Article

Tracking the Carbon Emissions Using Electricity Big Data: A Case Study of the Metal Smelting Industry

1
Guangxi Power Grid Co., Ltd., Nanning 530023, China
2
School of Applied Economics, Renmin University of China, Beijing 100872, China
*
Author to whom correspondence should be addressed.
Energies 2024, 17(3), 652; https://doi.org/10.3390/en17030652
Submission received: 16 November 2023 / Revised: 17 January 2024 / Accepted: 22 January 2024 / Published: 30 January 2024

Abstract

:
Implementing real-time carbon emissions monitoring at the enterprise level enables the detailed breakdown of carbon neutrality goals for microcosmic enterprises, which is of paramount significance in ensuring the precision of policy formulations. Grounded in China’s historical electricity consumption and carbon emissions data, this study utilizes the network approach and input–output methods to compute and predict direct and indirect transmission coefficients of electricity consumption and carbon emissions in each province. We establish a methodology that enables the monitoring of real-time carbon emissions of enterprises based on corporate electricity consumption data. Using the metal smelting industry in Guangxi as an example, our findings are as follows: First, in 2020, the comprehensive carbon emissions of the ferrous metal smelting industry in Guangxi reached 58.84 million tons, marking a notable increase of 42.78% compared to emissions in 2014, indicating that emissions reductions are imperative. Second, significant regional variations in emission coefficients are observed, with values ranging from 14 g CO2/KWh to 940 g CO2/KWh among provinces. Meanwhile, the trends of direct carbon emissions and indirect carbon emissions are totally different, underscoring the importance of comprehensive carbon accounting in informing policy decisions. Third, through the carbon emissions real-time monitoring of 75 metal smelting industry enterprises using electricity big data, we identified that the distribution of emissions across industries, time periods, and regions is uneven. Overall, this method can optimize carbon emission measurement techniques to a higher spatiotemporal resolution and more microscopic monitoring subjects, providing essential numerical foundations for promoting carbon emissions reduction and sustainable development.

1. Introduction

As a crucial strategic objective aimed at reducing greenhouse gas emissions and mitigating climate change, carbon peak is a key component of carbon reduction policies. China, as the world’s largest carbon emitter, contributes over 30% of global carbon emissions [1]; therefore, China’s actions will directly affect the level of global carbon emissions. It is proposed that to achieve the carbon peak and neutrality targets, China will release implementation plans for peaking carbon dioxide emissions in key areas and sectors as well as a series of supporting measures, and will put in place a “1 + N” policy framework for the dual carbon targets [2]. Guided by the “four revolutions, one collaboration” strategy for new energy security, the construction of a new power system and a clean, low-carbon, secure, and efficient modern energy system is vital for economic and social development [3]. Therefore, leveraging big data technology for innovation and employing intelligent methods to lead and support the energy revolution in China, constitutes a crucial pathway towards realizing the dual carbon goals.

1.1. The Importance of the Metal Smelting Industry in Guangxi Province

Currently, the industrial structure in Guangxi leans towards resource-intensive sectors, and the metal smelting industry plays a pivotal role in the process of advancing the dual carbon goals of Guangxi. In 2020, the economic value added of ferrous and non-ferrous metal smelting industries increased by 34.8% and 10.6%, respectively, while the value added in the agricultural and sideline food processing industry decreased by 7.8% year-on-year [4,5]. Moreover, Guangxi is recognized as one of the top ten key regions for non-ferrous metals in China, earning a reputation as the hub of non-ferrous metals. Guangxi boasts abundant and diverse mineral resources, such as aluminum, manganese, lead, and zinc, with large reserves and significant development potential [6]. The resource endowment and favorable transportation conditions contribute to the development of the metal industry. Over the years, the overall proportion of the metal smelting industry in Guangxi has consistently remained at the highest level (see Figure 1). Simultaneously, during the “14th Five-Year Plan” period, Guangxi actively implemented the national industrial layout optimization, adjusting and deploying the strategy for industrial transfer in the eastern regions to accommodate industrial transformation, and the planned projects largely continue to be traditional industries with high emissions characteristics [7]. Therefore, given the anticipated high proportion system in the metal smelting industry in Guangxi, establishing high-coverage, high-frequency, balanced carbon emission monitoring technology for metal smelting enterprises is significant. This technology is crucial for understanding the carbon emission patterns in Guangxi province, ultimately contributing to the achievement of carbon neutrality goals.
Power systems represent a significant contributor to global greenhouse gas emissions, and the precise calculation of carbon emission coefficients for electricity grids is crucial for the formulation of rational decarbonization policies. However, up to now, there is no standardized method to calculate carbon emission coefficients for power grids at home and abroad. First, because of the varied levels of attention to carbon emissions by environmental and electricity sectors, the carbon emission accounting methods of each sector are different. Second, the technical difficulty in accounting for carbon emissions data is relatively high. On the one hand, enterprise carbon emission sources are very complex, coupled with numerous emission points, posing challenges in direct monitoring methods that require substantial investments in monitoring equipment, a notably expensive endeavor [9]. On the other hand, because carbon dioxide emissions are invisible, colorless and odorless, they are easily unreported and misreported [10]. Furthermore, the estimation of indirect emissions through annual energy consumption statistics is constrained by the statistical period of energy consumption data, hindering real-time monitoring and timely adjustment of emission reduction policies, resulting in a significant lag [11]. This paper discusses the existing challenges in standardizing carbon emission accounting methodologies in power systems and emphasizes the need for a unified approach to ensure the accuracy and integrity of results.
Based on the analysis above, our objectives are to address three key questions regarding carbon emissions:
  • How can we propose a carbon emission accounting method that considers inter-regional flows and encompasses both direct and indirect carbon emissions?
  • How can we establish a real-time monitoring method for enterprise carbon emissions based on electricity big data?
  • What is the progress of carbon neutrality in the metal smelting industry in Guangxi, and how can precise emission reduction be achieved based on the enterprise carbon monitoring model?
To address these questions, this study establishes a method to account for the direct and indirect carbon emissions based on electricity consumption in Guangxi. The study also elucidates the correlation between electricity consumption and carbon emissions in the metal smelting industry, achieving the real-time monitoring, and accounting of carbon emissions at the enterprise level. This real-time carbon emission model provides a foundation from which to answer the questions above and contributes towards an understanding of the carbon emission dynamics in the context of regional and industrial activities.

1.2. Literature Review on CO2 Monitoring Methods

Achieving “carbon neutrality” primarily hinges on reducing carbon emissions, thus the statistical accounting of carbon emissions is an indispensable foundation. The accuracy of statistical accounting directly impacts the rationality of decarbonization policies and the effectiveness of operational mechanisms, and ultimately determines whether the “carbon neutrality” goal can truly be achieved. Therefore, acquiring high-quality carbon emissions data has garnered widespread attention in the academic community [12,13]. This paper will conduct a literature review on carbon emissions, focusing on three aspects: the temporal and spatial scale of carbon emissions, coverage scope, and measurement methods.
In terms of the spatial scale of carbon emissions, the existing research on carbon emissions accounting is mostly focused on the national level, with particular attention to developing countries, including China [14,15]. Given the significant characteristics of densely populated megacities, industrial agglomeration, traffic congestion, and frequent economic activities, the total carbon emissions and composition of carbon emissions for typical megacities and urban clusters are increasingly prominent [16,17]. At the industry level, the attention was primarily on the energy industry (oil, natural gas, etc.) and transportation industry early and is now gradually shifting towards emphasizing emissions accounting and emissions control in the power industry [18,19]. This is because traditional energy-intensive industries make up a large part of global carbon dioxide emissions associated with fossil fuels; therefore there is an urgent need for a green upgrade of the entire industrial chain’s production processes, and carbon emissions accounting related to agriculture, construction, chemical industry, and residential consumption has become the new research focus [20,21,22].
Regarding the coverage scope of carbon emission measurement, it is generally recognized that there are three accounting systems, namely direct carbon emissions (Scope 1) and indirect carbon emissions (Scope 2, Scope 3) [23,24]. Scope 1 primarily focuses on the direct emissions of greenhouse gases generated in the production process, which can be directly controlled by enterprises and independently accounted for by the enterprises themselves. Common greenhouse gas emission inventories typically adopt this accounting scope, reflecting the production responsibility principle of carbon emission accounting [4,24,25]. Scope 2 primarily addresses emissions caused by the energy demands of enterprises in the production process, including the indirect greenhouse gas emissions resulting from the purchase of energy from other enterprises for self-use, such as electricity, heat, heating, and cooling. Network analysis methods [26,27,28] are often employed for this scope. Scope 3, similar to Scope 2, also constitutes the indirect emissions of enterprises, but it requires a comprehensive accounting of the direct and indirect emissions of all relevant products in the upstream and downstream of the product value chain. Bilateral trade models or input–output methods [29,30,31] elucidate this scope.
In terms of monitoring methods for carbon emission measurement, the current main CO2 accounting methods in China focus on monitoring and calculation at the production end. After years of research and development, CO2 accounting methods at the production end have become relatively mature and refined. Different research objects employ different calculation methods, primarily divided into two categories: the direct measurement method and the calculation method. The direct measurement method includes point sources and area sources monitoring that directly and continuously monitor the CO2 emissions from specific micro-objects (point sources) to accurately calculate the total and real-time emissions over a certain period or rely on satellite equipment to monitor the real-time CO2 content in the atmosphere of a specific region to calculate the CO2 emissions (surface sources) [32]. Based on different calculation methods, the approaches are applicable to objects at different levels: first, the material conservation method based on mass conservation can calculate the energy and CO2 emissions generated when the energy input for production is known. However, due to high data requirements, it is only suitable for calculating CO2 emissions for specific enterprises or production chain processes. Second, the life cycle method is based on the product’s production cycle, including the energy input at each stage of the entire production cycle, divided into “from cradle to gate” and “from cradle to grave” accounting scales. It can be used to calculate the CO2 emissions for the entire production process or supply chain of a certain type of product. Third, the emission coefficient method calculates the CO2 emissions based on the CO2 emissions per unit of fuel or energy provided in the emission inventory, combined with the energy consumption data of the research object. As most of China’s energy consumption data is reported at the provincial or industry level, this method is suitable for calculating the CO2 emissions of various provinces or industries [33,34].
Overall, existing studies have used various methods to calculate Scope 1 and simplified Scope 2, and some studies have measured Scope 3 for individual industries. On the one hand, current research still lacks measurements based on micro-enterprises, making it impossible to achieve real-time monitoring. On the other hand, existing monitoring systems only focus on the accounting scope of Scope 1, paying less attention to responsibility transfer in carbon emissions. Therefore, this study optimizes the calculation accuracy and scope of the carbon emission monitoring model, with the following main innovations:
  • This approach utilizes the carbon conductivity coefficient to replace the methods of directly monitoring carbon emissions, which can significantly reduce the measurement cost of carbon emissions. Traditional point source carbon emission monitoring methods mainly focus on chemical detection, spectral analysis, and carbon satellite monitoring, which are not only costly but also not easy to scale. This project transforms the methods by fully exploiting the existing electricity data resources of power grid companies. Based on the correlation mechanism of electricity consumption and historical carbon emission data in different industries, the carbon conduction coefficient for electricity is calculated, constructing an indirect monitoring method for enterprise carbon emissions, significantly reducing equipment and cost requirements;
  • Expanding the scope of carbon emission accounting using network analysis and input-output methods, considering indirect conduction, improving the accuracy of the accounting scope. This study considers the regional heterogeneity of electricity carbon emissions and calculates the electricity emission coefficients for different regions, considering the case of purchasing electricity from outside the region. It achieves indirect carbon emission transfer accounting at the regional and industry levels, reflecting the principle of comprehensive carbon emission responsibility and providing more accurate results than traditional Scope 1 accounting, which only considers direct carbon emissions;
  • Utilizing random event sequence methods to achieve real-time monitoring of carbon emissions at the enterprise level and improve time accuracy. This project utilizes the significant features of objective, precise, and real-time electricity data to establish short-term “electricity-carbon conductivity” prediction methods for different industries. Due to the high-frequency characteristics of electricity big data, this monitoring method can downscale traditional carbon emissions data from annual to hourly levels, achieving more accurate real-time monitoring of carbon emissions.

2. Methods for Enterprise CO2 Emissions Monitoring Using Electricity Big Data

2.1. Calculation Methods for Direct Carbon Emissions

The direct carbon emissions of the metal smelting industry refer to the carbon emissions generated from the direct combustion of fossil fuels during production processes such as metal smelting, blowing, and refining, as well as the carbon emissions from industrial processes dominated by cement. Due to significant differences in raw materials and production processes among metal smelting enterprises, their production processes and technical parameters vary significantly. However, from the perspective of carbon emissions, their emission types and accounting methods are relatively unified. According to successive documents issued by the National Development and Reform Commission, such as the “Accounting Methods and Reporting Guidelines for Greenhouse Gas Emissions of Chinese Electrolytic Aluminum Production Enterprises (Trial)” and the “Accounting Methods and Reporting Guidelines for Greenhouse Gas Emissions of Chinese Magnesium Smelting Enterprises (Trial)”, the direct carbon emissions of this industry in a specified region are represented by Formula (1):
e r , i f = e r , i f u e l + e r , i c e m e n t e r , i f u e l = m = 1 M c r , i , m f u e l × h m × p m × o m × t m e r , i c e m e n t = c r , i c e m e n t × e c c e m e n t
These emissions consist of two parts. The first part is carbon emissions from the combustion of fossil fuels, calculated by multiplying the mth fossil energy consumption of sector i in region r by the carbon emission coefficient. The carbon emission coefficient e c m f u e l is calculated by the lower calorific value h m of the mth fuel, the carbon content per unit calorific value p m , the oxidation rate o m and the C C O 2 conversion coefficient t m (44/12). The second part of industrial process carbon emissions is obtained by multiplying cement consumption c r , i c e m e n t and emission coefficient e c c e m e n t [35]. The consumption of various energy varieties, cement production, and carbon emission coefficients of different energy products in the metal smelting process are derived from the Guangxi Statistical Yearbook [8], China Carbon Emissions Database (CEADs) [36], and National Greenhouse Gas Inventory Guidelines (IPCC) [37] over the years.

2.2. Calculation Methods for Indirect Carbon Emissions

The indirect carbon emissions of enterprises e r , i s signify the carbon emissions triggered by the electricity consumption of industry i, and there is a spatial mismatch in China’s electricity supply and demand. The flow of the power network can also lead to the transfer and distortion of carbon emissions implicit in electricity usage. However, China spans a vast geographical area, with varied geographical locations, technological levels, and resource endowments among provinces. The emissions intensities of electricity production vary significantly in each province. If the source of electricity consumption in Guangxi Province is not traced, there will be a significant deviation in the measurement of indirect carbon emissions [38]. Therefore, the indirect carbon emissions of enterprises e r , i s are represented by Formula (2), which distinguishes the regional sources of electricity consumption and is related to the corresponding regional carbon emission coefficient e c r . The indirect carbon emissions caused by the inflow of electricity from each province are based on the direct carbon emissions of electricity caused by the usage of all j fossil fuels in each province, as shown in Formula (3). Here, c r , j f u e l represents the input amount of the jth fossil fuel used for power generation in region r, and e c j represents the CO2 emission coefficient of the jth fossil fuel. These data still come from the “China Energy Statistical Yearbook (2016–2021)” compiled by the IPCC [37]:
e r , i s = c r , i e × e c r
e c r = j = 1 J c r , j f u e l × e c j
To accurately depict inter-regional electricity flow and identify hidden carbon emission pathways among provinces, this paper employs the network and input–output methods, which assumes that electricity input from other provinces is initially mixed with all local electricity and then uniformly utilized for local consumption or sale. This method takes high-order electricity flow through transitional areas into consideration, enabling a more precise calculation of indirect carbon emissions from electricity consumption.
In the network analysis methodology employed in this project, each province is simplified as a power grid, serving as a node within the network, and the electric flows between different provinces are considered as edges in the network. The total inflows and outflows of each node in the transmission network can be determined based on the electricity flow data between different provinces. Due to the challenges of storing electricity, the total inflows and outflows of each node should equal; that is, the sum of incoming and produced electricity in region r( I n r ) is equal to the sum of outgoing and consumed electricity in region r( O u t r ), see Equation (4) [28]. Here, s r denotes the locally generated power in region r, d r signifies the local demand, and Q r , g represents the power transmission from region r to region g.
I n r = s r + g = 1 N Q r , g O u t r = d r + g = 1 N Q g , r I n r = O u t r
Referring to the derivation of [30], we construct a 31-dimensional power-flow matrix for 31 provinces by utilizing the equilibrium of electricity inflows and outflows in each region Q as Formula (5):
Q = 0 Q 1 , 31 Q 31 , 1 0
Then, we calculate the direct electricity outflow matrix A as Formula (6):
A = 0 Q 1 , 31 I n 1 Q 31 , 1 I n 31 0
The elements of the matrix represent the proportion of the total electricity in region r that flows to region g.
Let I be the identity matrix, and In, Out, and S, respectively represent the matrices of total inflows, outflows, and electricity generation in each province, then I n = O u t = S + I n A , and the solution is I n r = O u t r = S C , of which C = ( I A ) 1 = A + A 2 + A 3 + is the direct and indirect electricity flows between regions. Defined d ^ as the diagonal matrix of electricity consumption in each province, H = C d ^ ( I ^ n ) 1 represents the electricity consumption structure matrix, and the matrix elements represent the total electricity consumed by region g per unit of electricity generation in region r:
H = c 1 , 1 c 1 , 31 c 31 , 1 c 31 , 31 d 1 I n 1 0 0 d 31 I n 31 = c 1 , 1 d 1 I n 1 c 1 , 31 d 31 I n 31 c 31 , 1 d 1 I n 1 c 31 , 31 d 31 I n 31 = h 1 , 1 h 1 , 31 h 31 , 1 h 31 , 31
Diagonalize the carbon emissions generated by power generation in various regions to form a direct carbon emission matrix E as Formula (8):
E = e 1 f 0 0 e 31 f
Then, the complete carbon emission matrix is Z,
Z = E H = e 1 f h 1 , 1 e 1 f h 1 , 31 e 31 f h 31 , 1 e 31 f h 31 , 31
where each element represents the implicit carbon emissions in the electricity consumed by region r in region g.
Furthermore, e f = [ 1 , 1 ] E I ^ n 1 is an n-dimensional row vector, where each element r = 1 N e 1 f d r , g I n g represents the CO2 emission coefficient of the electricity used in region g (The results are calculated by Microsoft Excel 16.47.1).

2.3. Construction of Industry Carbon-Conductivity Coefficient

The project establishes the correlation between actual carbon emissions and electricity consumption to obtain the carbon conduction coefficient. Utilizing electricity big data from the metal smelting industry enables real-time monitoring of carbon emissions. As analyzed in the preceding sections, the actual carbon emissions in industry i of region r encompass both direct and indirect carbon emissions, and these can be separately calculated using network analysis methods.
The calculation of the carbon conduction coefficient for industry i in region r is demonstrated in Formula (10). This formula utilizes the direct and indirect carbon emissions calculated in Section 3.1 and Section 3.2, divided by the industry’s electricity consumption. The entire calculation process is performed using Microsoft Excel. Once the electric carbon conduction coefficients are determined, the carbon emissions of individual enterprises can be obtained using the electricity consumption c r , i , j of enterprise j, as indicated in the formula:
e c r , i = ( e r , i f + e r , i s ) c r , i
e r , i , j c o m p a n y = e c r , i × c r , i , j c o m p a n y
In addition, in order to avoid double-counting of emissions in the power industry, fossil energy combustion emissions from the power industry will not be included in direct carbon emissions e r , i f , but will be distributed to various sectors of society according to the principle of consumer responsibility.

3. Results and Discussion

3.1. Results of Total Carbon Emissions in Guangxi Metal Smelting Industry

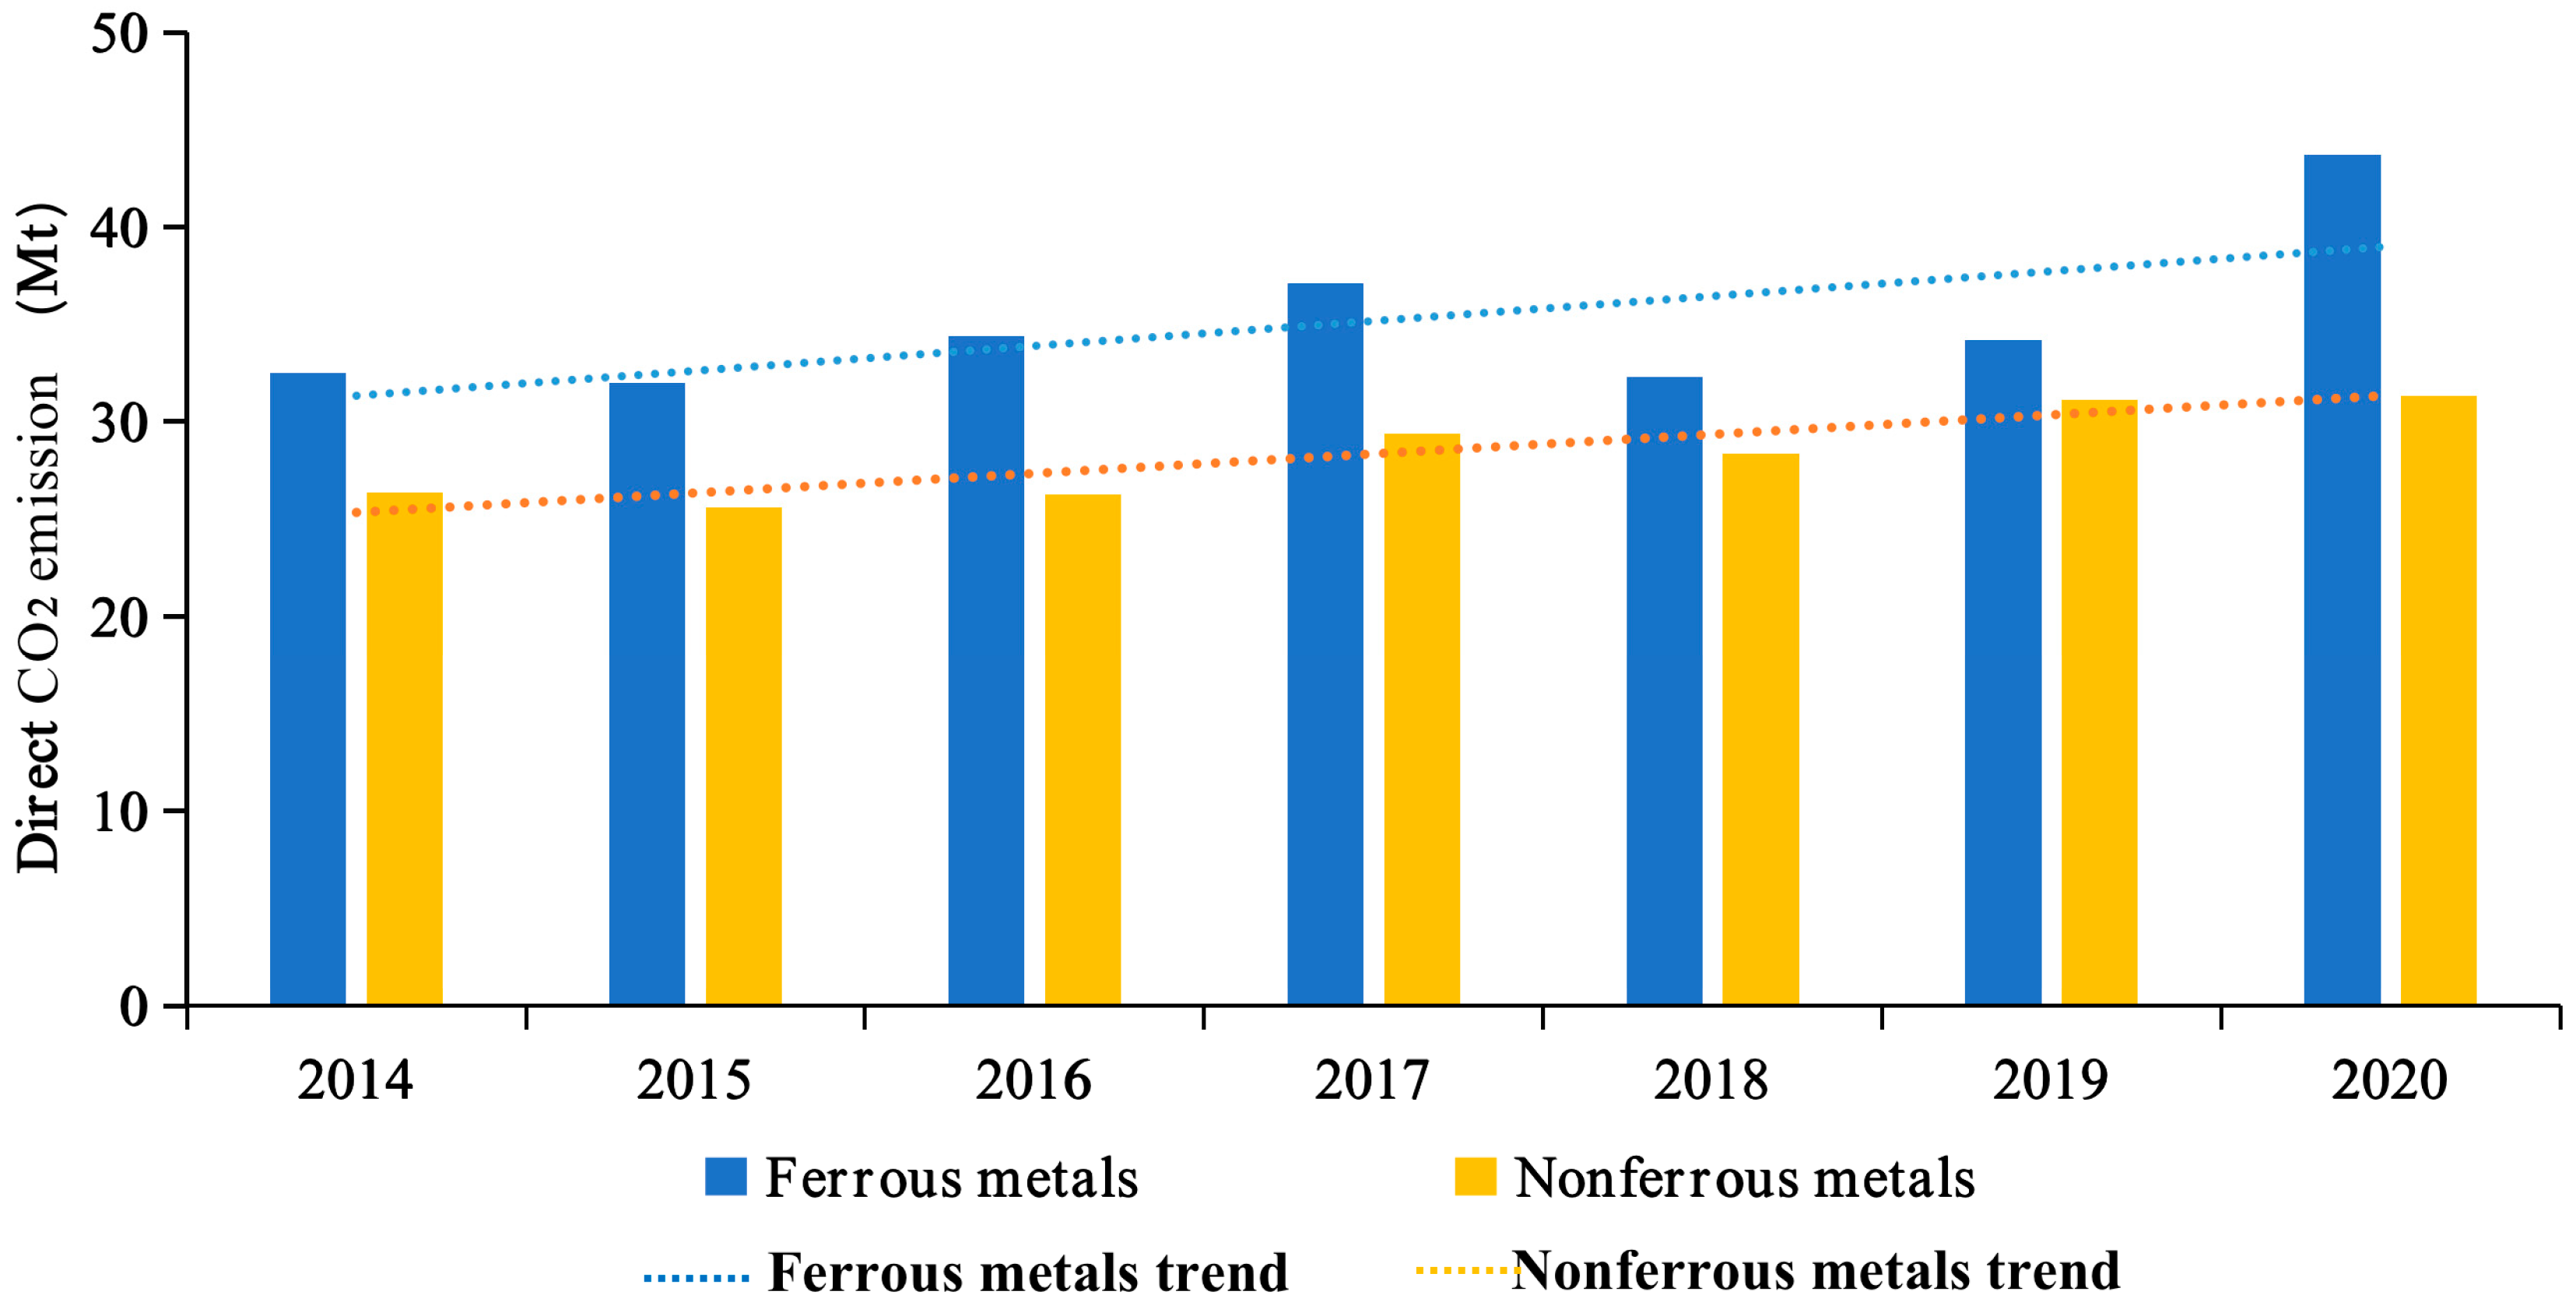
Direct carbon emissions include emissions from fossil fuel combustion and industrial processes. Using the method outlined in Section 3.3, we calculated the carbon emissions of the nonferrous metal smelting industry in Guangxi Province from 2014 to 2020 based on publicly available data. The results are shown in Figure 2.
In 2020, the ferrous metal smelting and nonferrous metal smelting industries in Guangxi Province, as the primary sources of carbon emissions in the region, generated 43.69 million tons and 31.33 million tons of direct carbon emissions, accounting for 23.76% and 17.04% of the total direct emissions in the province. The significantly high carbon emissions underscore the pivotal role of the metal smelting industry, emphasizing the crucial importance of carbon emission monitoring in achieving Guangxi Province’s carbon reduction goals. From the temporal perspective, the carbon emissions of both the ferrous and nonferrous metal smelting industries showed a gradual upward trend from 2014 to 2020. While the carbon emissions of ferrous metals briefly decreased in 2018 and 2019, they significantly increased again in 2020, returning to the average growth trend line level. Compared to nonferrous metals, the ferrous metal smelting industry exhibited higher and more pronounced carbon emissions, with an average growth rate of 34.33% from 2014 to 2020. This may be attributed to the higher carbon content in ferrous metals, requiring substantial high-temperature reduction processes, while nonferrous metals can utilize more environmentally friendly methods such as electrolysis.
Indirect carbon emissions are influenced by the electricity consumption in the region, the corresponding electricity structure, and the national cross-regional electricity flow. Specifically, the implicit carbon flow of cross-regional electricity in 2020 is illustrated in Figure 3. Guangxi Province has electricity transmission with nearly all provinces across the country. The electricity flow into and out of northern cities from Guangxi is generally higher than those of southern cities. Overall, Guangxi is a net exporter of electricity, with more electricity flowing out than in. Among these flows, Guangxi exports the most electricity to Shandong Province and Jiangsu Province, totaling 8.46 TWh, and this may be related to the economic development, trade relationships, and geographical locations of these two provinces. Guangxi imports the most electricity from Inner Mongolia, with a total output of 4.99 TWh.
The calculation results of carbon emission coefficients for electricity consumption for each province in 2020 are presented in Figure 4. The lowest value is found in Xizang, at only 14 g CO2/KWh, while the highest is in Hebei, reaching 940 g CO2/KWh, which is 66 times that of Xizang. The average carbon emission coefficient for all provinces and cities is 524 g CO2/KWh. Except for five provinces and cities in the southwest and northwest, including Qinghai and Sichuan, most provinces and cities exhibit carbon emission coefficients concentrated in two tiers: around 400 g CO2/KWh and around 750 g CO2/KWh. Additionally, the carbon emission coefficients of electricity also show some spatial distribution characteristics. In agreement with the findings of [39], the emission coefficients in the northeast region are generally higher than those in the southwest region, while the central and western regions are rich in renewable energy, resulting in lower average carbon emission coefficients for electricity. In conclusion, there are significant variations in the carbon emission coefficients of electricity among provinces, emphasizing the critical necessity of regional tracing of electricity.
Using the network approach described in Section 3.2 and taking implicit carbon flow into account, the actual carbon emissions caused by electricity consumption in the metal smelting industry in Guangxi can be calculated based on the energy source structure and regional carbon emission coefficients of each province. The calculation results are depicted in Figure 5, where the dashed line represents the indirect carbon emissions associated with electricity consumption.
For the ferrous metal smelting industry, the average indirect carbon emissions in Guangxi from 2014 to 2020 is approximately 30.8% of the direct carbon emissions. This finding aligns with the conclusion for China drawn by Vidovic [40] on the steel industry. As for the nonferrous metal industry, the proportion of the indirect and direct carbon emissions is slightly lower, at about 28.9%. However, these are the average results for all metals and provinces. On the one hand, due to the different processes of each metal, indirect carbon emissions may vary greatly, such as that of aluminum with the highest electricity consumption in electrolysis processes having indirect emissions accounting for 85% of the total carbon emissions [40], whereas the indirect emissions of nickel are only about 23% of total emissions [41]. On the other hand, the provinces in China have different power structures. In 2022, the proportion of coal-fired power generation in Guangxi was 53.74%, much lower than the national average of 69% [42,43]; the proportion of indirect carbon emissions calculated in Guangxi is conservative compared to the nationwide level.
In addition, the high proportions of indirect carbon emissions mentioned above also indicate the significance of indirect ones as a critical component of emissions; therefore, tracing and attributing carbon emissions are essential for achieving genuine carbon reduction goals. From 2014 to 2020, indirect carbon emissions and direct carbon emissions exhibited a synchronized growth trend. The growth rate of indirect carbon emissions was slightly higher than that of direct carbon emissions, leading to a gradual increase in the proportion of indirect carbon emissions to total carbon emissions each year. As trade and other connections become more closely intertwined, indirect carbon emissions may continue to escalate, making accurate accounting increasingly urgent. Overall, the trends in indirect carbon emissions for both the ferrous and non-ferrous metal smelting industries are relatively similar, with the non-ferrous metal industry experiencing a slightly higher growth rate than the ferrous metal industry.
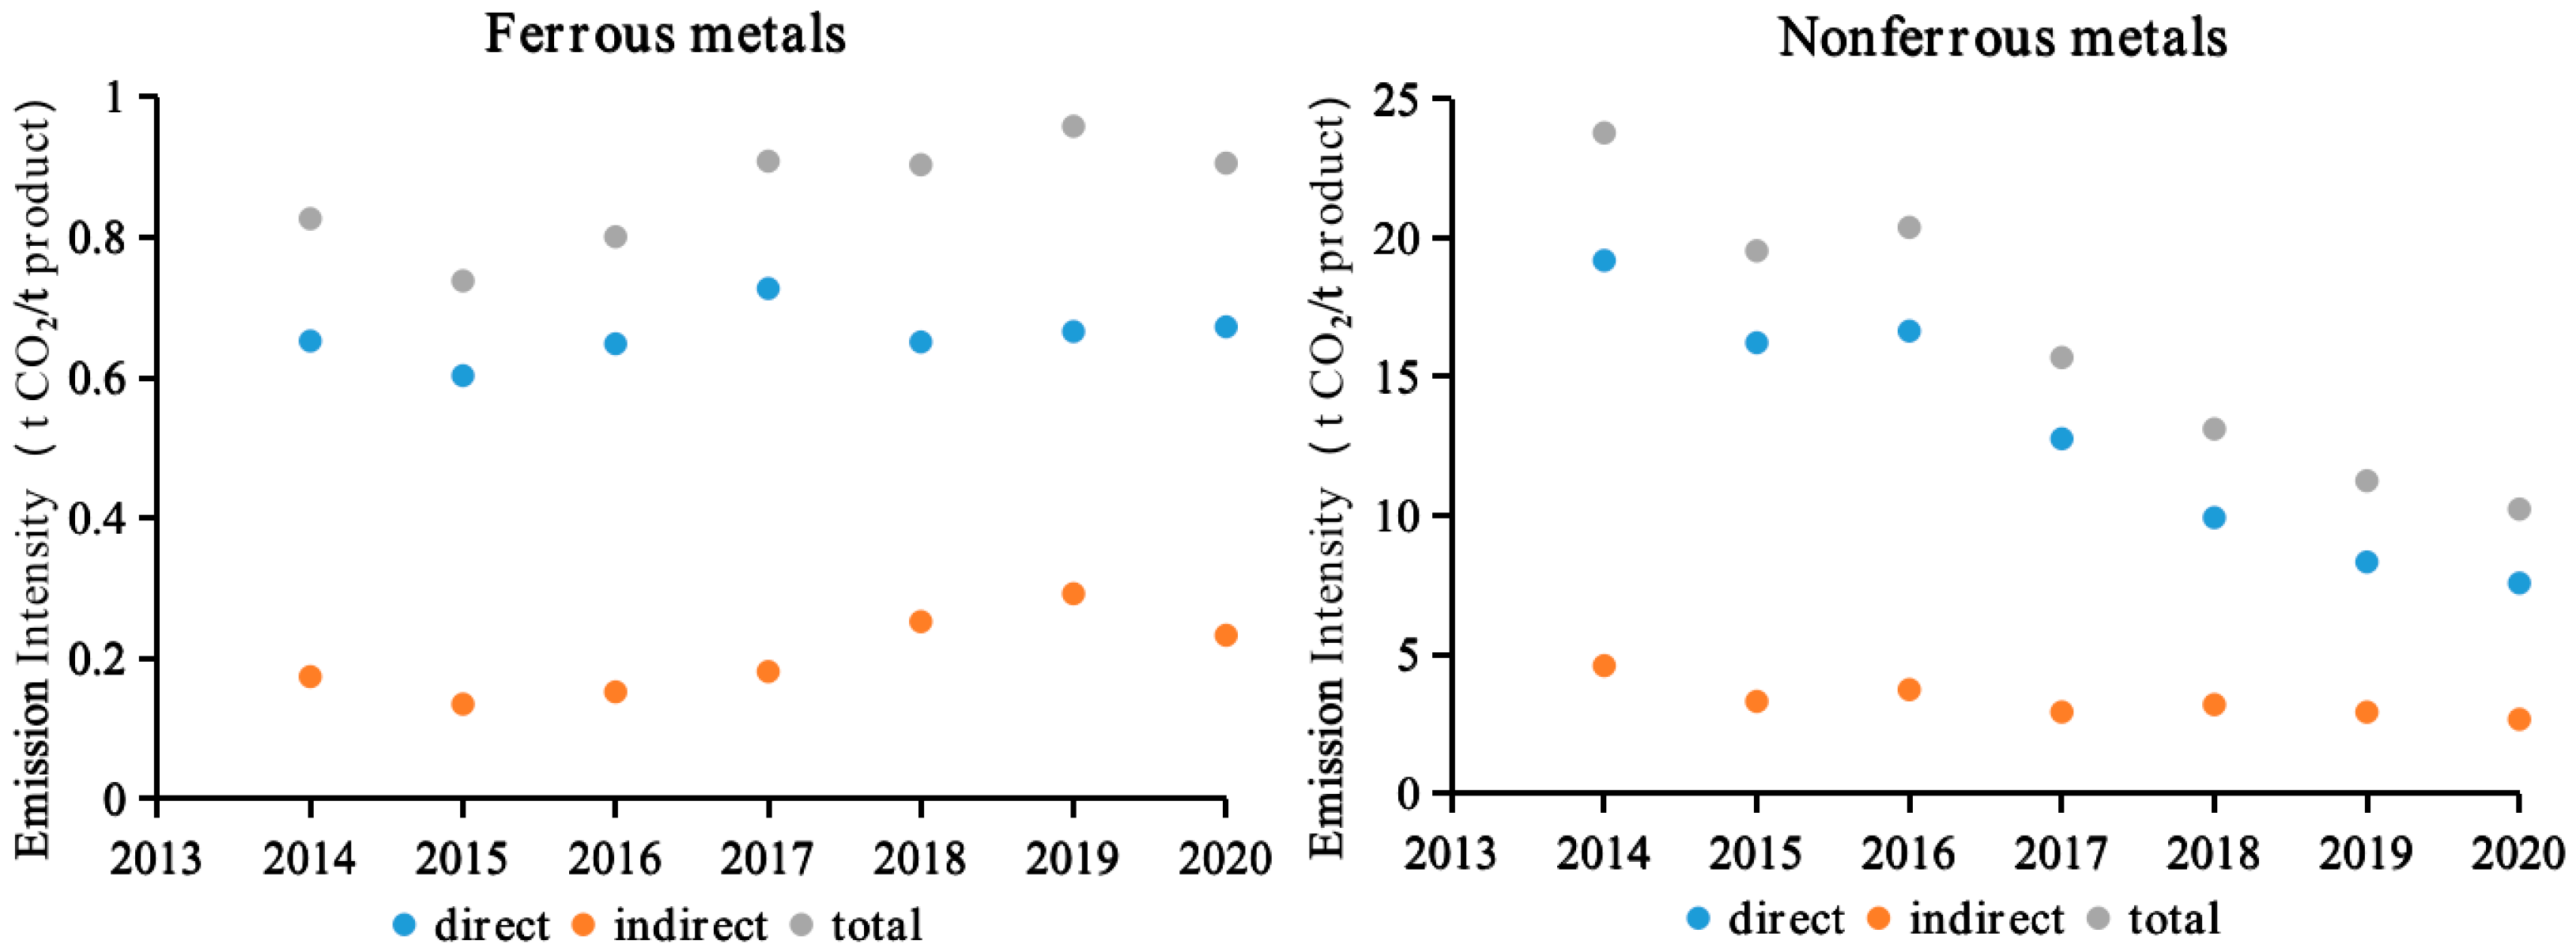
Furthermore, using industry-specific production data from the Guangxi Statistical Yearbook [8], the carbon emissions per unit output for the ferrous metal and non-ferrous metal industries can be separately calculated [40], as illustrated by the emissions intensities in Figure 6. Although the absolute carbon emissions for these two industries do not differ significantly each year, the carbon emissions intensity for the non-ferrous metal industry is more than ten times greater than that for the ferrous metal industry. This indicates that the carbon emissions from the non-ferrous metal industry are more severe, offering greater potential for emissions reductions. However, this potential is somewhat overshadowed by the larger production output of the ferrous metal industry. Examining the trend over time, the carbon emissions intensity of the non-ferrous metal industry shows a noticeable decline, possibly due to past technological innovations. In contrast, the carbon emissions intensity of the ferrous metal industry experiences only minor fluctuations, and the two are gradually converging. Additionally, in 2020, the total carbon emissions intensities for ferrous metal and non-ferrous metal industries are around 1 t CO2/t product and 10 t CO2/t product, respectively. Due to the constantly changing product structure of the ferrous metal and non-ferrous metal industries, it is challenging to compare the average results with those seen previously in the literature. Therefore, the unit carbon emissions of some major ferrous and non-ferrous metals are shown as follows to compare with the results above. For ferrous metals, it is reported that the carbon emissions from electrolyzing one ton of steel range from 1.8 to 2.5 tons [44]. As for non-ferrous metals, in 2022, the carbon emissions per ton of electrolytic aluminum were 10.4 tons [45], electrolytic nickel amounted to 10.19 tons CO2 per ton product [41], and electrolytic aluminum ranged from 13.5 to 17.5 tons CO2 per ton product [46]. These values are generally consistent with the results of this study, and some minor deviations may be attributed to differences in smelting technologies and calculation methods.

3.2. Electric-Carbon Coefficient of Guangxi Metal Smelting Industry

The actual carbon emissions of the metal smelting industry in Guangxi Province calculated by the electricity consumption can be used to derive the electricity carbon conductivity coefficient in the future, and the annual results are presented in Figure 7. The average carbon conductivity of all industries in society exhibits a noticeable decreasing trend over time, potentially influenced by technological innovation, policy requirements, and regulatory intensity. Before 2016, the carbon conductivity of the metal smelting industry was lower than the overall societal average, but post-2016, it surpassed the societal average. This shift could be attributed to the industry’s high energy demand, challenges in technological innovation, and a smaller emission reduction space compared to other sectors within the metal smelting industry. The carbon emission coefficients of both nonferrous and ferrous metal smelting industries have shown relatively stable fluctuations over time, consistently hovering around 2000 g CO2/KWh, with a slight downward trend since 2017. In contrast to the relative relationship observed in direct carbon emissions, the carbon emission coefficient of ferrous metal smelting is typically lower than that of nonferrous metal smelting. This is possibly due to the involvement of electrolysis processes in nonferrous metal smelting, leading to a higher indirect distribution of electricity consumption. In addition, the average conductivity coefficient of the entire industry after 2016 is around 1.2 kg CO2/KWh, which is consistent with the disclosure in the 2023 report on carbon dioxide emission coefficients in China’s regional power grid released by the Ministry of Ecology and Environment, stating that the distribution range of emission coefficients in power grids in various provinces of China is 0.095–1.092 kg/kWh.
To address the issue of delayed emissions data, this project employs the time trend analysis method. We forecast the carbon emission coefficients of the metal smelting industry in Guangxi Province for 2021 and beyond using the ARMA (1,0,0) model and trend extrapolation method, with the prediction results depicted in Figure 8. The period 2014–2020 represents the actual measured values, while 2021–2023 reflects the model-predicted values. In both prediction methods, the ferrous metal smelting industry exhibits a slight upward trend. Due to the rapid historical growth rate from 2019 to 2020, the trend extrapolation method predicts a significantly higher carbon emission coefficient for the ferrous metal smelting industry in 2023 compared to the ARMA (1,0,0) model. Conversely, for the non-ferrous metal smelting industry, the carbon emission coefficients in the predicted results using the ARMA (1,0,0) model have been increasing year by year. However, due to the decrease in carbon emission coefficients from the nonferrous metal smelting industry from 2019 to 2020, under the trend extrapolation method, the carbon emission coefficients of the nonferrous metal smelting industry will continue to decline, indicating a significant systematic directional difference between the two prediction models.
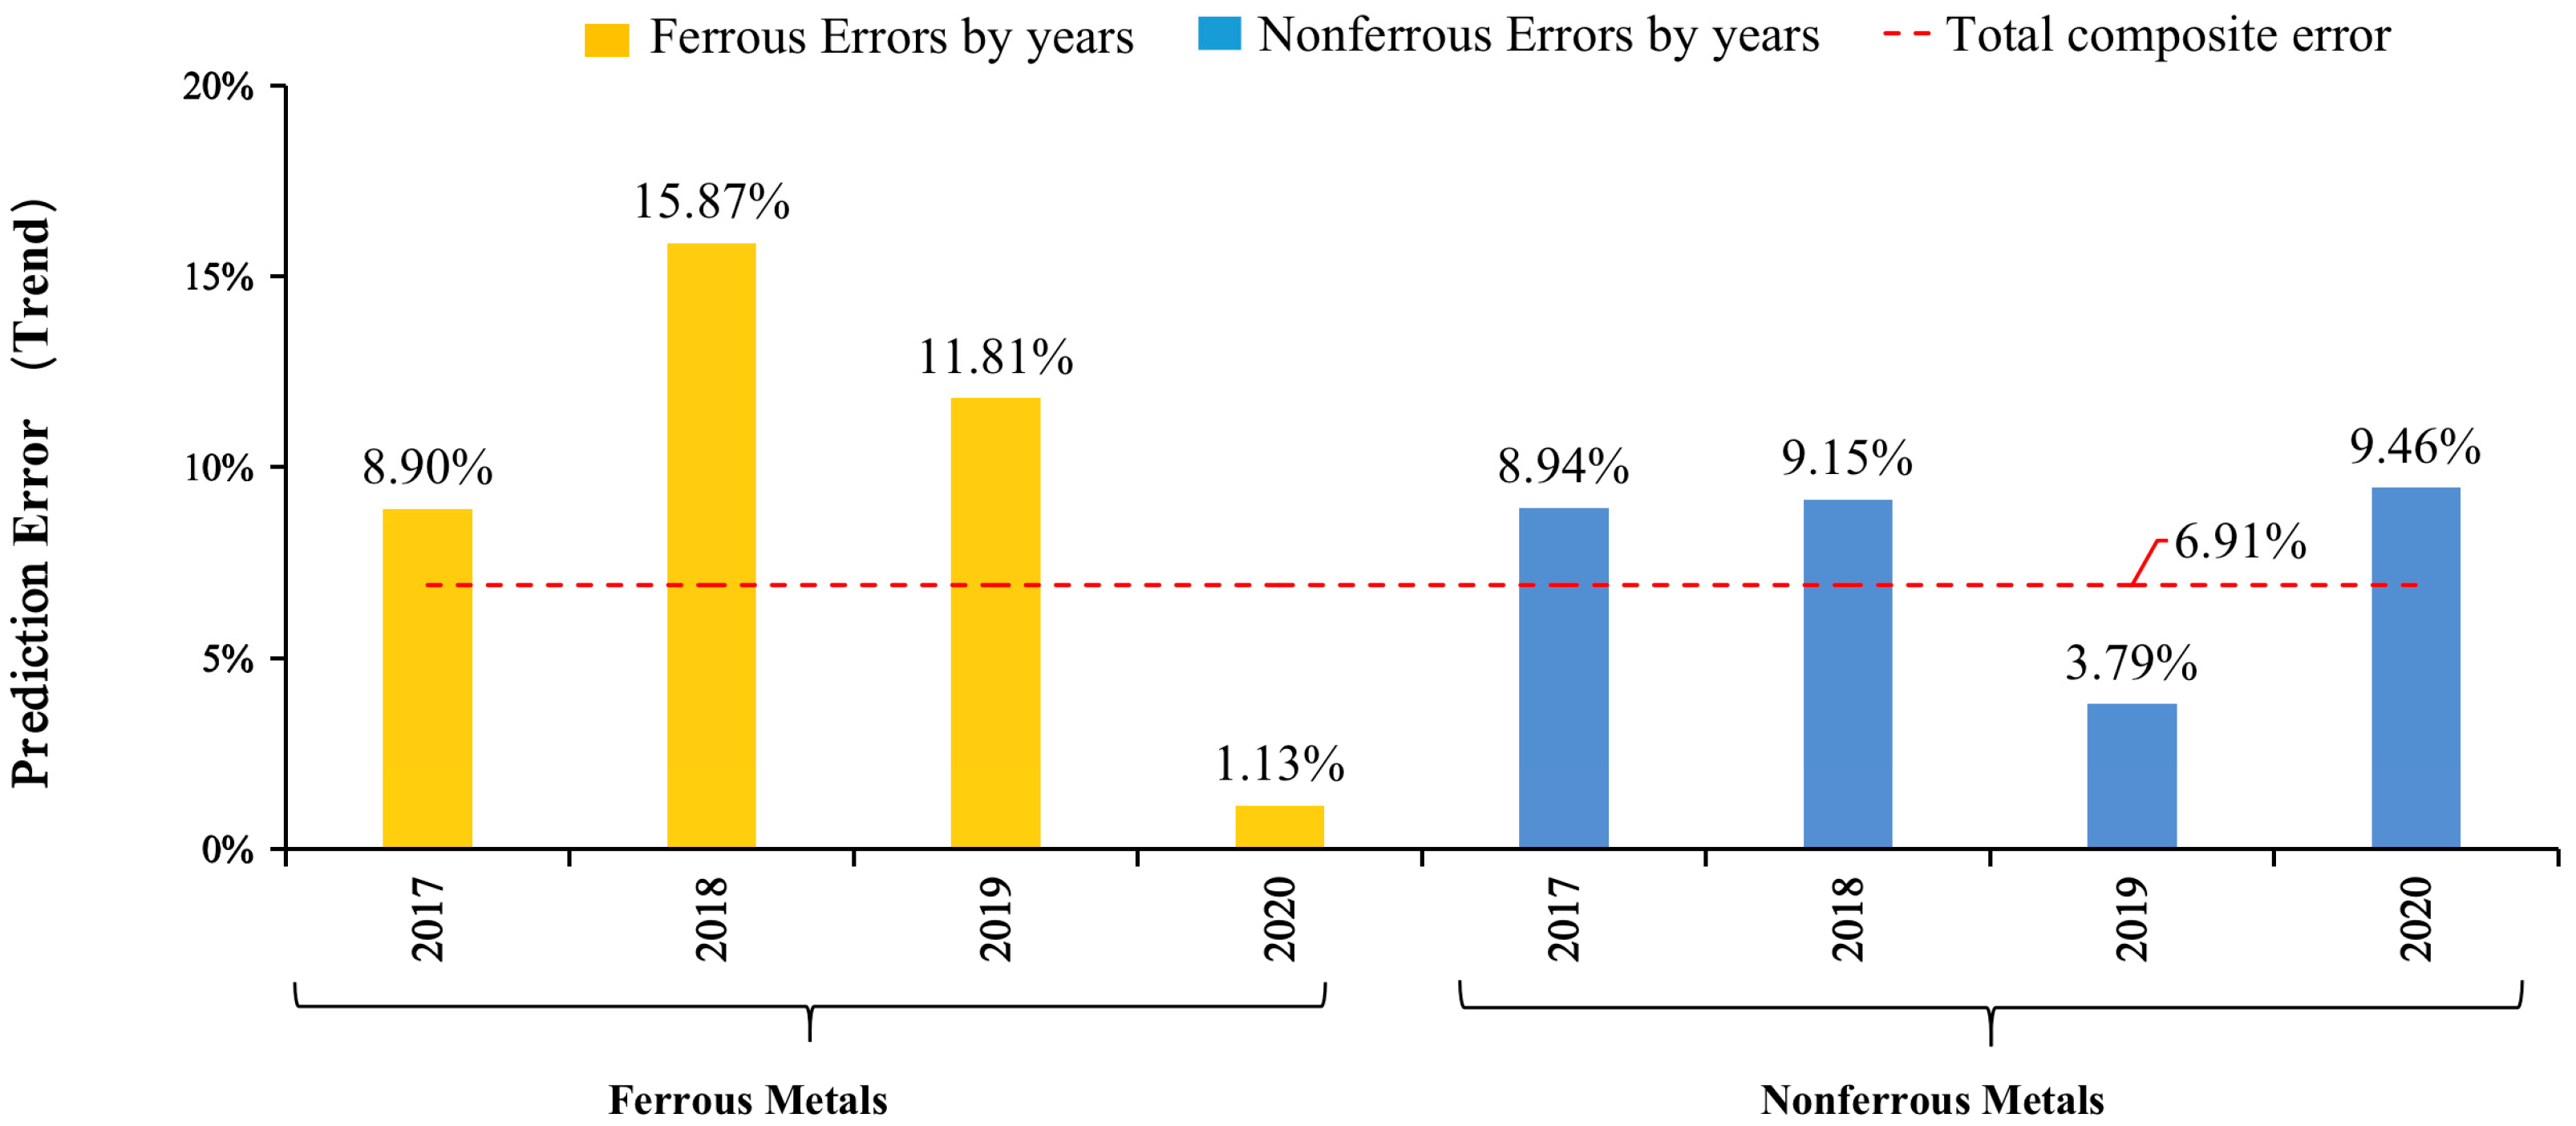
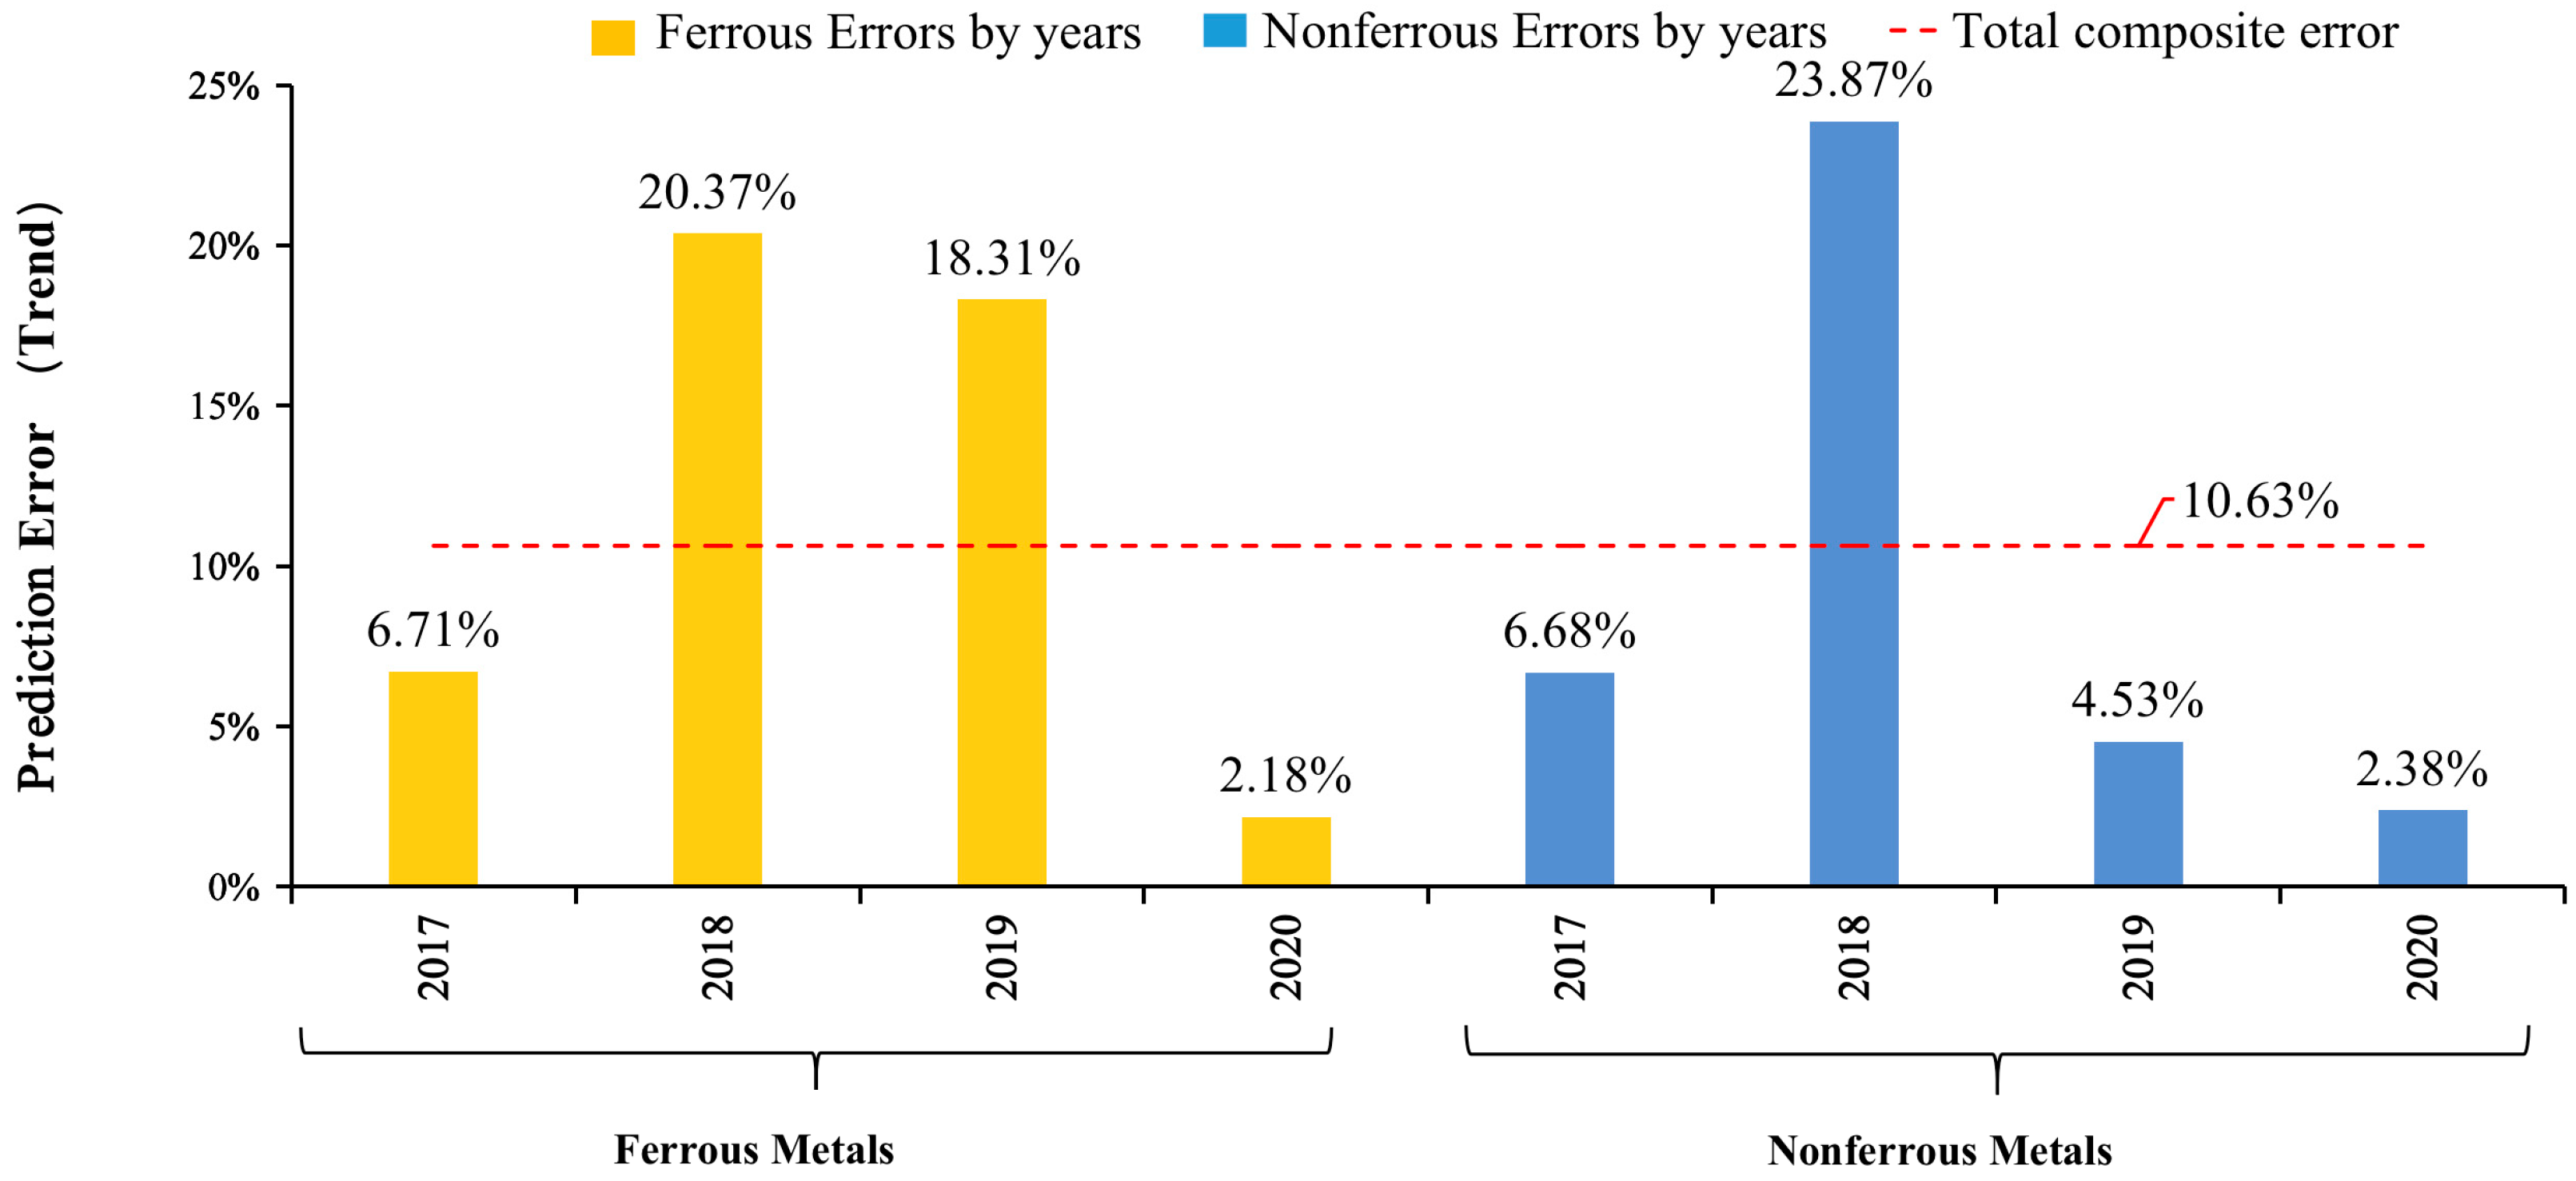
To verify the accuracy of the two models in predicting the future carbon conductivity and obtain the most reasonable continuous prediction values, this project utilized data from 2016 and earlier to simulate the predicted values of carbon conductivity under the two models from 2017 to 2020. The simulated values were then compared with the actual values to assess the prediction accuracy. The results of the prediction accuracy are shown in Figure 9 and Figure 10.
When predicting and validating the carbon emission coefficients of the metal smelting industry in historical years, from 2017 to 2020, the average error of the trend extrapolation method used by the nonferrous metal smelting industry and the ferrous metal smelting industry was 10.63%, while the average error of the ARMA (1,0,0) model prediction results was 6.91%, both at a relatively low level, indicating high reliability in the predictions. In comparison, the prediction error of the ARMA (1,0,0) model is smaller, indicating that, when simulating short-term economic sequences related to Guangxi in this project, the ARMA (1,0,0) model exhibits higher accuracy. Similarly, Ref. [47] calculated the average coefficient prediction error of the above two methods from the industry perspective, with the results for ARMA at 7.48% and the trend extrapolation at 12.17%, indicating that, with the same results as this research, the ARMA method is more accurate. This is because the ARMA (1,0,0) is more suitable for simulating sequences with high randomness, while the trend extrapolation method is more suitable for sequences with trends.

3.3. Carbon Emission Monitoring of Enterprises Based on Big Data of Electricity

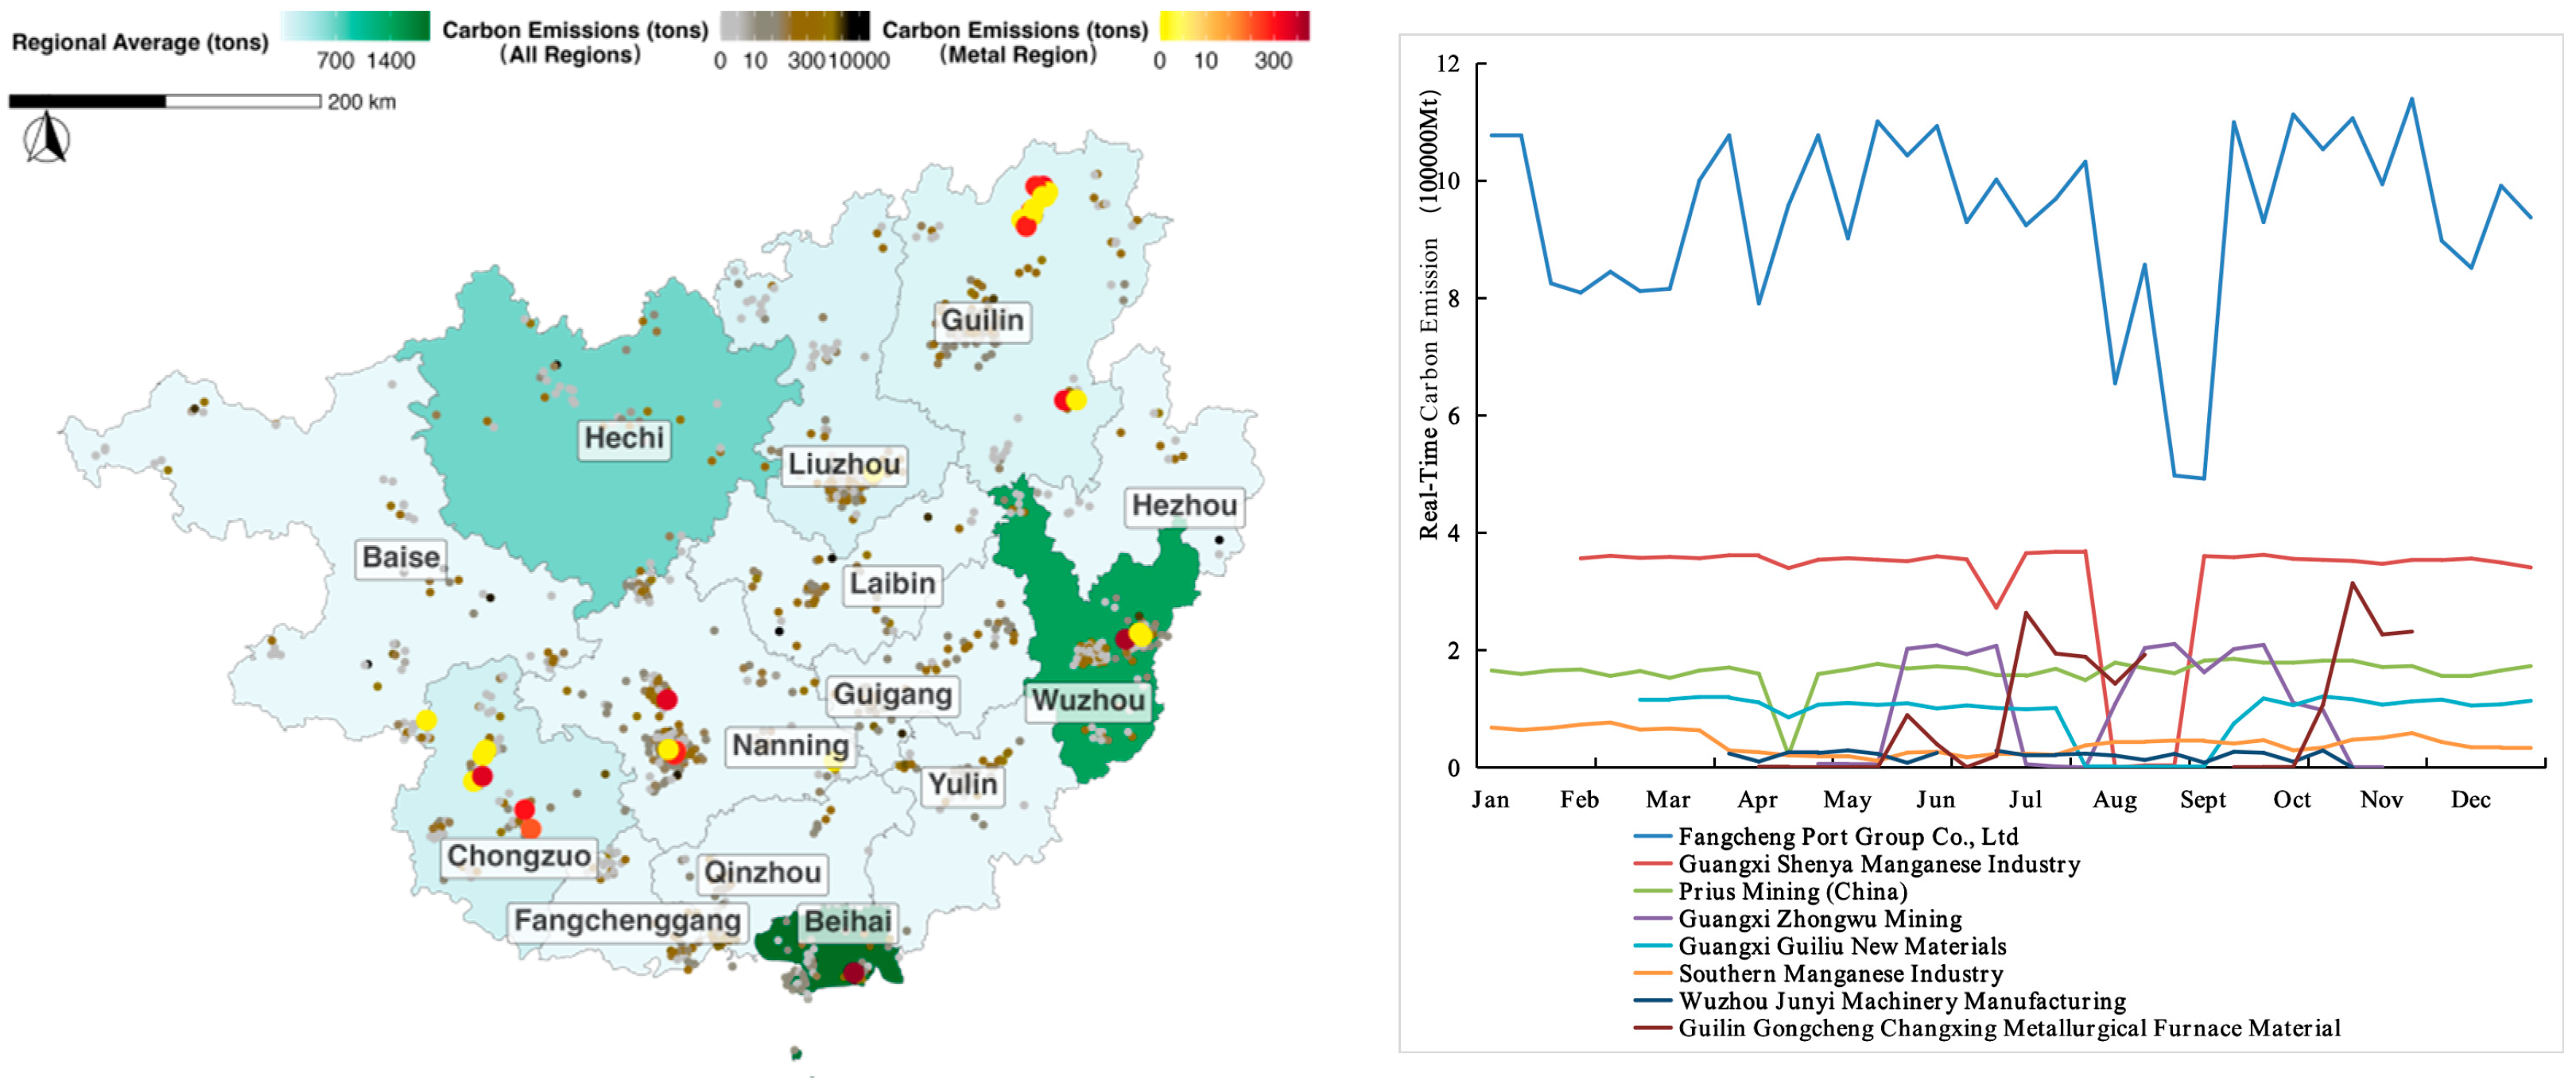
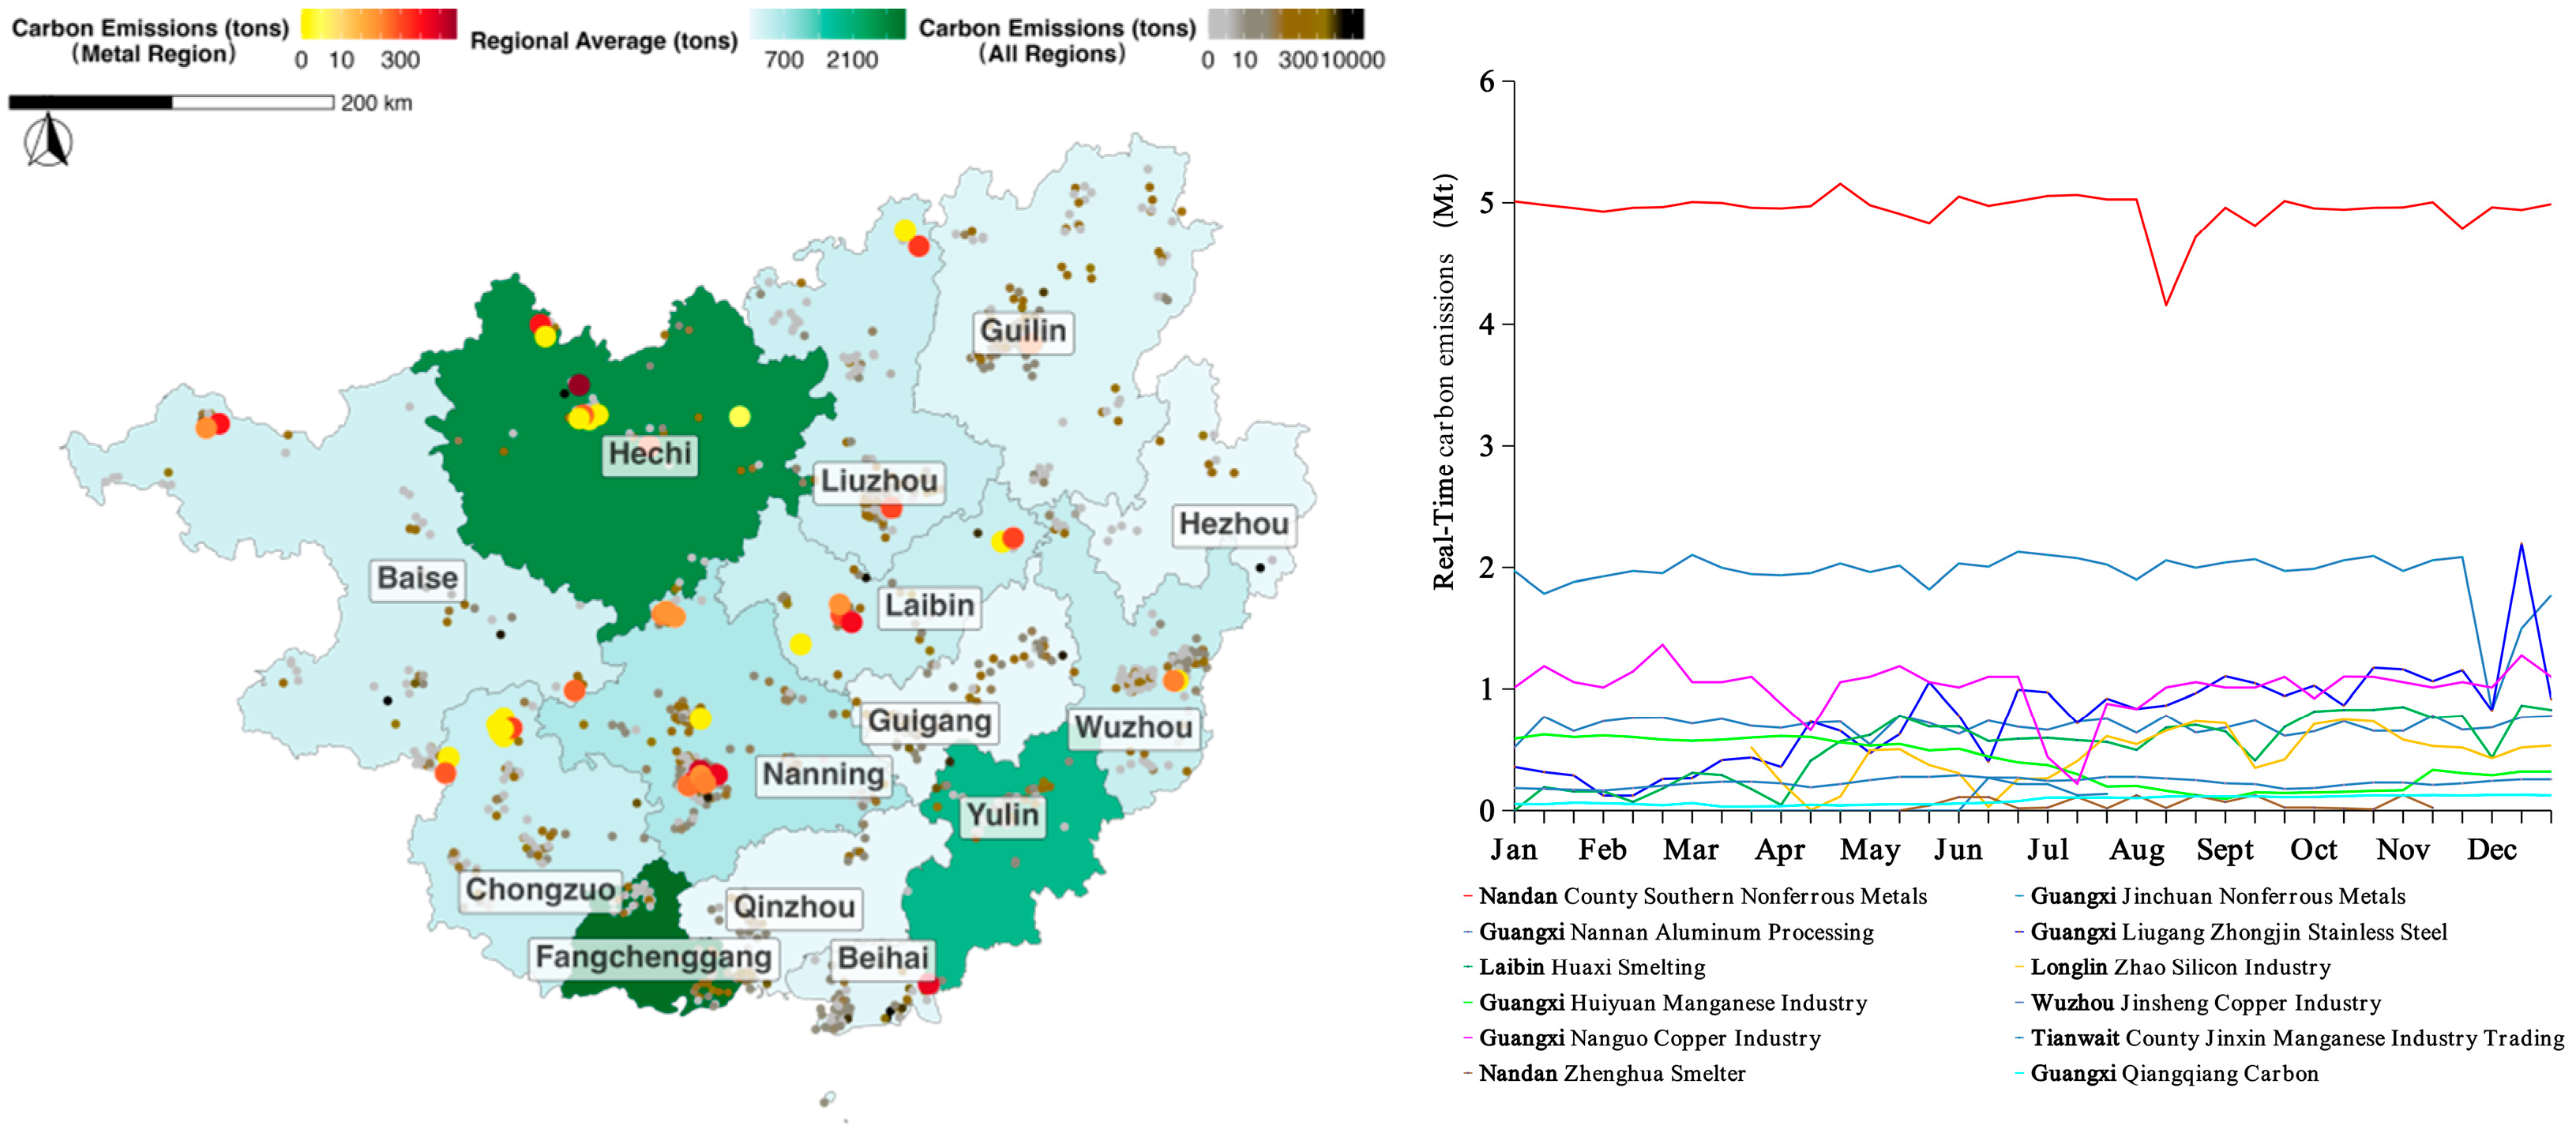
Using the predicted values of the electricity carbon conductivity coefficient for various industries in 2022, and combined with hourly enterprise electricity consumption data, this project achieves real-time carbon emission monitoring at the enterprise level, covering a total of 1338 enterprises in the Guangxi region, including 75 in the metal smelting industry. The monitoring results for non-ferrous metal smelting enterprises and ferrous metal smelting enterprises are displayed in the left figures of Figure 11 and Figure 12, respectively.
First, the emissions distribution reveals an imbalance among regions, with average carbon emissions from the metal smelting industry in cities such as Fangchenggang, Hechi, and Beihai significantly higher than those in other cities. This difference may be related to the level of technological development, input power from provinces, and raw material properties. From an enterprise perspective, cities with lower average carbon emissions, such as Guilin, Nanning, and Chongzuo, have attracted a large number of metal smelting enterprises, aligning with industry development trends and facilitating the implementation of emissions reduction plans.
Second, concerning industries, the regional distribution of carbon emission levels differs between the ferrous metal smelting industry and the nonferrous metal smelting industry. Real-time monitoring of the ferrous metal smelting industry is displayed in Figure 11, and real-time monitoring of the nonferrous metal smelting industry is shown in Figure 12. The ferrous metal smelting industry exhibits the highest carbon emissions in Beihai and Wuzhou, while the nonferrous metal smelting industry experiences the highest carbon emissions in Hechi and Fangchenggang, demonstrating significant differences in emission levels.
Finally, there is temporal heterogeneity in the carbon emissions of various enterprises in the metal smelting industry. From the real-time monitoring trends of 75 enterprises’ carbon emissions in 2022, as shown in the right figures of Figure 11 and Figure 12, the carbon emissions of most enterprises are relatively stable in terms of the time dimension, with small fluctuations. The ranking of carbon emissions among enterprises is relatively stable, and there is little exchange between seasons. This may be because the large industrial enterprises usually operate stably and at the same time exert great influence. Some enterprises have seasonal differences in carbon emissions, with summer carbon emissions slightly lower than autumn and winter carbon emissions. In addition, the operational stability of nonferrous metal smelting enterprises is generally higher than that of ferrous metal smelting enterprises.

4. Conclusions and Implications

4.1. Conclusions

Based on the network approach and the direct emission coefficients of each region, this paper calculated the actual carbon emissions of the metal smelting industry considering power flow. The approach combined the industry’s power consumption to derive the correlation mechanism between the carbon emissions of the metal smelting industry and its electricity consumption, constructing the electron–carbon transmission coefficient of the metal smelting industry. Finally, based on real-time electricity consumption big data of various industries in Guangxi, carbon emission monitoring at the industry/enterprise level was achieved. Taking Guangxi as an example, this project draws the following important conclusions:
  • Currently, the carbon emissions of the metal smelting industry in Guangxi Province are still in the upward phase of the carbon peak path, with both direct carbon emissions and actual carbon emission coefficients showing an upward trend. In 2020, the comprehensive carbon emissions of the ferrous metal smelting industry reached 58.84 Mt, an increase of 42.78% compared to 2014. In 2020, the comprehensive carbon emissions of the nonferrous metal smelting industry were 42.35 Mt, showing an increase of 29.50% compared to 2014. The industry has not achieved significant carbon emissions reductions in the past five years, indicating a great need for future development and the potential for emission reductions;
  • There are significant differences in emission coefficients among regions, with notable variations in the values and trends of direct and comprehensive carbon emissions, therefore comprehensive accounting of carbon emissions is of great significance for accurately formulating efficient carbon reduction policies. The emission coefficients of each province range from 14 g CO2/KWh to 940 g CO2/KWh, with an average of 524 g CO2/KWh; the numbers range significantly, with coefficients in northern provinces, such as Hebei and Inner Mongolia, generally higher than those of southern provinces like Xizang. From 2014 to 2020, the direct carbon emissions of the ferrous metal smelting industry increased from 32.52 Mt to 43.69 Mt, showing an increase of 34.33%. The direct carbon emissions of the nonferrous metal smelting industry increased from 26.39 Mt to 31.33 Mt, with an increase of 18.75%. Compared to ferrous metals, the direct carbon emissions of the nonferrous metal industry are relatively low in value and increase amplitude. For the comprehensive carbon emission coefficient, the nonferrous metal industry has always been higher than that of the ferrous metal industry, and the upward trend is not significant;
  • The technologies used in ferrous metal smelting and nonferrous metal smelting are significantly different, leading to heterogeneous emission properties. For example, nonferrous metals can be decomposed using electrolysis, resulting in high electricity consumption. Therefore, targeted policy regulatory schemes should be adopted. In 2020, the indirect carbon emissions of the nonferrous metal smelting industry were 4.86 Mt, an increase of 74.41% compared to 2014. From 2014 to 2020, the average level of indirect carbon emissions from the nonferrous industry, considering electricity distribution, accounted for 24% of comprehensive carbon emissions, significantly higher than that of the ferrous metal smelting industry. Among the increases in carbon emissions, only 36.65% of the ferrous metal smelting industry was contributed by the increase in indirect carbon emissions, with the rest being contributed by the increase in direct carbon emissions; however, 49% of emissions from the nonferrous metal smelting industry were contributed by the increase in indirect carbon emissions.

4.2. Policy Implications

Achieving multi-level carbon emission monitoring of “region-industry-enterprise” is of great significance. On the one hand, the government can better understand the carbon emission trends of different regions and industries, formulate more targeted personalized policies and strategies, and more effectively reduce carbon emissions. On the other hand, enterprises can use multi-level carbon emission monitoring to better understand their carbon footprint and identify emission reduction opportunities, which helps to encourage enterprises to adopt cleaner and more efficient technologies and practices, promote carbon emission reduction innovation, reduce resource waste, and improve competitiveness. At the same time, multi-level carbon emission monitoring provides more comprehensive data, enabling governments, businesses, and the public to better understand carbon emissions, helping to establish transparency and accountability, and promoting more responsible management and a reduction in carbon emissions by all parties. In summary, multi-level carbon emission monitoring provides more accurate data and refined insights for the global response to climate change and carbon reduction and is a key tool for achieving sustainable development and mitigating climate change. Based on the research results of this article, the following policy recommendations are proposed:
  • Accurately calculating and regulating the actual carbon emissions of major industries such as metal smelting is of great significance for effectively reducing carbon emissions. On the one hand, the metal smelting industry, as one of the industries with the highest carbon emissions, accounts for a large proportion of carbon emissions and has significant regulatory achievements and emissions reduction potential. On the other hand, if the actual carbon emissions are not accurately identified, it will cause significant errors in the judgment of the carbon emission structure and the identification of emission sources, leading to biases in regulatory focus and policy formulation. Meanwhile, the metal smelting industry has not yet achieved significant carbon reductions in the past five years; therefore, in the future, it is still necessary to focus on researching its technological transformation and regulatory incentive plans;
  • Using real-time carbon emission monitoring at the enterprise level can promote the optimization of carbon emission policies, independent emission reduction innovation, and carbon market construction. On the one hand, real-time carbon emission monitoring provides governments with real-time and accurate emission data, enabling policymakers to adjust and improve carbon emission policies more flexibly, helping to ensure the effectiveness of policies and better respond to the challenges of climate change. On the other hand, enterprise-level carbon emission monitoring encourages enterprises to actively seek emission reduction opportunities. Through real-time monitoring, enterprises can better understand their emission status, identify potential emission reduction measures, and strengthen independent emission reduction innovation, which helps them to improve production efficiency, reduce costs, and gain a competitive advantage in a low-carbon economy. Meanwhile, real-time emissions data are the foundation of carbon market operations, and can be used to track the emissions of enterprises and serve as a basis for carbon trading. Real-time monitoring at the enterprise level provides transparency for the carbon market, helps to build trust, and promotes market development and maturity;
  • Although a monitoring method for corporate carbon emissions has been established in this study and achieved good results, there are still several areas that can be addressed in future research. First, it is meaningful to compare current emissions levels with the level required to achieve carbon neutrality goals, identify the target gap, and accurately develop emissions reduction strategies. Secondly, more big data can be combined to mutually verify and supplement each other, such as the manufacturing production index, financial transaction index, etc. Finally, actual emissions can be compared with predicted emissions to verify monitoring accuracy and analyze the reasons for errors. These improvements will better utilize big data to promote the smooth achievement of carbon neutrality goals.

Author Contributions

Conceptualization, investigation, resources, project administration, funding acquisition, C.Z. and D.Z.; methodology, Y.T. and C.Z.; software, validation, formal analysis, visualization, Y.T.; writing—original draft preparation, writing—review and editing, Y.T. and Z.C. All authors have read and agreed to the published version of the manuscript.

Funding

This research received no external funding.

Data Availability Statement

The data presented in this study are available upon request from the corresponding author. The related open-source databases are CEADs (https://www.ceads.net/ (accessed on 10 April 2023)), the Guangxi Statistical Yearbook (http://tjj.gxzf.gov.cn/tjsj/tjnj/ (accessed on 20 April 2023)) and the IPCC inventory (https://www.ipcc-nggip.iges.or.jp/public/2019rf/ (accessed on 20 April 2023)).

Conflicts of Interest

Authors Chunli Zhou, Deyan Zhu and Zhiwei Cui were employed by the company Guangxi Power Grid Co., Ltd. The remaining authors declare that the research was conducted in the absence of any commercial or financial relationships that could be construed as a potential conflict of interest.

References

  1. IEA. An Energy Sector Road Map to Carbon Neutrality in China. 2021. Available online: https://www.iea.org/reports/an-energy-sector-roadmap-to-carbon-neutrality-in-china (accessed on 10 April 2023).
  2. Zhang, S. Reflection on Optimizing and Adjusting the Carbon Emission Factors of the Power Grid under the Background of “Dual Carbon”. China Electr. Power Enterp. Manag. 2022, 22, 62–65. [Google Scholar]
  3. Zhao, S.; Fu, H.; Liu, J. Promoting high-quality development of Sinopec in all aspects. Sinopec 2021, 1, 6–8. [Google Scholar]
  4. Shan, Y.; Huang, Q.; Guan, D.; Hubacek, K. China CO2 emission accounts 2016–2017. Sci. Data 2020, 7, 54. [Google Scholar] [CrossRef] [PubMed]
  5. Guan, Y.; Shan, Y.; Huang, Q.; Chen, H.; Wang, D.; Hubacek, K. Assessment to China’s recent emission pattern shifts. Earth’s Future 2021, 9, e2021EF002241. [Google Scholar] [CrossRef]
  6. Chen, X.; Li, H.; Mu, Y. Difficulties and Suggestions for Carbon Peaking and Carbon Neutrality in Guangxi. Volkswagen Technol. 2022, 7, 155–158. [Google Scholar]
  7. Bing, L.; Akintoye, A.; Edwards, P.; Hardcastle, C. The allocation of risk in PPP/PFI construction projects in the UK. Int. J. Proj. Manag. 2005, 23, 25–35. [Google Scholar] [CrossRef]
  8. Wu, J.; Liao, J. Guangxi Statistical Yearbook. 2021. Available online: http://tjj.gxzf.gov.cn/tjsj/tjnj/ (accessed on 20 April 2023).
  9. Wei, Y.; Liu, L.; Fan, Y.; Wu, G. China Energy Report 2008: Carbon Emissions Study; Science Press: Beijing, China, 2008. [Google Scholar]
  10. Zhang, Q.; Zhang, D.; Zhang, X. Application of Online Monitoring to China’s Carbon Emission Trading System: Key Issues and Policy Recommendations. J. Environ. Econ. 2021, 6, 136–146. [Google Scholar]
  11. Pan, J. Construction, challenges and market expansion of emissions trading system. China Popul. Resour. Environ. 2016, 26, 1–5. [Google Scholar]
  12. Liu, Z.; Guan, D.; Wei, W. Carbon emission accounting in China. Sci. China Earth Sci. 2018, 48, 878–887. (In Chinese) [Google Scholar]
  13. Qian, H.; Xu, S.; Cao, J.; Ren, F.; Wu, L. Air pollution reduction and climate co-benefits in China’s industries. Nat. Sustain. 2021, 4, 417–425. [Google Scholar] [CrossRef]
  14. Caldeira, K.; Davis, S.J. Accounting for carbon dioxide emissions: A matter of time. Proc. Natl. Acad. Sci. USA 2011, 108, 8533–8534. [Google Scholar] [CrossRef]
  15. Yu, S.; Zheng, S.; Li, X.; Li, L. China can peak its energy-related carbon emissions before 2025: Evidence from industry restructuring. Energy Econ. 2018, 73, 91–107. [Google Scholar] [CrossRef]
  16. Zhou, Y.; Shan, Y.; Liu, G.; Guan, D. Emissions and low-carbon development in Guangdong-Hong Kong-Macao Greater Bay Area cities and their surroundings. Appl. Energy 2018, 228, 1683–1692. [Google Scholar] [CrossRef]
  17. Chen, G.; Shan, Y.; Hu, Y.; Tong, K.; Wiedmann, T.; Ramaswami, A.; Guan, D.; Shi, L.; Wang, Y. Review on City-Level Carbon Accounting. Environ. Sci. Technol. 2019, 53, 5545–5558. [Google Scholar] [CrossRef] [PubMed]
  18. Hao, H.; Geng, Y.; Li, W.; Guo, B. Energy consumption and GHG emissions from China’s freight transport sector: Scenarios through 2050. Energy Policy 2015, 85, 94–101. [Google Scholar] [CrossRef]
  19. Yang, L.; Lin, B. Carbon dioxide-emission in China׳ s power industry: Evidence and policy implications. Renew. Sustain. Energy Rev. 2016, 60, 258–267. [Google Scholar] [CrossRef]
  20. Gabrielli, P.; Gazzani, M.; Mazzotti, M. The role of carbon capture and utilization, carbon capture and storage, and biomass to enable a net-zero-CO2 emissions chemical industry. Ind. Eng. Chem. Res. 2020, 59, 7033–7045. [Google Scholar] [CrossRef]
  21. Lippiatt, N.; Ling, T.C.; Pan, S.Y. Towards carbon-neutral construction materials: Carbonation of cement-based materials and the future perspective. J. Build. Eng. 2020, 28, 101062. [Google Scholar] [CrossRef]
  22. Yan, Y.; Zhang, H.; Long, Y. A factor-based bottom-up approach for the long-term electricity consumption estimation in the Japanese residential sector. J. Environ. Manag. 2020, 270, 110750. [Google Scholar] [CrossRef] [PubMed]
  23. Brohé, A. The Handbook of Carbon Accounting; Routledge: Oxfordshire, UK, 2017. [Google Scholar]
  24. Eggleston, H.; Buendia, L.; Miwa, K.; Ngara, T.; Tanabe, K. 2006 IPCC Guidelines for National Greenhouse Gas Inventories. 2006. Available online: https://www.osti.gov/etdeweb/biblio/20880391 (accessed on 20 April 2023).
  25. Oda, T.; Maksyutov, S.; Andres, R.J. The Open-source Data Inventory for Anthropogenic CO2, version 2016 (ODIAC2016): A global monthly fossil fuel CO2 gridded emissions data product for tracer transport simulations and surface flux inversions. Earth Syst. Sci. Data 2018, 10, 87–107. [Google Scholar] [CrossRef] [PubMed]
  26. Li, Z.; Sun, L.; Geng, Y.; Dong, H.; Ren, J.; Liu, Z.; Tian, X.; Yabar, H.; Higano, Y. Examining industrial structure changes and corresponding carbon emission reduction effect by combining input-output analysis and social network analysis: A comparison study of China and Japan. J. Clean. Prod. 2017, 162, 61–70. [Google Scholar] [CrossRef]
  27. Sun, L.; Qin, L.; Taghizadeh-Hesary, F.; Zhang, J.; Mohsin, M.; Chaudhry, I.S. Analyzing carbon emission transfer network structure among provinces in China: New evidence from social network analysis. Environ. Sci. Pollut. Res. 2020, 27, 23281–23300. [Google Scholar] [CrossRef]
  28. Chen, H.; Wang, R.; Liu, X.; Du, Y.; Yang, Y. Monitoring the enterprise carbon emissions using electricity big data: A case study of Beijing. J. Clean. Prod. 2023, 396, 136427. [Google Scholar] [CrossRef]
  29. Abdi, R.; Taki, M.; Akbarpour, M. An Analysis of Energy input-output and Emissions of Greenhouse Gases from Agricultural Productions. Int. J. Nat. Eng. Sci. 2012, 6, 73–79. [Google Scholar]
  30. Qu, S.; Liang, S.; Xu, M. CO2 emissions embodied in interprovincial electricity transmissions in China. Environ. Sci. Technol. 2017, 51, 10893–10902. [Google Scholar] [CrossRef]
  31. Poblete-Cazenave, M.; Pachauri, S. A model of energy poverty and access: Estimating household electricity demand and appliance ownership. Energy Econ. 2021, 98, 105266. [Google Scholar] [CrossRef]
  32. Singh, P.; Kansal, A.; Carliell-Marquet, C. Energy and carbon footprints of sewage treatment methods. J. Environ. Manag. 2016, 165, 22–30. [Google Scholar] [CrossRef]
  33. Hamamoto, M. Energy-saving behavior and marginal abatement cost for household CO2 emissions. Energy Policy 2013, 63, 809–813. [Google Scholar] [CrossRef]
  34. Chancel, L. Are younger generations higher carbon emitters than their elders?: Inequalities, generations and CO2 emissions in France and in the USA. Ecol. Econ. 2014, 100, 195–207. [Google Scholar] [CrossRef]
  35. Liu, Z.; Guan, D.; Wei, W.; Davis, S.J.; Ciais, P.; Bai, J.; Peng, S.; Zhang, Q.; Hubacek, K.; Marland, G. Reduced carbon emission estimates from fossil fuel combustion and cement production in China. Nature 2015, 524, 335–338. [Google Scholar] [CrossRef] [PubMed]
  36. China Carbon Emissions Database. Available online: https://www.ceads.net/ (accessed on 20 April 2023).
  37. 2019 Refinement to the 2006 IPCC Guidelines for National Greenhouse Gas Inventories. Available online: https://www.ipcc-nggip.iges.or.jp/public/2019rf/ (accessed on 10 April 2023).
  38. Wei, W.; Zhang, P.; Li, J. The framework of regional electricity-related carbon emissions accounting and its application. China Popul. Resour. Environ. 2020, 30, 9. [Google Scholar]
  39. Li, W.; Liang, C.; Dong, X.; Li, Y.; Li, S. Analysis of the Impact of Green Electricity and Green Certificate Trading on Carbon Emission Factors in Electricity. Value Eng. 2023, 42, 13–15. [Google Scholar]
  40. Vidovic, D.; Marmier, A.; Zore, L.; Moya, J. Greenhouse Gas Emission Intensities of the Steel, Fertilisers, Aluminium and Cement Industries in the EU and Its Main Trading Partners; Publications Office of the European Union: Luxembourg, 2023. [Google Scholar]
  41. Available online: https://baijiahao.baidu.com/s?id=1701507758246891378&wfr=spider&for=pc (accessed on 3 January 2024).
  42. Available online: https://www.huaon.com/channel/distdata/875847.html (accessed on 3 January 2024).
  43. Available online: https://www.toutiao.com/article/7215637230218527291/?wid=1705464821861 (accessed on 3 January 2024).
  44. Available online: https://baijiahao.baidu.com/s?id=1785269024649166773&wfr=spider&for=pc (accessed on 3 January 2024).
  45. Wang, W.; Wu, J.; Ge, Y.; Li, Q. Carbon emission accounting method and strategy analysis under the dual carbon background–Taking the copper and aluminum industry as an example. Nonferrous Met. (Smelt. Part) 2022, 4, 1–11. [Google Scholar]
  46. Available online: https://wenku.baidu.com/view/fa80aec20329bd64783e0912a216147917117ee2.html (accessed on 3 January 2024).
  47. Zhou, C.; Lin, X.; Wang, R.; Song, B. Real-time carbon emissions monitoring of high-energy-consumption enterprises in Guangxi based on electricity big data. Energies 2023, 16, 5124. [Google Scholar] [CrossRef]
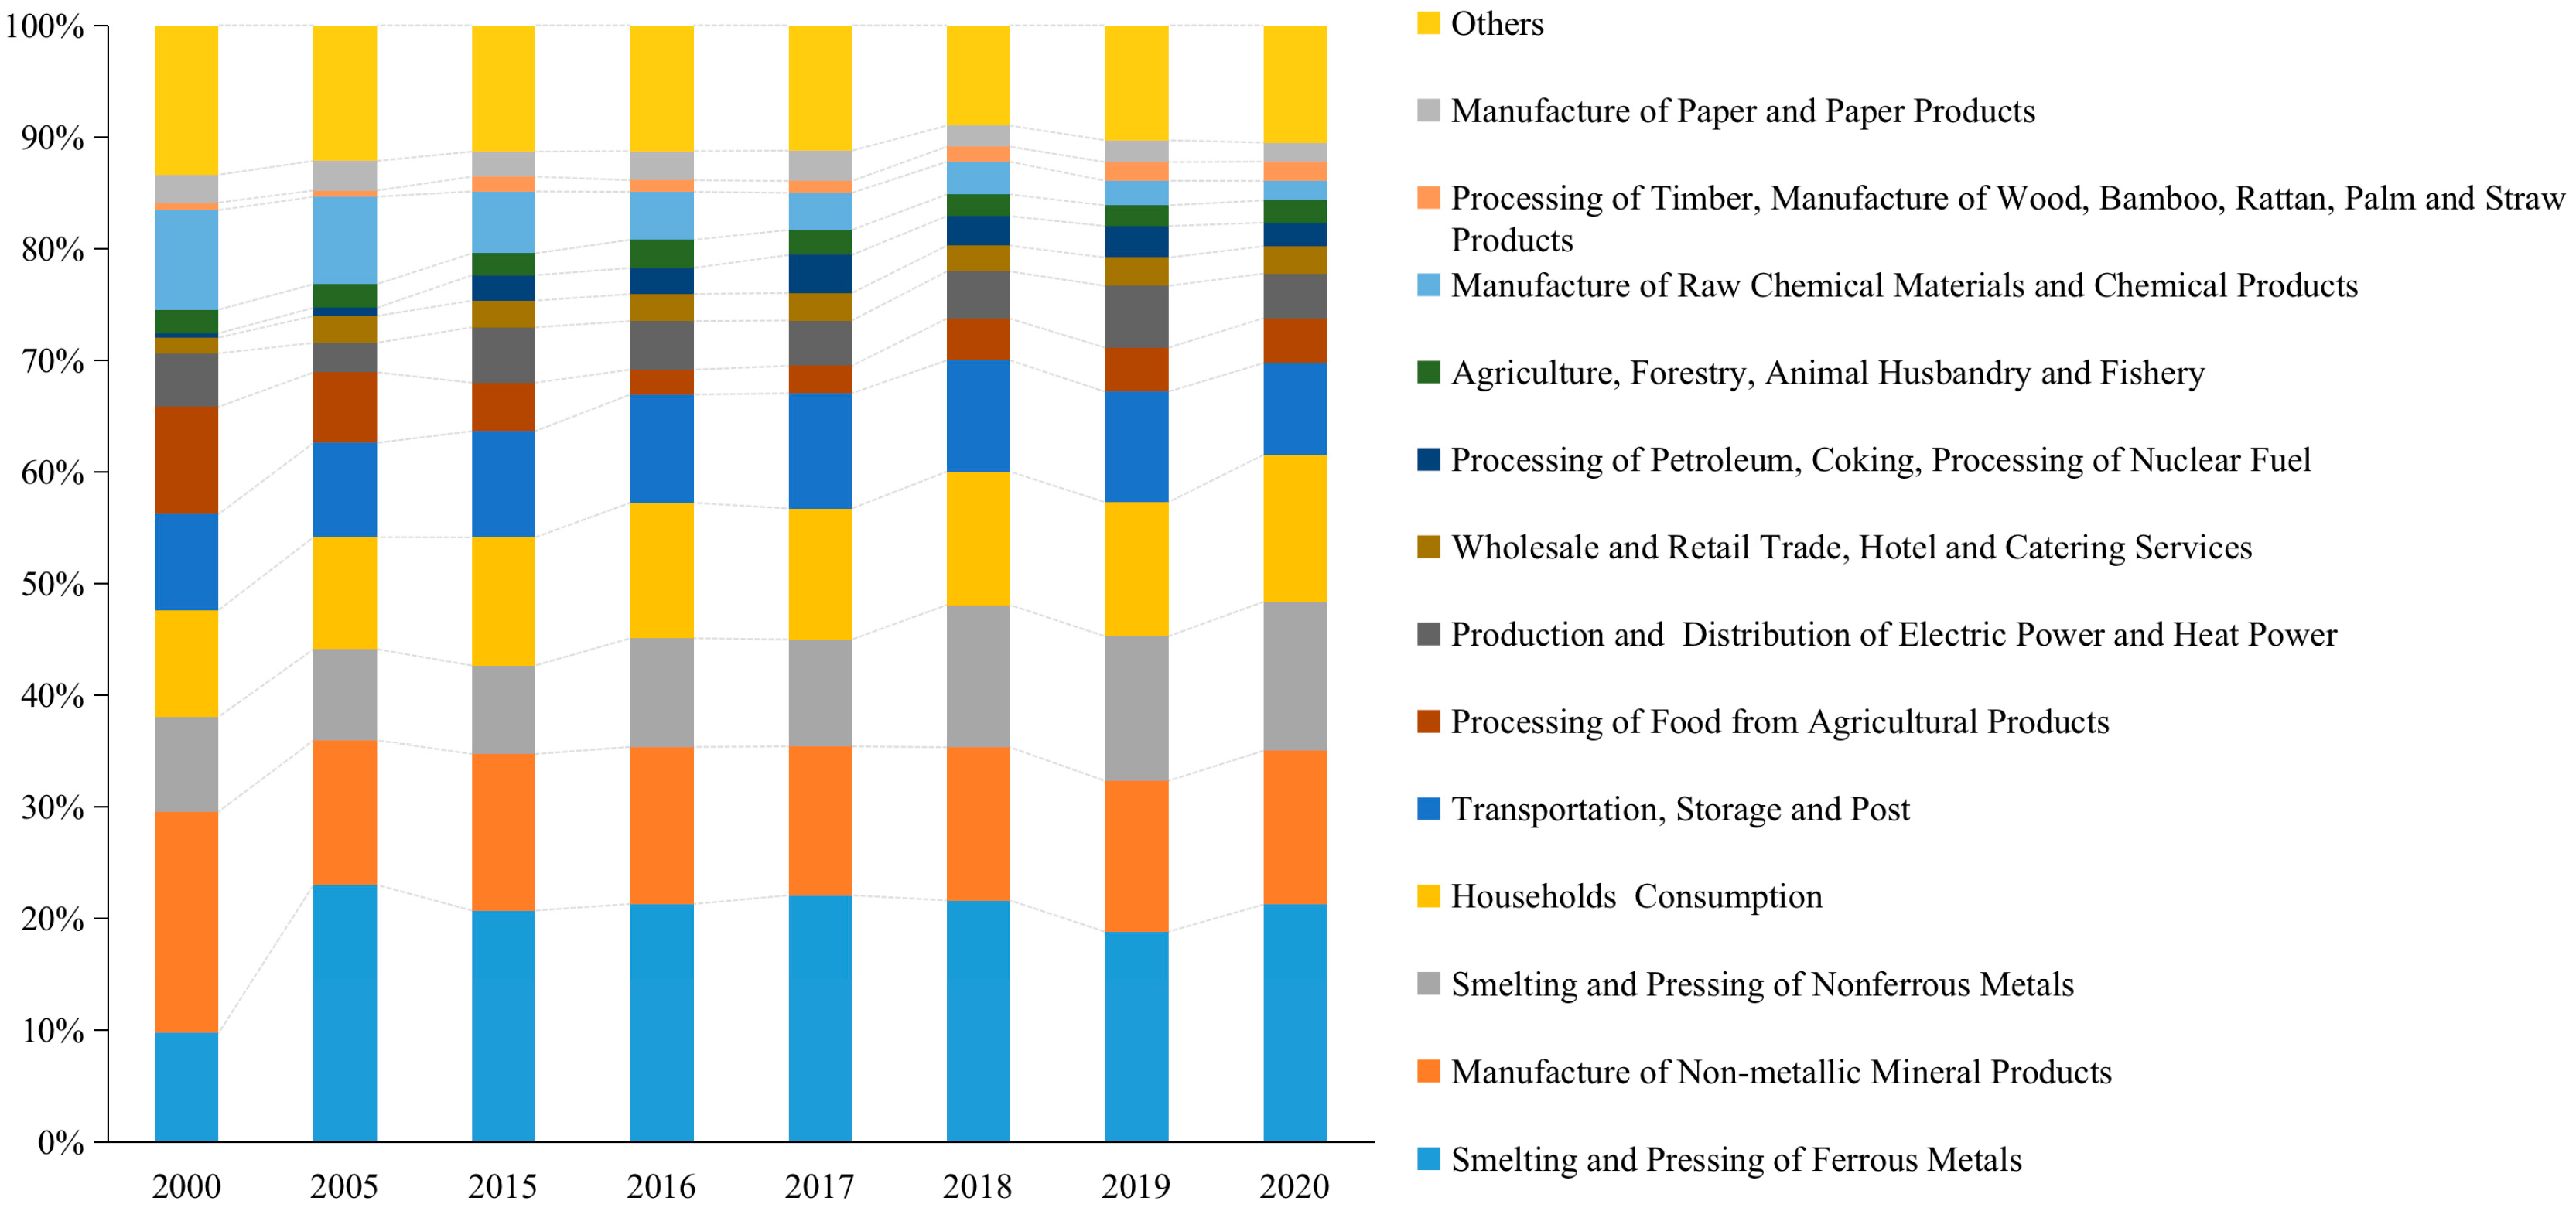
Figure 1. Proportion of total energy consumption by industry in Guangxi Province [8].
Energies 17 00652 g001
Figure 2. Direct carbon emissions of metals in Guangxi.
Energies 17 00652 g002
Figure 3. CO2 emission flows in 2020 (Mt).
Energies 17 00652 g003
Figure 4. Regional emission coefficients in 2020.
Energies 17 00652 g004
Figure 5. Full carbon emissions in Guangxi.
Energies 17 00652 g005
Figure 6. Emissions intensities in Guangxi.
Energies 17 00652 g006
Figure 7. Electricity-CO2 coefficient in Guangxi (2020).
Energies 17 00652 g007
Figure 8. Prediction of electricity-CO2 coefficient.
Energies 17 00652 g008
Figure 9. Prediction errors of electricity-CO2 coefficient (ARMA).
Energies 17 00652 g009
Figure 10. Prediction errors of electricity-CO2 coefficient (Trend Extrapolation).
Energies 17 00652 g010
Figure 11. Real-time carbon emissions monitoring map of Guangxi in ferrous metal. Note: The larger orange circles represent the enterprises in the metal smelting industry that this article focuses on. The smaller gray circles represent enterprises in all industries. Color depth indicates the intensity of carbon emissions.
Energies 17 00652 g011
Figure 12. Real-time carbon emissions monitoring map of Guangxi in nonferrous metal. Note: The larger orange circles represent the enterprises in the metal smelting industry that this article focuses on. The smaller gray circles represent enterprises in all industries. Color depth indicates the intensity of carbon emissions.
Energies 17 00652 g012
Disclaimer/Publisher’s Note: The statements, opinions and data contained in all publications are solely those of the individual author(s) and contributor(s) and not of MDPI and/or the editor(s). MDPI and/or the editor(s) disclaim responsibility for any injury to people or property resulting from any ideas, methods, instructions or products referred to in the content.