Abstract
In recent years, the exploration of oil and gas in China’s Precambrian strata has garnered significant attention, leading to notable advancements in exploration play assessment. However, there is a dearth of published literature on Proterozoic source rocks’ organic sources, sedimentary environments, marine hydrochemistry, and other attributes. This study focuses on investigating potential source rocks within the Hongshuizhuang and Xiamaling Formations in the Jibei Depression of North China. A comprehensive analysis was conducted to evaluate hydrocarbon generation characteristics, using hydrocarbon biomarkers and polar compounds as geochemical indicators for precursor biota and maturity levels. The results indicate high organic matter abundance with predominantly type I-II1 organic matter composition in the studied source rocks. These samples are at an immature–low mature stage, with the potential for primarily generating aromatic crude oil. The parent material is mainly attributed to lower aquatic organisms, such as bacteria and algae. The sedimentary environment exhibits marine facies, characterized by high evaporation rates, salinity levels, and strong euxinic conditions, that led to sulfur incorporation into the organic matter matrix. It should be noted that correlations between biomarker parameters and maturity may not be fully applicable to ancient source rocks; however, the methyldibenzothiophene ratio (MDR) demonstrates a strong correlation with Tmax. The compounds and their total monoisotope ions abundance (TMIA) were primarily identified and analyzed using FT–ICR MS. It was observed that these compounds were influenced by the depositional environment and organic matter maturity. Importantly, it was clearly demonstrated that the DBE and carbon number range of CH compounds gradually increased with maturity, due to the removal of N, S, and O functional groups. Specifically, N1 compounds predominantly consisted of carbazoles with short alkyl side chains which readily converted into N1Ox compounds. On the other hand, O1 compounds mainly comprised benzofurans with low abundance, indicating a reducing sedimentary environment, as suggested by their low TMIA values. Furthermore, S1 compounds were primarily thiophenes whose DBE range and carbon number increased with maturity, possibly suggesting an abiotic input of inorganic sulfur. Notably, the maturity indices (MAT) proved suitable for Mesoproterozoic source rocks while exhibiting strong linear relationships.
1. Introduction
Due to the scarcity of reliable fossils and suitable reservoirs in the Mesoproterozoic era, its environmental conditions and biological evolution have generally been perceived as stagnant, thus rendering it an unsuitable layer for high-quality oil and gas exploration. However, recent advancements in unconventional oil and gas theory, along with expanded exploration efforts, have sparked significant interest in the potential hydrocarbon resources within Precambrian strata. Notably, successful discoveries of oil and gas fields have been made in cratonic basins located in East Siberia, Oman, and Australia, among other regions. Consequently, substantial progress has been achieved regarding the exploration of oil and gas resources during the Mesoproterozoic period [1,2]. Several studies indicate that favorable climatic conditions and marine stratification during this time facilitated organic matter burial and source rock deposition [3,4]. Moreover, the diverse participation of various microorganisms alongside the discovery of eukaryotes has enriched the composition of hydrocarbon-generating parent materials within source rocks [5,6], thereby providing a preliminary foundation for subsequent investigations into hydrocarbon generation from these sources. Nevertheless, it is crucial to acknowledge that Precambrian source rocks differ significantly from their Phanerozoic counterparts, not only concerning parent material sources, but also atmospheric environment dynamics and marine water chemistry conditions, as well as sedimentary models influencing source rock formation processes and organic matter evolution throughout this particular geological epoch. Regrettably, though unsurprisingly given these complexities inherent to Precambrian geology, research remains relatively limited, which consequently hampers both exploration discoveries and resource assessment orientations. The Mesoproterozoic of Jibei Depression in North China exhibits numerous sets of source rocks, characterized by continuous deposition and stable distribution, offering significant potential for oil and gas resources. Therefore, based on a comprehensive literature review, this study focuses on the Hongshuizhuang and Xiamaling formations as experimental subjects to evaluate the organic matter content using various experimental methods. Gas chromatography–mass spectrometry (GC–MS) is employed to characterize biomarkers, enabling further analysis of the origin of organic matter, the sedimentary environment, and the thermal evolution characteristics of source rocks. Additionally, suitable biomarker parameters for ancient Mesoproterozoic strata are determined. Furthermore, Fourier-transform ion cyclotron resonance mass spectrometry (FT–ICR MS) is utilized to analyze the types and characteristics of polar molecular compounds in marine low-maturity compounds, while revealing their changing patterns and influencing factors. The maturity indices (MAT) are used to estimate the fitting degree of high-precision experimental parameters, which provides valuable insights for evaluating, exploring, and developing oil and gas resources in Mesoproterozoic source rocks.
2. Geological Setting
North China Craton (NCC) is a well-preserved ancient landmass in China, with ancient historical sites dating back over 3.8 billion years. Its tectonic evolution is complex and the rock types are diverse and highly characteristic. The Yanshan area in the northern part of the craton has the most complete Mesoproterozoic strata, covering an area of approximately 10.6 × 10⁴ km2 and presenting a development pattern of “five depressions and two uplifts”. The central position of this area consists of “two uplifts” [7], while the Jibei depression is located in the central north of the Yanshan sedimentary belt, extending from the Mihuai uplift to the Inner Mongolia axis, in an east–west direction, with an additional north-east-east transformation towards its eastern end, covering an area of 8733 km2 [8]. Among them, the Mesoproterozoic strata are widely distributed with complete stratigraphic sequences; more than 100 surface oil seedlings and asphalt nodules have been found [9], which hold great potential for oil and gas exploration and development. In North China’s northern region, strata are well-developed, mainly on the Inner Mongolia axis, with a weak metamorphic degree (below greenschist facies) but good continuous sedimentary preservation. This study focuses primarily on the Mesoproterozoic Hongshuizhuang Formation and the Xiamaling Formation in northern North China (Figure 1). Using a zircon U–Pb dating method, we obtained numerous high-precision age data, combined with an assumed average deposition rate that limits the lower/upper ages for the Xiamaling Formation at about 1400 Ma/1320 Ma, respectively [10], while the Hongshuizhuang Formation’s sedimentary age ranges between approximately 1470 and 1450 Ma [11]. The Xiamaling Formation comprises a complete sedimentary cycle, characterized by a relative rise and subsequent fall in sea level, which can be subdivided into four distinct sections from bottom to top. The first member of the Xiamaling Formation is composed of silty shale, and its color changes upward, from greenish yellow to light gray to dark gray. Iron-rich sandstone and siltstone can be identified at the bottom. The second member is gray–green glauconite-bearing sandstone and siltstone, a greenish shale rich in pyrite. The third member is usually composed of thick black shale, with a small amount of thin siliceous shale at the bottom. The fourth member includes black shale, dark gray shale, and gray–green shale, with silty mudstone. The Hongshuizhuang Formation was deposited in the late stage of the Yanshan rift zone [12], and strong dolomitization occurred. After sedimentation, the strata were accompanied by transgression, forming a sedimentary sequence with deeper sedimentary waters and a lower cycle speed, and the thickness distribution was stable. The overlying strata consist of the Tieling and Xiamaling Formations, predominantly comprising dense argillaceous siltstone and shale deposits. These formations exhibit favorable caprock conditions, making them highly prospective for oil and gas exploration. Stratigraphically, they can be subdivided into dolomite and shale units. The dolomite section comprises gray dolomicrite and dark gray argillaceous dolomite, while the shale section is primarily characterized by dark gray and black lithologies.
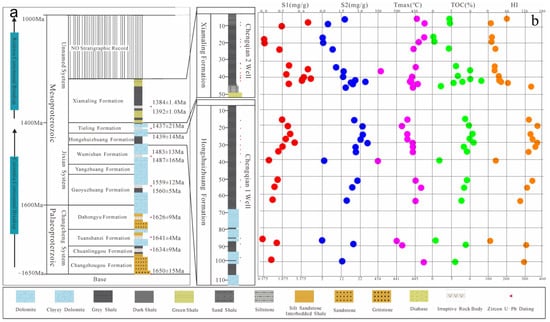
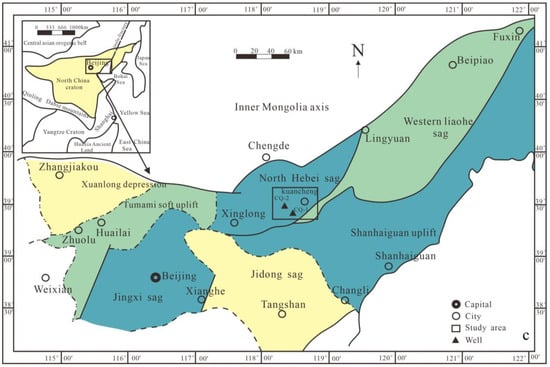
Figure 1.
Structural region division, comprehensive stratigraphic column, and sampling well parameter profile in North China (a) Stratigraphic sequence in northern North China and lithology map of Chengshallow Wells 1 and 2 (b) the basic pyrolysis parameter diagram (The red circle represents the S1 content, the blue circle represents the S2 content, the purple circle represents the highest pyrolysis temperature of the rock, the green circle represents the Toc content, and the orange circle represents the H1 index) (c) Schematic map of structural region division in northern North China (base map modified after [13]).
3. Samples and Methods
3.1. Samples
According to the geological background, systematic and continuous sampling was conducted for well Chengqian 1 (CQ1) and well Chengqian 2 (CQ2), resulting in the acquisition of 27 source rock samples at different depths. These samples served as valuable materials for subsequent experiments (Figure 1). The mass distribution of the samples ranged from 40 g to 51 g. After being ground into powders, the samples were subjected to pretreatment for subsequent experiments. Firstly, soxhlet extraction was performed, followed by quantification of the extracts based on group components. The extracts were then separated into saturates, aromatics, resin, and asphaltene, for further GC–MS analysis. Subsequently, representative extracts were selected for Fourier-transform ion cyclotron resonance–mass spectrometry analysis.
3.2. Methods
In the study, the samples were first subjected to basic organic matter analysis. The content of Total organic carbon(TOC) was determined. The instrument involved in TOC is Leco SC 632. The equivalent vitrinite reflectance was detected by a microphotometer. Open-system pyrolysis (Py–GC) refined the S2 peak of rock pyrolysis to obtain the composition of unstable organic matter of free hydrocarbons in source rocks. The 30 mg sample was placed in a glass tube and heated at 50 °C/min from 300 to 600 °C with helium as the carrier gas. The pyrolysis products were collected and condensed in a cryogenic trap. The products were analyzed by gas chromatography, and the range of carbon-containing compounds (C1, C2–5, C6–14, and C15+) and individual compounds (n-olefins, n-alkanes, alkyl aromatics, and alkyl thiophenes) were quantified using a standardization of n-butane.
The gas chromatography–mass spectrometry (GC–MS) analysis was conducted by heating the sample in the chromatographic column at a constant temperature of 50 °C for 1 min using helium flow (flow rate: 1.0 mL/min). Subsequently, the temperature was increased to 300 °C at a rate of 30 °C/min and held at this temperature for 15 min. The standard method allowed the determination of the peak area ratio and the absolute content for each series of biomarker compounds.
Fourier-transform ion cyclotron resonance mass spectrometry (FT–ICR MS) combined with positive ion mode(APPI) positive ion mode was employed to analyze polar molecular compounds in source rocks. The extract was dissolved in a mixture of methanol and n-hexane (9:1), injected into the APPI source at a flow rate of 20 μL/h, and subjected to ultra-high resolution mass spectrometry analysis using the Bruker FT–ICR MS system, equipped with a 12 T cryo-superconducting magnet. Preliminary calibration utilized a polyethylene glycol mixture as a calibrator, followed by recalibration in secondary calibration mode prior to data analysis. To ensure experimental accuracy, only signals with a signal-to-noise ratio ≥ 12 were retained.
4. Results and Discussions
4.1. Organic Matter Occurrence
Abundance is the main component of source rock evaluation, which plays an important role in the evaluation of hydrocarbon generation, expulsion, adsorption, and storage. The total organic carbon (TOC) is expressed as the mass fraction of organic carbon contained in the rock under the unit mass, combined with the hydrocarbon generation potential (S1 + S2), reflecting the total amount of hydrocarbon generated by the source rock under the unit mass, which is widely used in the rapid analysis of organic matter abundance in source rocks [14,15]. As shown in Figure 2, the TOC content of the Xiamaling Formation samples is distributed between 0.17 and 7.71%, with an average of 3.5%, and the hydrocarbon generation potential is distributed between 0.05 and 4.15 mg/g, with an average of 1.98 mg/g. The TOC content of the Hongshuizhuang Formation samples is distributed in the range of 0.27–6.26%, with an average value of 4.47%, and the hydrocarbon generation potential is distributed between 0.05 and 4.15 mg/g, with an average value of 1.98 mg/g. The frequency distribution of TOC in the two formations is similar, but the hydrocarbon generation potential (S1 + S2) is quite different. The samples from Xiamaling Formation are mainly concentrated at less than 6.0 mg/g, while samples from Hongshuizhuang Formation are mainly concentrated at greater than 20.0 mg/g.
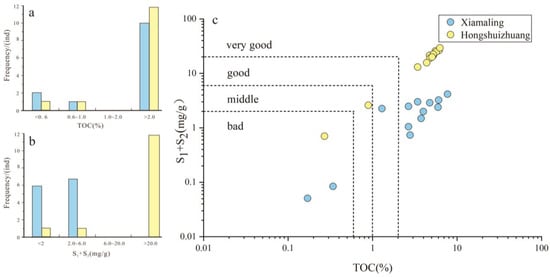
Figure 2.
(a–c) Organic matter richness and hydrocarbon generation potential parameters of Mesoproterozoic source rocks.
The type of organic matter determines the properties of hydrocarbon generated by source rocks, and also affects the parameters such as hydrocarbon generation threshold and generation potential in the evolution process. According to the trichotomy scheme, the organic matter types of source rocks are determined by microscopic whole rock macerals, and the direction of oil and gas exploration is determined. As shown in Figure 3, through the quantitative determination of macerals, it was found that no vitrinite, exinite, or inertinite were present in the samples. Therefore, the conventional triangular diagram of vitrinite, exinite, and inertinite cannot be used for discrimination. It is revealed that the source rock samples are not derived from the parent material of higher animals and plants; that is, the organic matter type is not type II2 or type III. The characteristics of the samples were analyzed. For the Xiamaling Formation, it was found that carbon asphalt (An) was short-banded in black shale, and microparticles (Mi) and pyrite (Py) were dispersed in the clay mineral (Cl) substrate. For the Hongshuizhuang Formation, it was found that there were relatively developed cracks in black shale, and asphaltene (B) was distributed in micro-layered parallel layers in clay mineral (Cl) basement or filled in pores between particles; additionally, pyrite (Py) was distributed in clusters, strawberries, or particles, which were evenly distributed in the clay mineral (Cl) substrate. Vitrinite, exinite, and inertinite reflect organic matter, derived predominantly from higher animals and plants as parent sources, whereas solid bitumen and microsomes primarily indicate contributions from phytoplankton and bacteria as parent materials. The differences between the two sets of black shales in different layers can be summarized as follows: the common occurrence of asphalt in the Xiamaling Formation was confined to a narrow band, whereas in the Hongshuizhuang Formation, it was distributed more extensively and enriched; pyrite particles were scattered in samples from the Xiamaling Formation, while most samples from the Hongshuizhuang Formation exhibited agglomerated and strawberry-like distribution patterns. Microsomes were exclusively observed in samples from the Xiamaling Formation. These observations further support classifying the source rock samples as type I-II1. The presence of pyrite (FeS2) suggests sulfidation within a sedimentary environment, while its susceptibility to oxidation indicates stagnant water conditions with reducing tendencies.
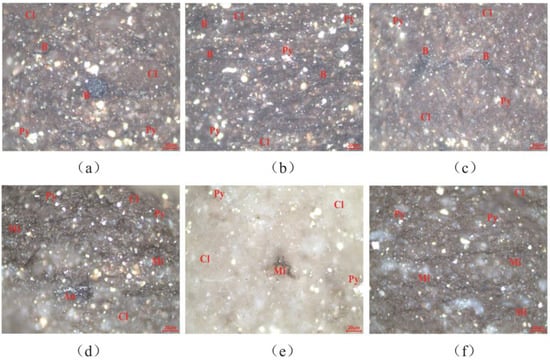
Figure 3.
The macerals under the whole rock microscope. (a) CQ1–5, Hongshuizhuang Formation, uniform distribution of pyrite particles; (b) CQ1–9, Hongshuizhuang Formation, fracture and pore development, asphaltene filling; (c) CQ1–11, Hongshuizhuang Formation, asphaltenes filled in pores, and pyrite distributed in agglomerates; (d) CQ2–1, Xiamaling Formation, short-banded carbon asphalt; (e) CQ2–3, Xiamaling Formation, scattered distribution of pyrite; and (f) CQ2–6, Xiamaling Formation, a large number of microsomes evenly distributed.
Organic matter maturity is an important index to reflect the hydrocarbon generation and expulsion of source rocks. The maturity could be characterized by the temperature (Tmax) at the highest pyrolysis hydrocarbon production rate in the process of rock pyrolysis analysis. A Rock-Eval 6 instrument was used for pyrolysis. The Tmax value range of the source rock sample was generally between 356 and 451 °C, with an average of 434 °C, and the overall performance was at the immature–low mature stage. The maximum Tmax value of the Xiamaling Formation sample was 448 °C, the minimum value was 417 °C (except the obviously abnormal CQ-8, 356 °C), and the average value was 429 °C, which mainly showed the immature–low mature stage. While the maximum Tmax value of the Hongshuizhuang Formation sample was 451 °C, the minimum value was 441 °C, and the average value was 445 °C, which showed that all samples were in the low mature stage. Thus, the organic matter maturity of the Hongshuizhuang Formation was higher than that of the Xiamaling Formation.
Pyrolysis gas chromatography minimizes secondary reactions and enables the identification of various original components bonded to organic macromolecules, thereby providing detailed molecular composition information on the kerogen and hydrocarbon types generated. By establishing a carbon number ternary diagram of pyrolysis products with different alkyl chain lengths, the organic phase of source rocks can be predicted. As shown in Figure 4, Hongshuizhuang Formation source rocks mainly produced low-wax-content paraffin–naphthene–aromatic crude oil with some gas and condensate oil, indicating the stronger aromaticity of kerogen functional groups. Xiamaling Formation source rocks predominantly produced crude oil with some paraffin-based crude oil; their higher wax content reflected a higher average molecular weight of pyrolysis products and the richer-than-normal long chain structure of organic functional groups on kerogen.
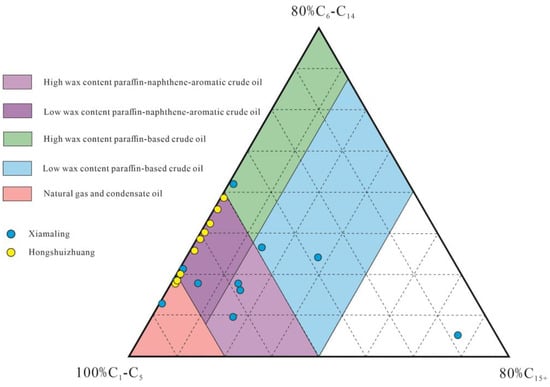
Figure 4.
Pyrolysis gas chromatography analysis of source rock organic facies (base map modified after, [16]).
4.2. Characteristics of Biomarker Compounds
Biomarkers are also known as geochemical fossils or “fingerprint compounds”. The skeleton structure of organic molecules from organisms in geological bodies has a certain stability and heredity in the process of life evolution and organic matter evolution. Although it is affected by many geological processes, it still retains the carbon skeleton structure and functional groups of basic original biological components [17]. The accurate identification of biomarker compounds, if further quantified, can regard the composition and relative abundance of a series of biomarker compounds as molecular “fingerprints”, which is of great significance in evaluating the properties of organic matter, judging kerogen types and the sedimentary environment, and identifying the secondary effects of hydrocarbons [18,19,20]. In this study, the saturated and aromatic hydrocarbons of the samples were analyzed using GC–MS experiments, after separating the group components. The characterization of biomarkers in Mesoproterozoic organic matter aimed to provide insights into ancient sedimentary environments, redox conditions of water bodies, sources and supplies of organic matter, as well as thermal evolution of source rocks. Saturated hydrocarbons (compounds composed of carbon and hydrogen atoms, with only single bonds, that are no longer able to form chemical bonds with other atoms) are widely used, which mainly include n-alkanes, isoprenoids, terpanes, and steranes [21]. In this study, alkanes and isoprenoids constituted the primary components of saturated hydrocarbon chromatography. However, steranes, terpanes, and hopanes exhibited significant baseline drift, rendering the accurate identification of peak types and compounds challenging (Figure 5). Aromatic hydrocarbons are crucial constituents of sedimentary organic matter, due to their stable carbon skeleton structure and robust resistance against degradation [22]. Naphthalene series, phenanthrene series, and trifluorene series, with high abundance, wide distribution, and relatively complete species, were selected as related indicators. Single aromatic steroids and triaryl steranes showed strong baseline drift, and most samples could not accurately identify peak types and compounds.
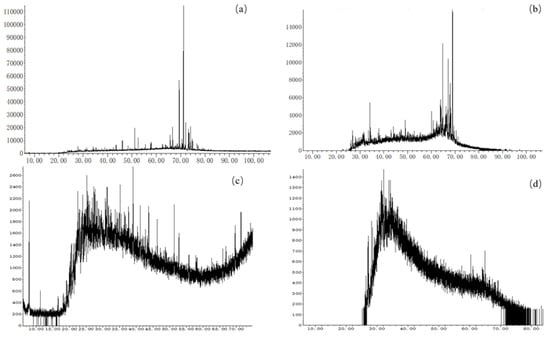
Figure 5.
Typical GC–MS results of Mesoproterozoic samples ((a) CQ2–5, Hongshuizhuang Formation, m/z = 191; (b) CQ2–5, m/z = 217; (c) CQ1–3, Xiamaling Formation, m/z = 191; and (d) CQ1–3, m/z = 217).
4.2.1. Sedimentary Environment and Parent Material Source
The organic matter evolved from biological deposition is the main source of saturated hydrocarbons in source rocks. The saturated hydrocarbons carried by different biological sources have different distribution types. The chromatogram of n-alkanes in saturated hydrocarbons can provide information on the source of organic matter. The samples of the Hongshuizhuang Formation are all standard front peak type; the carbon number is mainly distributed between nC13 and nC20, and the main peak carbon is mostly in nC14 (Figure 6a). Most of the samples from the Xiamaling Formation are pre-peak type; a small number of samples have bimodal characteristics, and the carbon number is mainly distributed between nC13 and nC20. The main peak carbon of the pre-peak type Xiamaling samples is mainly nC16, and the main peak carbon of the samples with bimodal characteristics is after nC20 (Figure 6b). The samples of the Hongshuizhuang Formation and most of the samples from the Xiamaling Formation exhibit a diverse range of parent material sources, primarily consisting of lipid-rich compounds derived from low aquatic organisms such as bacteria and algae. However, it is worth noting that the bimodal sample observed in the Xiamaling Formation may be attributed to potential contamination.

Figure 6.
Typical GC–MS results of Mesoproterozoic samples ((a) CQ2–13, Xiamaling Formation, m/z = 85); ((b) CQ1–11, Hongshuizhuang Formation, m/z = 85).
In addition, isoprenoids are frequently employed as indicators for identifying oxidation-reduction sedimentary environments, with pristane (Pr) and phytane (Ph) being the most prevalent biomarkers. The correlation diagram of Pr/nC17 and Ph/nC18 can provide insights into the source of organic matter and the sedimentary environment. As depicted in Figure 7, samples from Hongshuizhuang and Xiamaling occupy the lower left corner of the diagram, indicating a relatively dense distribution. This suggests that the parent materials of both formations primarily consist of lower aquatic plants or bacteria found in saline lakes or marine facies, implying a closed and strongly reducing sedimentary environment. These findings are consistent with those inferred from n-alkanes.
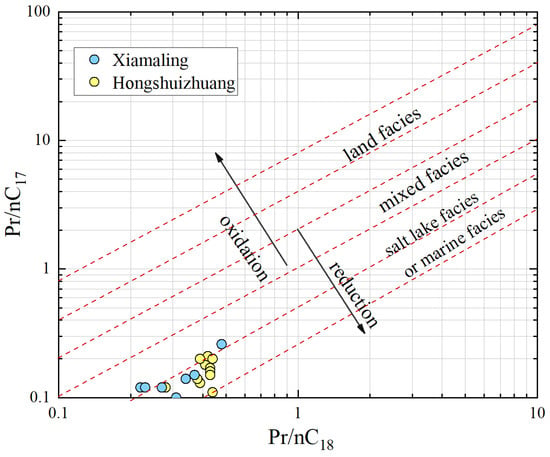
Figure 7.
Pr/nC17 vs. Ph/nC18 of Mesoproterozoic samples (base map modified after [19]).
The trifluorene series compounds (oxyfluorene, thiofluorene, and fluorene) in aromatic hydrocarbons exhibit similar basic skeletons to saturated hydrocarbons and may originate from the same precursors. The evolution of these precursors is influenced by the sedimentary environment of organic matter deposition, making them valuable indicators of redox conditions [23]. Under oxidizing or weakly reducing environments, oxyfluorene series compounds are more likely to form, whereas under normal reducing conditions, fluorene series compounds are favored. In the strong reduction environment of saltwater lake facies or sea facies, it is easier to be reduced to sulfur-containing aromatic hydrocarbons, dominated by thiofluorene. In the source rocks of freshwater and brackish lake facies, the content of fluorene is relatively high, while in the source rocks of swamp facies and coal measures, the content of oxyfluorene is more abundant [23,24].
From Figure 8a, it can be seen that the trifluorene series compounds of the Mesoproterozoic Hongshuizhuang source rocks in North China showed the distribution characteristics of sulfur fluorene > fluorene > oxygen fluorene, which characterizes the sedimentary environment with strong reducibility, while the trifluorene series compounds of the Xiamaling source rocks showed the distribution characteristics of sulfur fluorene ≈ fluorene > oxygen fluorene, which characterizes the normal reduction-strong sedimentary environment. In the samples of the Hongshuizhuang Formation, the sulfur fluorene series compounds were dominant, and the content was distributed between 56.0 and 67.8%, with an average of 61.8%; fluorene series compounds followed, distributed between 27.4% and 38.4%, with an average of 32.2%; the proportion of oxygen fluorene series was very low, with an overall average of 5.8%. In contrast, the content percentage of trifluorene series compounds in the Xiamaling Formation varied greatly, among which sulfur fluorene and fluorene series compounds were the main components, and the content of sulfur fluorene compounds was distributed between 27.7% and 69.0%, with an average of 41.9%; the content of fluorene series compounds was 29.9–67.3%, with an average of 52.9%; the content of oxygen fluorene series compounds was lower than that of the Hongshuizhuang Formation, with an average of 5.19%. Since the distribution characteristics of trifluorene series compounds were not suitable indices for samples in the transition stage between oxidation and reduction, the sedimentary environment could be better identified through the intersection diagram of ∑ SF/∑ (F + SF) and ∑ OF/∑ (F + OF) (Figure 8b). The distribution of Hongshuizhuang samples was relatively concentrated. The range of the ∑ SF/∑ (F + SF) value was 0.59–0.71, with an average of 0.65, and the range of the ∑ OF/∑ (F + OF) value was 0.09–0.23, with an average of 0.15, showing a strong reducing environment with high salinity, which indicated that it was very likely to have been a closed seawater environment during deposition. The distribution of Xiamaling samples was discrete. The range of the ∑ SF/∑ (F + SF) value was 0.30–0.69, with an average of 0.44, and the range of the ∑ OF/∑ (F + OF) value was 0.03–0.32, with an average of 0.08. Although the Xiamaling Formation was also a reducing environment, its reducibility was weaker than that of Hongshuizhuang Formation.
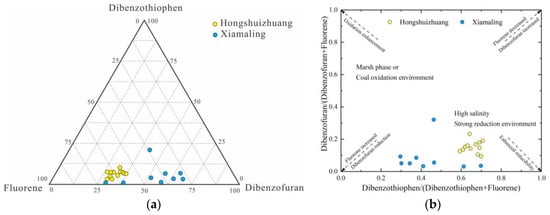
Figure 8.
The distribution characteristics of trifluorene series compounds and sedimentary environment identification (a) Content distribution characteristics (b) Sedimentary environment identification map (base map modified after [24]).
4.2.2. Thermal Evolution Characteristics of Organic Matter
The characteristic parameters of naphthalene, phenanthrene, and trifluorene series in aromatic hydrocarbons serve as effective indicators for assessing the thermal maturity of source rocks. Among these parameters, the most commonly used feature is the phenanthrene series, specifically the methyl phenanthrene index (MPI1 and MPI2) [25], along with the modified distribution parameters of methyl phenanthrenes (MPDF-F1/F2) [26]. This is attributed to the rearrangement of methyl functional groups, resulting from variations in thermal stability among the four isomers of methylphenanthrene. As maturity increases, α-type 1-methylphenanthrene (1-MP) and 9-methylphenanthrene (9-MP) isomers undergo transformation into β-type 2-methylphenanthrene (2-MP) and 3-methylphenanthrene (3-MP), which exhibit higher thermal stability.
The composition and distribution characteristics of methylphenanthrene in source rocks are illustrated in Figure 9. In the Hongshuizhuang Formation (well CQ1), the relative content of 9-methylphenanthrene among the methylphenanthrene isomers was the highest, with a minimum value above 30%. Following this, 1-methyl phenanthrene exhibited a relative content exceeding 20% at its lowest value. The relative contents of 2-methylphenanthrene and 3-methylphenanthrene showed minimal differences, both remaining above 10%. In contrast, the relative abundance percentages of methylphenanthrene isomers in the Xiamaling Formation (well CQ2) varied with depth. With increasing depth, there was an increase in the relative content of both 2-methylphenanthrene and 3-methylphenanthrene, while there was a decrease in the relative content of both 1-methylphenanthrene and 9-methylphenanthrene. Therefore, the methylphenanthrene index was used to quantify the thermal evolution maturity and to convert it to the vitrinite reflectance. The methyl phenanthrene index (MPI1 and MPI2) of the Hongshuizhuang Formation is obviously distributed from low to high as the depth increases; the MPI1 was distributed between 0.75 and 1.48, with an average of 0.91, and the MPI2 is distributed between 0.63 and 1.22, with an average of 0.78. In contrast, the MPI1 and MPI2 of the Xiamaling Formation showed the characteristics of “high–low–high”; according to the depth, the MPI1 was distributed between 1.81 and 5.15, with an average of 2.54, and the MPI2 was distributed between 1.14 and 2.80, with an average of 1.71. The specific data are shown in Table 1.
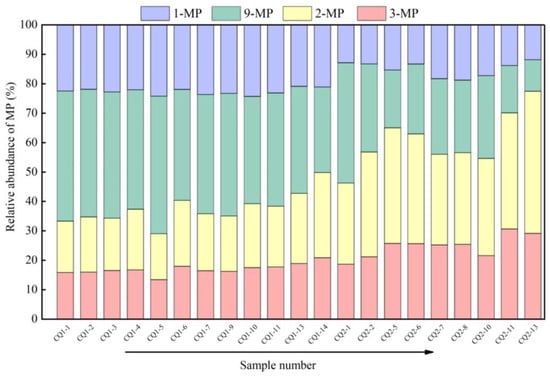
Figure 9.
Distribution characteristics of methyl phenanthrene composition of Mesoproterozoic source rocks.

Table 1.
Biomarker compounds characterize maturity parameters of source rocks.
Furthermore, alkyl naphthalene series compounds can serve as indicators of the thermal evolution experienced by source rocks during deposition. The thermal stability of β-methyl-substituted isomers in the naphthalene series is higher, and their relative abundance increases with increasing maturity [25]. The methyl naphthalene index (2-MN/1-MN) and dimethyl naphthalene index ((2.6 + 2.7-DMN)/1.5-DMN) are commonly used parameters to assess alkyl naphthalene maturity. Upon calculation, the methyl naphthalene index for the Hongshuizhuang Formation ranged from 0.50 to 3.82, with an average value of 1.03, whereas for the Xiamaling Formation it fell between 1.73 and 4.01, with an average value of 2.59. Based on these data, both phenanthrene and naphthalene indices indicated a higher level of maturity in the Xiamaling Formation compared to that in the Hongshuizhuang Formation; however, this observation did not align with actual geological evolution. Trifluorene series compounds can serve as potential indicators for evolution, and the methyldibenzothiophene ratio (MDR) (4-MDBT/1:MDBT) is commonly employed to assess maturity levels. Upon calculation, the MDR values of the Xiamaling samples ranged from 2.26 to 18.47, with an average of 8.57, whereas the MDR values of the Hongshuizhuang samples ranged from 2.58 to 18.89, with an average of 9.64. Consequently, it can be inferred that the maturity level of the Hongshuizhuang Formation surpassed that of the Xiamaling Formation, in terms of MDR distribution patterns. Regarding thermal maturity parameters for naphthalene, phenanthrene, and trifluorene series compounds in Mesoproterozoic source rocks, only MDR values were applicable.
4.3. Composition of Polar Molecular Compounds
Thousands of mass spectrum peaks appear in the FT–ICR MS; according to the ionization characteristics, the APPI positive ion mode is more suitable for the detection of hydrocarbon and non-hydrocarbon heteroatom compounds, with a total of more than 9900 species detected [27,28]. Figure 10 shows the total ion mass spectrum of typical Mesoproterozoic organic matter that could be revealed in APPI positive ion mode combined with FT–ICR MS. The initial peak of m/z (the mass charge ratio) almost started from m/z = 150, and the compound signal tended to be weak after approaching m/z = 800. The m/z of the identified hydrocarbon and non-hydrocarbon heteroatom compounds were mainly distributed between 200 and 600. The type showed a single peak characteristic generally, and the intensity of the overall compound peak was higher.
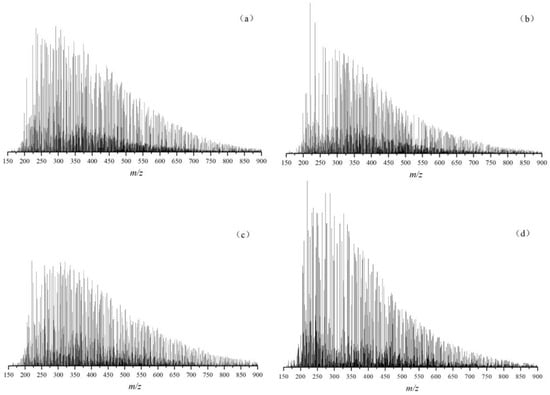
Figure 10.
APPI FT–ICR MS of typical Mesoproterozoic samples ((a) CQ1–1, Hongshuizhuang Formation; (b) CQ1–9, Hongshuizhuang Formation; (c) CQ2–1, Xiamaling Formation; and (d) CQ2–7, Xiamaling Formation).
In the data analysis process, the number of atoms of O, N, and S in each organic component is represented by x, y, and z, in the form of OxNySz, to determine the composition of molecular elements and to classify the compounds. The relative abundance is represented by the percentage of TMIA, so as to visually present the relative content relationships between different components. According to the results of polar molecular compound analysis, the polar compounds detected in this study were divided into seven major compounds, namely CH, Ox, Ny, Sz, NySz, OxSz, and OxNy. As shown in Figure 11, all polar molecular compounds were dominated by CH compounds, and the proportion of CH compounds in the Xiamaling Formation was higher than that in the Hongshuizhuang Formation. The CH compounds in the Xiamaling Formation ranged from 69.8% to 79.82%, with an average of 73.60%. The CH compounds in the Hongshuizhuang Formation ranged from 61.77% to 69.63%, with an average of 65.97%. Through analysis, it was found that the research value was opposite to the TOC value, which showed that the correlation between the change in CH compound content in organic matter and the change in organic carbon content was poor.
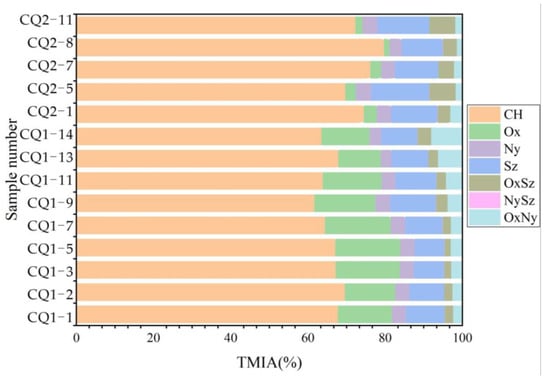
Figure 11.
Composition of polar molecular compounds in Mesoproterozoic organic matter.
In order to comprehensively depict the molecular alterations of organic matter compounds in marine Mesoproterozoic source rocks, the samples were arranged in ascending order of maturity, as illustrated in Figure 12. For Ox molecular compounds belonging to type I and type II1 kerogens, oxygen (O) primarily existed in the form of ester groups (-COO-) and carboxyl groups (-COOH) within the side chains of functional groups, thus constituting a crucial component of organic molecular compounds. The relative content of O1 polar molecular compounds ranged from 0.68% to 11.61%, while that of O2 polar molecular compounds fell between 0.76% and 5.81%. The total mean integral area (TMIA) for O1 compounds surpassed that for O2 compounds. Overall, the relative content of O1 compounds exhibited an initial increase, followed by a subsequent decrease with increasing maturity, whereas the relative content of O2 compounds demonstrated an upward trend with increasing maturity (Figure 12a).
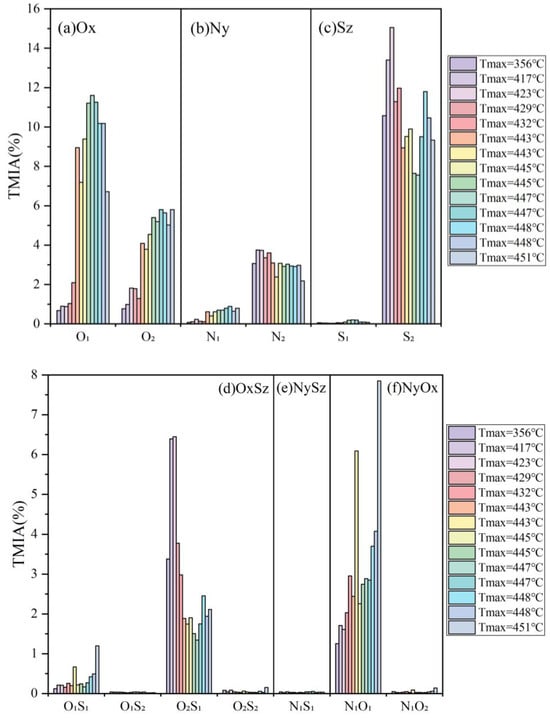
Figure 12.
Distribution of polar molecular compounds in Mesoproterozoic organic matter.
The relative content of Ny molecular compounds was relatively small. The Ny molecular compounds in Xiamaling and Hongshuizhuang samples were between 2.71% and 3.96%, and the TMIA percentage between the two formations was not much different. The low content of alkaline nitrides was usually related to the reducing environment, where they may be reduced to forms such as nitrogen oxides (NOx). Specifically, the N1 polar molecular compounds content was between 0.07% and 0.89%, with an average of 0.49%, while the N2 polar molecular compounds content was between 2.19% and 3.75%, and the TMIA of N2 compounds was higher than that of N1 compounds. Although the content of the N1 compound was low, it still showed an obvious trend of increasing with the increase in maturity, but the content of the N2 compounds was the opposite, showing a trend of decreasing with the increase in maturity (Figure 12b).
The relative abundance of Sz molecular compounds was higher, second only to CH compounds, which was closely associated with sulphuration and reduction reactions in sedimentary environments. The distribution range of Sz molecular compounds in the Xiamaling samples varied from 10.63% to 15.09%, with an average content of 12.50%. The Sz molecular compounds of the Hongshuizhuang samples was distributed between 7.75% and 11.89%, with an average of 9.52%. Therefore, it can be concluded that the TMIA of Sz molecular compounds in the Xiamaling Formation was more abundant than that in the Hongshuizhuang Formation. In terms of specific compound categories, S1 compounds accounted for a very small proportion. The TMIA range of S1 compounds in the two formations was between 0.03% and 0.20%, while the proportion of S2 compounds was relatively high, and the TMIA range of S2 compounds in the two formations was between 7.55% and 15.05%. There was no trend between the sulfur-containing compounds and maturity (Figure 12c).
The OxSz, NySz, and NyOx polar compounds content were very low in the organic matter, and the TMIA of each compound type did not exceed 8.00% (Figure 12d–f). Among them, O2S1 compounds were the main part of OxSz, followed by O1S1 compounds, and O1S2 compounds were the lowest. The TMIA of O2S1 polar molecular compounds was distributed between 1.34% and 6.45%, with an average of 2.83%. The TMIA distribution range of O2S1 compounds in the Hongshuizhuang samples was 1.34–2.46%, with an average of 1.85%. The TMIA distribution range of O2S1 compounds in the Xiamaling samples was 2.98–6.45%, with an average of 4.60%. Therefore, the O2S1 molecular compounds of the Xiamaling Formation were more abundant than those of the Hongshuizhuang Formation, and the abundance of O2S1 compounds decreased firstly and then increased with the increasing maturity. The abundance of O1S1 compounds increased with the increase in maturity, and the abundance of O1S2 and O2S2 compounds was too low, so the trend with maturity was not obvious.
The polar molecular compounds in NyOx compounds, namely N1O1, may consist of N1 compounds grafted with hydroxyl groups, while the N1O2 polar molecular compounds may involve N1 compounds grafted with carboxyl groups [29]. The abundance of N1O1 polar molecular compounds was relatively high, up to 7.85%, while the abundance of N1O2 polar molecular compounds did not exceed 0.02%, so N1O1 polar molecular compounds were relatively developed. The TMIA distribution range of N1O1 compounds in the Hongshuizhuang samples was between 2.26% and 7.85%, with an average of 3.88%. The TMIA distribution range of N1O1 compounds in the Xiamaling samples was between 1.25% and 2.95%, with an average of 1.91%. Therefore, the TMIA of N1O1 compounds in the Xiamaling Formation was less than that in the Hongshuizhuang Formation. In general, the N1O1 compounds showed an increasing trend with the maturity. This phenomenon may be attributed to the accumulation of nitrogen-containing compounds with long carbon chains and the low unsaturation in organic matter as it matures, without progressing to an unstable stage, resulting in the enrichment of these unsaturated nitrogen oxides in the source rocks.
4.4. Structural Evolution of Polar Molecular Compounds
Based on the determination of the relative content of different types of polar molecular compounds, CH, N1, O1, and S1 compounds were selected for further analysis to investigate the dynamic evolution of organic molecular structures. The APPI positive ion mode was employed for detecting these aforementioned compounds [30]. The double bond equivalent (DBE) distribution of CH compounds is shown, according to the carbon number and DBE intersection diagram (Figure 13). By combining the types and contents of different mature samples, it was found that the TMIA of CH compounds gradually decreased with the increase in maturity, and the range of DBE and carbon number gradually increased. As shown in Figure 13e–h, it can be clearly seen that, at the immature–low mature stage, the DBE and carbon number range of CH compounds increased with maturity in the Xiamaling organic matter, which indicates that the CH compounds had more rings, and a higher aromaticity and molecular weight. However, the expansion of the DBE and carbon number range was different from the molecular polycondensation reaction of the compounds at high–over mature stage. The increase in aromaticity and molecular weight was more derived from the release of CH compounds from the Xiamaling organic matter itself, or from the removal of functional groups containing N, S, and O. The DBE of CH compounds in the Hongshuizhuang samples had a small fluctuation with the carbon number range (Figure 13a–d), which was related to the control effect of maturity with a small range of variations.
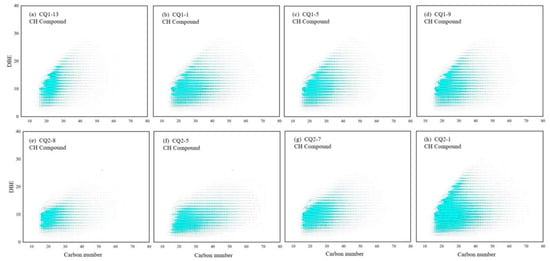
Figure 13.
Carbon number and DBE distribution of CH compounds in Mesoproterozoic source rocks. (a) Tmax = 443 °C, (b) Tmax = 445 °C, (c) Tmax = 447 °C, (d) Tmax = 448 °C, (e) Tmax = 356 °C, (f) Tmax = 417 °C, (g) Tmax = 429 °C, and (h) Tmax = 432 °C.
The content of N1 compounds in organic matter was significantly low (Figure 14). In CQ1–13, the carbon number distribution of N1 compounds mainly ranged from 19 to 30, while the DBE primarily fell between 12 and 18. Conversely, in the Xiamaling Formation samples, the carbon number distribution of N1 compounds in CQ2–8 mainly spanned from 14 to 35, with the DBE predominantly ranging from 9 to16. It can be observed that the molecular composition of N1 compounds underwent changes as the maturity increased. Except for the CQ2–8 sample, these changes were primarily associated with variations in carbon numbers, rather than DBE values, for similar molecular structures. Therefore, it can be concluded that alkylation (different methylene groups) played a more significant role than aromatization (i.e., DBE changes) in separating these N1 compounds into distinct molecular components. For instance, among the compounds exhibiting relatively high content within the sample (i.e., represented by larger dot areas on the carbon number–DBE diagram), those with a DBE value of 9 were often identified as carbazole (chemical formula C12H9N), those with a DBE value of 12 were frequently recognized as benzocarbazole (chemical formula C16H11N), and those with a DBE value of 15 were commonly classified as dibenzocarbazole (chemical formula C20H13N) [30,31,32]. These smaller core structures tended to be enriched in low-maturity oil; thus, these crucial N1 compounds possessed identical aromatic core structures across different groups but exhibited varying lengths and quantities of alkyl side chains. However, based on analysis using carbon numbers depicted on the diagram, it is evident that short-chain alkyl side chains constituted the primary types present (Figure 14). It was found that, with the increase in maturity, the nitrogen-containing compounds became easier to dealkylate, and the chain length in the alkyl side chain was shortened. Compounds with a DBE value less than nine were rare, which may have been converted to N1Ox compounds by oxygenation at low temperatures and reducing conditions. These results will obviously reveal the transformation of N1 compounds in Mesoproterozoic organic matter.
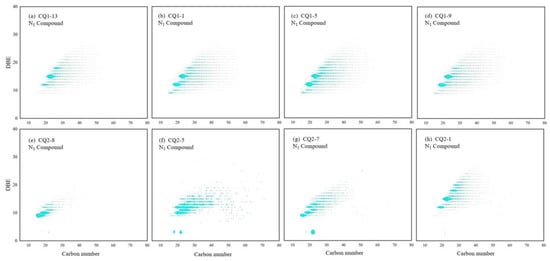
Figure 14.
Carbon number–DBE distribution characteristics of N1 compounds in Mesoproterozoic source rocks. (a) Tmax = 443 °C, (b) Tmax = 445 °C, (c) Tmax = 447 °C, (d) Tmax = 448 °C, (e) Tmax = 356 °C, (f) Tmax = 417 °C, (g) Tmax = 429 °C, and (h) Tmax = 432 °C.
O1 compounds are often oxidizable in organic matter [33], and the TMIA of O1 compounds is rare, which confirms that the Mesoproterozoic sedimentary environment contains trace free oxygen and is rich in reducing substances, such as organic matter and hydrocarbons. In the specific analysis using FT–ICR MS (Figure 15), it was found that O1 compounds with DBE belonging to 1~4 may be acyclic or non-aromatic cyclic compounds, which contain at least one carboxyl or carbonyl (C = O) structure [34]. Combined with the type of kerogen (type I or type II1), O1 compounds with a DBE value greater than four are likely to be aromatic substances, such as benzofuran, rather than non-aromatic polycyclic structures, such as hopanoic acid or steroidal acid [35,36]. Furthermore, the dot area with abnormal abundance may be the ringed benzofuran, and the reason why its abundance and structure remain unchanged may be that benzofuran is difficult to open. Based on the types and contents of O1 compounds in different samples, there was no linear change between O1 compounds and maturity differences, which may indicate that O1 compounds were less affected by maturity or not only controlled by maturity. O1 and O2 compounds can not only be used as parameters to detect the potential biodegradation level of organic matter [37], but also can indicate the redox conditions of the strata where the source rocks are located. The TMIA abundance of O1 and O2 compounds was low; this is consistent with the reducing sedimentary environment result indicated by the trifluorene series compounds.
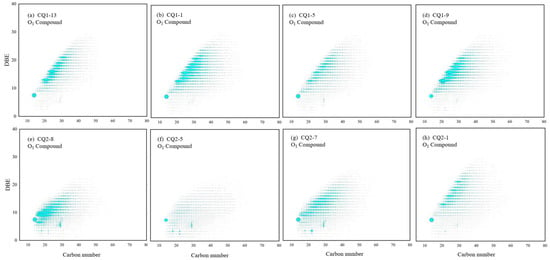
Figure 15.
Carbon number–DBE distribution characteristics of O1 compounds in Mesoproterozoic source rocks. (a) Tmax = 443 °C, (b) Tmax = 445 °C, (c) Tmax = 447 °C, (d) Tmax = 448 °C, (e) Tmax = 356 °C, (f) Tmax = 417 °C, (g) Tmax = 429 °C, and (h) Tmax = 432 °C.
Since organic sulfur compounds may retain the original site information of carbon skeleton and related functions, they are considered to be excellent potential molecular indicators for paleoecology and paleoenvironmental assessment [38]. However, S1 compounds have relatively low TMIA in Mesoproterozoic organic matter, which may be related to the weak dipole moment of the sulfur–carbon bond of S1 compounds [39]. The DBE dot areas in the diagram (Figure 16) of most samples were 9, 10, 12, and 15, indicating that the S1 compounds in the Mesoproterozoic source rocks are mainly thiophenes [40,41]. In this study, it was believed that the S1 compound with a DBE value of 9 was dibenzothiophene and had an alkyl side chain of C2~C10. The S1 compound with a DBE value of 10 was dibenzothiophene with a cycloalkane ring, the S1 compound with a DBE value of 12 was naphthalene benzothiophene, and the S1 compound with a DBE value of 15 was mainly benzene ring benzothiophene, which was consistent with the detection results of the aromatic hydrocarbon biomarkers. It was found that the carbon number and DBE range of S1 compounds gradually increased with the maturity (Figure 16). In the S1 compounds with high DBE, their abundance almost increased with the increasing of maturity, whereas, in the S1 compounds with low DBE, their abundance did not show an obvious synergistic change in the relationship with the maturity, which may be related to the presence of inorganic sulfur input in the S1 compounds of marine source rocks [42].
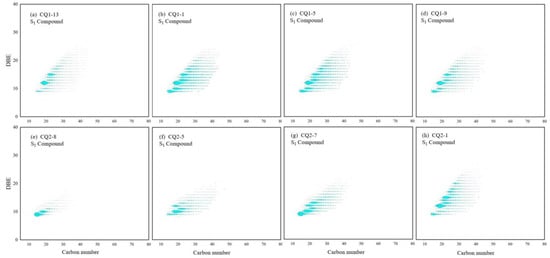
Figure 16.
Carbon number–DBE distribution characteristics of S1 compounds in Mesoproterozoic source rocks. (a) Tmax = 443 °C, (b) Tmax = 445 °C, (c) Tmax = 447 °C, (d) Tmax = 448 °C, (e) Tmax = 356 °C, (f) Tmax = 417 °C, (g) Tmax = 429 °C, (h) Tmax = 432 °C.
5. Implications
Aromatic hydrocarbons and saturated hydrocarbons, as crucial components of petroleum, find extensive applications in the field of oil and gas geochemistry, due to their abundant geological information [43,44,45]. Owing to their relatively intact preservation in the thermal maturity stage and distinct response patterns across different maturity stages, they serve as indicators for source rock and crude oil maturity [46,47,48]. However, classical biomarkers often encounter challenges in assessing maturity when vitrinite reflectance (Ro) > 1.3%. On the other hand, non-biological markers offer a broader range of maturity parameters but necessitate new calibrations specific to different petroleum systems. With a maturity increase in source rocks, the composition of organic compounds often changes; the functional groups and side chains around the aromatic ring in the molecular structure are broken and the methyl is rearranged, the structure of the compound is isomerized or aromatized, the number of aromatic structures increases, and the number of aliphatic structures decreases, which has a good response to the thermal evolution of organic matter and can be used as an effective index to evaluate maturity [49,50]. Therefore, according to the thermal evolution reactions such as side chain cleavage, aromatization, and condensation, the DBE and carbon number are divided into six regions, namely region 1 (DBE: 10~20; carbon number: 20~30), region 2 (DBE: 20~30; carbon number: 30~40), region 3 (DBE: 30~40; carbon number: 40~50), region 4 (DBE: 10~20; carbon number: 30~40), region 5 (DBE: 20~30; carbon number: 40~50), region 6 (DBE: 30~40; carbon number: 50~60). Theoretically, the degree of polymerization and aromatization of compounds in regions 1~3 are higher than those in regions 4~6. Thus, the maturity evaluation parameter (MAT) could be calculated by the molecular compounds data from FT–ICR MS [51,52].
In order to expand the response range of MAT parameters, lacustrine Shahezi and marine Arthur Creek samples with different maturities were added for comparison with the Xiamaling and Hongshuizhuang Formations in this research. It can be seen that, from the immature to high–over mature stages, the Tmax and MAT of CH, O1, N1, and S1 compounds were positively correlated, but the correlation coefficient and dispersion degree of the four formations were different, which may be related to the different precursors of organic matter (Figure 17). Compared with CH, N1, and O1 compounds, the MAT of the S1 compounds showed a relatively weak linear relationship for Mesoproterozoic source rocks. According to the analysis of the composition and abundance of the S1 compounds, there was a difference in the distribution of organic sulfur between different maturities, which may have been influenced by the input of inorganic sulfur. Considering the stable reductive sulfidation environment in the Mesoproterozoic, inorganic sulfur may have entered into sulfur-containing compounds via bacteria and algae in the anti-carboxylic acid cycle or via sulfate and pyrite in solid media. This indicates that the DBE and carbon numbers of organic compounds could reveal and quantify the thermal evolution characteristics of organic matter from different provenances and sedimentary environments.
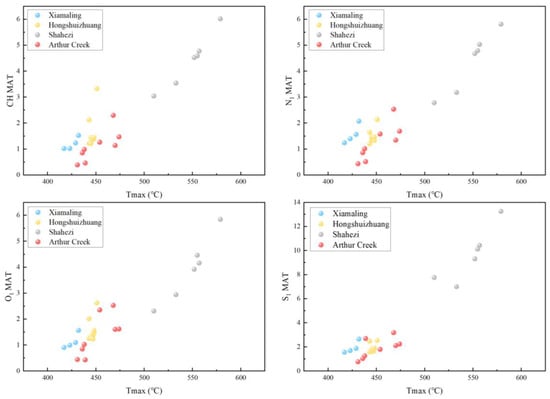
Figure 17.
Tmax vs. MAT of CH, O1, N1, and S1 compounds.
6. Conclusions
Based on organic petrology and pyrolysis analysis, the Hongshuizhuang and Xiamaling source rocks exhibit high organic matter abundance with type I-II1 kerogen. The Hongshuizhuang Formation is characterized by low maturity, while the Xiamaling Formation is in an immature–low mature stage. Hydrocarbons produced in the Hongshuizhuang Formation display stronger aromaticity and shorter alkyl side chains of organic functional groups, whereas hydrocarbons from the Xiamaling Formation have a higher average molecular weight and predominantly consist of long-chain structures.
Most n-alkane peaks observed in Mesoproterozoic samples are front peak types, indicating that bacteria and algae are the primary sources of organic matter. The phenanthrene series mainly comprises methylphenanthrenes. In terms of trifluorene series distribution, sulfur fluorene > fluorene > oxygen fluorene is observed in the Hongshuizhuang Formation, while sulfur fluorene ≈ fluorene > oxygen fluorene characterizes the Xiamaling Formation, suggesting a strong sulphuration reaction and a reducing sedimentary environment for the former formation. Maturity verification using molecular biomarker parameters reveals that only MDR aligns with Tmax; traditional biomarker parameters are not fully applicable to Mesoproterozoic source rocks.
High-precision FT–ICR MS analysis indicates that CH compounds dominate among CH, Ox, Ny, Sz, NySz, OxSz, and OxNy compounds present in these source rocks, followed by Sz compounds and Ox compounds; Ny compounds show limited development, but long-chain nitrogen oxides (NOx) are enriched. Different compound types exhibit varying abundances influenced by maturity: the TMIA changes for CH, O2, N1, O1S1, and N1O1 compounds as the maturity increases. The change in TMIA for CH compounds shows poor correlation with the organic carbon content. With increasing maturity, the DBE and carbon number range of CH compounds gradually increase.
Author Contributions
Conceptualization, S.H.; investigation, C.X., Y.W., M.H., X.M., J.H. and J.Z. (Junhao Zhu); writing—original draft preparation, S.H., Y.Q. and C.X.; writing—review and editing, S.H., Y.Q., J.Z. (Jinchuan Zhang), Y.W., M.H., X.M., J.H. and J.Z. (Junhao Zhu). All authors have read and agreed to the published version of the manuscript.
Funding
This research was funded by the National Natural Science Foundation of China (Grant Nos. 42072168 and 41802156), and the Fundamental Research Funds for the Central Universities (Grant No. 2023ZKPYDC07). The editors and anonymous reviewers are gratefully acknowledged.
Data Availability Statement
The data presented in this study are available on request from the corresponding author.
Conflicts of Interest
The authors declare no conflicts of interest.
References
- Li, G.; Bai, G.; Gao, P.; Ma, S.; Chen, J.; Qiu, H. Geological characteristics and distribution of global primary hydrocarbon accumulations of Precambrian-Loewr Cambrian. Exp. Pet. Geol. 2021, 43, 958–966. [Google Scholar]
- Al-Riyamy, Q.; Kelly, S.; Al-Rawahi, A.; Matsuura, T.; Davis, D.; Henning, R.; Terres, R. Precambrian field Oman from Greenfield to EOR. In Proceedings of the SPE Middle East Oil and Gas Show and Conference, Manama, Bahrain, 12–15 March 2005; p. 93364. [Google Scholar]
- Kuznetsov, V.G. Riphean hydrocarbon reservoirs of the Yurubchen-Tokhom Zone, Lena-Tunguska Province, NE Russia. J. Pet. Geol. 1997, 20, 459–474. [Google Scholar] [CrossRef]
- Zhao, W.; Wang, X.; Hu, S.; Zhang, S.; Wang, H.; Guan, S.; Ye, Y.; Ren, R.; Wang, T. Hydrocarbon generation characteristics and exploration prospects of Proterozoic source rocks in China. Sci. Sin. Terrae 2019, 62, 909–934. [Google Scholar] [CrossRef]
- Zhang, S.; Wang, H.; Wang, X.; Ye, Y. Mesoproterozoic marine biological carbon pump: Source, degradation, and enrichment of organic matter. Scientia 2022, 67, 1624–1643. [Google Scholar] [CrossRef]
- Zhang, F.; Wang, H.; Zhang, S.; Deng, S.; Ye, Y.; Deng, Y.; Wang, X.; Lu, D.; Lu, Y.; Lu, Y. Evolution of Proterozoic eukaryotic algae and environmental constraints. Acta Geol. Sin. 2021, 95, 1334–1355. [Google Scholar]
- Luo, Q.; Zhong, N.; Zhu, L.; Wang, Y.; Qin, J.; Li, L.; Zhang, Y.; Ma, Y. Productivity in the Mesoproterozoic Hongshuizhuang Formation, northern North China. Scientia 2013, 58, 1036–1047. [Google Scholar]
- Wang, T. A novel tricyclic terpane biomarker series in the upper Proterozoic bituminous sandstone, eastern Yanshan Region. Sci. China Chem. 1991, 34, 479–489. [Google Scholar]
- Wang, T.; Han, K. On Meso-Neoproterozoic primary petroleum resources. Acta Pet. Sin. 2011, 32, 1–7. [Google Scholar]
- Zhang, S.; Wang, X.; Hammarlund, E.U.; Wang, H.; Costa, M.; Bjerrum, H.J.; Connelly, J.N.; Zhang, B.; Bian, L.; Canfield, D.E. Orbital forcing of climate 1.4 billion years ago. Proc. Natl. Acad. Sci. USA 2015, 112, 1406–1413. [Google Scholar] [CrossRef]
- Su, W.; Li, H.; Huff, W.D.; Ettensohn, F.R.; Zhang, S.; Zhou, H.; Wan, Y.S. SHRIMP U-Pb dating for a K-bentonite bed in the Tieling Formation. North China Chin. Sci. Bull. 2010, 55, 3312–3323. [Google Scholar] [CrossRef]
- Li, H.; Zhu, S.; Xiang, Z.; Su, W.; Lu, S.; Zhou, H.; Geng, J.; Li, S.; Yang, F. Zircon U-Pb dating on tuffbed from gaoyuzhuang formation in Yanqing Beijing further constraints on the new subdivisong of the mesoproterozzic stratigraphy in the northern north in china craton. Acta Pet. Sin. 2010, 26, 2131–2140. [Google Scholar]
- Tao, J.; Zhang, J.; Liu, Y.; Stüeken, E.E.; Dong, Z.; Shi, M.; Li, P.; Zhang, Q.; Poulton, S.W. A stable and moderate nitrate pool in largely anoxic Mesoproterozoic oceans and implications for eukaryote evolution. Precambrian Res. 2022, 381, 106868. [Google Scholar] [CrossRef]
- Zhang, S.; Liang, D.; Zhang, D. Evaluation criteria for paleozoic effective hydrocarbon source rocks. Pet. Explor. Dev. 2002, 29, 8–12. [Google Scholar]
- Liang, D.; Guo, T.; Chen, J.; Bian, L.; Zhao, Z. Some progresses on studies of hydrocarbon generation and accumulation in marine sedimentary regions, southern China (part 1): Distribution of four suits of regional marine source rocks. Mar. Pet. Geol. 2008, 13, 1–16. [Google Scholar]
- Horsfield, B. Practical criteria for classifying kerogens: Some observations from pyrolysis-gas chromatography. Geochim. Cosmochim. Acta 1989, 53, 891–901. [Google Scholar] [CrossRef]
- Peters, K.E.; Walters, C.C.; Moldowan, J.M. The Biomarker Guide, Volume 1: Biomarkers and Isotopes in the Environment and Human History; Cambridge University Press: Cambridge, UK, 2005; pp. 1–2. [Google Scholar]
- Fu, J.; Sheng, G. Genesis and biomarker composition characteristics of continental crude oil in China. Acta Sedimentol. Sin. 1991, 9, 1–8. [Google Scholar]
- Wang, H.; Liu, Y.; Wang, Z. Molecular fossils as indicators for paleoenvironment and paleo-climate from red clastic rocks of middle Jurassic-early cretaceous in jianmenguan, Sichuan basin of Chain. Earth Sci. 2001, 26, 229–234. [Google Scholar]
- Mottram, H.R.; Crossman, Z.M.; Evershed, R.P. Regiospecific characterisation of the triacylglycerols in animal fats using high performance liquid chromatography-atmospheric pressure chemical ionisation mass spectrometry. Analyst 2001, 126, 1018–1024. [Google Scholar] [CrossRef]
- Ficken, K.J.; Li, B.; Swain, D.L.; Eglinton, G. An n-alkane proxy for the sedimentary input of submerged/floating freshwater aquatic macrophytes. Org. Geochem. 2000, 31, 745–749. [Google Scholar] [CrossRef]
- Ran, Z.; Li, M.; Li, Y.; Shi, Y.; Wang, N.; Yang, Y.; Lu, X.; Xiao, H. Biomarker compositions and geochemical significance of crude oils of Baiyun Sag, Pearl River Mouth Basin. Exp. Pet. Geol. 2022, 44, 1059–1069. [Google Scholar]
- Li, L.; Lin, R. Study on maturity of crude oil distributed in west slope of Dongpu depression using aromatic compounds. Acta Sedimentol. Sin. 2005, 23, 361–366. [Google Scholar]
- Li, S.; He, S. Geochemical characteristics of dibenzothiophene, dibenzofuran and fluorene and their homologues and their environmental indication. Geochimica 2008, 37, 45–50. [Google Scholar]
- Radke, M.; Welte, D.H.; Willsch, H. Geochemical study on a well in the Western Canada Basin: Relation of the aromatic distribution pattern to maturity of organic matter. Geochim. Cosmochim. Acta 1982, 46, 1–10. [Google Scholar] [CrossRef]
- Alexander, R.; Kagi, R.I.; Rowland, S.J.; Sheppard, P.N.; Chirila, T.V. The effects of thermal maturity on distributions of dimethylnaphthalenes and trimethylnaphthalenes in some Ancient sediments and petroleums. Geochim. Cosmochim. Acta 1985, 49, 385–395. [Google Scholar] [CrossRef]
- Smith, D.F.; Podgorski, D.C.; Rodgers, R.P.; Blakney, G.T.; Hendrickson, C.L. 21 tesla FT-ICR mass spectrometer for ultrahigh-resolution analysis of complex organic mixtures. Anal. Chem. 2018, 90, 2041–2047. [Google Scholar] [CrossRef]
- Solihat, N.N.; Acter, T.; Kim, D.; Plante, A.F.; Kim, S. Analyzing solid-phase natural organic matter using laser desorption ionization ultrahigh resolution mass spectrometry. Anal. Chem. 2019, 91, 951–957. [Google Scholar] [CrossRef]
- Jiang, B.; Tian, Y.; Zhai, Z.; Zhan, Z.; Liao, Y.; Zou, Y.; Peng, P. Characterisation of heteroatomic compounds in free and bound bitumen from different source rocks by ESI FT-ICR MS. Org. Geochem. 2021, 151, 104147. [Google Scholar] [CrossRef]
- Shi, Q.; Xu, C.; Zhao, S.; Chung, K.; Zhang, Y.; Gao, W. Characterization of Basic Nitrogen Species in Coker Gas Oils by Positive-Ion Electrospray Ionization Fourier Transform Ion Cyclotron Resonance Mass Spectrometry. Energy Fuel 2009, 24, 563–569. [Google Scholar] [CrossRef]
- Walters, C.C.; Wang, F.; Qian, K.; Wu, C.; Mennito, A.S.; Wei, Z. Petroleum alteration by thermochemical sulfate reduction-A comprehensive molecular study of aromatic hydrocarbons and polar compounds. Geochim. Cosmochim. Acta 2015, 153, 37–71. [Google Scholar] [CrossRef]
- Mahlstedt, N.; Horsfield, B.; Wilkes, H.; Poetz, S. Tracing the impact of fluid retention on bulk petroleum properties using nitrogen-containing compounds. Energy Fuel 2016, 30, 6290–6305. [Google Scholar] [CrossRef]
- Liu, Y.; Huang, H.; Liu, Q.; Xu, X.; Cheng, H. The acid and neutral nitrogen compounds characterized by negative ESI Orbitrap MS in a heavy oil before and after oxidation. Fuel 2020, 277, 118085. [Google Scholar] [CrossRef]
- Huba, A.K.; Huba, K.; Gardinali, P.R. Understanding the atmospheric pressure ionization of petroleum components: The effects of size, structure, and presence of heteroatoms-ScienceDirect. Sci. Total Environ. 2016, 568, 1018–1025. [Google Scholar] [CrossRef] [PubMed]
- Liao, Y.; Shi, Q.; Hsu, C.S.; Pan, Y.; Zhang, Y. Distribution of acids and nitrogen-containing compounds in biodegraded oils of the Liaohe Basin by negative ion ESI FT-ICR MS. Org. Geochem. 2012, 47, 51–65. [Google Scholar] [CrossRef]
- Shi, Q.; Zhao, S.; Xu, Z.; Chung, K.; Zhang, Y.; Xu, C. Distribution of Acids and Neutral Nitrogen Compounds in a Chinese Crude Oil and Its Fractions: Characterized by Negative-Ion Electrospray Ionization Fourier Transform Ion Cyclotron Resonance Mass Spectrometry. Energy Fuel 2010, 24, 4005–4011. [Google Scholar] [CrossRef]
- Martins, L.L.; Pudenzi, M.A.; da Cruz, G.F.; Nascimento, H.D.L.; Eberlin, M.N. Assessing Biodegradation of Brazilian Crude Oils via Characteristic Profiles of O1 and O2 Compound Classes: Petroleomics by Negative-Ion Mode Electrospray Ionization Fourier Transform Ion Cyclotron Resonance Mass Spectrometry. Energy Fuel 2017, 31, 6649–6657. [Google Scholar] [CrossRef]
- Sinninghe Damste, J.S.; De Leeuw, J.W. Analysis, structure and geochemical significance of organically-bound sulphur in the geosphere: State of the art and future research. Org. Geochem. 1990, 16, 1077–1101. [Google Scholar] [CrossRef]
- Adams, J.J. Asphaltene Adsorption, a Literature Review. Energy Fuel 2014, 28, 2831–2856. [Google Scholar] [CrossRef]
- Griffiths, M.T.; Da Campo, R.; O’Connor, P.B.; Barrow, M.P. Throwing light on petroleum: Simulated exposure of crude oil to sunlight and characterization using atmospheric pressure photoionization fourier transform ion cyclotron resonance mass spectrometry. Anal. Chem. 2014, 86, 527–534. [Google Scholar] [CrossRef] [PubMed]
- Ho, T.Y.; Rogers, M.A.; Drushel, H.V.; Koons, C.B. Evolution of Sulfur Compounds in Crude Oils. AAPG Bull. 1974, 58, 2338–2348. [Google Scholar]
- Yue, H.; Horsfield, B.; Schulaz, H.M.; Yang, S.; Vieth-Hillebrand, A.; Poetz, S. Preservation of biotic and palaeoenvironmental signatures in organosulfur compounds of immature fine-grained sedimentary rocks. Int. J. Coal Geol. 2023, 265, 104168. [Google Scholar] [CrossRef]
- Boreham, C.J.; Crick, I.H.; Powell, T.G. Alternative calibration of the Methylphenanthrene Index against vitrinite reflectance: Application to maturity measurements on oils and sediments. Org. Geochem. 1988, 12, 289–294. [Google Scholar] [CrossRef]
- Gentzis, T.; Goodarzi, F.; Snowdon, L.R. Variation of maturity indicators (optical and Rock-Eval) with respect to organic matter type and matrix lithology: An example from Melville Island, Canadian Arctic Archipelago. Mar. Pet. Geol. 1993, 10, 507–513. [Google Scholar] [CrossRef]
- Hatch, J.R.; Daws, T.A.; Lubeck, S.C.M.; Pawlewicz, M.J.; Threlkeld, C.N.; Vuletich, A.K. Organic Geochemical Analyses for 247 Organic-Rich-Rock and 11 Oil Samples from the Middle Pennsylvanian Cherokee and Marmaton Groups, Southeastern Iowa, Missouri, Southeastern Kansas, and Northeastern Oklahoma; U.S. Geological Survey; United States Department of the Interior: Denver, CO, USA, 1984; Volume 10, pp. 84–160.
- Mackenzie, A.S.; Hoffmann, C.F.; Maxwell, J.R. Molecular parameters of maturation in the Toarcian shales, Paris Basin, France—III. Changes in aromatic steroid hydrocarbons. Geochim. Cosmochim. Acta 1981, 45, 1345–1355. [Google Scholar] [CrossRef]
- Seifert, W.K.; Moldowan, J.M. The effect of thermal stress on source-rock quality as measured by hopane stereochemistry. Phys. Chem. Earth 1980, 12, 229–237. [Google Scholar] [CrossRef]
- Veld, H.; Fermont, W.J.J.; Jegers, L.F. Organic petrological characterization of Westphalian coals from the Netherlands: Correlation between Tmax, vitrinite reflectance and hydrogen index. Org. Geochem. 1993, 20, 659–675. [Google Scholar] [CrossRef]
- Schenk, H.J.; Witte, E.G.; Müller, P.J.; Schwochu, K. Infrared estimates of aliphatic kerogen carbon in sedimentary rocks. Org. Geochem. 1986, 10, 1099–1104. [Google Scholar] [CrossRef]
- Poetz, S.; Horsfield, B.; Wilkes, H. Maturity-Driven Generation and Transformation of Acidic Compounds in the Organic-Rich Posidonia Shale as Revealed by Electrospray Ionization Fourier Transform Ion Cyclotron Resonance Mass Spectrometry. Energy Fuel 2014, 28, 4877–4888. [Google Scholar] [CrossRef]
- Han, S.; Xie, L.; Du, X.; Xiang, C.; Huang, J.; Tang, Z.; Wang, C.; Horsfield, B.; Mahistedt, N. Insights into organic metagenesis using Raman spectroscopy and high resolution mass spectrometry: A case study of the Shahezi formation, deep Songliao basin, China. Int. J. Coal Geol. 2023, 265, 104153. [Google Scholar] [CrossRef]
- Noah, M.; Horsfield, B.; Han, S.; Wang, C. Precise maturity assessment over a broad dynamic range using polycyclic and heterocyclic aromatic compounds. Org. Geochem. 2020, 148, 104099. [Google Scholar] [CrossRef]
Disclaimer/Publisher’s Note: The statements, opinions and data contained in all publications are solely those of the individual author(s) and contributor(s) and not of MDPI and/or the editor(s). MDPI and/or the editor(s) disclaim responsibility for any injury to people or property resulting from any ideas, methods, instructions or products referred to in the content. |
© 2024 by the authors. Licensee MDPI, Basel, Switzerland. This article is an open access article distributed under the terms and conditions of the Creative Commons Attribution (CC BY) license (https://creativecommons.org/licenses/by/4.0/).