Article

Non-Invasive Method-Based Estimation of Battery State-of-Health with Dynamical Response Characteristics of Load Surges

School of Electrical Engineering and Automation, Fuzhou University, Fuzhou 350108, China
*
Author to whom correspondence should be addressed.
Energies 2024, 17(3), 583; https://doi.org/10.3390/en17030583
Submission received: 14 December 2023 / Revised: 17 January 2024 / Accepted: 23 January 2024 / Published: 25 January 2024
(This article belongs to the Section D2: Electrochem: Batteries, Fuel Cells, Capacitors)

Abstract

:
Battery state-of-health (SOH) estimation is an effective approach to evaluate battery reliability and reduce maintenance costs for battery-based backup power supply systems. This paper proposes a novel SOH estimation method for batteries, which only uses the response characteristics of load surges and is, therefore, non-destructive to the estimated battery and its system. The discrete wavelet transform (DWT) method based on multi-resolution analysis (MRA) is used for wavelet energy features extraction, and the fuzzy cerebellar model neural network (FCMNN) is introduced to design the battery SOH estimator. The response voltage signals to load surges are used in the training and detection process of the FCMNN. Compared to conventional methods, the proposed method only exploits characteristics of online response signals to the inrush currents rather than injecting interference signals into the battery. The effectiveness of the proposed method is validated by detailed simulation analysis and experiments.

1. Introduction

As a backup power supply, battery energy storage has been widely used in energy storage systems because of its high power density and variable size, which can improve system reliability, reduce maintenance costs, and allow for longer standby times [1]. When the power grid is in emergency conditions, these batteries are usually used to power critical loads. Lead-acid batteries, pioneers in the field of energy storage, are the most common type of rechargeable batteries globally [2] and represent the only closed-loop operational battery technology. Despite their relatively lower energy density, they exhibit robust performance, simple control, and lower costs, making them more environmentally friendly compared to other battery types. In consequence, they are primarily used in backup power scenarios for their high safety levels. They are extensively employed in various industries, including data centers, finance, communications, and transportation. Although their growth rate may not match that of lithium-ion batteries, they maintain a leading position in terms of capacity (GWh). This is mainly attributed to the emergence of mild and start-stop hybrid power batteries as the primary growth sector for advanced lead-acid batteries [3]. However, the aging and insufficient operation of lead-acid batteries can lead to power outages, shutdowns, and even severe accidents. The health status of the batteries is thus closely related to the security and stability of the system [4].
Battery SOH indicates the health status of the battery, which is usually defined as capacity degradation or internal resistance growth [5,6,7,8]. A lead-acid battery is composed of positive and negative plates, separators, and electrolytes. The chemical reactions between the active material of the positive and negative plates and the sulfuric acid solution are the charging and discharging process of the lead-acid battery. The active material of the positive plate is lead dioxide (PbO2), and the active material of the negative plate is spongy metallic lead. The chemical reaction of the charging process:
( Positive plate )     ( Negative plate )     ( Positive plate )     ( Negative plate ) P b S O 4 + 2 H 2 O + P b S O 4 > P b O 2 + 2 H 2 S O 4 + P b
The chemical reaction of the discharging process:
( Positive plate )     ( Negative plate )     ( Positive plate )     ( Negative plate ) P b O 2 + 2 H 2 S O 4 + P b > P b S O 4 + 2 H 2 O + P b S O 4
The decrease in battery SOH is usually caused by the gradual accumulation of lead sulfate in the active material. This part of lead sulfate will not be converted back to active material during the charging process. It inhibits the contact between the electrolyte and the active material. Over time, the small lead sulfate crystals on the positive and negative electrodes will accumulate into large lead sulfate crystals. Therefore, as the battery SOH decreases, the internal resistance of the battery is gradually increasing.
When the available capacity reduces to a preset threshold known as end-of-life value, the invalid battery needs to be replaced. The capacity estimation of batteries in engineering applications mainly requires periodic discharge tests [9]. The results obtained from this method are accurate but time-consuming (at least five hours to fully discharge). The measurement time can be shortened by increasing the discharge current, but high currents will lead to incomplete discharge, increasing the error of battery capacity estimation and even causing greater damage to the battery.
Relevant studies have been conducted on estimating battery capacity based on the correlation between battery voltage and capacity. Among them, “coup de fouet” is a particular phenomenon for lead-acid batteries that can be utilized for capacity estimation [10]. When a battery is fully charged for a long time, the voltage will drop sharply and rise again within the first few minutes of the battery discharge. The voltage drop observed during the initial moments of discharging a lead-acid battery, following a prolonged charging period is attributed to polarization effects occurring at the electrode surfaces. When the battery ceases charging and transitions to discharge, polarization phenomena alter the chemical state of the electrode surfaces. Upon commencing discharge, this polarization effect briefly causes a voltage reduction. This transient voltage decrease is a result of the battery requiring a certain amount of time to readjust the electrode surface conditions to accommodate the discharge process. The degree of voltage drop is strongly related to the actual capacity of the battery [11]. Therefore, the relationship between them can be used to estimate the capacity of the battery. However, this method depends on the battery’s state of charge (SOC), which needs to be offline for some time. Another method, the so-called dual-pulses discharge load test, was introduced to estimate the available capacity of the battery in [12], which uses two identical discharge pulse currents. Although this method is user-friendly, it is not suitable for online dynamic estimation and requires two additional pulses to the battery. Therefore, it is feasible to distinguish the SOH of batteries by open-circuit voltage slopes.
A fusion method-based extended Kalman filter (EKF) using a neural network was presented to estimate the SOC, and then, the recursive least squares were used to find the slope of the open circuit voltage versus the SOC curve as the input for the fuzzy system [13]. This method has good performance under continuous charging or discharging situations. However, the slope difference is not obvious when the battery pack contains a large number of batteries. The impedance and resistance of batteries increase with the loss of battery life and capacity. Combined with impedance measurement, fuzzy logic data analysis can be used to estimate the SOH of a battery effectively [14,15]. While the SOH of batteries can be reflected by the variation trend of internal impedance, it needs more accurate and expensive equipment due to the low impedance of batteries, i.e., less than one-tenth of a milliohm. The measurement of internal impedance will also interfere with excessive fluctuations of discharge current and radiation noise [16].
In addition, estimation models have been developed using data-fitting methods. For instance, the neural network is used to analyze the relationship between the SOH and the battery voltage, current, temperature and other parameters directly measured from batteries and then estimate the capacity of the battery [17,18,19]. Sui et al. extracted features from battery voltage using the fuzzy entropy method [20]. This method performs well with the change of aging temperature since it can efficiently capture the impact due to aging temperature. With the fractional-order model, a data-driven approach was used to obtain model parameters, and finally, SOC and SOH are estimated by multi-scale double-extended Kalman filtering [21]. However, this method is too model-dependent.
In [22], aiming to estimate the degradation of battery capacity, the mathematical model of the battery was established to judge battery capacity. The ideal mathematical model is more suitable for the ideal operating mode. In [23], based on two working states of the battery, the relationship between voltage and battery aging in the discharge state and the relationship between internal resistance and battery aging in the floating charge state were found. Two results were obtained from the corresponding two empirical models weighted as real SOH of batteries. The extended Kalman filter (EKF) was employed to identify the model parameters and estimate the SOH, which reduces the computation of diagnosis and prognosis [24]. However, it is just suited in the case that the battery discharge rate is constant.
Another method estimates the remaining capacity of the battery by injecting sinusoidal voltage or current signals into the battery and analyzing its response signals [25,26]. However, this method needs an accurate mathematical model; the estimation error will be larger if the model is not accurate. Partial charging curves are commonly used in SOH estimation. In [27], the Kendall coefficients were employed for feature selection. Combined with the linear regression model, the recursive method was used to fit the features with less computation burden. He et al. proposed a new incremental capacity feature from partial constant current charging data [28]. The estimated SOH error is within 5% for the most cycle estimation.
Moreover, the sensitive equipment on the DC bus will be affected by the injected harmonic signal, resulting in inaccurate measurement or incorrect operation. A non-linear observer was established to identify bulk capacitance, which converts the SOH estimation of the battery into parameter estimation based on the model describing the dynamic characteristics of the battery with good robustness [29]. However, the selection of a battery model has a great influence on the effectiveness and adaptability of the estimation algorithm.
In this paper, a novel method is proposed for battery SOH estimation by using the response signals of the battery to inrush currents, where an inrush current is a large but short-time current triggered by the load. From the response voltage signal during the inrush current, the proposed estimation method first utilizes wavelet transform based on MRA to extract energy features. In addition, a battery SOH estimator is built based on FCMNN. For example, the proposed method can be used in the backup energy system where batteries are infrequently charged or discharged. The inrush current would be offered to activate the motor-based high-voltage breaker. Instead of using the costly charging and capacity curves of the batteries, the FCMNN-based estimator directly uses this fast and simple inrush current to estimate the battery SOH, in turn, does not require any external signal injection, and there is no influence on the system, including the battery.
The rest of this paper is organized as follows: Section 2 introduces the theoretical background and the model-based method for battery SOH estimation. Section 3 presents simulation and experimental results. Finally, concluding remarks are provided in Section 4.

2. Materials and Methods

2.1. Dynamical Response Characteristics of Inrush Current

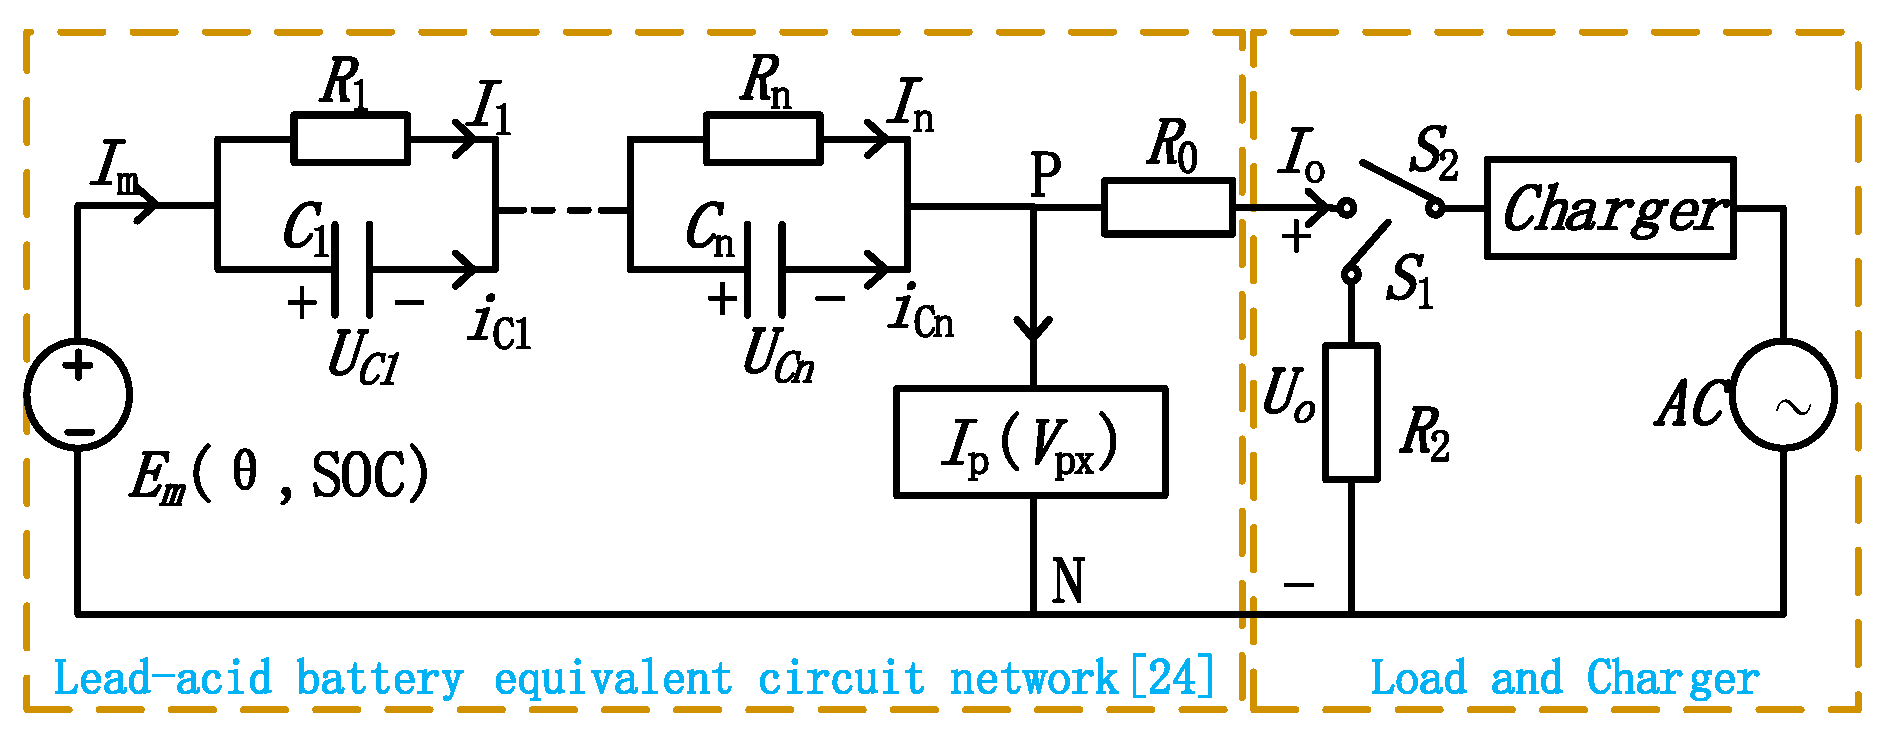
2.1.1. Equivalent Circuit Model of the Battery

Various battery models have been proposed [30,31,32,33], most of which are the equivalent circuit models. The Ceraolo model is widely used to demonstrate electrochemistry, as shown in Figure 1. Here, Em(θ, SOC) is the open circuit voltage of the battery when switch S1 and switch S2 are all off, which is related to the SOC of the battery and the electrolyte temperature θ; Ip is the parasitic branch current, Ip ≈ 0; Uo is the battery terminal voltage; Io is the battery discharge current; R0 is the internal resistance of the battery; Rx Cx (x = 1, 2, …, n) are the parallel blocks modeling the transient behavior of the battery, which represent the activity of the battery associated with the SOH.
The internal impedance is a common performance indicator for the SOH estimation. According to Kirchhoff’s voltage law, the battery terminal voltage will drop suddenly when an inrush current happens. The parameters of the battery, such as the internal resistance, have obvious changes, accompanied by the increase in the number of charging and discharging. Hence, the battery terminal voltage drops at different aging levels are different.

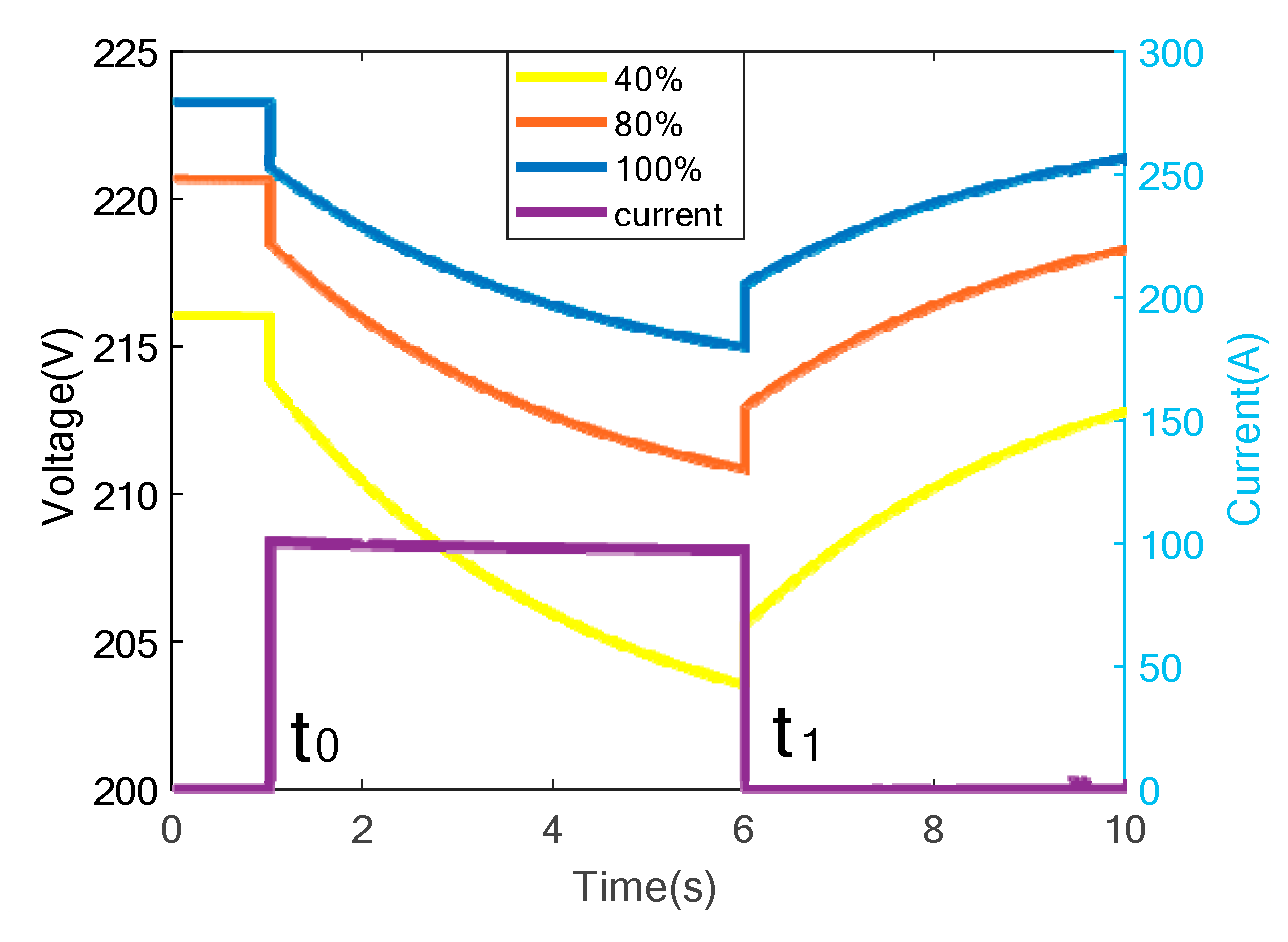
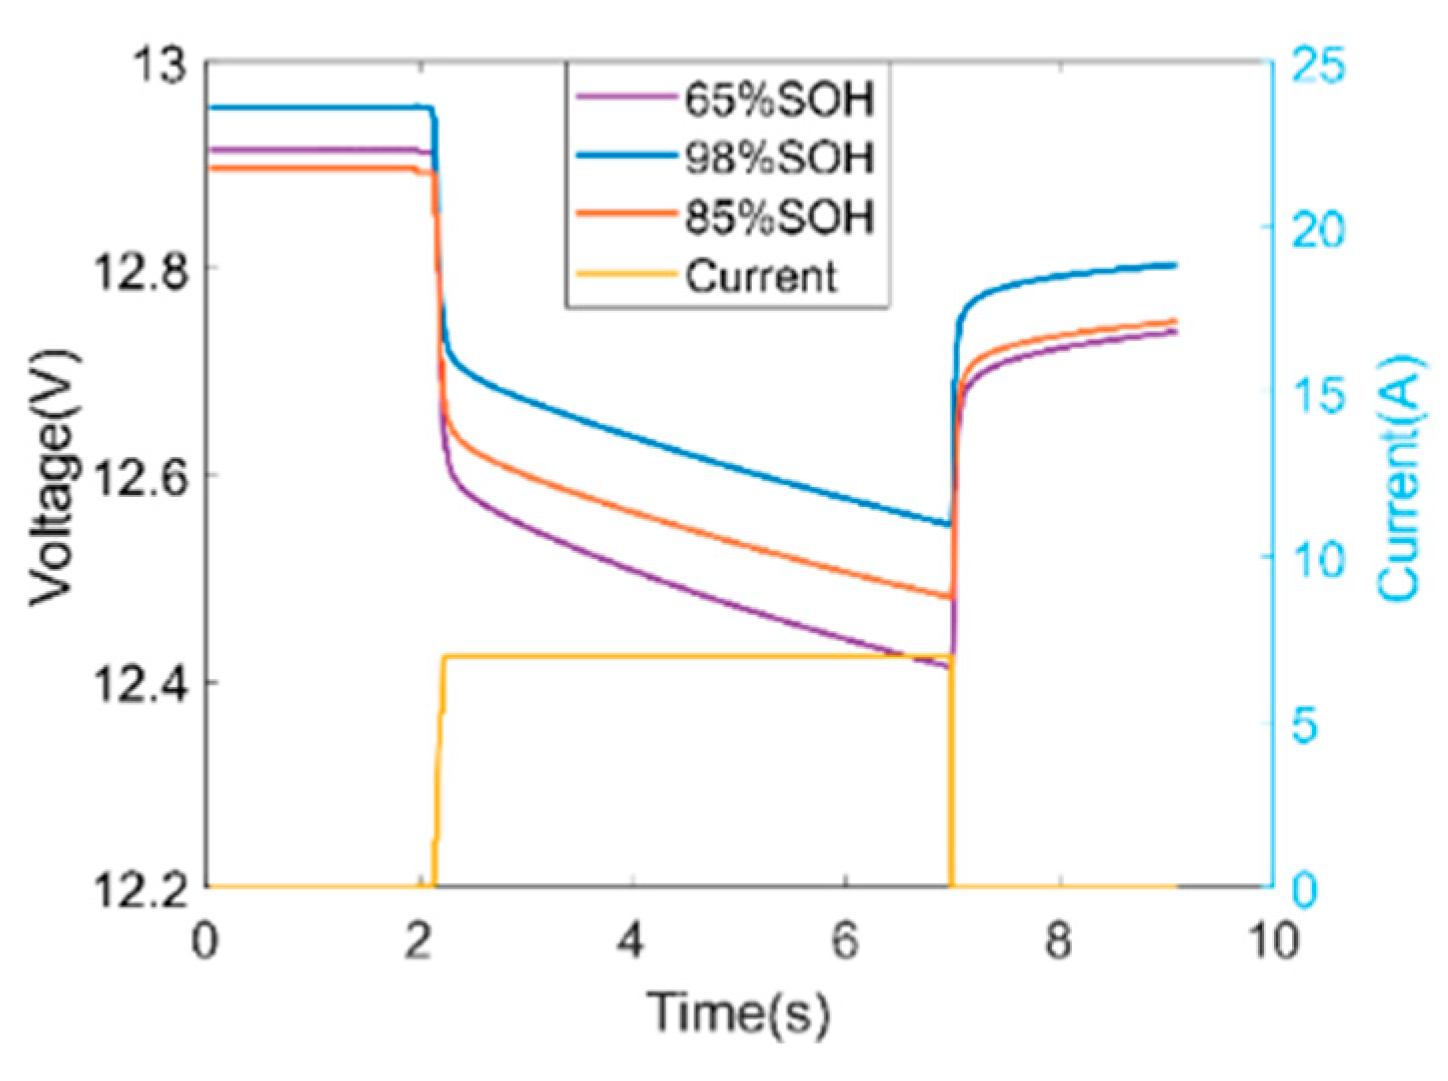
2.1.2. Dynamical Response Characteristics Analysis

The voltage response to pulsed load for lead acid battery at different SOHs and SOCs are shown in Figure 2 and Figure 3 by using the SIMULINK toolbox in MATLAB. As can be seen from Figure 2, affected by inrush current, minimum and maximum voltage drops occur under 100% and 60% SOHs, respectively. It confirms that the battery aging will bring more evidently changes subjected to a pulse load than a new battery.
(1)
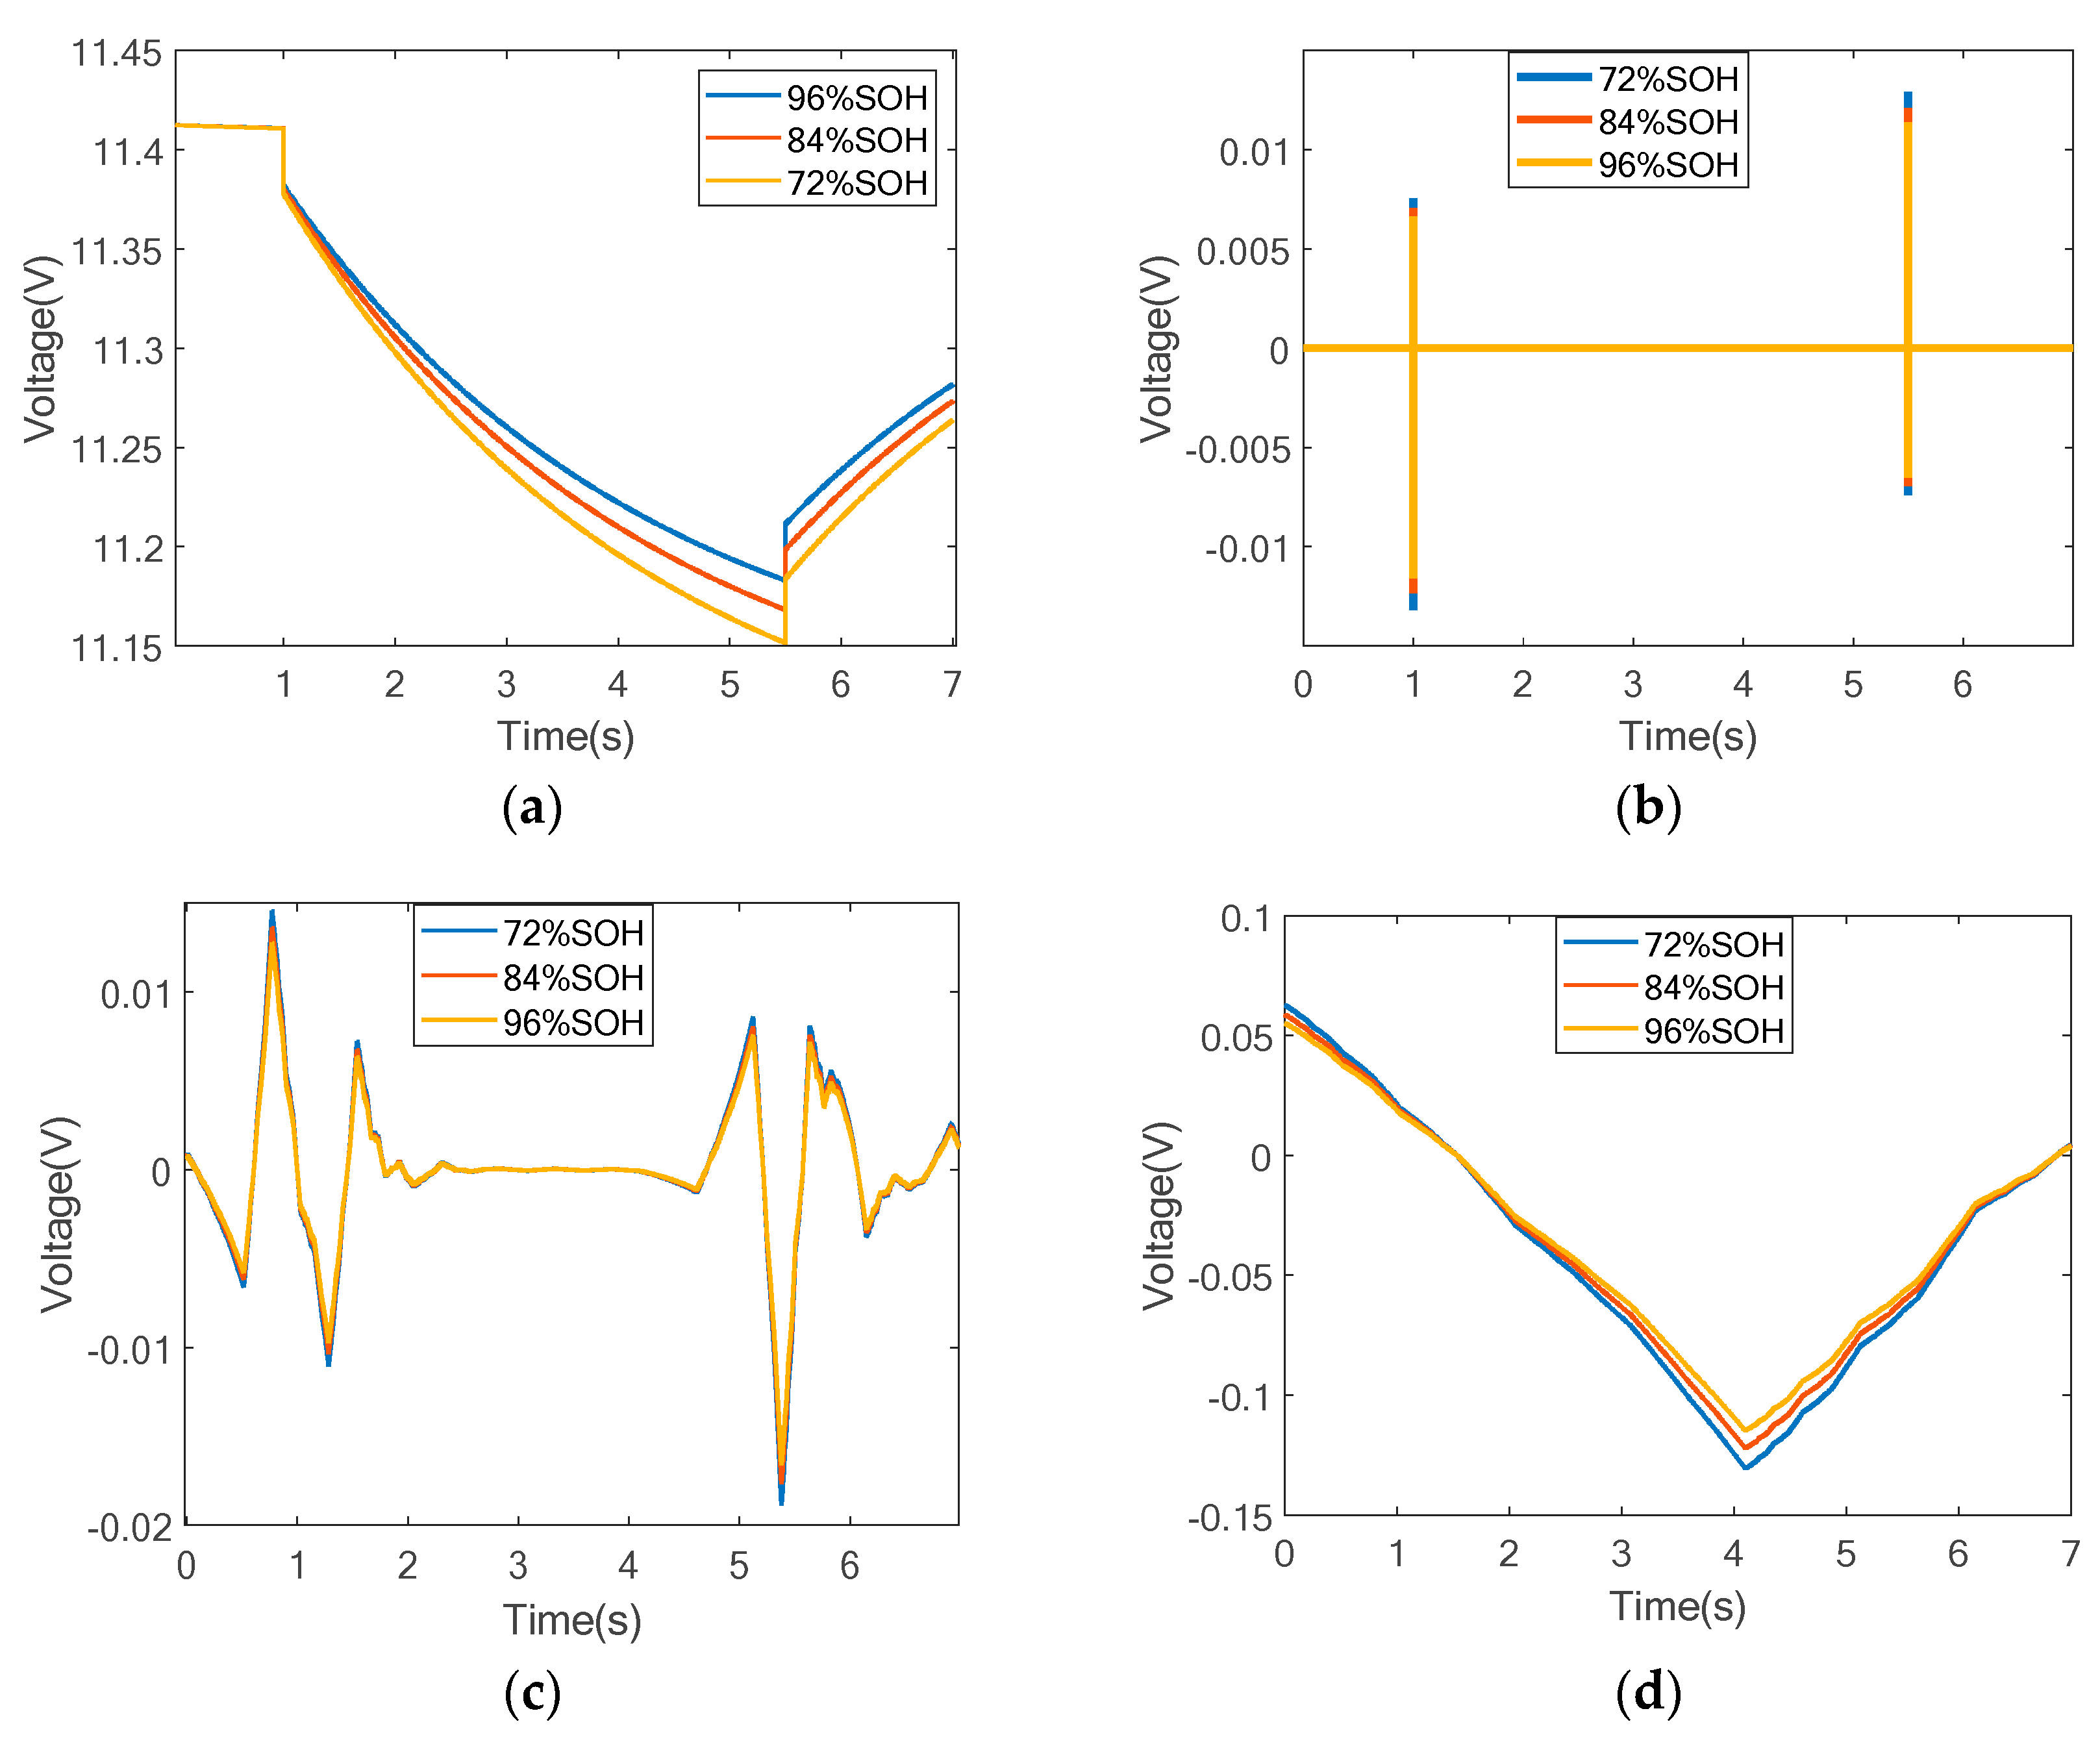
Effect of battery SOH
According to the equivalent circuit in Figure 1 and the simulation results in Figure 2, the relation between the response signal of an inrush current and internal parameters can be deduced as follows:
(a) t < t0: switch S1 is on, and switch S1 is off, then the battery is in the charging situation.
U o ( t 0 ) = E m ( t 0 ) I o ( t 0 ) × x = 1 n R x I o ( t 0 ) × R 0
When the actual direction of the charging current is opposite to the reference direction, that is, Io < 0, then Uo > Em(t0−), ucx < 0 (x = 1, 2, …, n), then the terminal voltage of the battery is greater than its open circuit voltage.
(b) t = t0: switch S1 is on, then the load is connected to the battery. If the load current is larger than the charger can offer, the battery will switch to the discharging state. On the other hand, the voltages of parallel R-C blocks would not change at the moment because the voltage of the capacitor ucx cannot change instantaneously. Therefore, we have the following equation:
U o ( t 0 + ) = E m ( t 0 + ) I o ( t 0 ) × x = 1 n R x I o ( t 0 + ) × R 0
Since Em(t0+) = Em(t0−), the terminal voltage changed at this moment is
Δ U o ( t 0 ) = U o ( t 0 + ) U o ( t 0 ) = ( I o ( t 0 ) I o ( t 0 + ) ) × R 0
Equation (3) indicates that ΔUo(t0) is related to the internal resistant R0 of the battery. As shown in Figure 2, for the same inrush current, the greater R0 is, the deeper the voltage drop is.
(c) t0 < t < t1: switch S1 and switch S2 are both on, Uo will decrease in accordance with Equation (4):
U o ( t ) = E m ( t 0 + ) I o ( t 0 ) x = 1 n R x x = 1 n u c x ( t ) I o ( t ) R 0 I o ( t ) R Σ e ( t t 0 ) τ c m
where
x = 1 n u c x ( t ) = I o ( t ) x = 1 n R x I o ( t ) x = 1 n R x e ( t t 0 ) τ x
R Σ = R 0 + x = 1 n R x
and τx = RxCx (x = 1, 2, …, n) is the time constant of the R-C block, respectively. τcm = RCm, Cm is the capacity of the battery. Therefore, the response voltage signal from t0 to t1 contains the main SOH information of the battery.
(d) t = t1: switch S1 is off, that is when the inrush current disappears.
U o ( t 1 ) = E m ( t 1 - ) I o ( t 0 ) x = 1 n R x x = 1 n u c x ( t 1 ) I o ( t 1 ) R 0
E m ( t 1 ) = E m ( t 0 + ) I o R Σ e ( t 1 t 0 ) τ c m
U o ( t 1 + ) = E m ( t 1 + ) I o ( t 0 ) x = 1 n R x x = 1 n u c x ( t 1 + )
For E m ( t 1 + ) = E m ( t 1 ) and x = 1 n u c x ( t 1 + ) = x = 1 n u c x ( t 1 ) , then
Δ U o ( t 1 ) = U o ( t 1 + ) U o ( t 1 ) = I o ( t 1 ) × R 0
(e) t > t1: switch S1 and switch S2 are all off, the battery is in the recovery process:
U o ( t ) = E m ( t 1 + ) x = 1 n R x I x e ( t t 1 ) τ x
According to Equation (11), the recovery process only depends on the dynamical parameter τx = RxCx.
(2)
Effect of Battery SOC
Similarly, the variation of the battery SOC also influences the steepness of the terminal voltage drops. In this case, we supposed that the AC source is offline. Then, the voltage response to the same inrush current at different SOCs and the same SOH is shown in Figure 3. It is obvious that the smaller the SOC of the battery is, the larger the battery terminal voltage drops. When the battery SOC is at a low value, there is a higher presence of non-active substances in the battery, reducing the availability of active materials. Simultaneously, the concentration of solutes in the electrolyte decreases, resulting in a lower rate of electrochemical reactions. This subsequently causes an increase in internal resistance within the battery, influencing the voltage response and causing a more significant voltage drop. A battery with a low SOC will express greater battery voltage change to sustain high currents. It illustrates that battery voltage drops are related not only to SOH but also to SOC. However, there are some different characteristics between these two kinds of response signals, which can be seen from the following formulas deduced in a similar way above.
(a) t < t0: switch S1 and switch S2 are all off, for Io = 0, then
U o ( t 0 ) = E m ( t 0 )
The initial value of Em(t0−) is decided by the SOC under the same temperature.
(b) t = t0: switch S1 turns on at this time, then the drop voltage will be
Δ U o ( t 0 ) = U o ( t 0 + ) U o ( t 0 ) = I o ( t 0 + ) × R 0
According to Equation (13), the voltage drops at the moment when the inrush current is injected, independent of the initial voltage Em(t0−). Therefore, it is not influenced by the SOC.
(c) t0 < t < t1: switch S1 is on, then
U o ( t ) = E m ( t 0 + ) x = 1 n u c x ( t ) I o ( t ) R 0 I o ( t ) R Σ e ( t t 0 ) τ c m
(d) tt1: switch S1 turns off, the step-up voltage is the same as Equation (10). And the recovery voltage is also the same as Equation (11).
(3)
Discussions of Dynamical Response Characteristics
According to (10), the step voltage at the moment when the inrush current disappeared only depends on the internal resistant R0. Therefore, for different SOCs but the same SOH of a battery, the values of step voltage are equal under the same step current. On the contrary, the value of step voltage will be bigger for an aging battery with a bigger internal resistant R0.
In summary, the voltage response to the pulsed load is related to the SOH and the SOC of the battery. However, the relationship between SOH and the voltage response signal is not explicit, and the voltage signal is susceptible to interference. Therefore, in this paper, a feature extraction method based on wavelet transform is adopted. Then, an estimator with a moderate computational complexity is designed using a fuzzy cerebellar model neural network.

2.2. Battery SOH Estimation Method Based on FCMNN

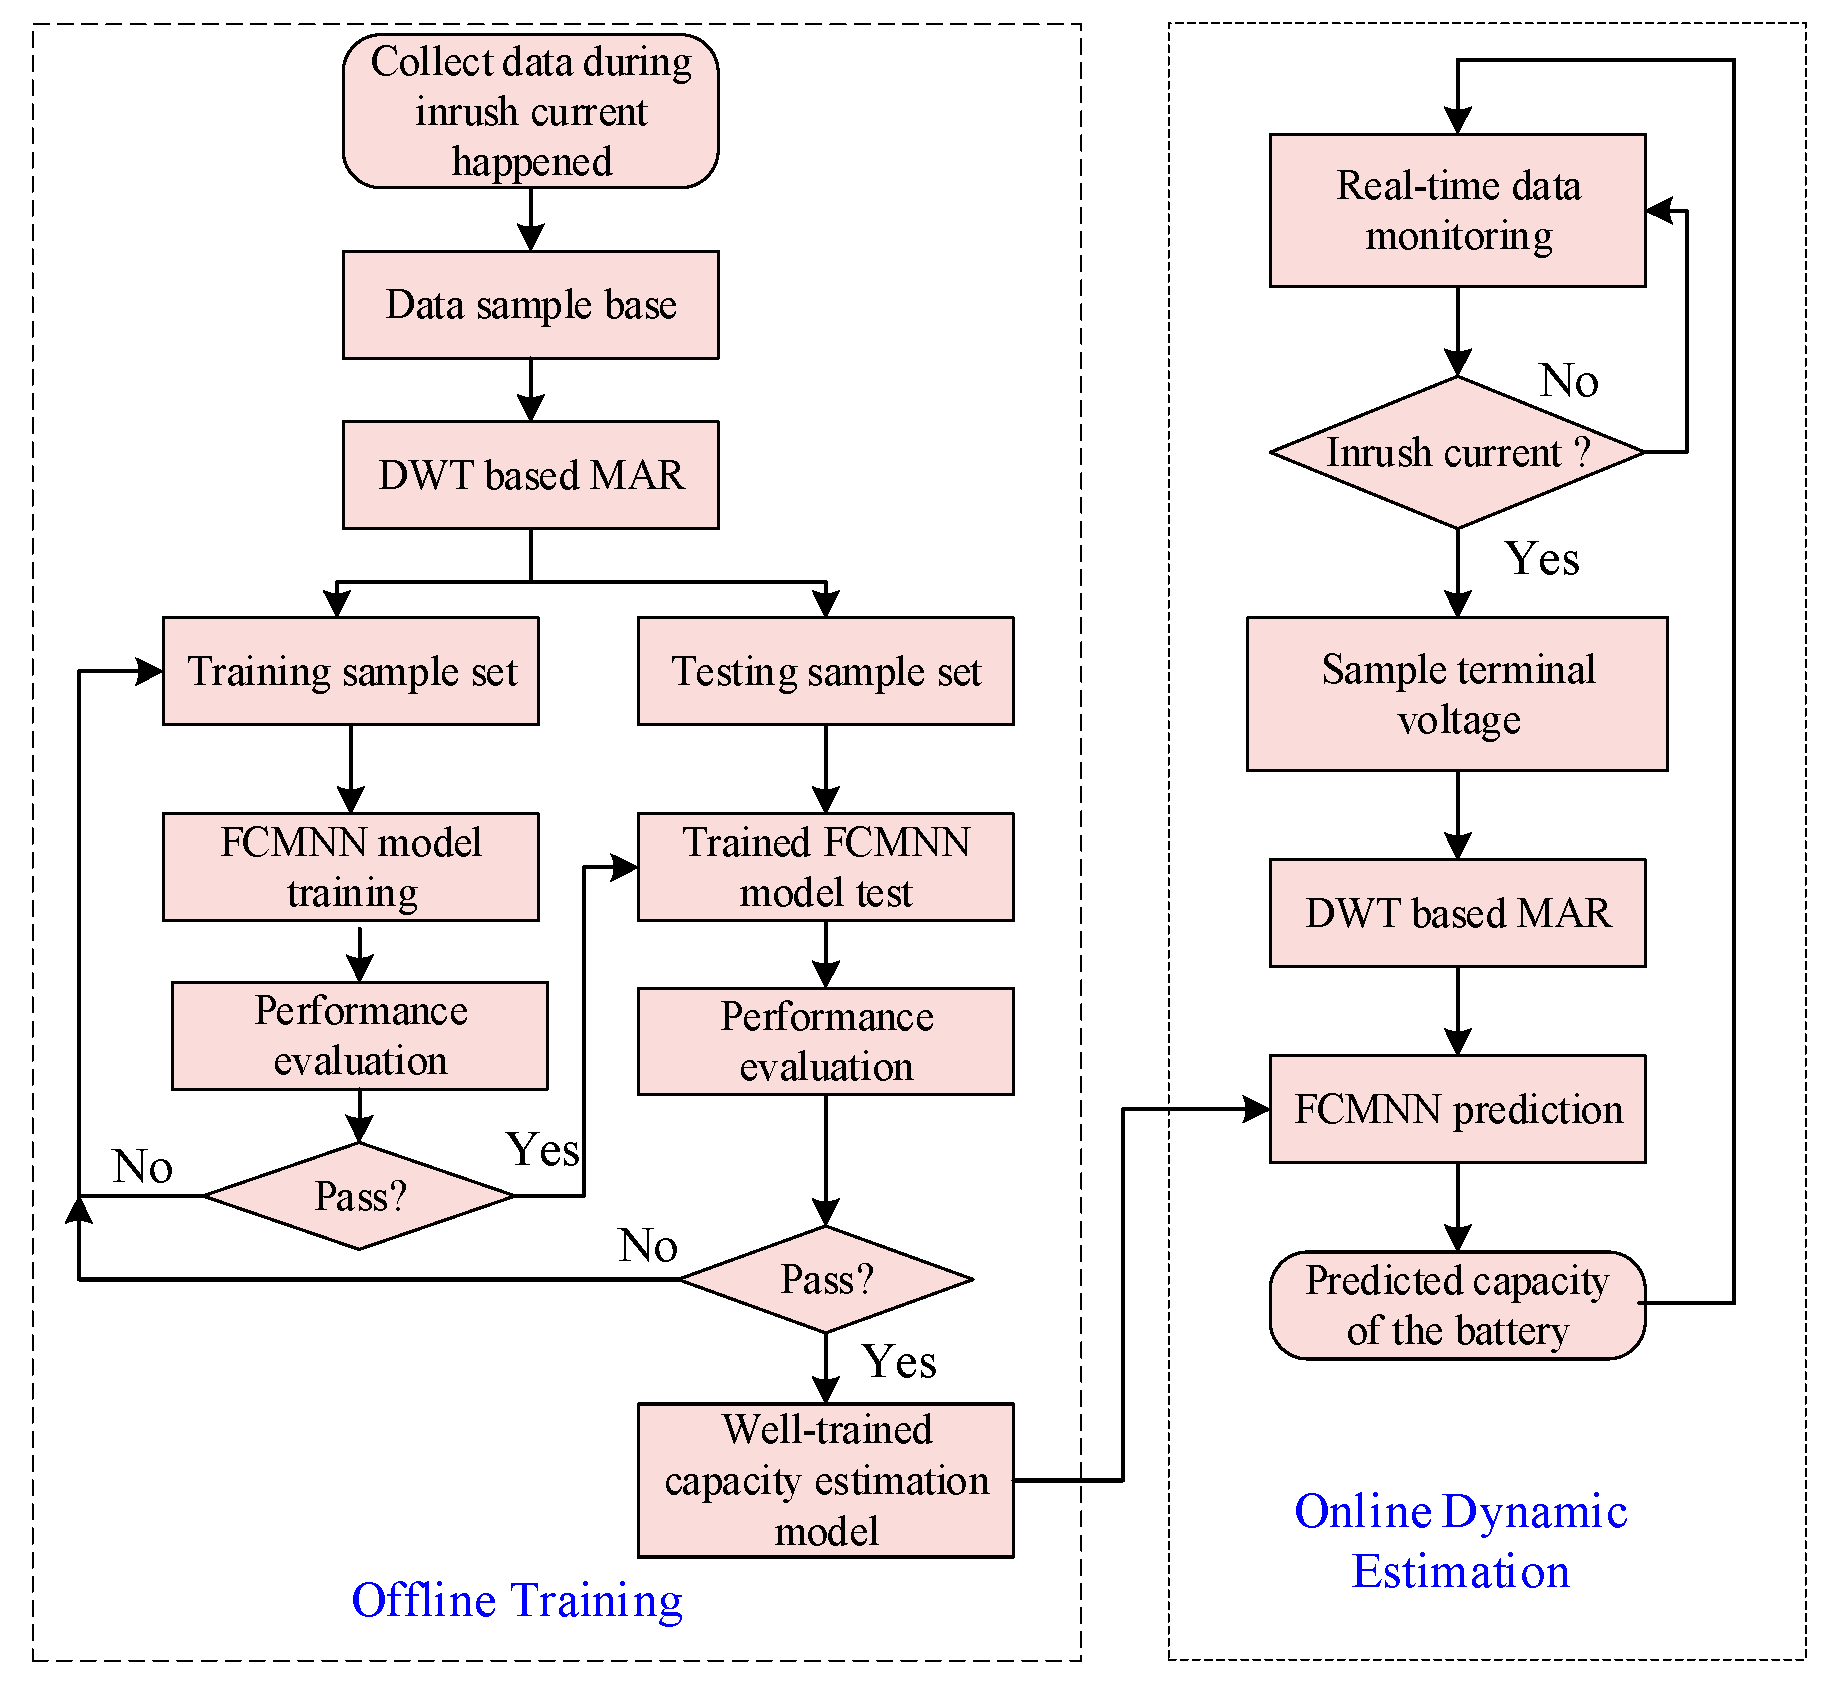
2.2.1. Flowchart of Estimation Process

Aiming to estimate the real-time SOH of the battery using only the voltage response signal of the inrush current, as shown in Figure 4, DWT-based MRA is introduced for feature extraction and FCMNN for the battery SOH estimation is designed by applying the fuzzy rule to machine learning algorithms. Raw data are divided into a training set and a testing set. The data sample base contains battery terminal voltage signals collected from different values of inrush currents under different SOCs. After the training, the proposed method can be used for the online battery SOH estimation with real-time sampled terminal voltage signals of the battery.

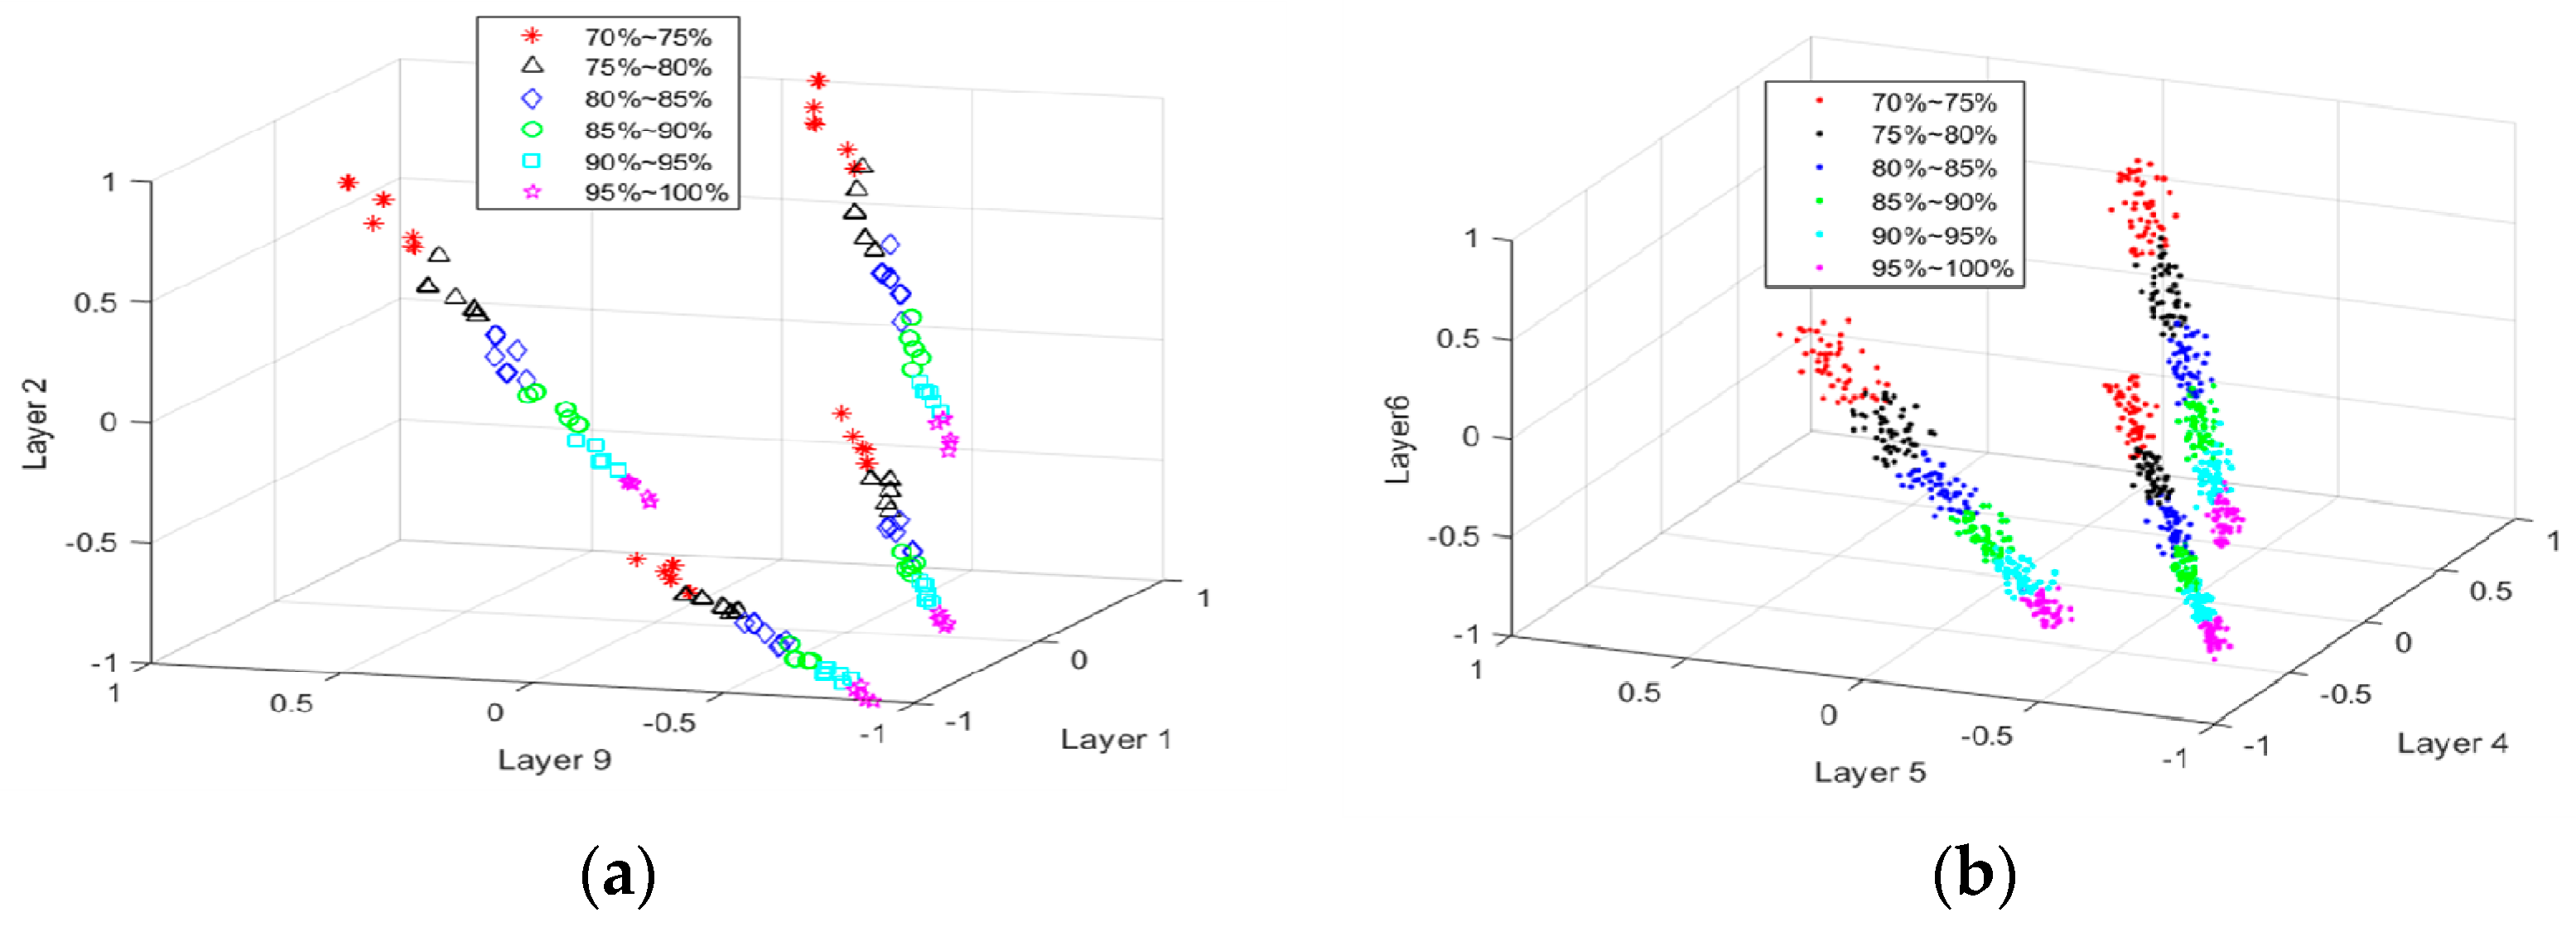
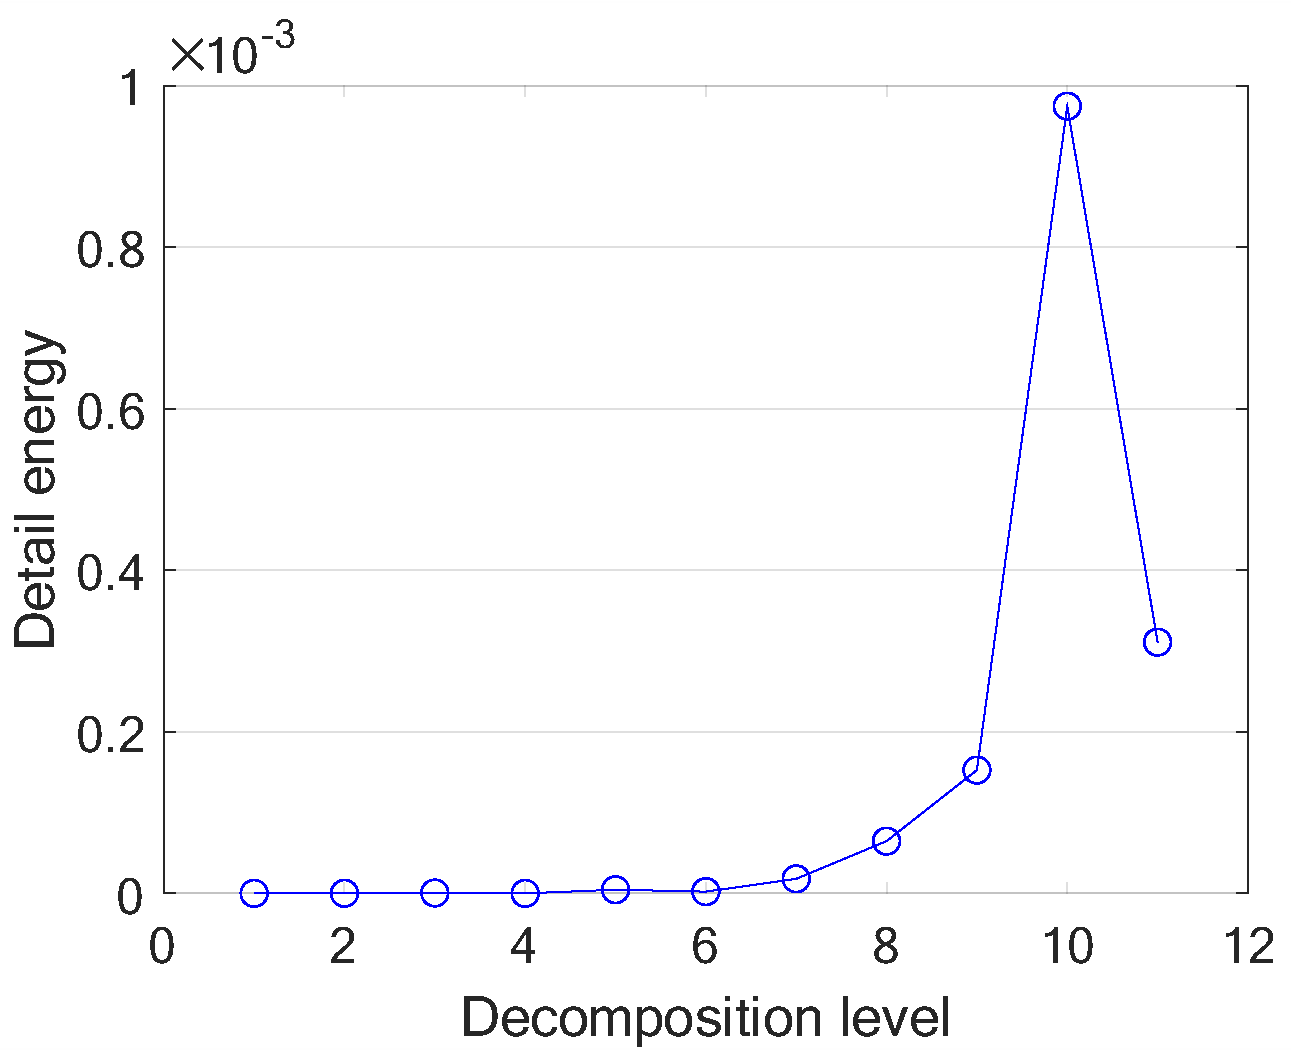
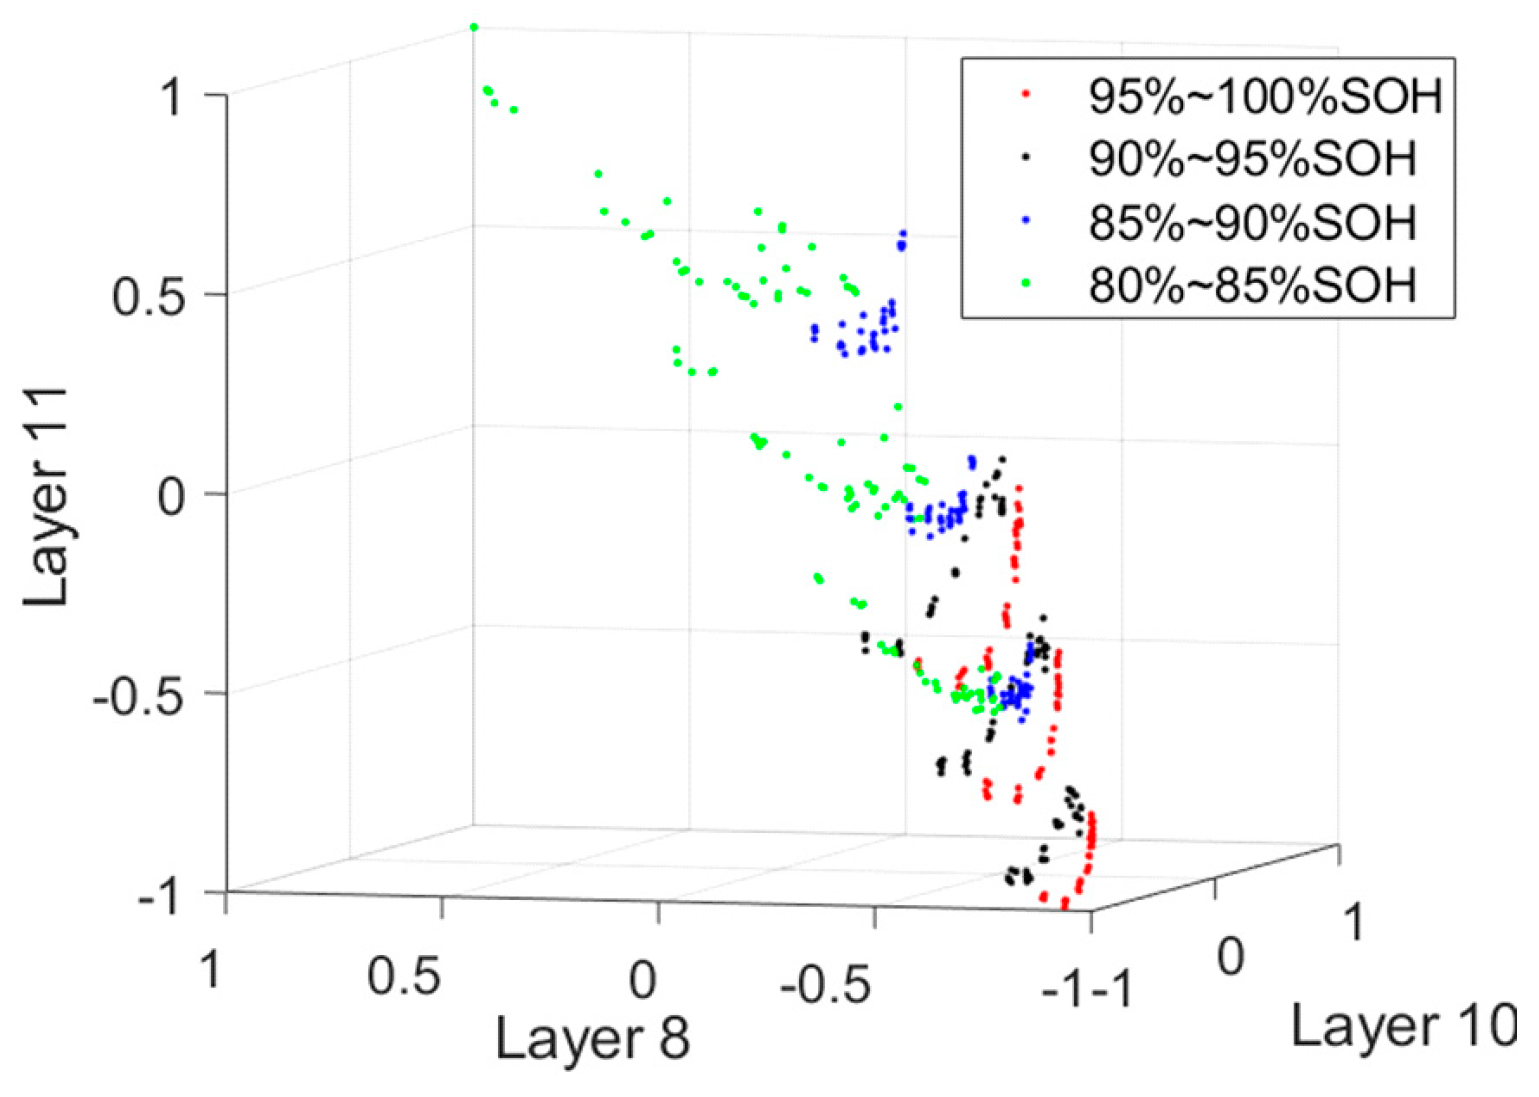
2.2.2. Feature Extraction Based on DWT

There are various signal decomposition methods, such as DWT, ensemble empirical mode decomposition (EEMD) [34], and improved complete ensemble empirical mode decomposition with adaptive noise (ICEEMDAN) [35], etc. In this study, the voltage response of the battery contains rich information on SOH and SOC; it is affected by the current’s magnitude and duration, showing a non-stationary nature. Wavelet analysis is used since it can obtain the information in both time and frequency domains from raw degradation signal and is well suited for processing non-stationary signals [32].
With the scaled and shifted wavelets, the multi-resolution signal analysis method based on DWT can avoid the numerical complexity and be easily implemented for online applications [33]. Given an arbitrary signal f(n) of finite energy, its multi-resolution decomposition at level M is defined by the formula:
f ( n ) = k a m , k φ m , k ( n ) + k d m , k ψ m , k ( n )
where am,k is the scaling coefficient, dm,k is the wavelet coefficient. φ(n) and ψ(n) are the scaling function and wavelet function, respectively.
The parameters am,k and dm,k can be calculated as:
a m , k = < f , φ m , k > = n a m 1 , n h ( m 2 k )
d m , k = < f , ψ m , k > = n a m 1 , n g ( m 2 k )
Here, h(m) is the low-pass filter, and g(m) is the high-pass filter. DWT based on MRA can be used to process data samples. For a signal V, it can be decomposed into approximate coefficient aj and detailed coefficient dj at different scales by using low-pass filter h(n) and high-pass filter g(n), and aj can be further decomposed into aj+1 and dj+1, etc. Coefficient reconstruction is a reverse decomposition process. The energy content of every detailed coefficient can be calculated as:
E D j = i = 1 q j d j , i 2 i = 1 q j d j , i 2 + i = 1 c j a j , i 2
where qj is the length of wavelet coefficients, and cj is the length of scaling coefficient at scale j. The number of decomposed layers is in accordance with the following rule:
N j , d = L
where Nj,d is the number of detail coefficients of the j-th layer after wavelet decomposition, L is the supporting length of the wavelet function, and j is determined as the final scale.
Here, three different SOHs are chosen, and the voltage curves under the same SOC illustrate the process of feature selection. The information of these three voltage curves is shown in Figure 5a. According to the decomposition principle shown in Equation (15), the number of decomposition layers is finally determined to be 14 layers.
Figure 5b–d show the reconstructed curves of the 1st, 10th, and 14th layer detail coefficients. These layers contain information about the battery’s internal resistance, open circuit voltage and rebound voltage, and battery polarization, respectively. The energy of each level of detail coefficient is obtained and used as an effective classification feature. It is found that the reconstruction curves of layers 1–8, 9–11, and 12–14 are similar to those in Figure 5b, Figure 5c, and Figure 5d, respectively. The detailed energy component of each layer is calculated using Equation (18). From the above analysis, only three layers need to be selected as features.

2.2.3. Battery SOH Estimator Based on FCMNN

FCMNN can be thought of as a learning mechanism imitating the cerebellum of a human being. It is often referred to as an associative NN, where only a small subset addressed by the input vector determines instantaneous output. Compared with backpropagation neural networks (BPNNs) and deep learning algorithms, FCMNN has the advantages of faster learning speed, better generalization and less computation resources, which is increasingly being employed for classification and forecast [33,36,37]. Therefore, FCMNN is proposed as a battery SOH estimation model in this paper.
Figure 6 shows the architecture of the battery SOH estimator based on FCMNN and its training method. The structure of the battery SOH estimator based on FCMNN has five spaces [33].
Layer 1. Input space Es: The input data is the energy feature data Ei, i = 1, 2, ⋯, ne, which are the features extracted from V. i represents the i-th input feature, and ne is the number of input signals to the estimator.
Layer 2. Association memory space As: It consists of nl layers and nb blocks. rijk denotes the output of the k-th layer and j-th block of the receptive-field basis function for the i-th input. Each block has two adjustable parameters, mean mijk, and variance vijk. The Gaussian function is employed as the receptive-field basis function in this paper.
r i j k E i = exp E i m i j k 2 v i j k 2 , j = 1 , , n l k = 1 , , n b
Layer 3. Receptive-field space Rs: It is formed by multiple input regions.
b j k = i = 1 n e r i j k = exp i = 1 n e I i m i j k 2 v i j k 2 , j = 1 , , n l k = 1 , , n b
where bjk is the general basis function associated with the jth layer and kth block of association memory space.
Layer 4. Weight memory space Ws: The weight memory space connects the receptive-field space with the output space. Where wjko denotes the connecting weight of o-th (o = 1, 2, …, no) output associated with the k-th block of j-th receptive field. no is the number of battery SOH estimator outputs.
W = w 111 w 11 o w 11 n o w j k 1 w j k o w j k n o w n l n b 1 w n l n b o w n l n b n o R n l n b × n o
Therefore, we have the last layer, i.e., the output space. Where the output of the proposed estimator can be represented by:
c o = j = 1 n l k = 1 n b w j k o b j k
y o = 1 / 1 + exp c o , o = 1 , 2 , , n o

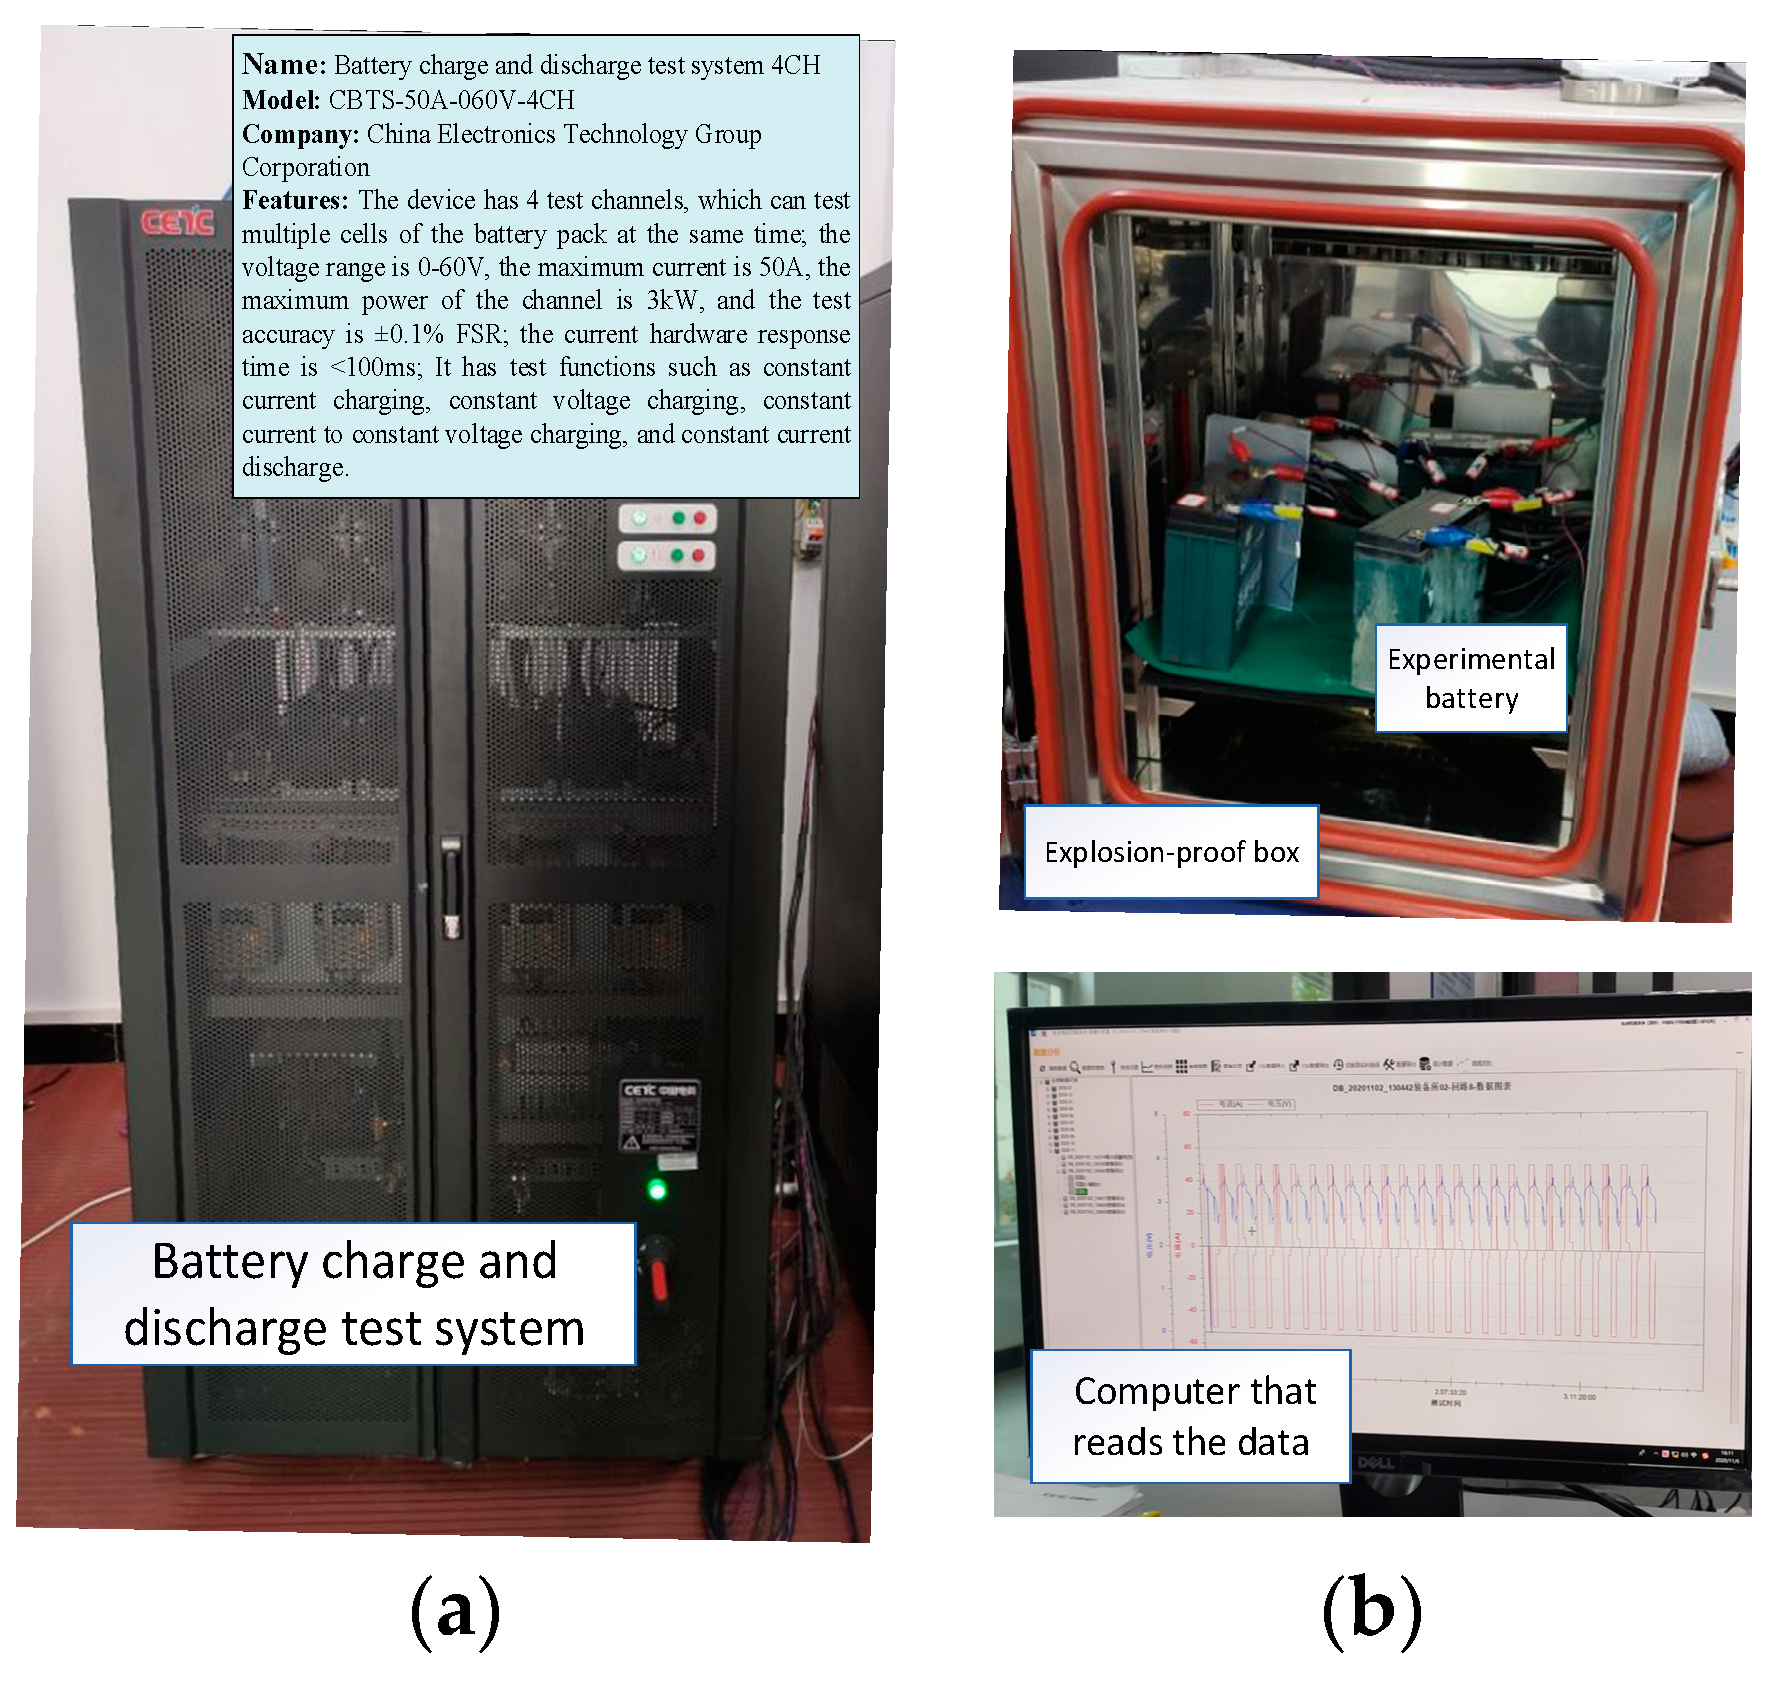
2.3. Experiment Platform

Figure 7 shows an experimental platform constructed for subsequent experiments: a battery, a battery charge–discharge testing system, and a computer. The battery has a capacity of 20 AH and a rated voltage of 12 V. The pulsed current and the duration used in the experiment are listed in Table 1.

3. Results

3.1. Simulation Case Study

In this section, two examples were modeled in Simulink of MATLAB for simulation study.

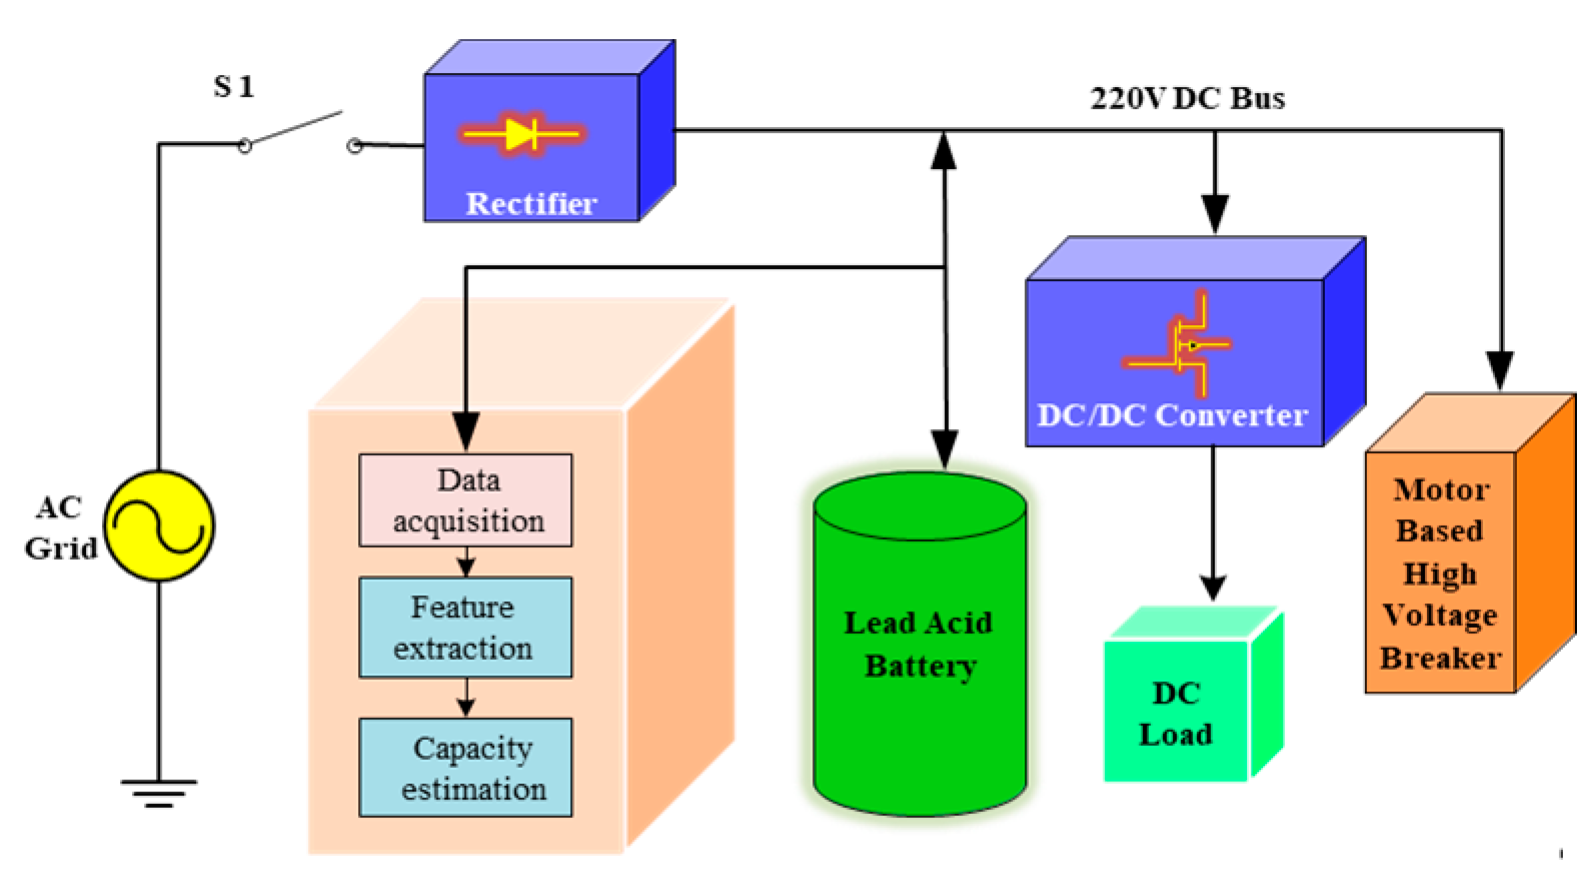
3.1.1. Auxiliary Supply System of Transformer Substation:

A classical auxiliary DC supply system with the proposed online dynamical battery SOH estimator is shown in Figure 8. The rectifier converts the 220 V AC voltage to 220 V DC voltage. The battery bank paralleled with the DC bus is used as a backup supply during an outage. This system has two kinds of loads: the constant load and the pulse load. Due to high inrush currents that the rectifier cannot offer, most or all of the inrush currents are supplied by a battery bank to activate the motor-based high-voltage breaker when the AC grid is normal or during outages. Therefore, the response signal can be used to estimate the real-time battery bank SOH with the proposed method.
The main parameters of the auxiliary supply system in this simulation case are described in Table 2. When switch S1 is on, it means that the AC grid is working well; otherwise, the grid will fail. Table 3 lists different operated values and durations of inrush currents. Usually, the battery is regarded to be at the end of life when the capacity reaches 80% of the rated capacity [38]. The SOC of the battery varies from 28~100%, and the range of SOH is 70~100%. Two estimation models are built by FCMNN for load surges that may occur when the AC source is normal or faulty. Table 4 lists six intervals of the SOH of the battery.

3.1.2. Simulation Results of Example I

By using the feature extraction method, the battery voltage response signal is decomposed into 11 layers when the AC power supply is online, and the battery voltage response signal is decomposed into 13 layers when the AC power supply is offline. This difference is caused by different lengths of the impulse current time selected in Table 3. The time segment of the AC power supply online inrush current selection is short, and the time segment of the AC power supply offline inrush current selection is long.
According to Section 3, it can be noted that the detailed energy of decomposition can be roughly divided into three categories. Therefore, suitable energy can be selected as the characteristic quantity among different classes. Figure 9a shows a three-dimensional view of the detailed energy of the 1st, 2nd, and 9th layers when the AC power supply is online. Figure 9b shows the three-dimensional view of the AC power offline, and the detailed energy of the 4th, 5th, and 6th layers are selected.
There were 300 data sets obtained in the normal operation of the AC source, and suppose that SOC is 100%. To analyze the performance of FCMNN, the samples were divided into three parts: training sets, test sets and validation sets, respectively. Without the loss of generality, 30 sets of data were randomly selected as the training set from 40 sets of data under each battery SOH interval, and the remaining 10 sets of data were used as the test sets. Thus, 180 sets of data were obtained as the training set data and 60 data sets were used as the test set data. Another 60 sets of data were used to validate the effectiveness of the well-trained SOH estimation model.
A total of 1020 sets of data were collected in AC source offline under different SOCs. Similarly, 120 sets of data were randomly selected as the training set from the 170 sets of data under each capacity interval, and 30 sets of data were used as the test sets. Thus, 720 sets of data were obtained as the training set data, 180 sets of data were used as the test set data, and the remaining 120 sets were for validation. Table 5 shows the sample partition and the classification accuracy of the testing set using an estimator based on a different kind of neural network.
A Back-Propagation Neural Network (BPNN) and Support Vector Machine (SVM) are used to compare with FCMNN in the paper. As listed in Table 5, the proposed method performs particularly well when the AC source is online. The FCMNN-based SOH estimator has better capabilities than the other two methods when the AC source is offline.

3.1.3. Simulation Results of Example II

The battery capacity and voltage used in the experiment did not reach 100 AH or 220 V. This can be regarded as a group of batteries connected in a series. In this case, the current is identical for each battery, so the voltage response should be the same. Therefore, for security purposes, a battery with a capacity of 20 AH and a rated voltage of 12 V was used in the experiment. Therefore, in order to verify the validity of the experiment, the battery capacity and voltage adjustment in the simulation are consistent with the experiment, listed in Table 6.
A total of 864 sets of data were obtained under AC power offline. For the sample data, the training set is 600 sets of data, the test set is 120 sets of data, and the verification set is 144 sets of data.
The set simulation scenes are shown in Table 7. The final validation set results and test set results are shown in Figure 10. It can be seen that using the FCMNN-based estimator, the battery SOH can still be distinguished with a high classification accuracy of 97.5%.

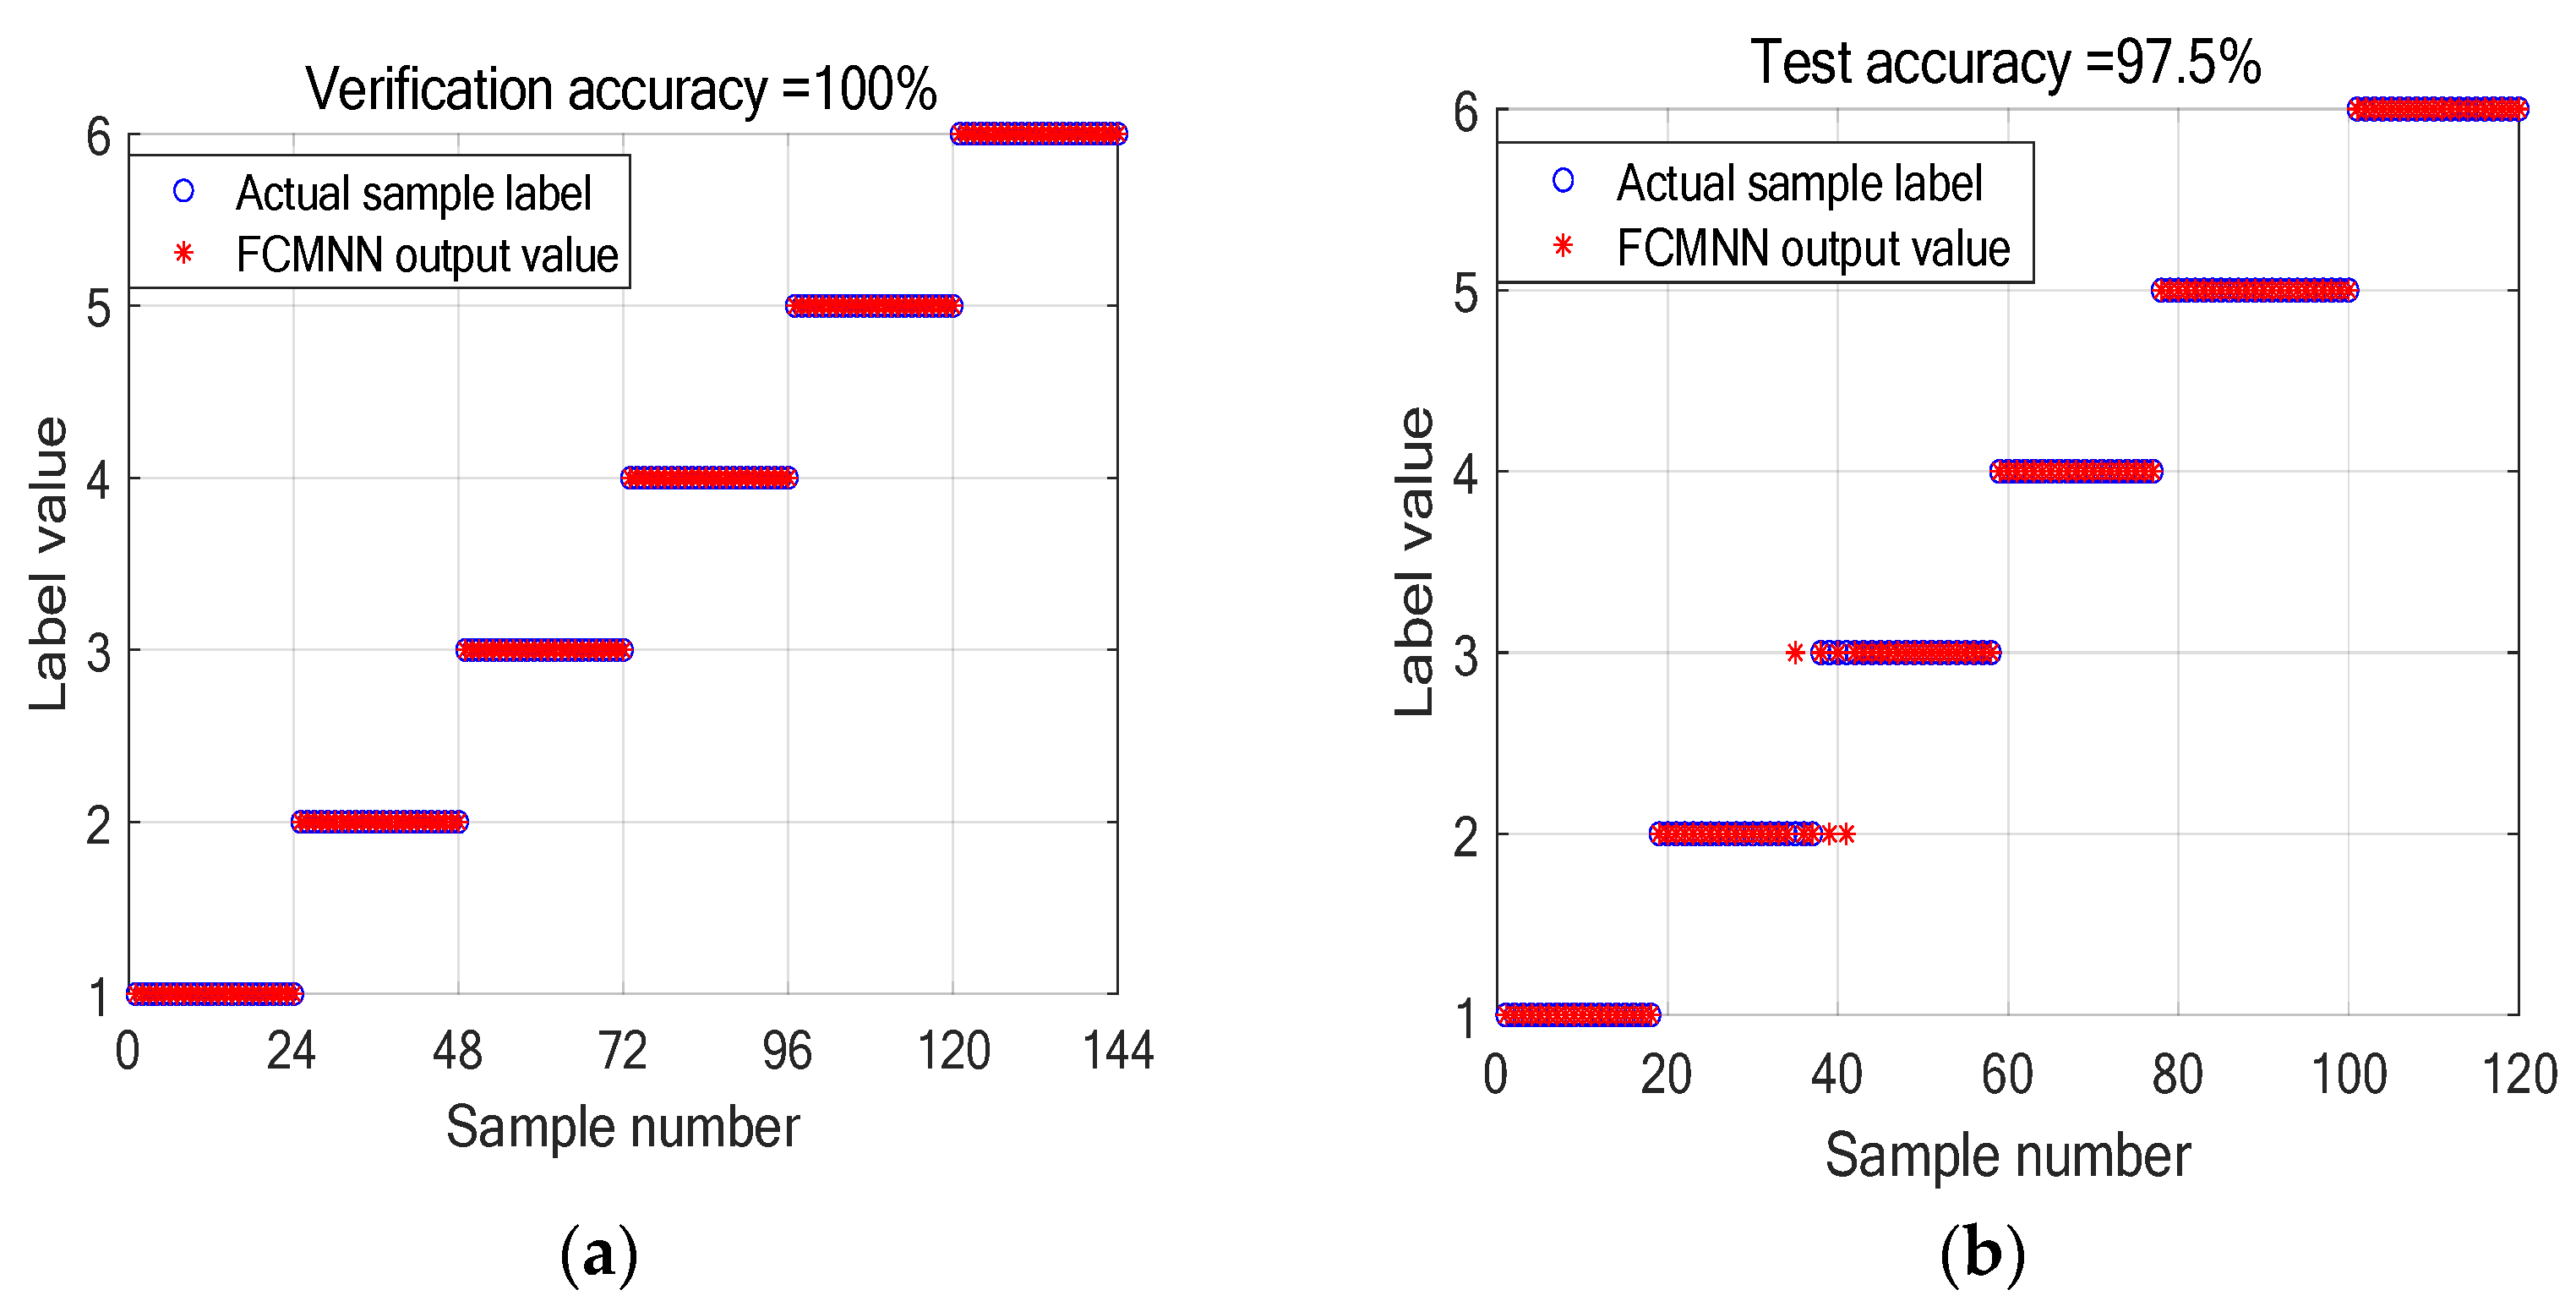
3.2. Experiment Verification

Figure 11 shows the voltage and current curves of the experimental battery under different SOHs. There were 420 data samples, including 380 samples for training and 40 samples for testing. Table 8 shows the SOH range of the experiment setting and the corresponding label. Using the proposed feature extraction method, the end condition was reached when the number of decomposition layers was selected to be 11 layers. Figure 12 shows the detailed energy of each layer obtained after decomposing 11 layers of a certain curve.
It can be seen from Figure 12 that the detail energies of layers 6–9 have a strong linear correlation, so one of them was chosen. Here, the energy of the 8th layer was selected. Then, two layers with larger energy were chosen as features, namely the 10th and the 11th layers. The three features of each curve are shown in the three-dimensional graph, as shown in Figure 13. These four categories can be easily distinguished from the figure. If the current difference is large or only one current is used, it is easier to distinguish.
The three features obtained from the experimental data were fed into the FCMNN, SVM, and BPNN models, and the results obtained are shown in Table 9. Table 9 shows that the proposed battery estimation method based on FCMNN can obtain higher classification accuracy than SVM and BPNN algorithms. This is because the associative memory and receptive-field space within FCMNN enhance the network’s capability to process uncertain information, adaptively learn, and generalize effectively. These improvements enable the estimator to better approximate complex non-linear mapping relationships. Compared with the traditional discharging method [9], both methods can achieve high accuracy; however, the traditional discharging method requires more than 5 h while the proposed method has the potential of online measurements.
Moreover, the traditional method needs the battery to be fully discharged; otherwise, it would cause large measurement errors. For the proposed method based on FCMNN, no additional injections and interference are needed during the measurements, which is non-destructive to the battery and the entire system. Furthermore, due to the similarity in the operating principles of different types of batteries, the proposed voltage response characteristics are also applicable to these batteries, e.g., lithium-ion batteries. They are gradually becoming the preferred energy storage solution for various applications due to their high energy density and long lifespan characteristics; it is important to estimate their health state. Therefore, there is potential for applying the proposed FCMNN-based SOH estimator due to the load surges.

4. Conclusions

This paper presents a novel battery SOH estimation method based on the response characteristics of the battery terminal voltage to pulsed loads. DWT-based MRA is employed to extract effective features from the dynamical response voltage data to inrush currents. The SOH estimator based on FCMNN is then utilized to estimate the SOH of the battery dynamically online. The simulation and experiment results show that the proposed approach has better performance. The advantage of the proposed method is that it can avoid interference from rectifier equipment and the other sensitive loads connected to the DC bus. Meanwhile, no additional injected high currents are needed. The proposed method is suitable for the scenario where the battery bank is used as a backup power supply and is not charging and discharging frequently, such as the online UPS system and the auxiliary. The DC supply system was deployed in transformer substations with high voltage circuit breakers. It can also be used in other applications with load surges, such as the starting process of electric vehicles.

Author Contributions

Conceptualization, Q.L. and R.H.; methodology, Y.F.; software, Y.F. and R.H.; validation, Y.F.; writing—original draft preparation, Y.F.; writing—review and editing, R.H.; supervision, Q.L. All authors have read and agreed to the published version of the manuscript.

Funding

This work was funded by the Science and Technology Major Project of Fujian Province of China under Grant 2022HZ028010 and the Young and Middle-aged Teacher Education Research Project of Fujian Province under Grant JAT220014.

Data Availability Statement

Data are contained within the article.

Acknowledgments

Thank you for the technical support from Shi You, Zhimin Dan, Xinhong Yu and Fengxiang Wang.

Conflicts of Interest

The authors declare no conflicts of interest.

References

  1. Mu, T.; Wang, Z.; Yao, N.; Zhang, M.; Bai, M.; Wang, Z.; Wang, X.; Cai, X.; Ma, Y. Technological penetration and carbon-neutral evaluation of rechargeable battery systems for large-scale energy storage. J. Energy Storage 2023, 69, 107917. [Google Scholar] [CrossRef]
  2. Shang, Y.; Zheng, W.; Yan, X.; Nguyen, D.H.; Jian, L. Predicting the state of health of VRLA batteries in UPS using data-driven method. Energy Rep. 2023, 9, 184–190. [Google Scholar] [CrossRef]
  3. Jiang, S.; Song, Z. A review on the state of health estimation methods of lead-acid batteries. J. Power Sources 2022, 517, 230710. [Google Scholar] [CrossRef]
  4. Guo, F.; Huang, G.; Zhang, W.; Wen, A.; Li, T.; He, H.; Huang, H.; Zhu, S. Lithium Battery State-of-Health Estimation Based on Sample Data Generation and Temporal Convolutional Neural Network. Energies 2023, 16, 8010. [Google Scholar] [CrossRef]
  5. Lucaferri, V.; Quercio, M.; Laudani, A.; Riganti Fulginei, F. A Review on Battery Model-Based and Data-Driven Methods for Battery Management Systems. Energies 2023, 16, 7807. [Google Scholar] [CrossRef]
  6. Selvaraj, V.; Vairavasundaram, I. A comprehensive review of state of charge estimation in lithium-ion batteries used in electric vehicles. J. Energy Storage 2023, 72, 108777. [Google Scholar] [CrossRef]
  7. Martí-Florences, M.; Cecilia, A.; Costa-Castelló, R. Modelling and Estimation in Lithium-Ion Batteries: A Literature Review. Energies 2023, 16, 6846. [Google Scholar] [CrossRef]
  8. Chen, S.-Z.; Liang, Z.; Yuan, H.; Yang, L.; Xu, F.; Fan, Y. A novel state of health estimation method for lithium-ion batteries based on constant-voltage charging partial data and convolutional neural network. Energy 2023, 283, 129103. [Google Scholar] [CrossRef]
  9. He, Q.; Zha, Y.; Sun, Q.; Pan, Z.; Liu, T. Capacity Fast Prediction and Residual Useful Life Estimation of Valve Regulated Lead Acid Battery. Math. Probl. Eng. 2017, 2017, 7835049. [Google Scholar] [CrossRef]
  10. Chao, K.-H.; Chen, J.-W. State-of-health estimator based-on extension theory with a learning mechanism for lead-acid batteries. Expert Syst. Appl. 2011, 38, 15183–15193. [Google Scholar] [CrossRef]
  11. Sutanto, E.; Astawa, P.E.; Fahmi, F.; Hamid, M.I.; Yazid, M.; Shalannanda, W.; Aziz, M. Lithium-Ion Battery State-of-Charge Estimation from the Voltage Discharge Profile Using Gradient Vector and Support Vector Machine. Energies 2023, 16, 1083. [Google Scholar] [CrossRef]
  12. Marchildon, J.; Doumbia, M.L.; Agbossou, K. SOC and SOH characterisation of lead acid batteries. In Proceedings of the IECON 2015—41st Annual Conference of the IEEE Industrial Electronics Society, Yokohama, Japan, 9–12 November 2015; pp. 001442–001446. [Google Scholar]
  13. Shahriari, M.; Farrokhi, M. Online State-of-Health Estimation of VRLA Batteries Using State of Charge. IEEE Trans. Ind. Electron. 2013, 60, 191–202. [Google Scholar] [CrossRef]
  14. Kim, J.; Nikitenkov, D. Fuzzy logic-controlled online state-of-health (SOH) prediction in large format LiMn2O4 cell for energy storage system (ESS) applications. In Proceedings of the 2014 IEEE International Conference on Industrial Technology (ICIT), Busan, Republic of Korea, 26 February–1 March 2014; pp. 474–479. [Google Scholar]
  15. Zenati, A.; Desprez, P.; Razik, H.; Rael, S. Impedance measurements combined with the fuzzy logic methodology to assess the SOC and SOH of lithium-ion cells. In Proceedings of the 2010 IEEE Vehicle Power and Propulsion Conference, Lille, France, 1–3 September 2010; pp. 1–6. [Google Scholar]
  16. Takahashi, K.; Watakabe, Y. Development of SOH monitoring system for industrial VRLA battery string. In Proceedings of the 25th International Telecommunications Energy Conference, INTELEC ’03, Yokohama, Japan, 23–23 October 2003; pp. 664–670. [Google Scholar]
  17. Chaoui, H.; Ibe-Ekeocha, C.C. State of Charge and State of Health Estimation for Lithium Batteries Using Recurrent Neural Networks. IEEE Trans. Veh. Technol. 2017, 66, 8773–8783. [Google Scholar] [CrossRef]
  18. Mao, L.; Hu, H.; Chen, J.; Zhao, J.; Qu, K.; Jiang, L. Online State-of-Health Estimation Method for Lithium-Ion Battery Based on CEEMDAN for Feature Analysis and RBF Neural Network. IEEE J. Emerg. Sel. Top. Power Electron. 2023, 11, 187–200. [Google Scholar] [CrossRef]
  19. Zhang, X.; Hou, J.; Wang, Z.; Jiang, Y. Joint SOH-SOC Estimation Model for Lithium-Ion Batteries Based on GWO-BP Neural Network. Energies 2023, 16, 132. [Google Scholar] [CrossRef]
  20. Sui, X.; He, S.; Meng, J.; Teodorescu, R.; Stroe, D.I. Fuzzy Entropy-Based State of Health Estimation for Li-Ion Batteries. IEEE J. Emerg. Sel. Top. Power Electron. 2021, 9, 5125–5137. [Google Scholar] [CrossRef]
  21. Xu, P.; Hu, X.; Liu, B.; Ouyang, T.; Chen, N. Hierarchical Estimation Model of State-of-Charge and State-of-Health for Power Batteries Considering Current Rate. IEEE Trans. Ind. Inform. 2022, 18, 6150–6159. [Google Scholar] [CrossRef]
  22. Layadi, T.M.; Champenois, G.; Mostefai, M.; Abbes, D. Lifetime estimation tool of lead–acid batteries for hybrid power sources design. Simul. Model. Pract. Theory 2015, 54, 36–48. [Google Scholar] [CrossRef]
  23. Liu, X.; Yang, Y.; He, Y.; Zhang, J.; Zheng, X.; Ma, M.; Zeng, G. A new dynamic SOH estimation of lead-acid battery for substation application. Int. J. Energy Res. 2017, 41, 579–592. [Google Scholar] [CrossRef]
  24. Yan, W.; Zhang, B.; Zhao, G.; Tang, S.; Niu, G.; Wang, X. A Battery Management System With a Lebesgue-Sampling-Based Extended Kalman Filter. IEEE Trans. Ind. Electron. 2019, 66, 3227–3236. [Google Scholar] [CrossRef]
  25. Kwiecien, M.; Badeda, J.; Huck, M.; Komut, K.; Duman, D.; Sauer, D.U. Determination of SoH of Lead-Acid Batteries by Electrochemical Impedance Spectroscopy. Appl. Sci. 2018, 8, 873. [Google Scholar] [CrossRef]
  26. Badeda, J.; Kwiecien, M.; Schulte, D.; Sauer, D.U. Battery State Estimation for Lead-Acid Batteries under Float Charge Conditions by Impedance: Benchmark of Common Detection Methods. Appl. Sci. 2018, 8, 1308. [Google Scholar] [CrossRef]
  27. Wu, J.; Su, H.; Meng, J.; Lin, M. State of Health Estimation for Lithium-Ion Battery via Recursive Feature Elimination on Partial Charging Curves. IEEE J. Emerg. Sel. Top. Power Electron. 2023, 11, 131–142. [Google Scholar] [CrossRef]
  28. He, J.; Meng, S.; Li, X.; Yan, F. Partial Charging-Based Health Feature Extraction and State of Health Estimation of Lithium-Ion Batteries. IEEE J. Emerg. Sel. Top. Power Electron. 2023, 11, 166–174. [Google Scholar] [CrossRef]
  29. Zhang, C.; Zhang, Y.; Li, Y. A Novel Battery State-of-Health Estimation Method for Hybrid Electric Vehicles. IEEE/ASME Trans. Mechatron. 2015, 20, 2604–2612. [Google Scholar] [CrossRef]
  30. Hu, Y.; Wang, Y.Y. Two Time-Scaled Battery Model Identification With Application to Battery State Estimation. IEEE Trans. Control Syst. Technol. 2015, 23, 1180–1188. [Google Scholar] [CrossRef]
  31. Ceraolo, M. New dynamical models of lead-acid batteries. IEEE Trans. Power Syst. 2000, 15, 1184–1190. [Google Scholar] [CrossRef] [PubMed]
  32. Ning, J.; Wang, J.; Gao, W.; Liu, C. A Wavelet-Based Data Compression Technique for Smart Grid. IEEE Trans. Smart Grid 2011, 2, 212–218. [Google Scholar] [CrossRef]
  33. Yu, J.J.Q.; Hou, Y.; Lam, A.Y.S.; Li, V.O.K. Intelligent Fault Detection Scheme for Microgrids With Wavelet-Based Deep Neural Networks. IEEE Trans. Smart Grid 2019, 10, 1694–1703. [Google Scholar] [CrossRef]
  34. Dliou, A.; Elouaham, S.; Laaboubi, M.; Zougagh, H.; Saddik, A. Denoising Ventricular Tachyarrhythmia Signal. In Proceedings of the 2018 9th International Symposium on Signal, Image, Video and Communications (ISIVC), Rabat, Morocco, 27–30 November 2018. [Google Scholar]
  35. Elouaham, S.; Dliou, A.; Elkamoun, N.; Latif, R.; Said, S.; Zougagh, H.; ElKhadiri, K. Denoising Electromyogram and Electroencephalogram Signals Using Improved Complete Ensemble Empirical Mode Decomposition with Adaptive Noise. Indones. J. Electr. Eng. Comput. Sci. 2021, 23, 829–836. [Google Scholar] [CrossRef]
  36. Lin, Q.; Chen, S.; Lin, C.M. Parametric Fault Diagnosis Based on Fuzzy Cerebellar Model Neural Networks. IEEE Trans. Ind. Electron. 2019, 66, 8104–8115. [Google Scholar] [CrossRef]
  37. Lin, Q.; Li, H.; Chai, Q.; Cai, F.; Zhan, Y. Simultaneous and rapid estimation of state of health and state of charge for lithium-ion battery based on response characteristics of load surges. J. Energy Storage 2022, 55, 105495. [Google Scholar] [CrossRef]
  38. Chung, C.-C.; Chen, T.-S.; Lin, L.-H.; Lin, Y.-C.; Lin, C.-M. Bankruptcy Prediction Using Cerebellar Model Neural Networks. Int. J. Fuzzy Syst. 2016, 18, 160–167. [Google Scholar] [CrossRef]
Figure 1. Battery equivalent circuit with load and charger.
Energies 17 00583 g001
Figure 2. Battery voltage drop affected by inrush current under different SOHs.
Energies 17 00583 g002
Figure 3. Battery voltage drop affected by inrush current under different SOCs.
Energies 17 00583 g003
Figure 4. The flowchart of the proposed battery SOH estimation.
Energies 17 00583 g004
Figure 5. (a) Voltage curve of different SOHs. (b) The 1st layer detail coefficient reconstruction curve. (c) The 10th level detail coefficient reconstruction curve. (d) The 14th layer detail coefficient reconstruction curve.
Energies 17 00583 g005
Figure 6. The architecture of the battery SOH estimator is based on FCMNN and its learning process.
Energies 17 00583 g006
Figure 7. Experiment platform with equivalent pulsed load. (a) Battery charge and discharge test system. (b) Experimental battery and computer.
Energies 17 00583 g007
Figure 8. Architecture of an auxiliary supply system.
Energies 17 00583 g008
Figure 9. Three-dimensional feature distribution for (a) AC source online and (b) AC source offline.
Energies 17 00583 g009
Figure 10. (a) Verification result of FCMNN. (b) Test result of FCMNN.
Energies 17 00583 g010
Figure 11. Experimental results of voltage drop affected by the inrush current under different SOHs.
Energies 17 00583 g011
Figure 12. Detail energy for different wavelet decomposition layers.
Energies 17 00583 g012
Figure 13. Three-dimensional feature distribution of experiment data samples.
Energies 17 00583 g013
Table 1. Current Changing of Circuit Breaker used in the experiment.
Duration time (s) (S1 off)555
Mean value (A) (S1 off)108.57
Table 2. Main Parameters of Auxiliary DC Supply System.
AC Source
Effective Value
Constant
Load
Rated Capacity
of Battery
Nominal Voltage
of Battery
AC 220 V16 Ω100 AhDC 220 V
Table 3. Current Changing of Circuit Breaker in auxiliary DC supply system.
Duration time (s) (S1 on).3423.5
Mean value (A) (S1 on)80706050
Duration time (s) (S1 off)345
Mean value (A) (S1 off)807060
Table 4. Battery SOH Range Setting in auxiliary DC supply system.
Battery SOH span setting1~95%95~90%90~85%
Labels001010011
Battery SOH span setting85~80%80~75%75~70%
Labels100101110
Table 5. Test Set Accuracy in the Simulation.
AC Source OnlineAC Source Offline
Training Set180720
Test Set60180
Validation Set60120
Sample Size3001020
Validate Set Accuracy by FCMNN98.3%97.2%
Test Set Accuracy by SVM98.3%96.1%
Test Set Accuracy by BPNN98.3%92.7%
Test Set Accuracy by FCMNN96.6%97.2%
Table 6. Main Parameters of System for Example II.
AC Source
Effective Value
Constant
Load
Rated Capacity
of Battery
Nominal Voltage
of Battery
AC 220 VConstant20 AhDC 12 V
Table 7. Current Changing of Circuit Breaker for Example II.
Duration time (s) (S1 off)344.5
Mean value (A) (S1 off)107.55
Table 8. Experiment Battery SOH Range Setting.
Battery SOH span setting1~95%95~90%90~85%
Labels001010011
Battery SOH span setting85~80%
Labels100
Table 9. The Set Results in the Experiment.
AlgorithmAccuracy
FCMNN94.8%
SVM87.5%
BPNN85%
Disclaimer/Publisher’s Note: The statements, opinions and data contained in all publications are solely those of the individual author(s) and contributor(s) and not of MDPI and/or the editor(s). MDPI and/or the editor(s) disclaim responsibility for any injury to people or property resulting from any ideas, methods, instructions or products referred to in the content.

