Article

Research on the Internal Flow Mechanisms and Pressure Fluctuation Characteristics of Seawater Reverse Osmosis Energy Recovery Turbines

School of Energy and Power Engineering, Lanzhou University of Technology, Lanzhou 730050, China
*
Author to whom correspondence should be addressed.
Energies 2024, 17(24), 6461; https://doi.org/10.3390/en17246461
Submission received: 12 November 2024 / Revised: 3 December 2024 / Accepted: 17 December 2024 / Published: 22 December 2024
(This article belongs to the Section A: Sustainable Energy)

Abstract

:
Energy recovery turbines (ERTs) play an important role in reducing the energy consumption of seawater reverse osmosis (SWRO). The internal flow loss mechanisms and hydraulic vibration characteristics of a centrifugal ERT model used in SWRO were studied under multiple conditions. The results show that the high-efficiency range of the ERT tends toward high-flow conditions. The energy loss is mainly concentrated at the tongue in the volute, which is due to the generation of flow separation vortices. There is a flow separation phenomenon on the suction surface side of the blade, trailing under the 0.8Qd condition. The energy loss of the ERT is the lowest under the 1.0Qd condition, because the interaction between the fluid and the blades is the weakest. There are vortices formed by flow impact on the blade pressure surface under the 1.2Qd condition. There are vortices on the blade suction face, which are generated by fluid separation. The closer the relative liquid flow angle is to the blade settle angle, the smaller the energy loss is in the impeller. Therefore, the ERT should first reduce rated flow appropriately before hydraulic design, as this is beneficial for efficient operation under multiple conditions.

1. Introduction

In the context of increasingly scarce freshwater in the world, the development of the seawater desalination industry is a common trend in various countries [1]. As the leading technology for seawater desalination, reverse osmosis has been widely applied in various water-scarce countries, and has achieved good economic benefits. Fluid energy recovery technology is mainly divided into two categories: non-direct fluid contact and direct fluid contact. Typical device types that use fluid non-contact technology include the Francis Turbine, Pelton Turbine, and Turbo Charger [2,3]. The usual turbine used in seawater reverse osmosis (SWRO) as an energy recovery device is the Pelton Turbine. The Francis turbine is used in brackish water reverse osmosis (BWRO) systems as a turbocharger. The Francis turbine uses a centrifugal pump for reverse rotation as an energy recovery turbine. There is a certain difference between the performance of the pump as turbine (PAT) and the performance of the pump [4,5,6] due to the design parameters of the centrifugal pump being in line with the conditions under which the pump works. D. Shahram [7] combined a gradient optimization algorithm with a 3D N-S flow solver to redesign the blade shape, in order to make the turbine more efficient, so as to improve the hydraulic performance of the ERT. P. Singh [8] studied the influence of the impeller inlet inverted circle on the centrifugal pump and mixed flow PAT, and verified, using experiments, that the impeller inverted circle can improve the overall efficiency of the turbine by 1–3%. Yang Sunsheng [9,10,11] studied the effects of rotational speed, blade rounding, and the number of the impeller blades on the performance of the PAT, pointing out that variations in rotational speed operation change the flow condition at which the turbine performs best, and the higher the rotational speed, the greater the flow corresponding to the optimal efficiency point. Wang Tao [12,13] proposed a hydraulic design method for forward-curved impellers used in hydraulic turbines, and the feasibility of this design method was verified with experiments. Qi Bing [14,15] studied the energy loss characteristics and the impact mechanisms of key geometric parameters on the performance of forward- and backward-curved energy recovery turbines, based on entropy production theory. T. Lin [16] studied the transient characteristics of flow separation during the operation of a PAT under design conditions, pointing out that the reflux and separation flow can be observed at the impeller leading edge and the leading shroud side near the trailing edge suction surface. In addition, there is always a vortex at the volute tongue.
Researchers have carried out a lot of research on the structure, flow field characteristics, and hydraulic vibration of flow components, in order to improve the performance and stability of ERTs. However, the coupling mechanisms linking the performance, operating stability, and internal flow characteristics of ERTs have not been clearly revealed. Therefore, the objective of this paper is to reveal the influence mechanisms of unsteady flow characteristics on internal flow loss and pressure pulsation. The generation mechanisms of unstable flow phenomena in ERT under multiple conditions, and their impact on pressure pulsation, were studied using experimental and numerical calculation methods.

2. Methodology of Vortex Identification

The Q criterion is the most widely used vortex identification method in blade fluid machinery. Therefore, this study uses the Q criterion to directly display the vortex structure in the turbine, thus revealing the unsteady evolution process of the vortex structure when the impeller rotates 90° in a cycle.
According to the principle of the Q criterion, the eigenvalues of the velocity gradient tensor ∇u should satisfy the following characteristic equations:
λ 3 + P λ 2 + Q λ + R = 0
and in an incompressible fluid flow,
P = S ii = 0
In Equation (1), λ is the eigenvalue of Equation (1); S is the deformation rate tensor; Ω is the vortex tensor; and P, Q, and R are the first, second, and third invariants of the velocity gradient, respectively, and their values are independent of the coordinate relationship. The Q method considers that the vortex tube is in the region of Q > 0. In Equation (2), the first term represents the rotational strength of the fluid microelement, and the second term represents the deformation strength of the fluid microelement. The Q method indicates that the fluid microelement dominated by the vortex is in the vortex tube.

3. Experimental and Numerical Setup
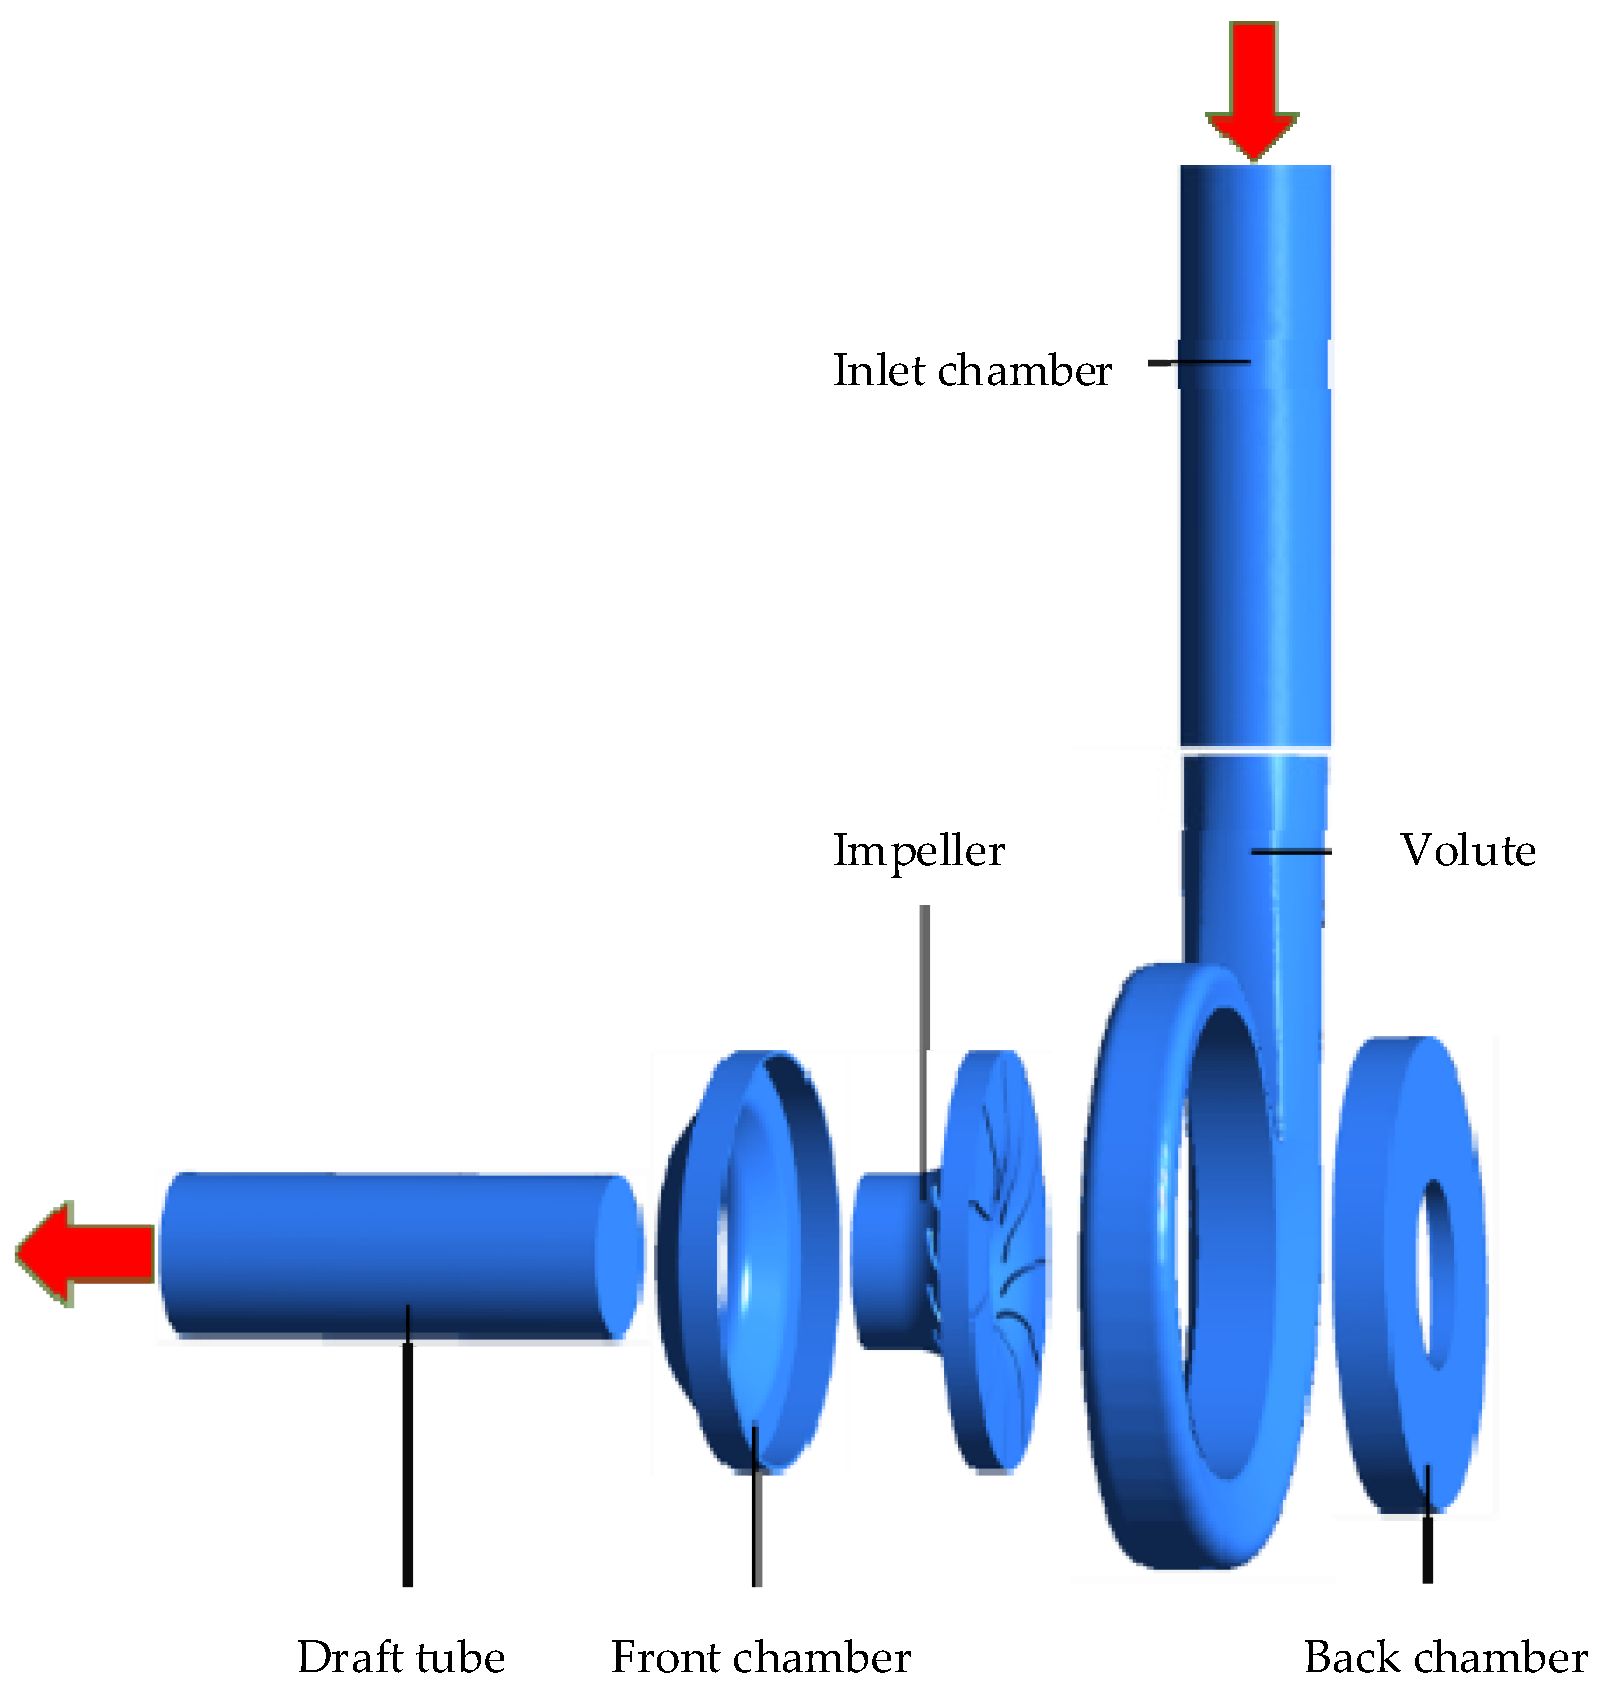
3.1. Physical Model

A centrifugal energy recovery turbine was selected as the research object in this study, and the performance and hydraulic vibration characteristics of an ERT were considered as the main research targets. The design parameters are shown in Table 1.
Figure 1 shows the hydraulic model of the overall computational domain for the ERT, which is mainly composed of a suction chamber, volute, front chamber and back chamber, impeller, and draft tube. It is worth noting that the inlet is extended to five times the diameter of the volute inlet, in order to reduce the influence of boundary condition disturbances and generate a stable flow at the inlet. The length of the tailpipe is extended to five times the diameter of the ERT outlet, in order to provide a fully developed flow at the outlet.

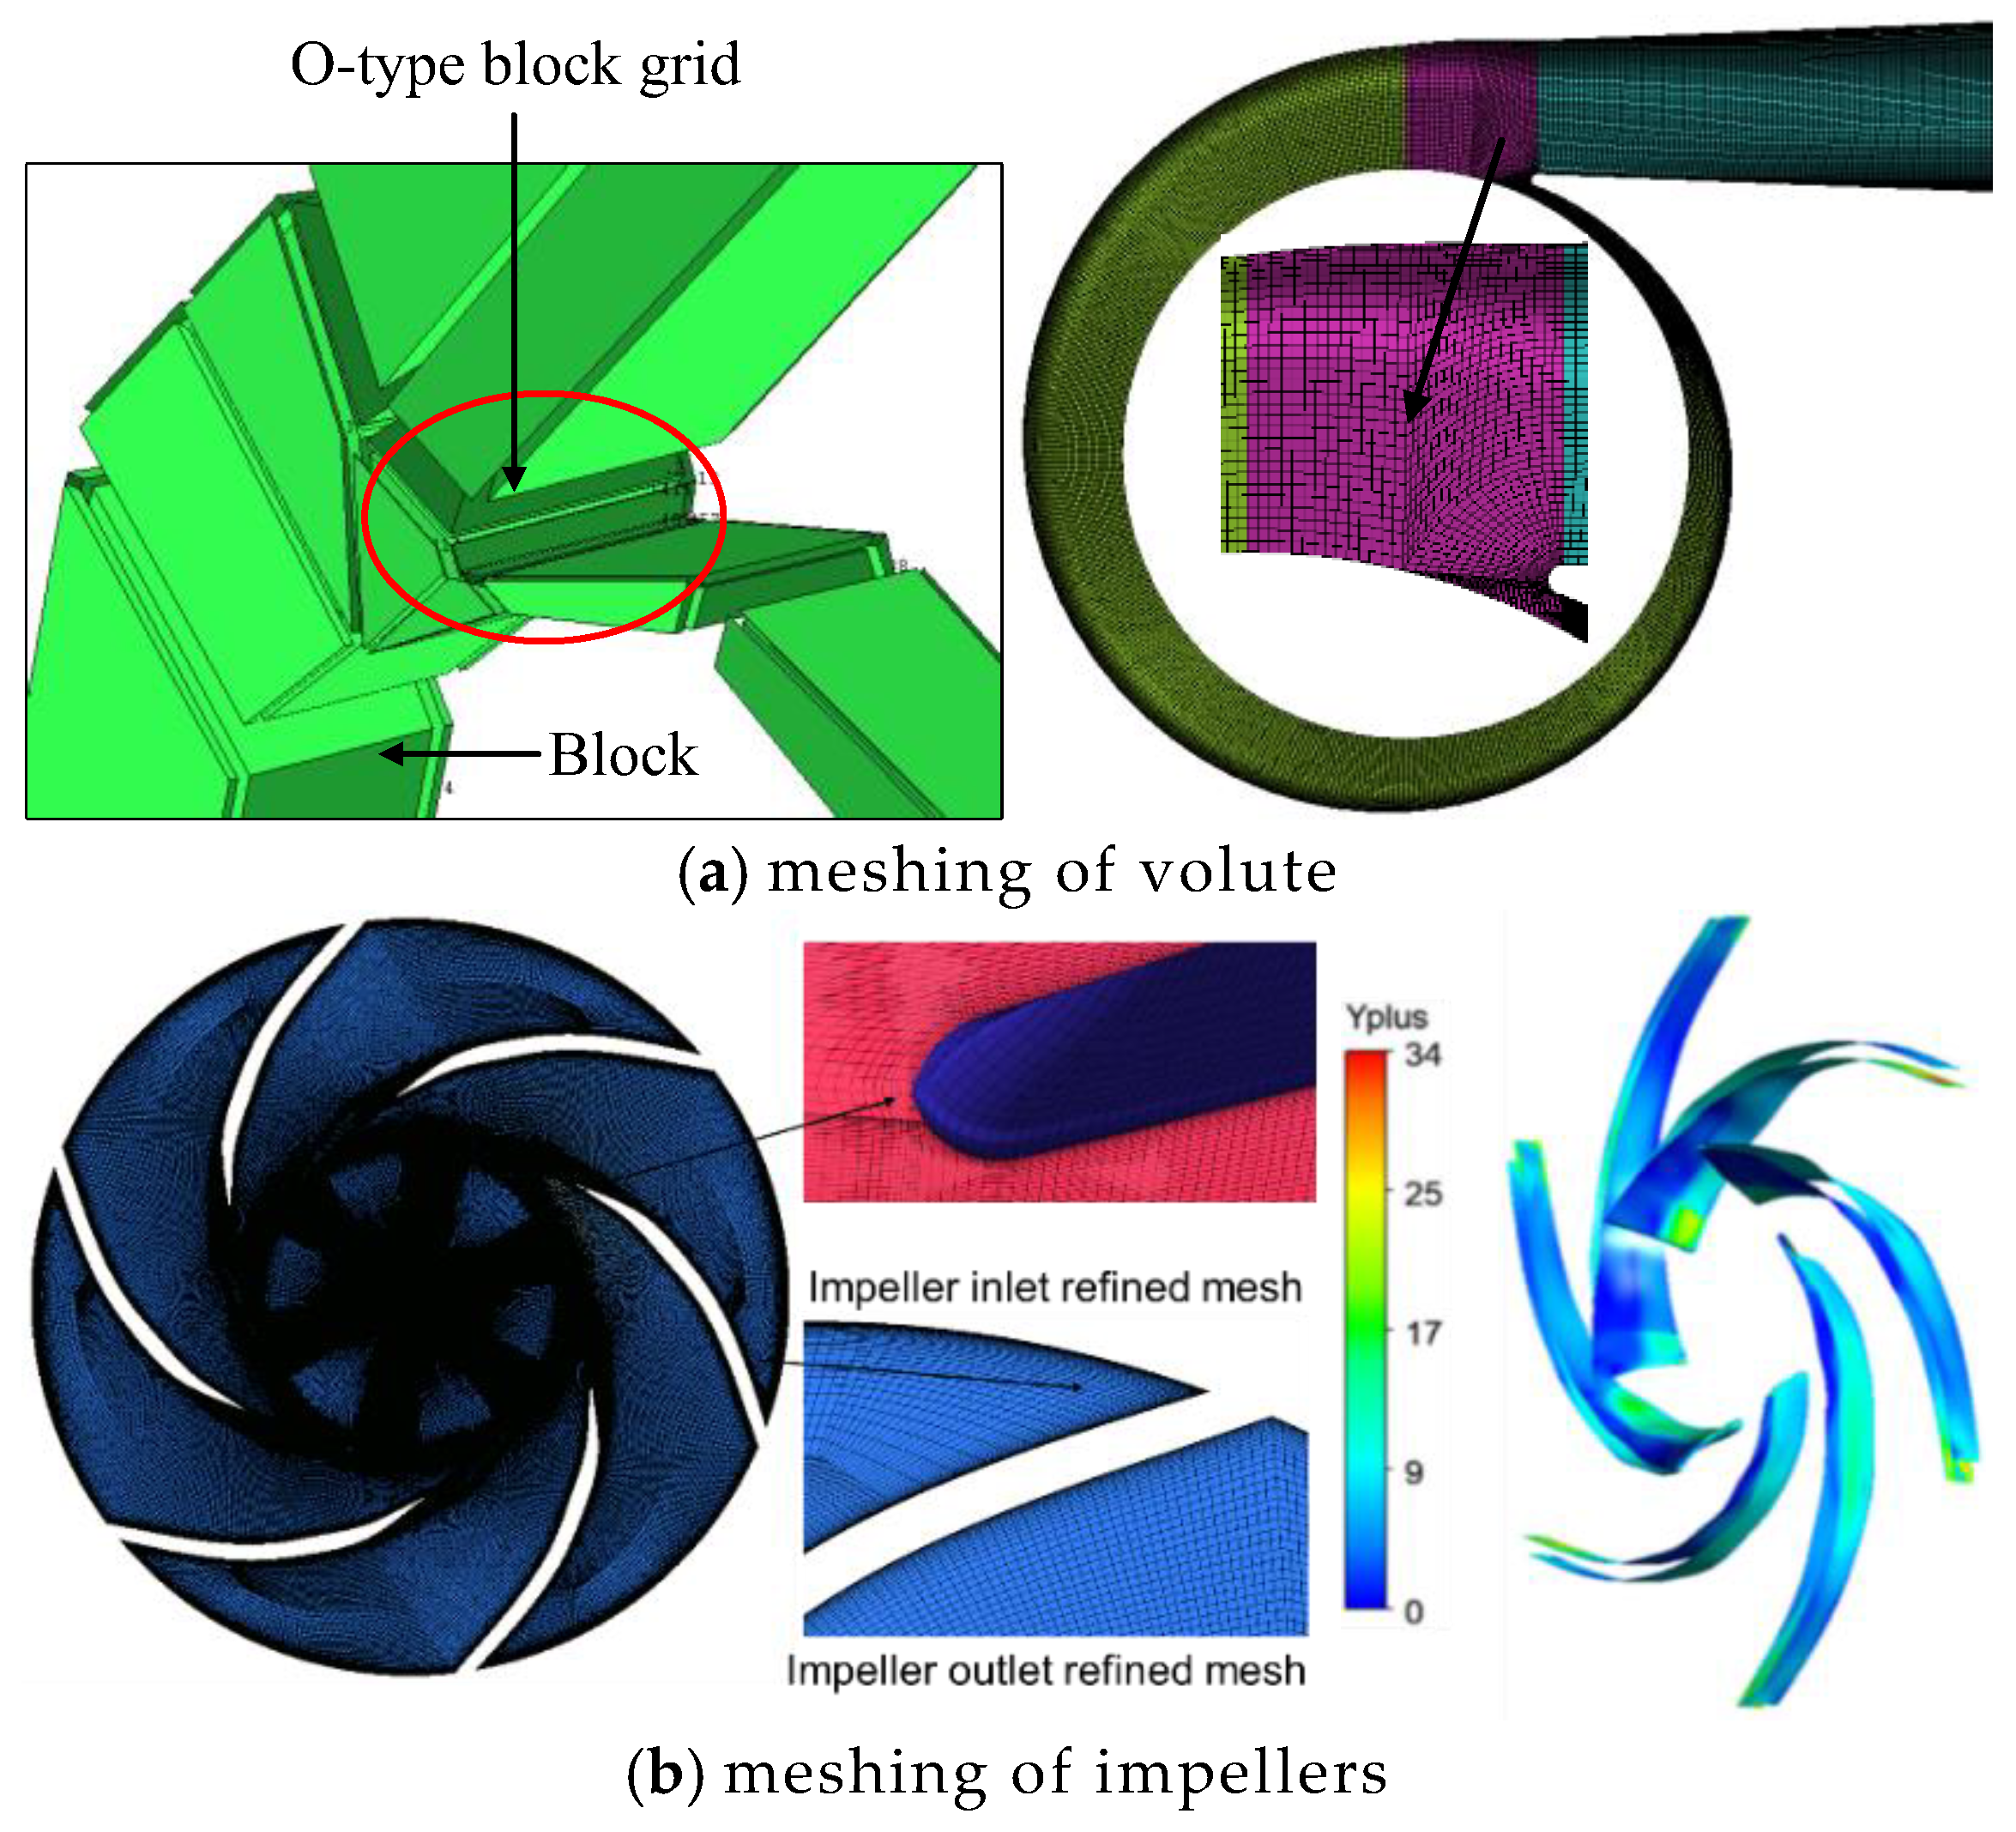
3.2. Meshing Generation

Hexahedral mesh was adopted in this study to partition the main computational domain, mainly because hexahedral mesh has the advantages of fast operation speed and high accuracy [17,18]. Figure 2a shows the division diagram of the volute’s structured mesh; the near-volute-wall surface meshes and the near-volute-tongue meshes were densified [19] to more accurately simulate the fine flow characteristics of the volute solid–liquid wall surface and the very complex flow pattern at the volute tongue. Figure 2b shows a schematic of the impeller’s structured mesh; Y-Block mesh generation was carried out on the sides of the impeller blade’s pressure surface and the region from the blade outlet to the impeller outlet, to improve the mesh quality and calculation accuracy. The thickness of the first layer of mesh on the blade wall was 0.05 mm, with a total of five layers, and a growth ratio of 1.12. A y+ ≤ 50 was guaranteed by a method of local mesh refinement, which provides a prerequisite for the numerical calculation accuracy, and enables the flow pattern near the wall to be captured more accurately [20,21].
The mesh independence of the ERT’s computational domain was studied, to prevent mesh density from affecting the turbine’s performance, during the numerical calculation of the turbine. Seven sets of mesh schemes with different numbers of nodes were generated by increasing the number of nodes of the impeller and volute. Efficiency was selected to verify the effect of mesh independence on the turbine’s performance in this study, because it is an important index for evaluating the comprehensive performance of the ERT. Figure 3 shows that the overall mesh number has little influence on turbine performance, with the maximum error of hydraulic efficiency of the turbine being 0.07% when the mesh number exceeds 9 million. Scheme 4 was finally selected for follow-up numerical calculation, as a characteristic for saving computational resources and reducing computational time.

3.3. Governing Equations and Boundary Conditions

The flow inside fluid machinery is generally considered to be a three-dimensional, viscous, compressible, unsteady flow, without considering the influence of temperature. The Navier–Stokes equation is expressed, in rectangular coordinates, as follows [22,23]:
𝜕 ρ 𝜕 t + 𝜕 𝜕 x i ρ u i = 0
𝜕 𝜕 t ρ u i + 𝜕 𝜕 x j ρ u i u j = 𝜕 p 𝜕 x i + 𝜕 𝜕 x j μ 𝜕 u i 𝜕 x j + 𝜕 u j 𝜕 x i 2 3 δ i j 𝜕 u k 𝜕 x k
where u and p refer to flow rate and pressure, respectively, and t and ρ refer to time and fluid density, respectively. μ refers to dynamic viscosity.
The SST k-ω turbulence model is used to solve the whole flow field, while solving the N-S equation conveniently. The k and ω equations in the SST k-ω equation are as follows:
𝜕 ρ k 𝜕 t + 𝜕 ( ρ u j k ) 𝜕 x j = 𝜕 𝜕 x j μ + μ t σ 3 𝜕 k 𝜕 x j + P K β ρ k ω
𝜕 ρ ω 𝜕 t + 𝜕 ρ u j ω 𝜕 x j = 𝜕 𝜕 x j μ + μ t σ ω 3 𝜕 ω 𝜕 x j + α 3 ω k P k β 3 ρ ω 2 + 2 1 F 1 ρ 1 σ ω 3 ω 𝜕 k 𝜕 x j 𝜕 ω 𝜕 x j
where the model coefficients σk3, σω3, α3, and β3 are linear combinations of k-ω and the corresponding coefficients of the modified k-ω turbulence model.
It is necessary to establish initial conditions and boundary conditions to solve the governing equations of fluid accurately. Whether the initial conditions and boundary conditions are reasonable or not directly determines whether the calculation results of the equations are convergent and accurate or not. In this study, the numerical simulation medium was water at 25 °C, and the boundary conditions of the turbine calculation domain were set as follows: the inlet boundary condition was set as a 1 atm pressure inlet, and the outlet boundary condition was set as the mass-flow boundary condition, which the varies according to the flow under different conditions. In addition, the solid wall adopted was a non-slip wall; a static domain was used, except for in the calculation domain of the walls of the impeller’s front and back shrouds; and the impeller calculation domain was set as the rotation domain. The roughness was set to 50 μm for the impeller and for near the impeller’s front and back shroud walls. The automatic wall function was used in the near-wall domain, and the interface boundary condition was used in the wall with data transmission. The governing equations were discretized by the finite volume method, and the second-order upwind scheme was used for the convection term. The convergence accuracy was set so that all the residual values were less than 10−5.

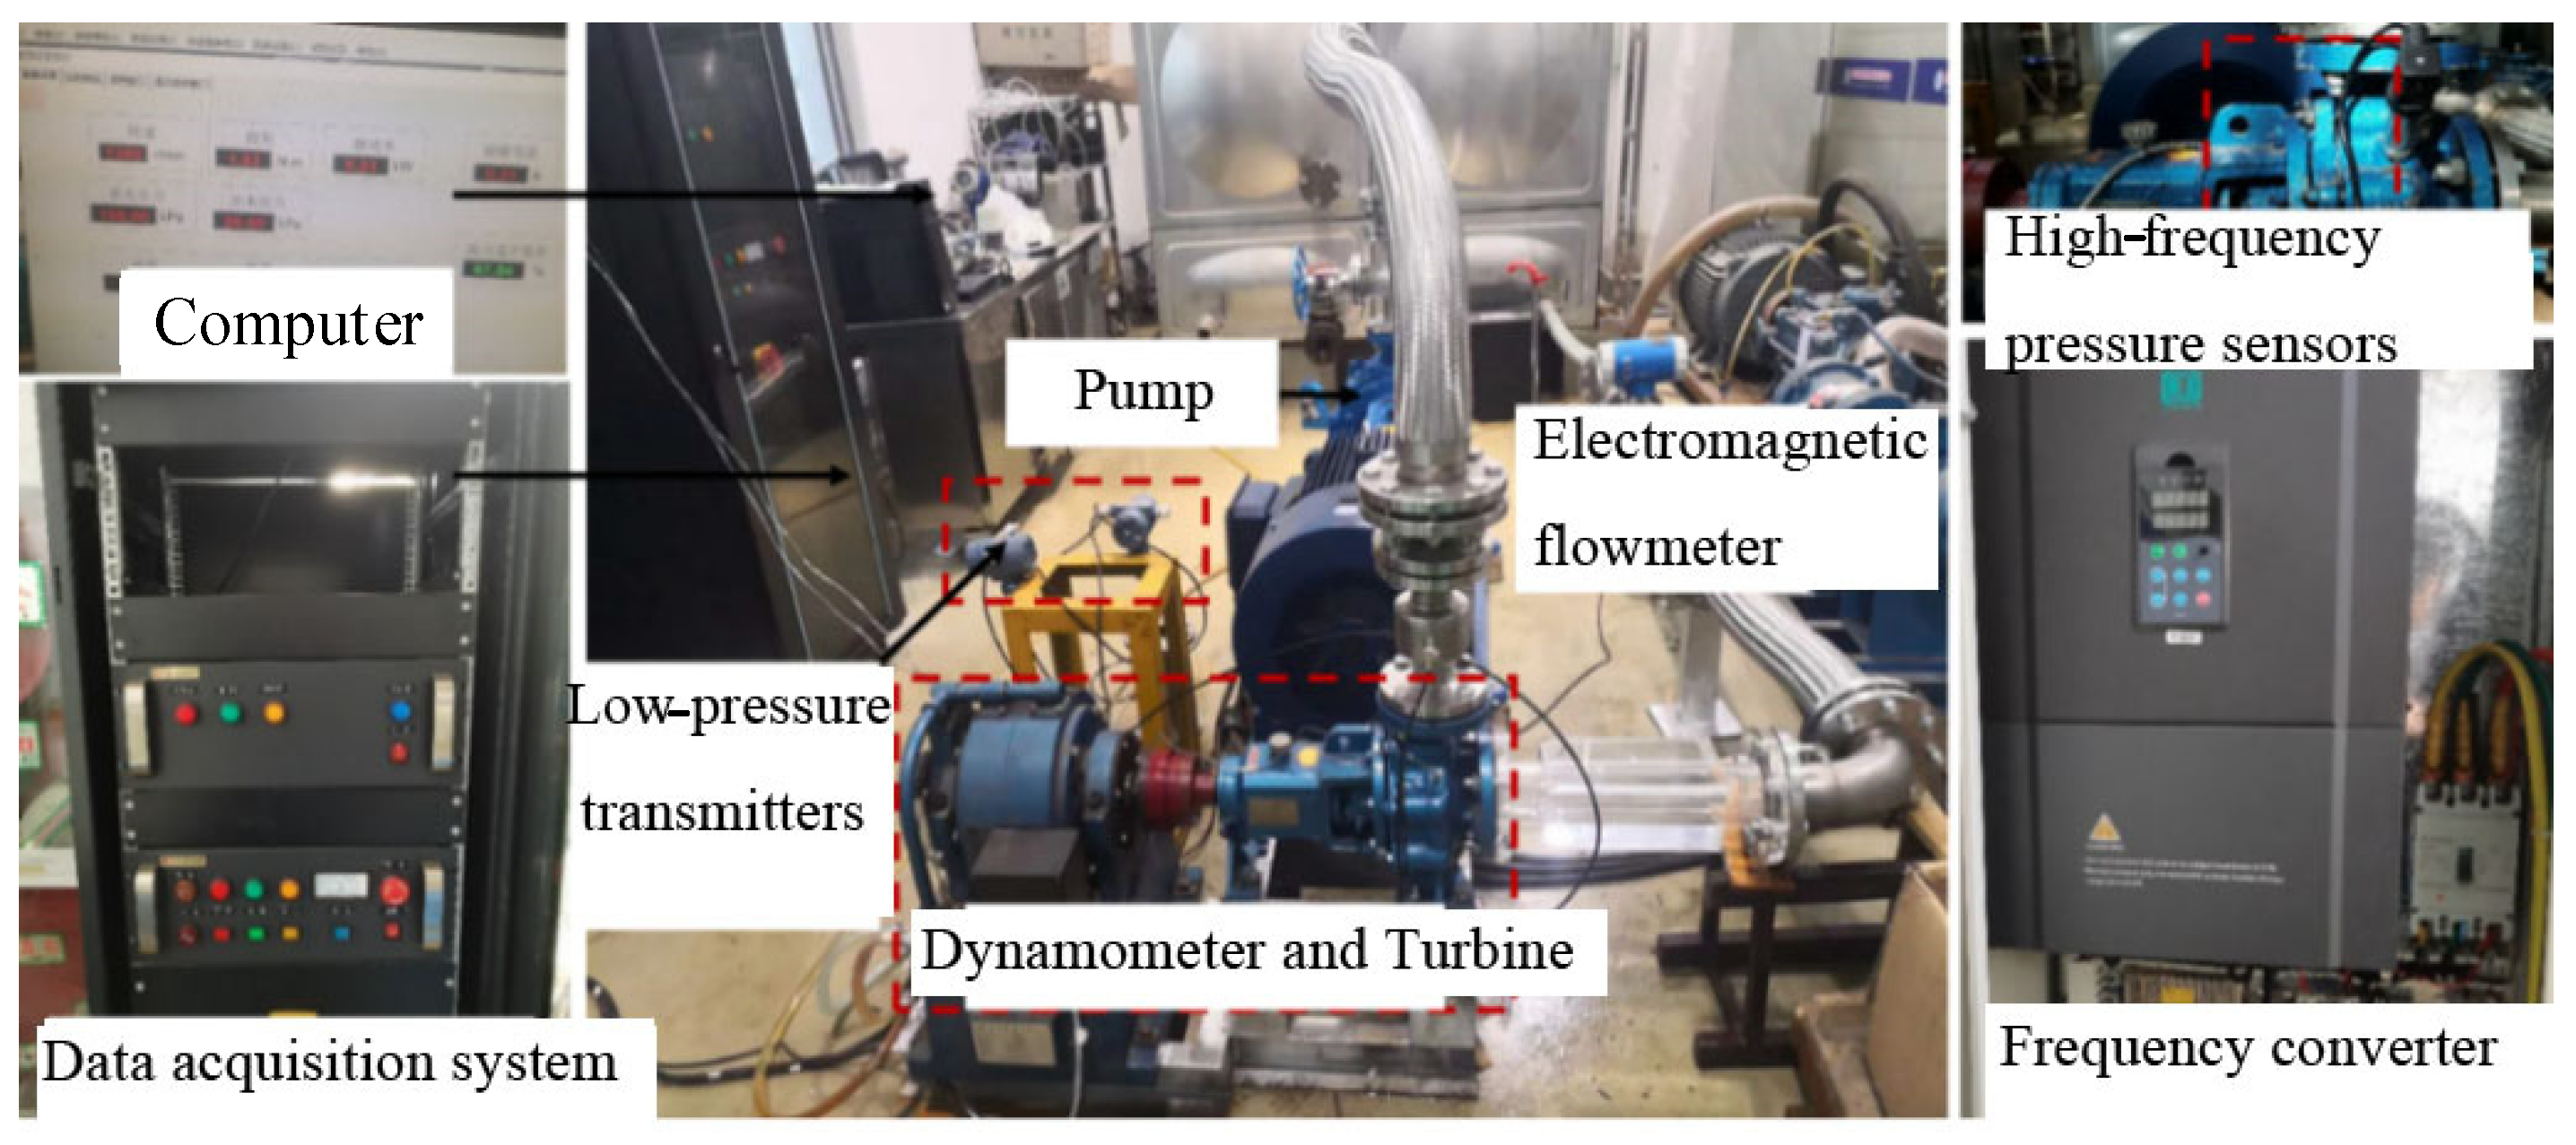
3.4. Performance Test System of ERT

Figure 4 shows the turbine performance test platform that was built. The system mainly includes a water tank, valve, motor, frequency converter, booster pump, PAT, dynamometer, pressure sensor, electromagnetic flowmeter, computer, and pipeline. In order to measure the hydraulic performance and pressure pulsations of the ERT under multiple conditions, test and control systems which complement each other are very important equipment. Figure 5 shows the main control and measuring equipment, in which the frequency converter is connected with the motor in the system, and the booster pump obtains different flows and speeds by controlling the output frequency of the frequency converter, thus controlling the flow and pressure.
An electromagnetic flowmeter and low- and high-frequency pressure sensors were the main testing equipment used. Table 2 shows the range and measurement errors of the main measurement and control equipment. The sensors in this paper are used in conjunction with a data acquisition card, and the acquisition card is connected with the internal data acquisition program of the computer to form a data acquisition system.

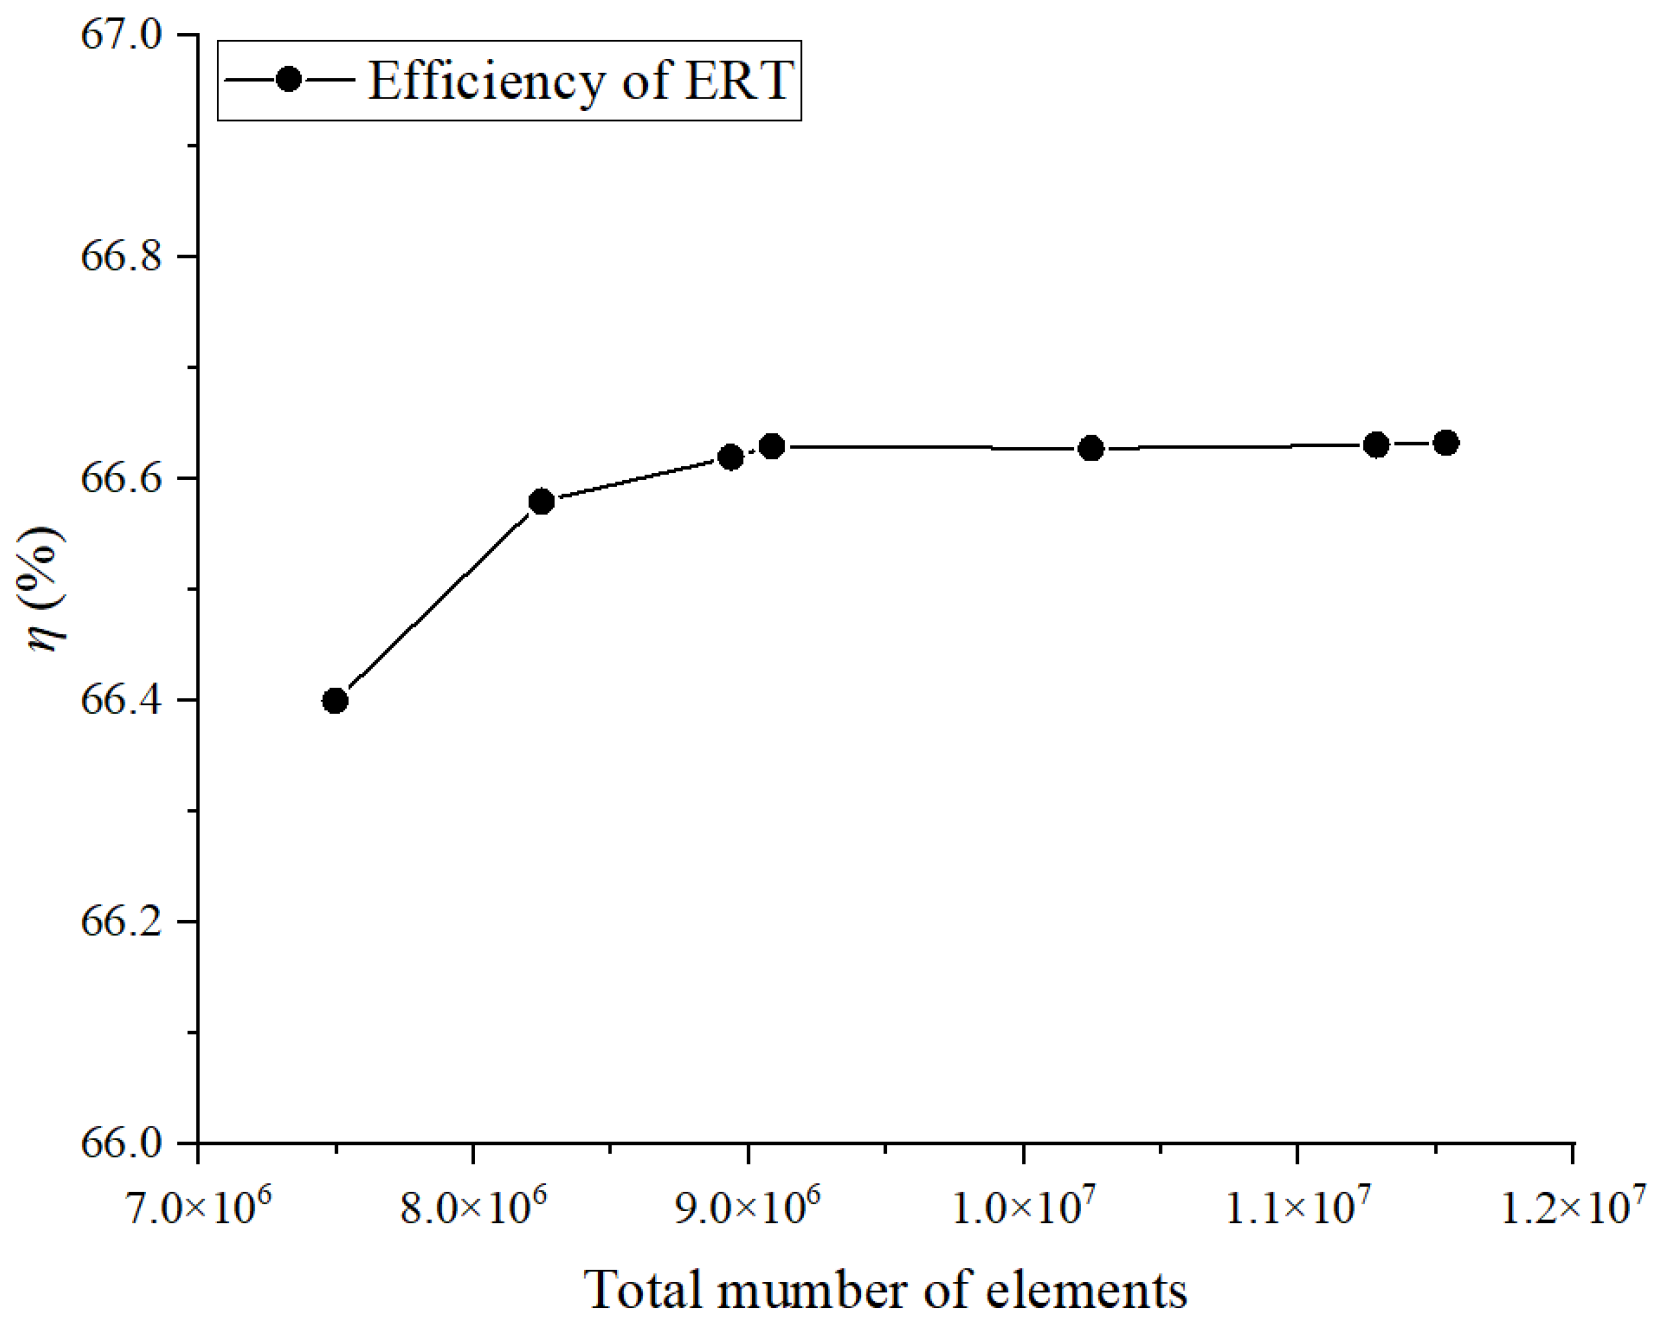
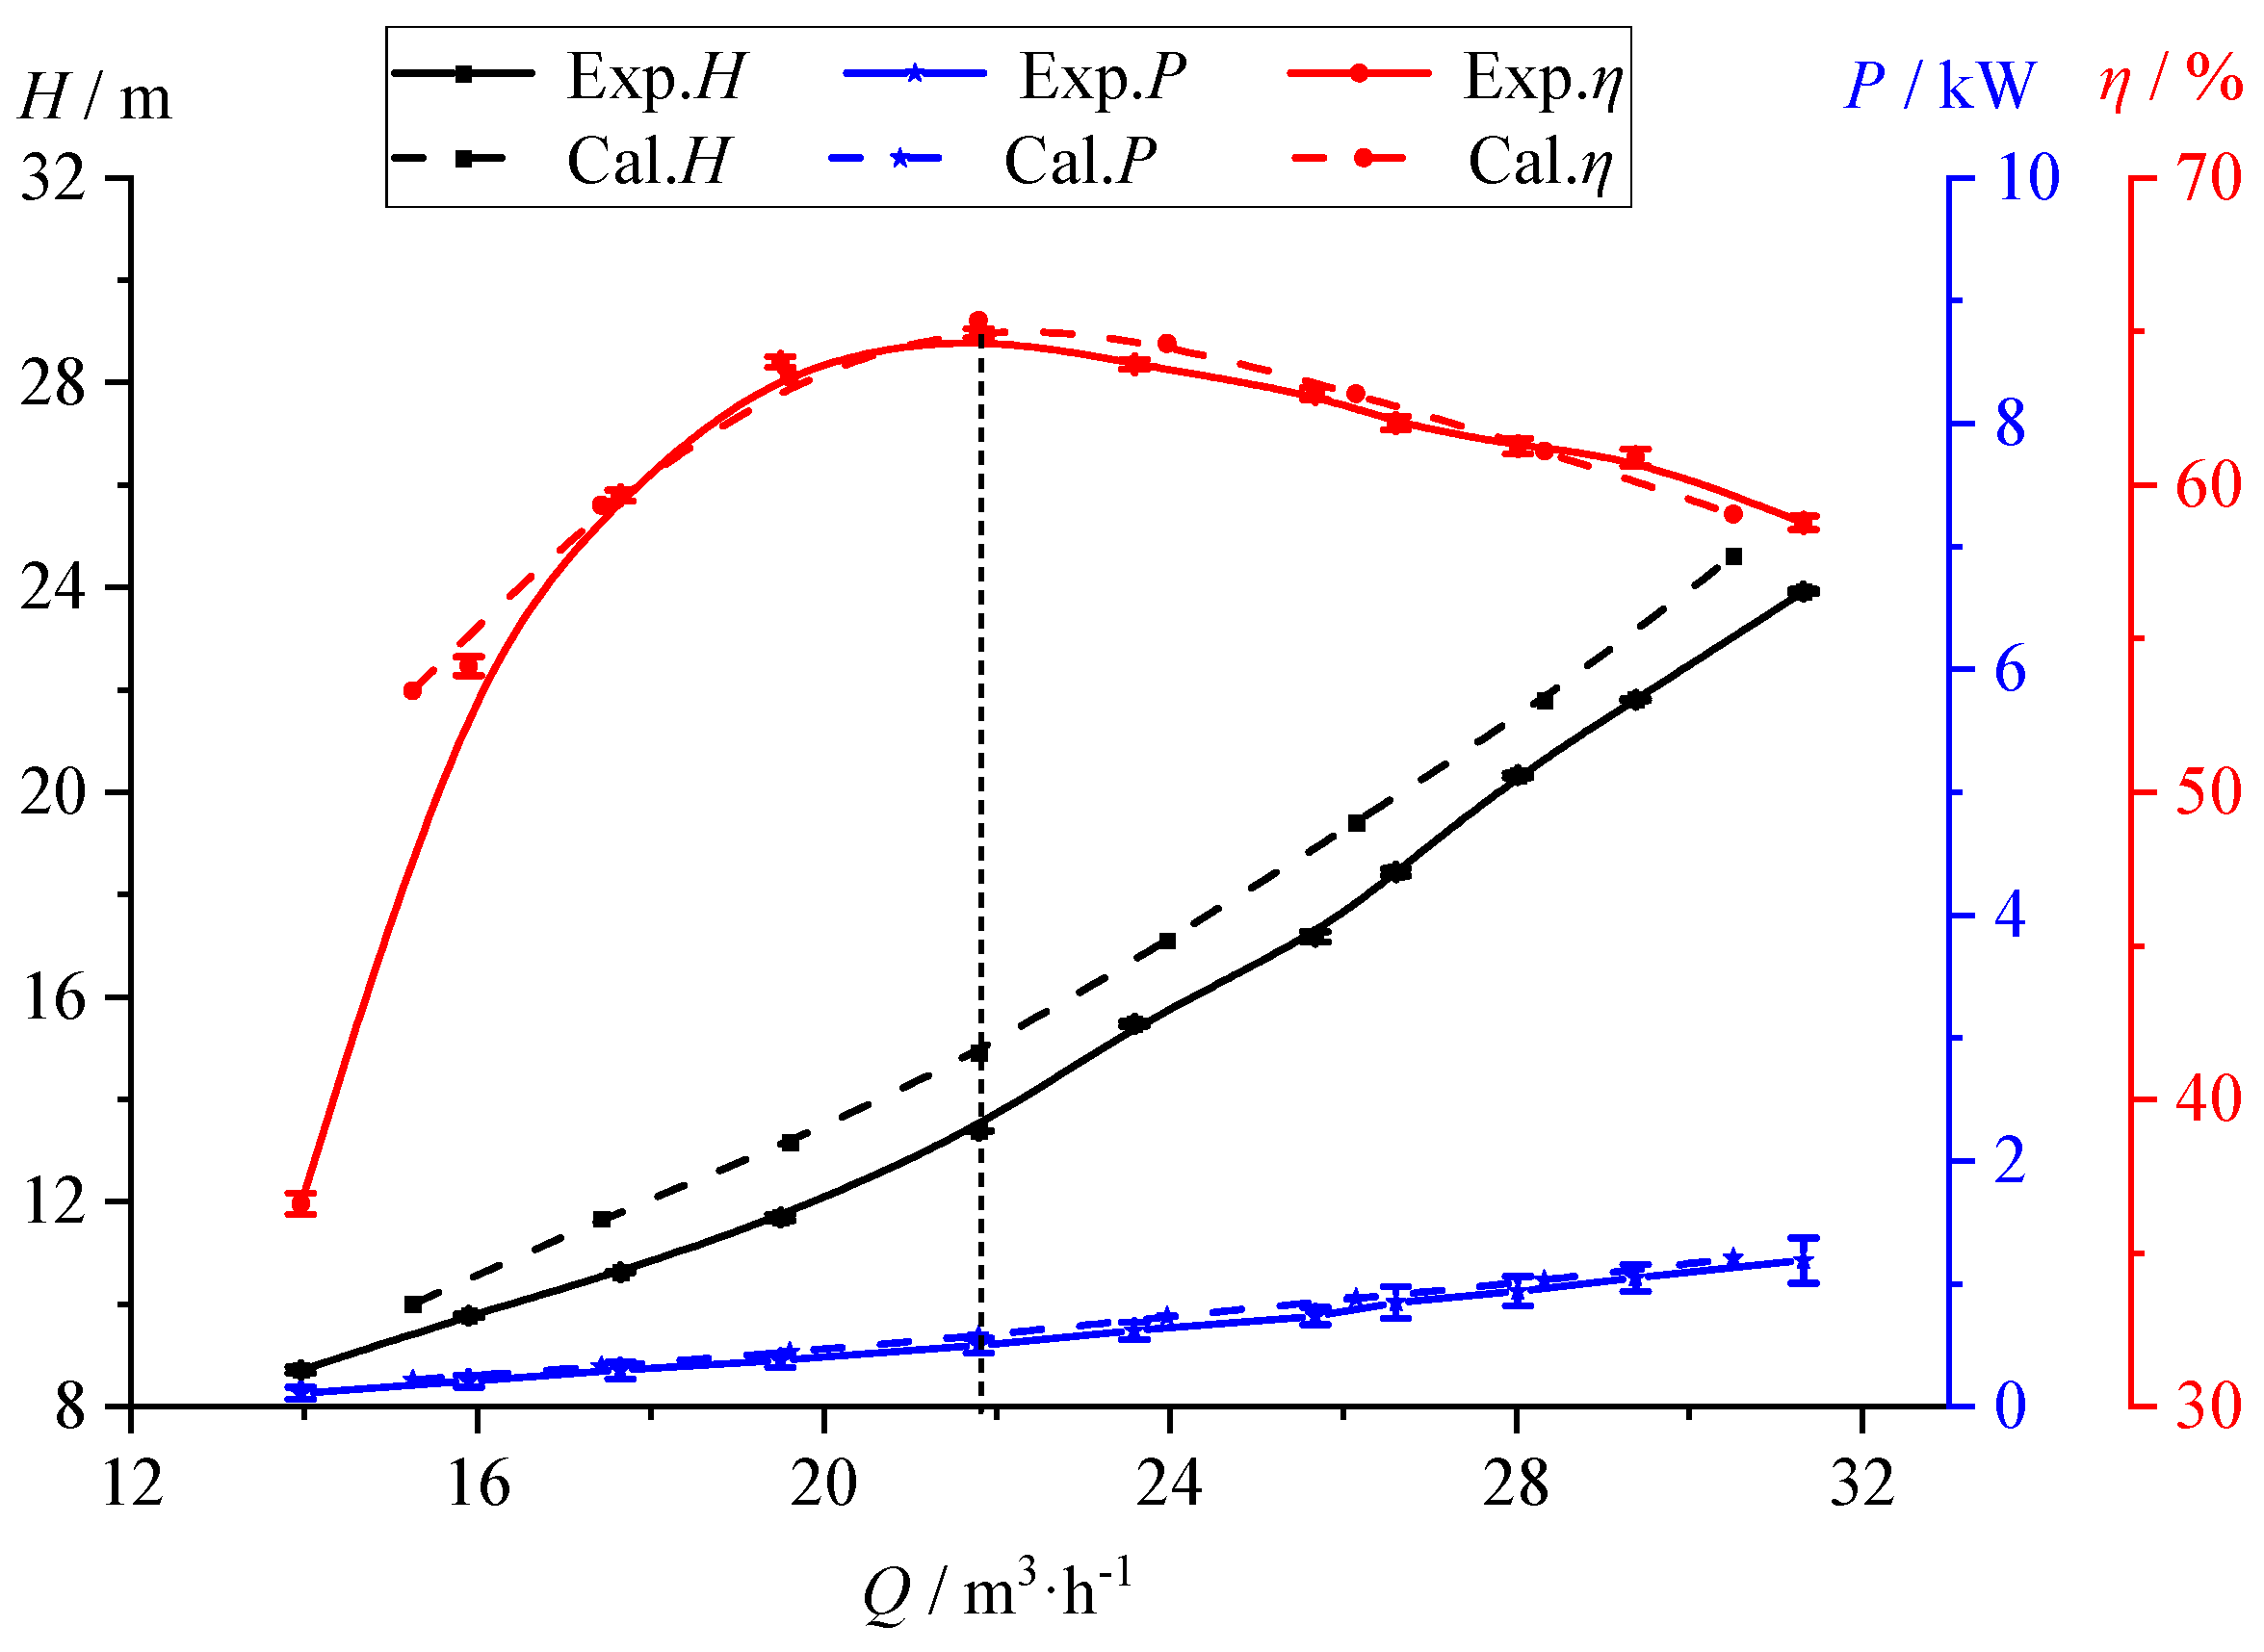
3.5. Numerical Verification

PAT performance parameters include head, shaft power, and efficiency. Equations (7)–(9) give the equations for calculating the head H, shaft power P, and efficiency η of the PAT, respectively.
H = P inlet P outlet ρ g
P = M 2 π n 60
η = P ρ g Q H × 100 %
In these equations, Pinlet and Poutlet refer to the total pressure of the turbine inlet and outlet of the pump, respectively. M refers to the torque of the turbine. n refers to the speed of the turbine. Q refers to the flow rate of the turbine. Figure 6 shows a comparison between the experimental and numerical results of the ERT. The results show that the changing trend of the numerical calculation of the performance of the turbine is basically consistent with the experimental results. On the one hand, the gap may be due to some errors in the calculation and experimental model; on the other hand, it may be due to the friction and volume loss in the experiment and test. However, the overall error ratio between the numerical calculation and the experiment is small, with the relative error of efficiency being 0.07% in the design condition and 4.3% in the off-design condition. Therefore, through the comparison of the experimental and numerical results in this section, it is considered that the meshing and numerical calculation scheme adopted in this paper is reasonable.

4. Results: Analysis and Discussion

4.1. Steady Characteristics of ERT Under Multiple Conditions

The internal flow characteristics of the turbine under multiple conditions were studied to gain an understanding of the variation mechanism of the external characteristic curve of the turbine. Figure 7 shows the turbulent kinetic energy-streamline distribution of the volute tongue; and the turbulent kinetic energy is the largest at the tongue so that the energy loss in the volute is mainly concentrated in the tongue. With an increase in the flow rate, the turbulent kinetic energy at the tongue increases. From the point of view of the streamline distribution, there is a confluence between the inlet flow of the volute and the flow in the annular channel, and separation occurs near the tongue. With an increase in the flow rate, there is a separation vortex on the tongue wall, and the impact of the two incoming flows is enhanced.
Figure 8 shows the velocity-streamline distribution in the partial flow passage of the impeller. There is a phenomenon of flow separation on the suction surface of the blade’s trailing edge under the 0.8Qd condition. The flow pattern of the blade’s trailing edge is improved, the interaction between the fluid and the blade is weak, and the energy loss is very low under the 1.0Qd condition. There are vortices on the inlet pressure surface and the blade suction surface; the vortex on the pressure surface is caused by the impact between the fluid and the blade, and the vortex on the suction surface is caused by the separation of the fluid. The energy loss is mainly concentrated in the transitions of the impeller from the blade’s trailing edge to the blade’s front edge, with the increase in the flow rate. The greater the flow rate, the greater the separation loss on the blade’s suction surface.
The velocity triangle of the blade inlet was studied in order to further investigate the root cause of energy loss in the impeller. Figure 9 shows the velocity triangle of the blade inlet, in which βb is the blade’s settle angle, and β1′, β1, and β1″ are the average relative flow angles of the blade inlet under 0.8Qd, 1.0Qd, and 1.2Qd conditions, respectively. The blade’s relative flow angle β1′ is less than the blade’s placement angle under the 0.8Qd condition. The blade’s average relative flow angle is larger than the blade’s settle angle under both the 1.0Qd and the 1.2Qd conditions. There is a little difference between the blade inlet’s relative flow angle and the blade’s settle angle under the 1.0Qd condition. This shows that the matching of the blade inlet’s relative liquid flow angle and the blade’s settle angle has an important influence on the internal flow pattern of the turbine. The greater the flow rate, the larger the relative liquid flow angle is in comparison to the blade’s settle angle, and the impact loss at the blade inlet’s pressure surface and the separation loss at the suction surface gradually increase.

4.2. Pressure Fluctuation Characteristics in ERT Under Multiple Conditions

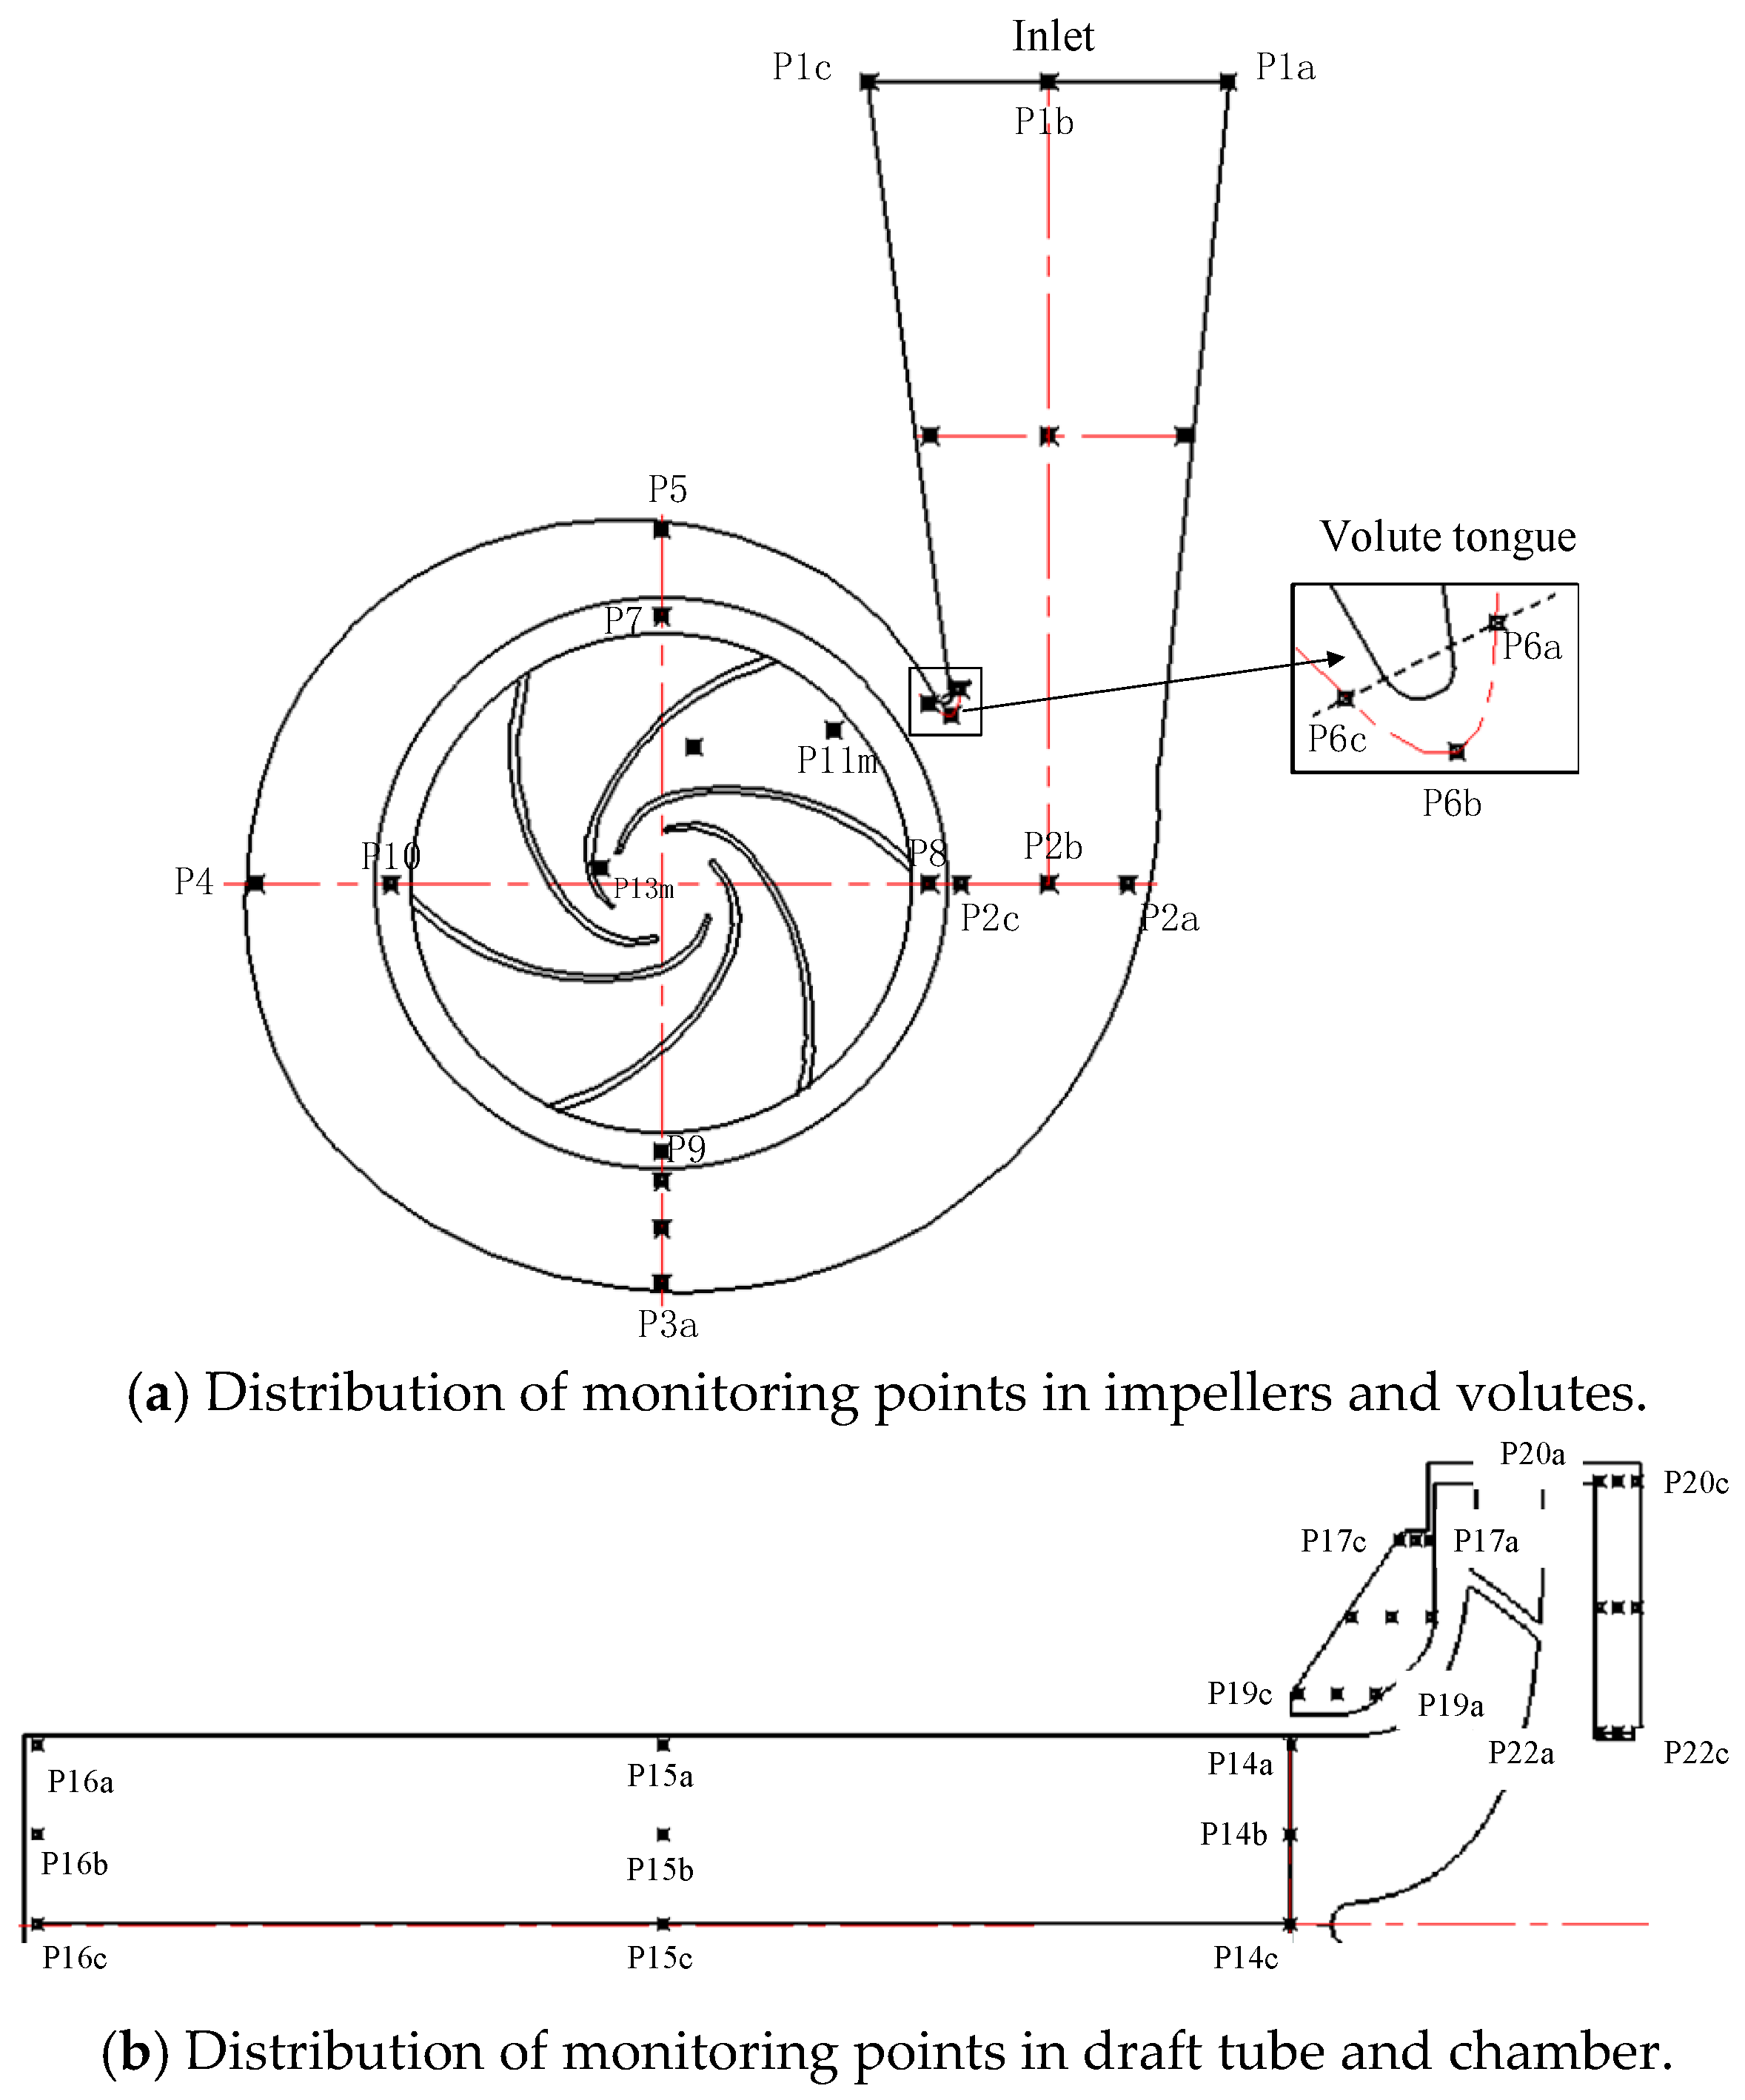
4.2.1. Monitoring Point Setting

The purpose of this paper is to study the distribution of pressure pulsation in the radial, axial, and circumferential directions of the turbine’s components. Desired monitoring points were set at different locations of the turbine’s components, and the monitoring points were selected as shown in Figure 10.
In this paper, the dimensionless coefficient of pressure fluctuation is defined as Cp, and its calculation equation is as follows:
p ¯ n o d e = 1 N j = 0 N 1 p n o d e , t 0 + j Δ t
C p = p ( n o d e ) p ¯ ( n o d e ) 1 2 ρ u 1 2
In the above equation, p ¯ ( n o d e ) refers to the time-averaged pressure of the monitoring point during the calculation period, node represents the mesh node, p(node) refers to the transient pressure of the monitoring point, and u1 refers to the circumferential velocity of the inlet of the turbine impeller.

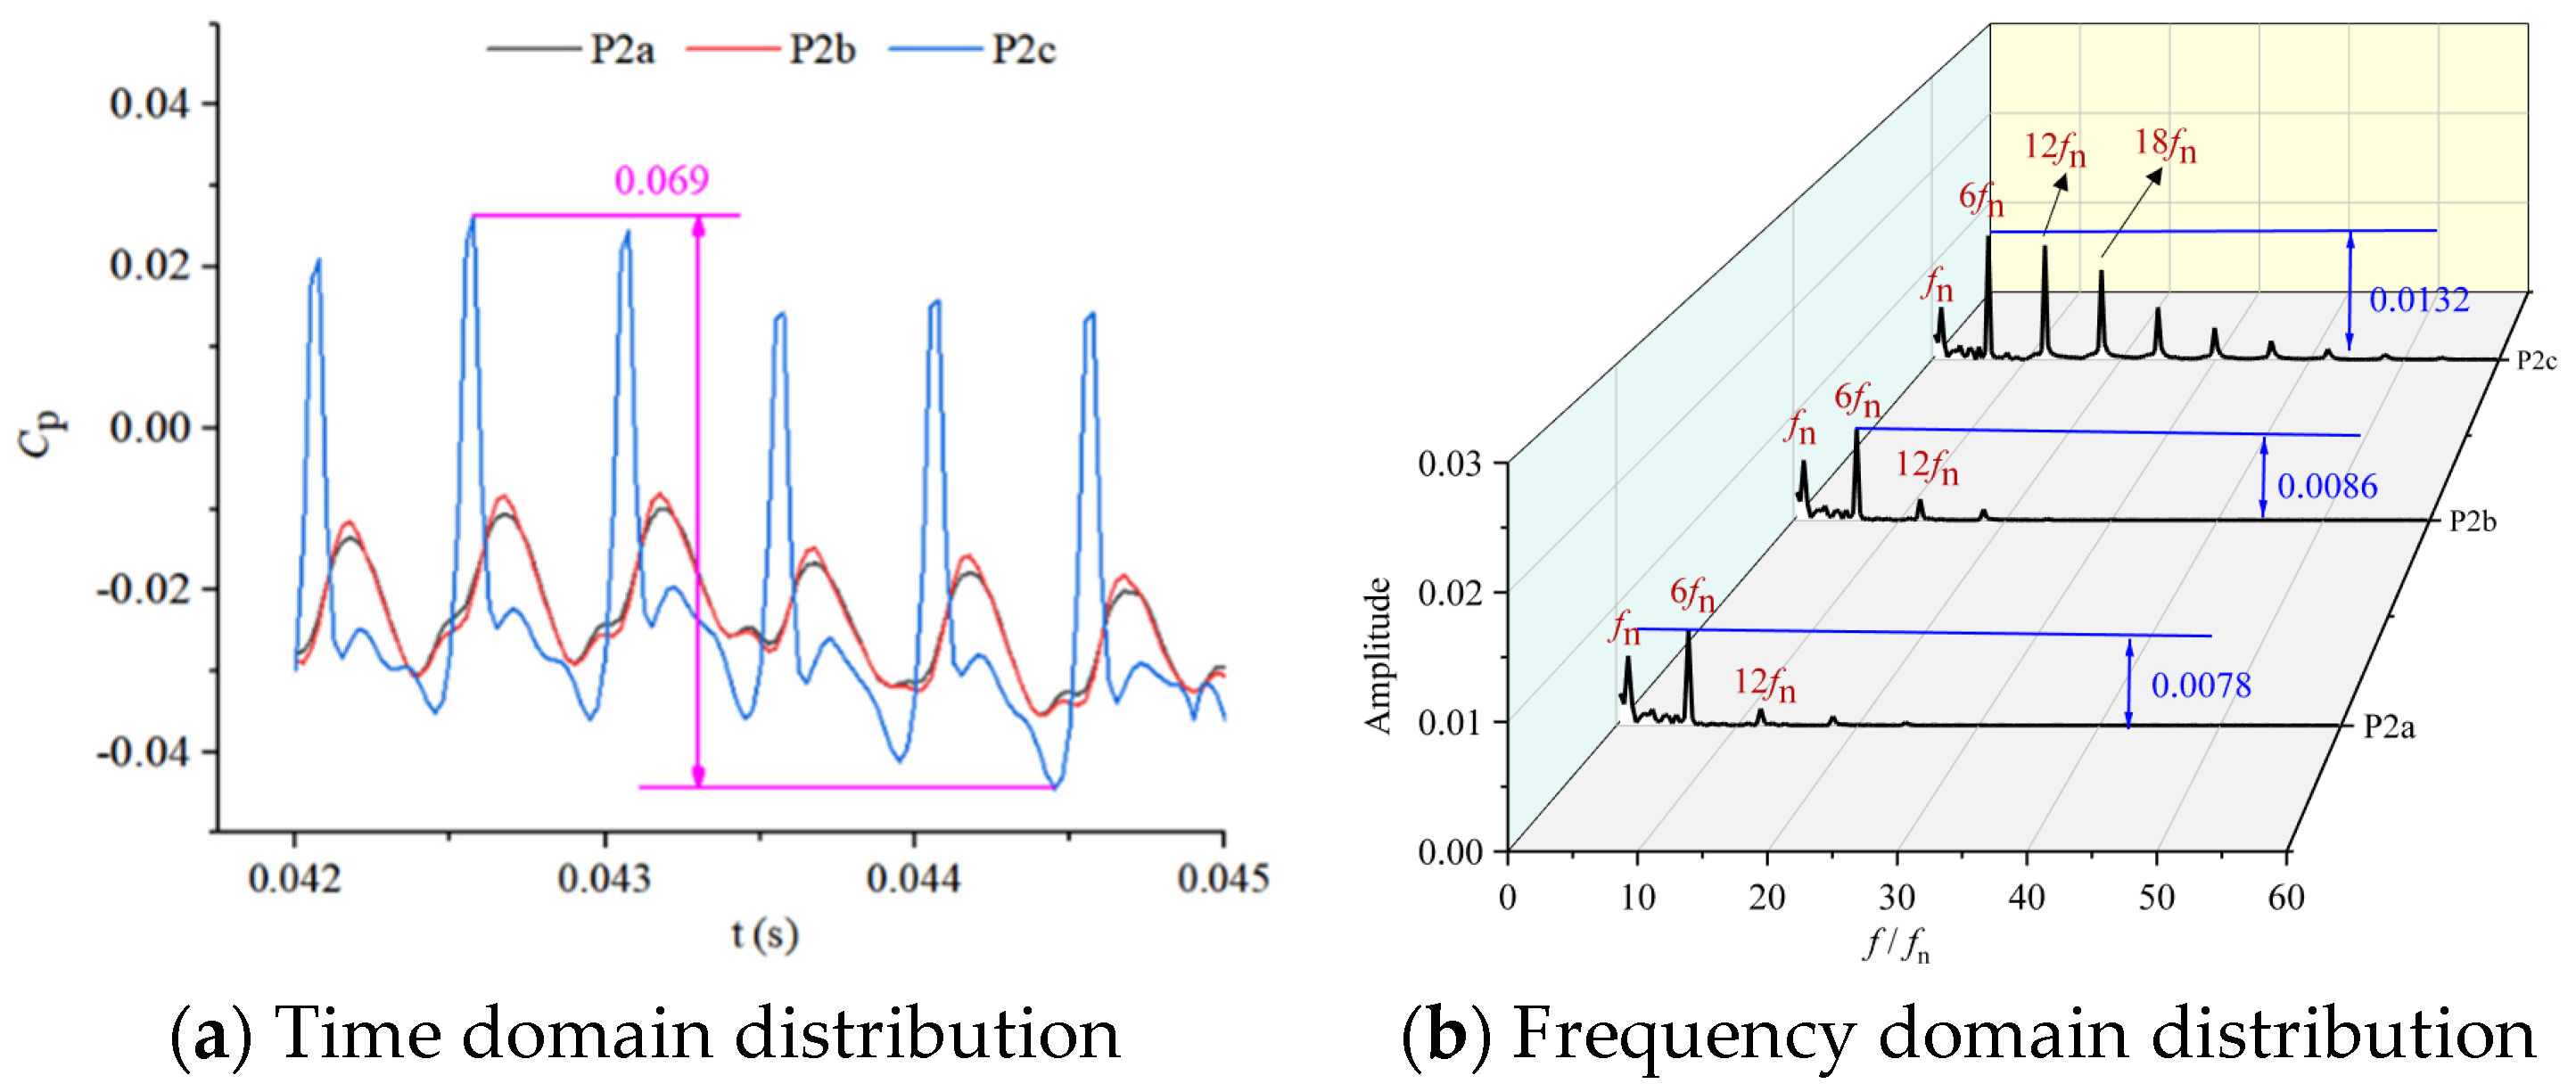
4.2.2. Radial Pressure Fluctuation of Volute

Figure 11 shows the pressure fluctuation characteristics of the volute along the radius. Figure 11a shows the time domain diagrams of monitoring points P2a, P2b, and P2c, respectively. The fluctuation characteristics of monitoring points P2a and P2b are similar. The fluctuation of P2c at the monitoring point is relatively violent, and the fluctuation range is large, with the maximum fluctuation amplitude reaching 0.069. Figure 11b shows the frequency domain diagram of monitoring points P2a, P2b, and P2c. The fluctuations of the three monitoring points are mainly low-frequency pulsations. The frequencies with large amplitude fluctuations are mainly concentrated at the blade frequency and its frequency doubling, in which the amplitude at the blade frequency is the largest, and the amplitude at the frequency doubling decreases. The amplitudes at the blade frequencies of monitoring points P2a, P2b, and P2c are 0.0078, 0.0086, and 0.0132, respectively. This shows that the amplitude in the volute increases gradually along the direction of decreasing radius; the closer to the impeller inlet, the more intense the pressure pulsation, and the larger the fluctuation amplitude.
Figure 12 shows the time–frequency characteristics of pressure pulsation in the impeller’s flow passage. Figure 12a shows the time domain diagram of monitoring points P11m, P12m, and P13m from the inlet to the outlet of the impeller’s middle flow passage. The pressure fluctuation amplitude at the inlet, P11m, and the middle, P12m, of the impeller is relatively large, and maximum value is 0.0188, while the pressure fluctuation amplitude at the outlet, P13m, of the impeller is relatively small. Figure 12b shows the frequency domain characteristics of three monitoring points. It shows that the pressure pulsation in the impeller is mainly low-frequency pulsation. The pulsation amplitude at the axial frequency is the largest, and the amplitude at the frequency doubling gradually decreases. The pulsation from the impeller inlet to the middle is relatively strong, while the pulsation at the exit is weaker. This shows that the pressure pulsation in the impeller is mainly low-frequency pulsation, and the pressure pulsation at the inlet and middle of the impeller is strong. The pulsation amplitude weakens when the fluid flows to the outlet.

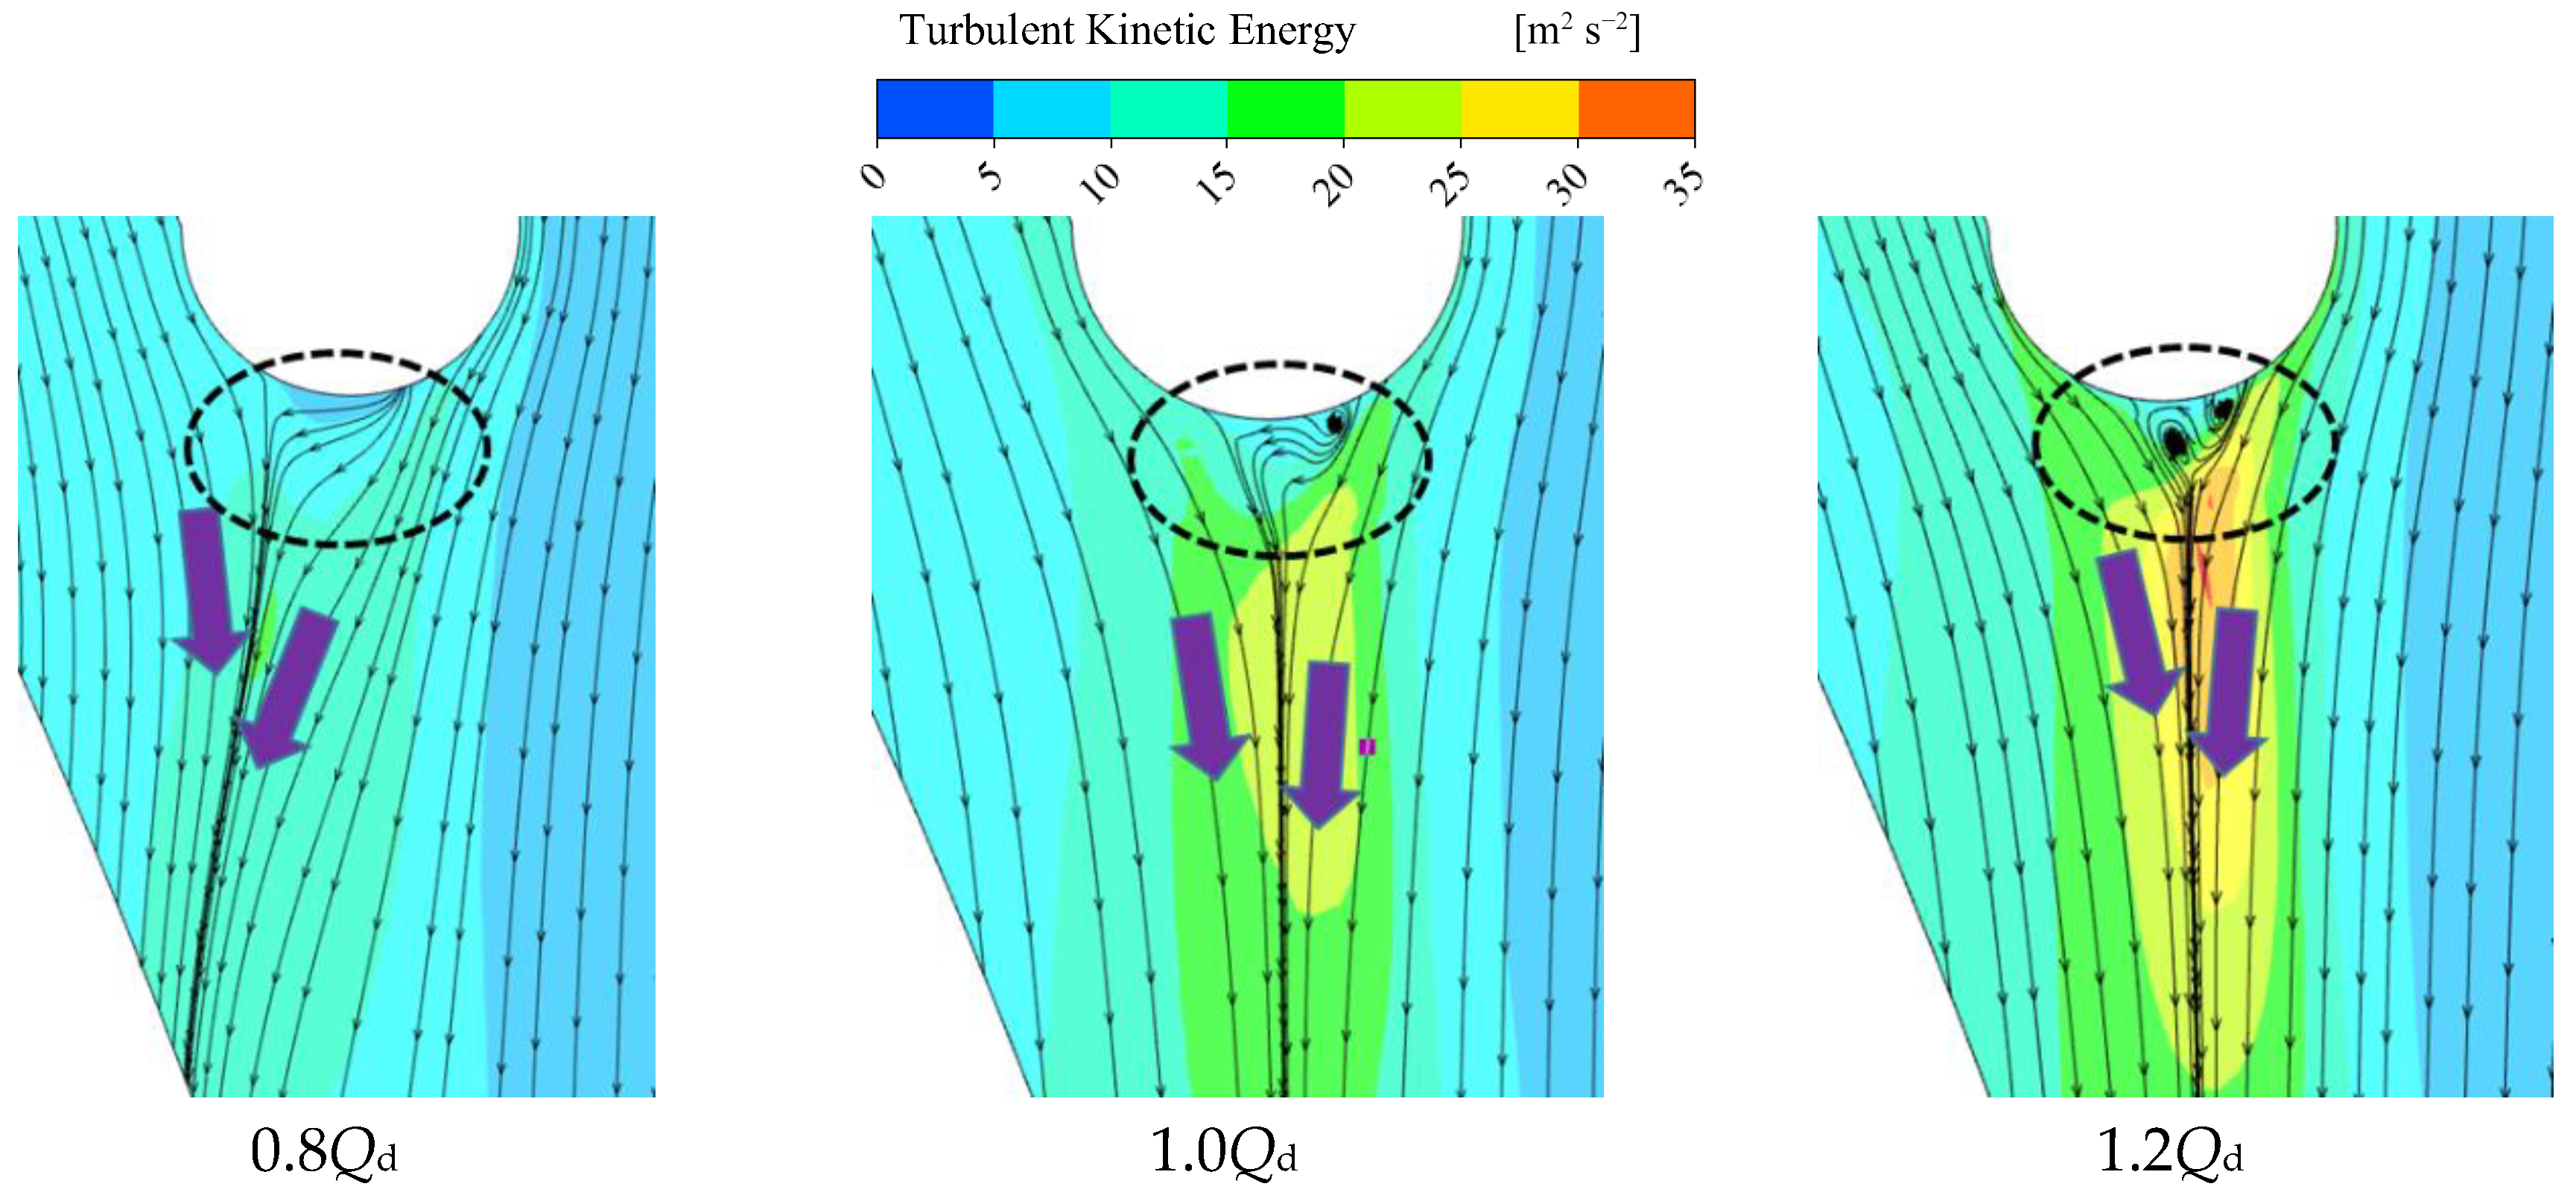
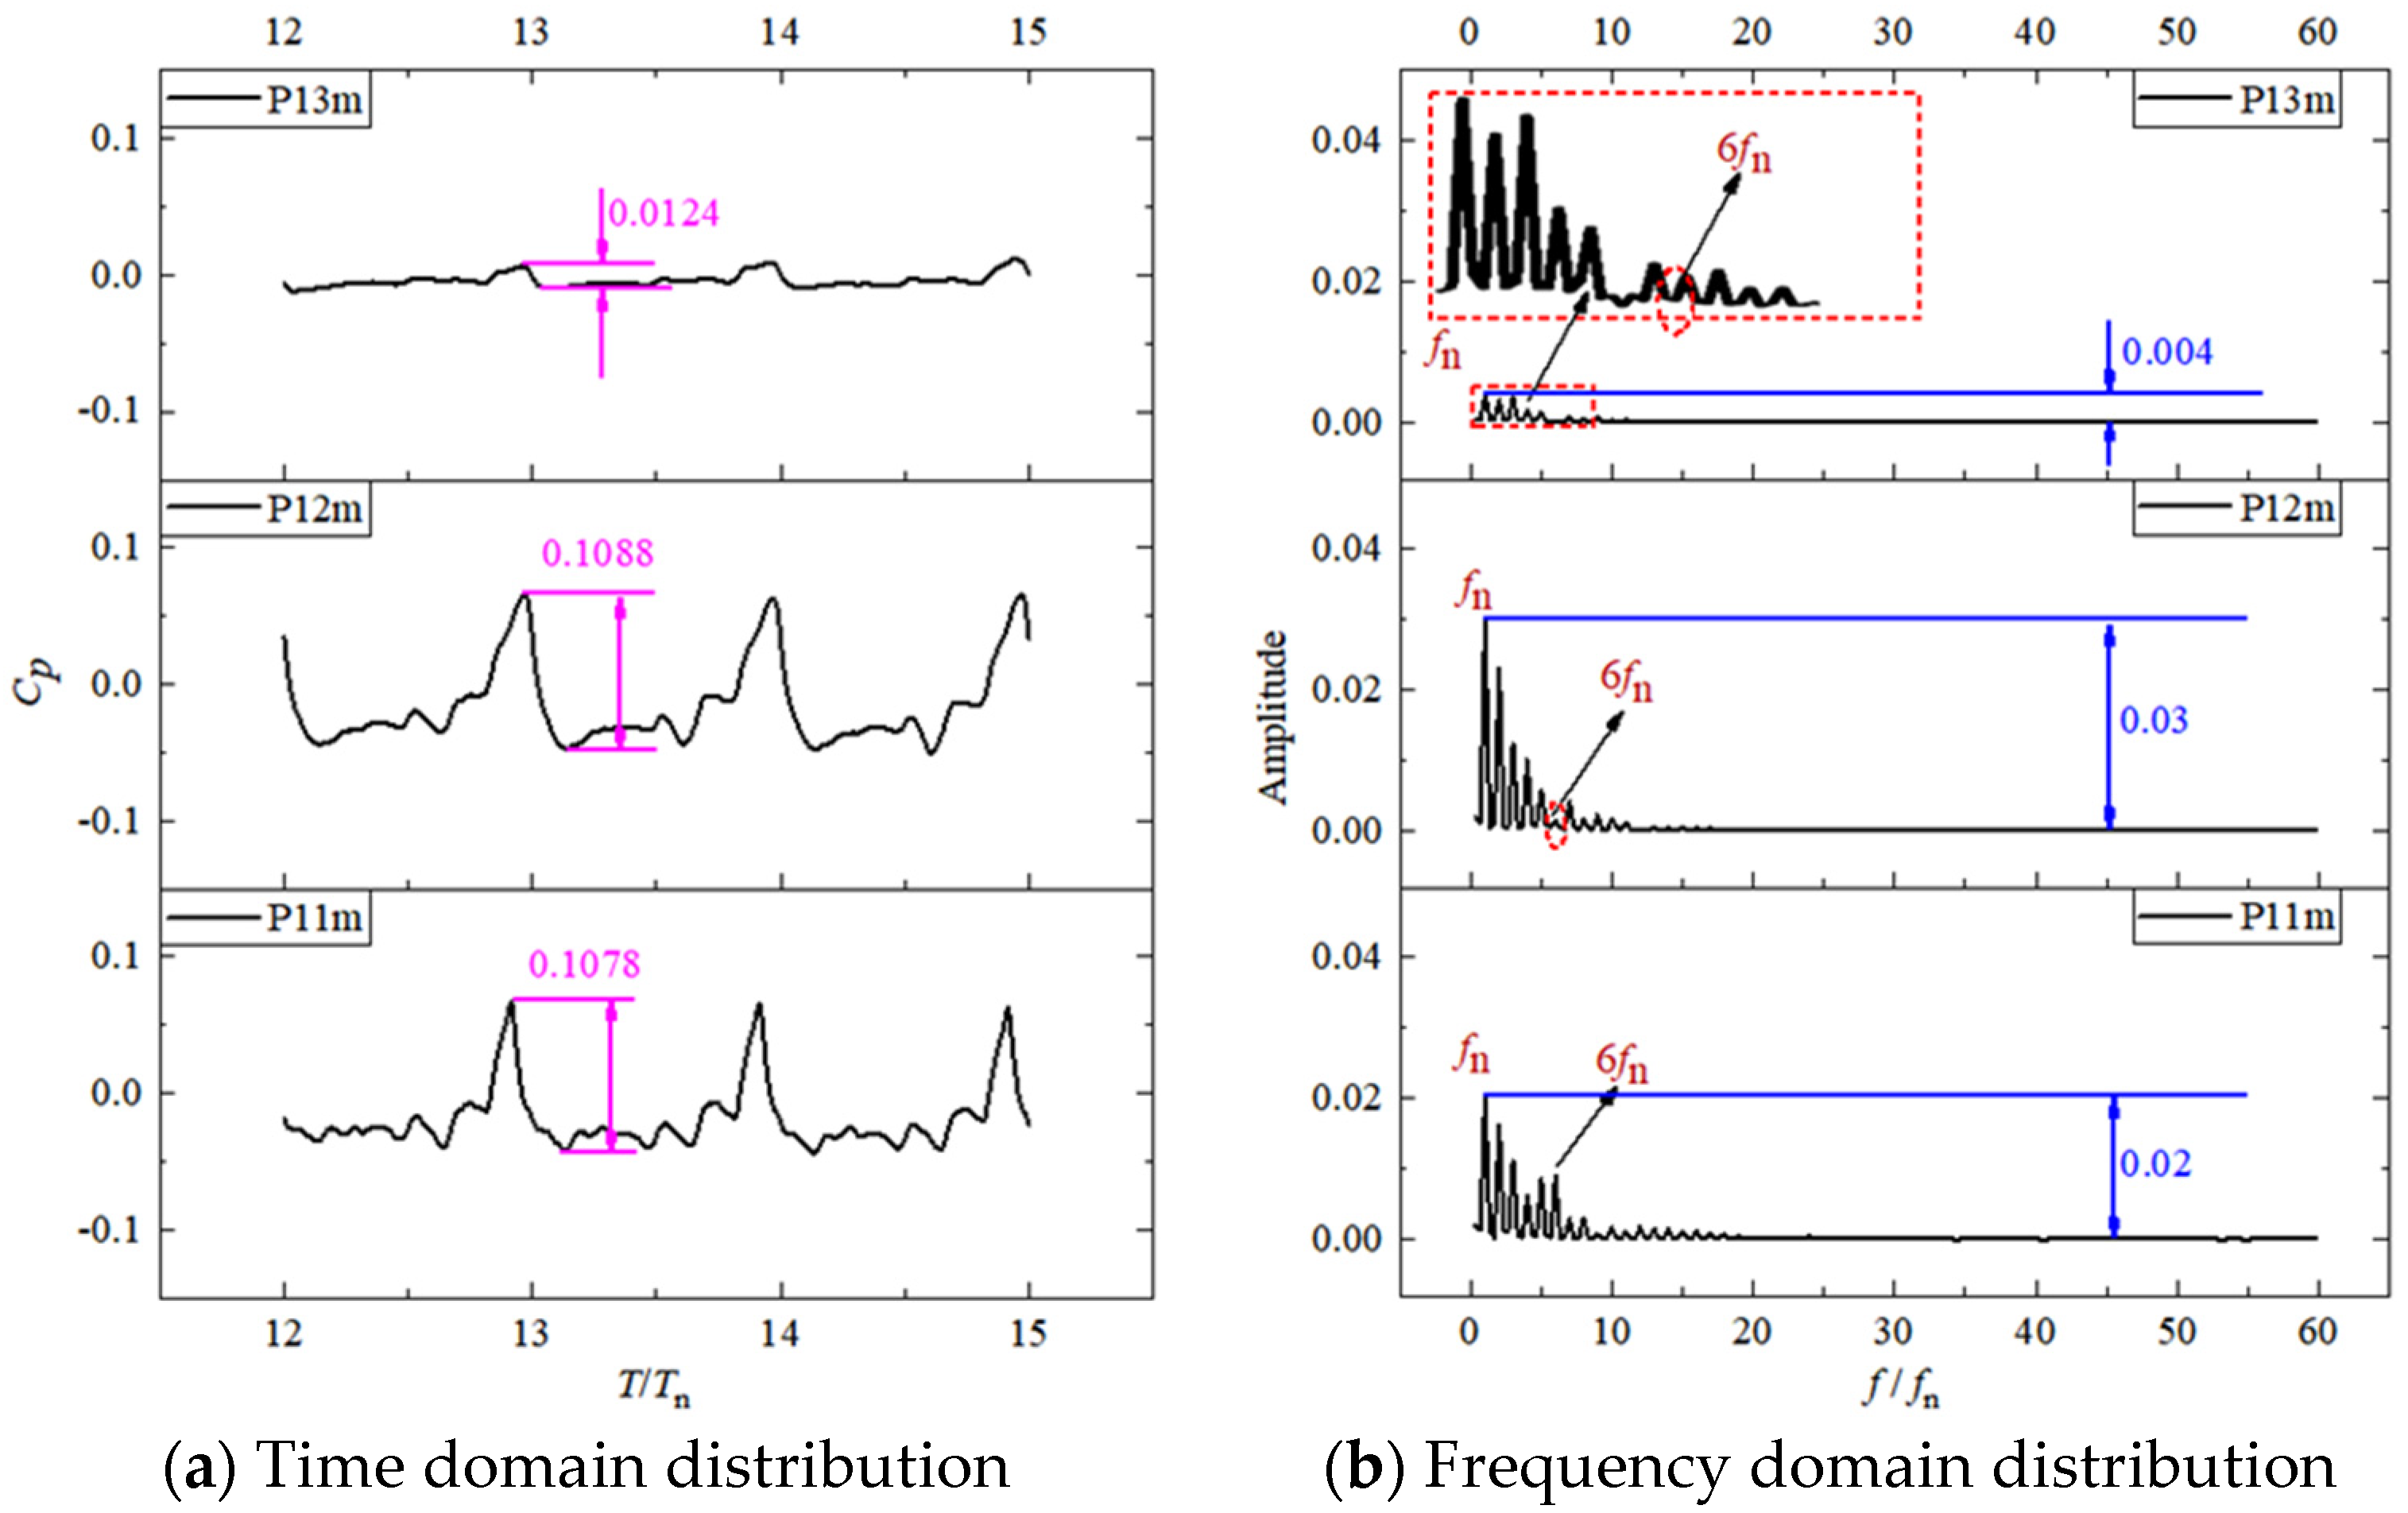
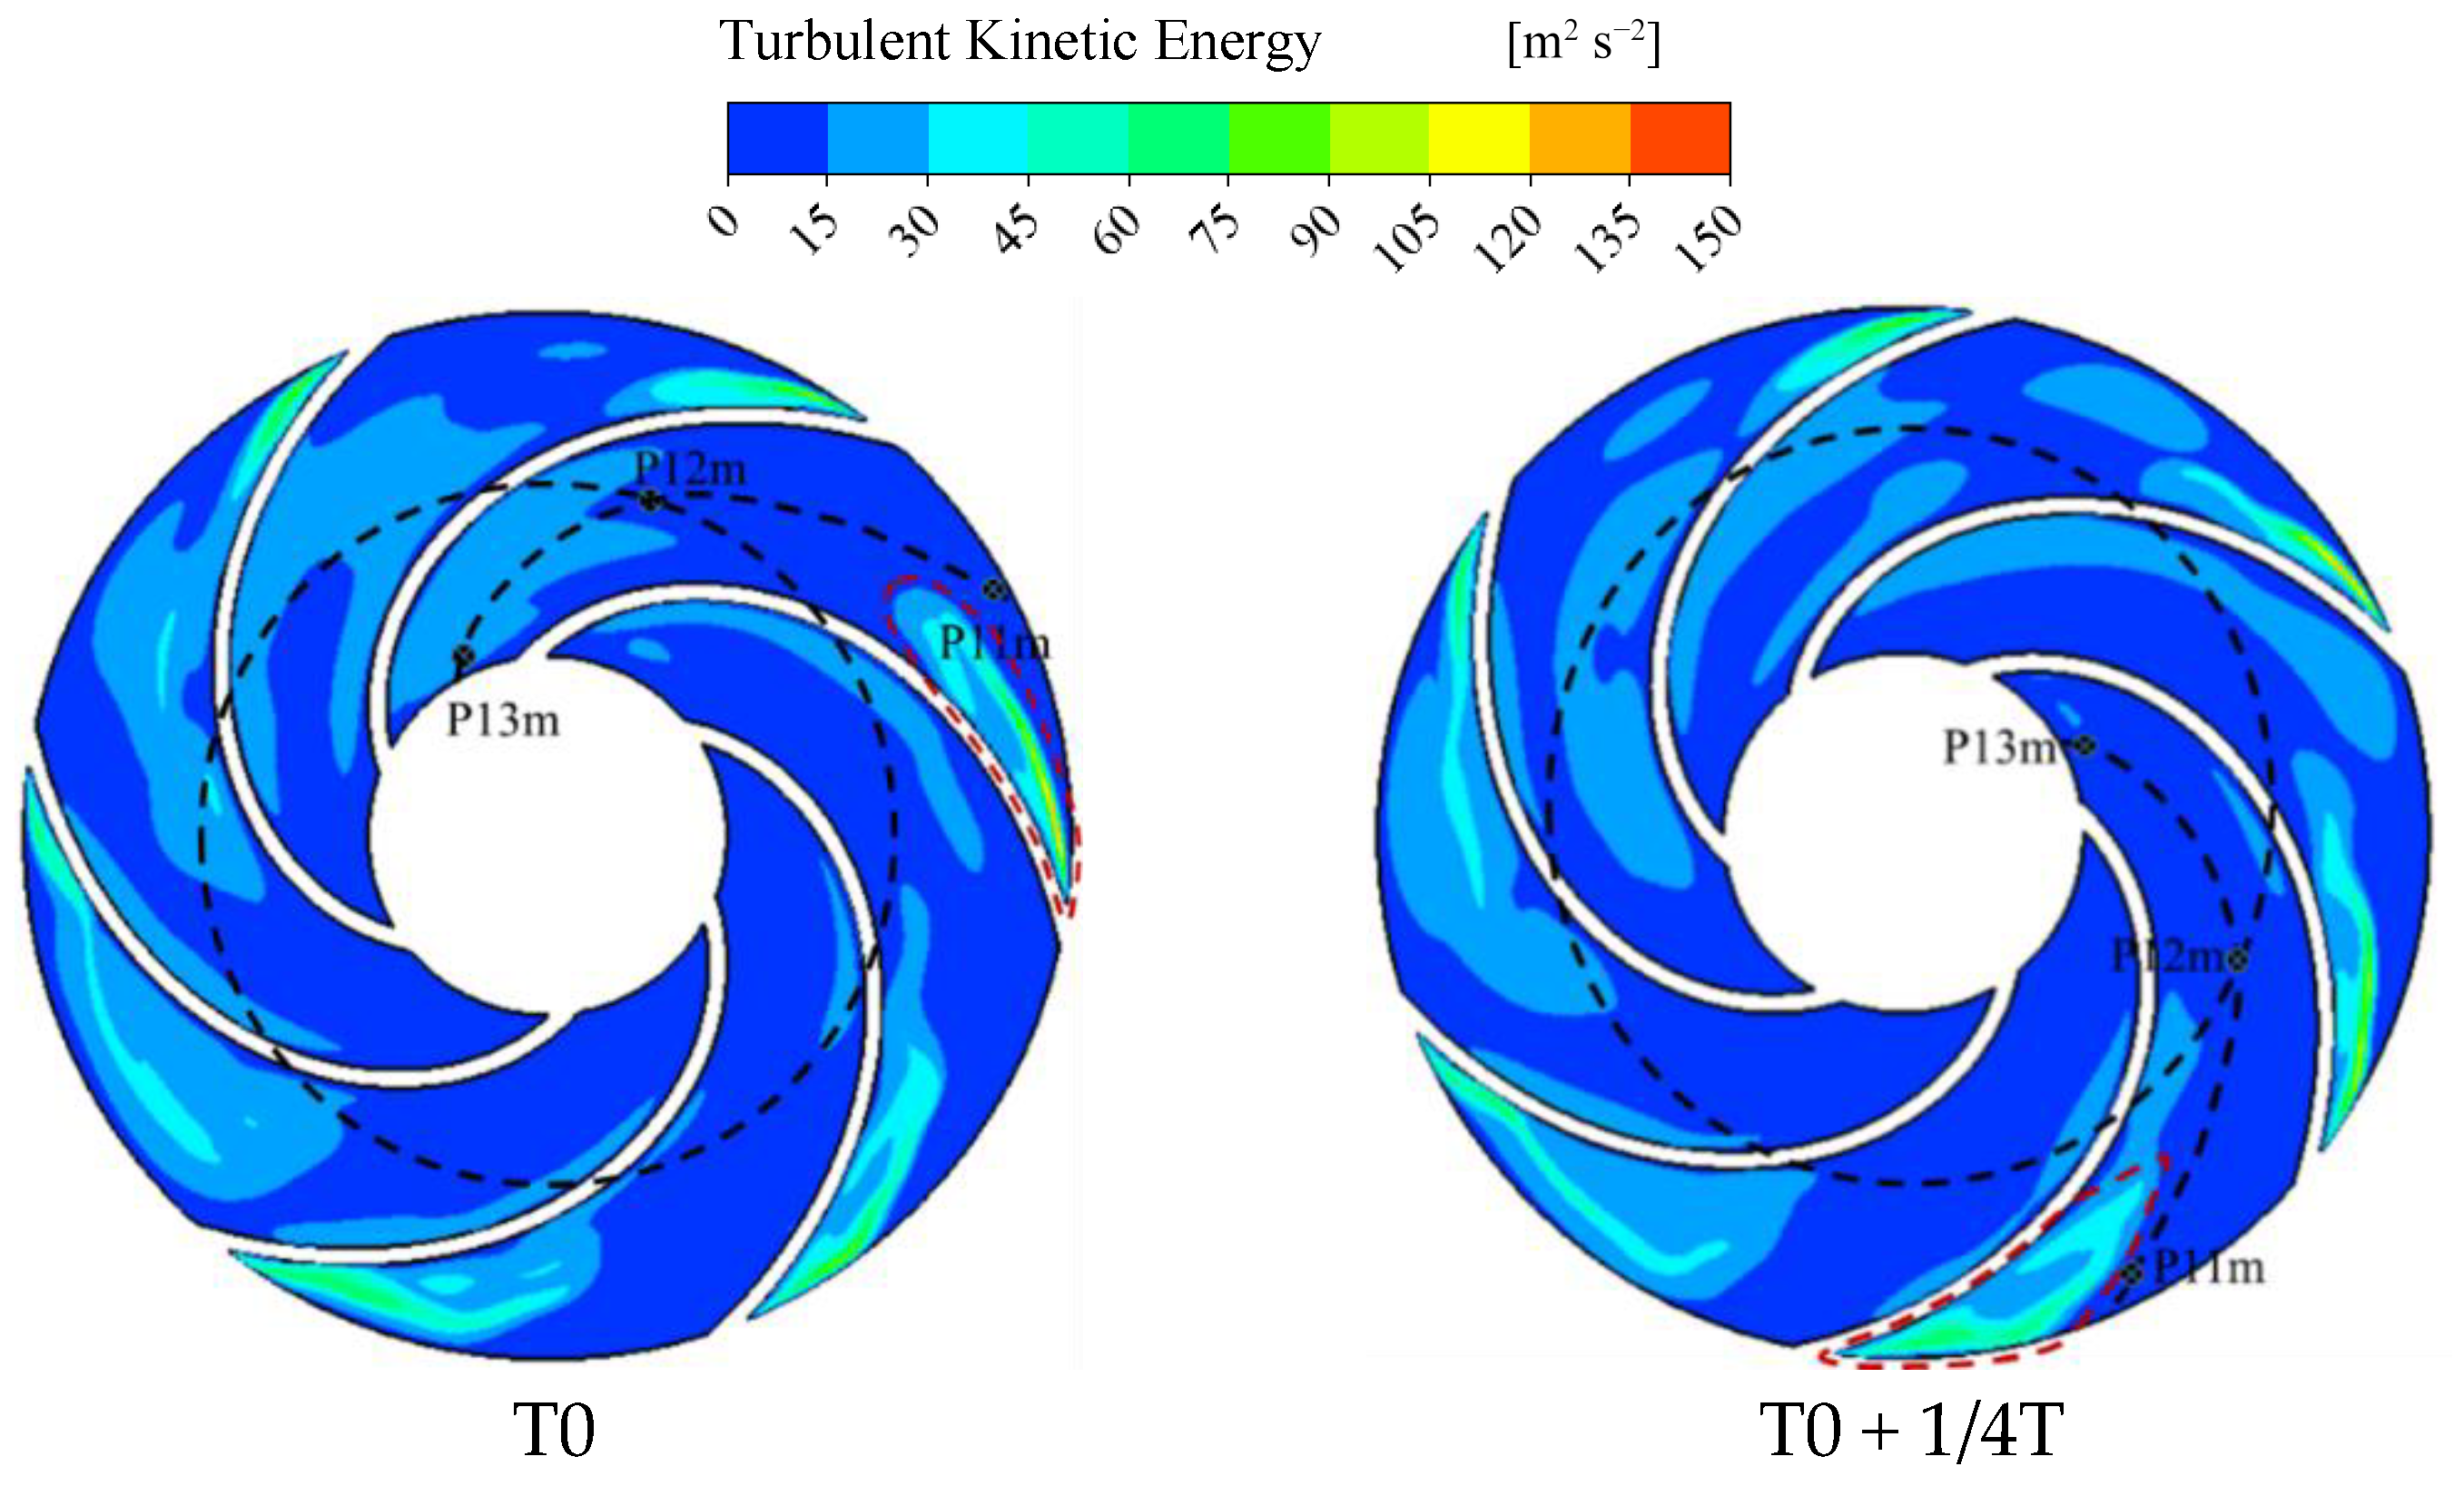
4.2.3. Turbulent Kinetic Energy Distribution in the Impeller

In order to reveal the mechanism of pressure fluctuation in the impeller passage, the turbulent kinetic energy distribution of the impeller rotating for one period was studied. Figure 13 shows the characteristics of turbulent kinetic energy distribution of the impeller from T0 time to T0 + 3/4T time. The change in the turbulent kinetic energy in one of the channels is marked with a red dotted line at the impeller inlet. The turbulent kinetic energy increases gradually from the T0 time to the T0 + 2/4T time, and the turbulent kinetic energy in the channel gradually weakens from the T0 + 2/4T time to the T0 + 3/4T time. This shows that the turbulent kinetic energy in the impeller passage increases and weakens gradually when the impeller rotates for a period. The turbulent fluctuation in the impeller channel is the main factor causing the pressure fluctuation, combined with the analysis of the characteristics of the pressure fluctuation in the impeller channel covered in Section 4.2.2.

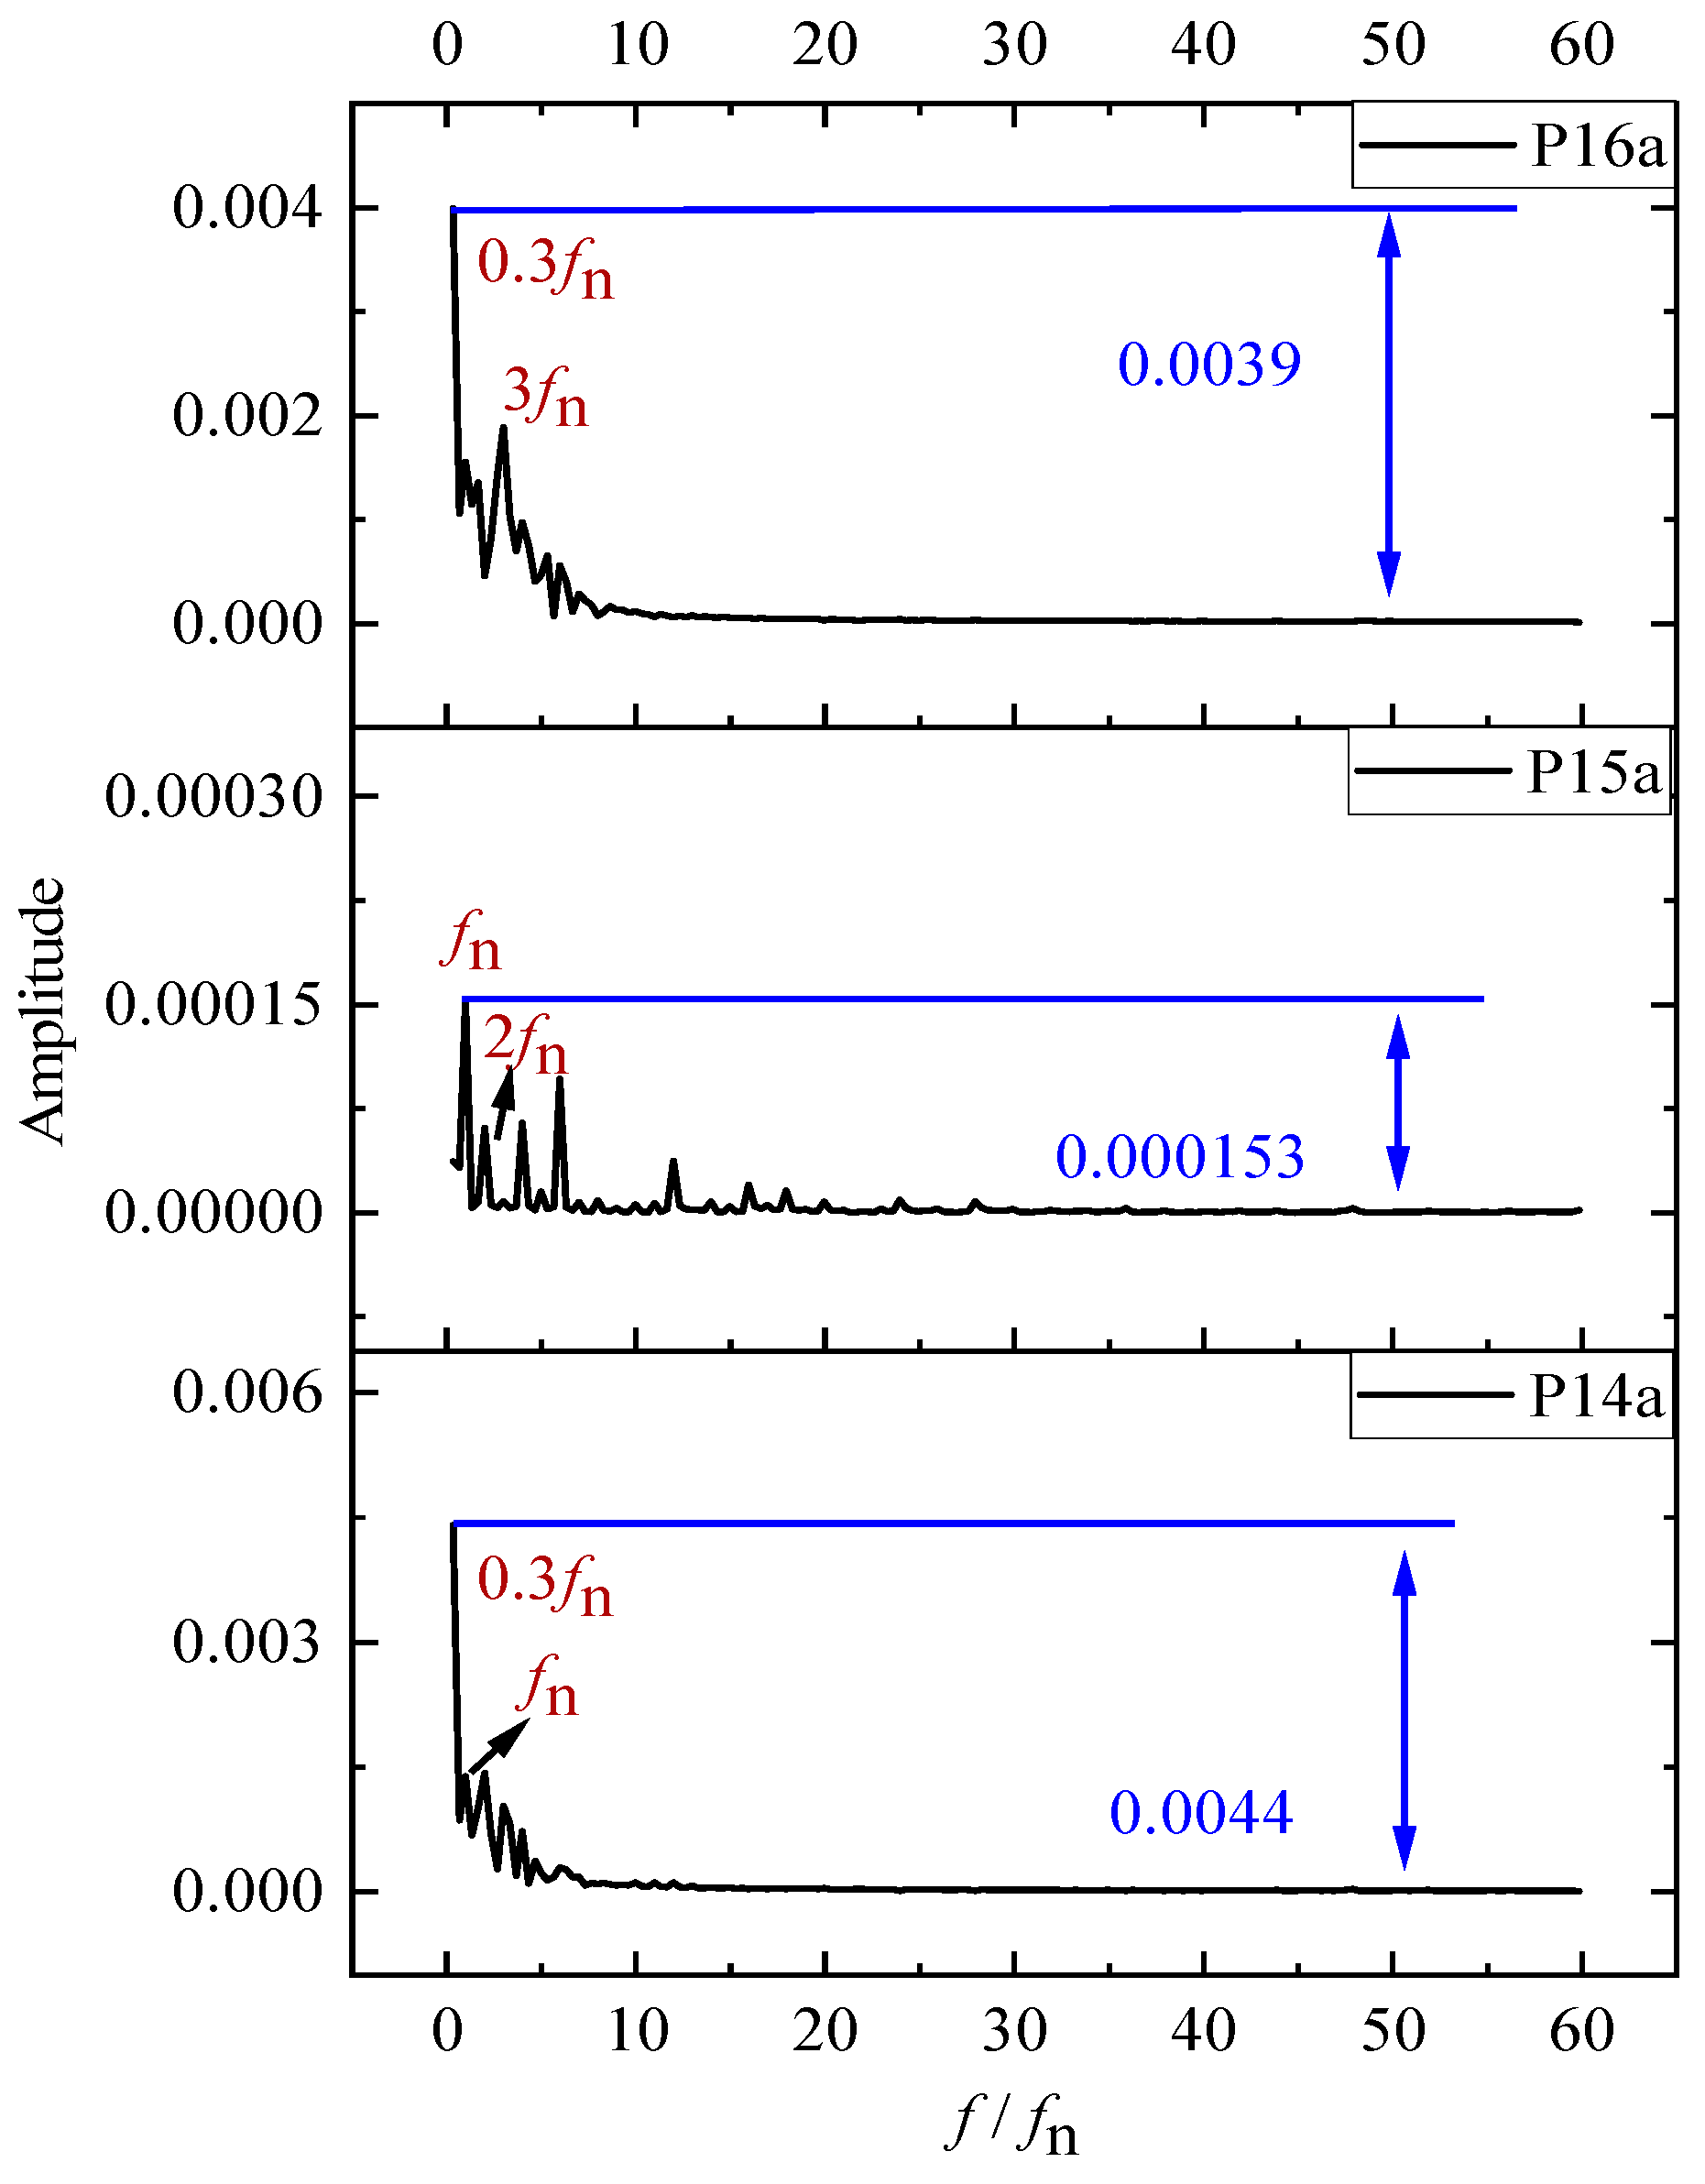
4.2.4. Pressure Fluctuation in Draft Tube

Figure 14 shows the frequency domain characteristics of the pressure fluctuation from the inlet to the outlet in the draft tube, which shows that the pressure fluctuation in the draft tube is mainly low-frequency fluctuation, and the low-frequency fluctuation is disordered. The pressure fluctuation amplitude of the draft tube from the inlet to the outlet gradually weakens. The static and dynamic interference of the impeller rotor is strong, and the pulsation is more intense due, to the fact that the draft tube inlet is close to the impeller outlet. The influence of dynamic and static interference is weak and the pulsation is low where the outlet of the draft tube is far away from the impeller.

4.3. Vortex Evolution Characteristics in ERT Components

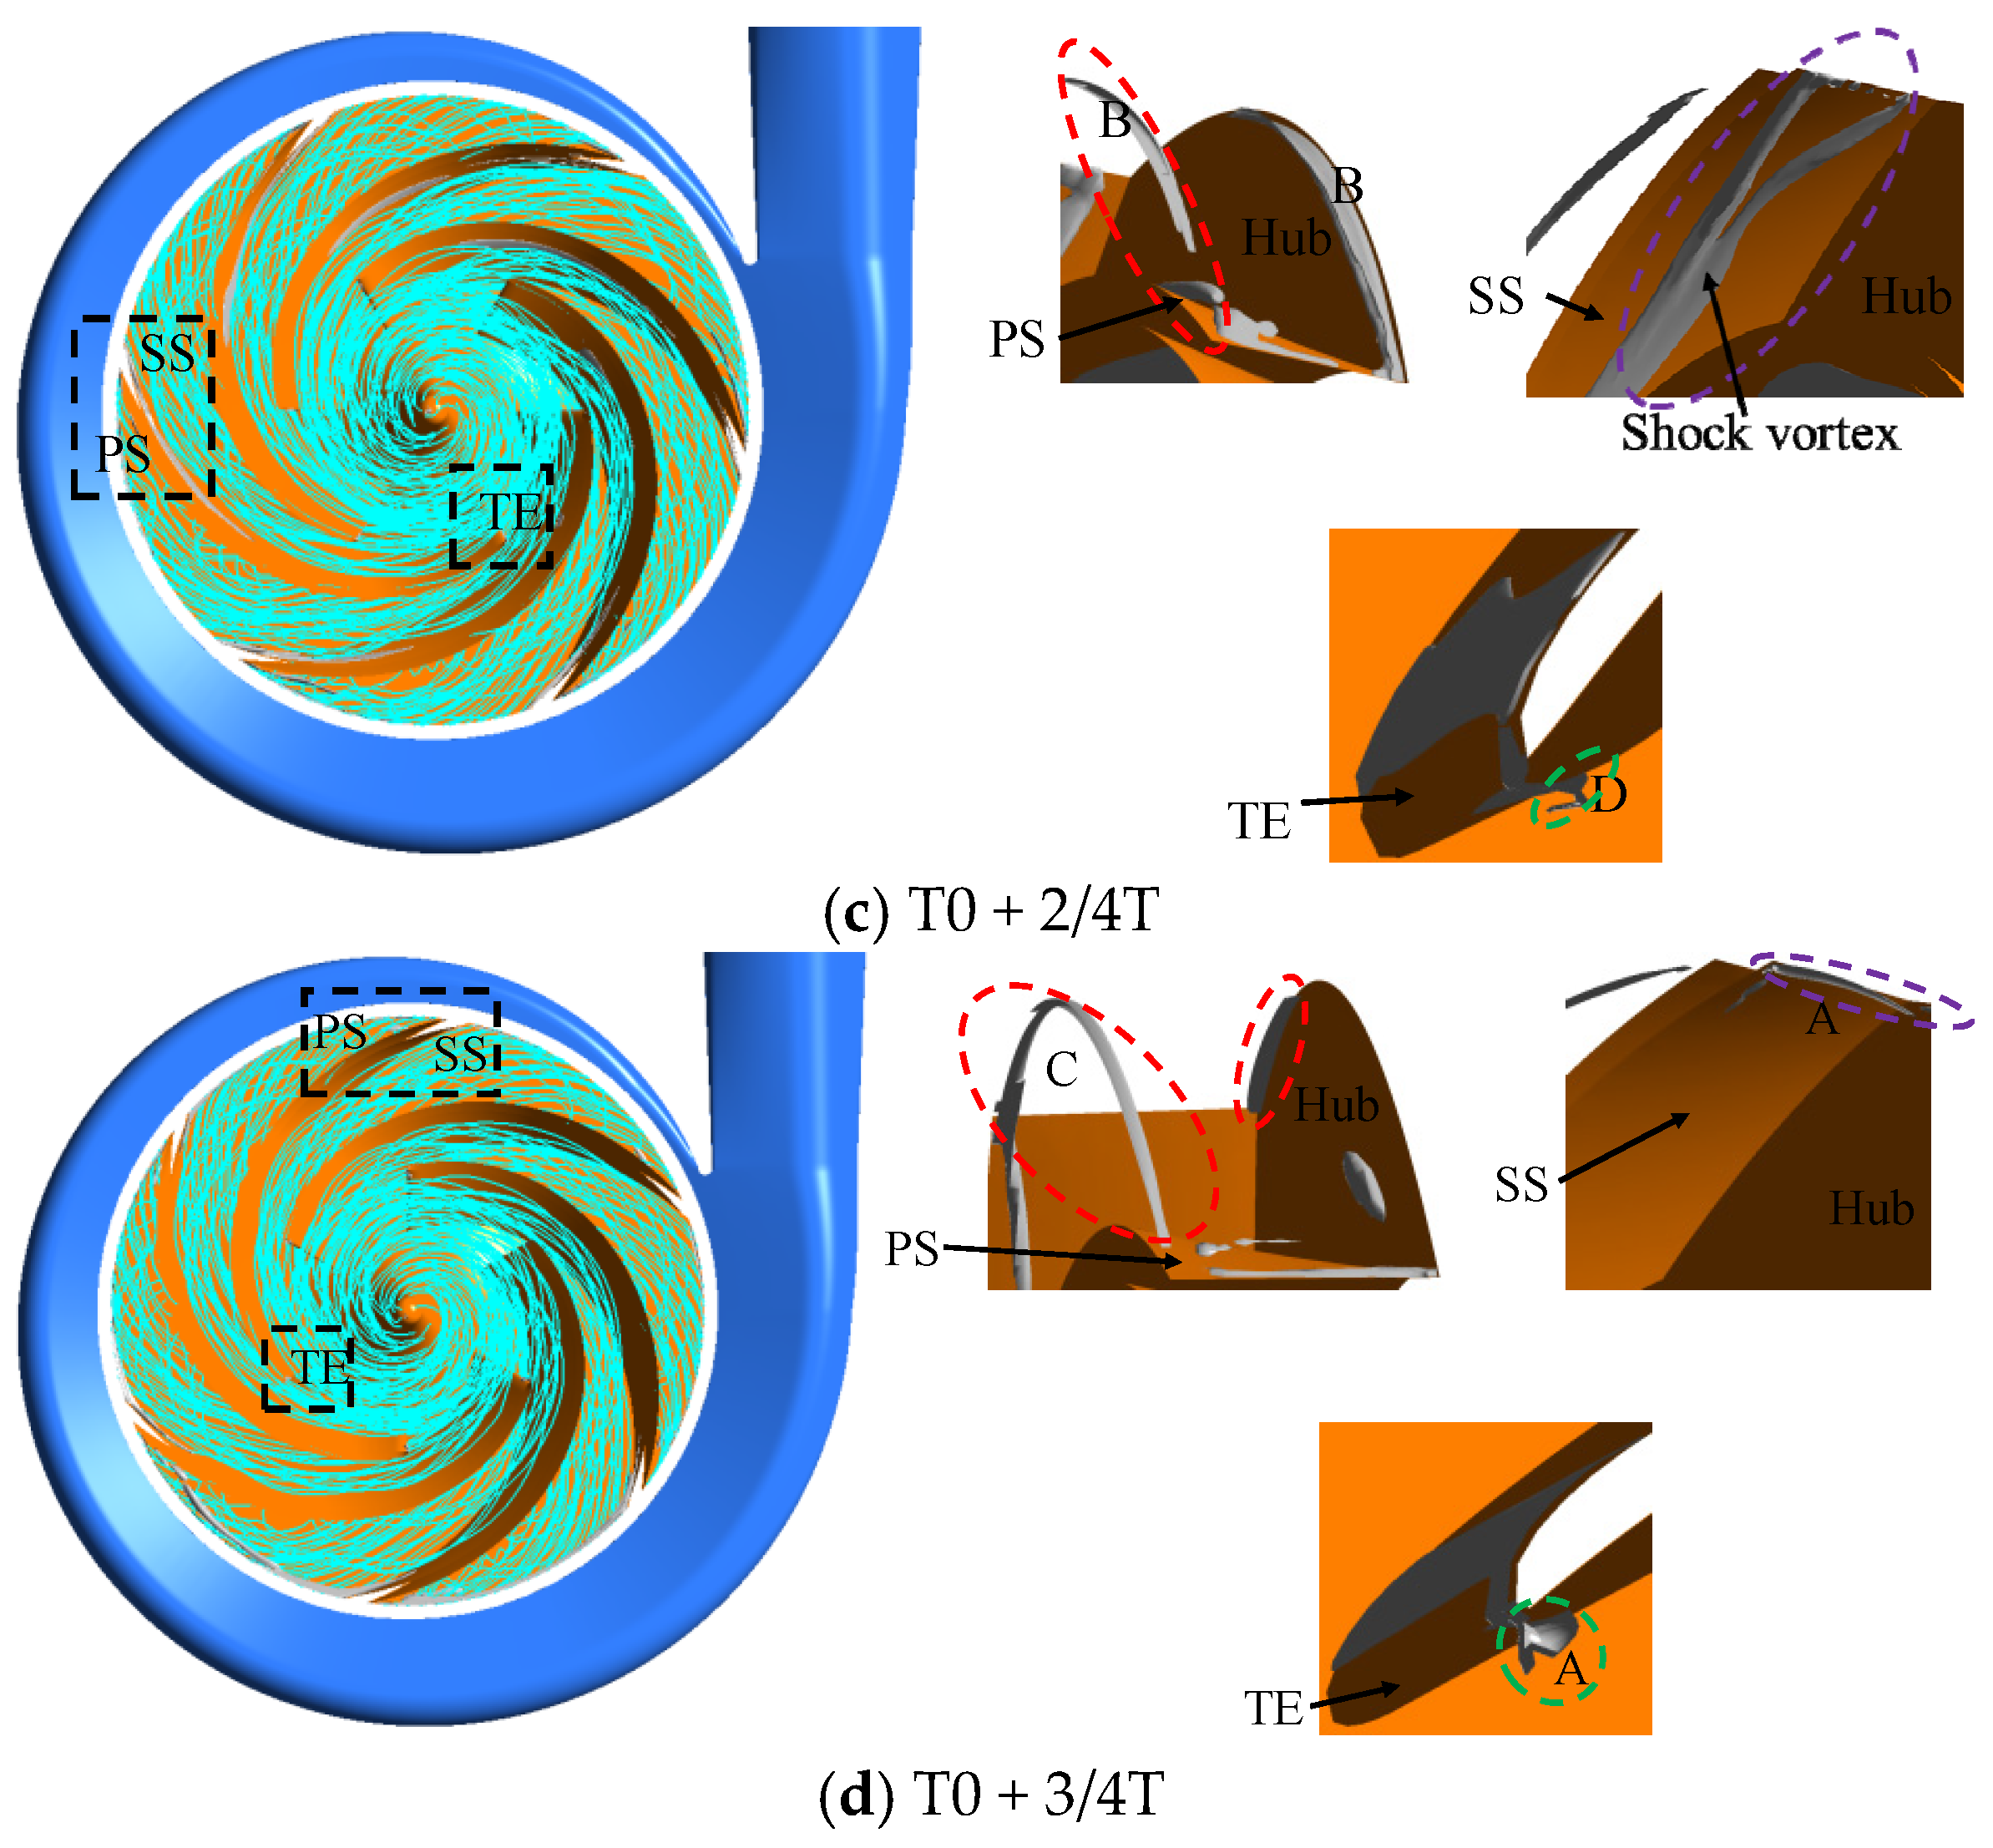
4.3.1. Vortex Evolution Characteristics in Impeller

To further reveal the unsteady distribution characteristics and influence mechanism of pressure fluctuation in the impeller, the vortex evolution mechanism of the leading edge and trailing edge of the impeller blade, caused by unstable flow phenomena such as flow separation and flow impact, was studied. The Q value is 3 × 10⁸ s−2, and gray is used to represent the vortex tube in this study. Figure 15 shows the characteristics of vortex evolution in a periodic passage of an impeller, based on Q criterion. The figure shows the initiation, evolution, maximization, and gradual disappearance of the separation vortex and the impact vortex at the blade’s leading edge in one cycle. The separation vortex on the pressure side of the blade’s leading edge is gradually generated at the T0 + 1/4T time. The separation vortex gradually spreads to the suction surface of the adjacent blade in the circumferential direction, and the diffused separation vortex is mainly located at the blade junction and the front and back cover plates at the T0 + 2/4T time. The separation vortex on one side of the blade has extended to the suction side of the adjacent blade, and the other side has entered a state of disappearance at the T0 + 3/4T time. At the T0 time, the separation vortices on both sides of the blade have gradually weakened and disappeared. On the other hand, the impact vortex on the suction side of the blade leading edge is gradually nascent at the T0 + 3/4T time, further extended and evolved at the T0 time, and reaches the maximum at the T0 + 1/4T time. The vortex near the front and back cover on both sides of the blade is not only maximized, but also a “Y”-type vortex appears in the middle of the blade. At the T0 + 2/4T time, the vortex on both sides of the blade has basically disappeared, while the further evolution of the “Y”-type impact vortex has been maximized.
Thus, the generation of impact and separation vortices is not only related to the matching relationship between the relative flow angle and the blade’s settle angle, but is also related to the front and back cover plates. The vortices on both sides of the blade are in a process of growth and decline, and when the separation vortex evolves to its maximum extent, the impact vortex is basically in the state of disappearance or nascence. At the blade’s trailing edge, a wake vortex is also produced, due to the action of the jet wake, and the wake vortex also goes through a process from nascence to maximization, and then to gradual disappearance. The difference is that part of the wake vortex is always attached to the blade’s pressure surface, which may be related to the boundary layer.

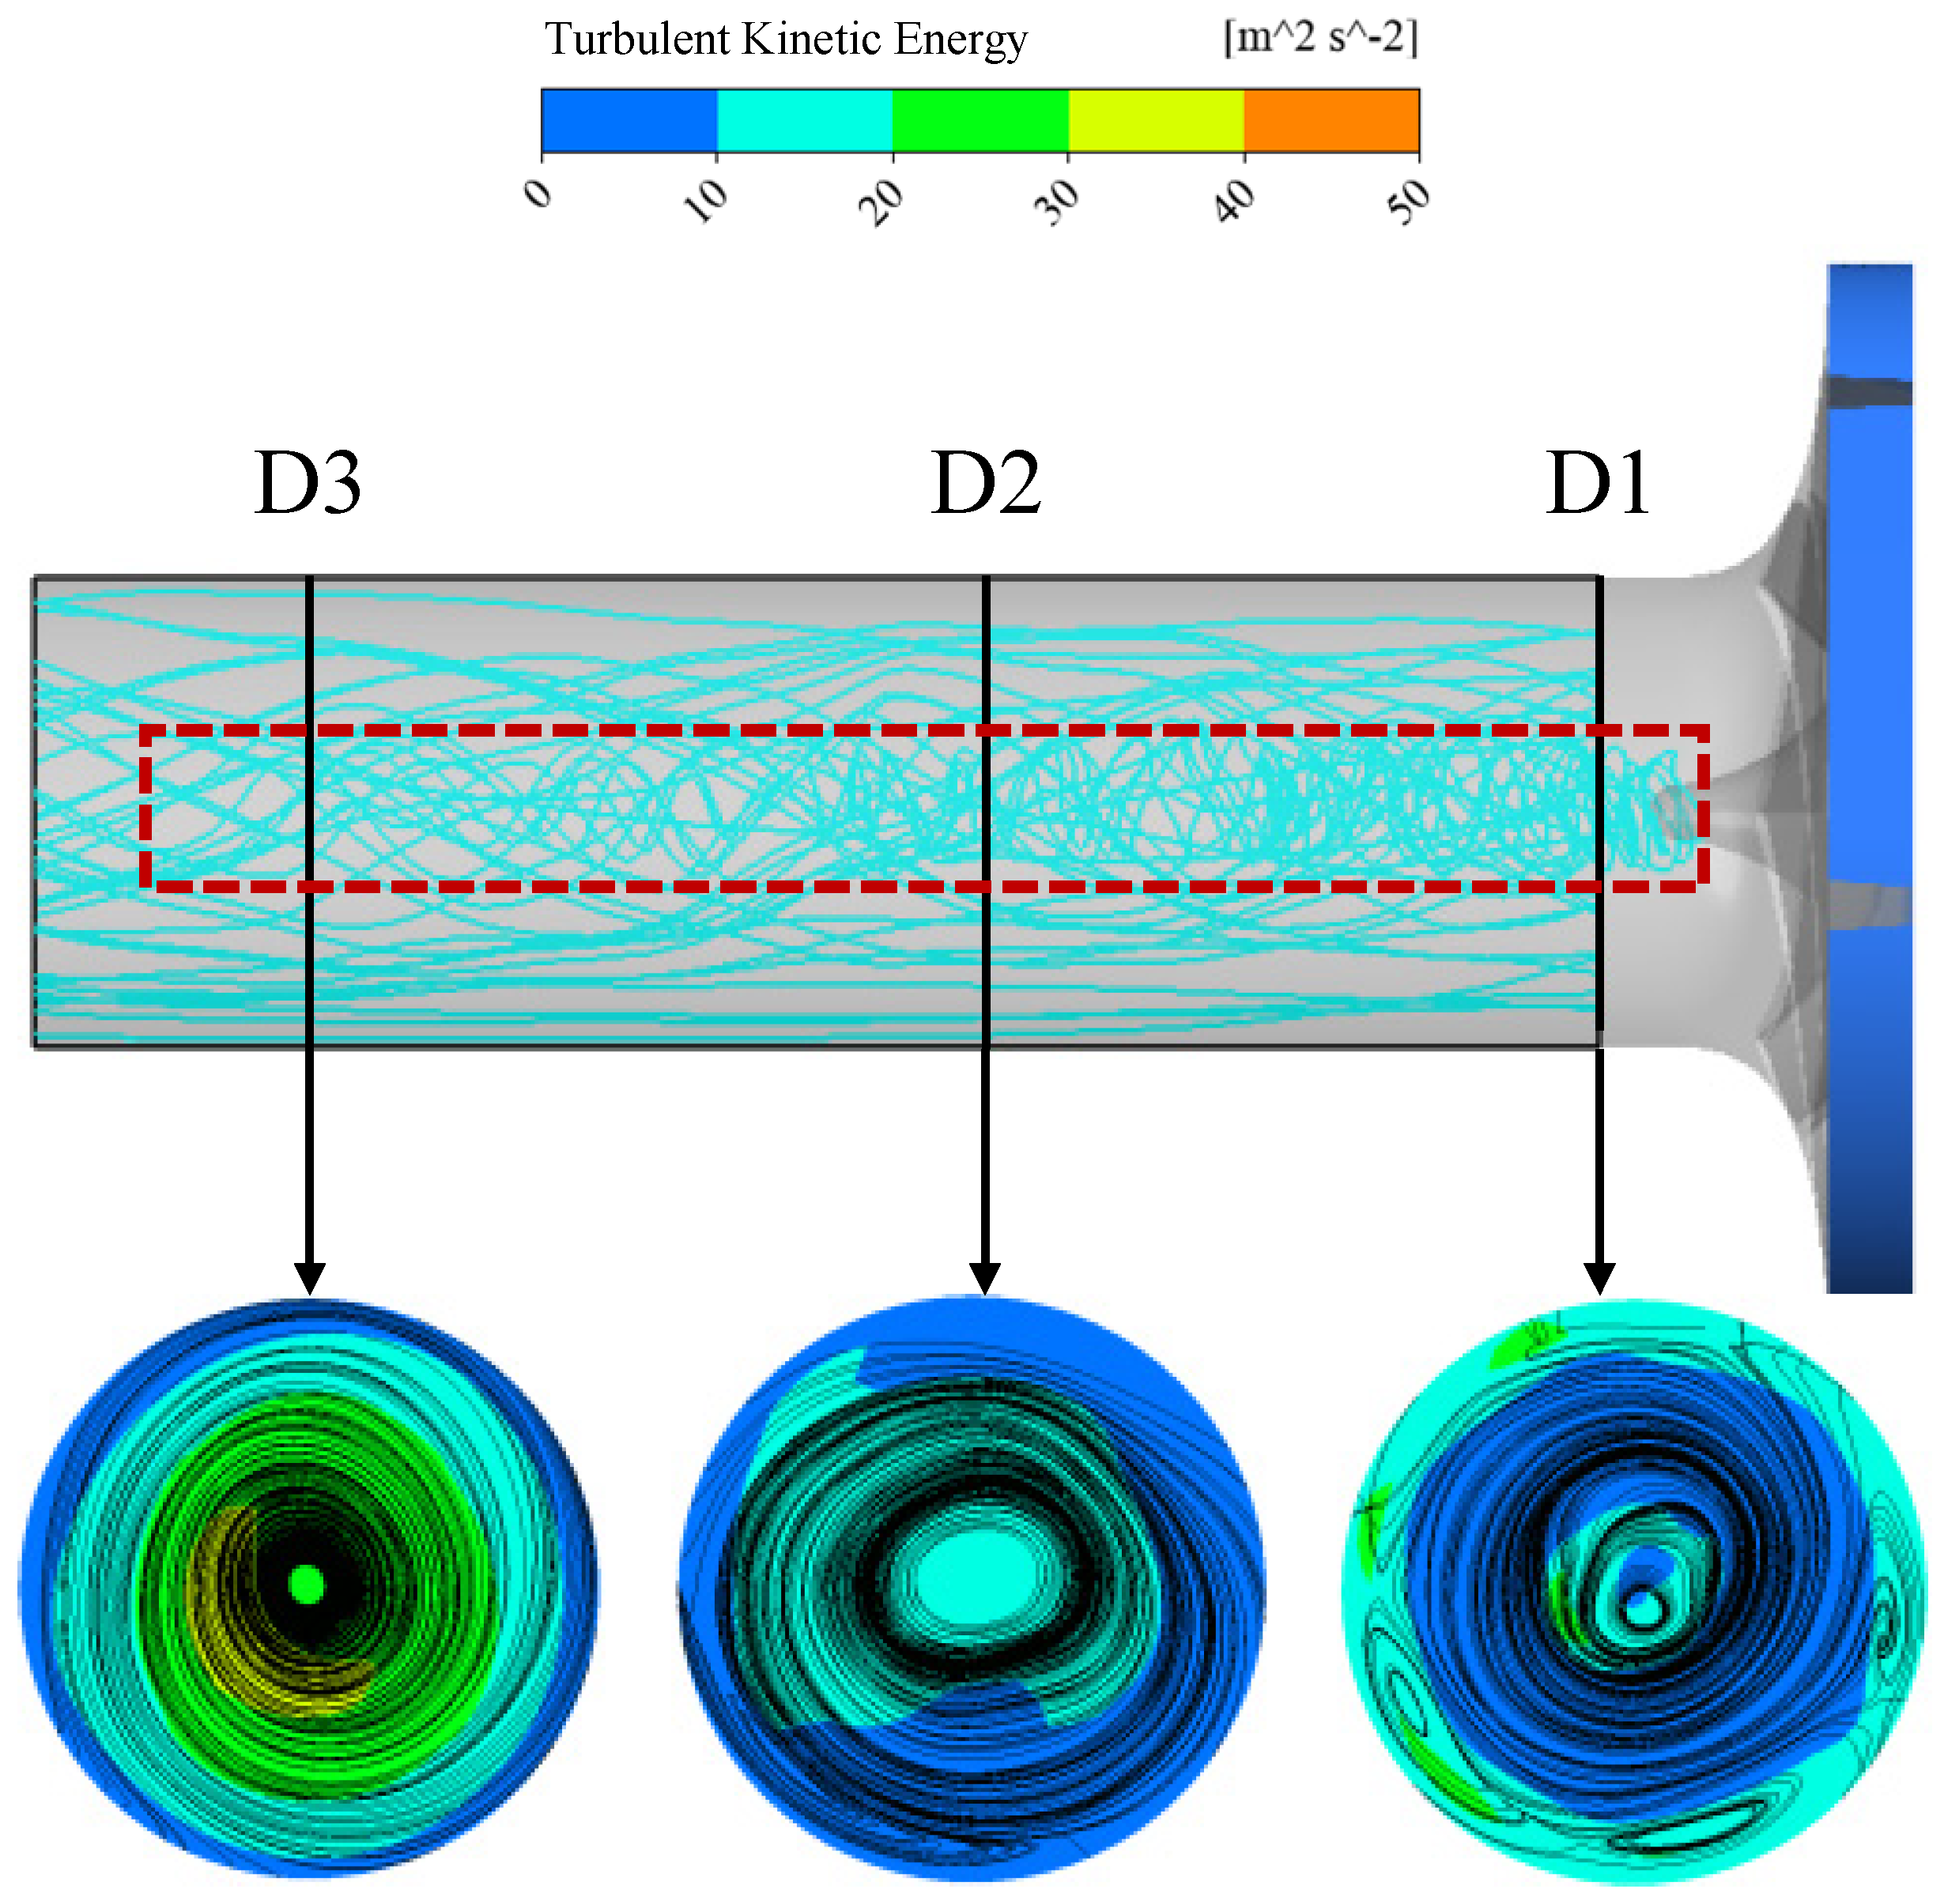
4.3.2. Vortex Evolution Characteristics in Draft Tube

Figure 16 shows the three-dimensional streamline distribution in the draft tube channel and the turbulent kinetic energy distribution in the D1–D3 section. Overall, the flow pattern in the draft tube is relatively disordered, and the tail vortex band is formed from the impeller blade outlet, with its rotation direction opposite to that of the impeller. This is because there is not only axial velocity, but also circumferential velocity, in the fluid from the impeller outlet. The tail vortex belt mainly forms two flow parts: one is mainly affected by the circumferential velocity and the front cover plate, and the other part is mainly affected by the circumferential velocity and the back cover plate hub. From the turbulent kinetic energy and streamline distribution of the D1–D3 section of the draft tube, the fluid at the inlet of the draft tube not only forms a large-scale vortex caused by circumferential velocity, but also has several small-scale vortices near the wall of the draft tube. As it is far away from the outlet of the impeller, the small-scale vortex gradually dissipates, leaving only a large-scale vortex. The area with large turbulent kinetic energy in the draft tube is mainly concentrated near the axis, and gradually decreases with the direction of the draft tube outlet.

5. Conclusions

The main purpose of this study is to reveal the unsteady flow characteristics of energy recovery turbines under multiple conditions. Firstly, the reliability of the numerical calculation method used in this paper was verified through experimental testing. Secondly, the flow field characteristics and pressure pulsation characteristics inside the turbine were studied using numerical calculation methods. Finally, the spatiotemporal evolution characteristics of vortices inside the impeller were studied based on the Q criterion, and the mechanism of vortex generation was revealed based on the flow field characteristics. The following conclusions can be drawn:
(1)
The energy loss in the volute is mainly concentrated in the tongue. There is a confluence between the inlet flow of the volute and the flow in the annular channel at the tongue, and separation occurs near the tongue. With an increase in the flow rate, there is a separation vortex on the tongue wall, and the impact of the two incoming flows is enhanced. The maximum amplitude of P2c at the leaf frequency is 0.0132. The closer to the impeller inlet, the more intense the pressure pulsation, and the larger the fluctuations in amplitude.
(2)
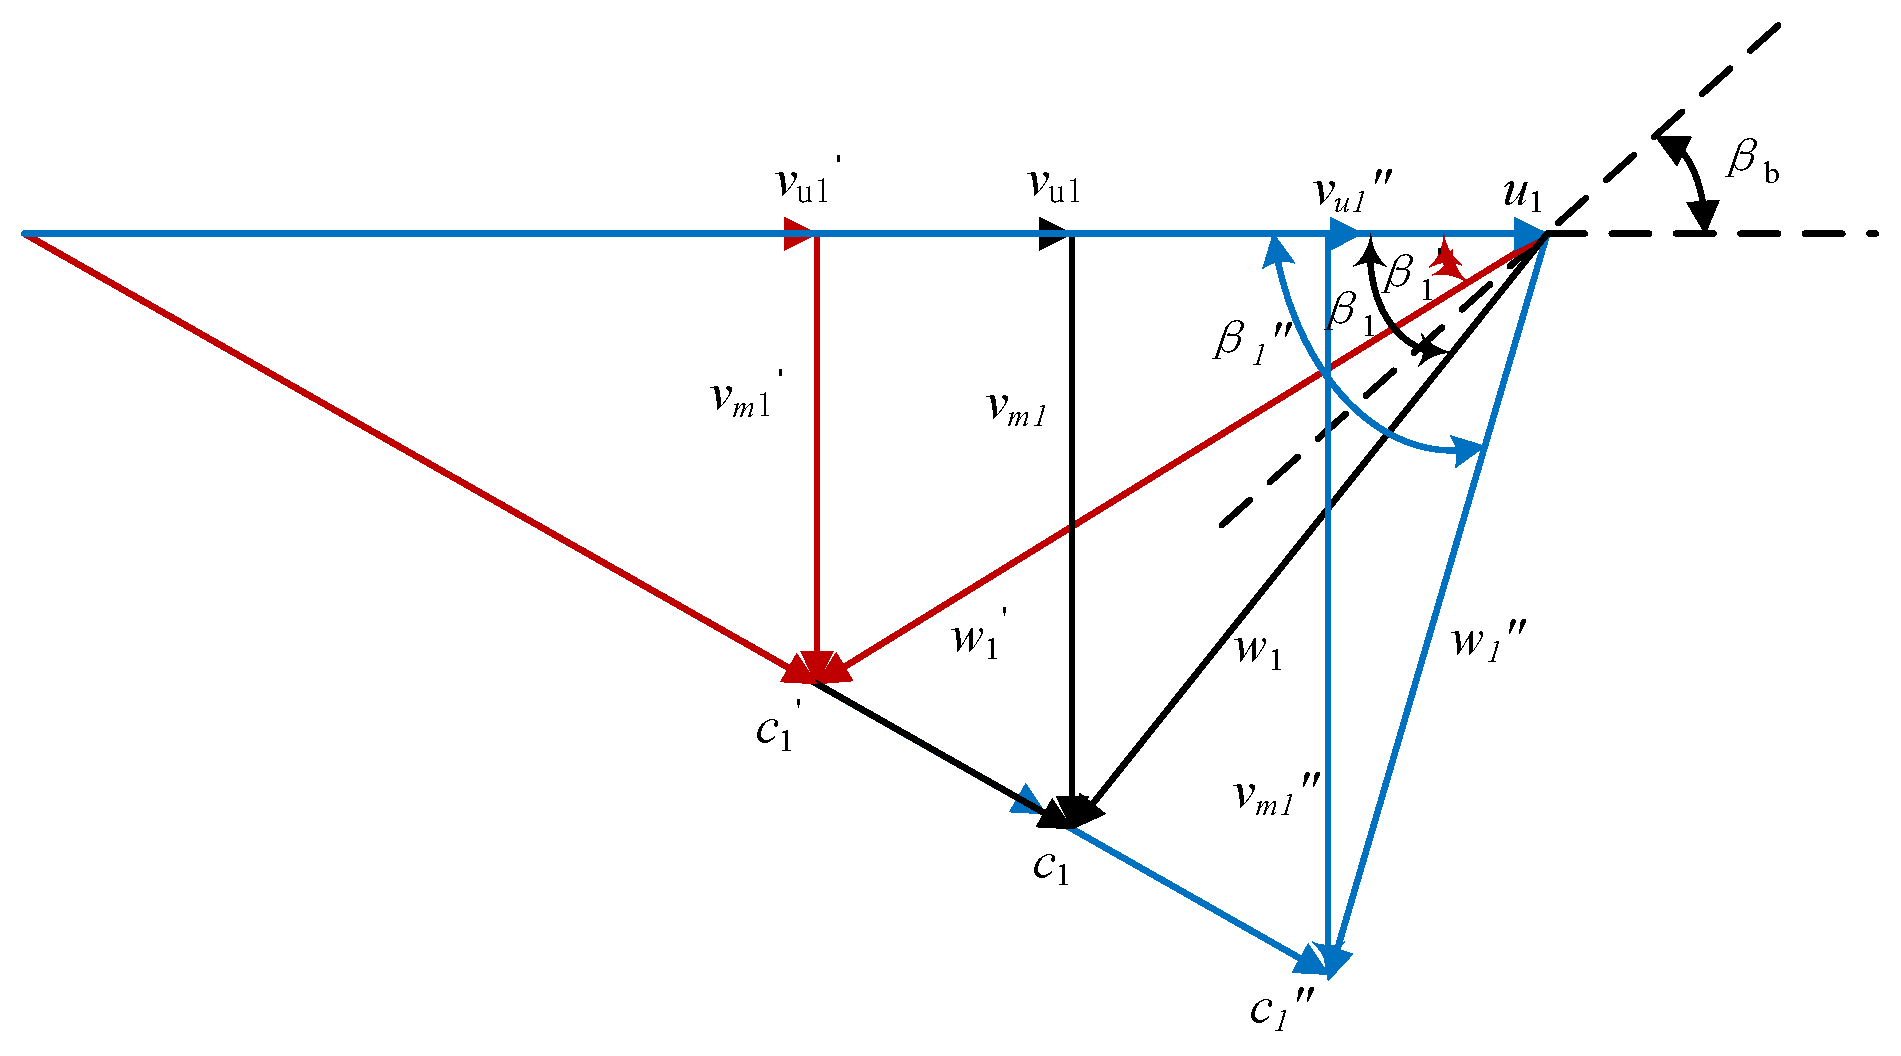
The blade’s relative fluid flow angle β1 is smaller than the blade’s settle angle under the 0.8Qd condition. There is flow separation at the suction surface of the blade’s trailing edge. The interaction between the fluid and the blade is weak, and the energy loss is very low under the 1.0Qd condition. Vortices exist at both the pressure and suction surfaces of the blade inlet under the 1.2Qd condition. The matching of the blade’s inlet relative liquid flow angle and the blade’s settle angle has a crucial effect on the flow pattern inside the turbine.
(3)
The maximum amplitude of pressure fluctuation at the impeller inlet, P11m, is 0.0188, while that at the impeller outlet, P13m, is relatively small. The pressure pulsation in the impeller is dominated by low-frequency pulsation; the amplitude at shaft frequency is the largest, and the amplitude at frequency doubling is gradually weakened. The entrance of the draft tube is strongly affected by the dynamic and static interference of the impeller rotor, and the pulsation intensity is very high.

Author Contributions

X.B.: writing—original draft preparation, conceptualization, software, experiment. J.Y.: conceptualization, supervision, methodology. X.Y.: writing—review and editing, investigation. X.C.: conceptualization, data curation, guidance. B.Q.: review and editing. All authors have read and agreed to the published version of the manuscript.

Funding

This work was supported by grants from the National Natural Science Foundation of China, Regional Project (52469018), the National Natural Science Foundation of China, Regional Project (52169019), and the Natural Science Foundation of Gansu Province (24JRRA214).

Data Availability Statement

The original contributions presented in this study are included in the article. Further inquiries can be directed to the corresponding author.

Conflicts of Interest

The authors declare that they have no known competing financial interests or personal relationships that could have appeared to influence the work reported in this paper.

Nomenclature

uRelative velocity (m·s−1)MTorque of the PAT (N∙m)
μDynamic viscosity (Pa∙s)PinInlet pressure (Pa)
Y+y plus value (-)PoutOutlet pressure (Pa)
QFlow rate (m3∙h−1)fBody force
QdtDesigned flow rate (m3∙h−1)CpDimensionless coefficient of pressure fluctuation
HHead (m) p ¯ ( n o d e ) Time-averaged pressure of the monitoring point
HdtDesigned head (m)
ηDesigned efficiency (%)λEigenvalue of equation
ηdtDesigned efficiency (%)SDeformation rate tensor
tTime (s)
ρFluid density (kg∙m−3)Acronyms
pStatic pressure (Pa)PATPump as turbine
gGravitational constant (m∙s−2)ERTEnergy recovery turbine
ndRotational speed (r/min)
NstSpecific speed
PShaft power (kW)

References

  1. Ma, X.; Wang, L.; Cao, J.; Chen, C. A Brief Analysis of Small scale Seawater Desalination Plants and Development. Anhui Chem. Ind. 2023, 49, 20–24. [Google Scholar]
  2. Chang, Y.; Ju, M.; Zhou, Y. Research progress on energy recovery technology and devices in reverse osmosis seawater desalination system. Energy Eng. 2006, 3, 48–52. [Google Scholar]
  3. Li, W.; Liao, Z. Comparison and Selection of Energy Recovery Device Scheme for Seawater Reverse Osmosis in a Certain Project. China Pet. Chem. Stand. Qual. 2023, 43, 118–120. [Google Scholar]
  4. Du, J.; Yang, H.; Shen, Z.; Chen, J. Micro hydro power generation from water supply system in high rise buildings using pump as turbines. Energy 2017, 137, 431–440. [Google Scholar] [CrossRef]
  5. Senchun, M.; Junhu, Y.; Yongji, S.; Tingting, W.; Yafeng, W. Research on selection of pump as turbine. J. Xihua Univ. (Nat. Sci.) 2016, 35, 23–26. [Google Scholar] [CrossRef]
  6. Tao, W.; Fanyu, K.; Yuyang, H.; Sunsheng, Y. Researching status of centrifugal pump as turbine. J. Drain. Irrig. Mach. Eng. 2013, 31, 674–680. [Google Scholar] [CrossRef]
  7. Derakhshan, S.; Mohammadi, B.; Nourbakhsh, A. Efficiency improvement of centrifugal reverse pumps. J. Fluids Eng. 2009, 131, 021103. [Google Scholar] [CrossRef]
  8. Singh, P.; Nestmann, F. Internal hydraulic analysis of impeller rounding in centrifugal pumps as turbines. Exp. Therm. Fluid Sci. 2011, 35, 121–134. [Google Scholar] [CrossRef]
  9. Yang, S.-S.; Kong, F.-Y.; Jiang, W.-M.; Qu, X.-Y. Effects of impeller trimming influencing pump as turbine. Comput. Fluids 2012, 67, 72–78. [Google Scholar] [CrossRef]
  10. Yang, S.-S.; Kong, F.-Y.; Qu, X.-Y.; Jiang, W.-M. Influence of Blade Number on the Performance and Pressure Pulsations in a Pump Used as a Turbine. J. Fluids Eng. 2012, 134, 124503. [Google Scholar] [CrossRef]
  11. Yang, S.S.; Kong, F.Y.; Jiang, W.M.; Qu, X.Y. Research on rotational speed to the influence of pump as turbine. IOP Conf. Ser. Earth Environ. Sci. 2012, 15, 042023. [Google Scholar] [CrossRef]
  12. Tao, W.; Fanyu, K.; Shouqi, Y.; Sunsheng, Y.; Kai, C. Design and experiment of a special impeller for hydraulic turbines with forward curved blades. Trans. Chin. Soc. Agric. Mach. 2014, 45, 75–79. [Google Scholar] [CrossRef]
  13. Wang, T.; Kong, F.; Duang, X.; Gou, Q. Experiment and analysis of effects of rotational speed on performance of pump as turbine. Trans. Chin. Soc. Agric. Eng. 2016, 32, 67–74. [Google Scholar] [CrossRef]
  14. Qi, B.; Zhang, D.; Geng, L.; Zhao, R.; van Esch, B.P.M. Numerical and experimental investigations on inflow loss in the energy recovery turbines with back-curved and front-curved impeller based on the entropy generation theory. Energy 2022, 239, 122426. [Google Scholar] [CrossRef]
  15. Qi, B.; Bai, X.; Li, Y.; Wang, X.; Zhang, X.; Zhang, D. Research on the influence mechanism of internal flow characteristics on energy conversion in radial energy recovery turbines under multiple conditions. Energy 2024, 296, 131191. [Google Scholar] [CrossRef]
  16. Lin, T.; Li, X.; Zhu, Z.; Xie, R.; Lin, Y. Investigation of flow separation characteristics in a pump as turbines impeller under the best efficiency point condition. J. Fluids Eng. 2021, 143, 061204. [Google Scholar] [CrossRef]
  17. Hao, Y.; Tan, L. Symmetrical and unsymmetrical tip clearances on cavitation performance and radial force of a mixed flow pump as turbine at pump mode. Renew. Energy 2018, 127, 368–376. [Google Scholar] [CrossRef]
  18. Ji, P. Investigations on Fluid-Structure Interaction of Unsteady Flow-Induced Vibration and Flow Unsteadiness Intensity of Centrifugal Pumps. Ph.D. Thesis, Jiangsu University, Zhenjiang, China, 2013. [Google Scholar]
  19. Jun, L.; Dangguo, Y.; Xiansheng, W.; Xinfu, L. Effect of turbulent boundary layer thickness on a three-dimensional cavity flow. Acta Aeronaut. Astronaut. Sin. 2016, 37, 475–483. [Google Scholar] [CrossRef]
  20. Kim, H.T.; Kline, S.J.; Reynolds, W.C. The production of turbulence near a smooth wall in a turbulent boundary layer. J. Fluid Mech. 1971, 50, 133–160. [Google Scholar] [CrossRef]
  21. Adrian, R.J.; Meinhart, C.D.; Tomkins, C.D. Vortex organization in the outer region of the turbulent boundary layer. J. Fluid Mech. 2000, 422, 1–54. [Google Scholar] [CrossRef]
  22. Zhang, G.; Yang, Y.; Zhang, X.; Zhang, Z.; Chen, J.; Jin, Z.; Dykas, S. Nanoparticles-induced heterogeneous condensation and geometry optimizations to enhance liquefaction efficiency and mitigate exergy loss in a novel hydrogen liquefaction two-phase expander. Energy 2024, 313, 134006. [Google Scholar] [CrossRef]
  23. Zhang, G.; Yang, Y.; Chen, J.; Jin, Z.; Dykas, S. Numerical study of heterogeneous condensation in the de Laval nozzle to guide the compressor performance optimization in a compressed air energy storage system. Appl. Energy 2024, 356, 122361. [Google Scholar] [CrossRef]
Figure 1. The overall hydraulic model of the pump as turbine.
Energies 17 06461 g001
Figure 2. Mesh division of turbine flow components.
Energies 17 06461 g002
Figure 3. Mesh independence verification.
Energies 17 06461 g003
Figure 4. Schematic diagram of the turbine test bench system.
Energies 17 06461 g004
Figure 5. The main control and measurement equipment of the system.
Energies 17 06461 g005
Figure 6. Experimental and calculated performance curve of turbine.
Energies 17 06461 g006
Figure 7. Turbulent kinetic energy-streamline distribution of volute tongue.
Energies 17 06461 g007
Figure 8. Velocity-streamline distribution of impeller.
Energies 17 06461 g008
Figure 9. Velocity triangle at impeller inlet.
Energies 17 06461 g009
Figure 10. Distribution of pressure pulsation monitoring points in the turbine.
Energies 17 06461 g010
Figure 11. Characteristics of radial pressure fluctuation of volute.
Energies 17 06461 g011
Figure 12. Characteristics of radial pressure fluctuation of impeller.
Energies 17 06461 g012
Figure 13. Turbulent kinetic energy transient characteristics in impeller.
Energies 17 06461 g013aEnergies 17 06461 g013b
Figure 14. Axial pressure fluctuation of draft tube.
Energies 17 06461 g014
Figure 15. Periodic evolution of vortex in impeller passage.
Energies 17 06461 g015aEnergies 17 06461 g015b
Figure 16. Evolution characteristics of vortex in draft tube.
Energies 17 06461 g016
Table 1. Design parameters of ERT.
Performance ParametersFlow Rate
Qdt (m3/h)
Head Hdt (m)Efficiency
ηdt (%)
Rotational Speed nd (r/min)Specific Speed Nst
50500≥80%20,00082
Table 2. Range and accuracy of main measuring equipment.
ApparatusTypeMeasurement ParametersRangeAccuracy
Electromagnetic flowmeterMEX-LDEFlow rate Q (m3/h)0–120 (m3/h)±0.5%
Low-pressure transmittersMEX-3051TGInlet, outlet pressure P (Pa)0–1.6 (MPa)±0.05%
Eddy current dynamometerCWF11DTorque M (N·m)0–35 (kW)±0.4%
Rotating speed sensorZH07-ARotating speed n (r/min)1–10,000 (r/min)±1 r/min
High-pressure transmittersSCYG310Pressure P (Pa)0–0.8 (MPa)±0.5%
Disclaimer/Publisher’s Note: The statements, opinions and data contained in all publications are solely those of the individual author(s) and contributor(s) and not of MDPI and/or the editor(s). MDPI and/or the editor(s) disclaim responsibility for any injury to people or property resulting from any ideas, methods, instructions or products referred to in the content.

