Article

Analysis of Greenhouse Gas Emissions and Energy Consumption Depending on the Material and Construction Solutions and the Energy Carrier Used—A Case Study

by
Grzegorz Nawalany
1,
Paweł Sokołowski
1,*,
Tomasz Jakubowski
2 and
Atilgan Atilgan
3
1
Department of Rural Building, Faculty of Environmental Engineering and Land Surveying, University of Agriculture in Krakow, al. Mickiewicza 24/28, 30-059 Krakow, Poland
2
Department of Machine Operation, Ergonomics and Production Processes, Faculty of Production and Power Engineering, University of Agriculture in Krakow, 30-059 Krakow, Poland
3
Department of Biosystems Engineering, Faculty of Engineering, Alanya Alaaddin Keykubat University, 07425 Alanya, Turkey
*
Author to whom correspondence should be addressed.
Energies 2024, 17(24), 6460; https://doi.org/10.3390/en17246460
Submission received: 25 November 2024 / Revised: 17 December 2024 / Accepted: 19 December 2024 / Published: 22 December 2024
(This article belongs to the Special Issue Challenges and Research Trends of Exhaust Emissions)

Abstract

:
The article presents the results of research on the impact of material and construction solutions on energy demand and greenhouse gas emissions. Field research was conducted in an existing free-standing greenhouse located in southern Poland. The research period covered the entire calendar year. The measurement data were used in the next step to validate the computational model using the numerical method of elementary balances. The data distribution was also analyzed in terms of basic statistics. The validated and verified model was used in the further part of the analysis to conduct computer simulations for three variants, differing in terms of material and construction solutions. The variants included: no foundation insulation, extruded polystyrene (XPS) insulation and the use of single-chamber polycarbonate panels with thermal insulation of the foundations. The obtained results showed a high agreement between theoretical and real data (85–89% for the coefficient of determination (R2) and 84–88% for the GOF method). In the case of variant 1, which in terms of material and construction solutions corresponded to the actual construction of the greenhouse, it was found that the annual energy demand for heating purposes amounted to 153,234 kWh/year. In variant 2, in which additional thermal insulation relative to the zero state was used, the energy demand for heating purposes was lower and amounted to 147,704 kWh/year. The lowest heat load was characteristic of variant 3, in which 116,294 kWh/year was required to cover heating needs. The variant with polycarbonate and foundation insulation brought energy savings of 24% and a reduction of CO2 emissions by 24%. In addition, replacing fuel from hard coal with natural gas brought significant benefits, reducing pollutant emissions by 51%. The paper is a new approach to the use of the mentioned numerical method for the assessment of gaseous pollutant emissions in this type of building based on numerical simulations of energy consumption.

1. Introduction

In recent years, especially in the European Union, there has been a clear trend aimed at reducing the emission of gaseous pollutants into the atmosphere. Concerns about the progress of the global warming phenomenon contribute significantly to this undertaking [1,2,3]. Despite the growing prominence of environmental issues in political and economic discussions, economic policy decisions during crises often emphasize immediate economic recovery over long-term sustainable development [4,5]. The prevailing standard of living and the rapid pace of civilization development make the reduction of harmful gas emissions into the atmosphere extremely difficult and expensive and promotes various social resistances [6,7]. Despite these challenges, many technical solutions require long-term research in the field of reduction of the emissions of undesirable gases into the atmosphere. Therefore, various research institutions address this issue by examining different sectors of the economy. One of the sectors considered is industry. This sector is responsible for about 30–47% of global greenhouse gas emissions, with a significant share of energy-related carbon dioxide emissions and gases emitted from industrial processes [8,9,10]. In addition to industry, agriculture is an important sector influencing atmospheric pollution. Agriculture, including crop and livestock production, forestry and land use changes, is responsible for 30% of global greenhouse gas emissions caused by human activity. Agricultural activity alone is responsible for about 12% of total global greenhouse gas emissions. Thus, over the last two decades, greenhouse gas emissions from the agricultural sector have accounted for 12–30% of global greenhouse gas emissions caused by human activity [11,12,13].
One of the highly energy-intensive types of agricultural production is the cultivation of plants in greenhouses. The aforementioned energy consumption results mainly from the need to maintain an appropriate internal air temperature, which entails the need for heating, depending on the location of the facility. For the sake of order, it should be noted that greenhouse facilities in colder climates require more energy for heating, while those in warmer climates need more energy for cooling [14,15,16]. Additionally, it should be emphasized that the demand for energy for heating purposes in greenhouses varies significantly depending on the season, with higher energy consumption most often occurring in winter compared to summer [17,18]. The energy demand of a greenhouse is also mainly influenced by the type of material and construction solutions adopted. In this aspect, the most important thing is to maintain the appropriate thermal resistance of partitions and light transmittance of transparent partitions [19,20] and to use the potential of the ground under the greenhouse as much as possible [21,22]. Thermal insulation of greenhouse foundations and appropriate parameters of thermal resistance of the casing can significantly reduce greenhouse gas emissions by reducing energy consumption and improving heating efficiency [23,24]. The average ratio of CO2 equivalent savings to emissions for current insulation products such as extruded polystyrene (XPS) is 48:1, which indicates a significant reduction of greenhouse gases into the atmosphere. Modern and environmentally friendly building materials with a high thermal resistance value can provide energy savings of up to 31.2 kWh/m2 per year, which translates into a significant reduction of CO2 emissions, especially when using “clean” fuels such as natural gas [25,26]. While professionals largely agree on the key inputs and methods that contribute to GHG emissions, there is minimal consensus on the most effective strategies for reducing the carbon footprint over a building’s entire lifecycle [27,28]. The effectiveness of thermal insulation in reducing greenhouse gas emissions depends on the climate, fuel type and heating system efficiency. For example, the greatest reductions in carbon dioxide emissions were observed in regions where hard coal is used for heating, with a reduction of up to 18.7 kg-CO2/m2 per year when switching to natural gas [29,30,31]. Thermal insulation of vegetable greenhouse foundations can reduce the total energy demand by about 44% and reduce the carbon footprint by 24% and 28%, respectively [32]. From the point of view of energy savings and the use of “clean” energy carriers, renewable energy cannot be forgotten. The interest in alternative or renewable energy sources for heating greenhouses is currently high due to their high energy load for heating purposes and the relatively high price of fossil fuels. Important alternative energy sources are solar collectors, heat pumps, biomass and cogeneration systems [30,33]. The use of alternative energy sources is particularly important in terms of reducing pollutant emissions, as recent research indicates that heated greenhouses consume between 240 and 500 kWh/m2 of energy per year, and various improvements in efficiency and renewable energy can save between 15% and 48% of energy in year-round operation [34,35]. In countries with transitional climates, it is necessary to implement a heating strategy during the winter months to maintain the optimum temperature in greenhouses for specific crops. Heating greenhouses, especially those constructed with glass partitions, causes significant heat losses, and these losses are aggravated by large differences in air temperature between the interior of the greenhouse and the outside environment. In order to reduce energy losses through transparent partitions in greenhouses, polycarbonate sheets are being increasingly used, which have a solar radiation transmittance coefficient comparable to glass. Studies conducted by Fabrizio [23] have shown that the implementation of transparent polymers, which exhibit excellent thermal properties compared to glass and do not significantly reduce the transmission of solar radiation, can potentially reduce the energy demand for heating greenhouses by up to 30%. Within the energy balance of greenhouses, a certain part of the heat exchange is attributed to the ground substrate, which plays an important role in determining the temperature in the cultivation zone [21].
The research conducted in this article aims to introduce a new contribution to the energy assessment of greenhouses, taking into account greenhouse gas emissions into the atmosphere by using a specialized method of elementary balances. The aim of the work is to determine the impact of the material and construction diversity of greenhouses on energy management and the emission of harmful gases. This article is a new approach to the use of the aforementioned numerical method to assess greenhouse gas emissions in buildings of this type based on numerical simulations of energy consumption. The elementary balance method, based on detailed physical analysis, has great potential in the context of using the results of numerical analyses to estimate emissions. In contrast to traditional methods based on simplified models, the elementary balance method takes into account a detailed analysis of the temperature distribution inside the facility and in its structure, as well as the heat flux flowing through the partitions at each stage of the process. This approach allows for the analysis of diverse material and construction solutions that could be omitted in less detailed analyses. The elementary balance method is universal and can be applied to various types of energy technologies, both conventional and renewable. This allows for the comparison of different technological solutions, among others, in terms of emissions and energy efficiency. Undertaking research on the application of the elementary balance method in energy analyses, in terms of emission estimation, fills a significant gap in previous research while opening up new possibilities for more effective and sustainable management of energy resources in agricultural buildings.

2. Materials and Methods

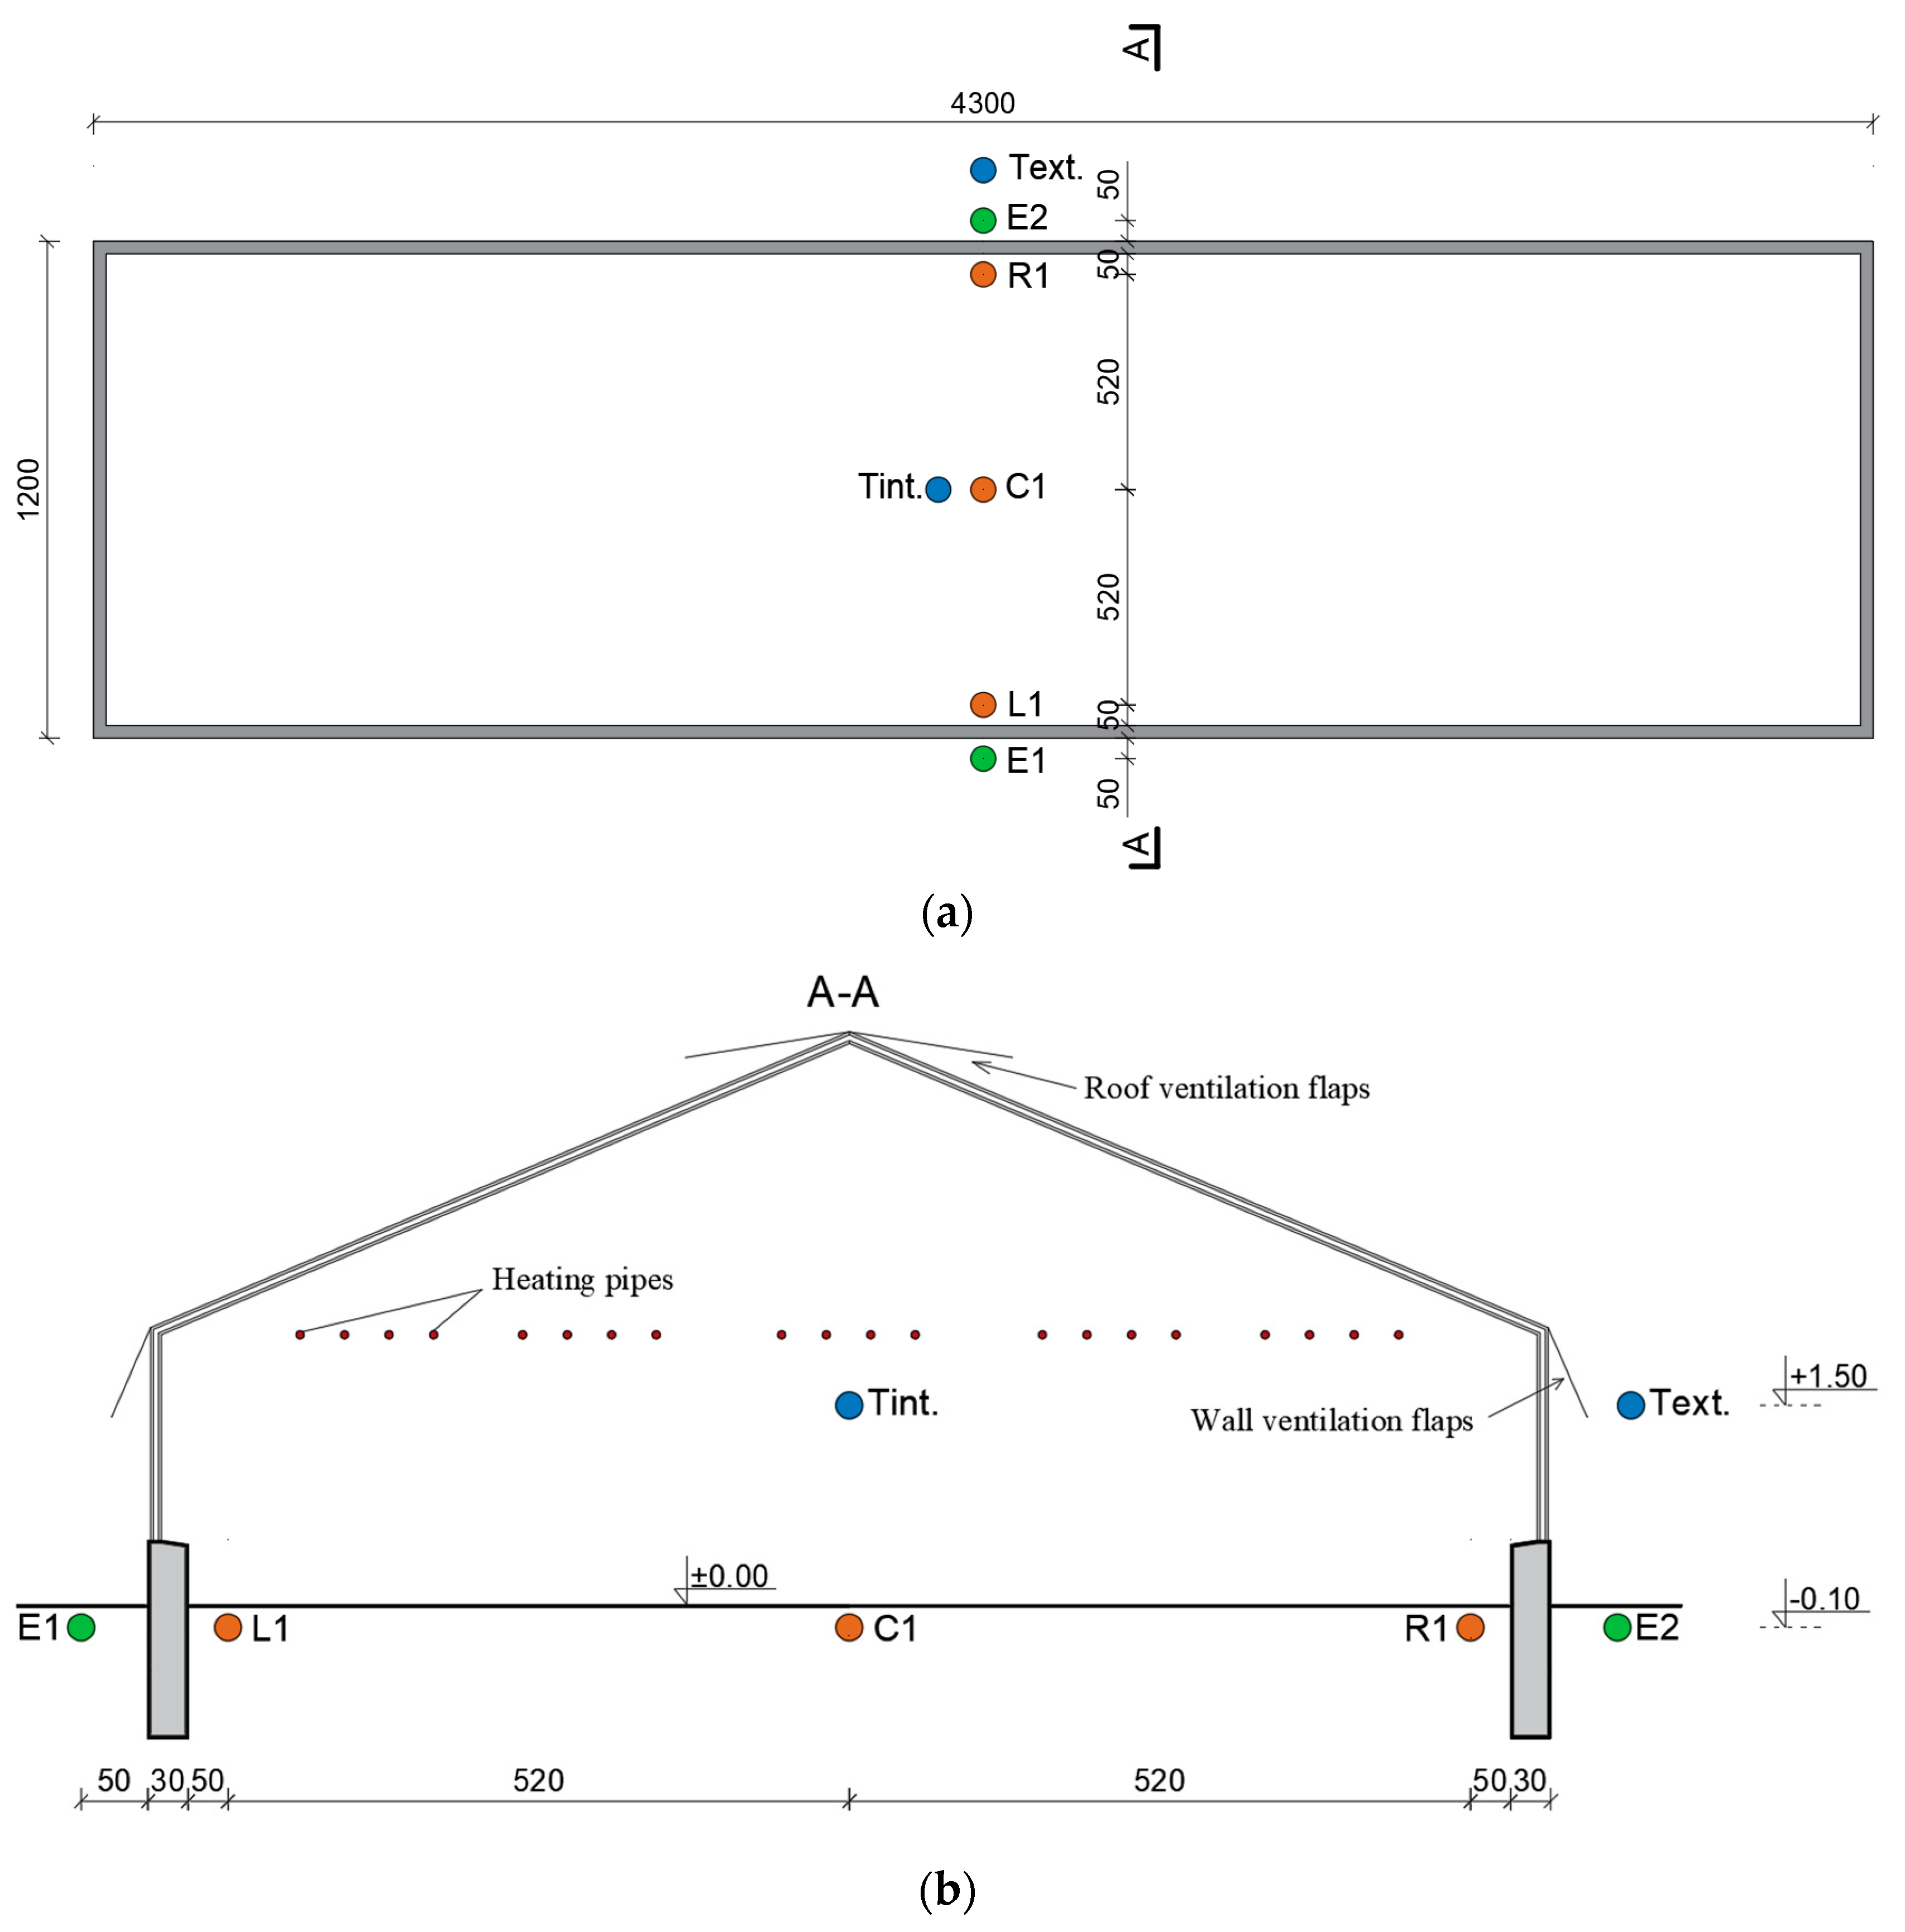
2.1. Research Object and Measuring Apparatus

Field studies were conducted in an existing free-standing greenhouse located in southern Poland. The cultivation area was 483.36 m2. The greenhouse structure was made of steel sections to which a single-layer 4 mm thick glass covering was attached. The structural elements were anchored pointwise in a concrete foundation, which was the foundation of the entire facility. Due to the climate zone and the depth of ground freezing, the foundation was placed at a level of 1.00 m below the ground level. Neither the foundation nor the floor of the greenhouse were thermally insulated. The tested facility was used for flower production (Dianthus caryophyllus). The microclimatic conditions inside the greenhouse were regulated by a heating and ventilation system in order to ensure optimal parameters for plant growth. Air exchange was possible thanks to mechanically tilted vents located in the upper part of the external walls and roof. The heating in the building was provided by a central heating system, fueled by hard coal, with tubular heaters placed along the longitudinal axis of the building, 2.50 m above the ground surface in the greenhouse. The aim was to maintain the internal air temperature in the range of 8 °C to 24 °C. The building did not have an air conditioning system, which made it difficult to regulate the temperature in the warmer period. The ground survey under and around the greenhouse showed that the study area is covered with sandy clay to a depth of 1.50 m. The study was conducted from 21 July 2021 to 20 July 2022. It included continuous measurement of the indoor air temperature (Tint.), outdoor air temperature (Text.) and ground temperature in the greenhouse (L1, C1, R1) and its surroundings (E1 and E2). The location of measurement points was planned at the intersection of the transverse and longitudinal axes of the study object (Figure 1).
The above-mentioned parameters were measured using 7 PT-100 sensors (ACSE Sp. z o.o., Krakow, Poland) with an accuracy of ±0.1 °C and a measurement error of ±0.1 °C. The measurement data were recorded every 60 min on the computer’s hard drive using a multi-channel Hewlett-Packard Data Logger.

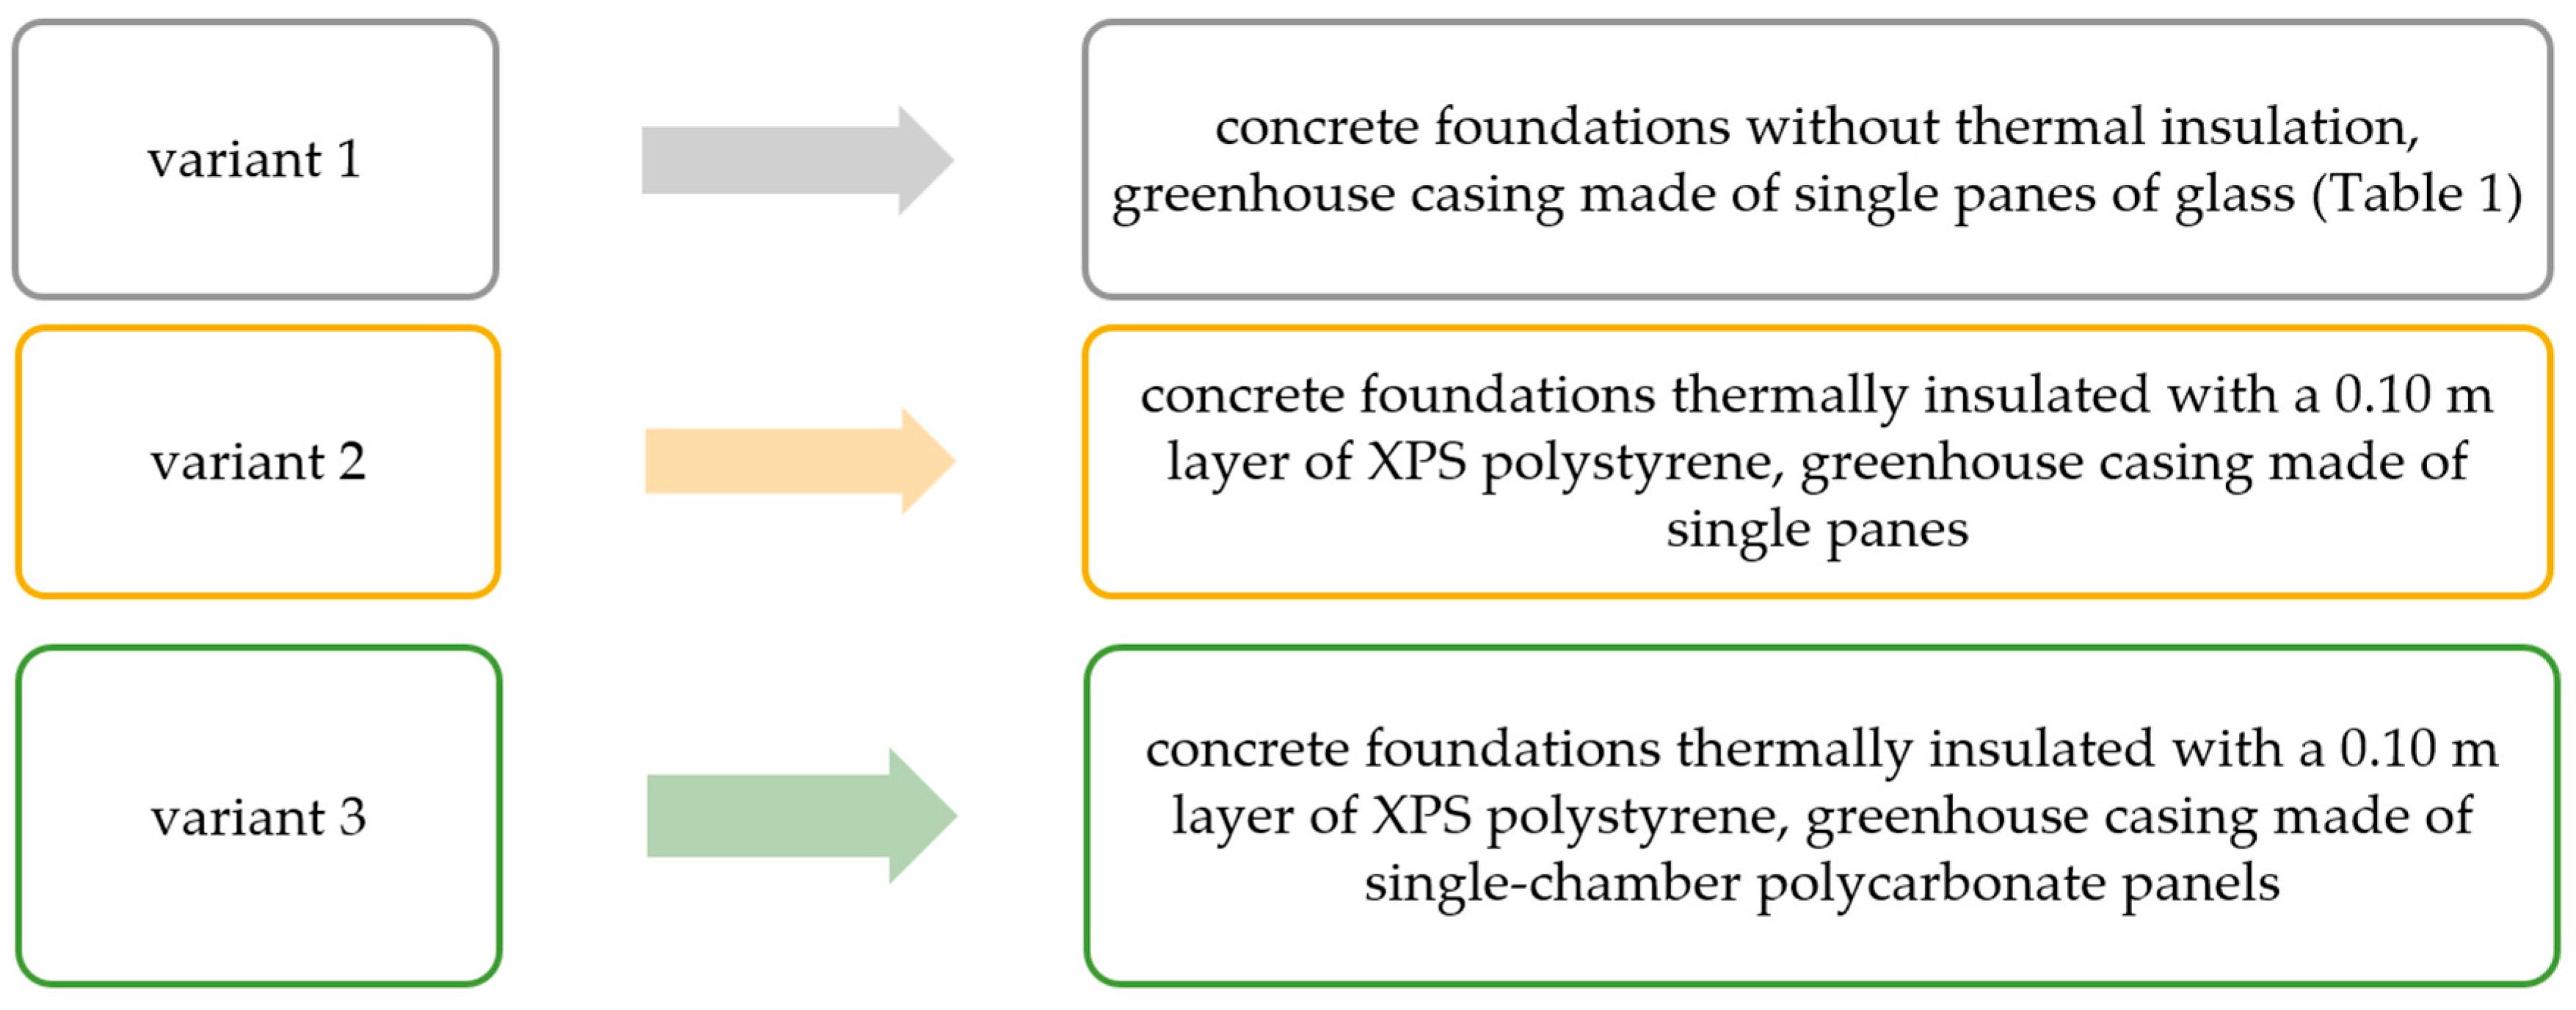
2.2. Method and Calculation Variants

The acquired measurement data were the basis for computer simulations of the energy consumption of the greenhouse under study. The calculations were performed based on the elementary balance method. This method is known for its efficiency and accuracy in modeling three-dimensional and transient heat flow in the context of soil and building component structures. This division process is called model discretization. Energy and temperature balance calculations are performed for each balance-differential element, assuming a specific time interval. A 60-min time step was assumed in the calculations, corresponding to the measurement frequency in real conditions. In order to perform the calculations and detailed analyses, specialized computer software WUFI®Plus (ver. 3.5.0.1, IBP Fraunhofer, Stuttgart, Germany) and the MS Excel and Statistica packages (ver. 13, TIBCO Software, Palo Alto, CA, USA) were used. The calculations were performed based on the elementary balance method. This method involves dividing the complex structure into cuboid balance-differential elements. For each balance-differential element, the technical parameters of the materials used in the model are given, such as: bulk density, specific heat, thermal conductivity coefficient, frame factor, average coefficient of heat gain from solar radiation, external surface emissivity, heat transfer coefficient. The model takes into account the boundary conditions (current values of air temperature inside and outside the analyzed object, the temperature of the ground medium and adiabatic planes) and their variability throughout the entire research period.
The heat flow is calculated in a non-stationary approach, assuming a time step (Formula (1)), where: i—element number, Φixiyiz,…—heat flow between element ixiyiz and neighboring elements [W], Δτ—time step.
ΔQ = Δτ (Φixiyiz,ix+1iyiz + Φixiyiz,ix−1iyiz + Φixiyiz,ixiyiz+1 + Φixiyiz,ixiyiz−1 + Φixiyiz,ixiy+1iz + Φixiyiz,ixiy−1iz)
For each balance-differential element resulting from the prepared geometric model that corresponds to actual dimensions, the energy balance is calculated based on the Crank-Nicolson explicit and implicit difference quotient. The method and equations used were described in detail, among others, in the work of Gdula [36].
The main goal of the simulation was to determine the actual energy demand for heating purposes and to determine the directions and values of heat flow. Three variants of material and construction solutions were adopted for the calculations (Figure 2).
For each calculation variant, the technical parameters of the materials were selected based on the PN:EN 6946:2017 standard [37] (Table 1).
The calculation model assumes the isolation of a ground cuboid under the building and in its surroundings, in which three-dimensional heat flow occurs (Figure 3).
The variant computer simulations were preceded by validation and verification of the computational model. The correct fit of theoretical data resulting from the simulation was verified based on the coefficient of determination (R2) method (Formula (2)), where: mi—is the result of parameter measurement, m ¯ —the average of the parameter measurement, si—the result of parameter simulation, s ¯ —the average of the parameter simulation, and the GOF (goodness-of-fit) method (Formula (3)), where: mi—measurement result, m—the average of the parameter measurement, si—the result of parameter simulation, s—the average of the parameter simulation [38,39]. The coefficient of determination (R2) method assumes that the simulation data are correctly fitted if more than 75% of the data shows compliance. In the case of the GOF method, at least 80% compliance between the actual and measurement data is required.
R 2 = i = 1 n m i m ¯ · ( s i s ¯ ) i = 1 n m i m ¯ 2 · i = 1 n s i s ¯ 2 2 · 100 [ % ]
G O F = 1 i = 1 n m i s i 2 i = 1 n s i m ¯ 2 · 100   [ % ]
Theoretical data were also assessed against the actual data using Spearman’s statistical correlation analysis. The results were supplemented with a graphical interpretation of the data distribution on box-plot charts. Theoretical data obtained from variant simulations performed on the previously validated model were then used to estimate the energy demand and heat flow directions from the tested greenhouse. The annual demand for fuel for heating purposes was calculated using Formula (4), where: B—annual fuel demand [kg/year], Q—annual energy demand [MJ], Wo—calorific value of the energy carrier [MJ/year], η—efficiency of the heating device [-]. Then, pollutant emissions were calculated based on Formula (5), where: E—pollutant emission [kg], EF—emission factor [g/GJ]. The calculation methodology was carried out based on the guidelines recommended by the National Centre for Emission Management and Balancing (KOBIZE), (Table 2). This method allows for determining the emission of selected pollutants into the atmosphere for heating systems diversified in terms of the heat carrier [40,41].
B = Q W o · η
E = B · W o · E F · 10 6
For each variant, the efficiency of the coal boiler was assumed to be η = 0.75 and the efficiency of the gas boiler to be η = 0.92. The simulations also included air infiltration into the building at the level of 0.5 h−1. Other parameters, such as wind speed and direction, total precipitation and solar radiation intensity, were assumed based on the data obtained for a typical meteorological year (Figure 4). These data were also implemented during the variant simulation process.

3. Results

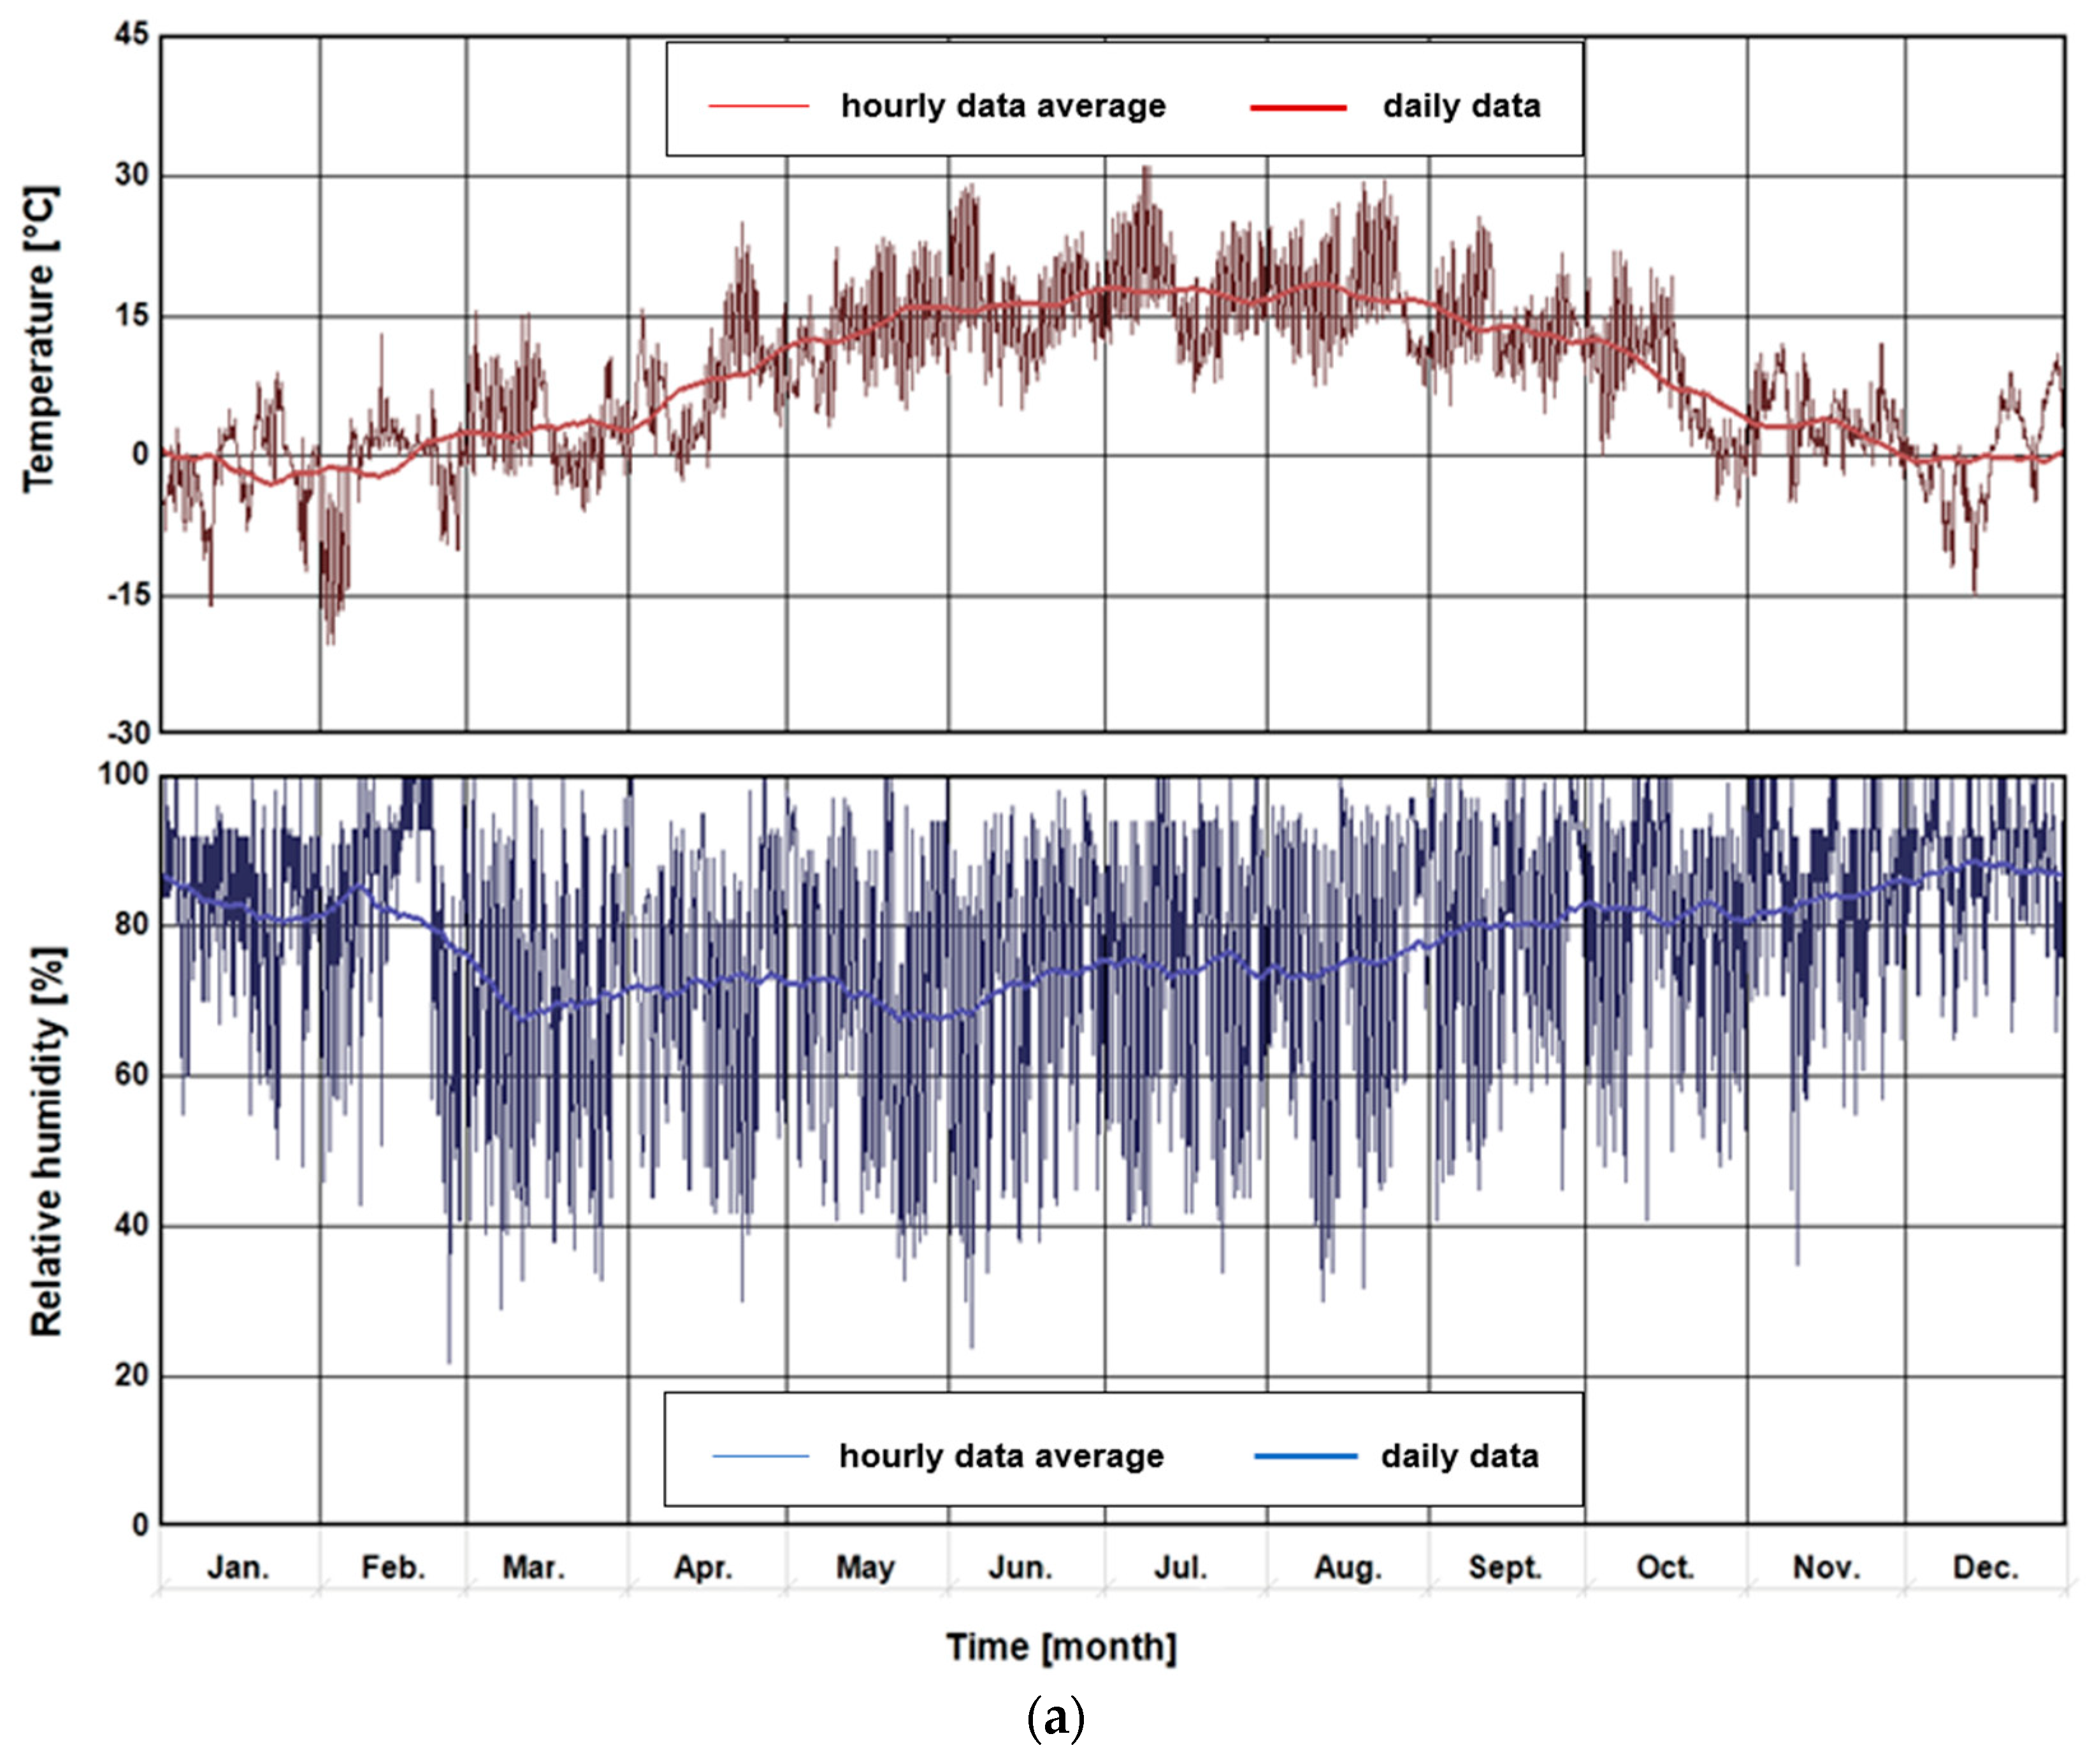
3.1. Analysis of Measurement Data

The results of the Tint. and Text. measurement data were analyzed for the entire measurement period (Figure 5). In the case of Tint., the recommended values for the type of crop were exceeded. In total, 24 °C was exceeded for 995 h (11% of the total length of the research period). Tint. reached values lower than the minimum recommended value (8 °C) for a total of 1116 h, which corresponds to 13% of the length of the research.
The average Tint. value for the period studied was 14.7 °C with a standard deviation of 7.1 °C. The average Text. value was 7.4 °C with a standard deviation of 10.6 °C. In order to determine the heat flow through the soil substrate, taking into account this area for the greenhouse energy analysis, ground temperature measurements were carried out (Figure 6). During the spring and summer, heat transfers vertically or diagonally downward from the entire greenhouse floor into the deeper layers of the ground. In contrast, during autumn and early winter, the heat flow reverses, moving vertically and diagonally upward from the ground back into the greenhouse. In the summer, the temperature distribution in the upper ground layer showed that ground temperatures decreased approximately 6 h more slowly than the minimum air temperature. This caused a moderate rise in air temperature. Over a 24-h measurement period, the direction of heat flow shifted. During the day, heat moved from the air into the top layer of the ground.
In winter, temperatures at a depth of −0.10 m displayed maximum and minimum values with a noticeable delay compared to air temperature near the ground. This delay, along with shifts in heat flow direction, contributed to greater thermal stability in the plant zone. For most of the day—including afternoon, night, and morning hours—the upper ground layer absorbed heat from deeper layers and transferred it to the air inside. Around midday, when air temperatures in the greenhouse peaked, heat flowed from both the air and deeper ground layers into the top layer of the ground.
The average ground temperature at point C1 was similar to the average Tint. value and amounted to 14.8 °C. At points L1 and R1, the ground was cooled by 1.1–1.4 °C compared to point C1 due to strong interaction with the external microclimate and a lack of thermal insulation. The operation of the heating system and the impact of the external microclimate contributed to significant diversification of the thermal conditions of the ground inside the greenhouse. The range of data for points L1, C1 and R1 indicates differences in ground temperature ranging from 19.8 °C to 22.3 °C, and at points E1 and E2 from 21.8 °C to 22.6 °C. The detailed data distribution is presented in the box-plot (Figure 7).

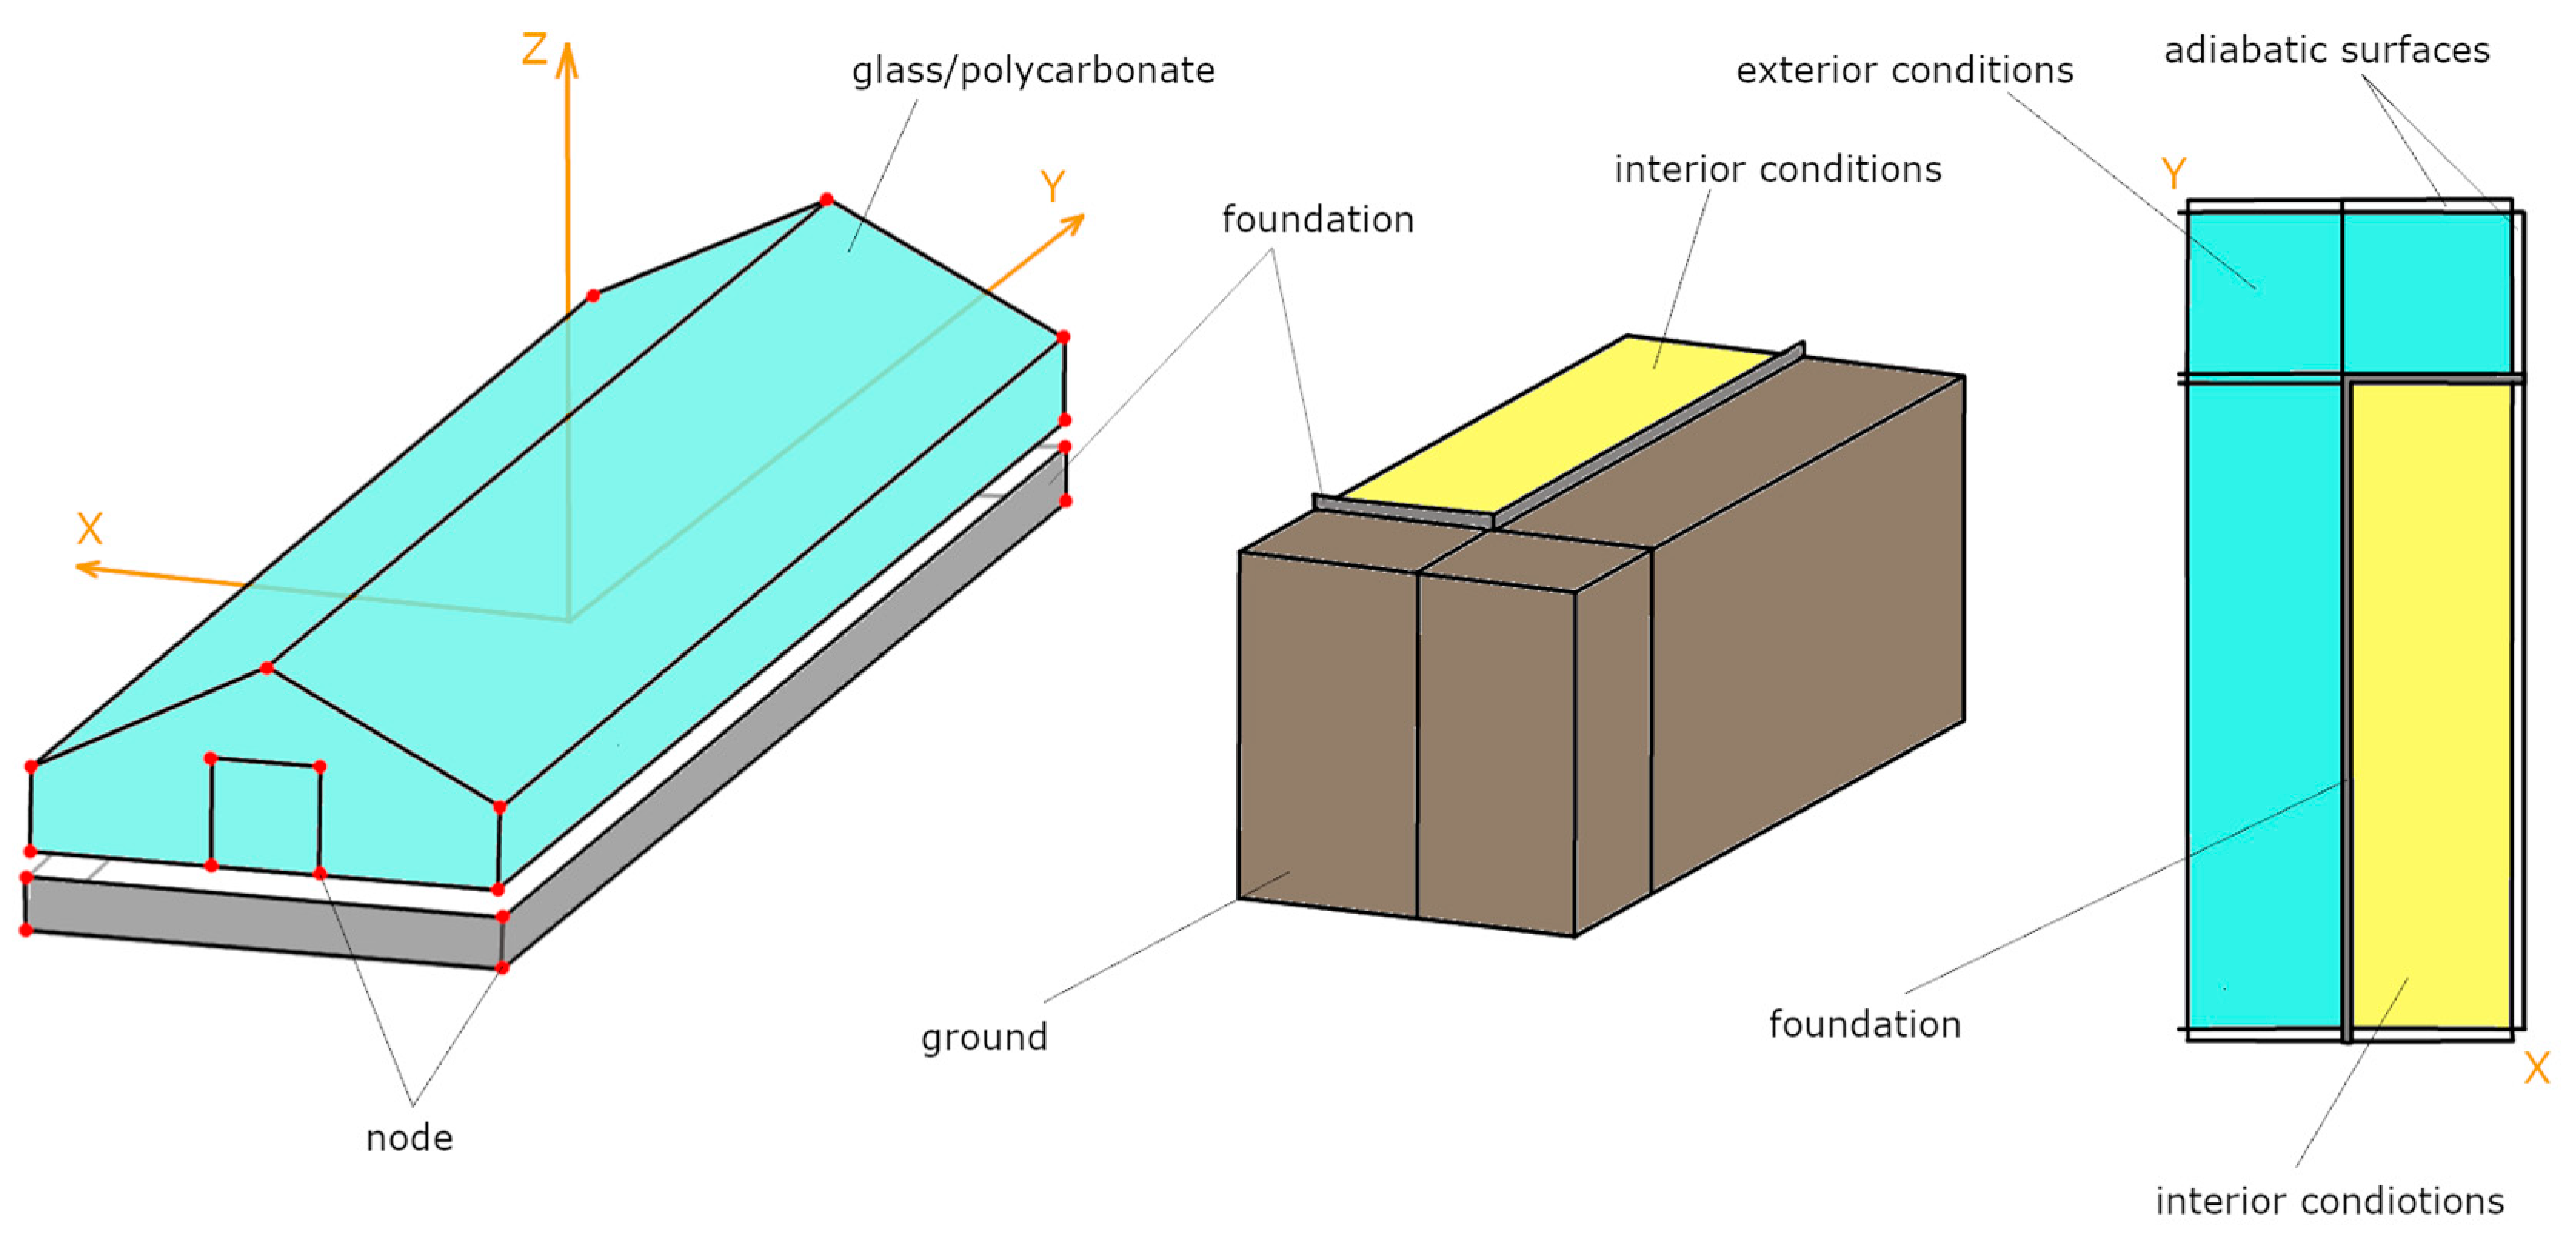
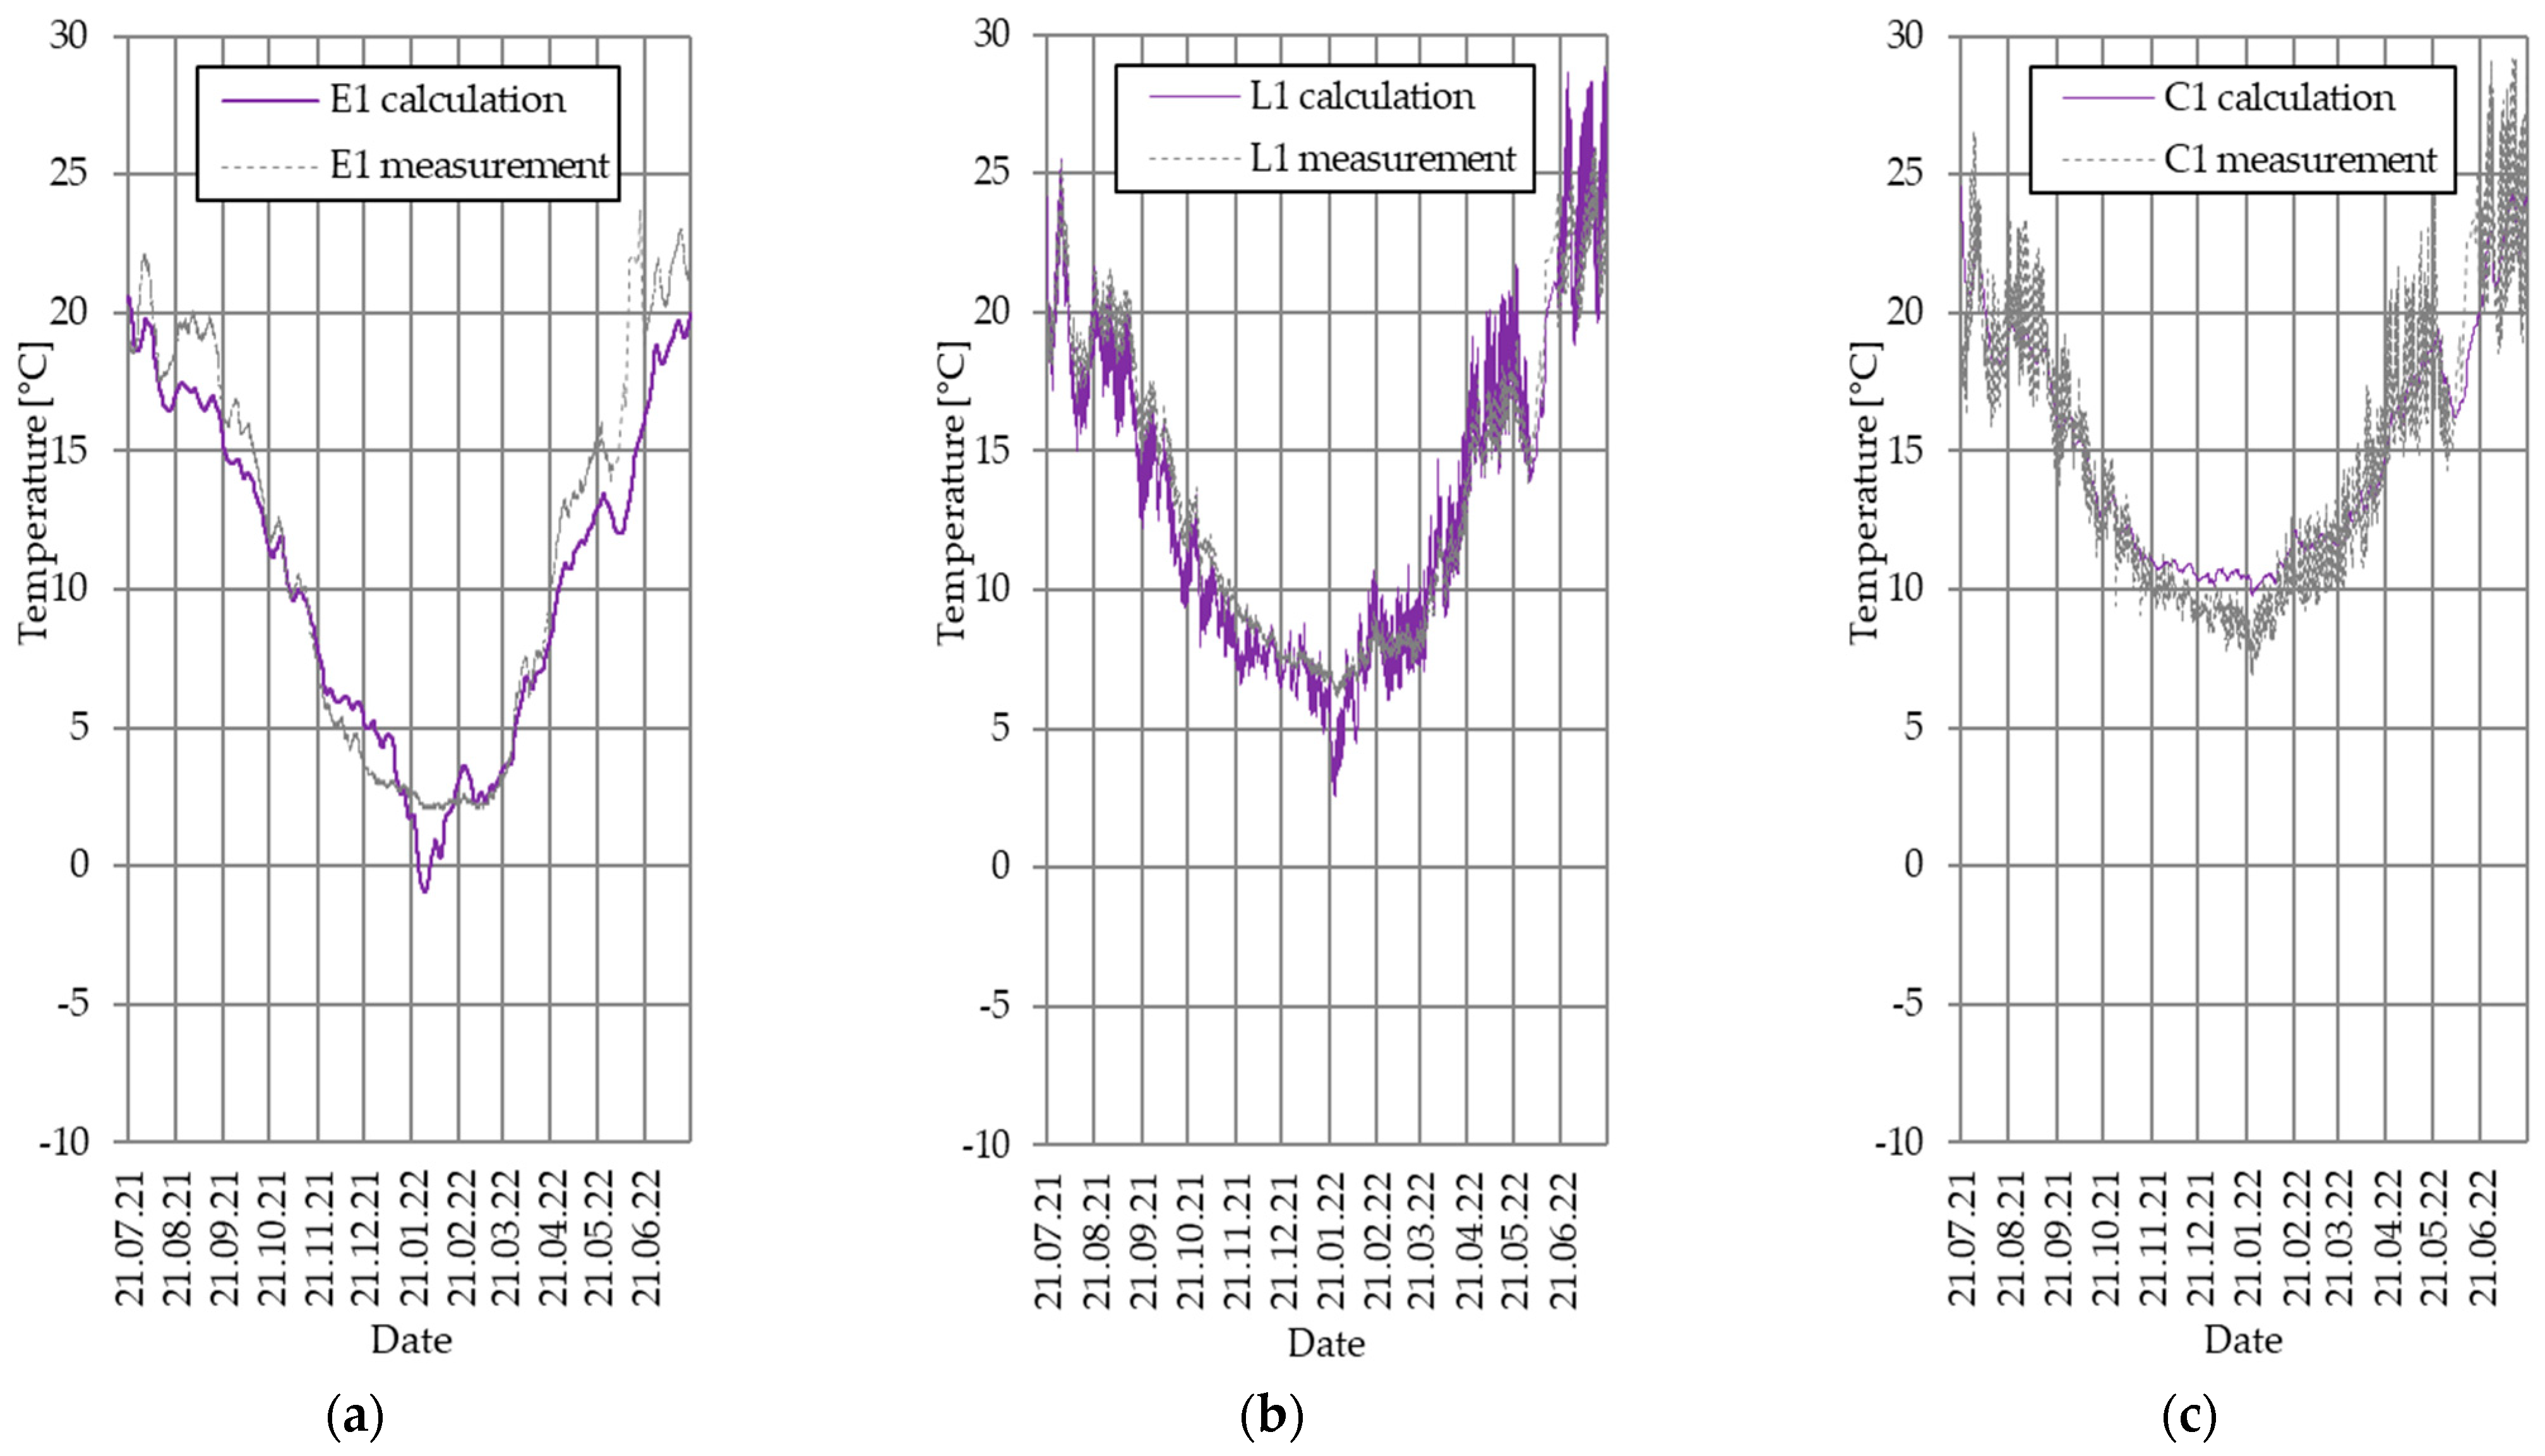
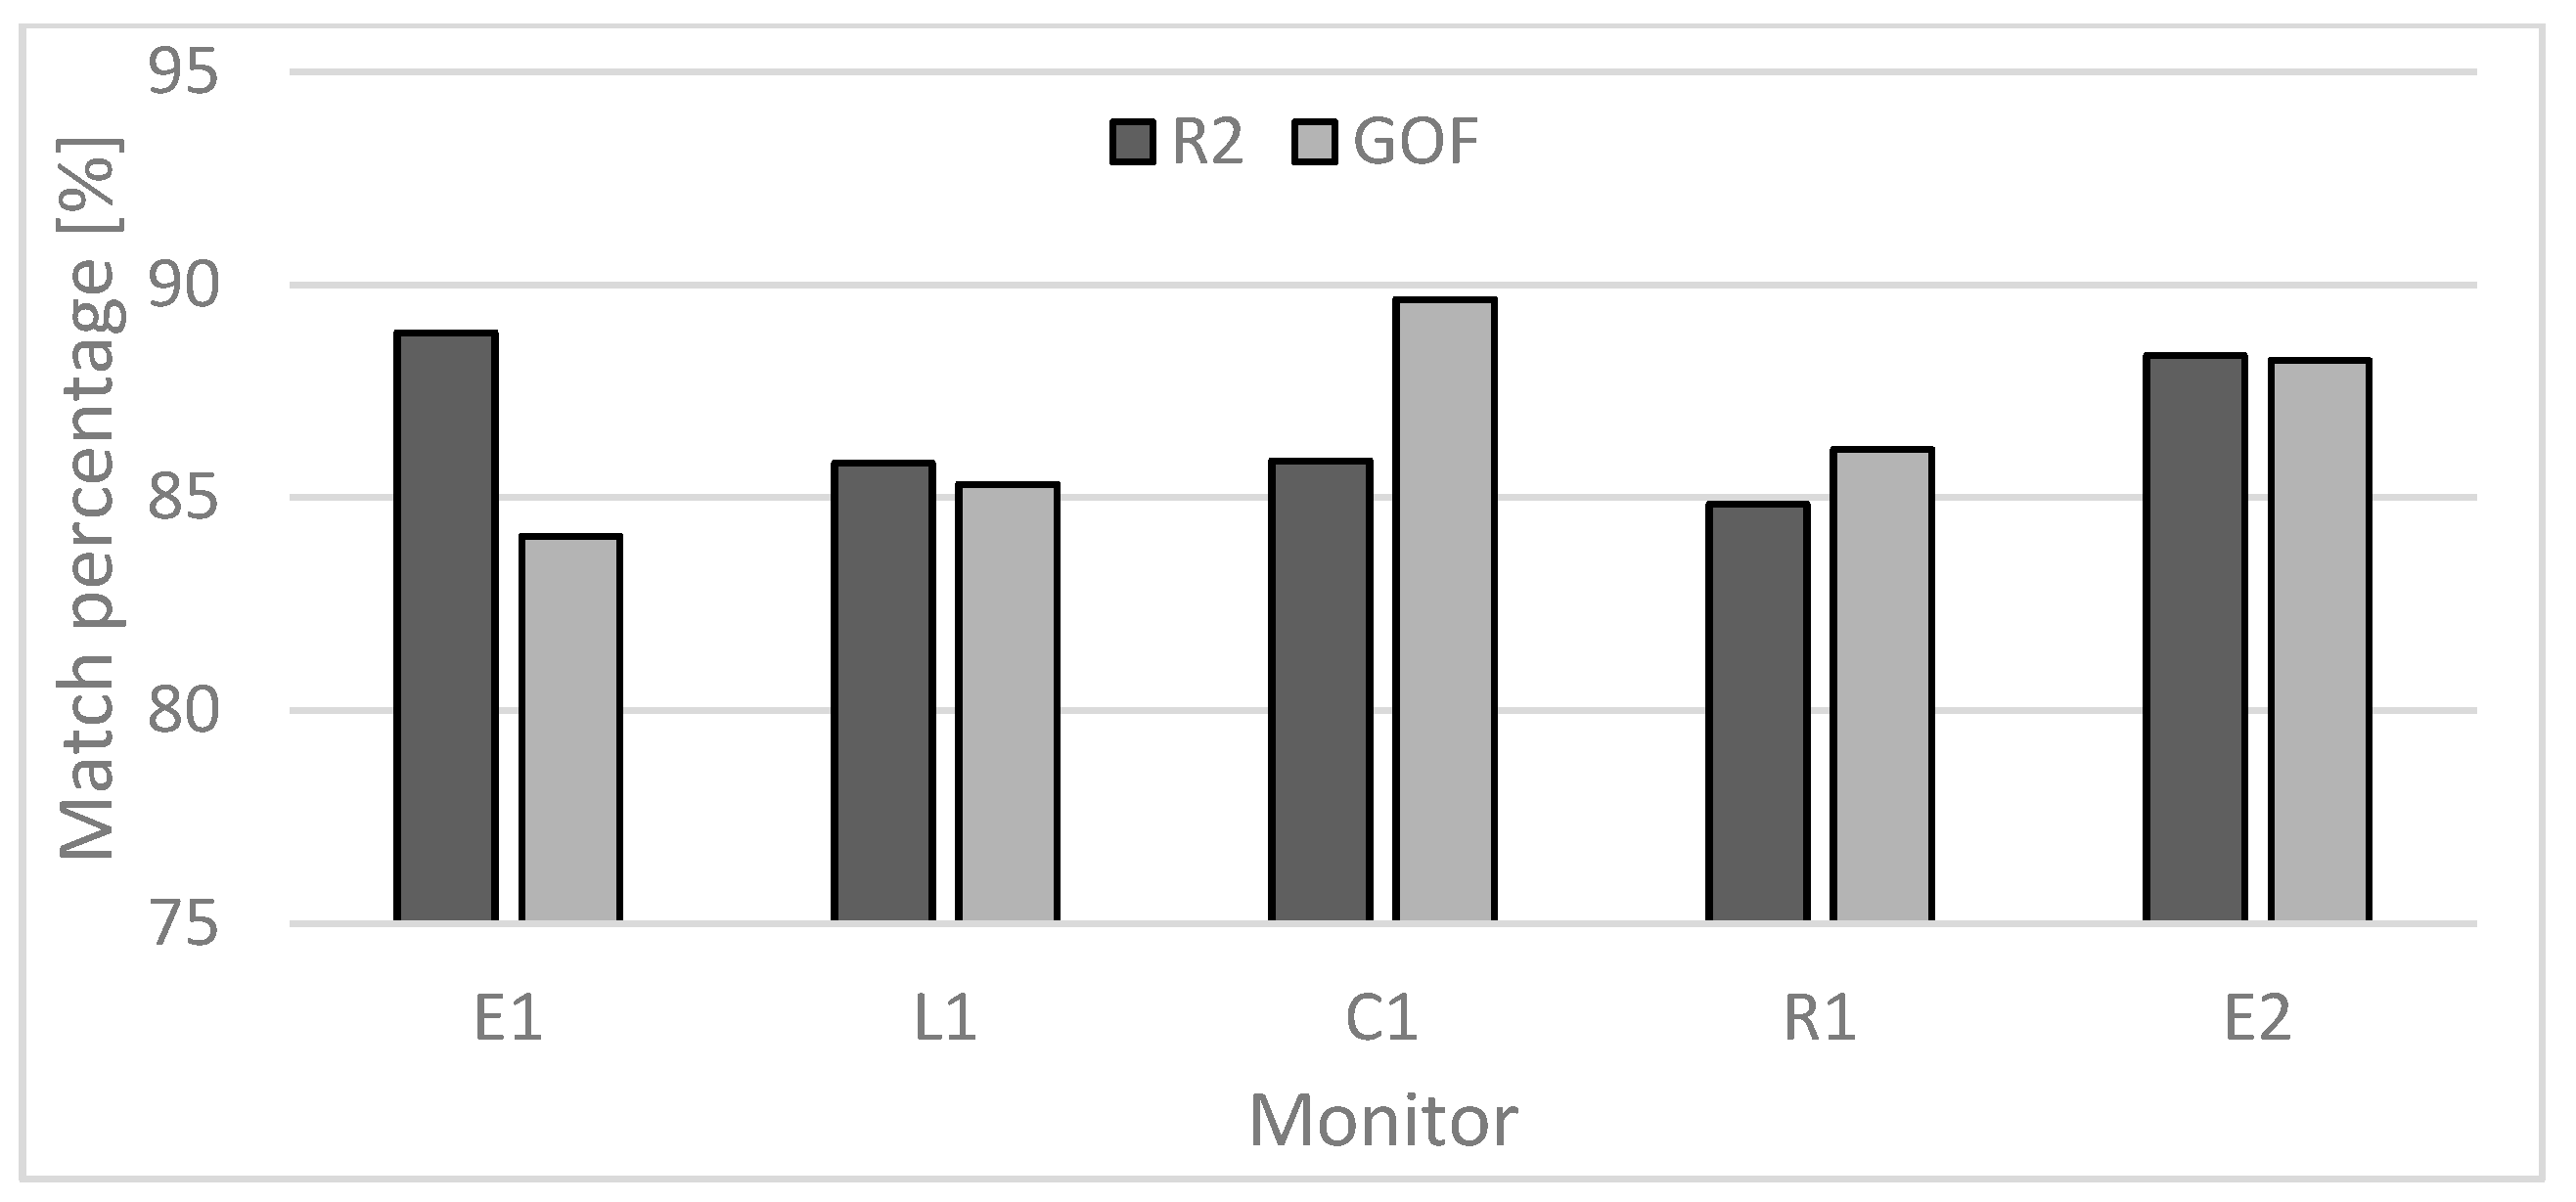
3.2. Validation and Verification of the Computational Model

The acquired measurement data were implemented for calculations using the numerical method of elementary balances, supported by specialist engineering software WUFI®Plus. The model validation was presented on the example of ground temperature for three selected measurement points, E1, L1 and C1 (Figure 8). Points E1 and E2 were characterized by temperature characteristics that did not differ statistically significantly (p < 0.05). Analysis of the obtained results showed a very strong correlation between actual and calculated data (0.92, Spearman correlation) and no statistically significant differences (p < 0.05). Verification of the reliability of the validated model performed using the R2 and GOF methods showed a high compliance of actual and calculated data (Figure 9). In the case of all measurement points, compliance was achieved at the level of 85–89% for the R2 method and 84–88% for the GOF method.

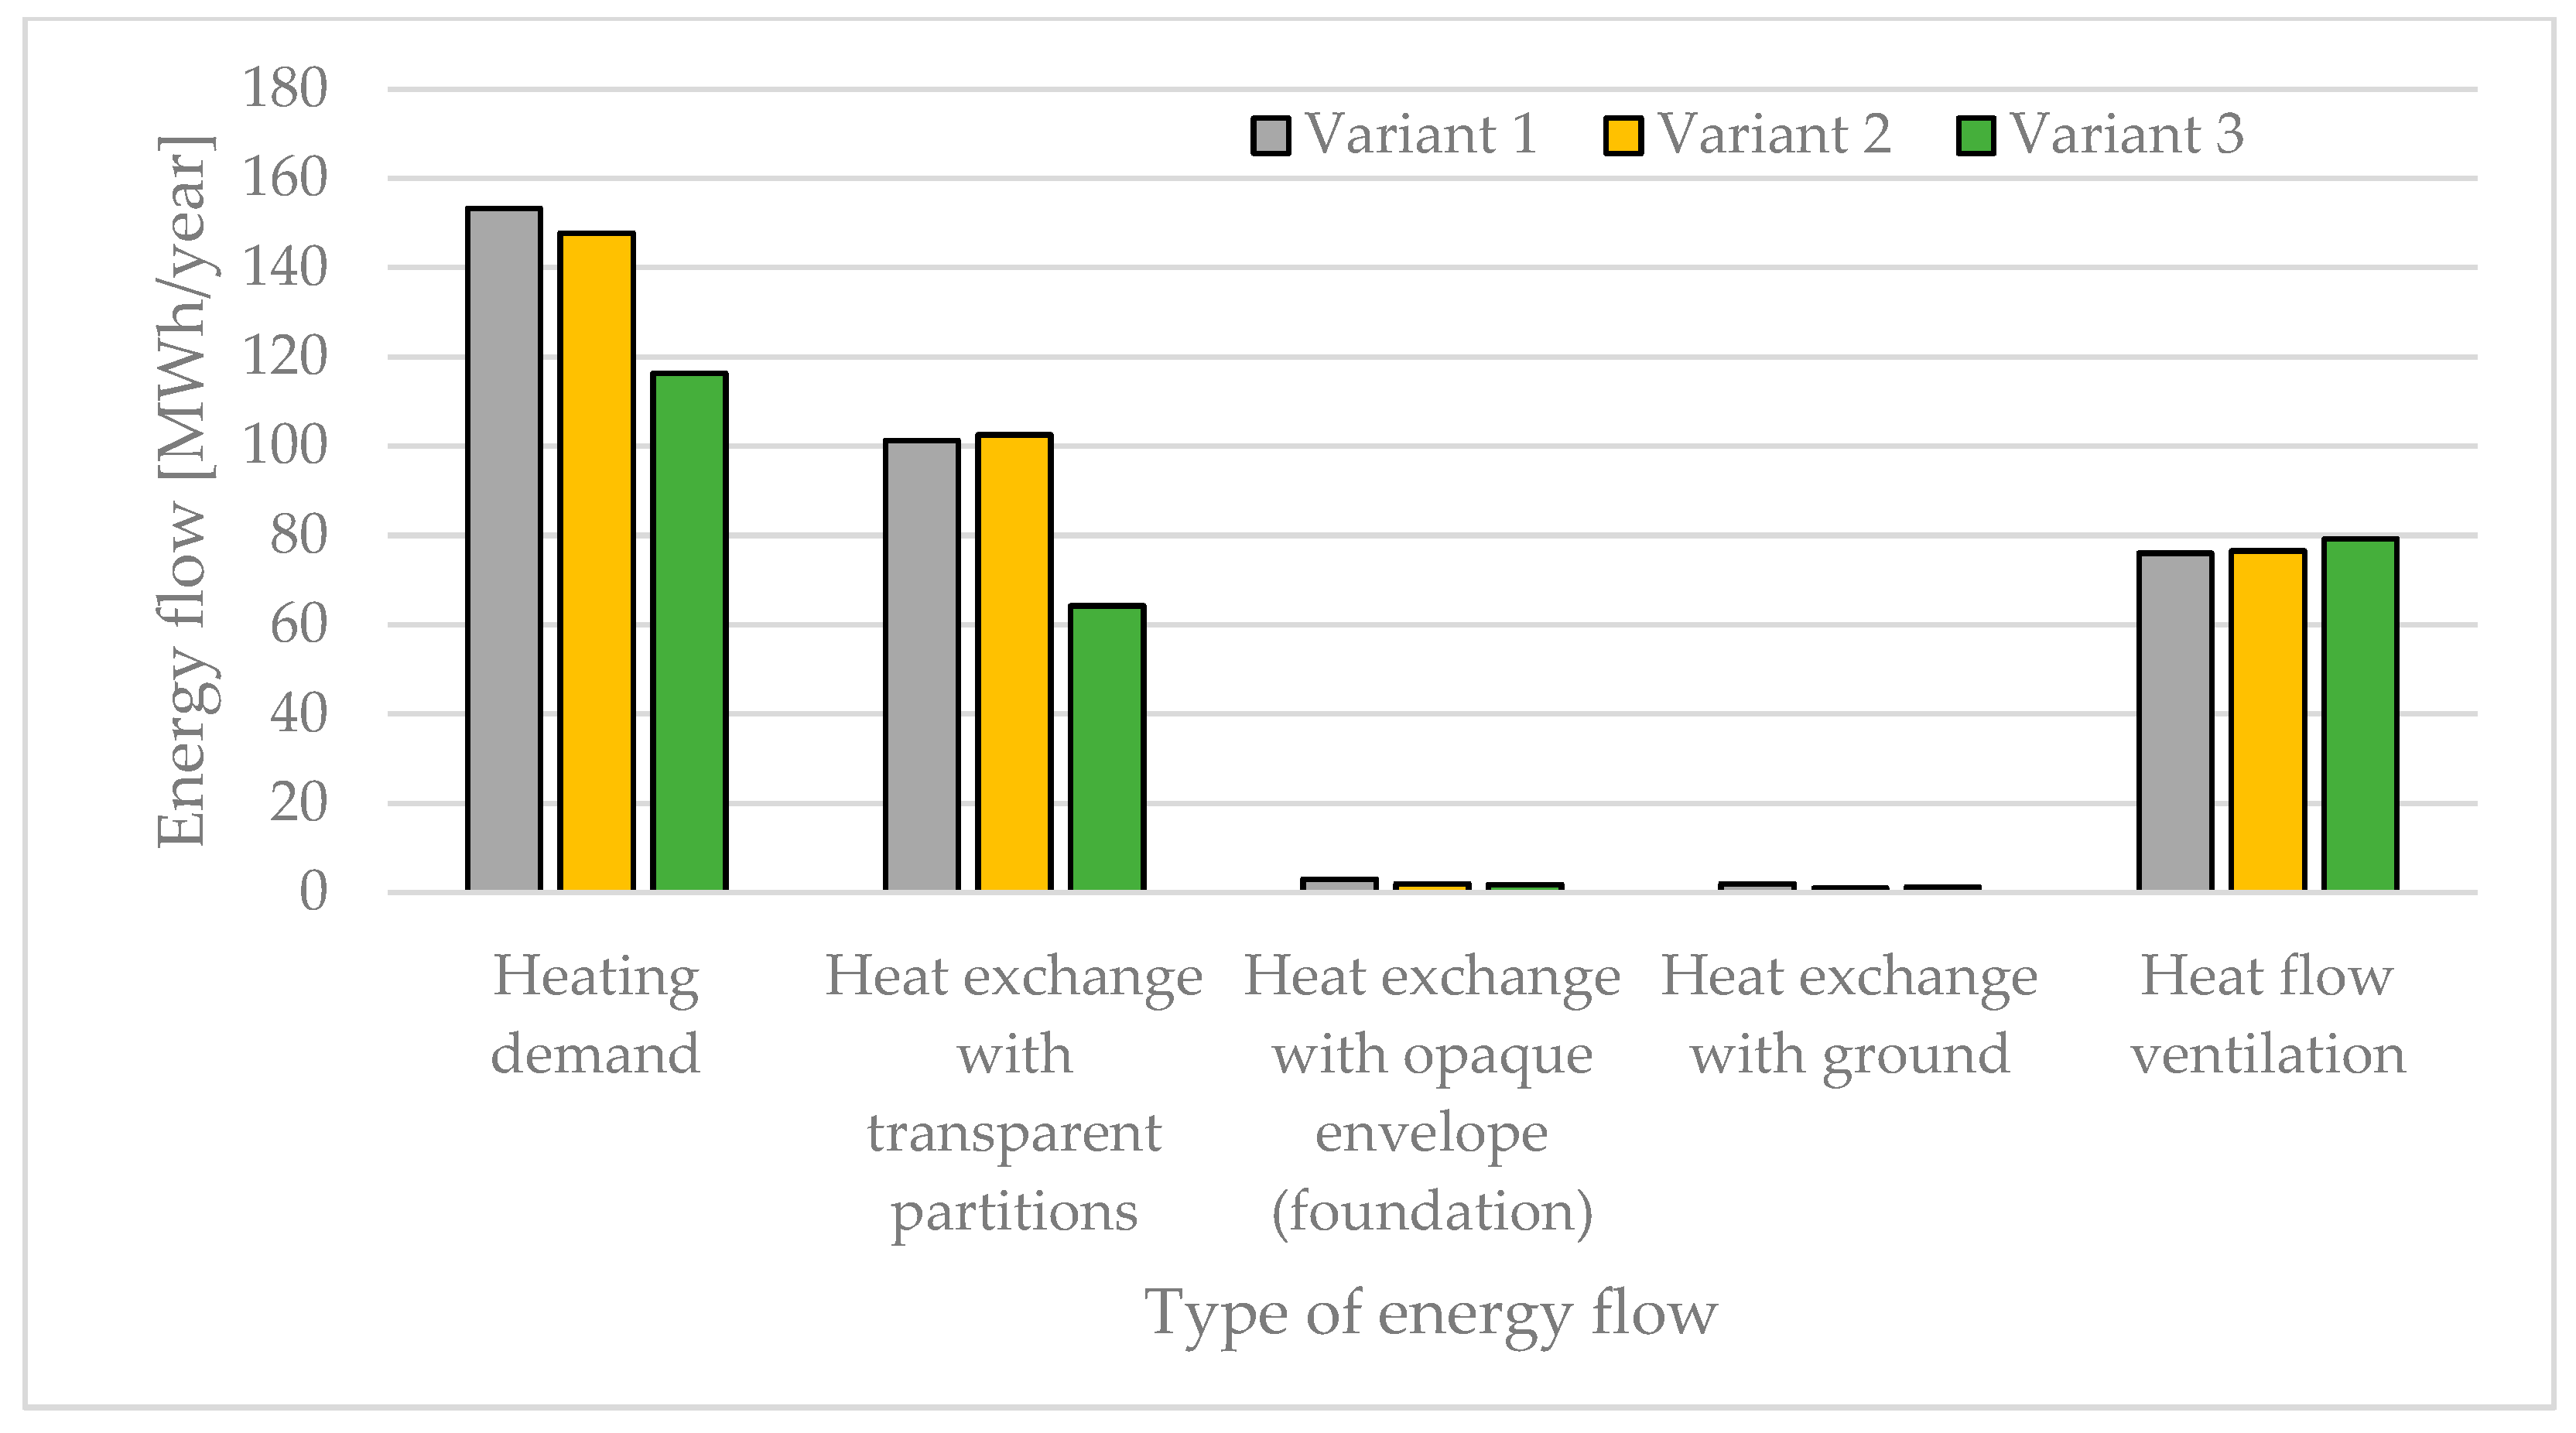
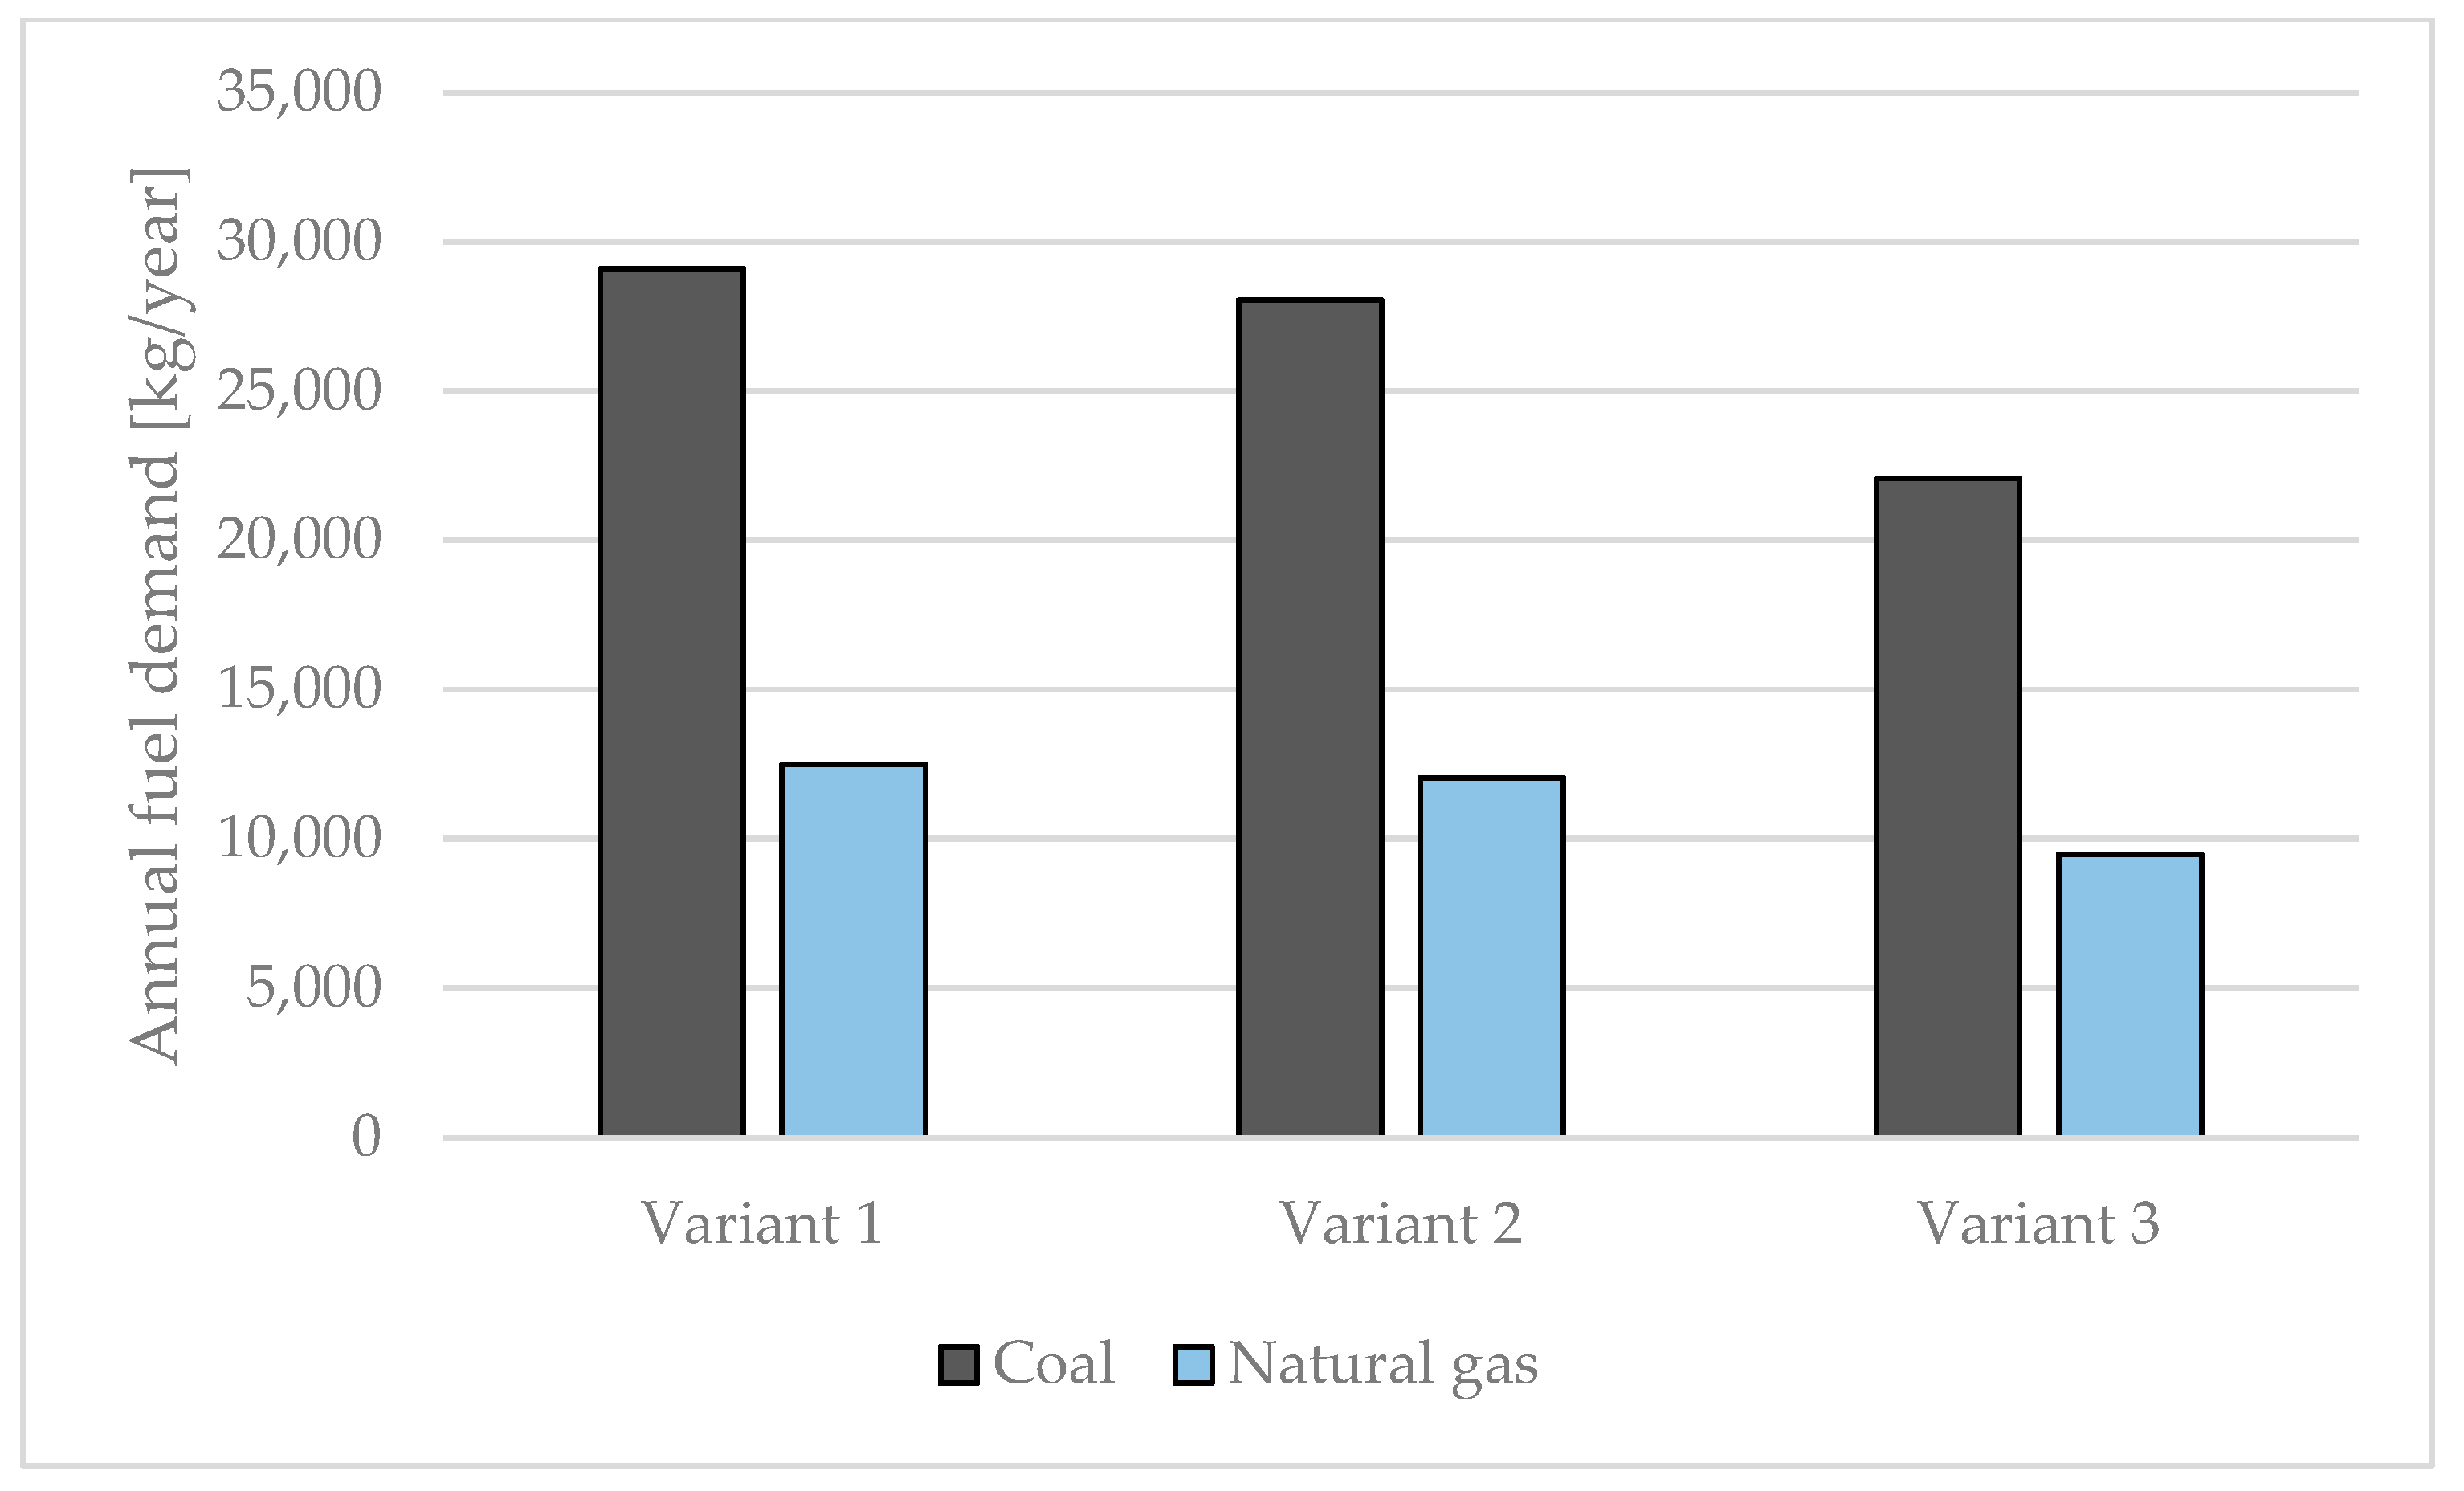
3.3. Variant Analysis

Energy analysis was carried out for three variants, discussed in detail in Section 2.2. In the case of variant 1, which in terms of material and construction solutions corresponded to the actual construction of the greenhouse, it was found that the annual energy demand for heating purposes amounted to 153,234 kWh/year. In variant 2, in which additional thermal insulation of the zero state was used, the energy demand for heating purposes was lower and amounted to 147,704 kWh/year. The lowest heat load was characteristic of variant 3, in which 116,294 kWh/year was required to cover heating needs (Figure 10). The use of thermal insulation of the foundations contributed to energy savings of 4% per year. Analysis of the research results for variant 3 showed, in turn, that the use of single-chamber polycarbonate for the greenhouse casing, together with the insulation of its foundations, can allow for energy savings of around 24% per year. It should be noted that the above results were obtained for the same indoor air temperature requirements (8–24 °C), and for other assumptions (e.g., for a different type of crop) the results may be different.
The obtained results of the energy consumption simulation were used in the next step of the analysis to calculate the emission of pollutants into the atmosphere. The computational analysis referred to two types of energy carrier, hard coal (actual state) and an alternative fuel—natural gas. The highest demand for fuel for heating purposes was noted for variant 1 (29,095 kg of coal or 12,492 kg of gas). Due to the increased thermal protection of the greenhouse casing and foundations, the lowest fuel demand was found for variant 3 (22,081 kg of coal or 9480 kg of gas) (Figure 11).
Emissions of harmful compounds were determined for total dust, carbon dioxide and nitrogen and sulfur oxides (Figure 12).
The analysis of the emissions of the aforementioned compounds in relation to the unit of crop area in the tested greenhouse showed that the total emission for variant 1 is 148 kg/m2. In variant 2, the total emission was reduced by 5.34 kg/m2. The lowest unit emission value was recorded in variant 3 (112.36 kg/m2). The aforementioned values refer to the case when the greenhouse is heated by a coal boiler with an efficiency of η = 0.75. In the case of changing the fuel to natural gas (boiler efficiency η = 0.92), a unit emission reduction for each of the variants was found at the level of 51% (from 58 kg/m2 to 76 kg/m2 lower emission of harmful compounds).

4. Discussion

The article uses a numerical model based on the elementary balance method, which effectively and precisely allows for heat flow modeling, especially in the analysis of three-dimensional structures, for the adopted boundary conditions and assumptions [42,43]. The model was validated based on year-round, real measurement data, which significantly influenced the reliability of the obtained simulation results. The obtained results showed a high agreement between theoretical and real data (85–89% for the coefficient of determination (R2) and 84–88% for the GOF method). The high correlation of data from simulations with real data suggests that the model reflects the real operating conditions of the greenhouse for the adopted assumptions well, which confirms its usefulness for further energy and environmental analyses [37,44]. It is also worth mentioning the potential limitations of numerical modeling. The models are based on certain simplifications (e.g., regarding material parameters or climatic conditions). Real conditions, such as changing precipitation or seasonal climate variability (periodically lying snow cover), can affect the obtained simulation results in a more dynamic way than the model predicts. However, with the appropriate selection of input parameter values, these limitations can be minimized, and the reliability of the obtained theoretical data can be verified by using indicators and methods such as R2 or GOF [38,44]. The conducted studies have shown that the numerical method can be used for indirect estimation of potential energy savings and reduction of pollutant emissions for different material and construction solutions. The use of such methods significantly speeds up the analysis process and is crucial in planning future technical improvements and optimizing existing buildings [45,46,47]. The use of modern thermal insulation materials, such as XPS polystyrene insulation and single-chamber polycarbonate panels, had a significant impact on reducing energy demand and emissions of pollutants into the atmosphere. Variant 3, which included both foundation insulation and polycarbonate panels, brought the greatest energy savings (24%) and the greatest reduction in CO2, dust and sulfur oxide emissions. The analyzed technical solutions can significantly improve the energy efficiency of this type of building, not only reducing their carbon footprint, but also contributing to more sustainable use of the facility in long-term operations [23,48,49,50]. It should be noted that the results of the current research are based on climate data for one location. In the future, the authors plan to extend the research with comparative analyses for different regions characterized by different climatic conditions. This may allow for a more precise definition of the tested assumptions in different atmospheric conditions. Continuing research will also include expanding the analysis to include other heat sources and heating systems such as hybrid systems (combining renewable energy with traditional sources) or solely systems based on renewable energy sources.

5. Conclusions

The use of more efficient energy solutions and clean energy sources has great potential to reduce the greenhouse sector’s carbon footprint. The verified numerical model enabled the performance of variant analyses of different material and construction configurations of greenhouses. Thanks to the model, it was possible to estimate potential energy savings and reductions in pollutant emissions, which is crucial for planning future research related to greenhouse modernization and optimization. The following conclusions were drawn:
  • The appropriate selection of materials and construction solutions significantly affects the energy demand of greenhouses.
  • The use of foundation insulation and single-chamber polycarbonate panels (instead of single panes) in variant 3 achieved energy savings of 24% compared to the initial variant 1.
  • Foundation insulation contributed to energy savings by 4%.
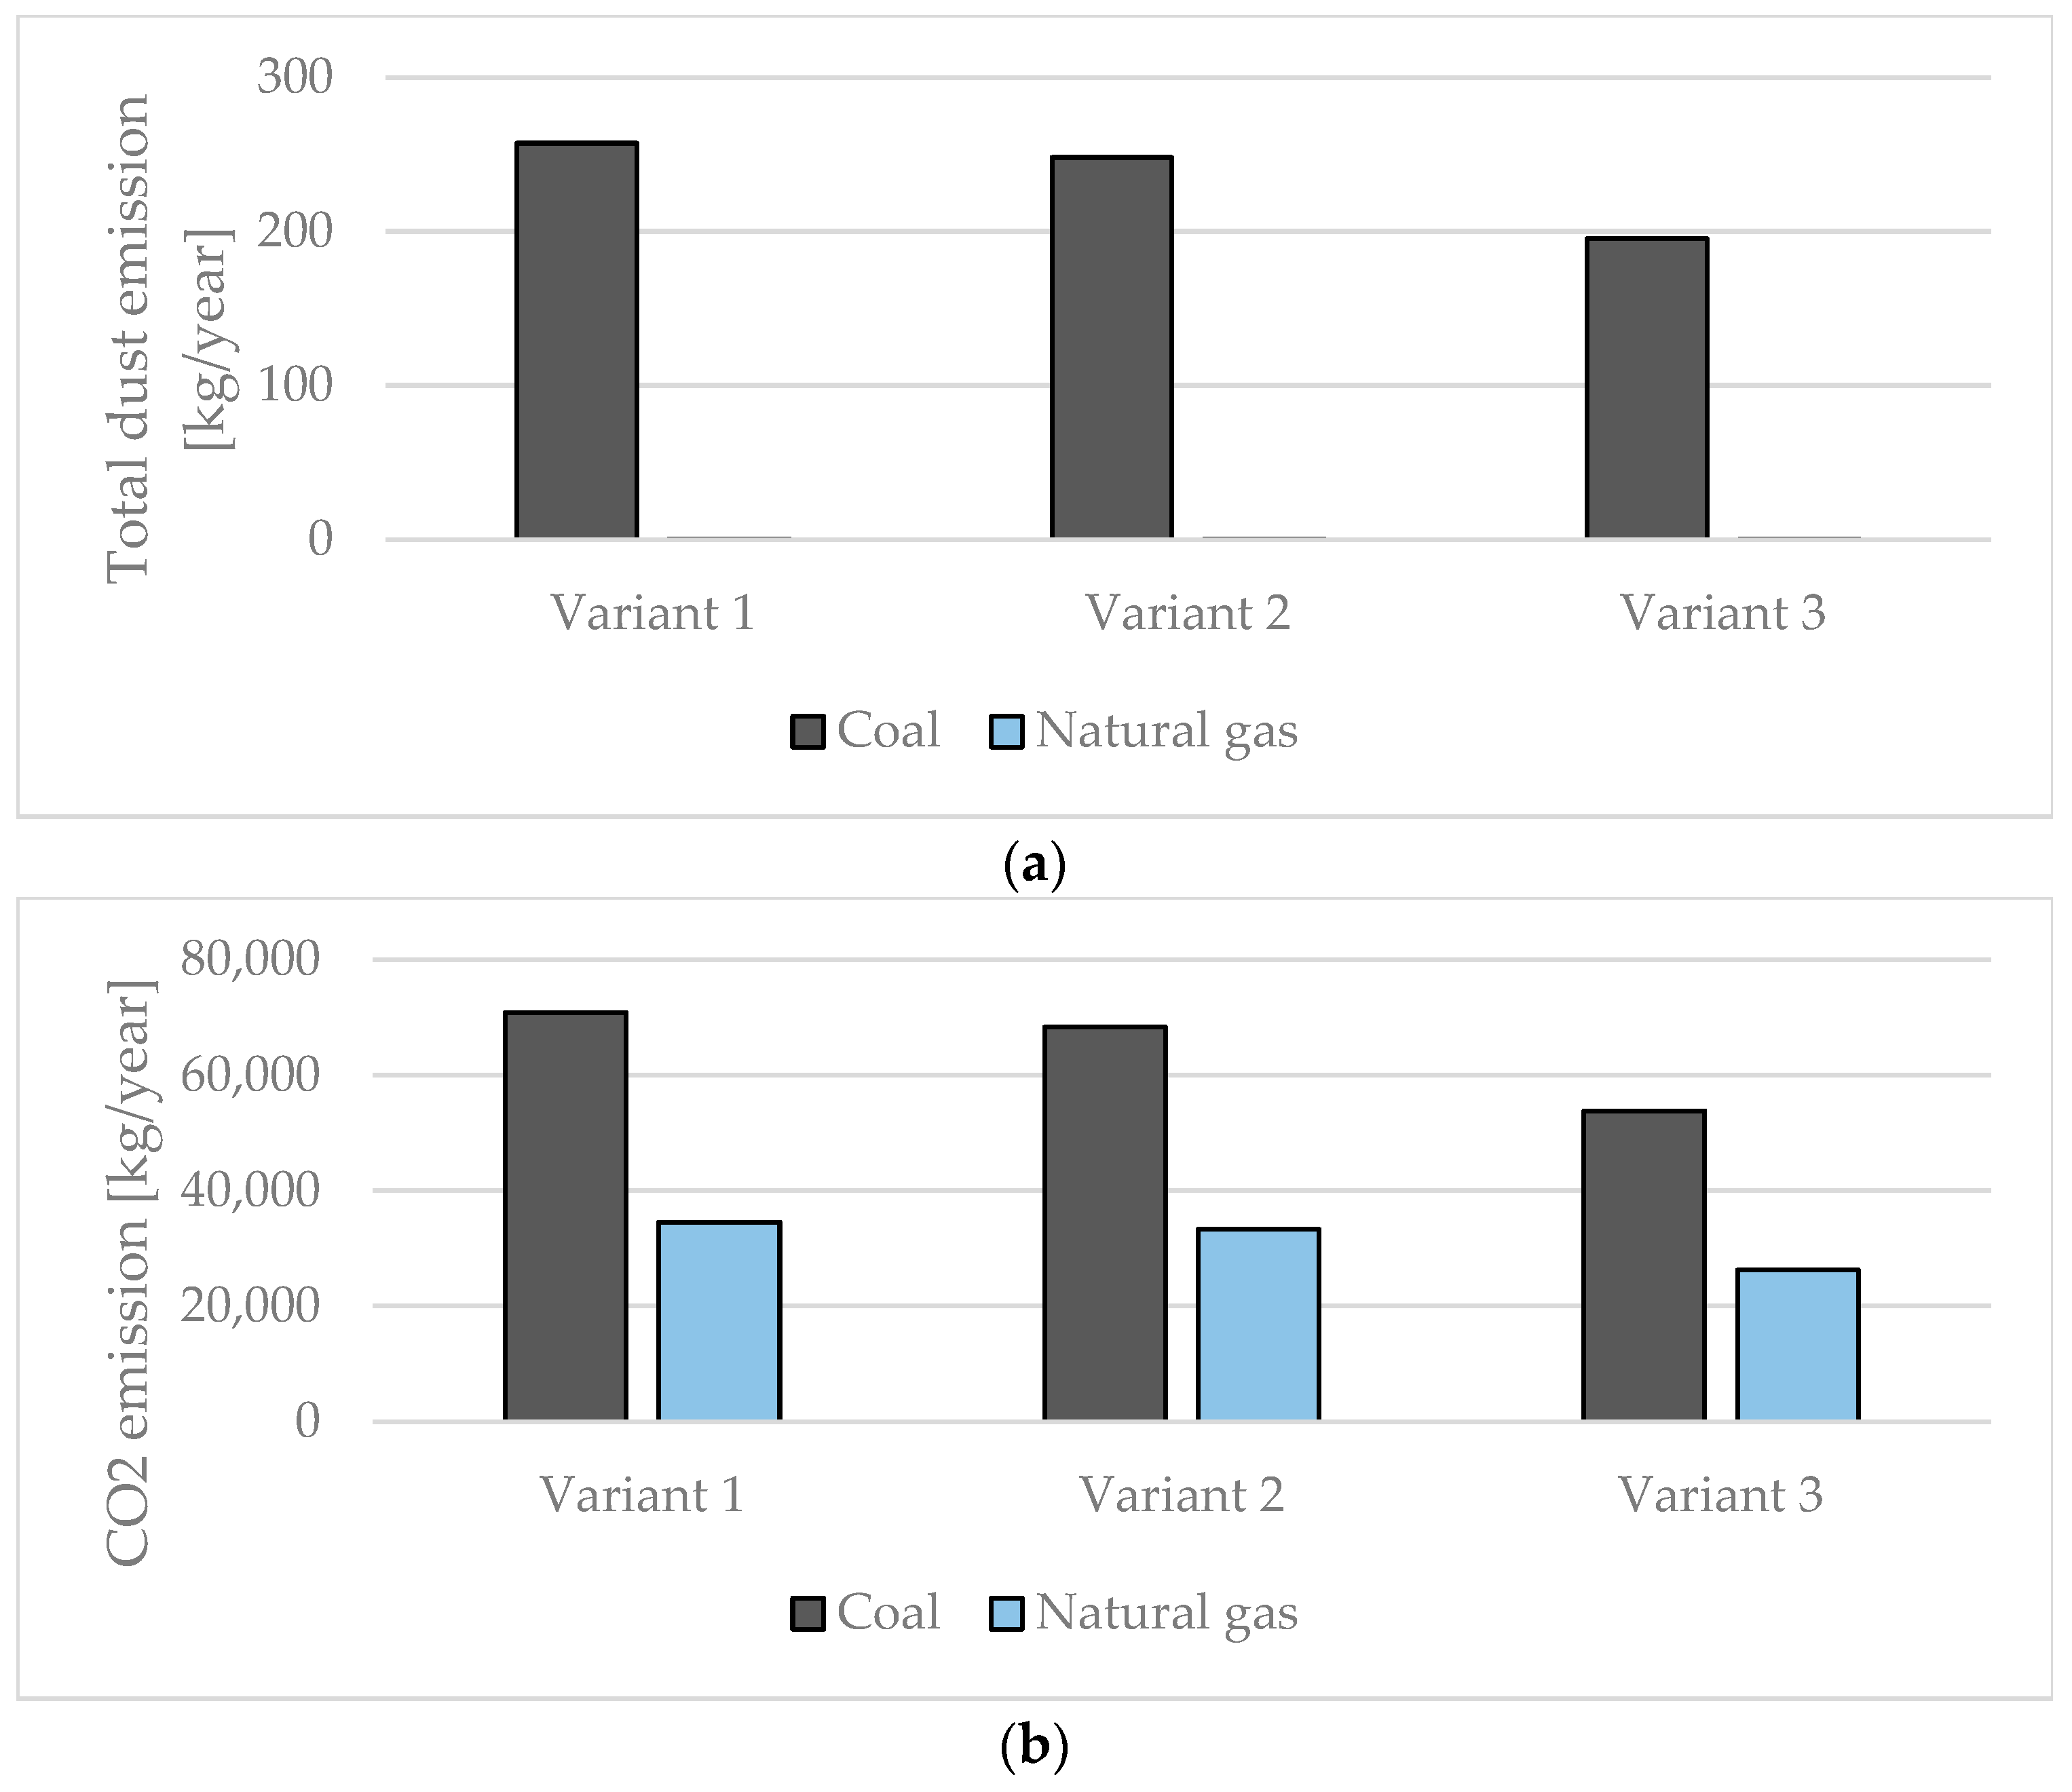
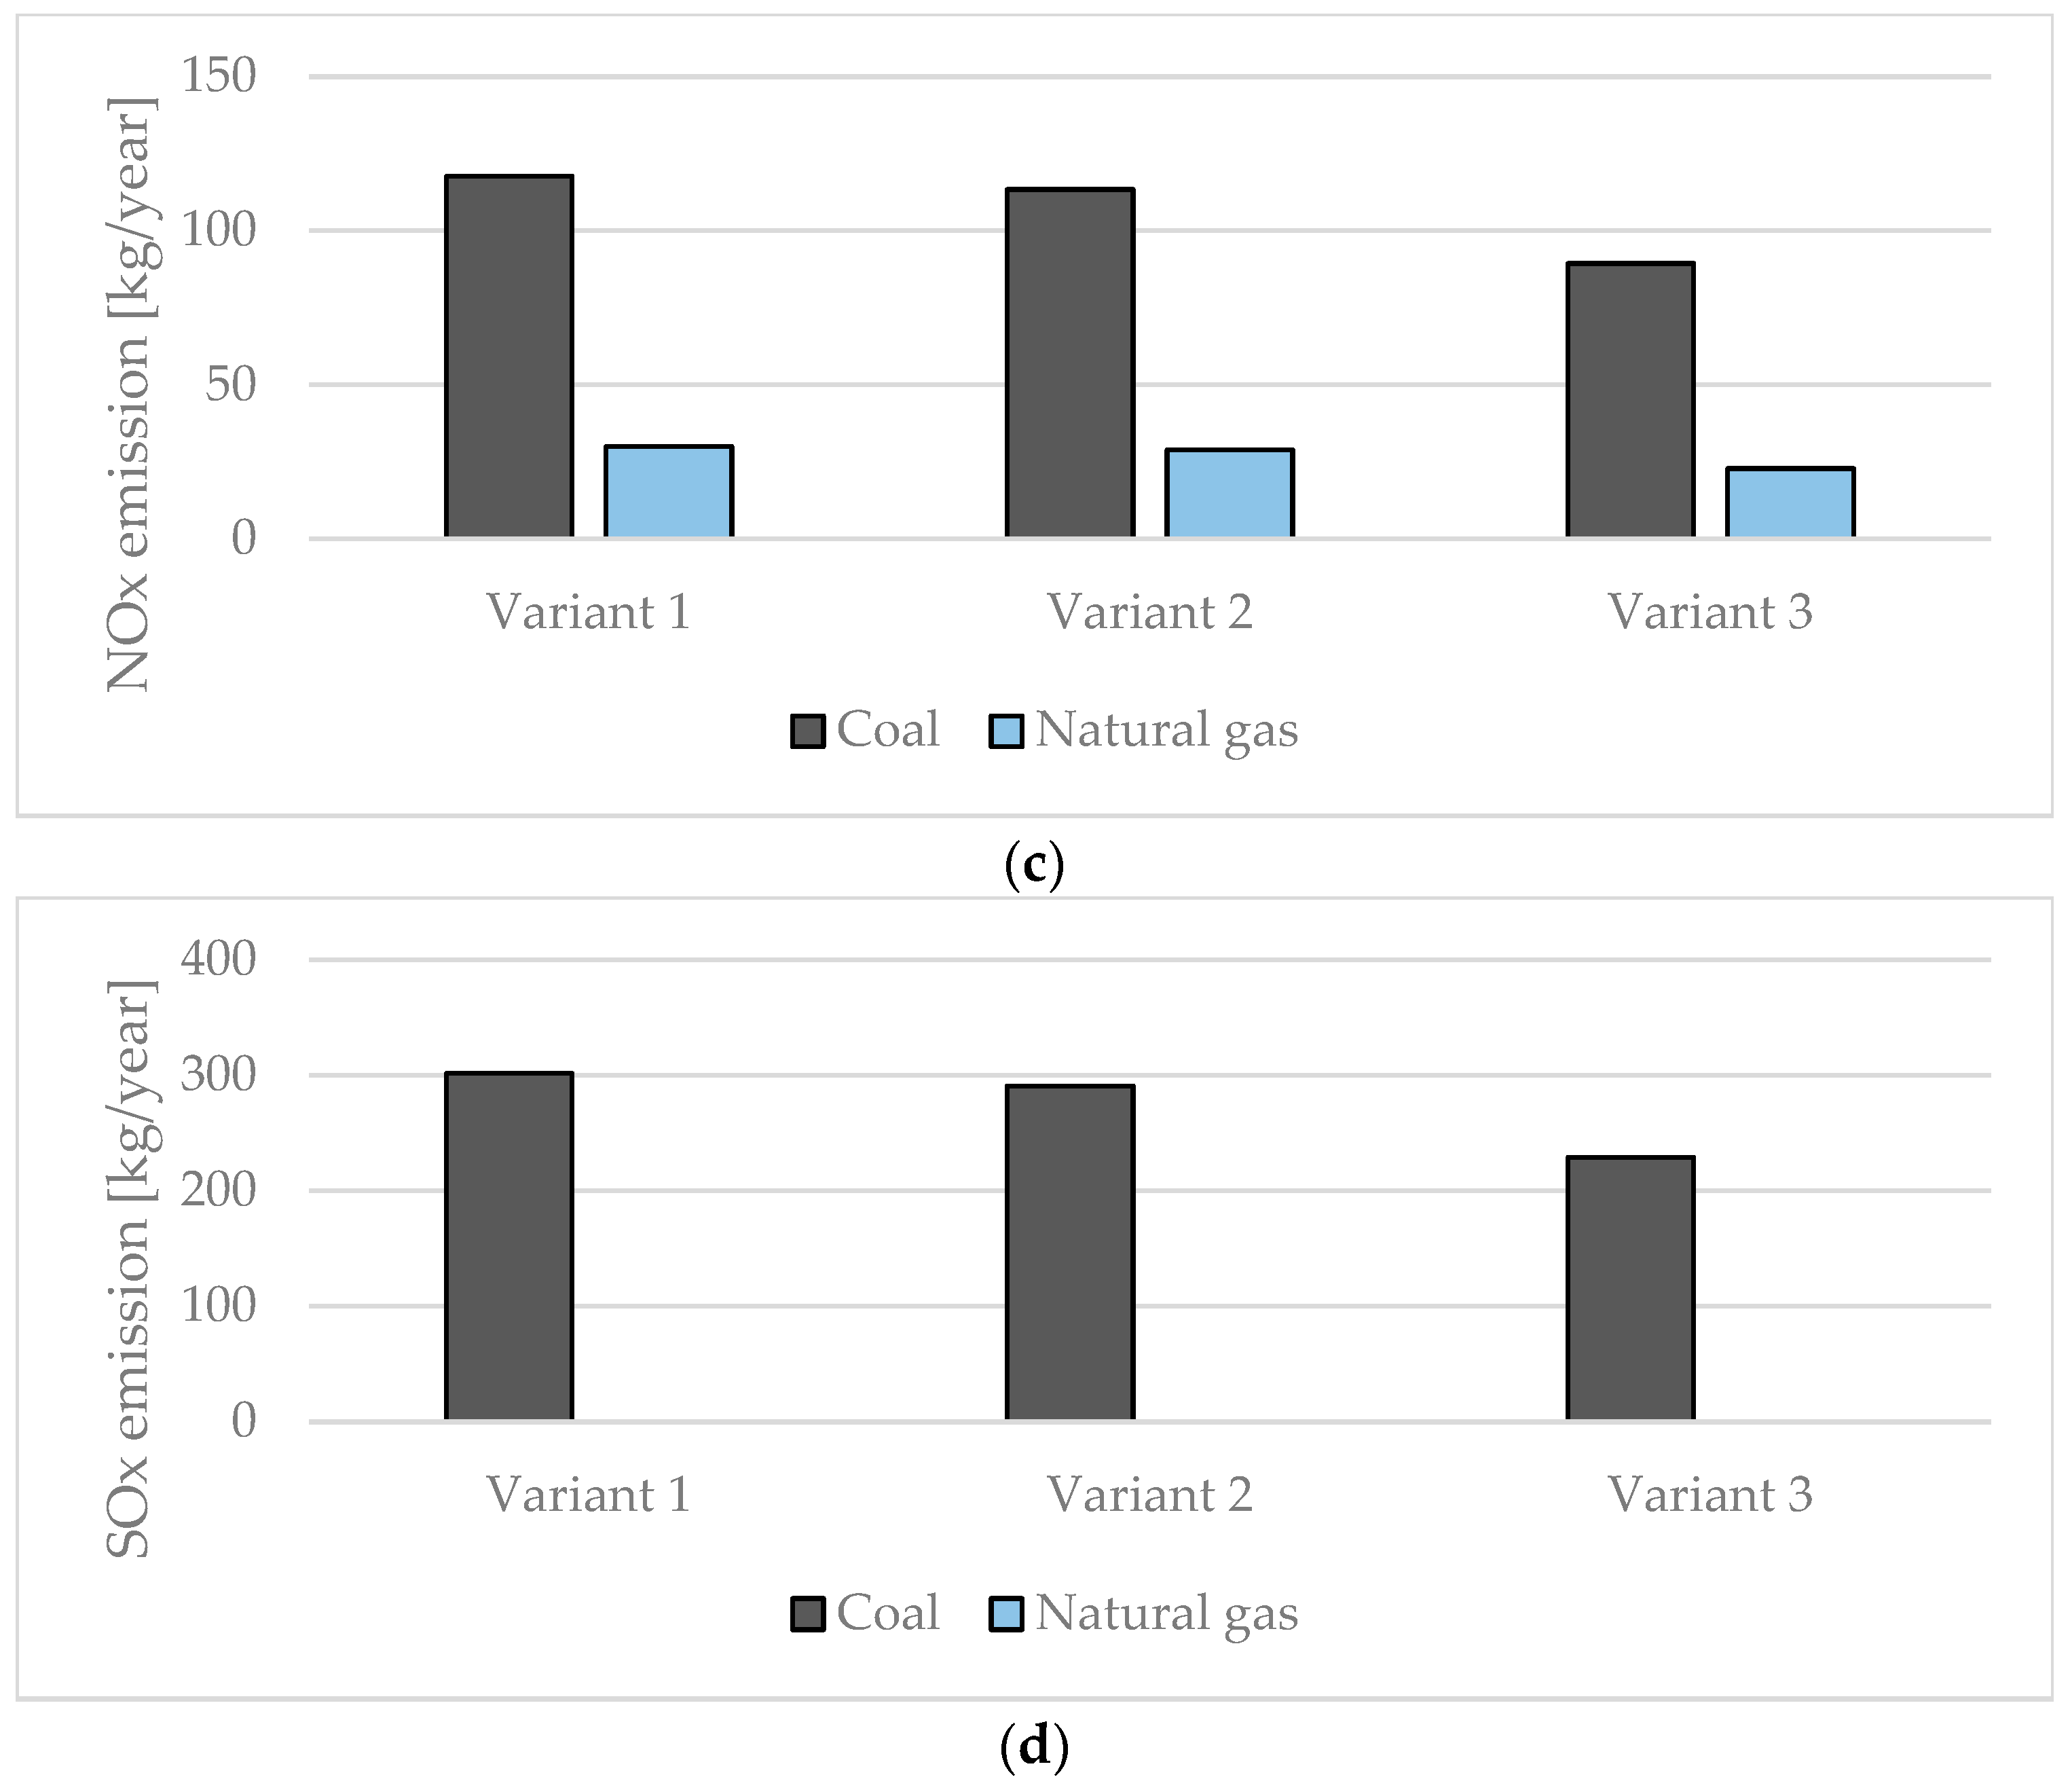
  • Variant 3 (foundation insulation and single-chamber polycarbonate panels) reduced CO2 emissions by 24% compared to the basic variant. Emissions of sulfur oxides, nitrogen oxides and dust were also reduced.
  • Changing the fuel from hard coal to natural gas would reduce the total unit emission by an estimated 51% compared to hard coal.
  • The obtained results showed a high compliance of theoretical and actual data (85–89% for the coefficient of determination (R2) and 84–88% for the GOF method). In further stages of research, it is therefore possible to use the applied model for analyses of adding insulation and modern materials using renewable energy (e.g., solar panels or heat pumps).
  • The solutions tested in the greenhouse can be adapted to other types of buildings requiring thermal regulation (e.g., agricultural warehouses or public utility buildings).

Author Contributions

Conceptualization, G.N. and P.S.; methodology, G.N. and P.S.; software, P.S.; validation, G.N. and P.S.; formal analysis, G.N. and P.S.; investigation, G.N. and P.S.; resources, G.N.; data curation, G.N. and P.S.; writing—original draft preparation, G.N., P.S., T.J. and A.A.; writing—review and editing, G.N., P.S., T.J. and A.A.; visualization, P.S.; supervision, G.N. All authors have read and agreed to the published version of the manuscript.

Funding

This research was funded by the Faculty of Environmental Engineering, University of Agriculture in Krakow, through the project “Subvention 030001-D014 Environmental Engineering, Mining and Energy”.

Data Availability Statement

The original contributions presented in this study are included in the article. Further inquiries can be directed to the corresponding author.

Conflicts of Interest

The authors declare no conflicts of interest.

References

  1. Jakučionytė-Skodienė, M.; Krikštolaitis, R.; Liobikienė, G. The contribution of changes in climate-friendly behaviour, climate change concern and personal responsibility to household greenhouse gas emissions: Heating/cooling and transport activities in the European Union. Energy 2022, 246, 123387. [Google Scholar] [CrossRef]
  2. Nawalany, G.; Sokołowski, P.; Michalik, M. The effect of floor material and construction solutions and the type of heating system on greenhouse gas (GHG) emissions—A case study. J. Build. Eng. 2023, 77, 107422. [Google Scholar] [CrossRef]
  3. Bielaczyc, P.; Woodburn, J.; Szczotka, A.; Pajdowski, P. The Impact of Alternative Fuels on Fuel Consumption and Exhaust Emissions of Greenhouse Gases from Vehicles Featuring SI Engines. Energy Procedia 2015, 66, 21–24. [Google Scholar] [CrossRef]
  4. Primc, K.; Zabavnik, D.; Dominko, M.; Slabe-Erker, R. Green financing for cutting emissions and simultaneous economic upturn in the European Union: Myth or reality? Sustain. Futures 2024, 8, 100355. [Google Scholar] [CrossRef]
  5. O’Callaghan, B.; Yau, N.; Hepburn, C. How stimulating is a green stimulus? The economic attributes of green fiscal spending. Annu. Rev. Environ. Resour. 2022, 47, 697–723. [Google Scholar] [CrossRef]
  6. Rabina-Alves, M.; Moutinho, V. Decomposition of energy-related GHG emissions in agriculture over 1995-2008 for European countries. Appl. Energy 2014, 114, 949–957. [Google Scholar] [CrossRef]
  7. Minato, K.; Kouda, Y.; Yamakawa, M.; Hara, S.; Tamura, T.; Osada, T. Determination of GHG and ammonia emissions from stored dairy cattle slurry by Rusing a floating dynamic chamber. Anim. Sci. J. 2013, 84, 165–177. [Google Scholar] [CrossRef]
  8. Talaei, A.; Gemechu, E.; Kumar, A. Key factors affecting greenhouse gas emissions in the Canadian industrial sector: A decomposition analysis. J. Clean. Prod. 2020, 246, 119026. [Google Scholar] [CrossRef]
  9. Worrell, E.; Bernstein, L.; Roy, J.; Price, L.; Harnisch, J. Industrial energy efficiency and climate change mitigation. Energy Effic. 2009, 2, 109–123. [Google Scholar] [CrossRef]
  10. Moomaw, W. Industrial emissions of greenhouse gases. Energy Policy 1996, 24, 951–968. [Google Scholar] [CrossRef]
  11. Tubiello, F.; Salvatore, M.; Rossi, S.; Ferrara, A.; Fitton, N.; Smith, P. The FAOSTAT database of greenhouse gas emissions from agriculture. Environ. Res. Lett. 2013, 8, 015009. [Google Scholar] [CrossRef]
  12. Tubiello, F.; Karl, K.; Flammini, A.; Gütschow, J.; Obli-Laryea, G.; Conchedda, G.; Pan, X.; Qi, S.; Heiðarsdóttir, H.; Wanner, N.; et al. Pre- and post-production processes increasingly dominate greenhouse gas emissions from agri-food systems. Earth Syst. Sci. Data 2022, 14, 1795–1809. [Google Scholar] [CrossRef]
  13. Linquist, B.; Groenigen, K.; Adviento-Borbe, M.; Pittelkow, C.; Kessel, C. An agronomic assessment of greenhouse gas emissions from major cereal crops. Glob. Change Biol. 2012, 18, 194–209. [Google Scholar] [CrossRef]
  14. Weidner, T.; Yang, A.; Hamm, M. Energy optimisation of plant factories and greenhouses for different climatic conditions. Energy Convers. Manag. 2021, 243, 114336. [Google Scholar] [CrossRef]
  15. Sokołowski, P.; Nawalany, G. Analysis of Energy Exchange with the Ground in a Two-Chamber Vegetable Cold Store, Assuming Different Lengths of Technological Break, with the Use of a Numerical Calculation Method—A Case Study. Energies 2020, 13, 4970. [Google Scholar] [CrossRef]
  16. Sachs, J.; Moya, D.; Giarola, S.; Hawkes, A. Clustered spatially and temporally resolved global heat and cooling energy demand in the residential sector. Appl. Energy 2019, 250, 48–62. [Google Scholar] [CrossRef]
  17. Costantino, A.; Comba, L.; Sicardi, G.; Bariani, M.; Fabrizio, E. Energy performance and climate control in mechanically ventilated greenhouses: A dynamic modelling-based assessment and investigation. Appl. Energy 2021, 288, 116583. [Google Scholar] [CrossRef]
  18. Rezaei, E.; Dagdougui, H.; Ojand, K. Hierarchical Distributed Energy Management Framework for Multiple Greenhouses Considering Demand Response. IEEE Trans. Sustain. Energy 2023, 14, 453–464. [Google Scholar] [CrossRef]
  19. Yan, S.; Fazilati, M.; Toghraie, D.; Khalili, M.; Karimipour, A. Energy cost and efficiency analysis of greenhouse heating system enhancement using phase change material: An experimental study. Renew. Energy 2021, 170, 133–140. [Google Scholar] [CrossRef]
  20. Esen, M.; Yuksel, T. Experimental evaluation of using various renewable energy sources for heating a greenhouse. Energy Build. 2013, 65, 340–351. [Google Scholar] [CrossRef]
  21. Nawalany, G.; Sokołowski, P. Numerical Analysis of the Effect of Ground Dampness on Heat Transfer between Greenhouse and Ground. Sustainability 2021, 13, 3084. [Google Scholar] [CrossRef]
  22. Nawalany, G.; Lendelova, J.; Sokołowski, P.; Zitnak, M. Numerical Analysis of the Impact of the Location of a Commercial Broiler House on Its Energy Management and Heat Exchange with the Ground. Energies 2021, 14, 8565. [Google Scholar] [CrossRef]
  23. Fabrizio, E. Energy reduction measures in agricultural greenhouses heating: Envelope, systems and solar energy collection. Energy Build. 2012, 53, 57–63. [Google Scholar] [CrossRef]
  24. Kittas, C.; Karamanis, M.; Katsoulas, N. Air temperature regime in a forced ventilated greenhouse with rose crop. Energy Build. 2005, 37, 807–812. [Google Scholar] [CrossRef]
  25. Mazor, M.; Mutton, J.; Russell, D.; Keoleian, G. Life Cycle Greenhouse Gas Emissions Reduction From Rigid Thermal Insulation Use in Buildings. J. Ind. Ecol. 2011, 15, 284–299. [Google Scholar] [CrossRef]
  26. Satola, D.; Röck, M.; Houlihan-Wiberg, A.; Gustavsen, A. Life Cycle GHG Emissions of Residential Buildings in Humid Subtropical and Tropical Climates: Systematic Review and Analysis. Buildings 2020, 11, 6. [Google Scholar] [CrossRef]
  27. Penaloza, G.A.; Vignisdottir, H.R.; Kristensen, T.; Ramsnes, E. Greenhouse gas emission reduction potential in road tunnels– Can we reach the European Union goals with existing materials and technologies? Tunn. Undergr. Space Technol. Inc. Trenchless Technol. Res. 2024, 153, 106011. [Google Scholar] [CrossRef]
  28. Dean, J.; Vogel, E.; Murphy, F. Modelling solar photovoltaic systems on dairy farms for cost savings and GHG emission reduction. Sci. Total Environ. 2024, 948, 174874. [Google Scholar] [CrossRef]
  29. Ustaoglu, A.; Yaraş, A.; Sutcu, M.; Gencel, O. Investigation of the residential building having novel environment-friendly construction materials with enhanced energy performance in diverse climate regions: Cost-efficient, low-energy and low-carbon emission. J. Build. Eng. 2021, 43, 102617. [Google Scholar] [CrossRef]
  30. Santacruz, W.; Munoz, J. Design and Construction of Energy Saving Buildings in Varied Climates: Bioclimatic Approach and Sustainability. Minerva 2023, 2023, 124–135. [Google Scholar] [CrossRef]
  31. Nematchoua, M.; Orosa, J.; Ricciardi, P.; Obonyo, E.; Sambatra, E.; Reiter, S. Transition to Zero Energy and Low Carbon Emission in Residential Buildings Located in Tropical and Temperate Climates. Energies 2021, 14, 4253. [Google Scholar] [CrossRef]
  32. Ntinas, G.; Dannehl, D.; Schuch, I.; Rocksch, T.; Schmidt, U. Sustainable greenhouse production with minimised carbon footprint by energy export. Biosyst. Eng. 2020, 189, 164–178. [Google Scholar] [CrossRef]
  33. Nawalany, G.; Sokołowski, P. Analysis of hygrothermal conditions of external partitions in an underground fruit store. J. Ecol. Eng. 2016, 17, 75–82. [Google Scholar] [CrossRef] [PubMed]
  34. Ahamed, S.; Guo, H.; Tanino, K. Energy saving techniques for reducing the heating cost of conventional greenhouses. Biosyst. Eng. 2019, 178, 9–33. [Google Scholar] [CrossRef]
  35. Gilli, C.; Kempkes, F.; Muñoz, P.; Montero, J.; Giuffrida, F.; Baptista, F.; Stępowska, A.; Stanghellini, C. Potential of different energy saving strategies in heated greenhouse. Acta Hortic. 2017, 1164, 467–474. [Google Scholar] [CrossRef]
  36. Gdula, S. Heat Conduction; PWN: Warsaw, Poland, 1984. [Google Scholar]
  37. PN-EN ISO 6946:2017; Thermal Resistance and Heat Transfer Coefficient. ISO: Geneva, Switzerland, 2017.
  38. Ruiz, G.R.; Bandera, C.F. Validation of calibrated energy models: Common errors. Energies 2017, 10, 1587. [Google Scholar] [CrossRef]
  39. Nawalany, G.; Sokołowski, P.; Michalik, M. Analysis of the Operation of an Unheated Wooden Church to the Shaping of Thermal and Humidity Conditions Using the Numerical Method. Energies 2021, 14, 5200. [Google Scholar] [CrossRef]
  40. KOBiZE. Calorific Values (WO) and CO2 Emission Factors (WE) in 2019 for Reporting Under the European Union Emissions Trading Scheme for 2022, Poland. Available online: https://www.kobize.pl/pl/article/aktualnosci-2022/id/2034/wartosci-opalowe-wo-i-wskazniki-emisji-co2-we-w-roku-2019-do-raportowania-w-ramach-systemu-handlu-uprawnieniami-do-emisji-za-rok-2022 (accessed on 4 January 2022).
  41. KOBiZE. Pollutant Emission Indicators from Fuel Combustion for Sources with Nominal Thermal Power up to 5 MW, Used for Automatic Emission Calculation in the Report to the National Database for 2020. Warsaw, Poland, 2021. Available online: https://krajowabaza.kobize.pl/docs/Wskazniki_emisji_zanieczyszczen_spalanie_paliw_dla_zrodel_do_5MW_automatyczne_wyliczenia_emisji_raport_2020_2021.pdf (accessed on 29 August 2022).
  42. Winkler, M.; Stadler, S.; Radoń, J.; Henning, J. PALM-4U GUI: A cloud based user-friendly graphical user interface for the urban climate model PALM-4U. In Proceedings of the Building Simulation 2023: 18th Conference of IBPSA, Shanghai, China, 4–6 September 2023; International Building Performance Simulation Association: Britton, SD, USA, 2024; pp. 1231–1238. [Google Scholar]
  43. Pazold, M.; Radoń, J.; Kersken, M.; Künzel, H.; Antretter, F.; Sinnesbichler, H. Development and Verification of Novel Building Integrated Thermal Storage System Models. Energies 2023, 16, 2889. [Google Scholar] [CrossRef]
  44. Trappler, V.; Arnaud, E.; Vidard, A.; Debreu, L. Robust calibration of numerical models based on relative regret. J. Comput. Phys. 2020, 426, 109952. [Google Scholar] [CrossRef]
  45. Yan, S.; Fazilati, M.; Samani, N.; Ghasemi, H.; Toghraie, D.; Nguyen, Q.; Karimipour, A. Energy efficiency optimization of the waste heat recovery system with embedded phase change materials in greenhouses: A thermo-economic-environmental study. J. Energy Storage 2020, 30, 101445. [Google Scholar] [CrossRef]
  46. Nasrollahi, H.; Ahmadi, F.; Ebadollahi, M.; Nobar, S.; Amidpour, M. The greenhouse technology in different climate conditions: A comprehensive energy-saving analysis. Sustain. Energy Technol. Assess. 2021, 47, 101455. [Google Scholar] [CrossRef]
  47. Majumder, A.; Canale, L.; Mastino, C.; Pacitto, A.; Frattolillo, A.; Dell’Isola, M. Thermal Characterization of Recycled Materials for Building Insulation. Energies 2021, 14, 3564. [Google Scholar] [CrossRef]
  48. Sadłowska-Sałęga, A.; Wąs, K. Risk of Moisture in Diffusionally Open Roofs with Cross-Laminated Timber for Northern Coastal Climates. Buildings 2020, 10, 10. [Google Scholar] [CrossRef]
  49. Wąs, K.; Radoń, J.; Sadłowska-Sałęga, A. Thermal Comfort—Case Study in a Lightweight Passive House. Energies 2022, 15, 4687. [Google Scholar] [CrossRef]
  50. Sadłowska-Sałęga, A.; Wąs, K. Moisture Risk Analysis for Three Construction Variants of a Wooden Inverted Flat Roof. Energies 2021, 14, 7898. [Google Scholar] [CrossRef]
Figure 1. Arrangement of measurement points of inside air temperature (Tint.), (°C), outside air temperature (Text.), (°C) and ground temperature in the greenhouse (L1, C1, R1), (°C) and in its surroundings (E1 and E2), (°C), (a) plan, (b) cross-section A-A.
Energies 17 06460 g001
Figure 2. Calculation variants adopted for numerical calculations.
Energies 17 06460 g002
Figure 3. Geometric model of the greenhouse with the surfaces of interaction of the internal microclimate (yellow color), external climate (blue color) and ground (brown color).
Energies 17 06460 g003
Figure 4. Climatic data of a typical meteorological year, (a) temperature and relative humidity of outside air, (b) solar radiation intensity.
Energies 17 06460 g004aEnergies 17 06460 g004b
Figure 5. Measured indoor air temperature Tint.and outdoor air temperature Text. over the entire research period.
Energies 17 06460 g005
Figure 6. Ground temperature at points E1, L1, C1, R1 and E2.
Energies 17 06460 g006
Figure 7. Visualization of the data distribution for indoor air temperature Tint., outdoor air temperature Text.and ground temperature (E1, L1, C1, R1, E2) over the entire research period.
Energies 17 06460 g007
Figure 8. Measured and calculated ground temperature: (a) point E1, (b) point L1 (c) pointC1.
Energies 17 06460 g008
Figure 9. Verification of the fit of data calculated based on the coefficient of determination (R2) and goodness-of-fit (GOF) methods.
Energies 17 06460 g009
Figure 10. Thermal energy flow through the heating system, transparent partitions, ventilation, ground and foundation of the tested greenhouse.
Energies 17 06460 g010
Figure 11. Annual demand for solid and gas fuel for heating purposes.
Energies 17 06460 g011
Figure 12. Emission level for (a) total dust, (b) carbon dioxide, (c) nitrogen oxides and (d) sulfur oxides.
Energies 17 06460 g012aEnergies 17 06460 g012b
Table 1. Technical parameters of the materials used in calculations.
Materials Used and the Ground Adopted for the Greenhouse
Physical ParameterConcrete C20/25XPS PolystyreneSingle Panes of GlassSingle-Chamber PolycarbonateSandy Clay
Bulk density
[kg·m−3]
2322.0040.00--1800.00
Specific heat
[J·kg−1·K−1]
850.001500.00--1000.00
Thermal conductivity coefficient
[W·m−1·K−1]
1.700.035--1.70
Frame factor [-]--0.900.80-
Average coefficient of heat gain from solar radiation
[-]
--0.850.60-
External surface emissivity [-]--0.850.80-
Heat transfer coefficient
[W·m−2·K−2]
--5.003.50-
Table 2. Calorific value and pollutant emission factors.
Type of PollutionCoal
[g/GJ]
Natural Gas
[g/GJ]
Total dust350.00.5
CO296,370.057,650.0
NOx160.050.0
SOx410.00.4
Fuel typeCalorific value [MJ/kg]
Coal25.28
Natural gas48.00
Disclaimer/Publisher’s Note: The statements, opinions and data contained in all publications are solely those of the individual author(s) and contributor(s) and not of MDPI and/or the editor(s). MDPI and/or the editor(s) disclaim responsibility for any injury to people or property resulting from any ideas, methods, instructions or products referred to in the content.

