Article

CO2 Emission Prediction for Coal-Fired Power Plants by Random Forest-Recursive Feature Elimination-Deep Forest-Optuna Framework

1
State Key Laboratory of Coal Combustion, School of Energy and Power Engineering, Huazhong University of Science and Technology, Wuhan 430074, China
2
China-EU Institute for Clean and Renewable Energy, Huazhong University of Science and Technology, Wuhan 430074, China
3
Key Laboratory of Coal Clean Conversion and Chemical Process Autonomous Region, School of Chemical Engineering and Technology, Xinjiang University, Urumqi 830000, China
4
Guoneng Yongfu Power Generation Co., Ltd., Guilin 541805, China
*
Author to whom correspondence should be addressed.
Energies 2024, 17(24), 6449; https://doi.org/10.3390/en17246449
Submission received: 28 November 2024 / Revised: 18 December 2024 / Accepted: 20 December 2024 / Published: 21 December 2024
(This article belongs to the Section B: Energy and Environment)

Abstract

:
As the greenhouse effect intensifies, China faces pressure to manage CO2 emissions. Coal-fired power plants are a major source of CO2 in China. Traditional CO2 emission accounting methods of power plants are deficient in computational efficiency and accuracy. To solve these problems, this study proposes a novel RF-RFE-DF-Optuna (random forest–recursive feature elimination–deep forest–Optuna) framework, enabling accurate CO2 emission prediction for coal-fired power plants. The framework begins with RF-RFE for feature selection, identifying and extracting the most important features for CO2 emissions from the power plant, reducing dimensionality from 46 to just 5 crucial features. Secondly, the study used the DF model to predict CO2 emissions, combined with the Optuna framework, to enhance prediction accuracy further. The results illustrated the enhancements in model performance and showed a significant improvement with a 0.12706 increase in R2 and reductions in MSE and MAE by 81.70% and 36.88%, respectively, compared to the best performance of the traditional model. This framework improves predictive accuracy and offers a computationally efficient real-time CO2 emission monitoring solution in coal-fired power plants.

1. Introduction

With the ongoing deterioration of the global climate, increasing carbon dioxide (CO2) emissions has become a primary concern for nations worldwide. As one of the largest CO2 emitters, China proposed the “dual carbon” goals of “carbon peaking” and “carbon neutrality” to address environmental challenges [1,2]. Coal-fired power plants are the largest source of CO2 emissions in China, which play a crucial role in achieving the “dual carbon” goals. The combustion processes in coal-fired power plants are highly complex, involving numerous chemical reactions and releasing multiple pollutants [3,4,5]. Accurate accounting of CO2 emissions from coal-fired power plants is essential for achieving carbon reduction targets [6,7].
Traditional methods of CO2 accounting, including the emission factor, the material balance, and the direct measurement methods. The emission factor method calculates CO2 emissions using factors defined by the Intergovernmental Panel on Climate Change (IPCC) as quantification coefficients [8]. This method is particularly suitable for situations where detailed statistical data are unavailable, serving as a reference for CO2 emission estimation. However, it leads to significant computation errors due to many situations, such as various regions, different power plant conditions, and variations in coal quality [9,10]. The material balance method estimates CO2 emissions by analyzing the flow of carbon within coal-fired power plants [11]. Due to the complexity of combustion processes in coal-fired power plants, this method encounters limitations related to modeling difficulty and data accuracy. The direct measurement method uses the continuous emission monitoring system (CEMS) to monitor real-time flue gas, providing accurate and low-latency emission data [12,13,14]. However, high operational and maintenance costs and the limited stability of measurement instruments hinder its widespread adoption [15].
In recent years, some new technologies have been used to enhance the accuracy and applicability of CO2 emission prediction. Machine learning has achieved remarkable success across various fields with its capabilities in data processing [16,17,18]. Some studies have utilized machine learning methods in the field of CO2 emission prediction in coal-fired power plants. C. Zhu et al. [19] used the eXtreme gradient boosting (XGBoost) algorithm to analyze factors influencing CO2 emissions in coal-fired power plants. Their model, constructed with seven key features, achieved root mean square error (RMSE) values of 0.05 × 10⁶ t, 0.07 × 10⁶ t, and 0.03 × 10⁶ t for three distinct power plants. This research demonstrates the potential of machine learning in handling complex datasets. C. Saleh et al. [20] proposed a predictive model based on support vector machine (SVM) for CO2 emission, achieving an RMSE of 0.004 through manual parameter tuning. The study demonstrates the effectiveness of the parameter tuning process in optimizing machine learning models. S Zhou et al. [21] proposed a deep learning-based emission estimation network (EEN) for monitoring CO2 emissions in coal-fired power plants. This model used hourly meter readings and achieved mean absolute percentage errors (MAPE) of 1.03% and 1.37% for 300 MW and 600 MW units. Y Liao et al. [22] utilized the support vector machine algorithm with operational data from a 100 MW coal-fired power plant in Guangdong Province. The input parameters included coal moisture, ash content, volatile matter, fixed carbon, load, air temperature, smoke temperature, and flue gas oxygen content. The model, validated under 30%, 50%, and 70% load conditions, achieved prediction errors within 10%. J Chen et al. [23] proposed a CNN-LSTM-attention model for predicting CO2 emissions using real-time data from a 660 MW ultra-supercritical unit. The model utilized CNN to extract spatial features, LSTM to process time-series relationships, and an attention mechanism to optimize predictions. The model demonstrated relatively accurate predictions, achieving a coefficient of determination (R2) of 0.95, a root mean square error (RMSE) of 19.44, and a mean absolute percentage error (MAPE) of 3.55%. Additionally, D Cheng et al. [24]. developed an RBF neural network model based on data collected from a Shandong Province power plant between 2020 and 2022. The model incorporated power generation, power supply, coal consumption, carbon content, and CO2 emission intensity as input features. The model achieved a mean square error of 0.0070 after 15 iterations and a relative prediction error of less than 5%. These studies show the diverse applications of machine learning models in different coal-fired power plants for CO2 emission prediction, demonstrating how these models can be adapted to various operational conditions.
Although these studies have shown some effectiveness of machine learning in predicting CO2 emissions from coal-fired power plants, there are still problems that remain—the uncertainty of prediction results and resource waste in practical applications. The prediction of CO2 emissions in coal-fired power plants usually involves multiple parameters. The lack of an effective feature selection method may lead to a large amount of unnecessary computing resource consumption, and it could be more serious, causing overfitting due to excessive features [25,26]. For instance, when a coal-fired power plant is in operation, every parameter from the coal feeding system to the combustion system and even the exhaust gas treatment system will affect the amount of CO2 emissions [27]. Therefore, it is very significant to select representative parameters for modeling, which are closely related to the accuracy of the prediction results. Moreover, as mentioned before, coal-fired power plants are complex and large systems; it is difficult to accurately account for their CO2 emissions. It sets a high standard for model selection and requires a model with strong nonlinear fitting ability to adapt to such complexity. Furthermore, hyperparameters tuning of machine learning models is critical to model performance [28,29]. The lack of efficient hyperparameters optimization methods increases the difficulty of model tuning and may affect the final prediction accuracy by failing to find the optimal parameter combination.
To address these challenges, this study proposes an innovative random forest–recursive feature elimination–deep forest–Optuna (RF-RFE-DF-Optuna) framework that integrates different technologies to enhance the accuracy, flexibility, and stability of predictions. Compared with other studies, this study innovatively employs RF-RFE for feature elimination, which is a method that optimizes a subset of features by gradually eliminating the least important ones [30]. Using the RF model as the base model for RFE, this model can efficiently identify the importance of different parameters in predicting carbon emissions and further improve the prediction accuracy and computational efficiency. Then, the DF model was chosen as the predictive model to capture the complex nonlinear relationship between coal-fired power plant parameters and CO2 emissions. The DF model has been shown to capture complex relationships between different parameters and be used in many other areas. Q Li et al. [31] utilized the DF model to effectively integrate biomedical data from multiple perspectives to predict the overall survival rate of cancer patients. B Liu et al. [32] utilized the DF model to predict groundwater recharge, achieving a 3% to 6% improvement in prediction accuracy compared to traditional models. X Ma et al. et al. [33] developed a freeway crash risk prediction model using the Deep Forest algorithm, which leverages detailed risky driving behavior data to enhance the accuracy of predicting crash risks. These studies corroborate the effectiveness of the DF model. In addition, this study used the Optuna framework to optimize the hyperparameters of the DF model. This approach not only significantly improves the overall performance of the model but also reduces the time consumption and complexity of the traditional manual tuning process.
Therefore, this study aims to improve the efficiency and accuracy of CO2 emission prediction in coal-fired power plants by using the RF-RFE framework to extract key parameters and the DF-Optuna model for precise predictions. The results indicate that the method significantly enhances prediction performance, reduces errors, and minimizes resource wastage.

2. Methods

The key methodology of this study integrates three main steps to construct an efficient CO2 emission prediction model. The overall structure is illustrated in Figure 1. Firstly, the RF-RFE feature selection method is applied to the original high-dimensional data to identify and extract the most representative features, reducing model complexity and enhancing computational efficiency. Secondly, the DF model is utilized to capture complex nonlinear relationships. Finally, the Optuna optimization framework is applied for tuning hyperparameters, enabling automated searches for optimal parameter combinations and further improving the overall performance of the model. The subsequent sections provide a detailed explanation of these methods.

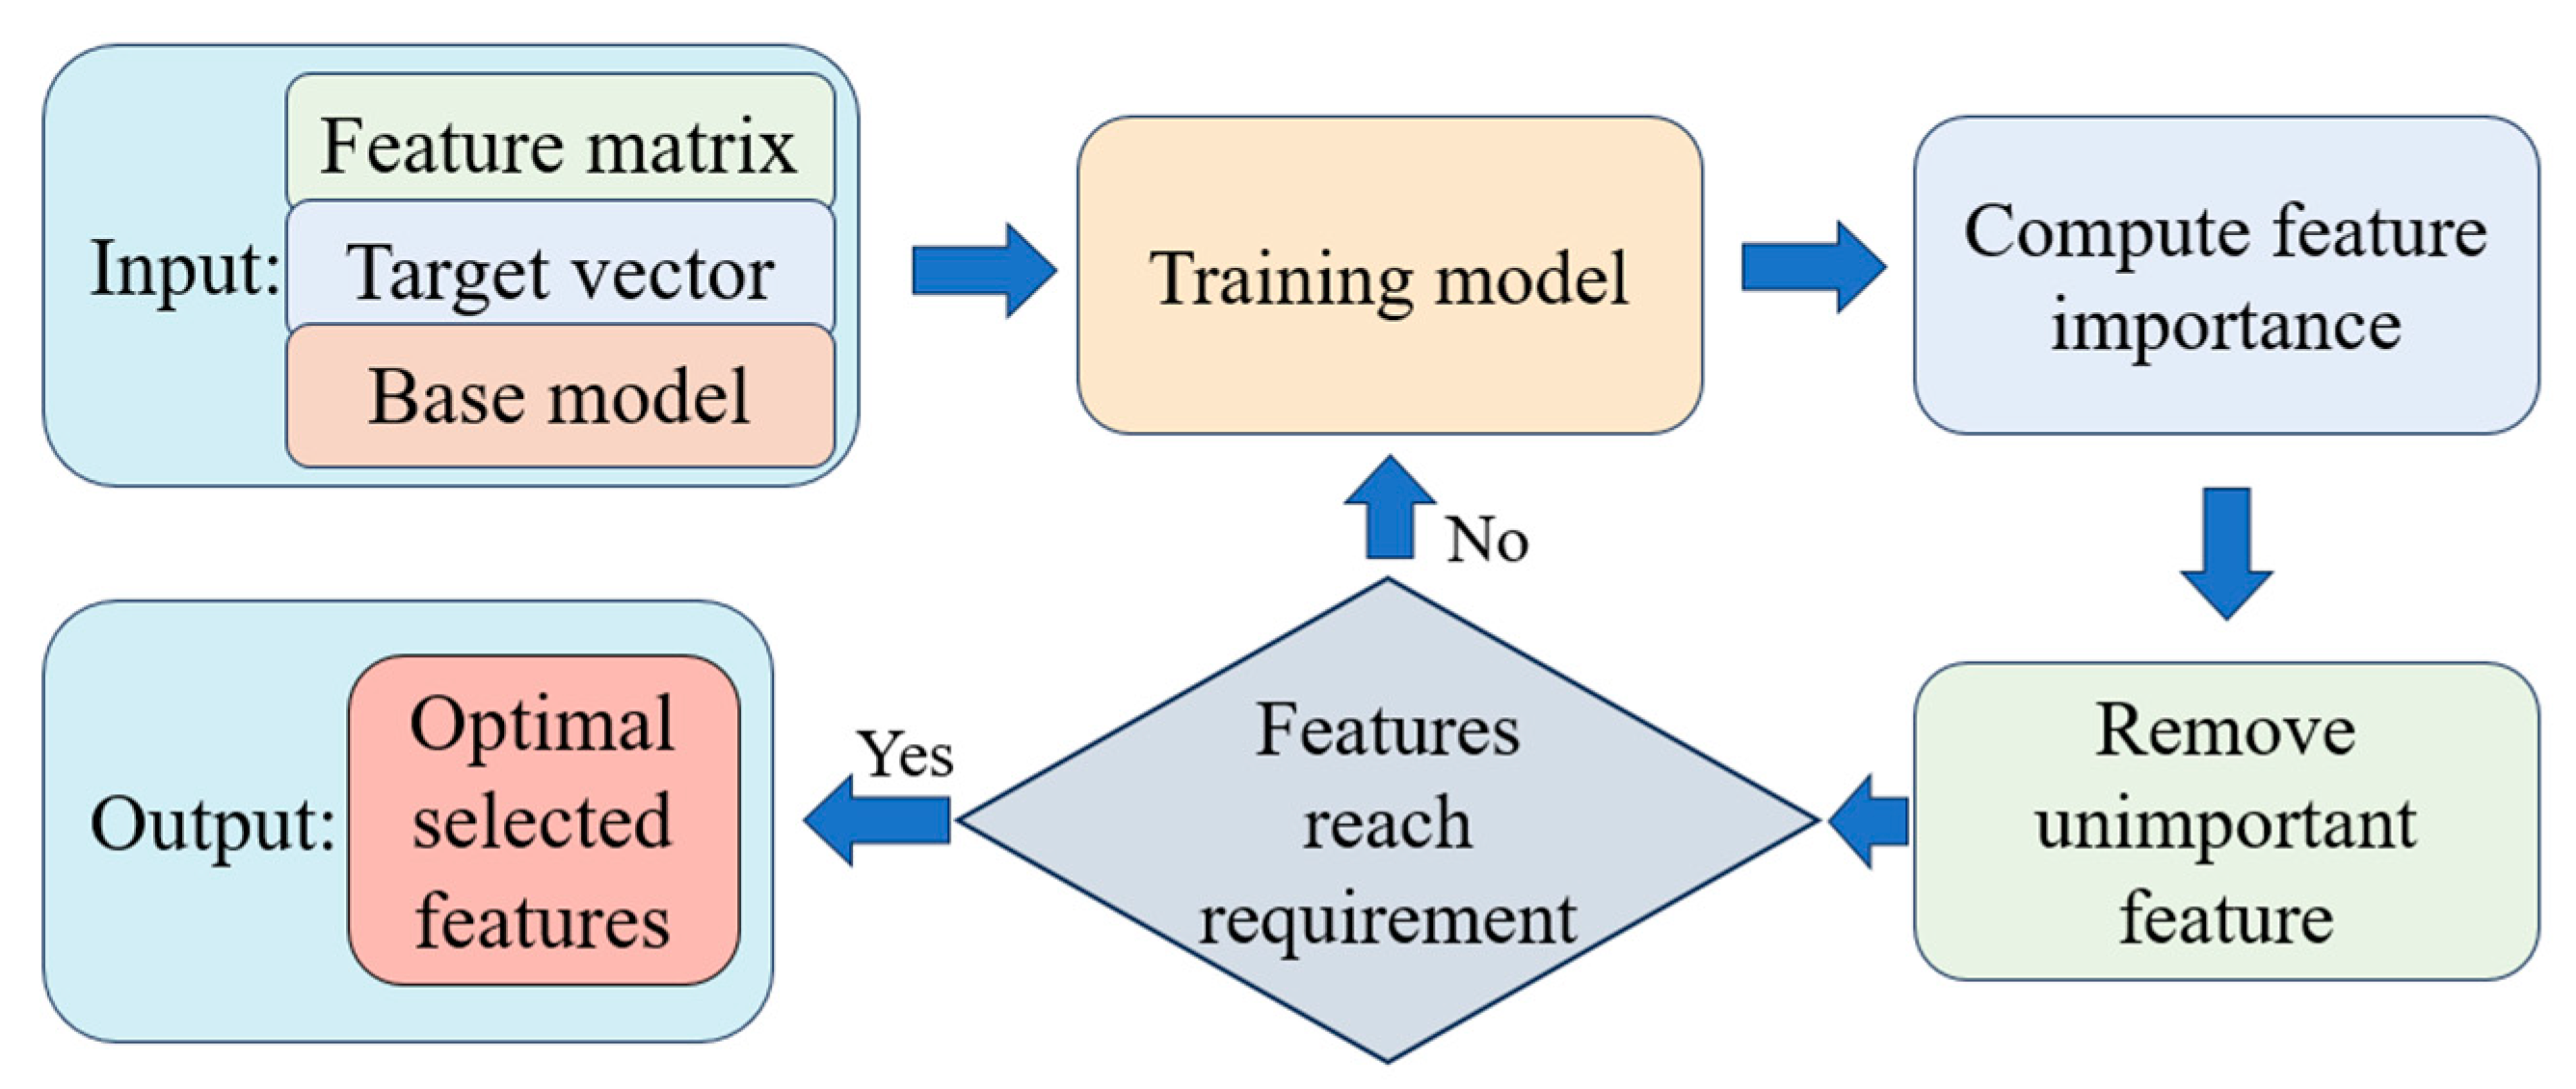
2.1. Recursive Feature Elimination

Recursive feature elimination is a technique for feature selection and model optimization [30,34,35]. Unlike traditional feature selection approaches, RFE employs a dynamic and iterative process. It recursively trains the model and uses performance metrics to identify and eliminate the least impactful features. This process repeats until a predefined number of features is achieved, effectively identifying the most important features for enhancing the predictive performance of the model, as illustrated in Figure 2. This method systematically reduces data redundancy and optimizes model input, making it particularly effective for complex datasets and scenarios with nonlinear relationships. In this study, RFE serves as a critical step in data preprocessing, selecting key features from high-dimensional data and providing high-quality input for subsequent model training.

2.2. Deep Forest Model

The DF model is a machine learning algorithm that cleverly integrates ensemble learning concepts with the hierarchical structure of deep learning, aiming to reduce the reliance on large-scale datasets typical of traditional deep neural networks [36]. The DF model utilizes a multi-layered tree structure, where each layer comprises multiple decision forests (Forest 1 to Forest n), as illustrated in Figure 3. Each forest within a layer processes the input feature vector and forwards its output to the corresponding forests in the next layer. This progressive feature combination through the cascade structure enables the model to effectively capture and refine complex nonlinear relationships within the data. In the final stage, the outputs from the last layer of forests are aggregated using both average and maximum operations to form a class vector. This vector is then employed to derive the final prediction. The combination of averaging and maximizing techniques aids in stabilizing the prediction. This approach reduces the risk of overfitting by ensuring the model does not overly depend on the output of any single tree. This method has been extensively applied across various fields, from image recognition to financial forecasting, demonstrating its versatility and effectiveness in handling diverse data types and prediction problems [37,38,39,40]. In this study, the DF model serves as the core algorithm for CO2 emission prediction, leveraging its robust ensemble learning capabilities to fully utilize the high-quality input data RFE selects. During the layer-by-layer training process, the DF model integrates the outputs of various decision trees and employs an ensemble strategy at each layer to continuously enhance the overall generalization capability of the model. This structured approach significantly reduces the risk of overfitting and ensures high-precision CO2 emission predictions even under complex and variable data conditions.

2.3. Optuna Framework

Optuna is an automated hyperparameters optimization framework designed to efficiently identify the optimal combination of parameters for machine learning models [41]. It employs Bayesian optimization combined with the tree-structured Parzen estimator (TPE) approach, facilitating a more intelligent search space exploration. This approach balances exploring new parameters with exploiting known effective parameters to ensure optimal model performance across various configurations. Renowned for its flexibility and powerful search capabilities, Optuna supports complex decision-making processes in machine learning tasks and has been successfully applied in multiple advanced applications [42,43,44]. In this study, Optuna is specifically employed to fine-tune the hyperparameters of the DF model, which are critical for enhancing the learning efficacy and generalization ability of the model. This strategic optimization uses the ability to effectively navigate multi-dimensional hyperparameters spaces of Optuna, allowing the DF model to precisely adjust and better predict CO2 emissions while saving time on tuning hyperparameters.

2.4. Evaluation Metrics

This study uses mean squared error (MSE), mean absolute error (MAE), and R2 as evaluation metrics. MSE quantifies the average squared difference between predicted and actual values, reflecting the overall prediction error. MAE computes the average absolute differences between predicted and actual values, evaluating the average error level. R2 assesses the ability to explain the variance in the model data, with values closer to 1 signifying a better model fit. Collectively, these metrics provide a comprehensive assessment of the predictive performance of the model. The definitions of these metrics are as follows [45]:
M S E = 1 n i = 1 n ( y i y i ^ ) 2
M A E = 1 n i = 1 n | y i y i ^ |
R 2 = i = 1 n ( y i y i ¯ ) 2 ( y i y i ^ ) 2 ( y i y i ¯ ) 2
In the equations, y i denotes the actual value of y, y i ^ represents the predicted value of y, and y ¯ indicates the mean of y. For comparison, the MSE and MAE in this study are computed after normalizing the data.

3. Results and Discussion

3.1. Data Collection and Processing

The data used in this study were obtained from the operating parameters of a 320 MW boiler at a coal-fired power plant located in the Guangxi Zhuang Autonomous Region, China. The data encompass key operating parameters of the boiler, flue gas flow parameters, desulfurization and denitrification parameters, and coal quality parameters used in the boiler, totaling 46 features. A total of 247 datasets were collected from 1 November 2023 to 29 September 2024. The boiler features a “W”-shaped flame design, a double-arch furnace structure, dual rear flues, and a balanced ventilation system. It is constructed with a steel frame and a fully suspended structure.
Additionally, the equipment is installed outdoors and incorporates a solid slag removal system. Its technical characteristics include operation under subcritical conditions, a natural circulation system, and intermediate reheat technology. The data originate from actual measurements taken by a CEMS system, which utilizes sonic nozzle dilution sampling and employs dry instrument air for immediate dilution of the sample gas to ensure the accuracy of the analysis. Partial features of the dataset are shown in Table 1. To ensure the ability to generalize the model, 80% of the data were randomly allocated to the training set for training and optimization. The other 20% served as the test set to evaluate the performance of the model. The RF, RFE, DF, XGboost, support vector regression (SVR) models were used in this study. RF, RFE, SVR were primarily sourced from the scikit-learn library (version 1.3.2), XGBoost(version 2.1.2) and DF(0.1.7) originating from their respective dedicated libraries.

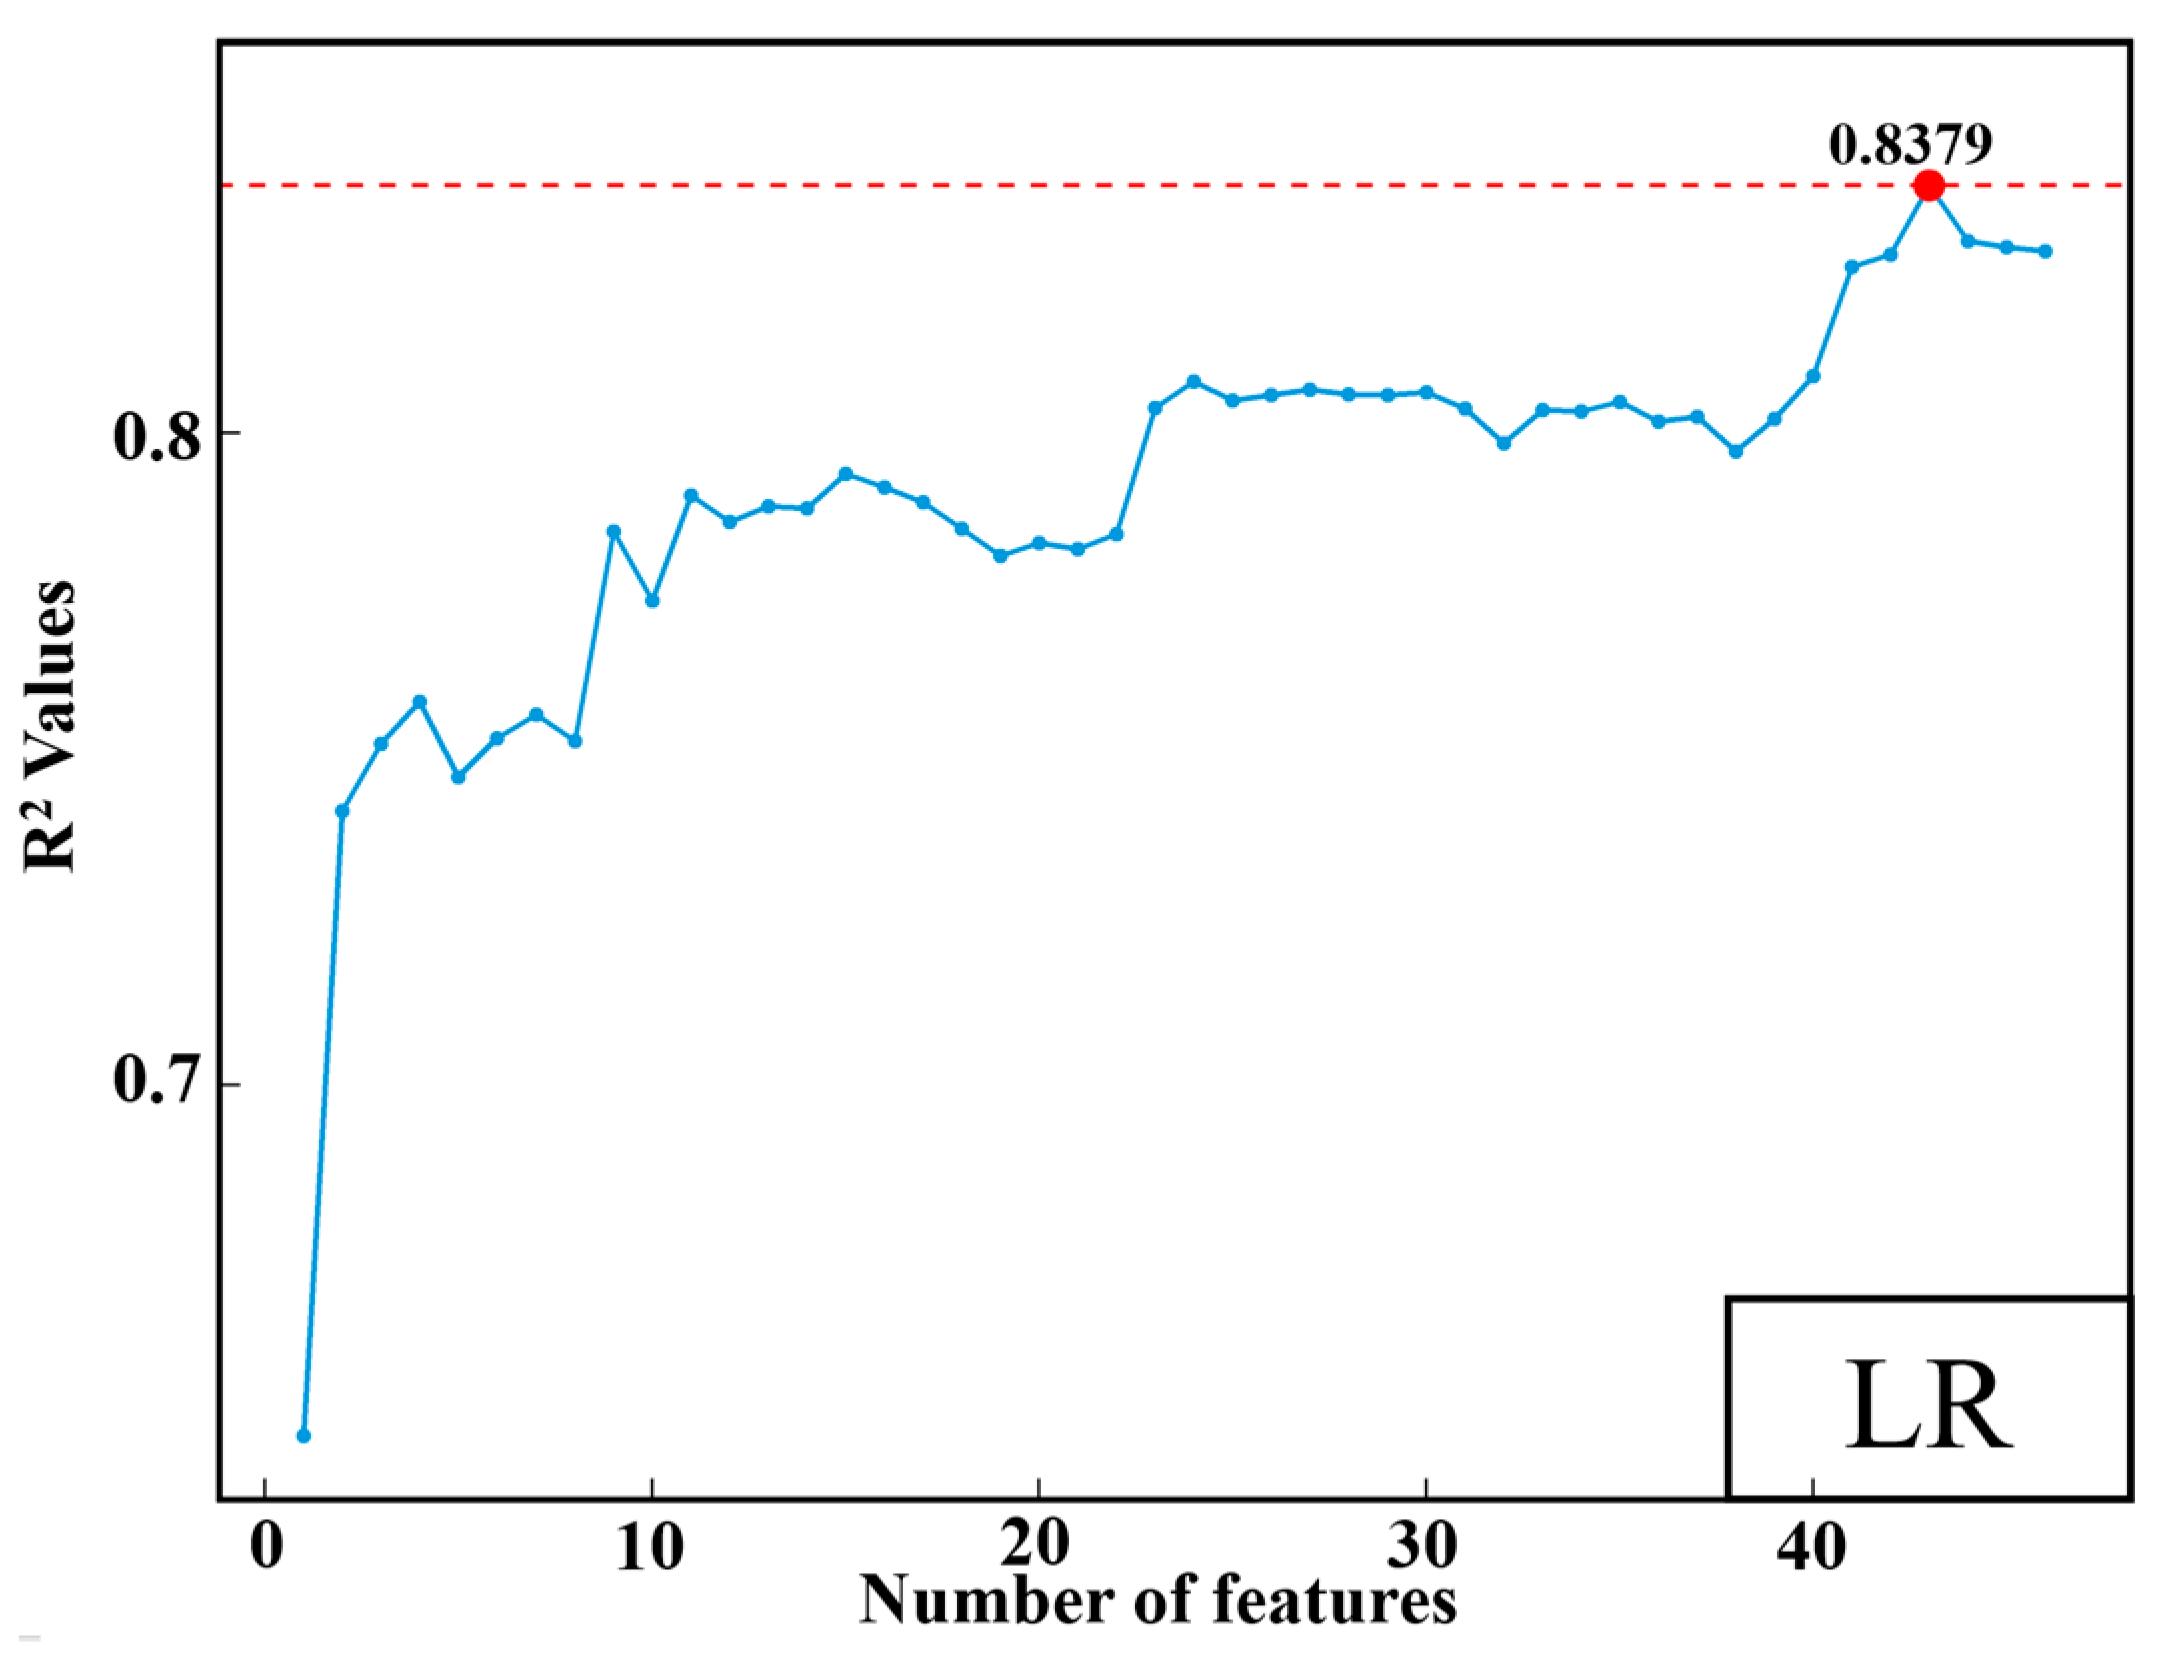
3.2. Features Selection

In this section, the performance of RFE is combined with three base models with fundamentally different architectures: linear regression (LR), ridge regression (RR), and random forest (RF). Each model is selected for its unique data handling approach, which is especially useful in coal-fired power plant operations where complex nonlinear interactions between data variables and CO2 emissions challenge the effectiveness of feature extraction methods. Given the many features involved, RFE systematically reduces data dimensionality by removing redundant and irrelevant features that do not significantly contribute to predictive accuracy. This refinement process not only enhances model performance but also increases computational efficiency. Selecting a suitable base model is crucial, especially in complex situations such as calculating CO2 emissions from coal-fired power plant data. It ensures an accurate evaluation of the importance of features, thereby optimizing the efficiency of feature selection and enhancing the predictive performance of the final model.
The RFE algorithm conducts feature selection by recursively training the model and systematically eliminating the least important features at each iteration. This iterative process evaluates the performance impact of each feature on the model and prunes the least impactful ones to refine the feature set progressively. A loop starting with a single feature was implemented to determine the optimal number of features, and more were incrementally added until all features were included. For each incremental feature set derived from the RFE process, the same XGBoost model was consistently used to train and assess the performance by the corresponding R2. A higher R2 value obtained with fewer features indicates a more efficient feature extraction capability by the RFE structure, demonstrating its effectiveness in identifying the most impactful predictors. This approach provides a quantitative assessment of the impact of each feature on model performance, revealing the threshold beyond which additional features cease to contribute significant improvements. Moreover, it highlights the risk of overfitting, where further inclusion of features might degrade performance, demonstrating the importance of strategic feature selection to maintain model efficacy and prevent data overfitting.
Firstly, LR was employed as the foundational model within the RFE framework to select features, with outcomes illustrated in Figure 4. As can be seen from the graph, while the initial number of features increases, the R2 value goes through phases of rapid growth, stabilization, and again small growth. In the initial phase, the R2 value rises sharply from a level close to 0.7 to about 0.75, indicating that the features added during this phase have a significant positive effect on the predictive power of the model. However, with the further increase in the number of features, the growth of the R2 value becomes stable, indicating that the contribution of the new features to the model performance gradually decreases. Especially when the number of features exceeds 20, the R2 value remains almost unchanged until the number of features approaches 43, and the R2 value rises slightly, reaching a peak of about 0.8379. This small increase may not be enough to justify adding more features, especially given the increase in model complexity and computational costs. In addition, despite achieving a relatively high R2 value, the large number of features required to reach this level indicates inefficiency in the feature extraction method. This suggests that the method, while capable of identifying influential features to some extent, is not optimal as it necessitates a substantial number of features to achieve significant model performance.
Subsequently, we selected the RR model as the base model to establish the RR-RFE model for feature selection, with the results presented in Figure 5. Despite observing that the R2 value peaked at 0.7914 with 43 features, this high number of features necessary to achieve such a result indicates inefficiency in the feature selection process. The significant fluctuation in R2 values, particularly noticeable between 20 and 30 features, points to some features adding noise or unnecessary complexity, which undermines the stability of the performance of the model. Furthermore, a substantial number of features is required before the model performs adequately, suggesting that the RR-RFE framework may lack robustness in effectively extracting the most impactful features, especially in the context of power plant data. This scenario highlights the limitations of the framework in efficiently identifying features that significantly contribute to predicting outcomes, with even the optimal feature set not yielding exceptionally high R2 values.
In addition, the RF-RFE framework is formulated, and the result is shown in Figure 6. The graph clearly demonstrates the effectiveness of the RF-RFE framework, with the R2 value rising rapidly as the number of features initially increases. This indicates a significant improvement in model performance with the addition of each feature, particularly highlighting the superior capability of the RF-RFE framework in feature extraction compared to other structures. It achieves substantial predictive accuracy with just a few selected features, confirming its excellence in extracting highly impactful features. The R2 value peaks at five features, but after that, it initially decreases, then slightly increases, and eventually stabilizes, reaching its maximum with eleven features selected. However, the improvement over using just five features is minimal, at only 0.0023. Based on these observations and considering the trade-off between model complexity and computational efficiency, as well as the marginal gains in performance, we selected the top five features for subsequent experiments. This decision, guided by the principle of parsimony, aims to simplify the model and reduce computational costs while maintaining high predictive accuracy. Such a selective approach minimizes the risk of model overfitting and ensures robustness and generalizability across different operational scenarios of the boiler. The final five selected key features and their statistical descriptions are listed in Table 2.
These features are particularly significant due to their direct or indirect relationships with CO2 emissions and their ability to effectively reflect the operational state of the boiler and combustion process. The A-side and B-side air preheater differential pressures indicate the efficiency of the air heating system, which is crucial for optimal combustion and directly impacts emission characteristics. The main steam flow and total feed water flow represent the load level and thermal balance of the boiler, directly influencing fuel consumption and CO2 emissions. Lastly, the total ammonia injection flow, primarily used for controlling NOx emissions, indirectly indicates combustion efficiency and CO2 generation, as variations in ammonia flow can reflect changes in combustion conditions. These selected features, representing a combination of mechanical operation and emission control systems, are used as input for the training of the DF model. By focusing on these critical parameters, the model can predict CO2 emissions more accurately under varying operational conditions. This targeted approach not only enhances the applicability of the model to real-world conditions but also boosts its generalization capability across different settings and operational parameters of the boiler.

3.3. Prediction of CO2 Emission

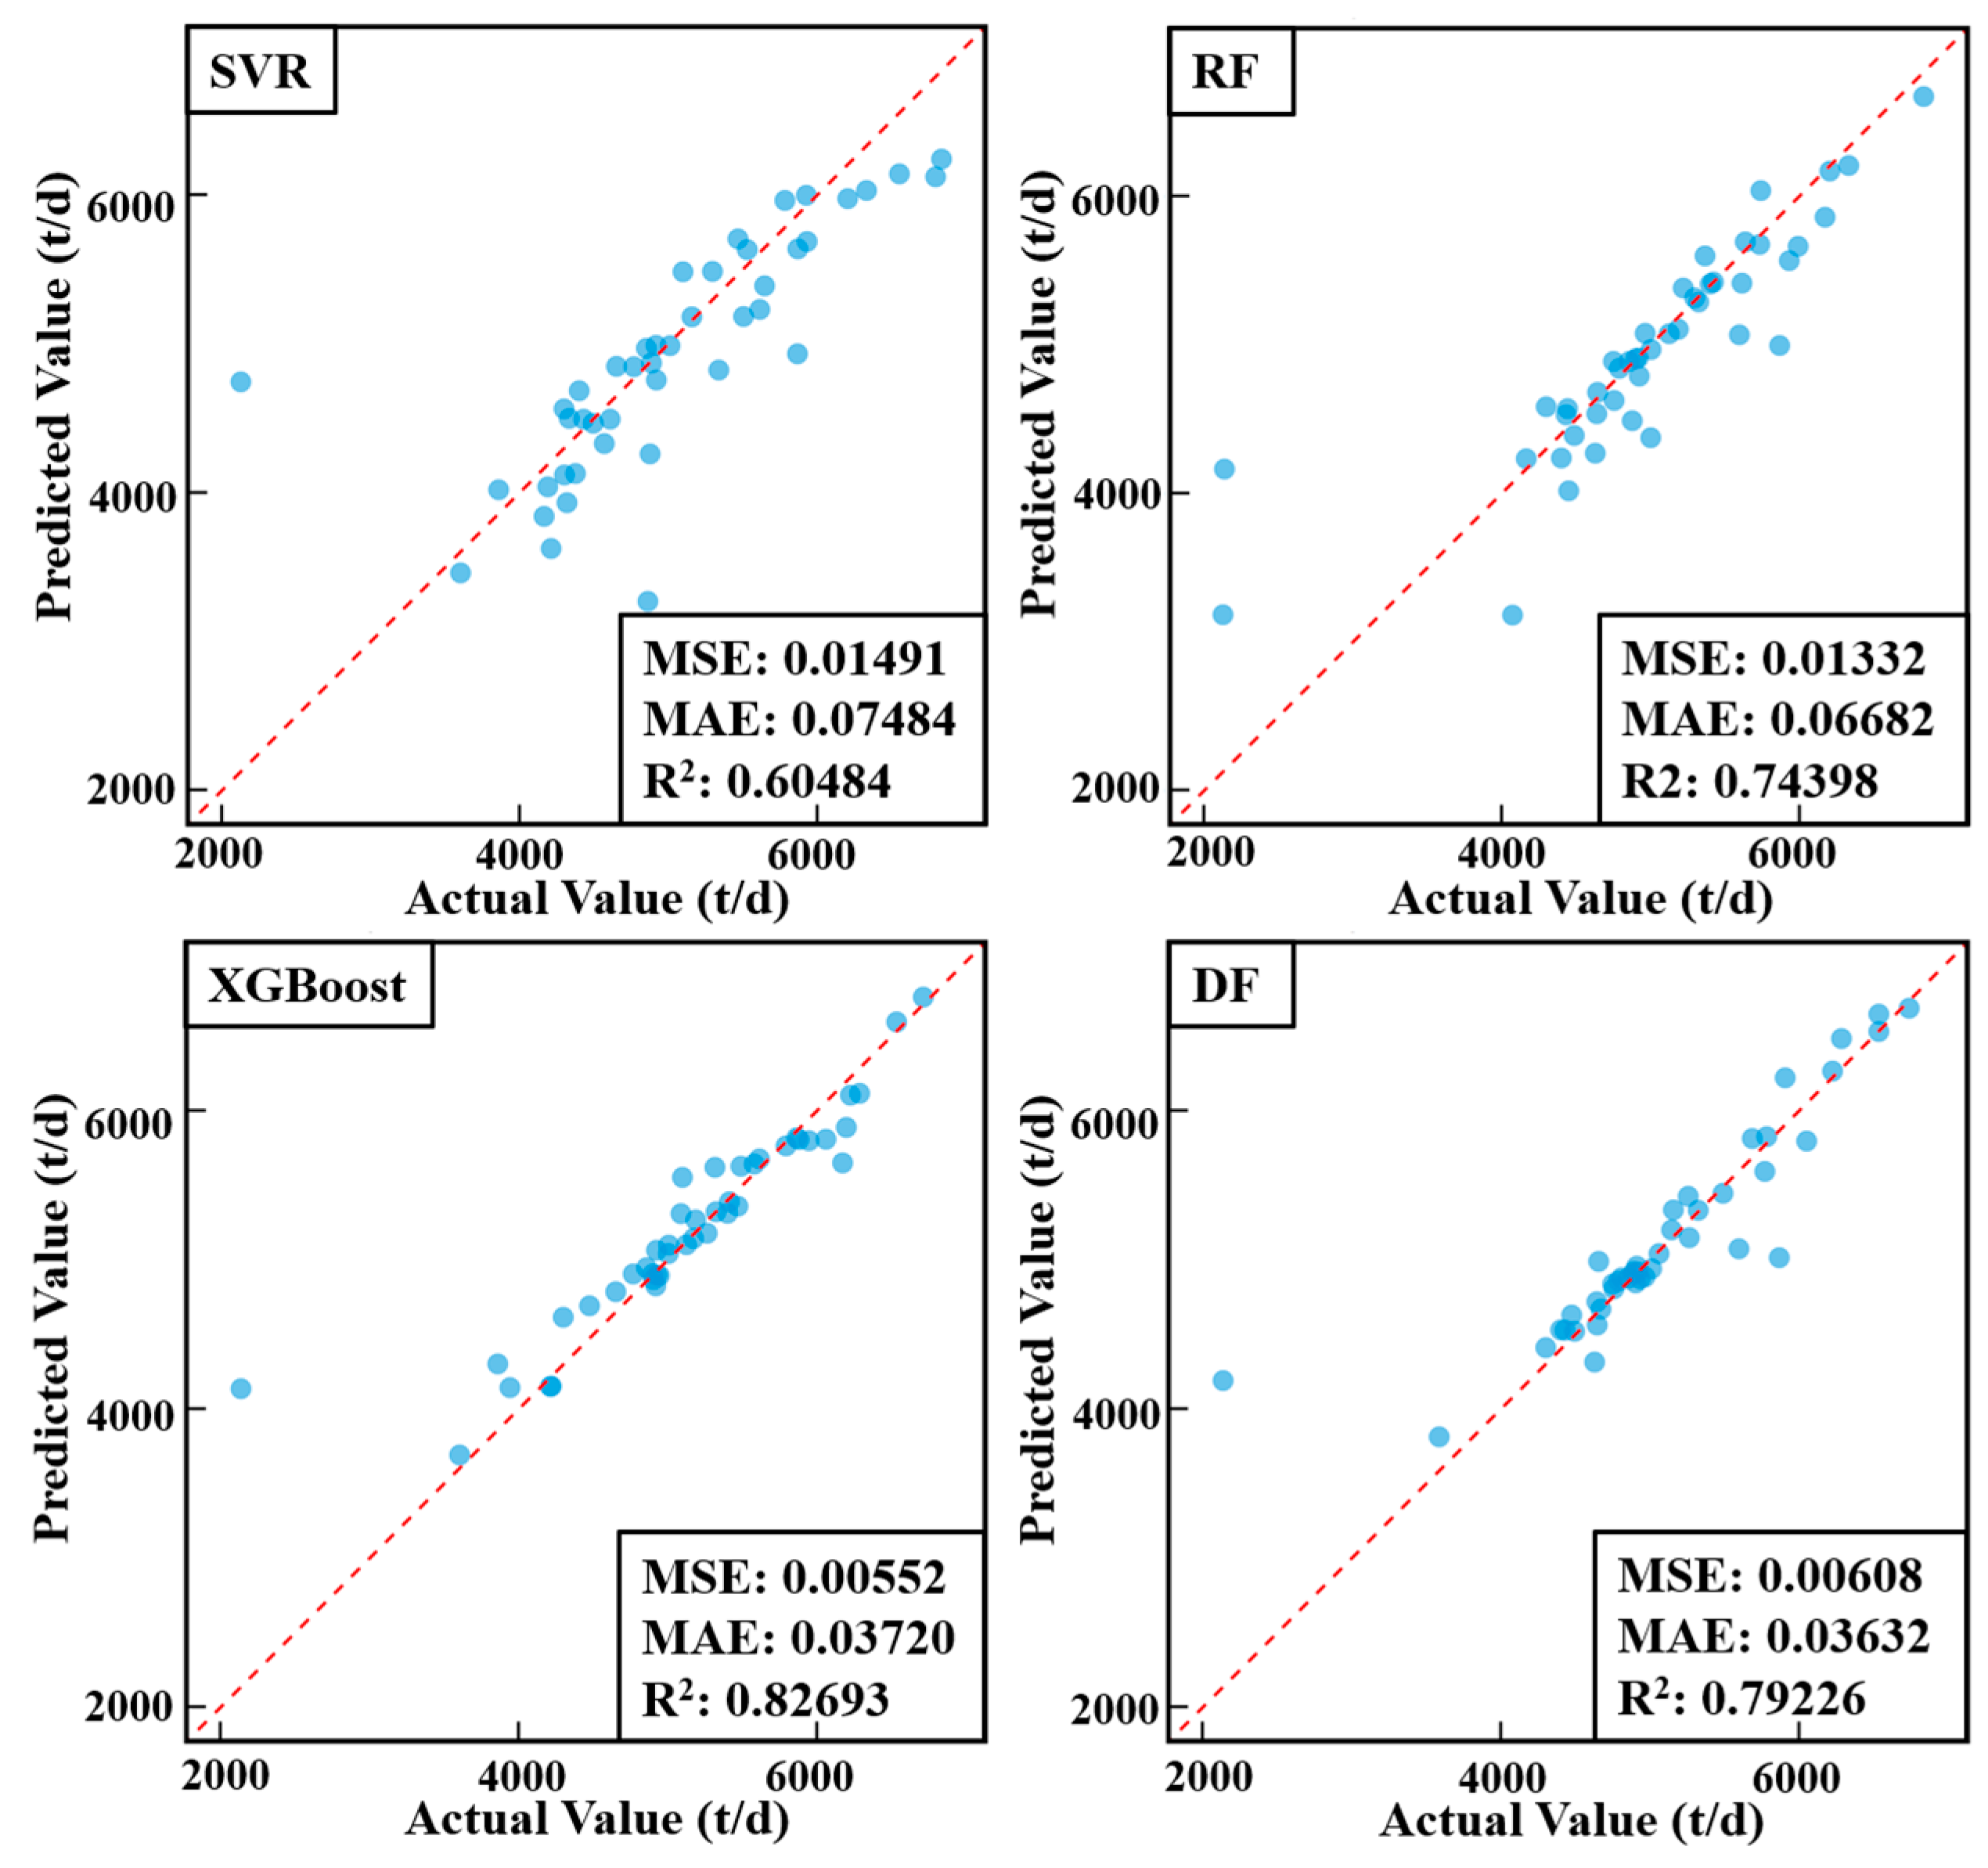
3.3.1. Prediction Model Evaluation

To evaluate the performance of the DF model, it was compared with three widely used machine learning algorithms: RF, XGBoost, and SVR. The hyperparameters of all models were initialized with the following default settings shown in Table 3. This comparative setup was designed to establish a baseline for the performance of each model under a standardized scenario, providing a clear, unbiased assessment of their predictive capabilities without the influence of tailored hyperparameters tuning. This approach allows us to evaluate the intrinsic algorithmic strengths and weaknesses of each model when applied to high-dimensional and complex data from coal-fired power plants.
The results of the experiments are summarized in Figure 7, which visually illustrates the comparison of the four models. Among these models, the DF model presents mixed results. It achieves an R2 value of 0.79226, indicating a strong ability to explain a substantial portion of the variance in the data. This high R2 value suggests that the DF model effectively captures complex dynamics. The MSE and MAE for the DF model are 0.00608 and 0.03632, respectively. These results are commendable, showcasing the capability of the model to provide accurate predictions with minimal deviation from actual values. However, compared to other models, particularly XGBoost with its lower MSE of 0.00552, it becomes evident that the DF model, despite its advanced structure, does not achieve the lowest error rates in this evaluation. The superior MSE performance of the XGBoost model indicates strong predictive power, likely due to its gradient-boosting framework that minimizes errors through sequential corrections. In contrast, with its unique and complex cascade structure, the DF model is designed to handle nonlinearities and intricate interactions within the dataset effectively. However, initial results suggest that the full potential of this sophisticated structure has not been fully leveraged.
Several factors may explain why the current metrics do not fully reflect the DF model with advanced capabilities. One reason is the inherent complexity and configurational demands of the DF model, which may require more fine-tuned parameter settings to handle the specific characteristics of the dataset optimally. Additionally, the performance of the DF model may be limited by the initial hyperparameters setup, which has not been optimized to address the specific challenges and nuances of the CO2 emission data. Therefore, while the DF model holds significant potential due to its architectural strengths, there is considerable room for improvement.

3.3.2. Hyperparameters Optimization with OPTUNA

After the initial predictions, this section further optimizes the hyperparameters of the four models used in this study by the Optuna framework to test the upper limits of the predictive capabilities of the DF-Optuna algorithm. The objective function of Optuna is to minimize the MSE of the models, which means that it will reduce the bias of the models by adjusting the hyperparameters. The hyperparameters search space for each model was carefully defined to enable a broad yet targeted exploration of potential configurations. Optuna updates the search space intelligently during each trial, dynamically adjusting hyperparameters based on their impact on performance. This method balances exploring new parameter spaces and exploiting areas that yield promising results, making it especially effective for optimizing complex models. This iterative process of refinement and testing continues until performance gains from additional trials diminish, signaling the attainment of near-optimal hyperparameters. The hyperparameters optimization search spaces and the results of the best configurations for each model are detailed in Table 4. The final prediction results, demonstrating the effectiveness of the optimized models, are shown in Figure 8.
The results clearly demonstrate the superiority of the DF-Optuna framework, especially in terms of predictive accuracy compared to other optimized models. The R2 value of 0.95399 indicates an exceptional fit to the data, reflecting the ability of the DF-Optuna model to capture complex, nonlinear relationships. The model achieves the lowest MSE of 0.00101 and MAE of 0.02348, marking a significant reduction of 83.39% in MSE and 35.37% in MAE compared to the pre-optimization results. This improvement highlights the effectiveness of Optuna in fine-tuning hyperparameters to maximize model performance. When compared to the SVR-Optuna model, which performed as the second-best with an MSE of 0.00173 and an MAE of 0.02965, the DF-Optuna model demonstrates a significant improvement, reducing MSE by 41.62% and MAE by 20.81%. This substantial reduction in error metrics underscores the enhanced ability of the DF model to capture and analyze the complex, nonlinear patterns inherent in the data. The tailored hyperparameters optimization through Optuna plays a crucial role in this improvement, ensuring that the model is finely tuned to the specific data characteristics, leading to more accurate and reliable predictions. The dramatic decrease in error rates translates directly to higher accuracy, enhanced reliability, and more stable predictions from the DF-Optuna model. The deep cascade structure of the DF model, when optimally tuned using Optuna, enables the model to effectively leverage nonlinear features and complex interactions within the dataset, which are often challenging for traditional models to capture. Compared to traditional models that performed best without optimization, the DF-Optuna framework demonstrated substantial improvements: the MSE decreased by 81.70%, the MAE by 36.88%, and the R2 value increased by 0.12706. These significant improvements have shown the effectiveness of the DF-Optuna model, with the optimization framework driving a remarkable enhancement in model performance.
In conclusion, these results underscore the advantages of the integrated RF-RFE-DF-Optuna framework. By employing RFE, the model focuses on the most critical features, reducing dimensionality and noise. The DF-Optuna framework significantly reduces errors using the DF architecture, which leverages an ensemble-based deep structure to capture nonlinear interactions effectively. Meanwhile, Optuna systematically fine-tunes hyperparameters, ensuring that each model component is optimized for the given operational range. And its ability to outperform other models showcases its superior predictive power and generalization capability. This makes it a preferred choice for accurately predicting CO2 emissions, demonstrating the practical and scientific merits of integrating advanced machine learning architectures with robust optimization techniques. This synergy of targeted feature selection, robust ensemble learning, and dynamic hyperparameters optimization streamlines computational efforts and enhances predictive stability.
The effectiveness of this framework shows its versatility and potential for broader application in emission monitoring. Future research could explore the application of this framework across different categories of power plants, including those utilizing varied boiler technologies, combustion processes, and fuel sources. From this way, assess its performance in diverse operational environments to ensure wide-ranging adaptability and efficiency. The flexible hyperparameters tuning in the RF-RFE-DF-Optuna framework allows it to adapt to changing conditions and different power plant configurations, potentially improving cost-effectiveness by reducing trial-and-error in model selection and parameter adjustments and makes it an excellent choice for environmental data analysis across a wide range of power plants. It supports precise emission predictions and enables more effective carbon management strategies, catering to the unique requirements of different power generation systems.

4. Conclusions

This study introduces the creation of the RF-RFE-DF-Optuna framework, aimed at achieving accurate and efficient CO2 emission prediction in coal-fired power plants. The main conclusions are as follows:
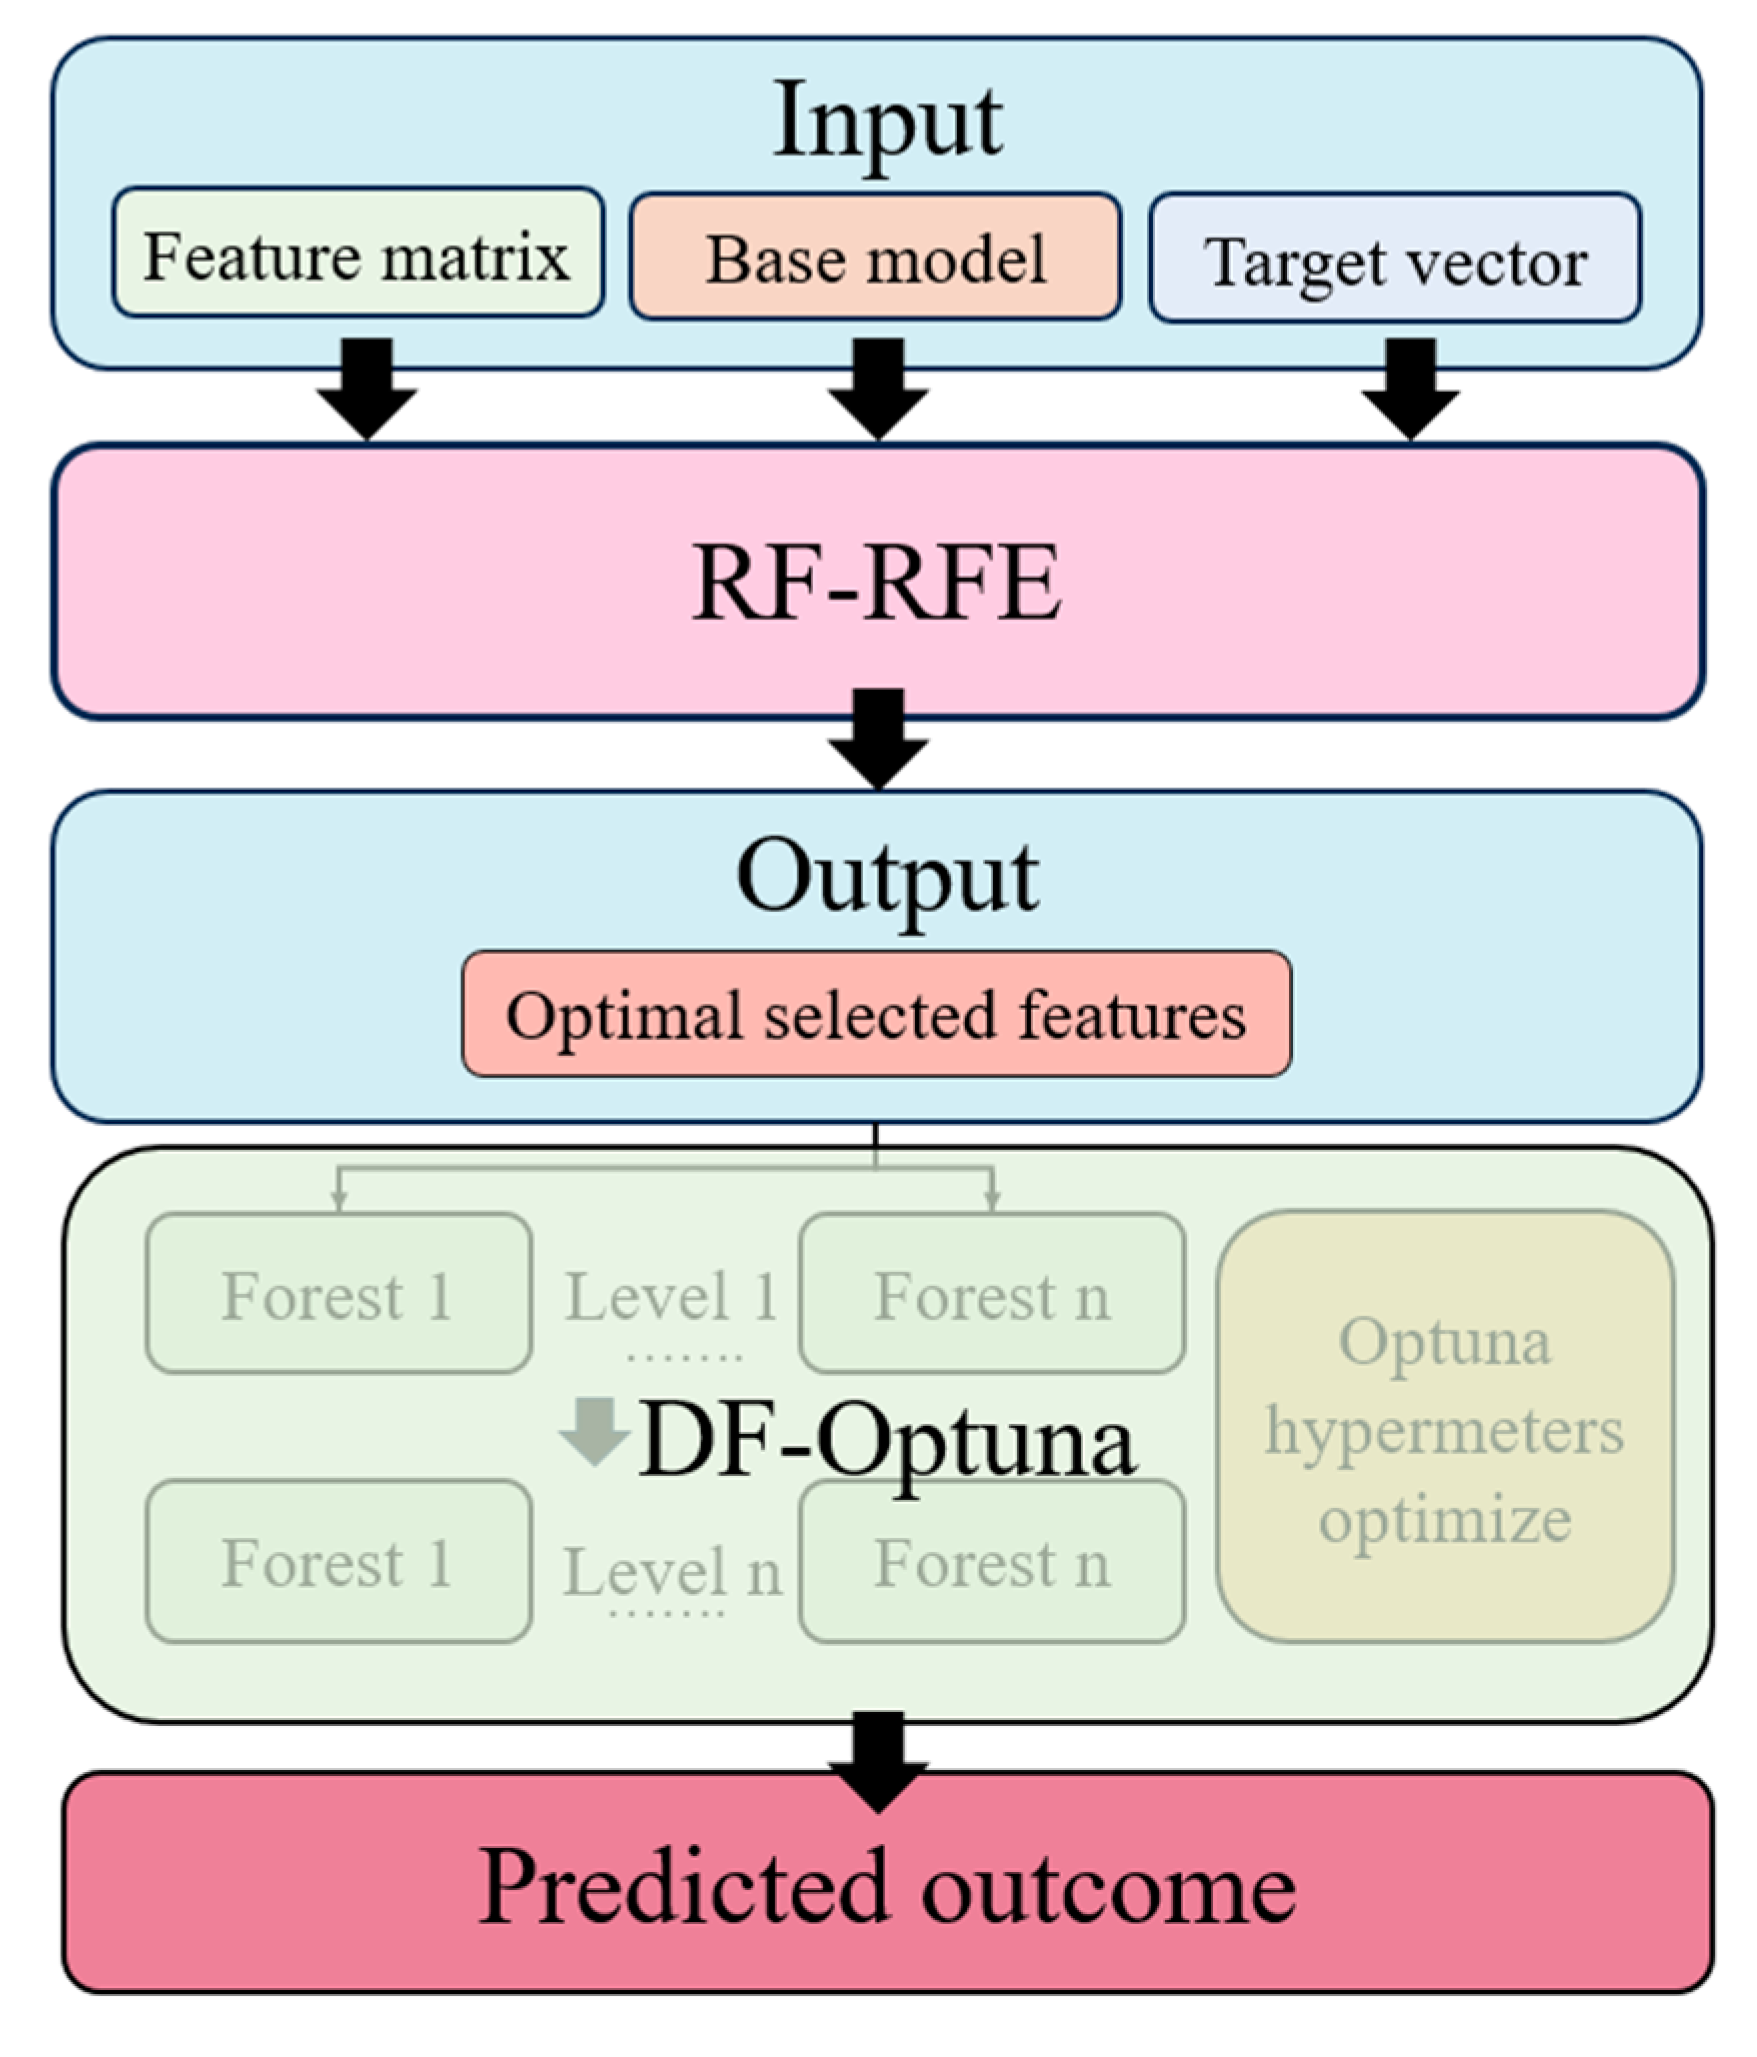
  • The RF-RFE-DF-Optuna framework was produced to select critical features using the RF-RFE method systematically and then employed the DF model integrated with Optuna for enhanced prediction precision, significantly improving the accuracy of CO2 emission forecasting in coal-fired power plants.
  • Establish RF-RFE model framework to effectively select five key features from 46 data points to predict CO2 emissions from coal-fired power plants, reducing computational resources without sacrificing accuracy.
  • The construction of the DF-Optuna model has achieved precise predictions of CO2 emissions. Compared to traditional models, it has significantly increased R2 by 0.12706, with reductions in MSE and MAE by 81.70% and 36.88%, respectively.

Author Contributions

Conceptualization, K.T.; methodology, K.T. and Y.W.; validation, K.T.; resources, K.T.; writing—original draft preparation, K.T. and Y.W.; data curation, B.L. and M.L.; funding acquisition, X.L.; writing—review and editing, X.L.; supervision, Z.H., X.W., L.S., G.L. and H.Y. All authors have read and agreed to the published version of the manuscript.

Funding

This research was funded by the Natural Science Foundation of Wuhan (grant number 2024040701010042).

Data Availability Statement

The authors do not have permission to share data.

Conflicts of Interest

Author Bo Luo was employed by the Guoneng Yongfu Power Generation Co., Ltd. The remaining authors declare that the research was conducted in the absence of any commercial or financial relationships that could be construed as a potential conflict of interest.

References

  1. Zhao, X.; Ma, X.; Chen, B.; Shang, Y.; Song, M. Challenges toward carbon neutrality in China: Strategies and countermeasures. Resour. Conserv. Recycl. 2022, 176, 105959. [Google Scholar] [CrossRef]
  2. Davenport, J.W.N. Statistical Review of World Energy; Energy Institute: London, UK, 2024. [Google Scholar]
  3. Dong, L.; Wang, L.; Wen, H.; Lin, Z.; Yao, Z.; Zou, C.; Xu, H.; Hu, H.; Yao, H. Numerical investigation of the oxy-fuel combustion in the fluidized bed using macroscopic model supported by CFD-DDPM. J. Environ. Chem. Eng. 2024, 12, 113959. [Google Scholar] [CrossRef]
  4. Zhu, Z.; Huang, Y.; Dong, L.; Xu, W.; Yu, M.; Li, Z.; Xiao, Y.; Cheng, H. Dual effects of NaCl on the high temperature adsorption of heavy metals by montmorillonite. Chem. Eng. J. 2024, 494, 152661. [Google Scholar] [CrossRef]
  5. Zhu, Z.; Huang, Y.; Dong, L.; Yu, M.; Xu, W.; Li, Z.; Xiao, Y.; Cheng, H. Effect of aluminosilicates on the release and form transformation of semi-volatile heavy metals during the combustion of hyperaccumulator plants. J. Clean. Prod. 2024, 461, 142604. [Google Scholar] [CrossRef]
  6. Feng, Y.; Wang, S.; Sha, Y.; Ding, Q.; Yuan, J.; Guo, X. Coal power overcapacity in China: Province-Level estimates and policy implications. Resour. Conserv. Recycl. 2018, 137, 89–100. [Google Scholar] [CrossRef]
  7. Ghadimi, P.; Wang, C.; Azadnia, A.H.; Lim, M.K.; Sutherland, J.W. Life cycle-based environmental performance indicator for the coal-to-energy supply chain: A Chinese case application. Resour. Conserv. Recycl. 2019, 147, 28–38. [Google Scholar] [CrossRef]
  8. IPCC. Guidelines for National Greenhouse Gas Inventories; Institute for Global Environmental Strategies: Hayama, Japan, 2006. [Google Scholar]
  9. AlKheder, S.; Almusalam, A. Forecasting of carbon dioxide emissions from power plants in Kuwait using United States Environmental Protection Agency, Intergovernmental Panel on Climate Change, and machine learning methods. Renew. Energy 2022, 191, 819–827. [Google Scholar] [CrossRef]
  10. Liu, Z.; Guan, D.; Wei, W.; Davis, S.J.; Ciais, P.; Bai, J.; Peng, S.; Zhang, Q.; Hubacek, K.; Marland, G.; et al. Reduced carbon emission estimates from fossil fuel combustion and cement production in China. Nature 2015, 524, 335–338. [Google Scholar] [CrossRef]
  11. Wang, P.; Zhao, Y.; Zhang, J.; Xiong, Z. Research progress on carbon measurement methods for coal-fired power plants under the dual carbon targets. Clean Coal Technol. 2022, 28, 170–183. [Google Scholar] [CrossRef]
  12. Tang, L.; Jia, M.; Yang, J.; Li, L.; Bo, X.; Mi, Z. Chinese industrial air pollution emissions based on the continuous emission monitoring systems network. Sci. Data 2023, 10, 110–153. [Google Scholar] [CrossRef]
  13. Wu, N.; Geng, G.; Qin, X.; Tong, D.; Zheng, Y.; Lei, Y.; Zhang, Q. Daily emission patterns of coal-fired power plants in China based on multisource data fusion. ACS Environ. Au 2022, 2, 363–372. [Google Scholar] [CrossRef] [PubMed]
  14. Hu, Y.; Shi, Y. Estimating CO2 emissions from large-scale coal-fired power plants using OCO-2 observations and emission inventories. Atmosphere 2021, 12, 811. [Google Scholar] [CrossRef]
  15. Sun, J.; Kong, X.; Chen, Y. Review of carbon emission accounting methods for the whole process of power systems. Autom. Electr. Power Syst. 2024, 1–14. Available online: https://link.cnki.net/urlid/32.1180.TP.20240410.1325.002 (accessed on 19 December 2024).
  16. Hu, Z.; Yuan, Y.; Li, X.; Wang, Y.; Dacres, O.D.; Yi, L.; Liu, X.; Hu, H.; Liu, H.; Luo, G.; et al. “Thermal-dissolution based carbon enrichment” treatment of biomass: Modeling and kinetic study via combined lumped reaction model and machine learning algorithm. Fuel 2022, 324, 124701. [Google Scholar] [CrossRef]
  17. Tang, Q.; Chen, Y.; Yang, H.; Liu, M.; Xiao, H.; Wang, S.; Chen, H.; Naqvi, S.R. Machine learning prediction of pyrolytic gas yield and compositions with feature reduction methods: Effects of pyrolysis conditions and biomass characteristics. Bioresour. Technol. 2021, 339, 125581. [Google Scholar] [CrossRef]
  18. Gupta, A.; Gowda, S.; Tiwari, A.; Gupta, A.K. XGBoost-SHAP framework for asphalt pavement condition evaluation. Constr. Build. Mater. 2024, 426, 136182. [Google Scholar] [CrossRef]
  19. Zhu, C.; Shi, P.; Li, Z.; Li, M.; Zhang, H.; Ding, T. Carbon emission prediction of thermal power plants based on machine learning techniques. In Proceedings of the 5th International Conference on Energy, Electrical and Power Engineering (CEEPE), Chongqing, China, 22–24 April 2022. [Google Scholar] [CrossRef]
  20. Saleh, C.; Dzakiyullah, N.R.; Nugroho, J.B. Carbon dioxide emission prediction using support vector machine. IOP Conf. Ser. Mater. Sci. Eng. 2016, 114, 12148–12155. [Google Scholar] [CrossRef]
  21. Zhou, S.; He, H.; Zhang, L.; Zhao, W.; Wang, F. A data-driven method to monitor carbon dioxide emissions of coal-fired power plants. Energies 2023, 16, 1646. [Google Scholar] [CrossRef]
  22. Liao, Y.; Zhong, J.; Meng, X.; Sun, L.W.; Fan, J.H. Research on the prediction model of CO2 emission based on different operating conditions for 100MW boiler. In Proceedings of the New Energy and Sustainable Development Conference(NESD), Changsha, China, 19–20 March 2016; pp. 458–467. [Google Scholar] [CrossRef]
  23. Chen, J.; Zheng, L.; Che, W.; Liu, L.; Huang, H.; Liu, J.; Xing, C.; Qiu, P. A method for measuring carbon emissions from power plants using a CNN-LSTM-Attention model with Bayesian optimization. Case Stud. Therm. Eng. 2024, 63, 105334. [Google Scholar] [CrossRef]
  24. Cheng, D.; Xiao, J.; Sun, L.; Liu, Y.; Feng, Y.; Kang, Y.; Ma, L.; Lu, H. Research on CO2 emission prediction of coal-fired power plant based on RBF neural network. In Proceedings of the 2023 IEEE International Conference on Smart Electrical Grid and Renewable Energy, Changsha, China, 16–19 June 2023. [Google Scholar] [CrossRef]
  25. Chen, X.; Qian, X.; Song, W. Image Classification Algorithm Based on Lightweight Feature Fusion Convolutional Network. Comput. Eng. 2021, 47, 268–275. [Google Scholar] [CrossRef]
  26. Buyukkececi, M.; Okur, M.C. An Empirical Evaluation of Feature Selection Stability and Classification Accuracy. Gazi Univ. J. Sci. 2024, 37, 606–620. [Google Scholar] [CrossRef]
  27. Li, P.; Zhou, W.; Bai, X.; Chen, C.; Liu, S.; Sun, T. Carbon emission performance calculation and impact analysis of coal-fired power plants. Clean Coal Technol. 2024, 30, 66–74. [Google Scholar] [CrossRef]
  28. Lima, M.T.; do Nascimento, D.C.; Pimentel, B.A. Optimization on selecting XGBoost hyperparameters using meta-learning. Expert Syst. 2024, 41, e13611. [Google Scholar] [CrossRef]
  29. Wojciuk, M.; Swiderska-Chadaj, Z.; Siwek, K.; Gertych, A. Improving classification accuracy of fine-tuned CNN models: Impact of hyperparameter optimization. Heliyon 2024, 10, e26586. [Google Scholar] [CrossRef] [PubMed]
  30. Guyon, I.; Weston, J.; Barnhill, S.; Vapnik, V. Gene selection for cancer classification using support vector machines. Mach. Learn. 2002, 46, 389–422. [Google Scholar] [CrossRef]
  31. Li, Q.; Du, Z.; Chen, Z.; Huang, X.; Li, Q. Multiview Deep Forest for Overall Survival Prediction in Cancer. Comput. Math. Methods Med. 2023, 2023, 7931321. [Google Scholar] [CrossRef]
  32. Liu, B.; Sun, Y.; Gao, L. An improved container-based deep forest model for predicting groundwater recharge. J. Phys. Conf. Ser. 2024, 2816, 012033. [Google Scholar] [CrossRef]
  33. Ma, X.; Huo, Z.; Lu, J.; Wong, Y.D. Deep Forest with SHapley additive explanations on detailed risky driving behavior data for freeway crash risk prediction. Eng. Appl. Artif. Intell. 2024, 141, 109787. [Google Scholar] [CrossRef]
  34. Sharma, A.; Singh, M. Batch reinforcement learning approach using recursive feature elimination for network intrusion detection. Eng. Appl. Artif. Intell. 2024, 136, 109013. [Google Scholar] [CrossRef]
  35. Benjamin, K.J.M.; Katipalli, T.; Paquola, A.C.M. DRFEtools: Dynamic recursive feature elimination for omics. Bioinformatics 2023, 39, btad513. [Google Scholar] [CrossRef]
  36. Idris, N.F.; Ismail, M.A.; Jaya, M.I.M.; Ibrahim, A.O.; Abulfaraj, A.W.; Binzagr, F. Stacking with Recursive Feature Elimination-Isolation Forest for classification of diabetes mellitus. PLoS ONE 2024, 19, e0302595. [Google Scholar] [CrossRef] [PubMed]
  37. Zhou, Z.; Feng, J. Deep Forest: Towards an Alternative to Deep Neural Networks. arXiv 2017. [Google Scholar] [CrossRef]
  38. Tan, Q.; Wen, Y.; Xu, Y.; Liu, K.; He, S.; Bo, X. Multi-view uncertainty deep forest: An innovative deep forest equipped with uncertainty estimation for drug-induced liver injury prediction. Inf. Sci. 2024, 667, 120342. [Google Scholar] [CrossRef]
  39. Zhou, T.; Sun, X.; Xia, X.; Li, B.; Chen, X. Improving defect prediction with deep forest. Inf. Softw. Technol. 2019, 114, 204–216. [Google Scholar] [CrossRef]
  40. Ma, C.; Liu, Z.; Cao, Z.; Song, W.; Zhang, J.; Zeng, W. Cost-sensitive deep forest for price prediction. Pattern Recognit. 2020, 107, 107499. [Google Scholar] [CrossRef]
  41. Akiba, T.; Sano, S.; Yanase, T.; Ohta, T.; Koyama, M. Optuna: A next-generation hyperparameter optimization framework. In Proceedings of the ACM SIGKDD International Conference on Knowledge Discovery & Data Mining, New York, NY, USA, 4–8 August 2019. [Google Scholar] [CrossRef]
  42. Li, Y.; Hu, L.; Li, N.; Shen, W. A light attention-mixed-base deep learning architecture toward process multivariable modeling and knowledge discovery. Comput. Chem. Eng. 2023, 174, 108259. [Google Scholar] [CrossRef]
  43. Almarzooq, H.; Bin Waheed, U. Automating hyperparameter optimization in geophysics with Optuna: A comparative study. Geophys. Prospect. 2024, 72, 1778–1788. [Google Scholar] [CrossRef]
  44. Li, Y.; Cao, Y.; Yang, J.; Wu, M.; Yang, A.; Li, J. Optuna-DFNN: An Optuna framework-driven deep fuzzy neural network for predicting sintering performance in big data. Alex. Eng. J. 2024, 97, 100–113. [Google Scholar] [CrossRef]
  45. Wang, Y.; Qin, L.; Wang, Q.; Chen, Y.; Yang, Q.; Xing, L.; Ba, S. A novel deep learning carbon price short-term prediction model with dual-stage attention mechanism. Appl. Energy 2023, 347, 121380. [Google Scholar] [CrossRef]
Figure 1. The structure of the RF-RFE-DF-Optuna model.
Energies 17 06449 g001
Figure 2. Flowchart of the RFE Algorithm.
Energies 17 06449 g002
Figure 3. Illustration of the multi-layer cascade structure of the deep forest model.
Energies 17 06449 g003
Figure 4. Number of features vs. R2 value (LR-RFE).
Energies 17 06449 g004
Figure 5. Number of features vs. R2 value (RR-RFE).
Energies 17 06449 g005
Figure 6. Number of features vs. R2 value (RF-RFE).
Energies 17 06449 g006
Figure 7. Prediction of CO2 emission.
Energies 17 06449 g007
Figure 8. Prediction of CO2 after optimizing.
Energies 17 06449 g008
Table 1. Partial features of the dataset.
Type of FeaturesFeatures Name
Boiler Operating ParametersLoadBoiler EfficiencyMain Steam FlowTotal Coal Feed
Main Steam PressureMain Steam Temperature
Flue Gas ParametersStandard Gas FlowFlue Gas Oxygen at SCR Inlet
Oxygen Level at Air Preheater Outlet
Temperature ParametersAir Supply TemperatureFlue Gas Temperature
Air Preheater Outlet Primary Air Temperature
Flue Gas Pollutant ParametersSCR Inlet NOx ValueSCR Outlet NOx Value
Total Ammonia Injection FlowDesulfurization Inlet SO2 Value
Coal Quality ParametersSCR Inlet NOx ValueSCR Outlet NOx Value
Total Ammonia Injection FlowDesulfurization Inlet SO2 Value
Table 2. Statistical description of key features.
Key Features NameMeanMedianStandard Deviation
A-side air preheater differential pressure (kPa)0.770.780.12
B-side air preheater differential pressure (kPa)0.790.790.17
Main steam flow (t/h)696.26694.4897.47
Total feed water flow (t/h)736.25735.0595.09
Total ammonia injection flow (t/h)319.10333.86175.31
Table 3. Initial hyperparameters of all models.
Hyperparameters NameSettingHyperparameters NameSetting
DF_N_estimators2RF_N_estimators50
DF_Max_layersNoneRF_Max_depth3
DF_N_trees100RF_Min_samples_split4
DF_Max_depthNoneRF_Min_samples_leaf5
DF_Min_samples_split2RF_Max_Featuresnone
XGBoost_N_estimators100SVR_Kernelrbf
XGBoost_Max_depth6SVR_C1.0
XGBoost_Learning_rate0.3SVR_Epsilon0.1
XGBoost_Colsample_bytree1XGBoost_Subsample1
Table 4. Overall of hyperparameters searching range.
Hyperparameters NameSearching RangeBest Hyperparameters
SVR_Kernel[1, 100]29.72
SVR_C[0.01, 0.5]0.0549
SVR_Epsilon[rbf, poly]poly
RF_N_estimators[30, 100]89
RF_Max_depth[3, 8]7
RF_Min_samples_split[2, 10]4
RF_Min_samples_leaf[3, 10]3
RF_Max_Features[sqrt, log2, none]sqrt
XGBoost_N_estimators[50, 200]200
XGBoost_Max_depth[3, 10]6
XGBoost_Learning_rate[0.01, 0.3]0.0114
XGBoost_Colsample_bytree[0.5, 1]0.7899
XGBoost_Subsample[0.5, 1]0.8735
DF_N_estimators[30, 100]86
DF_Max_layers[2, 5]2
DF_N_trees[30, 100]34
DF_Max_depth[3, 8]4
DF_Min_samples_split[3, 10]8
Disclaimer/Publisher’s Note: The statements, opinions and data contained in all publications are solely those of the individual author(s) and contributor(s) and not of MDPI and/or the editor(s). MDPI and/or the editor(s) disclaim responsibility for any injury to people or property resulting from any ideas, methods, instructions or products referred to in the content.

