Article

SOC Equalization Control Method Considering SOH in DC–DC Converter Cascaded Energy Storage Systems

1
School of Electrical Engineering, Xi’an University of Technology, Xi’an 710048, China
2
Xi’an Weiguang Energy Technology Co., Ltd., Xi’an 710075, China
*
Author to whom correspondence should be addressed.
Energies 2024, 17(24), 6385; https://doi.org/10.3390/en17246385
Submission received: 2 November 2024 / Revised: 5 December 2024 / Accepted: 16 December 2024 / Published: 19 December 2024
(This article belongs to the Special Issue Energy Storage Technologies and Applications for Smart Grids)

Abstract

:
In large-scale industrial and commercial energy storage systems, as well as ground power station energy storage systems, the trend is to adopt large-capacity battery cells to reduce system construction costs. It is essential to screen the consistency of battery cells during the initial design phase. In conventional energy storage systems, battery clusters utilize multiple batteries connected in series, which can lead to differential attenuation over time and inconsistent state of charge (SOC) among the batteries. The “barrel effect” diminishes the effective capacity of the energy storage system. To mitigate this issue, a DC–DC converter cascaded energy storage system has been developed, incorporating precise charge and discharge management for each battery module within a cluster. By implementing SOC equalization control at the module level, it mitigates the barrel effect and enables full utilization of each battery module’s charging and discharging capabilities, thereby enhancing the overall charge–discharge capacity of the energy storage system. However, when considering only the SOC equalizing factor, its effectiveness may be limited by constraints such as DC–DC converter power limitations and device voltage stress levels. Therefore, a novel SOC equalization control method that considers both SOH and SOC variations across battery modules is proposed here. Through a droop control methodology combined with closed-loop control implementation on eight DC–DC converter cascaded energy storage systems, we validate the improved effectiveness achieved by incorporating SOH-aware SOC equalization control. The energy storage system has the capability to enhance both charging and discharging capacities, achieving a remarkable increase of 1.85% every 10 min, thereby yielding significant economic advantages.

1. Introduction

Lithium-ion batteries are extensively utilized in power grid energy storage owing to their reliable battery management systems (BMSs), which ensure stable and efficient performance. A crucial BMS technique is battery status estimation, particularly in determining the state of charge (SOC) and state of health (SOH) [1]. State of charge (SOC) is defined as the proportion of the present charge relative to the maximum current capacity [2], indicating the current charge level of a battery. In contrast, state of health (SOH) is usually assessed based on the current maximum capacity or internal resistance, providing insight into the battery’s degradation over its lifespan [3]. Given the challenges in accurately estimating SOC and SOH and the interplay of their results, a joint estimation method is proposed that combines an equivalent circuit model and a data-driven model. In this framework, the actual storable energy of a battery is calculated by multiplying SOH with the battery capacity, thereby enabling precise monitoring of SOC and SOH throughout a lithium-ion battery’s life cycle [4]. This approach attains more precise estimation outcomes by accounting for the interaction between SOC and SOH via integrated models [5].
Extensive research by Chinese and international scholars over recent years has made many achievements in forecasting SOC and SOH, including battery model-based modeling, parameter profiling using mass data, neural network algorithms, and Kalman filtering algorithms, all of which estimate SOC and SOH by identifying battery parameters [6,7,8,9].
Traditional energy storage systems function through a single-stage conversion process, where a power conversion system (PCS) connects its DC terminal directly to a DC bus comprising series-parallel connected energy storage batteries, and its AC terminal to either grid-connected or standalone systems. To achieve higher capacity, multiple battery clusters can be connected in parallel with a high-capacity PCS. However, voltage disparities among these parallel battery clusters can potentially induce internal circulation currents [10], leading to potentially increased energy losses within the system. In addition, the most attenuated battery in the entire system often becomes the weak point in its battery cluster, determining the potential amount of energy that the system can actually charge or discharge, a phenomenon known as the “bucket effect” in energy storage. To mitigate the bucket effect and circulation issues in an energy storage system, precise charge–discharge control is applied to individual battery modules within the DC–DC cascaded energy storage system. This ensures that each module reaches its maximum state of charge or complete discharge, thereby enhancing the depth of discharge (DOD) and optimizing the utilization of the battery’s charge and discharge capabilities. Through the implementation of advanced droop control and DC–DC equalization control, the system facilitates the concurrent operation of batteries with varying capacities while accounting for the individual battery capacity coefficients. This leads to enhanced equalization performance in the DC–DC cascaded energy storage system [11]. However, this approach does not adequately address various limitations on capacity balancing, such as the voltage regulation range and power handling capability of the DC–DC converter. Achieving battery state-of-charge (SOC) balance is crucial for optimizing the system’s charging and discharging efficiency and ensuring uniform battery degradation. In an energy storage system, the ends of a battery connect in parallel to an SOC equalization circuit, which, in turn, connects in series with a switch pipe and a power resistor. When the switch pipe works in the switch mode, a significant share of the energy from the higher SOC battery cells is consumed by the resistor [12,13] and this leads to greater energy loss and diminished economic efficiency. The active approach utilizes inductors, transformers, or capacitors to reallocate energy from the more charged cells to the less charged ones, thereby improving energy utilization [14,15].
The battery cluster is formed by a plurality of half-bridge circuits in series with the energy storage battery unit. The circuit can realize the full charge and empty discharge of all cells, and the cells that are filled or finished in advance can be bypassed out. The half-bridge series battery cluster is connected to the DC–DC converter to realize the full and empty discharge of all cells, making it less efficient. The research in [16,17,18,19,20] provides an in-depth analysis of the operating modes of a DC–DC converter cascaded energy storage converter and expound on the working characteristic profiles of buck-mode, boost-mode, and boost–buck-mode DC–DC converters, discussing their respective application scenarios, advantages, and disadvantages. This study provides technical support for various applications that use DC–DC converters integrated with cascaded energy storage systems. It further examines the droop control mechanisms within these DC–DC converter-based energy storage configurations [21] and this study investigates the stability of the system when the DC–DC converter’s cascaded bus terminal is connected to an off-grid load. By leveraging battery impedance data obtained via electrochemical impedance spectroscopy (EIS) [22], we developed a neural network model to evaluate the state of health (SOH) and state of charge (SOC) of batteries. This model facilitates the implementation of SOC equalization control in a DC–DC cascaded energy storage system and provides a quantitative analysis of the relationship between SOH and SOC. However, it does not provide a quantitative evaluation of the state of health (SOH) and state of charge (SOC) individually, nor does it assess their impacts on equalization techniques. To optimize the utilization of cascade batteries and the integrated application of energy storage batteries with varying capacities [23], we introduced a cascaded energy storage system that utilizes a boost-mode DC–DC converter. The research further develops a mathematical model to explore SOC balancing control strategies under diverse conditions involving batteries of mixed capacities. However, this study focuses exclusively on equalizing batteries with different nominal capacities, while neglecting those with the same nominal capacities but varying states of health (SOH), which can significantly impact both the actual energy storage capacity and the outcomes of equalization. The studies in [24,25,26,27,28,29] investigate the sequencing of buck–boost mode DC–DC converters in cascaded energy storage systems, using state of charge (SOC) for the equalization process. In these systems, DC–DC converters supply more power from battery modules with higher state-of-charge (SOC) levels during discharge, while providing less power to these modules during the charging process. These studies overlooked the impact of state of health (SOH) differences on state of charge (SOC) equilibrium and assumed that all cells in the same system exhibit consistent attenuation, implying equal SOH for all cells. However, practical applications reveal inconsistencies in internal electrochemical reactions due to variations in battery materials and external environmental factors. Consequently, over time, a gradual decline in diversity occurs. Currently, industrial SOC calibration methods disregard battery attenuation and always calibrate SOC from 0 to 100%. During SOC equalization, the power distribution ratio based on SOC differs from the gain ratio based on charge amounts. Therefore, it is not feasible to achieve an ideal SOC equalization effect without considering SOH.
A DC–DC cascaded energy storage system is a practical solution to these application challenges. However, since SOH varies among battery modules, equalizing the system based on SOC alone would lead to frequent adjustments of charge and discharge powers, resulting in instability. For example, in the case of a battery cell with lower SOH but higher SOC, abrupt changes from high to low power may occur in its battery module, accelerating the aging and attenuation rates of modules with lower SOH. In contrast, when SOH is factored into the equalization process, power distribution is adjusted based on SOC and SOH during charging and discharging cycles, eliminating abrupt power fluctuations in battery modules. This approach not only enhances the stability of system operations but also ensures the balanced charging and discharging of battery modules with varying states of charge (SOC) and health (SOH), thereby enabling simultaneous full charging and discharging. The key contributions of this study are summarized as follows:
(1)
The focus of this paper is on DC–DC converters in cascaded energy storage systems, where an analysis is conducted on both the structure of the P-I series droop closed-loop control system and the operational mechanism of the DC–DC converter in charge and discharge modes. Additionally, it explores the significance of considering SOH during SOC equalization and its impact on the process.
(2)
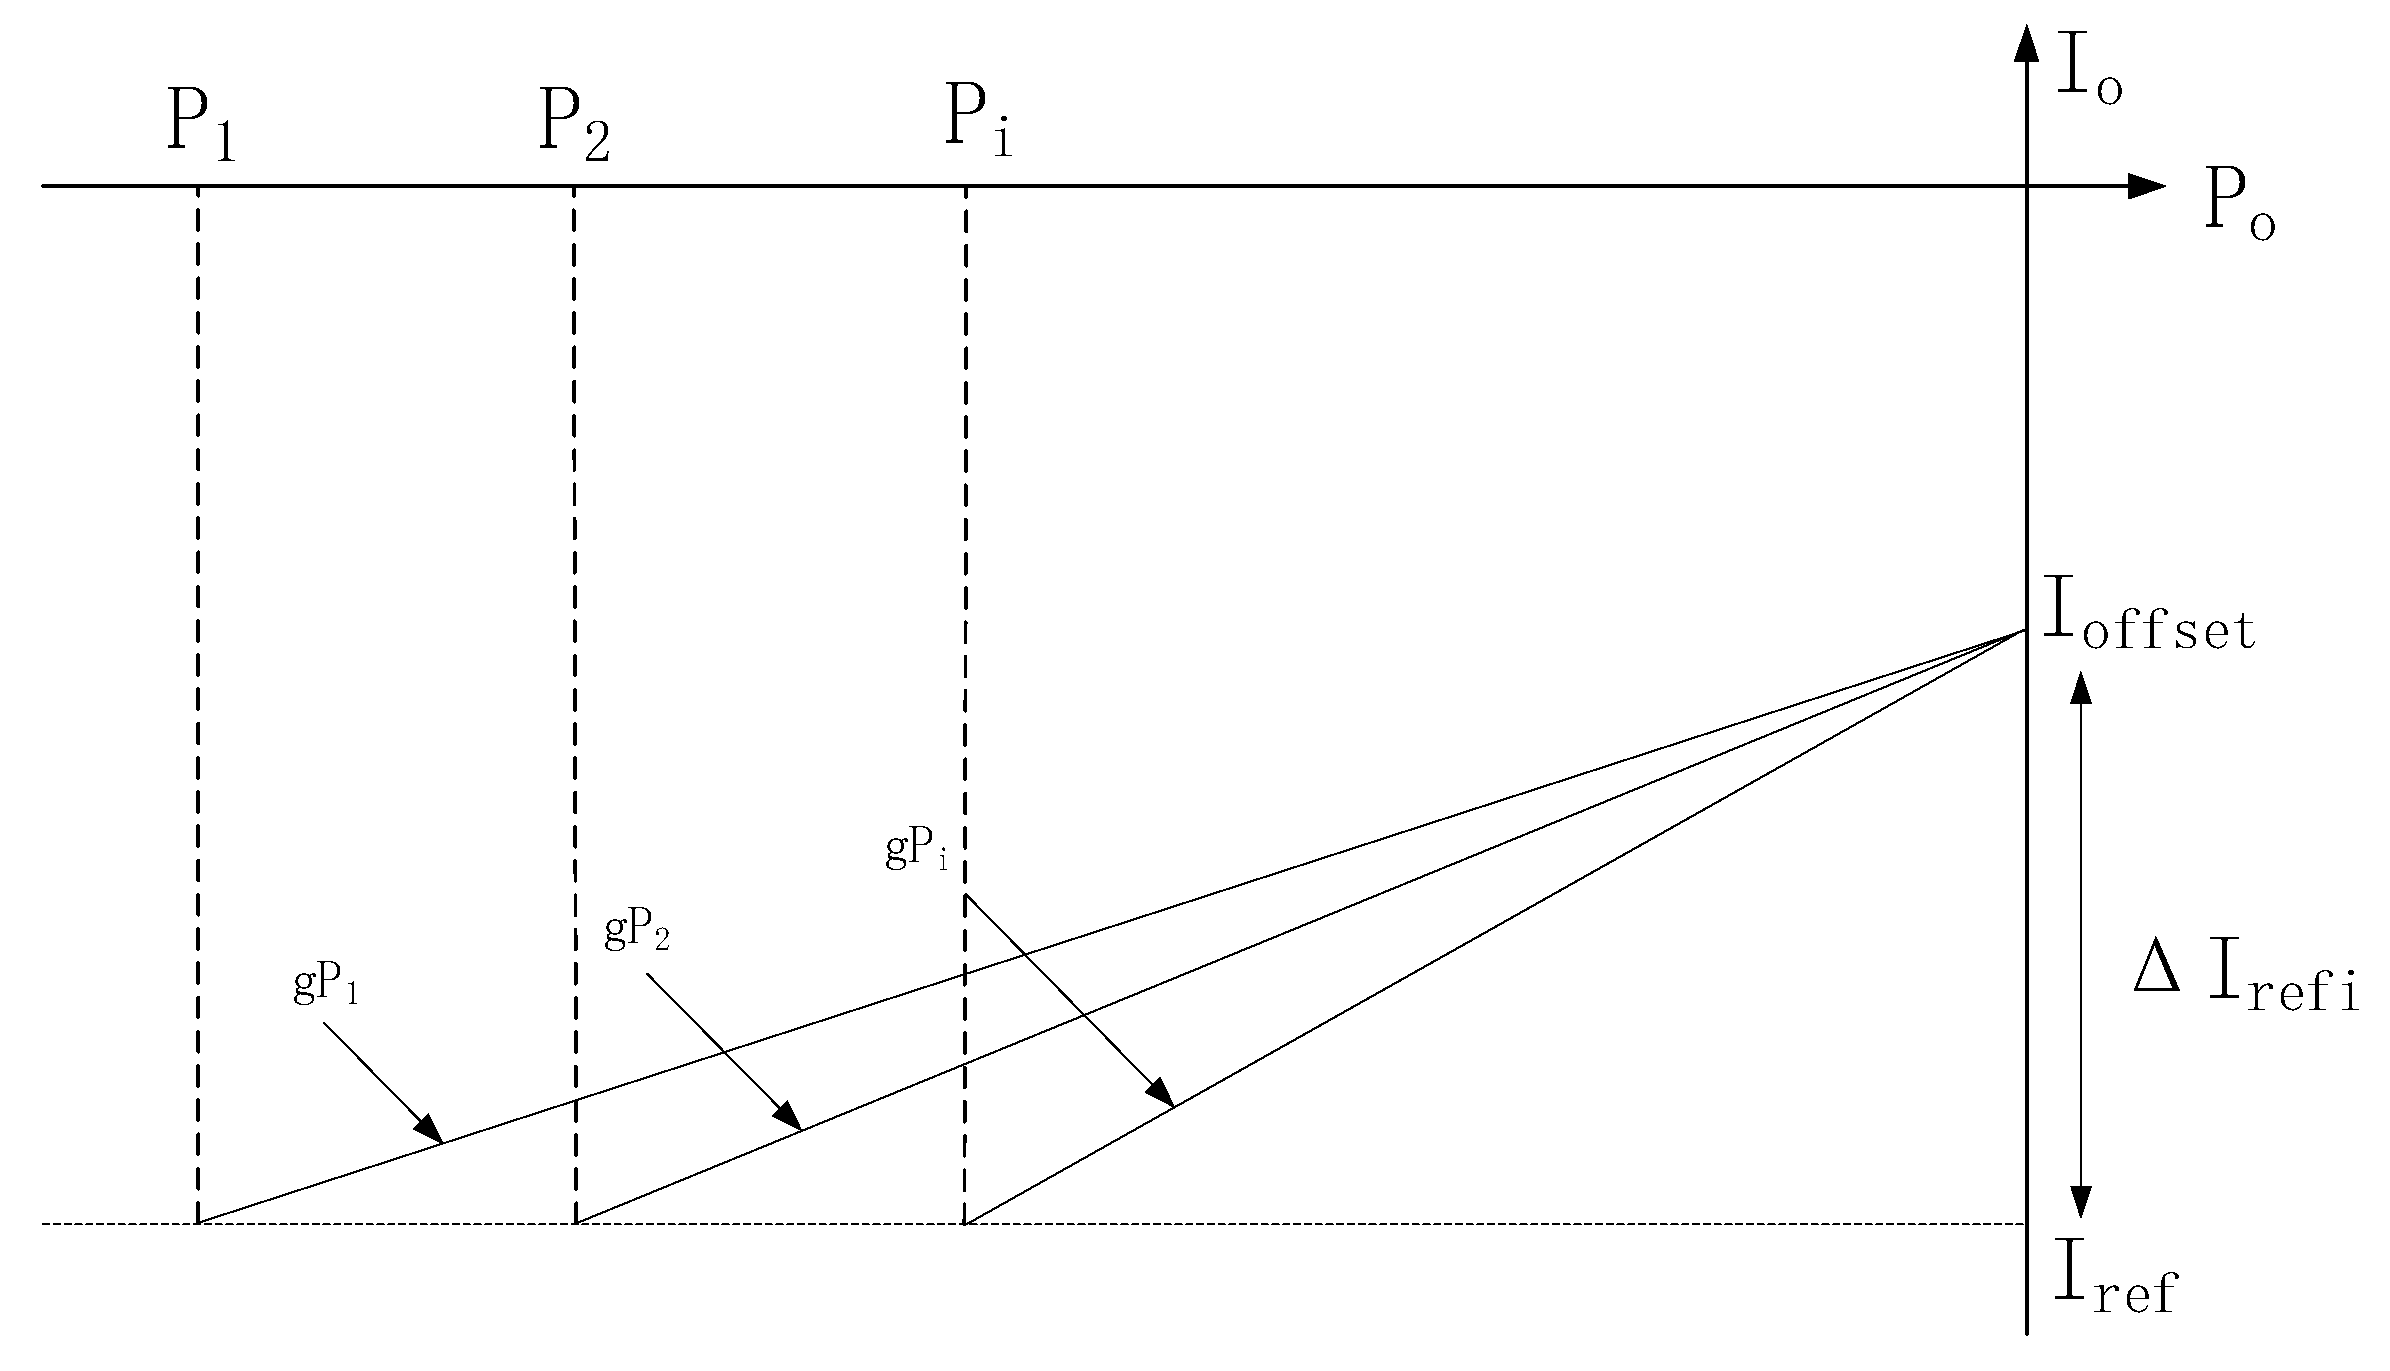
An SOC equalization control strategy considering SOH is proposed. In DC–DC converter cascaded energy storage systems, the power distribution is managed to allocate the voltage on the bus side of each DC–DC converter according to the specified power ratio. The ratio of g R to g R in relation to the reciprocal power droop coefficient g P is directly proportional to the ratio of the voltage on each DC–DC converter’s bus side to that of the total bus voltage. Based on this relationship, a larger g R is allocated to the smallest SOC during charging process to enhance equalization speed, while others are allocated proportionally based on their reciprocal SOC values. During the discharge process, a larger g R is assigned to the largest SOC and others are allocated according to their SOC ratios. Finally, g R is recalibrated based on relative SOH proportions, resulting in obtaining g R ¯ . Power adjustment for each DC–DC converter aims at achieving SOC equalization.
(3)
The effectiveness of the proposed method is verified through simulation and experimentation, providing a technical foundation for its application in energy storage system engineering. The number of DC–DC converters can be adjusted based on cost and equalization objectives to achieve more precise battery charge and discharge management, mitigate the decay rate of battery modules with low state of health (SOH), and prolong their service life.

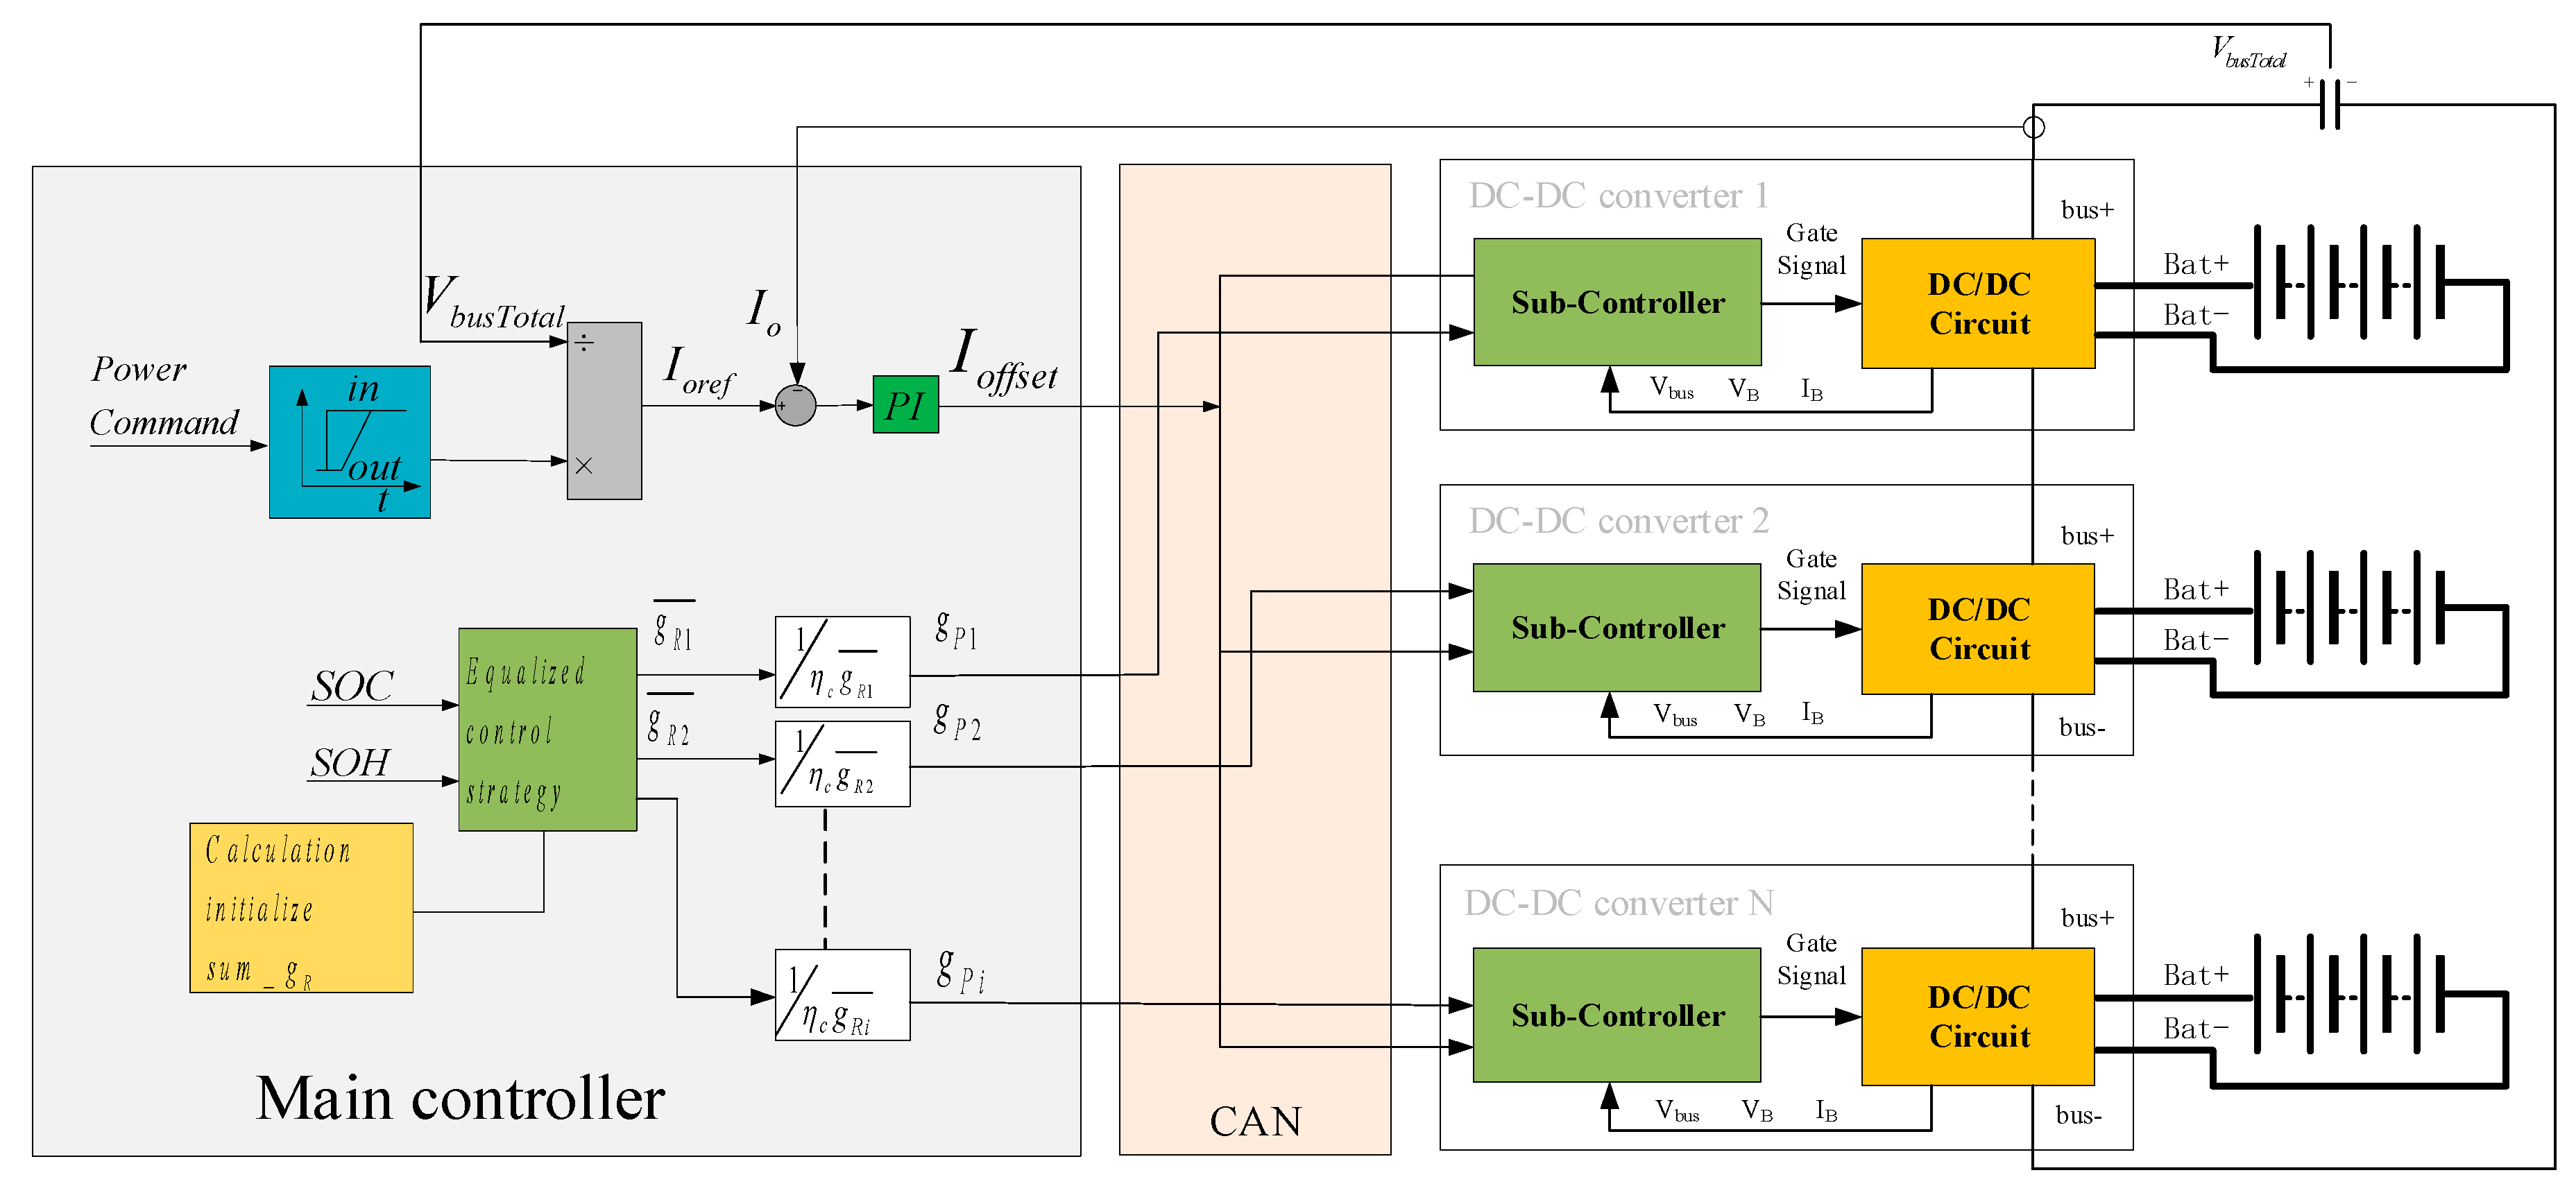
2. The Cascaded Energy Storage Systems with DC–DC Converters

2.1. The Architecture of a Cascading Energy Storage System for DC–DC Applications

The DC–DC cascaded energy storage system examined in this study is depicted in Figure 1. Each DC–DC converter is connected to an energy storage battery module. The DC side of each DC–DC converter is connected in cascade to form the overall DC bus, which is then connected to the PCS. The BMS monitors the voltage and temperature of each individual cell to assess its operational status, transmitting these data to the system control unit via communication channels. The PCS operates in the DC bus voltage control mode to achieve power conversion control between AC power grid energy and the main controller supplied by the DC–DC converter. The DC–DC converters operate in power regulation mode to control the charging and discharging processes of the battery units. The DC–DC converter calculates the state of charge (SOC) and state of health (SOH) of the battery module, while the equalization control is implemented based on the SOC and SOH data of each individual battery module. The main controller computes the equalization control strategy, and droop control is adopted by the cascaded DC–DC energy storage system. The computed droop coefficient is transmitted to each DC–DC converter through communication mode, enabling power control of the battery module based on this coefficient. Switch K1 is used to bypass the DC–DC converter, and a direct connection between the battery and the bus side is established in the event of its failure or system-controlled shutdown. In the event of a malfunction in the associated DC–DC converter, the K2 switches can bypass both the faulty converter and the battery module. This ensures that the defective battery module can be isolated from the system during charging and discharging cycles without compromising the overall system functionality.

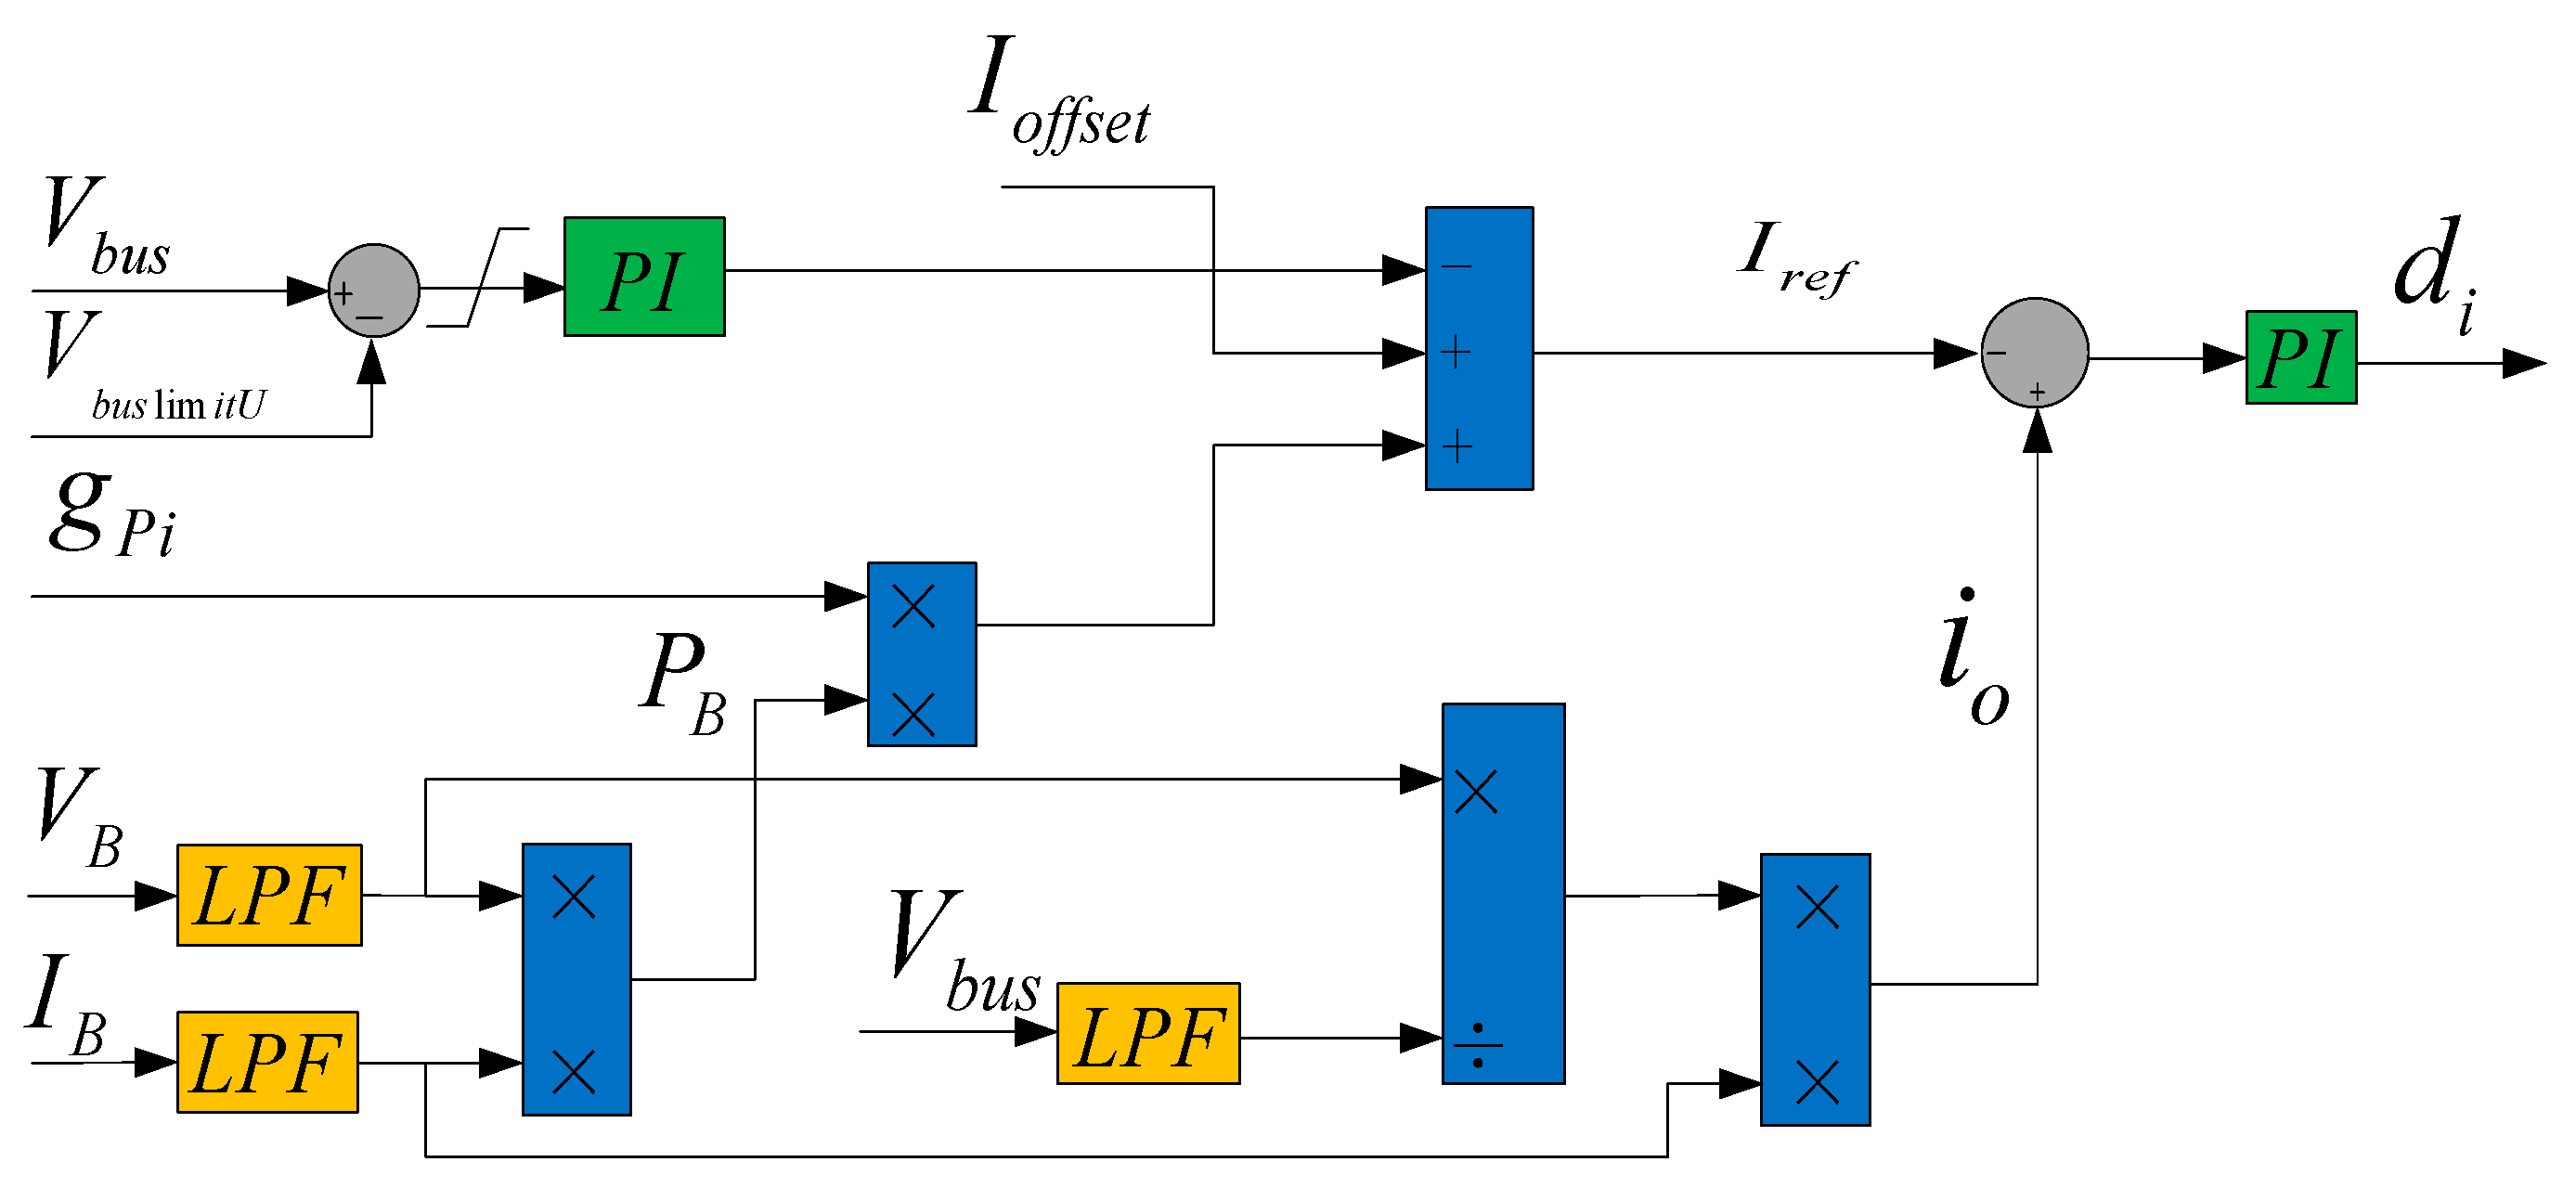
2.2. Closed-Loop Control of SOC Equalization in a DC–DC Cascaded Energy Storage System Based on Droop Control

The parameter definitions and terms subsequently outlined in this paper are presented in Table 1 below.
The closed-loop control system for the DC–DC cascaded energy storage system employing droop control is depicted in Figure 2 below. The PCS controls the total voltage on the bus side, while the DC–DC cascaded energy system regulates the power of charging and discharging. The system consists of a main controller and a sub-controller for each DC–DC converter. The main controller calculates the current reference I o f f s e t and droop coefficient g P i for each converter based on the SOC and SOH of individual battery modules. The fundamental goal of SOC equalization in a DC–DC cascaded energy system is to adjust the charge and discharge power of each converter. In a cascaded system, the current on the bus side of each DC–DC converter is maintained at a consistent level. Power regulation is designed to control the voltage on the bus side of each converter. The droop coefficient g P i represents power distribution among converters, specifically referring to voltage distribution on their respective bus sides. Each sub-controller for a DC–DC converter performs closed-loop control over power based on delivered I o f f s e t and g P i .
The main controller calculates the cluster’s current reference I o r e f based on the total power P t o t a l and the cluster’s total voltage V t o t a l . The difference between Ioref and the feedback of cluster current sampling I O is obtained through a PI regulator to derive the current reference I o f f s e t for every DC–DC converter. The droop coefficient g P i is determined by utilizing the SOC, SOH, and s u m _ g R of every battery module according to the equalization control strategy.
During charging periods, special attention to bus voltage control is unnecessary due to the inherent series voltage self-balancing function. However, during discharge periods, the distribution of bus voltage through power control becomes a critical factor. To ensure consistency in system control, the same methodologies should be applied for both charging and discharging processes. The current power droop control in charging mode is shown in Figure 3.
Current-power droop control, as shown in Formula (1) below.
I o = I o f f s e t + g P P o
g P denotes the droop coefficient, with its unit being the inverse of voltage. If g P is excessively high (indicating a very steep droop characteristic curve), even a minor change in the droop slope can adversely affect voltage distribution. A slight fluctuation in power, primarily due to voltage variations at the bus end, can lead to significant changes in current. Conversely, if g P is too low (indicating a shallow droop characteristic curve), the permissible power range becomes too broad, making it difficult to maintain stable voltage distribution. In droop control, I o f f s e t represents the reference value of the current, and the final current closed-loop reference adjusts to power variations.
To achieve battery SOC equalization control, modules with higher battery voltages should decrease their bus voltages during charging, while those with lower battery voltages should increase their bus voltages. This ensures that the bus voltage remains within the specified upper and lower limits.
When DC–DC converters control the power, the PCS regulates the voltage, or when battery DC–DC converters are connected to a DC network with a constant voltage, the total bus voltage of clusters of battery DC–DC converters is constant. The operating point I O V b u s of a DC–DC converter with I O P O power droop characteristics is determined by three equations: the voltage equation, the output power equation, and the droop characteristic equation.
V b u s t o t a l = V b u s 1 + V b u s 2 + + V b u s N i o = P o 1 V b u s 1 = P o 2 V b u s 2 = = P o N V b u s N i o = I o f f s e t + g P 1 P B 1 = I o f f s e t + g P 2 P B 2 = = I o f f s e t + g P N P B N
The voltage V b u s is distributed according to the proportion of g P η c 1 . Let the coefficient of the voltage g P η c 1 , the voltage distribution property functions, and the dimension be volts (V).
The equation for the DC–DC bus side voltage V b u s of the i-th DC–DC converter is as follows.
V b u s i = g R i i = 1 N g R i V b u s t o t a l
The expression of the system’s s u m _ g R is as follows, based on the droop characteristic of the DC–DC cascade.
s u m _ g R = i = 1 N g R i = 1 1 V b u s t o t a l I o f f s e t P t o t a l
g R i = 1 g P i η c i
The sub-controller of the DC–DC converter implements power control based on the I o f f s e t and g P i signals provided by the main controller. The closed-loop power control block diagram of the sub-controller is depicted in Figure 4 below.

3. SOC Equalization Control Strategies

3.1. SOC Equalization Control

In a DC–DC cascaded energy system, the ratio of the bus-side voltage of each DC–DC converter to the total bus voltage V b u s t o t a l of the cascaded energy system is equivalent to the sum of the individual contributions g R of each DC–DC converter and the collective contribution s u m _ g R of all DC–DC converters in the system, as shown in Equation (6) below. During the SOC Equilibrium charging process, to enhance the equalization speed, the highest voltage V b u s lim i t U is allocated to the bus side of the DC–DC converter connected to the battery module with the lowest SOC. This maximum voltage aligns with the maximum withstand voltage of the DC–DC converter. Other DC–DC converters are proportionally allocated based on the state of charge (SOC) level. In discharge mode, the highest voltage is directed to the bus side of the DC–DC converter connected to the battery module with the highest SOC, which also experiences the maximum voltage. The remaining battery modules are proportionally allocated according to their respective SOC levels. The coefficient g R associated with the DC–DC converter operating at the maximum bus voltage is denoted as g R max .
g R max s u m _ g R = g R max 1 V b u s t o t a l I o f f s e t P t o t a l = V b u s lim i t U V b u s t o t a l g R max = V b u s lim i t U V b u s t o t a l 1 V b u s t o t a l I o f f s e t P t o t a l
Due to the differences in circuit topologies of DC–DC converters, the DC–DC converters in this paper are booster circuit topologies, and the bus side voltage is always greater than the battery side voltage. In the process of charging and discharging, the distribution coefficient g R min _ s o l v corresponding to the DC–DC converter bearing the lowest bus voltage is time-varying, and the calculation method of g R min _ s o l v is shown in Formula (9). Based on the state of charge (SOC) of each battery module, the highest SOC within a module is designated as S O C max , while the lowest SOC is marked as S O C min . The distribution factor g R max , corresponding to the maximum bus voltage, and the factor g R , associated with the DC–DC converter for each module, are determined through linearization. s u m _ g R is calculated by aggregating g R i according to Equation (7).
g R i = g R max S O C i S O C min S O C max S O C min g R max g R min _ s o l v
The g R i of the DC–DC converter corresponding to each battery module is accumulated as follows:
s u m _ g R = N g R max i = 1 N S O C i N S O C min S O C max S O C min g R max g R min _ s o l v
Let s u m _ g R remain unchanged, g R m i n can be expressed using the equation below:
g R min _ s o l v = g R max S O C max S O C min i = 1 N S O C i N · S O C min N · g R max s u m _ g R
By substituting g R m i n , we can obtain all g R i , thereby defining g P i .

3.2. SOC Equalizing Control Method with Consideration of SOH

The attenuation difference of each battery module decreases with frequent charge and discharge cycles, leading to the dispersion of SOC and SOH among different battery modules. Building on the previously mentioned SOC equalization control strategy and considering the impact of SOH on SOC equalization, it is essential to acknowledge that variations in SOH indicate the extent of battery degradation. As a result, there is a discrepancy in their SOH values for battery modules with identical initial capacity. In practical energy storage applications, SOC is calibrated as 1 when fully charged and 0 when empty; however, it cannot be calibrated to match the maximum chargeable capacity of a single battery module. By incorporating Formulas (7)~(9) and considering individual SOH values for each labeled battery module, we can conclude that there is a maximum labeled value for the state of health (SOH). In the process of SOC equalization, after considering SOH, there must be a Formula (11), which is because the total bus voltage of the DC–DC cascaded energy system is determined by PCS, and the voltage remains constant. Formula (7) is rewritten and standardized according to SOH, and previously re-calibrated to g R i ¯ according to SOC assigned g R i , as shown in Formula (10).
g R i ¯ = g R i S O H i S O H max × g R i g R i S O H i S O H max
i = 1 i = N g R i ¯ = i = 1 i = N g R i
Then, Equations (8) and (9) are revised into Equations (12) and (13) as shown below.
s u m _ g R = s u m _ g R ¯ = N g R max ¯ i = 1 N S O C i N S O C min S O C max S O C min g R max ¯ g R min _ s o l v ¯
g R min ¯ = g R max ¯ S O C max S O C min i = 1 N S O C i N · S O C min N · g R max ¯ s u m _ g R
During the initial stage of equalization control, the I o f f s e t for running at full power should be set and the s u m _ g R for running at full power, while keeping the s u m _ g R unchanged during operation. As the V b u s t o t a l may vary within a limited range during operation, the following steps should be taken: First, g R m a x ¯ should be calculated according to the real-time ratio of the maximum bus voltage V b u s _ m a x to V b u s t o t a l . Next, the minimum g R ¯ of the DC–DC converters in an SOH- and SOC-factored battery module during charging periods should be determined. Then, all its g R i ¯ values should be calculated, and finally, the g P i can be determined.
The droop control-based, SOH-factored SOC equalization control strategy is illustrated in Figure 2. By taking into account the SOH and SOC of each battery module, the control input parameters for each DC–DC converter, labeled as I o f f s e t and g P i , are determined. The equalization control method is mathematically formulated in Equations (10)–(13).

4. System Simulation and Experimental Analysis

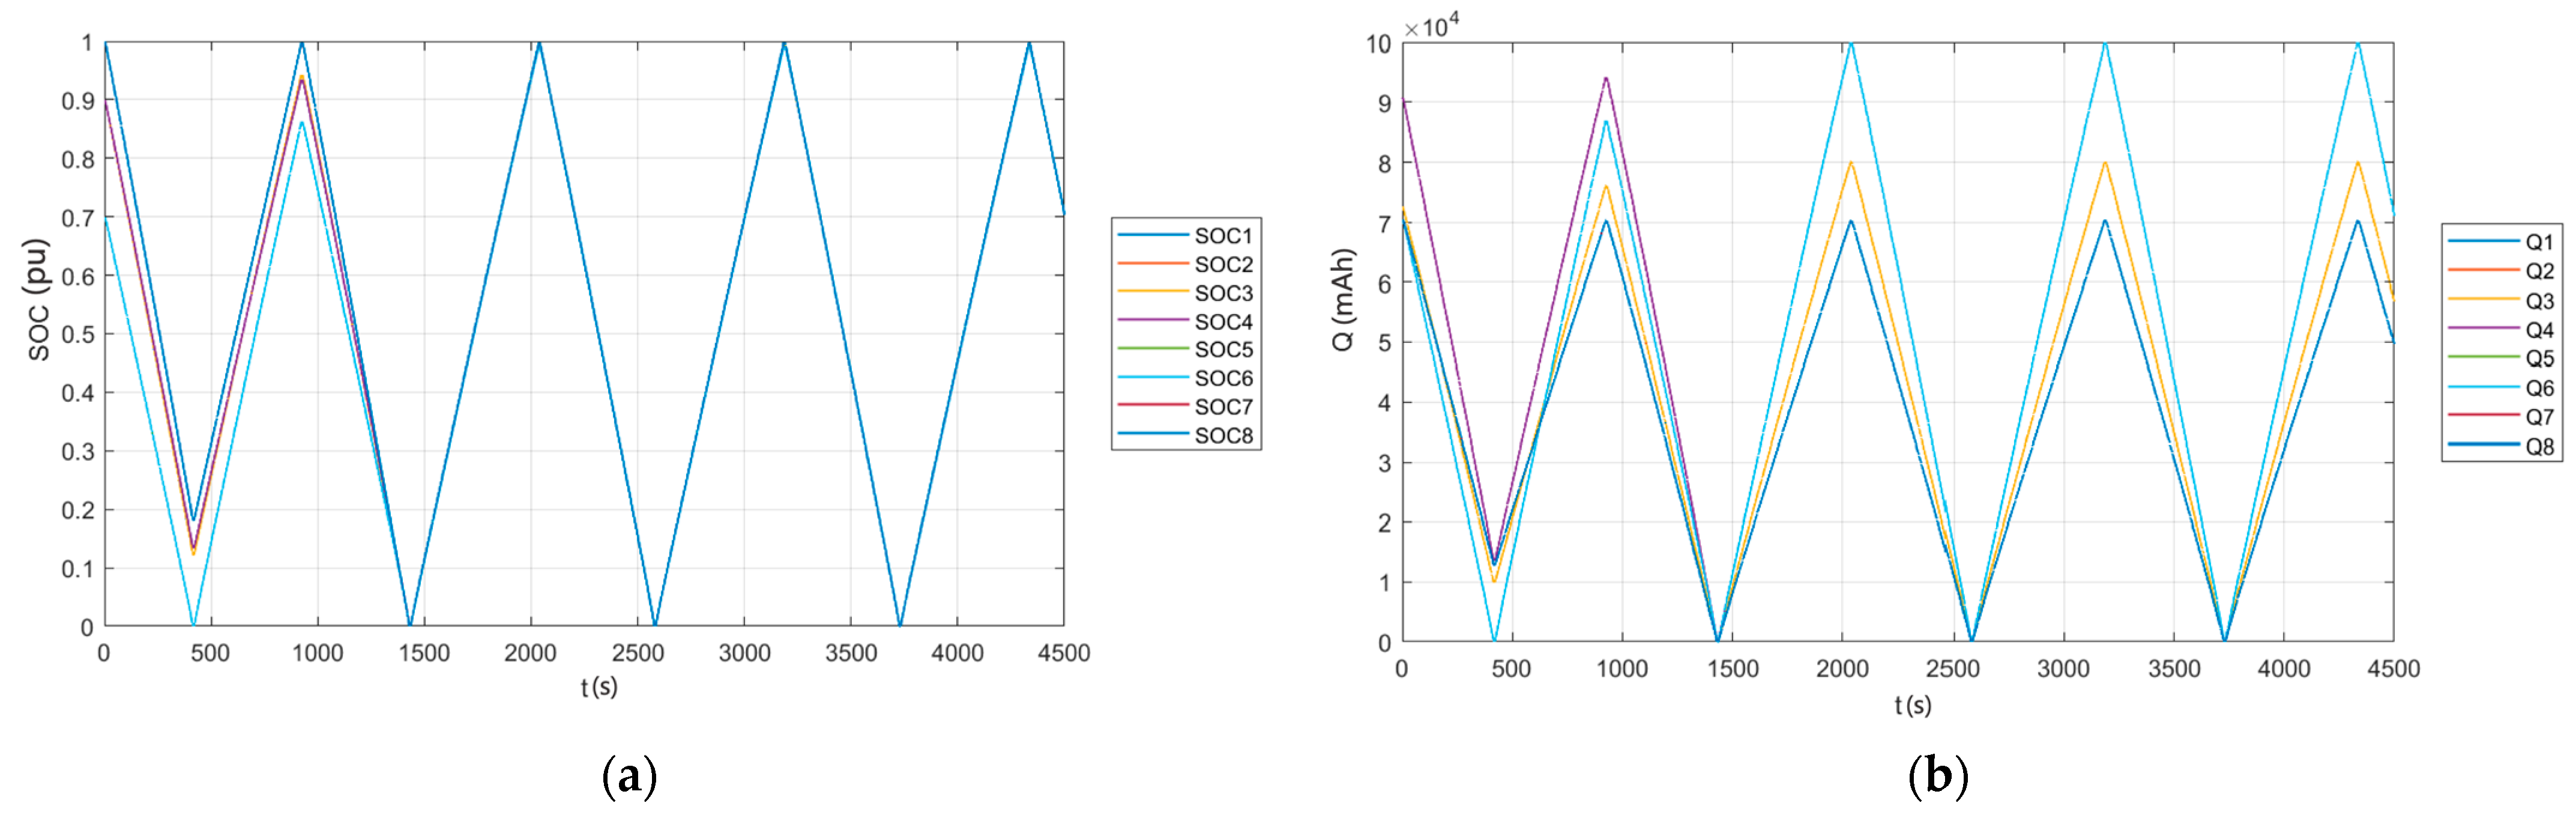
4.1. System Simulation

For this exercise, a simulation model was developed using MATLAB Simulink R2022b, with the specific simulation parameters outlined in Table 2.
Figure 5a depicts the results of the simulated droop control-based SOC equalization, excluding the impact of SOH. When battery modules share the same SOH but have different initial SOC values, equalization is achieved through SOC control. However, if the battery modules exhibit varying SOH levels, SOC equalization becomes unattainable. As a result, battery modules 1 to 4 cannot complete full charge and discharge cycles, whereas battery modules 5 to 8 can. The essence of SOC equalization, which takes into account the SOH, is based on the process of battery module power capacity equalization in order to achieve simultaneous charging and discharging of different SOH battery modules. The power distribution gain based on SOC is equivalent to the power distribution gain based on charge, resulting in effective SOC equalization among battery modules with identical SOH. However, the ratio of SOC power distribution differs from the gain obtained through power distribution for battery modules with varying SOH, thereby hindering the achievement of true SOC equalization without considering the SOH factor.
Figure 5b illustrates the results of the simulated droop control-based SOC equalization, taking into account the state of health (SOH) of the batteries. During discharge, the SOC of battery modules with varying SOH levels can simultaneously reach 0. During charging, the SOC can uniformly reach 1. The main goal of SOC balancing is to ensure an even distribution of power capacity among battery modules with different SOH levels, thereby optimizing the overall system performance. Disparities in initial SOC exist in both the charging and discharging processes. Taking into account the SOH, SOC equalizing yields highly favorable outcomes and proves suitable for practical applications in electrochemical energy storage engineering involving battery modules experiencing different degrees of attenuation.
Figure 6a illustrates the charging status of each battery module under the simulated droop control-based SOC equalization, considering SOH. Modules 1 to 4, which have higher SOH, are unable to complete full charge and discharge cycles. Conversely, modules with lower SOH exhibit a more rapid performance degradation. As a result, battery modules with lower SOH can achieve complete charge and discharge cycles, whereas those with higher SOH cannot. The recharge and discharge capacities of each battery module align with the SOC equalization results. However, due to the failure to achieve true SOC equalization, the battery module with high SOH experiences decreased recharge and discharge capacities.
Figure 6b illustrates the charging profiles of battery modules during the simulated droop control-based SOC equalization, taking into account the effects of SOH. In this scenario, all battery modules can be simultaneously fully discharged and charged, a condition that does not apply when SOH impacts are disregarded. After considering the SOH, it can be observed that the SOC equalization effect exhibits superior performance. Furthermore, there is a significant enhancement in both charge and discharge capacities for battery modules with higher SOH levels.
The simulation conditions should be modified for additional verification of the simulation. The details of the simulation suite are presented in Table 3 below.
The addition of SOH to the SOC equalizing strategy after 1000s serves to compare and validate the effectiveness of the equalization process. Figure 7a shows that the SOC equalizing effect was suboptimal before 1000 s. However, after incorporating the SOC equalizing strategy with the SOH factor, there was a significant improvement in the SOC equalizing effect. Figure 7b shows the variation curve of battery capacity during charge and discharge. The SOC equalizing strategy is used for the first 1000 s, and the SOH factor is added after 1000 s. After 1000 s, the SOC of each battery module and the battery capacity and amount of discharge have been improved.

4.2. Experimental Analysis

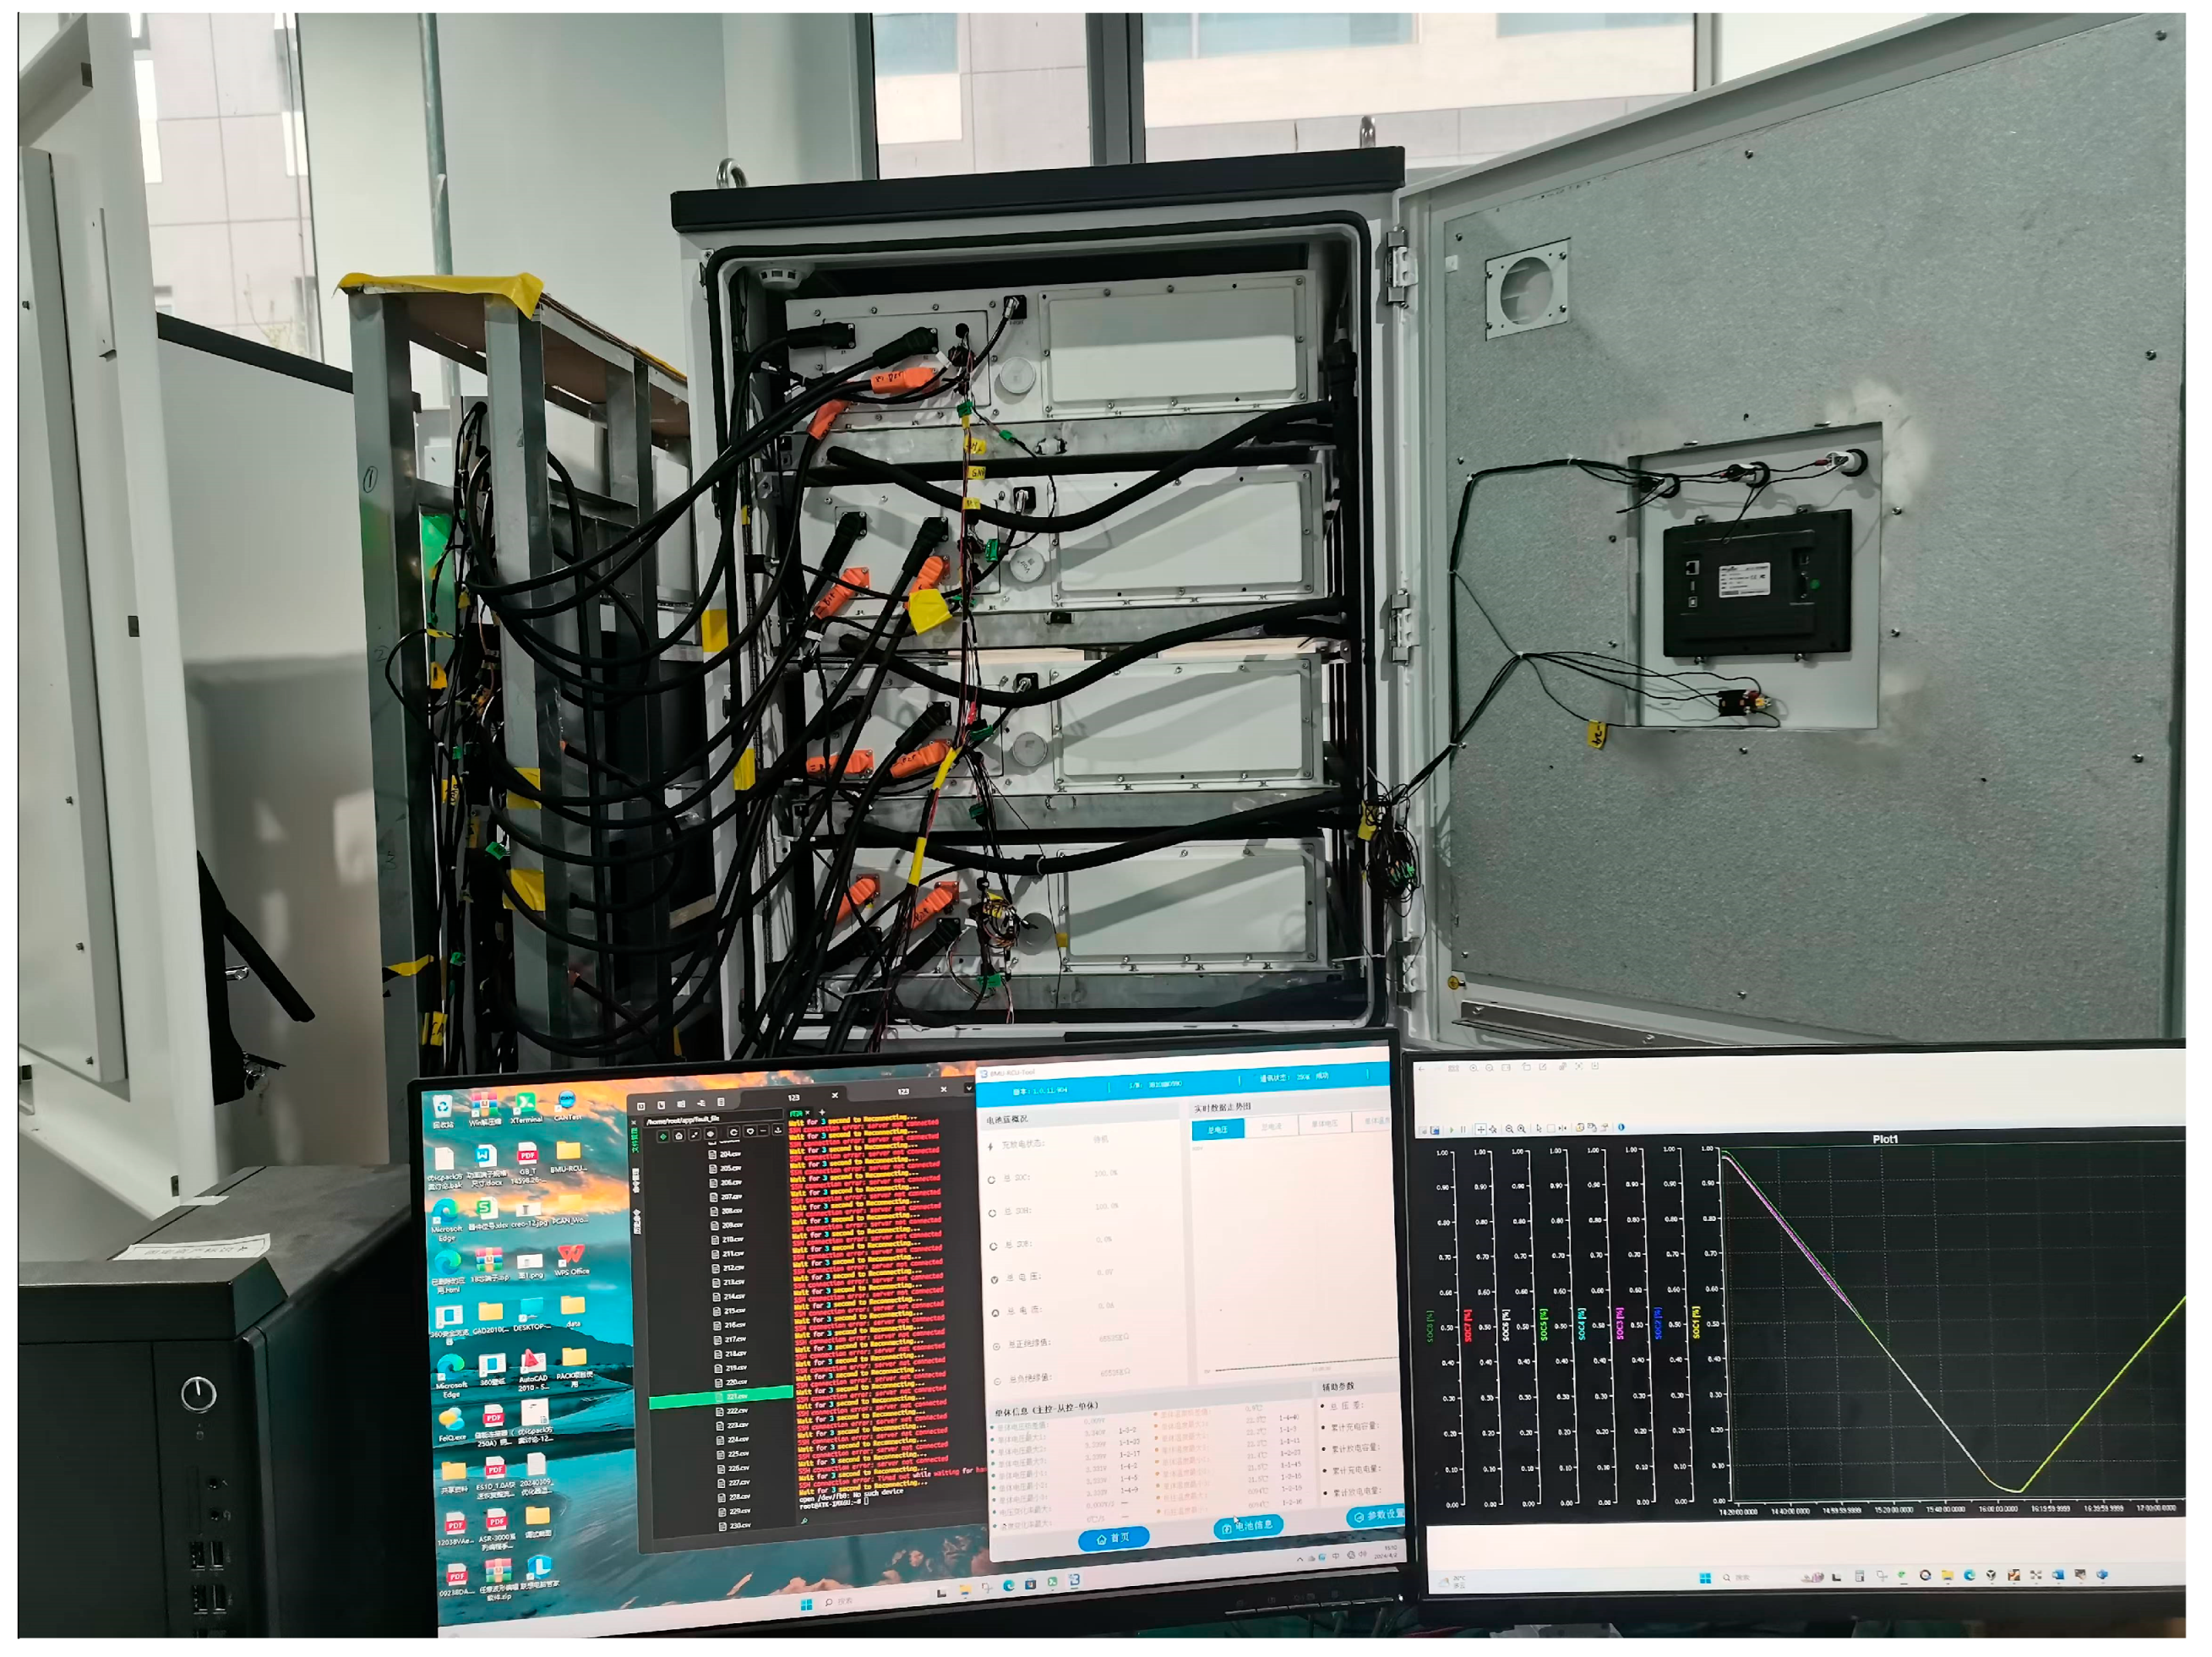
4.2.1. Experimental System

In this research, a cascaded energy storage system incorporating a DC–DC converter was developed. As shown in Figure 8, DC–DC converters 1 to 8 are positioned on the left side of the frame structure, while the battery packs are on the right. The system consists of four housings, with each housing containing two cascaded DC–DC converters connected through bus side output ports. Additionally, four battery packs are installed on the right side of the cabinet. Each battery pack comprises 64 individual battery cells, with every 32 cells forming a module. The battery module is composed of a series connection of 32 lithium-ion phosphate batteries. The capacity of the experimental cell is 280 Ah. These battery modules are directly linked to the respective DC–DC converters. The voltage range of the DC–DC converter on the battery side is 89.6 V to 115.2 V, while that on the bus side ranges from 115.2 V to 140 V. SOC data and SOC equalization data are displayed via the host computer. The physical DC–DC converter is shown in Figure 9. The structural housing consists of two bidirectional interleaving parallel boost converters, with the bus sides of the two converters connected in series prior to output. The power unit utilizes a configuration of two staggered and two parallel tubes. The switching tube employs a 250 V MOSFET, operating at a frequency of 50 kHz.
In the following experiments, the SOH of battery module 1 is 0.8, and that of battery modules 2 to 8 is 1.
During the experiment, it is necessary to continuously monitor the state of charge (SOC) of each battery module for an extended period. There are a total of eight groups of battery modules in operation. However, the current oscilloscope devices are not suitable for long-term data monitoring purposes. In this experiment, SOC data from each battery module are monitored through the main controller at intervals of 0.2 s, with charge–discharge cycles exceeding 5 h in duration. The recorded running data file (.xls) is then imported into the drawing software echarts to depict the SOC profile during both the charging and discharging processes.

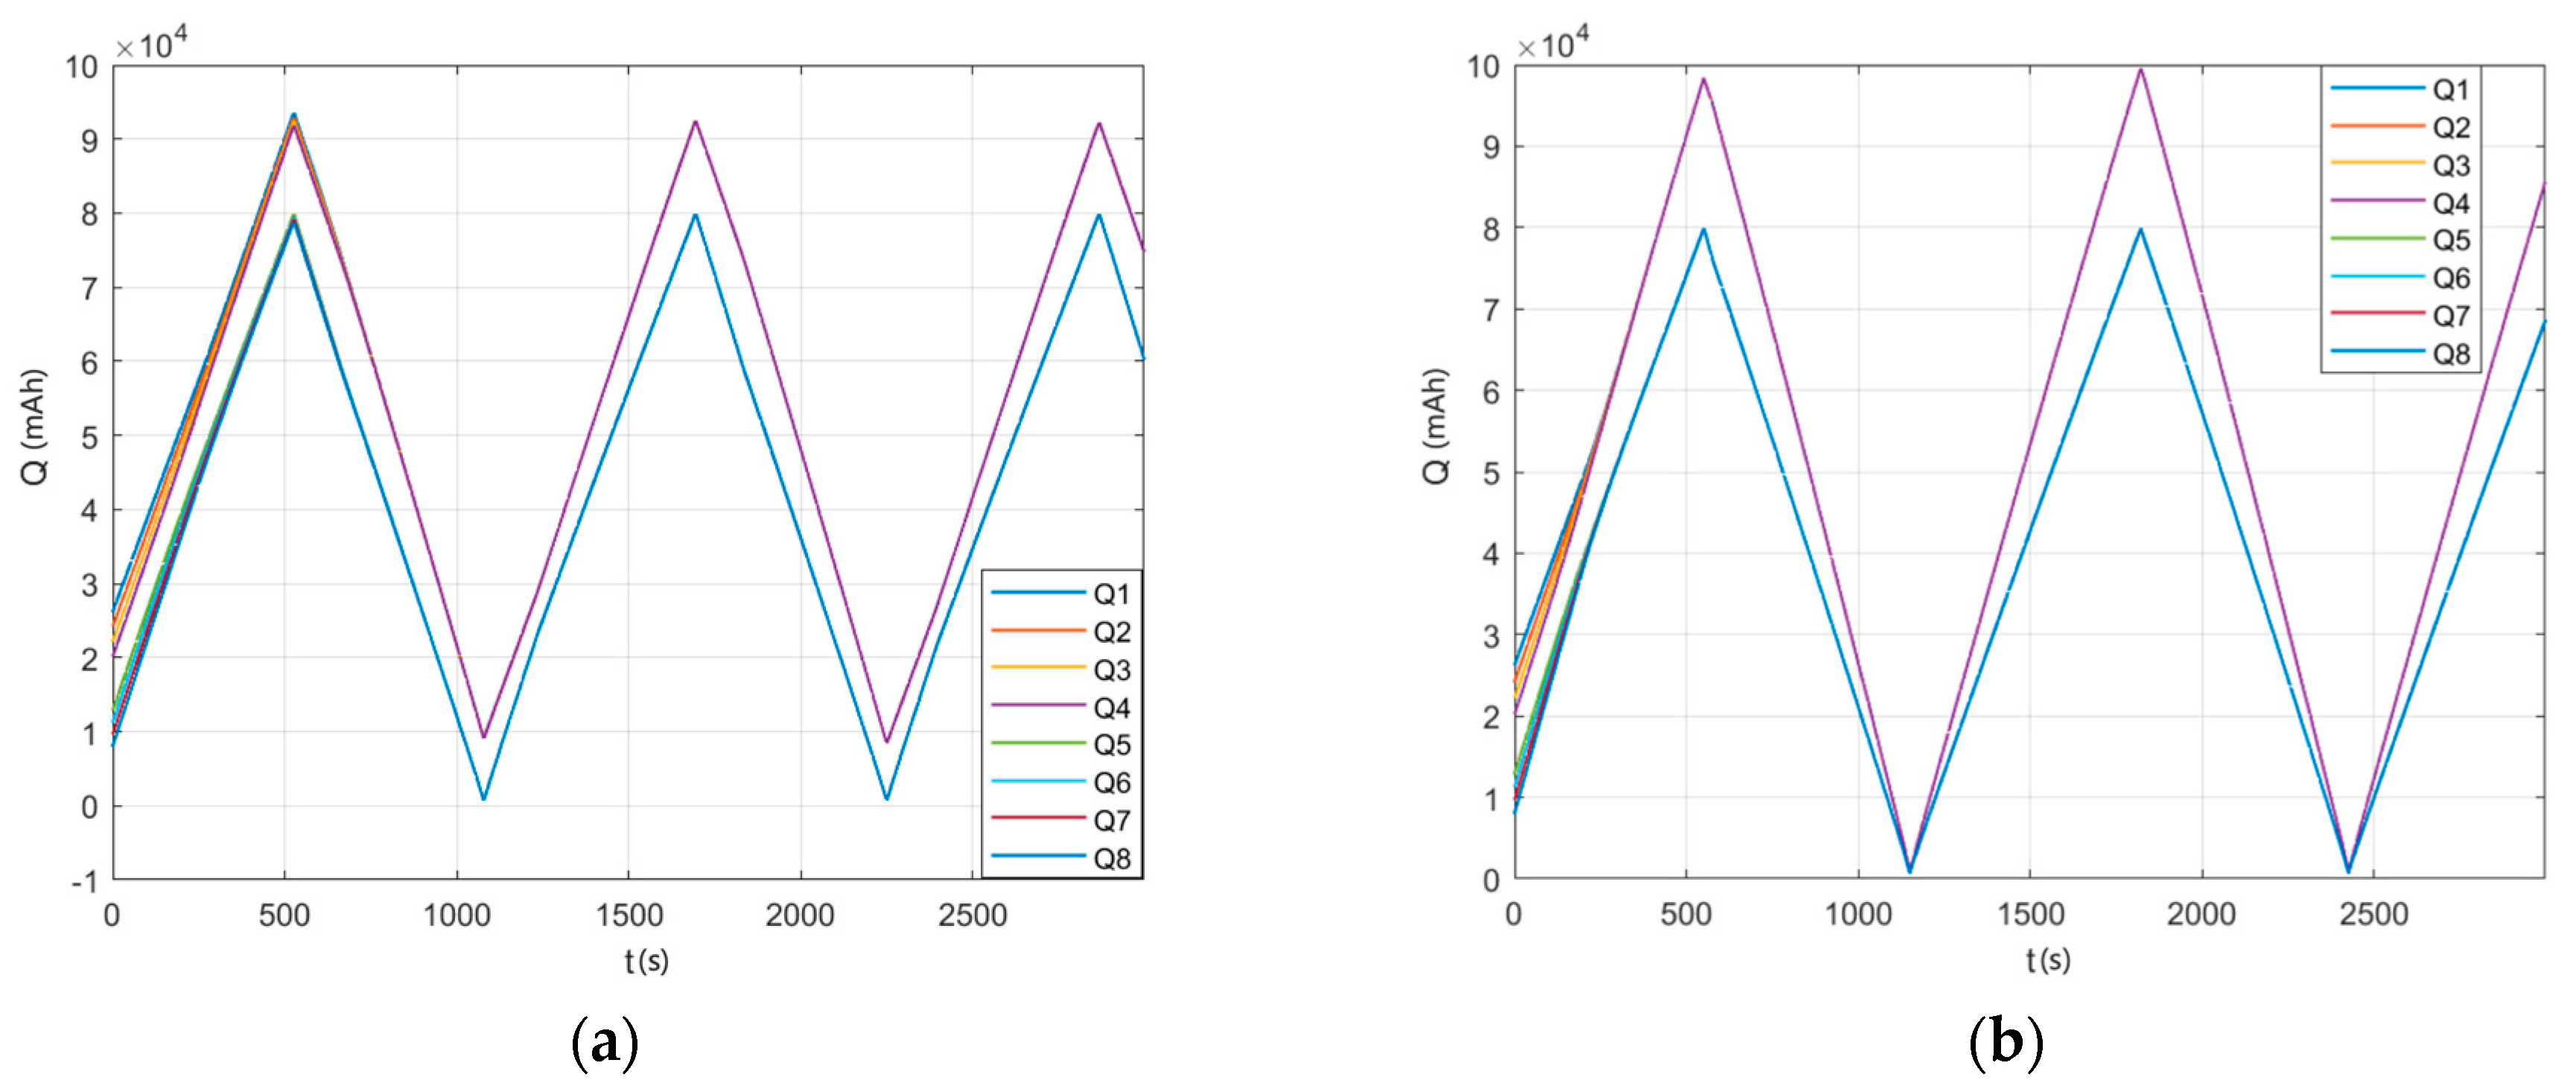
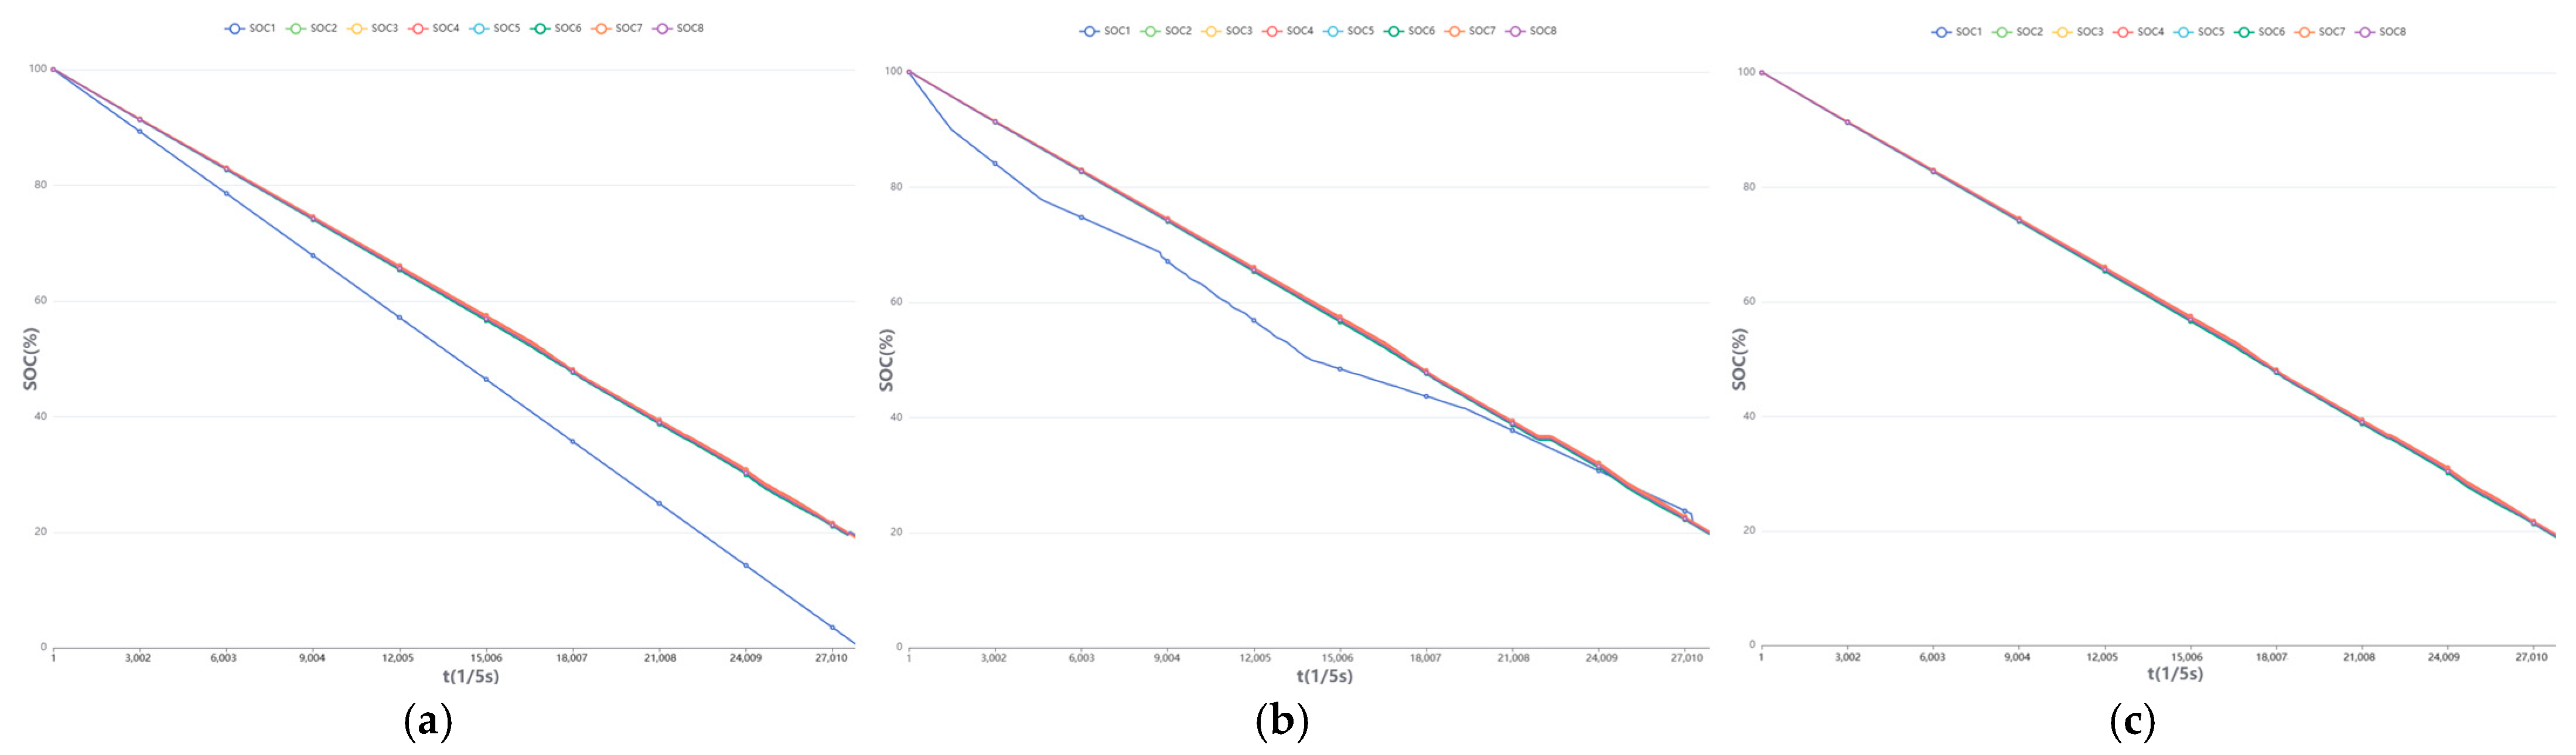
4.2.2. Charge Experiment

Figure 10a shows the case where each DC–DC converter is configured with the same droop coefficient, and the SOC curve is a straight line with varying slopes due to the different SOHs of the battery module. In Figure 10b, the initial stage is characterized by a substantial margin for equalization adjustment in the DC–DC converter due to low battery voltage, resulting in effective SOC equalization. However, as the battery voltage increases, this margin diminishes and hinders the achievement of SOC equalization for battery module 1. As shown in Figure 10c, a very good effect is achieved in the charging process when considering the SOH equalization of SOC.

4.2.3. Discharge Experiment

Figure 11a shows the case where each DC–DC converter is configured with the same droop coefficient, and the SOC curve is a straight line with varying slopes due to the different SOH of the battery module. In Figure 11b, there is a limited margin for adjustment in the equalization process of the DC–DC converter at the initial stage due to the high battery voltage, leading to a significant reduction in SOC. As the discharge progresses, the battery side voltage decreases and consequently increases the margin for equalization adjustment in the DC–DC converter, resulting in SOC equalization among battery modules with varying SOH. As shown in Figure 11c, a very good effect is achieved in the charging process when considering the SOH equalization of SOC.

5. Conclusions

The objective of this paper is to address the issue of battery capacity degradation in energy storage system batteries after prolonged use. Despite considering only the SOC as a single parameter for equalization, the problem of a poor equalization effect persists, failing to effectively alleviate battery capacity degradation. Therefore, this paper proposes an SOC equalization control strategy that integrates SOH considerations. Based on our analysis, we draw the following conclusions:
(1)
The attenuation of energy storage batteries in industrial and commercial energy storage systems, as well as power station energy storage systems, varies due to factors such as temperature at the application site. To effectively enhance the recharge capacity, discharge capacity, and overall cost-effectiveness of energy storage equipment, considering only SOC is inadequate for the SOC equalization of battery modules; instead, one must also take into account the SOH, which has a significant equalization effect. By considering both SOH and SOC simultaneously, the efficiency of charging and discharging in an energy storage system can be improved. In this study’s experimental conditions, the charge and discharge capacity increased by 1.85%/10 min.
(2)
The essence of SOC equalization, taking into account the SOH, lies in achieving charge distribution equalization among battery modules. During the initial stages of battery usage, the SOH values across all battery modules are essentially identical. However, the discrepancies between batteries increase over long-term use. Therefore, relying solely on a single parameter such as SOC fails to achieve optimal balancing effects.
(3)
The number of cells utilized by each DC–DC converter in the DC–DC cascaded energy storage system is determined based on the cost of the system, considering the application of a high-capacity lithium-ion phosphate battery in industrial and commercial energy storage systems. Additionally, the number of matched cells can be adjusted according to specific requirements, thereby enhancing the precise management of battery charging and discharging within the system.
(4)
The cascaded energy storage system employing DC–DC converters mitigates the impact of cell degradation on the overall system performance. Despite employing a more refined decomposition and fewer batteries corresponding to each DC–DC converter, there remains an issue of varying degrees of battery attenuation within each battery module. In subsequent research, bypassing the battery modules will be employed as a solution to address this problem.
(5)
The DC–DC cascaded energy storage system with SOC equalization, considering the SOH, demonstrates an optimal equalization effect, thereby validating the effectiveness of the proposed methodology and providing technical solutions for large-scale electrochemical energy storage engineering applications. This approach enhances both the recharge and discharge capacities of the energy storage system while improving its overall efficiency.

Author Contributions

Conceptualization, S.B. and X.T.; methodology, S.B.; software, S.B.; validation, S.B., X.T. and X.M.; formal analysis, S.B.; investigation, S.B.; resources, S.B.; data curation, J.Z.; writing—original draft preparation, S.B.; writing—review and editing, X.T.; visualization, X.M.; supervision, X.T.; project administration, S.B. All authors have read and agreed to the published version of the manuscript.

Funding

This research received no external funding.

Data Availability Statement

The initial simulation data and experimental results relevant to the research process were submitted concurrently with the manuscript.

Conflicts of Interest

Author Xin Ma was employed by the company Xi’an Weiguang Energy Technology Co., Ltd. The remaining authors declare that the research was conducted in the absence of any commercial or financial relationships that could be construed as a potential conflict of interest.

References

  1. Zhu, L.; Zhang, J. A new model of jointed states of charge and health for lithium batteries. Proc. CSEE 2018, 38, 3613–3620. [Google Scholar]
  2. Li, C.; Xiao, F.; Fan, Y. An approach to state of charge estimation of lithium-ion batteries based on recurrent neural networks with gated recurrent unit. Energies 2019, 12, 1592. [Google Scholar] [CrossRef]
  3. Dai, H.; Zhao, G.; Lin, M.; Wu, J.; Zheng, G. A novel estimation method for the state of health of lithium-ion battery using prior knowledge-based neural network and Markov chain. IEEE Trans. Ind. Electron. 2018, 66, 7706–7716. [Google Scholar] [CrossRef]
  4. Liu, P.; Li, Z.; Cai, S.; Wang, W.; Xia, X. Based on the fusion of equivalent circuit model and data-driven model Joint SOC and SOH estimation method. Trans. China Electrotech. Soc. 2024, 39, 3232–3243. [Google Scholar]
  5. Zhao, J.; Hu, J.; Zhang, X.; Zhang, W. Joint SOC-SOH estimation based on lithium battery model and fractional order theory. Trans. China Electrotech. Soc. Electr. Mach. Control. 2023, 38, 4551–4560. [Google Scholar]
  6. Feng, F.; Song, K.; Lu, R.; Wei, G.; Zhu, C. Equalization Control Strategy and SOC Estimation for LiFePO4 Battery Pack. Trans. China Electrotech. Soc. 2015, 30, 186–193. [Google Scholar]
  7. Liu, J.; Yang, P.; Li, L. A Method to Estimate the Capacity of the Lithium-ion Battery Based on Energy Model. Power Syst. Prot. Control 2015, 30, 100–107. [Google Scholar]
  8. Vennam, G.; Sahoo, A. A Dynamic SOH-Coupled Lithium-Ion Cell Model for State and Parameter Estimation. IEEE Trans. Energy Convers. 2023, 38, 1186–1201. [Google Scholar] [CrossRef]
  9. Tan, B.; Du, J.; Ye, X.; Cao, X.; Qu, C. Overview of SOC estimation methods for lithium-ion batteries based on model. Energy Storage Sci. Technol. 2023, 12, 1995–2011. [Google Scholar]
  10. Miao, Q.; Wu, J.Y.; Ai, H.K.; Xiong, F.; Qi, D.W.; Hao, L.L. Study on coordinating control strategy of hybrid cascade energy storage and bi-directional power regulation device. Asia-Pac. Conf. Electr. Eng. Autom. 2014, 852, 655–659. [Google Scholar] [CrossRef]
  11. Xu, J. Research on DC-DC Cascaded Energy Storage Converter Based on Droop Control. Master’s Thesis, Beijing Jiao Tong University, Beijing, China, 2019. [Google Scholar]
  12. Vikhorev, N.; Kurkin, A.; Aleshin, D.; Ulyanov, D.; Konstantinov, M.; Shalukho, A. Battery Dynamic Balancing Method Based on Calculation of Cell Voltage Reference Value. Energies 2023, 16, 3733. [Google Scholar] [CrossRef]
  13. Koseoglou, M.; Tsioumas, E.; Jabbour, N.; Mademlis, C. Highly effective cell equalization in a lithium-ion battery management system. IEEE Trans. Power Electron. 2019, 35, 2088–2099. [Google Scholar] [CrossRef]
  14. Hemavathi, S. Overview of Cell Balancing Methods for Lion Battery Technology Energy Storage; Wiley Online Library: Hoboken, NJ, USA, 2020. [Google Scholar]
  15. Wu, T.; Qi, Y.; Liao, L.; Ji, F.; Chen, H. Research on equalization strategy of lithium-ion batteries based on fuzzy logic control. J. Energy Storage 2021, 40, 102722. [Google Scholar] [CrossRef]
  16. Khan, N.; Ooi, C.A.; Shreasth. A novel active cell balancing topology for serially connected Li-ion cells in the battery pack for electric vehicle applications. Sci. Rep. 2024, 14, 18600. [Google Scholar] [CrossRef]
  17. Uno, M.; Kukita, A. String-to-battery voltage equalizer based on a half-bridge converter with multistacked current doublers for series-connected batteries. IEEE Trans. Power Electron. 2019, 34, 1286–1298. [Google Scholar] [CrossRef]
  18. Samanta, A.; Chowdhuri, S. Active cell balancing of lithium-ion battery pack using dual DC-DC converter and auxiliary lead acid battery. Energy Storage 2021, 33, 102109. [Google Scholar] [CrossRef]
  19. Cao, Y.; Li, K.; Lu, M. Balancing method based on flyback converter for series-connected cells. IEEE Access 2021, 9, 52393–52403. [Google Scholar] [CrossRef]
  20. Cui, X.; Shen, W.; Zhang, Y.; Hu, C.; Zheng, J. Novel active LiFePO4 battery balancing method based on chargeable and dischargeable capacity. Comput. Chem. Eng. 2017, 97, 27. [Google Scholar] [CrossRef]
  21. Chowdhury, S.M.; Badawy, M.O.; Sozer, Y.; Garcia, J.A.D.A. A Novel Battery Management System Using a Duality of the Adaptive Droop Control Theory. IEEE Trans. Ind. Appl. 2019, 55, 5078–5088. [Google Scholar] [CrossRef]
  22. Xia, Z.; Qahouq, J.A.A. State-of-charge Balancing of Lithium-ion Batterieswith State-of-health Awareness Capability. IEEE Trans. Ind. Appl. 2020, 57, 673–684. [Google Scholar] [CrossRef]
  23. Mukherjee, N.; Strickland, D. Control of Second Life Hybrid Battery Energy Storage System Based on Modular Boost-Multilevel Buck nverter. IEEE Trans. Ind. Appl. 2014, 10, 0046–0058. [Google Scholar]
  24. Liu, H.; Zhang, Z. The Equalizer of Charging and Discharging and the Balancing Strategies for Lithium-Ion Battery Pack. Trans. China Electrotech. Soc. 2015, 30, 186–193. [Google Scholar]
  25. Xu, B.; Tu, H.; Du, Y.; Yu, H.; Liang, H.; Lukic, S. A Distributed Control Architecture for Cascaded H-Bridge Converter with Integrated Battery Energy Storage. IEEE Trans. Ind. Appl. 2020, 57, 845–856. [Google Scholar] [CrossRef]
  26. Shi, R.; Zhang, X.; Liu, S.; Huang, L.; Liao, S.; Hu, Z. Review on wind speed prediction based on spatial correlation. Acta Energiae Solaris Sin. 2023, 44, 546–552. [Google Scholar]
  27. Li, Y.; Han, Y. A Module-Integrated Distributed Battery Energy Storage and Management System. IEEE Trans. Power Electron. 2016, 31, 8260–8271. [Google Scholar] [CrossRef]
  28. Fares, A.; Klumpner, C.; Sumner, M. Investigating the Benefits and Limitations of Cascaded Converter Topologies Used in Modular Battery Systems. IEEE Trans. Power Syst. 2017, 29, 2123–2130. [Google Scholar]
  29. Kamel, M.; Zane, R.A.; Maksimović, D. Voltage Sharing with Series Output Connected Battery Modules in a Plug-and-Play DC Microgrid. IEEE Trans. Power Electron. 2021, 36, 13118–13127. [Google Scholar] [CrossRef]
Figure 1. Topology structure of the cascaded DC–DC converter energy storage system.
Energies 17 06385 g001
Figure 2. Schematic illustration of the closed-loop control mechanism in a DC–DC cascaded energy system.
Energies 17 06385 g002
Figure 3. Current power droop characteristics during charging.
Energies 17 06385 g003
Figure 4. The block diagram illustrates the closed-loop power control for the DC–DC sub-controller.
Energies 17 06385 g004
Figure 5. SOC equalization in the charge and discharge process (a) without considering SOH and (b) considering SOH.
Energies 17 06385 g005
Figure 6. Charge data during charging and discharge (a) without considering SOH and (b) considering SOH.
Energies 17 06385 g006
Figure 7. The waveform of the SOC equalization effect before and after taking into account the SOH: (a) SOC waveform; (b) charge data waveform.
Energies 17 06385 g007
Figure 8. Experimental platform for a cascaded energy storage system integrated with a DC–DC converter.
Energies 17 06385 g008
Figure 9. DC–DC converter for battery module charging and discharging.
Energies 17 06385 g009
Figure 10. Experimental waveform of the charging mode SOC: (a) the SOC waveform without equalization charging; (b) the waveform for SOC equalization charging; and (c) SOC equalization charging considering SOH.
Energies 17 06385 g010
Figure 11. Experimental waveform of discharging mode SOC: (a) the SOC waveform without equalization discharging; (b) the waveform for SOC equalization discharging; (c) SOC equalization discharging considering SOH.
Energies 17 06385 g011
Table 1. Explanations of the parameter terms and their definitions.
Parameter VariableDefinition SpecificationNumerical Range
V B Battery module voltage 89.6   V 115.2   V
I B Battery module current (negative for charging, positive for discharging) 140   A
P B The power on the battery side of the DC–DC converter 14.375   kW
V b u s DC–DC converter bus side voltage
Upper voltage limit V b u s _ lim i t U
115.2   V 140   V
140   V
P t o t a l Total power of the DC–DC cascading system 115   kW
g R The reciprocal of the efficiency product for each DC–DC converter and the power droop factor
g R parameters of the i-th DC–DC converter g R i
Maximum g R max
Minimum g R min
g R i ¯ The consideration of the g R i in SOH should be taken into account
Maximum g R max ¯
Minimum g R min ¯
g P i Droop coefficient 0.001 0.0024
η c Efficiency of DC–DC converters 1
I o r e f Cluster current reference value 115   A
I o Measurement of cluster current 115   A
I o f f s e t The current reference on the DC–DC bus side
I o r e f Cluster current reference 115   A
V b u s T o t a l The total voltage on the bus side of the DC–DC converter 1120   V
S O C max The maximum SOC in multiple battery modules 0 1
S O C min The minimum SOC in multiple battery modules 0 1
S O H max The maximum SOH in multiple battery modules 0 1
S O H min The minimum SOH in multiple battery modules 0 1
d i The duty cycle of the i-th DC–DC converter
Q Battery capacitymAh
Table 2. Simulation parameters for Condition 1.
The Number of Battery ModulesInitial State of Charge (SoC)SOH
10.261.0
20.241.0
30.221.0
40.21.0
50.160.8
60.140.8
70.120.8
80.100.8
Table 3. Simulation parameters for Condition 2.
The Number of Battery ModulesInitial State of Charge (SoC)SOH
10.90.8
20.90.8
30.90.8
40.71.0
50.71.0
60.71.0
71.00.7
81.00.7
Disclaimer/Publisher’s Note: The statements, opinions and data contained in all publications are solely those of the individual author(s) and contributor(s) and not of MDPI and/or the editor(s). MDPI and/or the editor(s) disclaim responsibility for any injury to people or property resulting from any ideas, methods, instructions or products referred to in the content.

