Article

Numerical Analysis of Soot Dynamics in C3H8 Oxy-Combustion with CO2 and H2O

1
School of Petroleum Engineering, Yangtze University, Wuhan 430100, China
2
Key Laboratory of Low Carbon Catalysis and Carbon Dioxide Utilization, Chinese Academy of Sciences, Lanzhou 730099, China
*
Author to whom correspondence should be addressed.
Energies 2024, 17(24), 6232; https://doi.org/10.3390/en17246232
Submission received: 10 November 2024 / Revised: 5 December 2024 / Accepted: 6 December 2024 / Published: 11 December 2024
(This article belongs to the Section I2: Energy and Combustion Science)

Abstract

:
Oxygen-enriched combustion is increasingly recognized as a viable approach for clean energy production and carbon capture, offering substantial benefits for boosting combustion efficiency and mitigating pollutant emissions, which makes it widely adopted in various industrial applications. Liquefied petroleum gas (LPG), predominantly consisting of propane (C3H8), is commonly utilized in numerous combustion systems, yet its emissions of soot particulates have raised considerable environmental concerns. This study delves into the combustion dynamics and soot formation behavior of propane, the principal component of LPG, under oxy-fuel combustion conditions, with the inclusion of H2O and CO2, utilizing both experimental techniques and numerical simulations. The results reveal that CO2 and H2O suppress soot formation through distinct mechanisms. CO2 decreases soot nucleation and surface growth by lowering flame temperature and H atom concentration, but it minimally enhances soot oxidation. H2O significantly reduces soot formation by chemically increasing OH radical concentration, thereby enhancing soot oxidation. A detailed decoupling analysis further shows that CO2’s influence is predominantly thermal and chemical, resulting in lower OH levels and an elongated flame shape. In contrast, H2O’s substantial thermal and chemical effects decrease flame height and promote soot reduction. These insights advance the understanding of soot formation control in oxy-fuel combustion, offering strategies to optimize combustion efficiency and minimize environmental impact.

1. Introduction

Despite the ongoing global energy transition, fossil fuels remain essential to modern society [1]. However, the soot particles generated from fuel combustion pose significant risks to both the environment and human health [2]. In alignment with China’s ‘carbon neutrality’ strategy, optimizing the use of widely prevalent hydrocarbon fuels while minimizing soot formation is a critical research focus. In this situation, oxy-fuel combustion-based carbon capture technology has received a lot of attention from industries. Exhaust gas recirculation (EGR) and flue gas recirculation (FGR) are also being used by many industries [3,4]. Recent research indicates that soot formation on hydrocarbon fuels in O2/CO2 and O2/H2O environments significantly differs from its formation in air-based combustion [5,6]. Park J et al. [7] examined the impact of adding H2O, CO2, and N2 into CH4/air counterflow diffusion flames. Their results indicated that CO2 addition reduced the flame temperature due to a combination of thermal and chemical influences, whereas H2O promoted combustion primarily through its chemical interactions. Wang et al. [8] conducted numerical simulations and experiments to investigate the effects CO2 on soot formation in C2H4/air opposed-flow flames, discovering that CO2 reduced concentrations of key species like H radicals, methyl, propargyl, and acetylene, which in turn decreased soot nucleation and surface growth rates. Chen et al. [9] also investigated the impacts of CO2 on laminar co-flow ethylene diffusion flames. Their results indicated that CO2 decreases the nucleation size of soot particles and modified the boundary between soot growth and oxidation regions on the flame surface. Zhang et al. [10] used a two-color flame emission method with R-band and G-band spectra to measure flame temperature and soot volume fraction in an O2/CO2 environment. Their results showed that as the O2 concentration increased from 21% to 50%, the formation of soot by CO2 was effectively stopped. Xie et al. [11] studied flames that were mixed with CO2, H2, and air. The study found that introducing CO2 and H2O altered the primary chemical reaction from OH + H2 ⇋ H + H2O to HO2 + H ⇋ OH + OH, with CO2 exerting a more significant chemical influence than H2O. Xu H et al. [12] performed experiments and computer simulations on laminar synthetic gas diffusion flames with 30% CO2 as the oxidant. Their results showed that CO2’s thermal and chemical effects change the intensity of combustion by lowering the concentration of OH.
The effect of adding water vapor on soot formation has not been extensively studied, though some research indicates that introducing water vapor into hydrocarbon fuel combustion can suppress soot production. Liu F et al. [13] conducted numerical simulations to examine the effects of water vapor on flame characteristics and soot volume fraction in a laminar co-flow ethylene/air diffusion flame at 1–2 bar. They employed a model combining polycyclic aromatic hydrocarbons (PAHs) with the hydrogen-abstraction/carbon-addition (HACA) mechanism to simulate soot formation’s surface growth and the oxidation processes involved in soot formation. The study demonstrated that adding water vapor affected flame dynamics and soot generation mainly through dilution and thermal impacts, particularly by decreasing H radical concentrations, which in turn reduced the initial rate of soot formation. Ying et al. [14] investigated the effect of H2O addition on soot morphology, nanostructure, and oxidation activity in the fuel-rich region of an ethylene reverse diffusion flame. The findings indicated that higher H2O concentrations decreased soot, implying that H2O effectively inhibited its formation by decreasing the size of the primary particles and aggregates, confirming changes in soot morphology. Cepeda F et al. [15] investigated the influence of water vapor on soot formation in laminar co-flow diffusion flames across varying oxygen concentrations, utilizing both experimental methods and numerical simulations. The findings showed a strong alignment between measured data and simulation results, indicating that water vapor influenced H and OH radical concentrations and altered the formation and oxidation pathways of soot precursors. Qiu L et al. [16] performed numerical simulations on ethanol/air co-flow diffusion flames and examined the impact of water vapor on flame structure and soot production. The authors proposed a stepwise decoupling method to isolate the impacts of dilution, density, transport, thermal, radiative, and chemical effects of water vapor through the use of various virtual species. The study indicated that flame temperature distribution is chiefly affected by the dilution and thermal properties of water vapor, whereas the decrease in soot volume fraction was primarily due to its dilution and chemical effects.
Liquefied petroleum gas (LPG), primarily composed of propane, is extensively utilized in various combustion systems, making the control of its soot particle emissions a critical concern. However, the mechanisms underlying soot formation in propane laminar diffusion flames remain underexplored and require further investigation. Hu X et al. [17]. investigated the laminar flame speed of propane in O2/CO2 atmospheres using both experimental and numerical simulations. Their results showed that the laminar flame speed increases with the oxygen content in the air but decreases when there are more CO2 contents, due to the thermal, radiative, and chemical effects of CO2, which slow it down. Zhang et al. [18] investigated oxygen-enriched combustion characteristics and soot formation in laminar coaxial jet diffusion flames of ethylene/O2/N2. The results revealed that oxygen-enriched combustion significantly raises the flame temperature, expanding the soot formation zone and increasing the soot volume fraction as oxygen concentration rises. Wu et al. [19] employed optical diagnostics to examine how CO2 addition affects soot formation in ethylene and propane diffusion flames. Their measurements encompassed the spatial distributions of polycyclic aromatic hydrocarbons (PAHs), temperature, soot volume fraction, primary particle size, and particle number density. The results showed that with increasing CO2 concentration, the ethylene flame’s overall height decreases, the temperatures at the lower regions drop, while the upper temperatures rise. In contrast, the propane flame height remained relatively constant, with a slight overall temperature drop.
This study investigates the efficient and clean use of fossil energy through fundamental experiments and numerical simulations. The study focuses on the combustion characteristics and soot formation of propane (the primary component of liquefied petroleum gas) in CO2/H2O atmospheres. Furthermore, there is an in-depth examination into the effects of varying flame temperature, height, and the amount of soot that forms in propane co-flow diffusion flames in O2/N2, O2/CO2, and O2/H2O environments. Several virtual and key species were incorporated into the calculations to analyze the influence of CO2 and H2O on propane flame structure and soot formation.

2. Experiment and Simulation

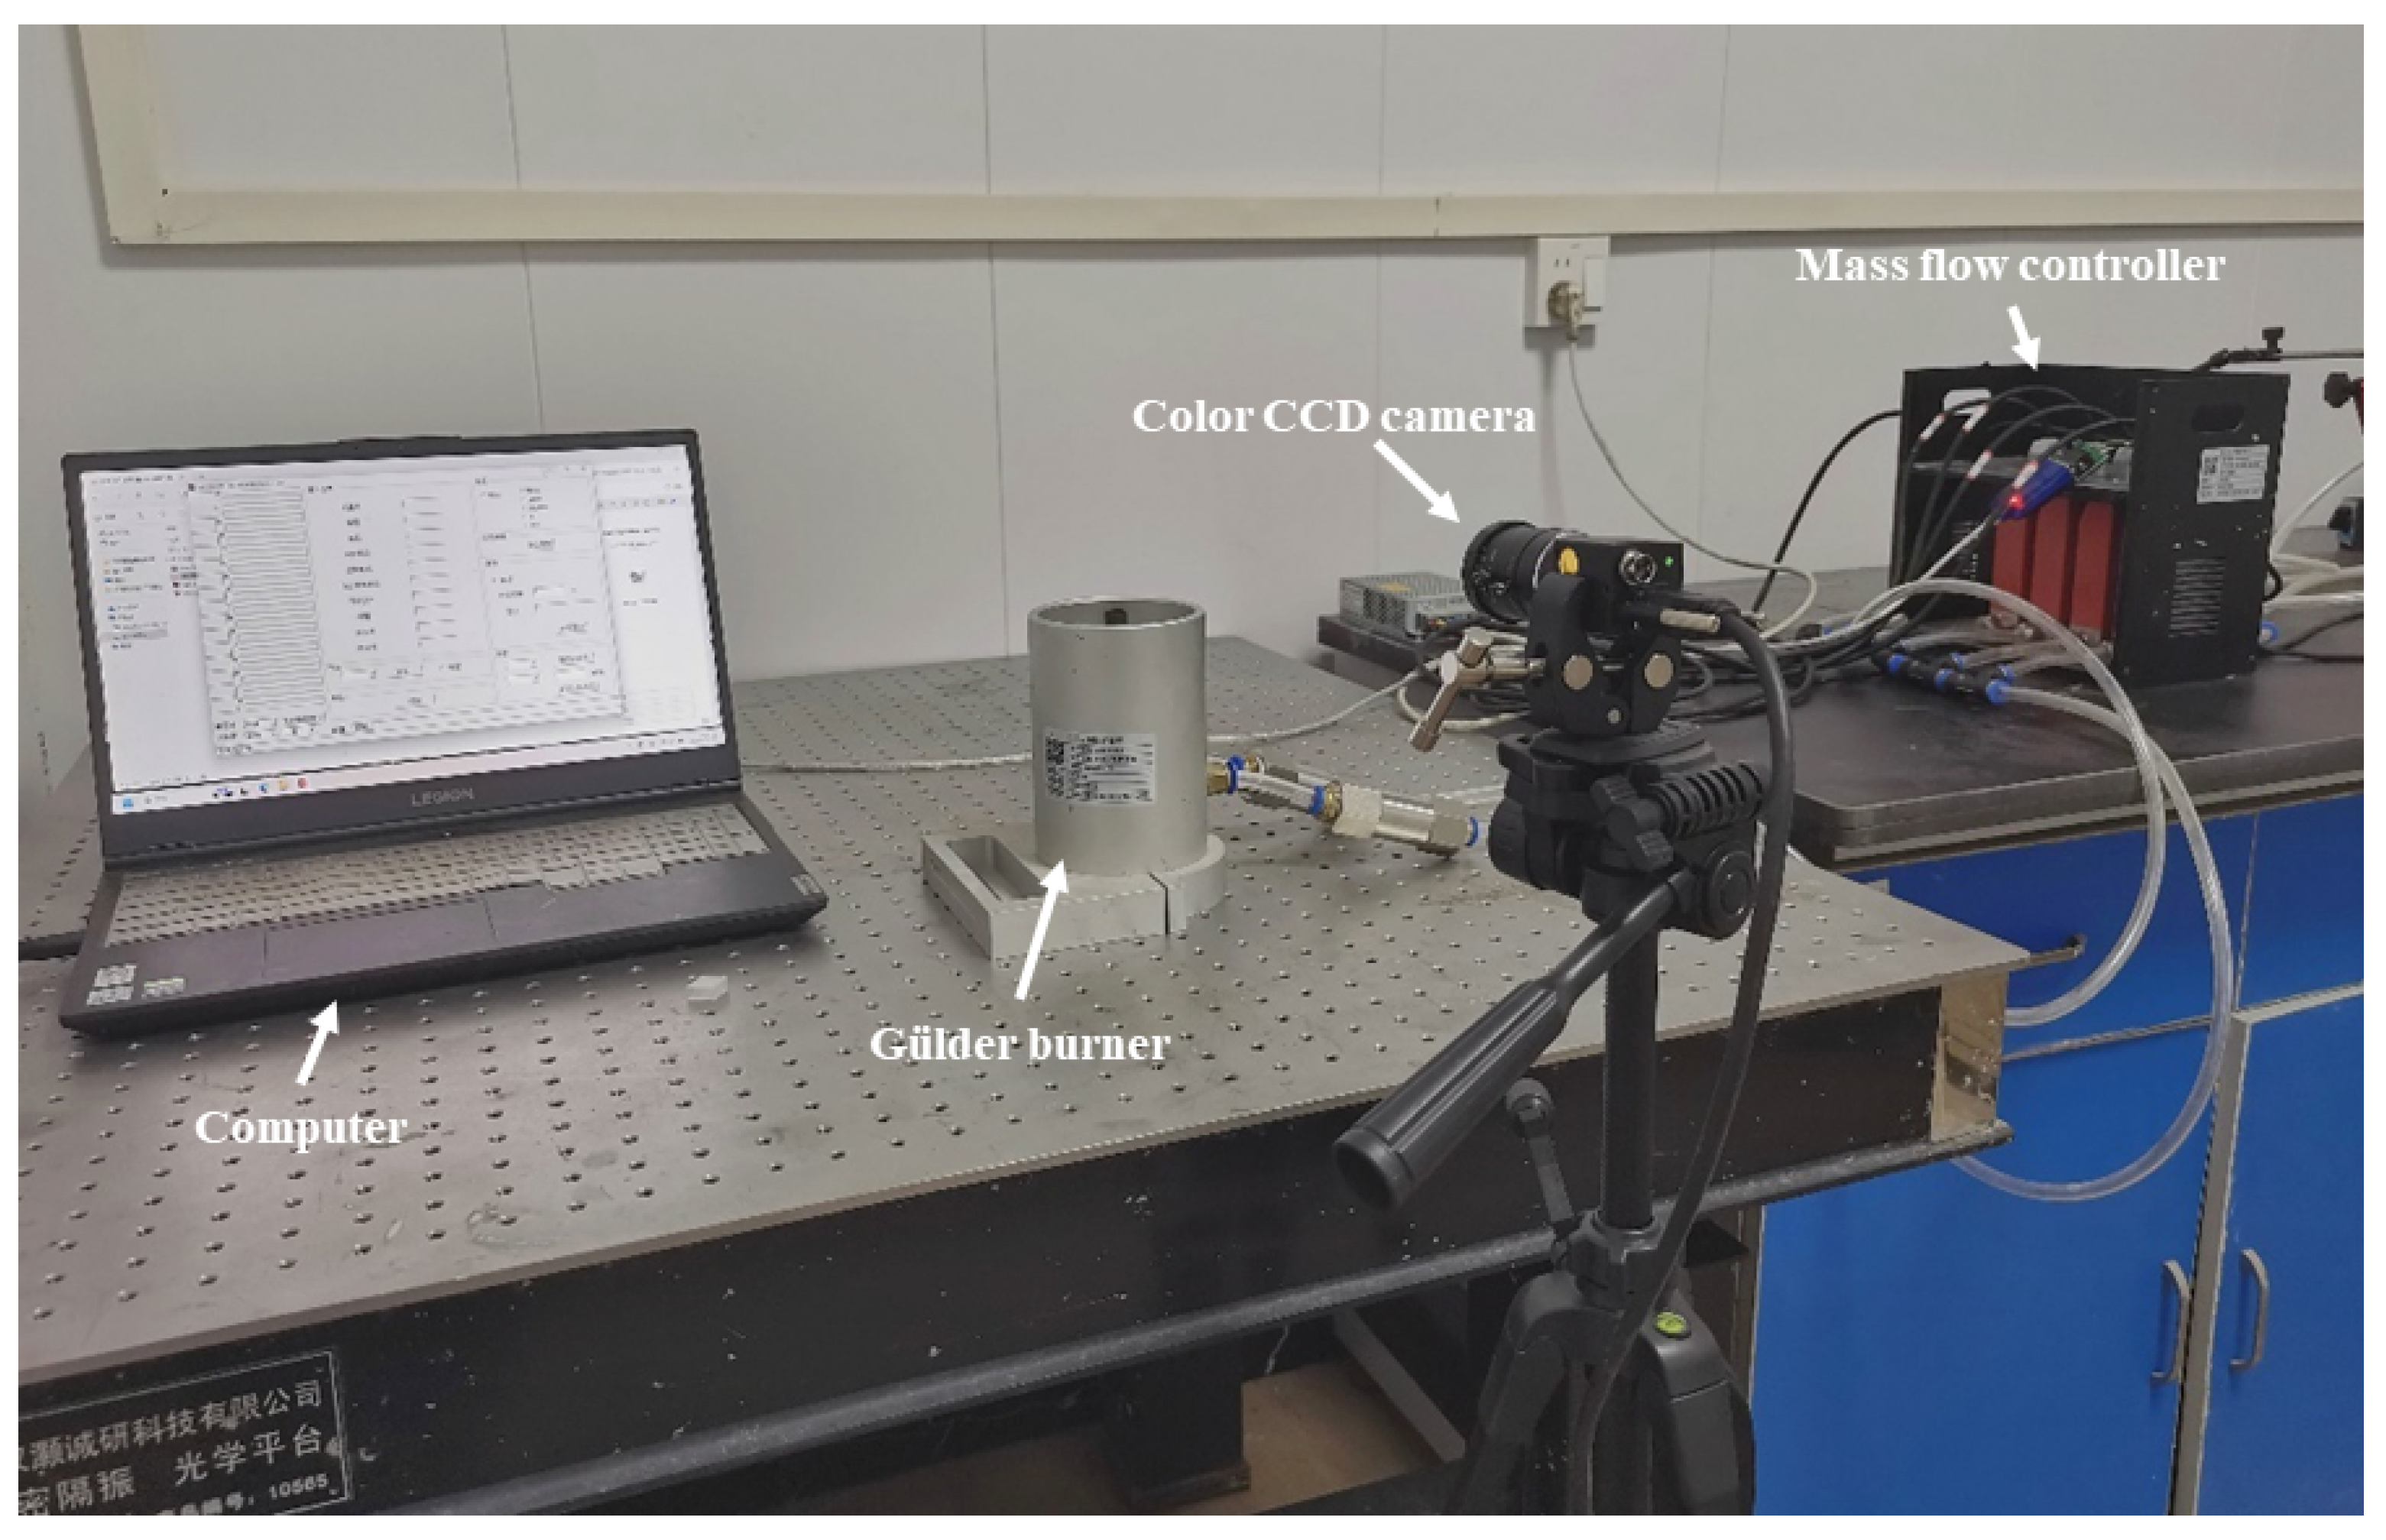
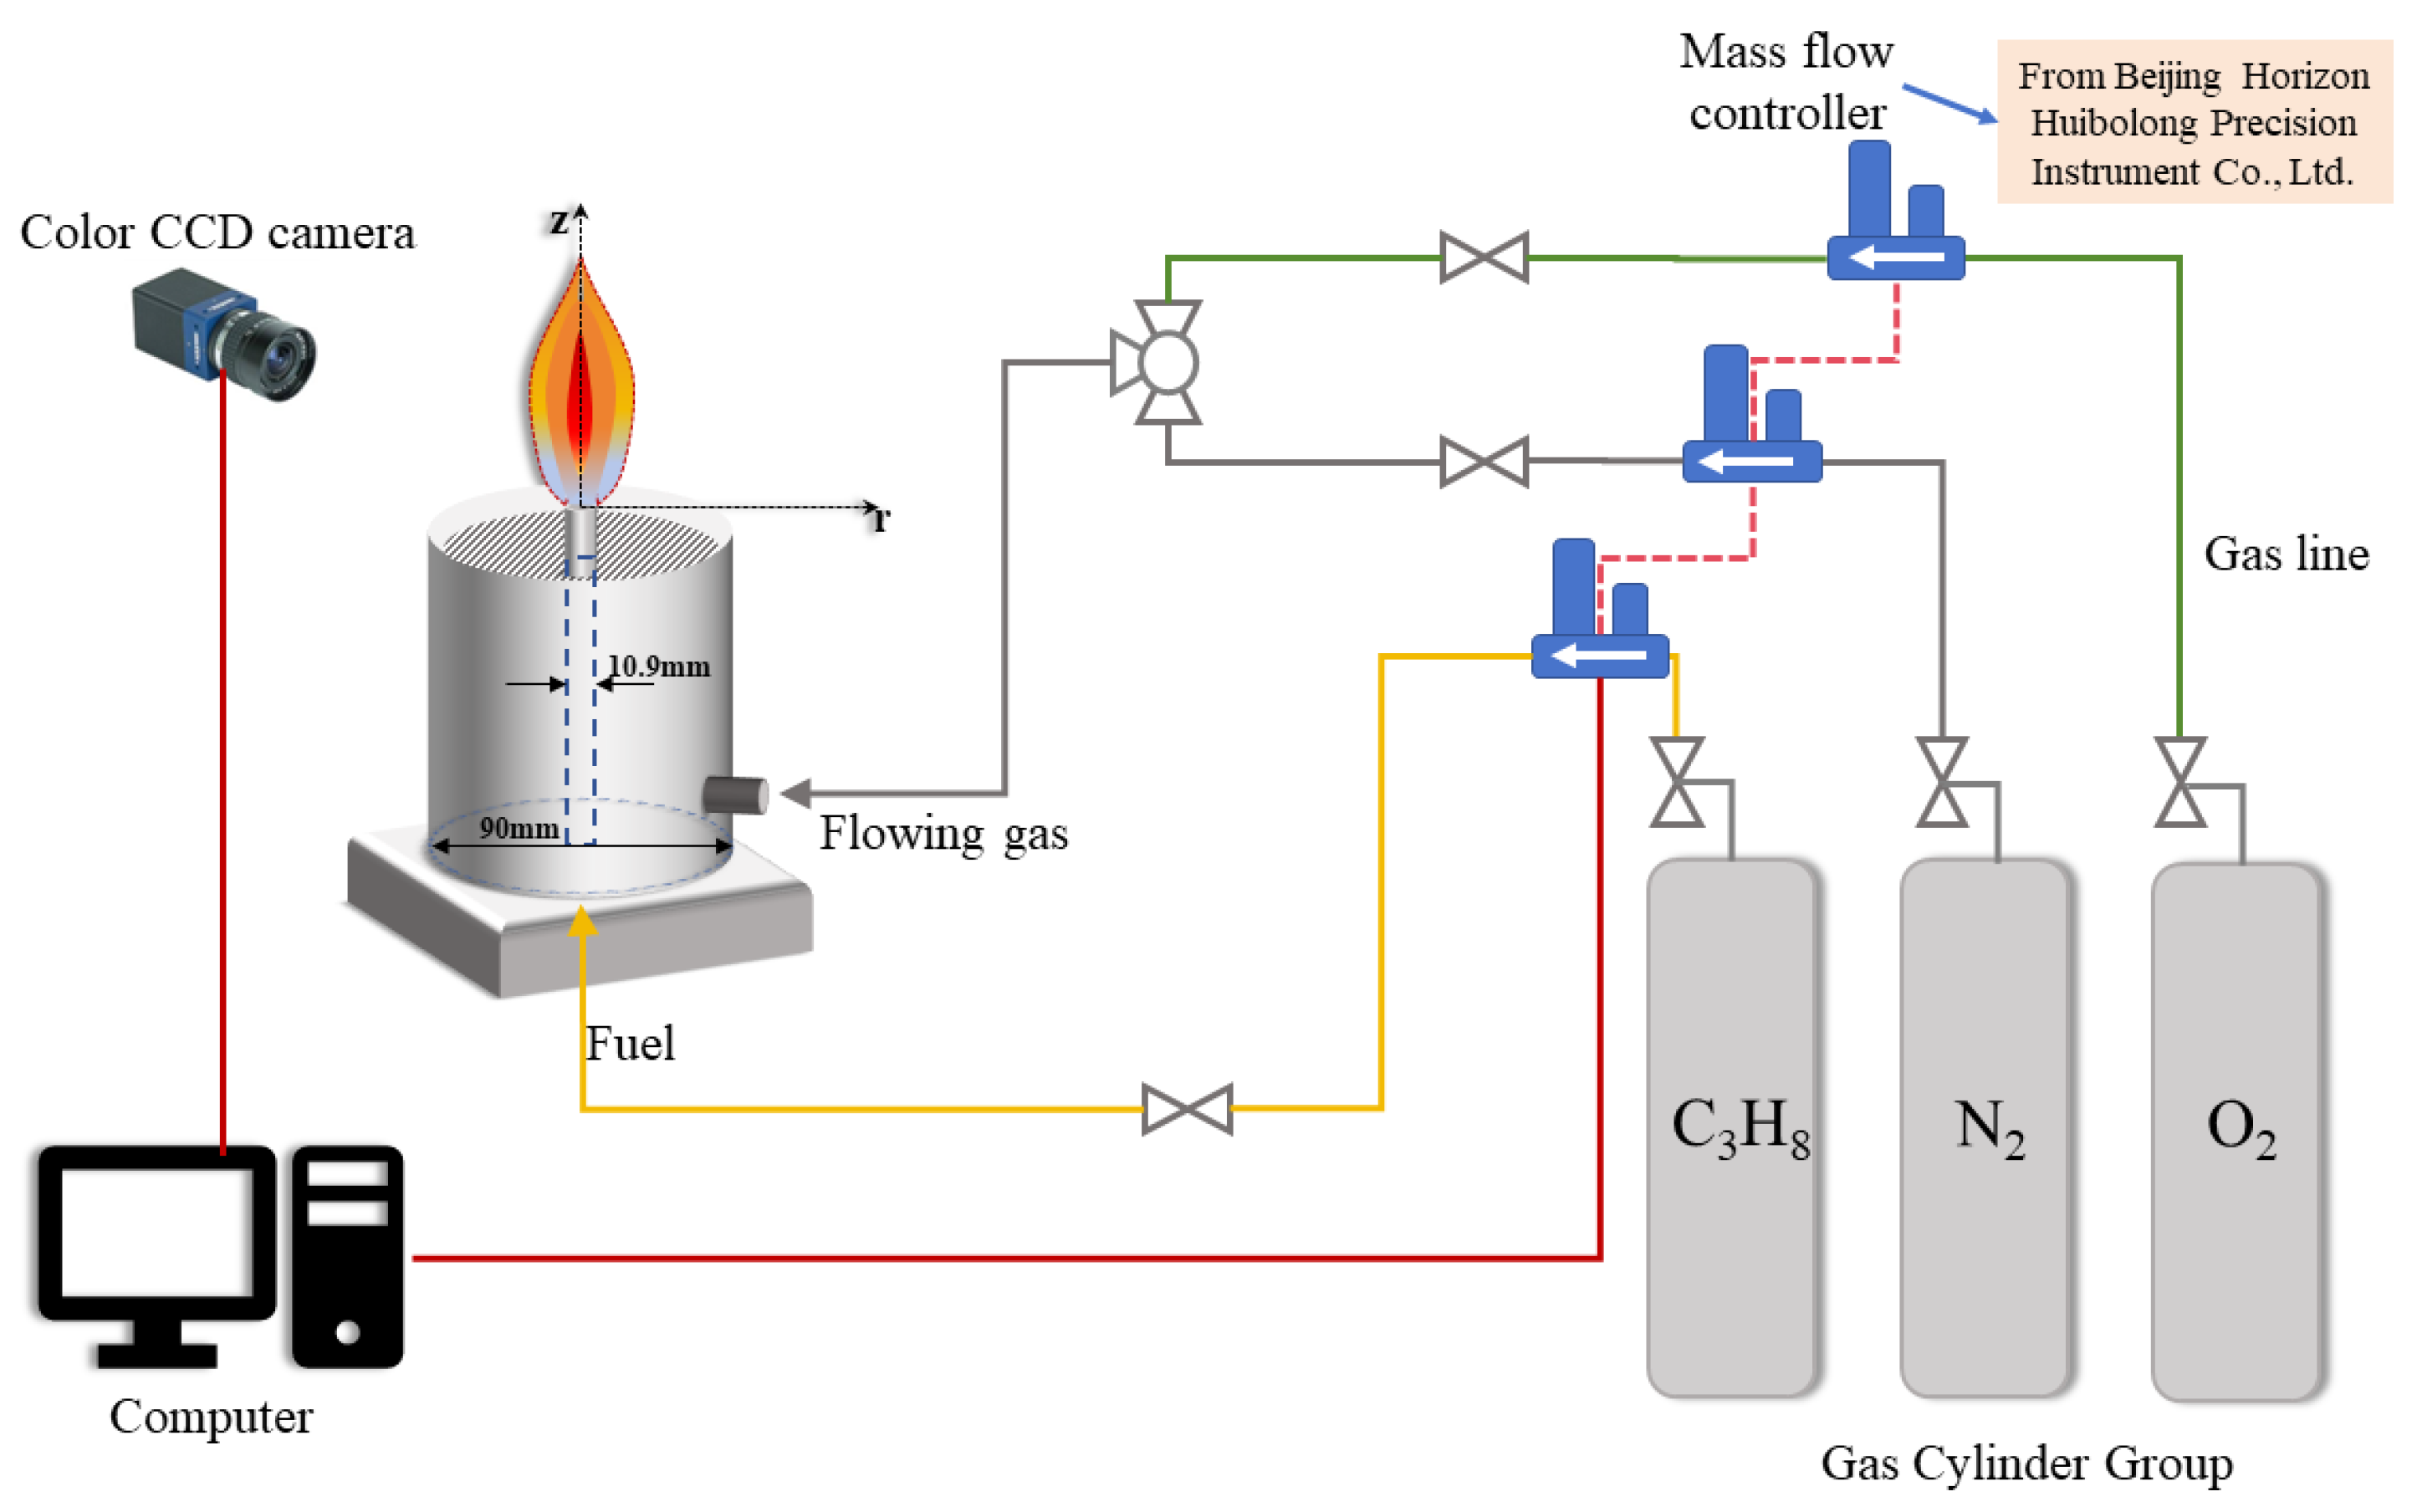
2.1. Experimental Instrument

The experiment utilizes a laminar diffusion flame combustion setup, depicted in Figure 1. This system consists of a burner, gas distribution pipeline, gas cylinder, flow control mechanism, and an optical measurement apparatus. The burner used in the experiment is a Gülder burner. The fuel tube features an inner diameter of 10.9 mm and a wall thickness of 0.95 mm, while the accompanying gas pipe has an inner diameter of 90 mm, consistent with configurations reported in previous studies [20].
The experimental setup, depicted in Figure 2, features a hydrocarbon fuel laminar diffusion flame system with a Gülder burner. The central tube emits propane, while the surrounding annular space releases co-flow gas. The co-flow gas flow is homogenized through small glass beads and a porous metal filter, creating a coaxial laminar diffusion flame at atmospheric pressure. O2 concentration variations, which are achieved by adjusting the O2/N2 mix, allow for different suitable working conditions. A Mercury series industrial camera (MER-200-14GC) which has a 1/1.8” global exposure CCD sensor with a 1628 H × 1236 V resolution, and exposure times were adjusted to ensure precise data capture. While a 15c fixed-focus lens was used to capture visible light thermal radiation images transmitted via a Gigabit Ethernet, the gas flow was regulated using the S48 300/HMT gas mass flow controller from Beijing Horizon Huibolong Precision Instrument Co., Ltd., Beijing, China.

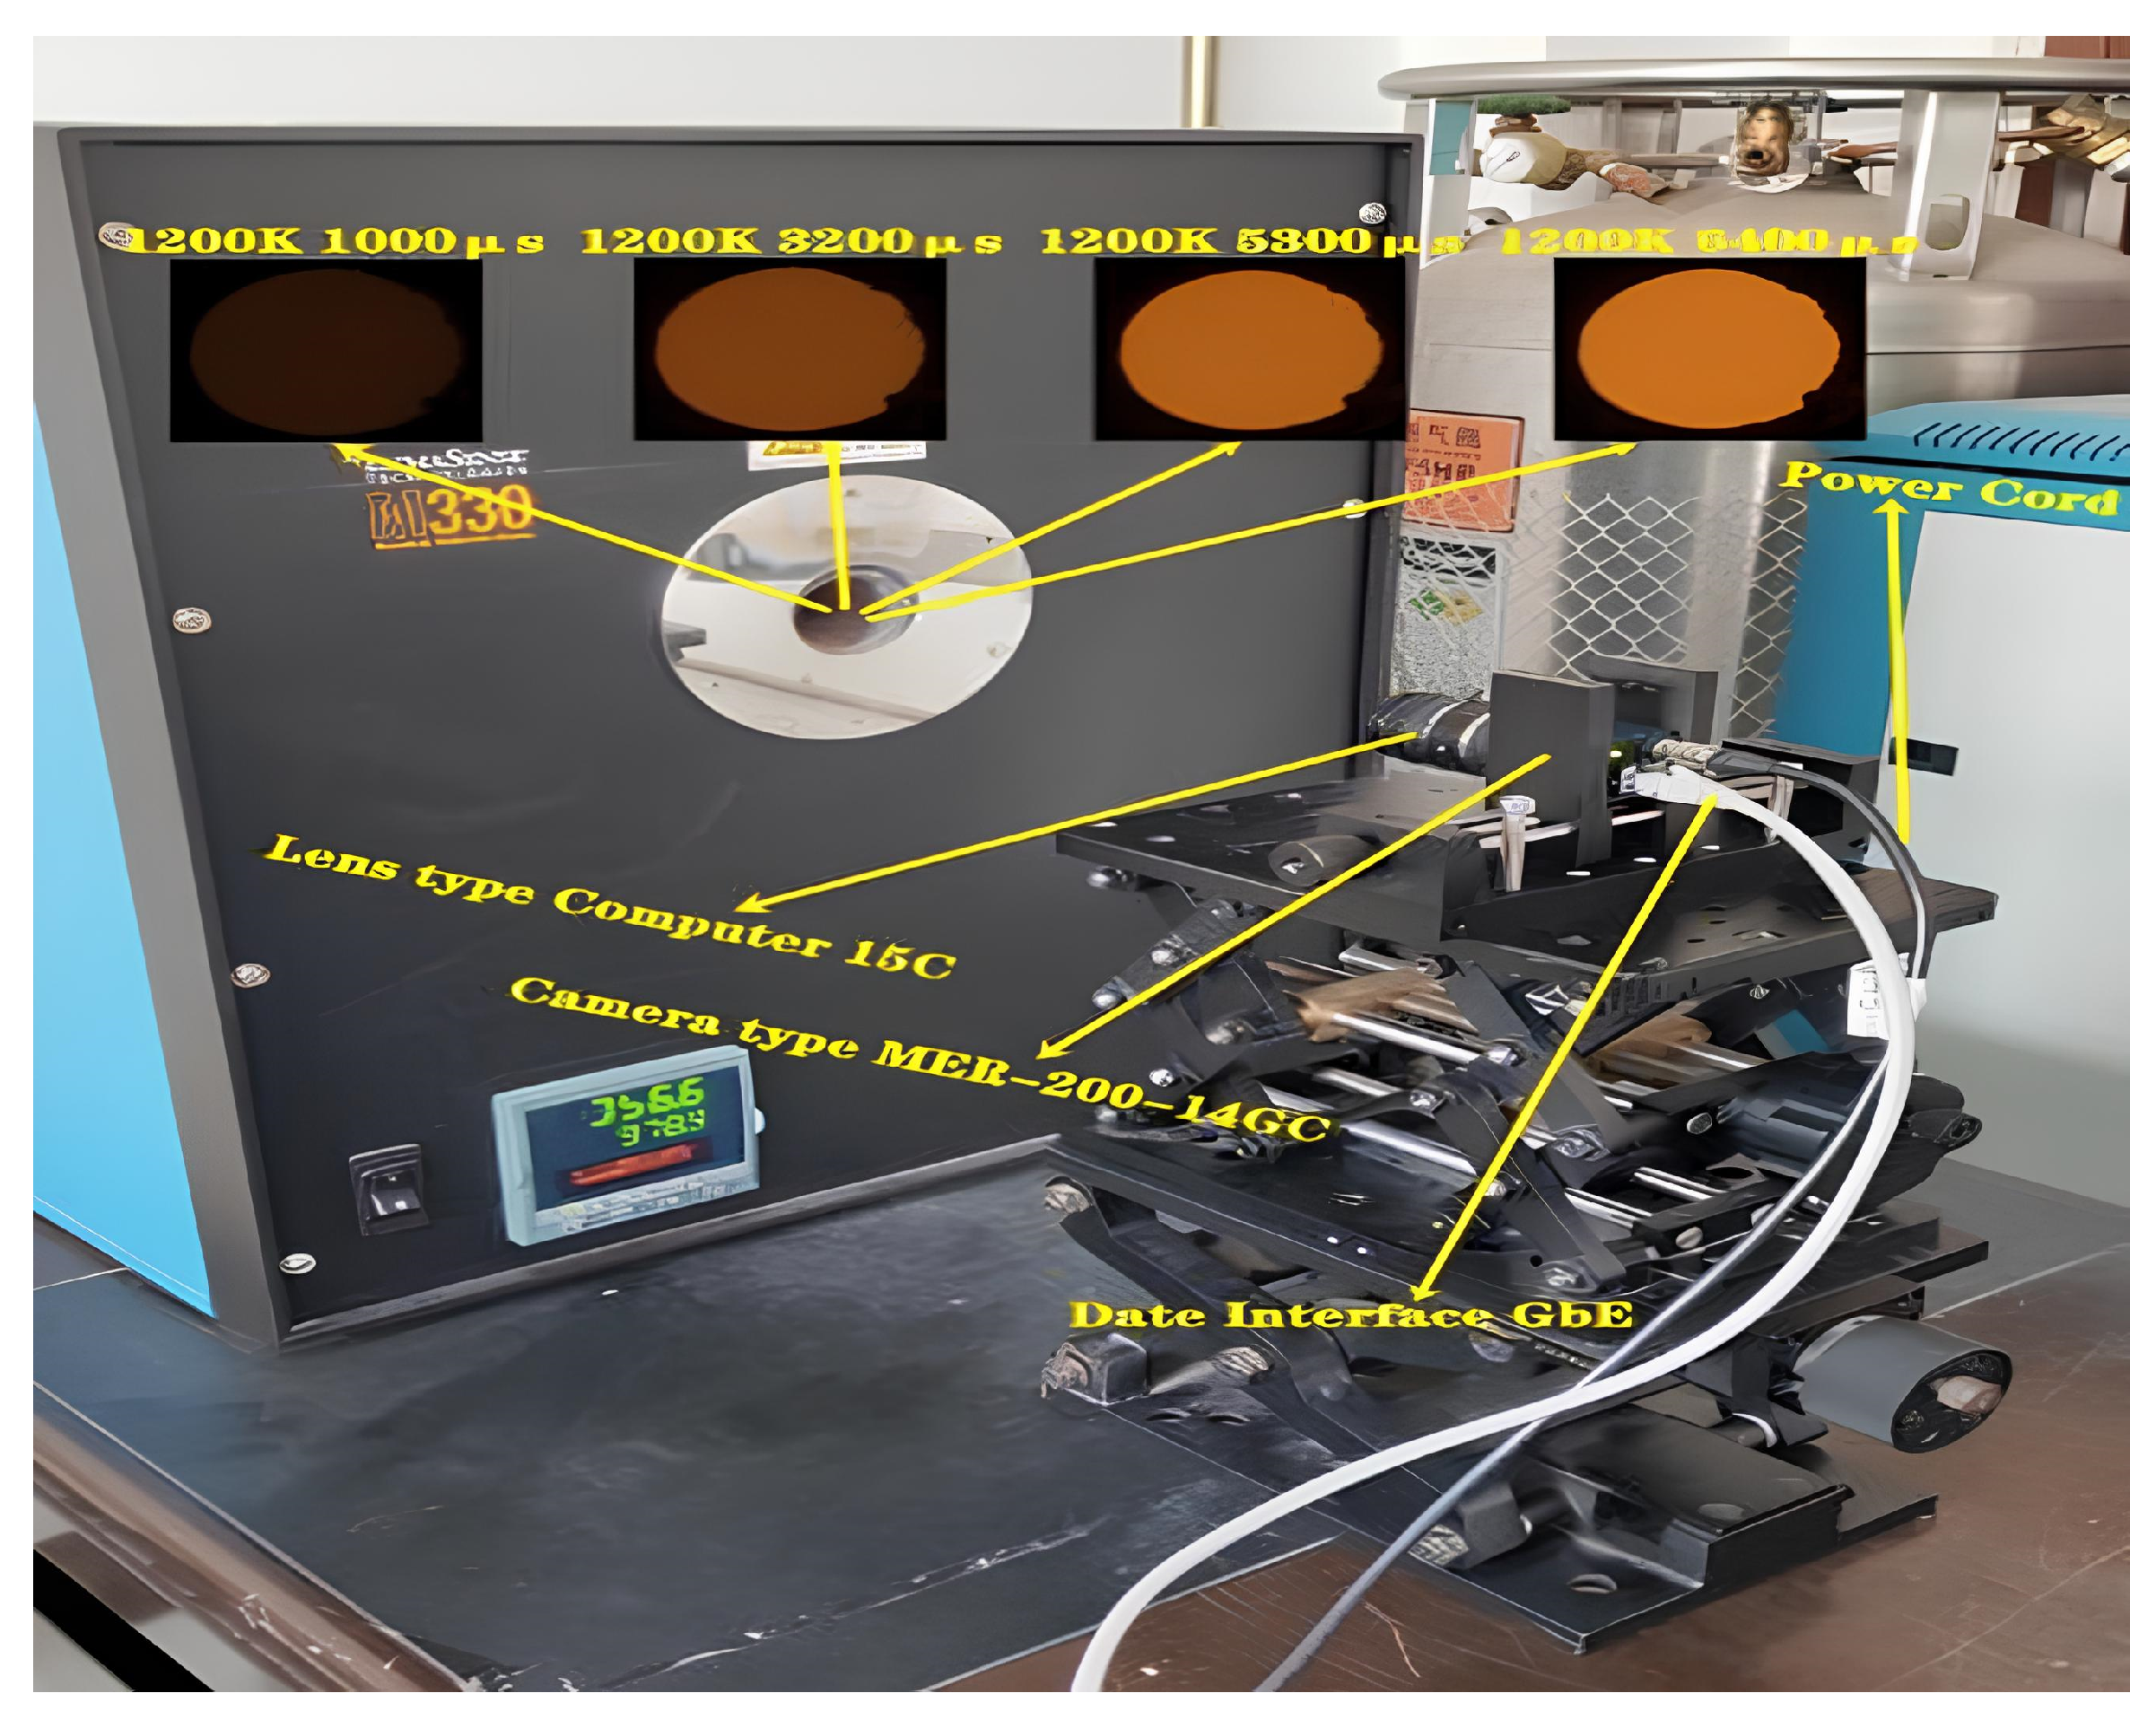
2.2. Experiment Principle

This study employs the two-color method, a non-contact technique for temperature measurement, which enables the temperature sensor to detect radiation signals from the combustion process without physically interacting with the target. This approach, which uses a CCD camera to capture thermal radiation images, preserves the integrity of the temperature field and its distribution, allowing for real-time temperature monitoring through continuous signal capture [21].
The study concentrates on a propane laminar diffusion flame, which exhibits absorption and emission in the absence of scattering or incident radiation. In the visible spectrum, the study focuses on the radiation given off by soot particles, leaving out the effects of triatomic gasses like CO2 and H2O. By utilizing intensity data from single and unidirectional boundary images, the study simultaneously reconstructs both the flame temperature and soot volume concentration. Figure 3 illustrates the segmentation of the horizontal cross-section of the axisymmetric flame, establishing a geometric correlation between the flame’s computational units and the camera’s imaging pixel units [22]. The jth line of sight records the following spectral radiation intensity:
I λ θ j = l j 0 l j κ λ l I b , λ l exp l l j κ λ l d l d l ,
where l is the path length of direct radiation intensity, κ λ l I b , λ l is the spectral emission source term, exp l l j κ λ l d l d l is the self-absorption, I b , λ ( l ) is the blackbody radiation intensity of soot particles, and κ λ is the spectral absorption coefficient of the soot particles. The approximate representation based on the Mie theory is typically constrained by Rayleigh conditions [23]:
k λ = 6 π E m f v λ ,
here f v is the volume fraction of soot, E m is the function of the optical constant of soot, and m is the gradient refractive index function with real and imaginary parts.
E m = Im m 2 1 m 2 + 1 = 6 n k n 2 k 2 + 2 2 + 4 n 2 k 2 ,
where n and k represent the refractive index and absorptivity, respectively. According to the literature [24], E m = 0.26 (n = 1.57, k = 0.56).
The blackbody spectral radiation intensity I b , λ ( l ) can be determined using Planck’s radiation law:
I b , λ = c 1 λ 5 e c 2 / λ T 1 .
This study assumes that the image pixel values in the R and G channels are proportional to the monochromatic radiation intensity, despite the broader spectral response curves of these bands. By considering the camera’s spectral response characteristics in the R and G bands, the directional emission power ER and EG can be calculated as follows [25]:
E R θ j = λ R 1 λ R 2 η R λ I λ θ j , λ d λ E G θ j = λ G 1 λ G 2 η R λ I λ θ j , λ d λ       .
The equations provided above can be used to determine both the temperature and soot volume fraction.
The reliability of these measurements significantly depends on the accuracy of image acquisition. To achieve precise mapping between radiation intensity and the color values in flame images, visible light radiation calibration of the imaging system is essential. This calibration process establishes a functional relationship between the radiation intensity channels and the image’s color values. A blackbody furnace, known for its stable radiation coefficient, is employed as the standard radiation source, with its temperature serving as the brightness temperature. Following the calibration method proposed by Wu Yonghua, thermal radiation images of the blackbody furnace are captured using a color CCD camera, allowing for the correlation between temperature and RGB values [21]. This correlation produces a fitting curve that is used to calibrate the monochromatic intensity values (R, G, B) in relation to the blackbody temperature. The calibration setup requires equipment such as a high-temperature blackbody furnace, CCD camera, computer, and transmission lines, as illustrated in Figure 4.

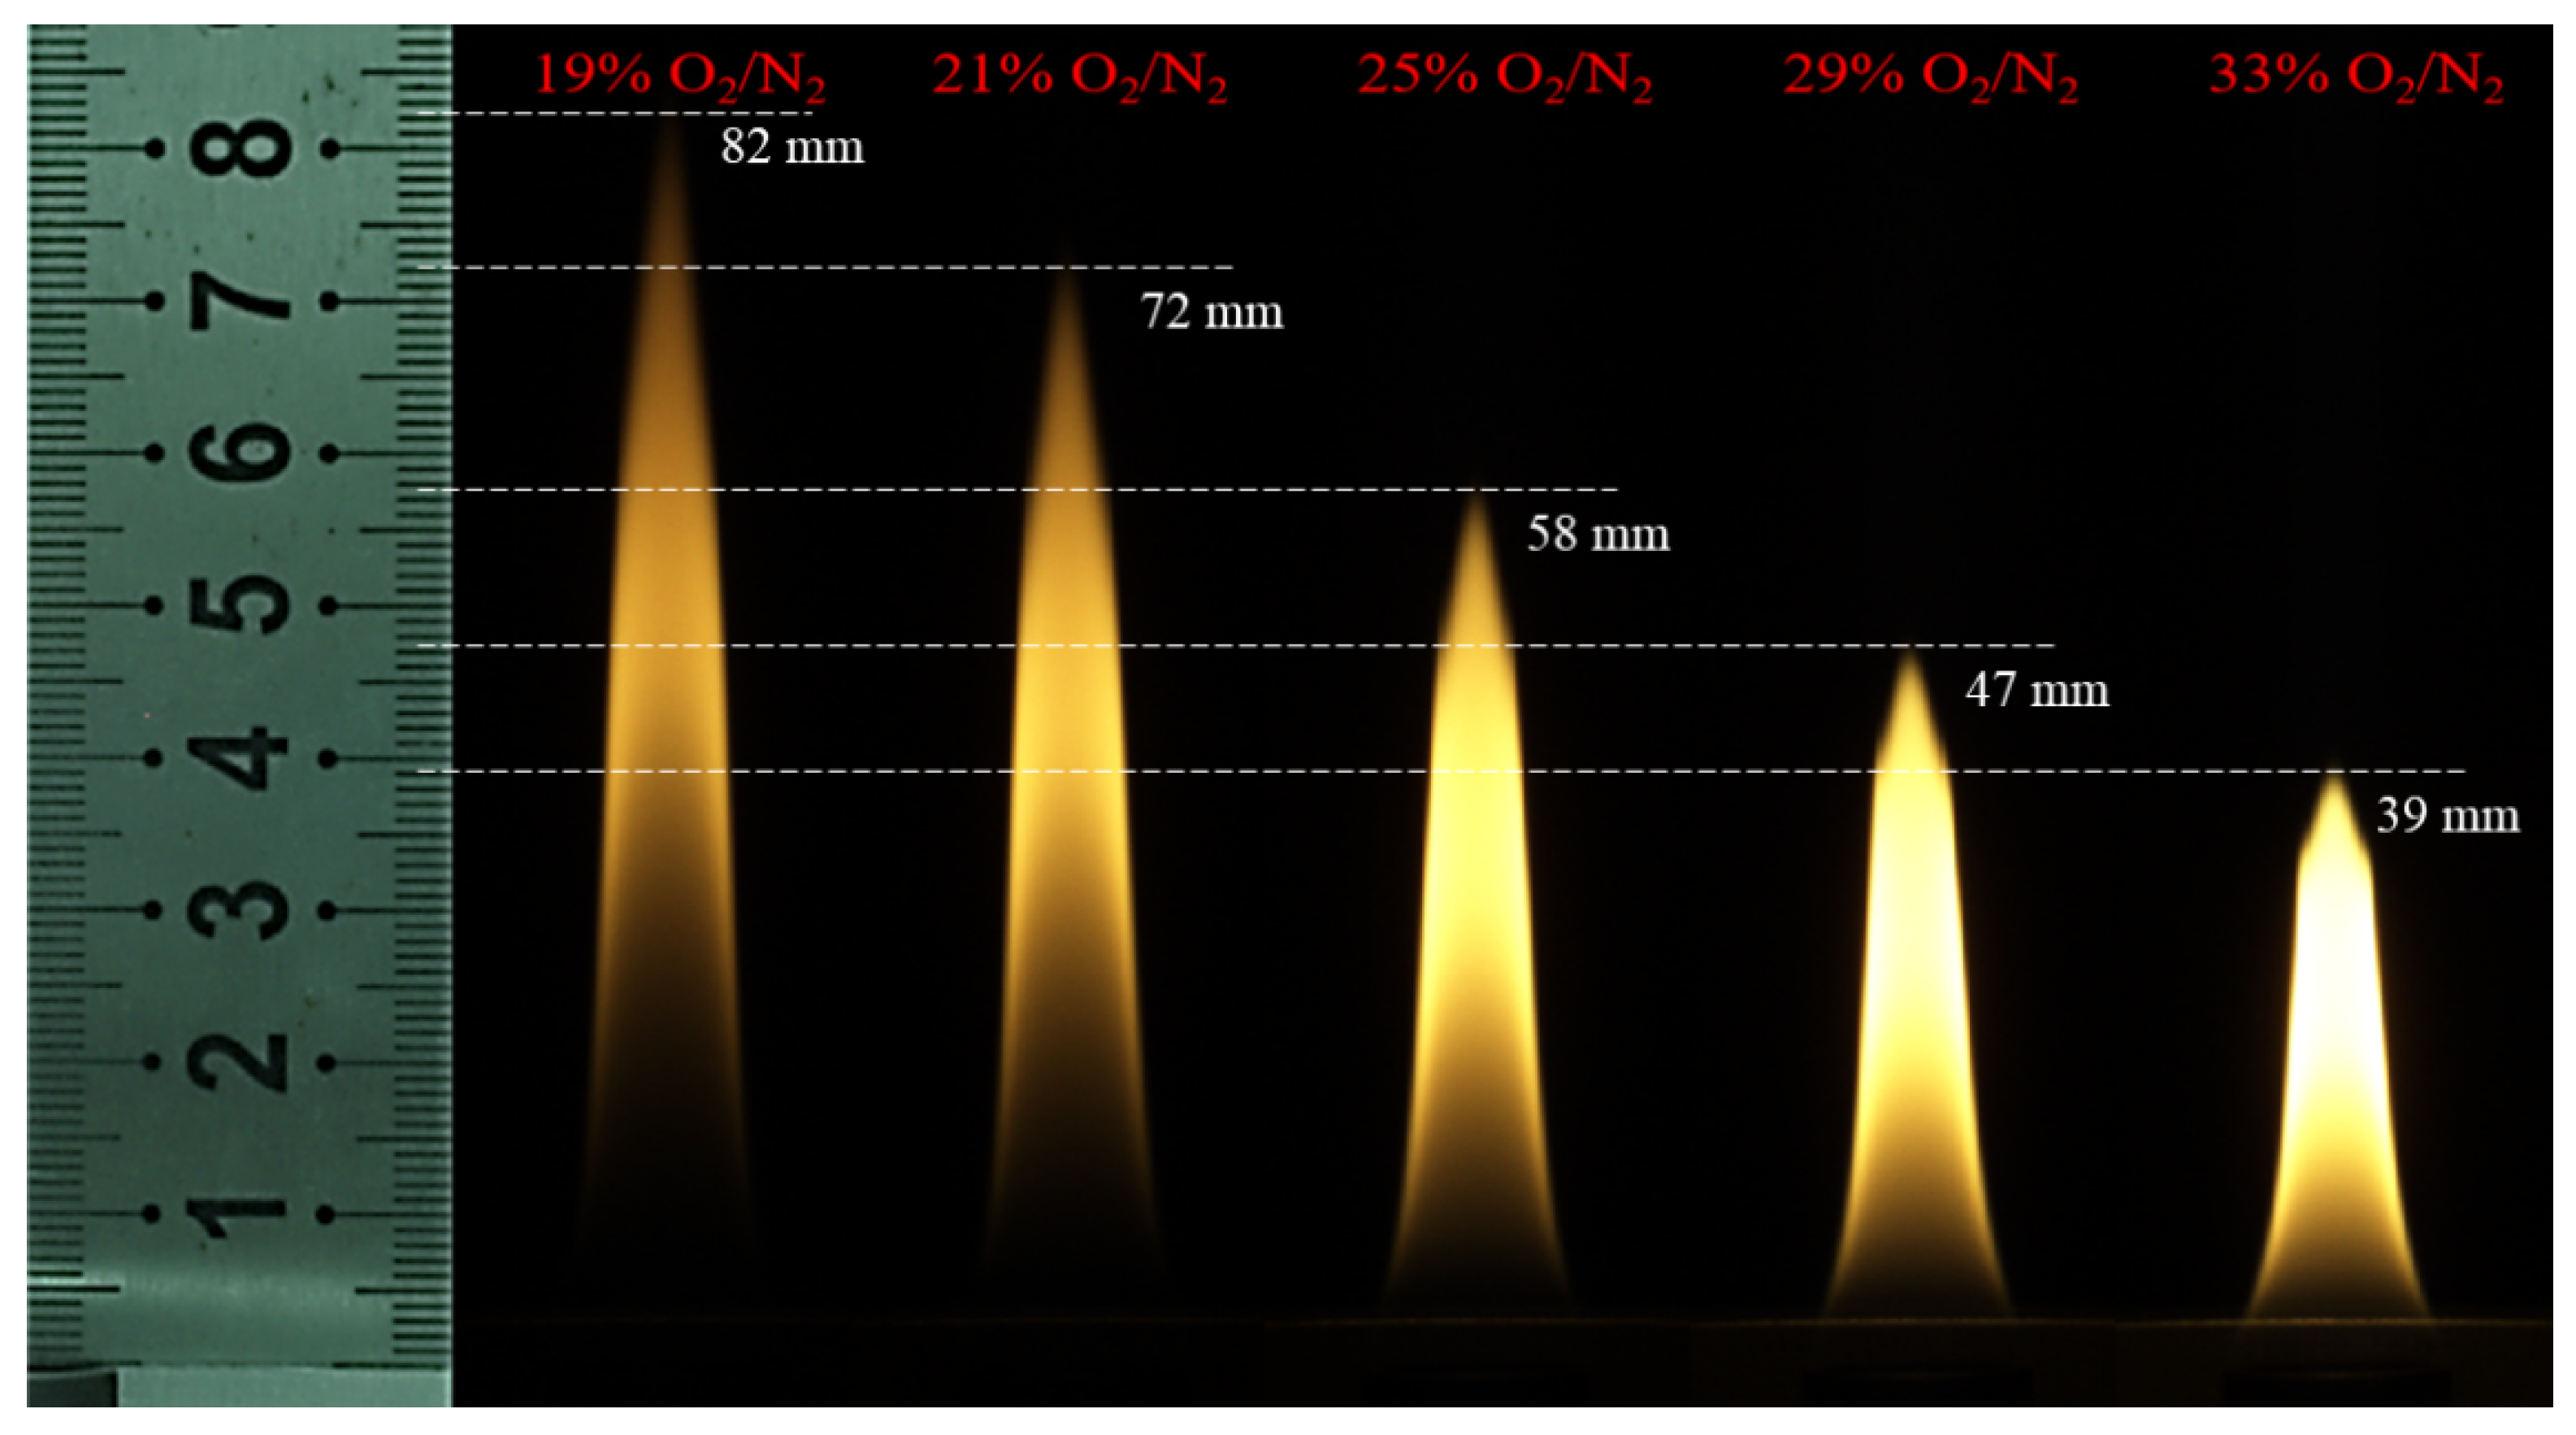
2.3. Experimental Condition

Flame images were captured using a CCD camera mounted on a laminar combustion test bench designed for hydrocarbon fuels. The two-color flame emission method, employing R and G channel response bands, was used to reconstruct the two-dimensional distribution of flame temperature and soot volume fraction for propane in a C3H8/(O2/N2/CO2) atmosphere. The experimental conditions for this study are provided in Table 1.

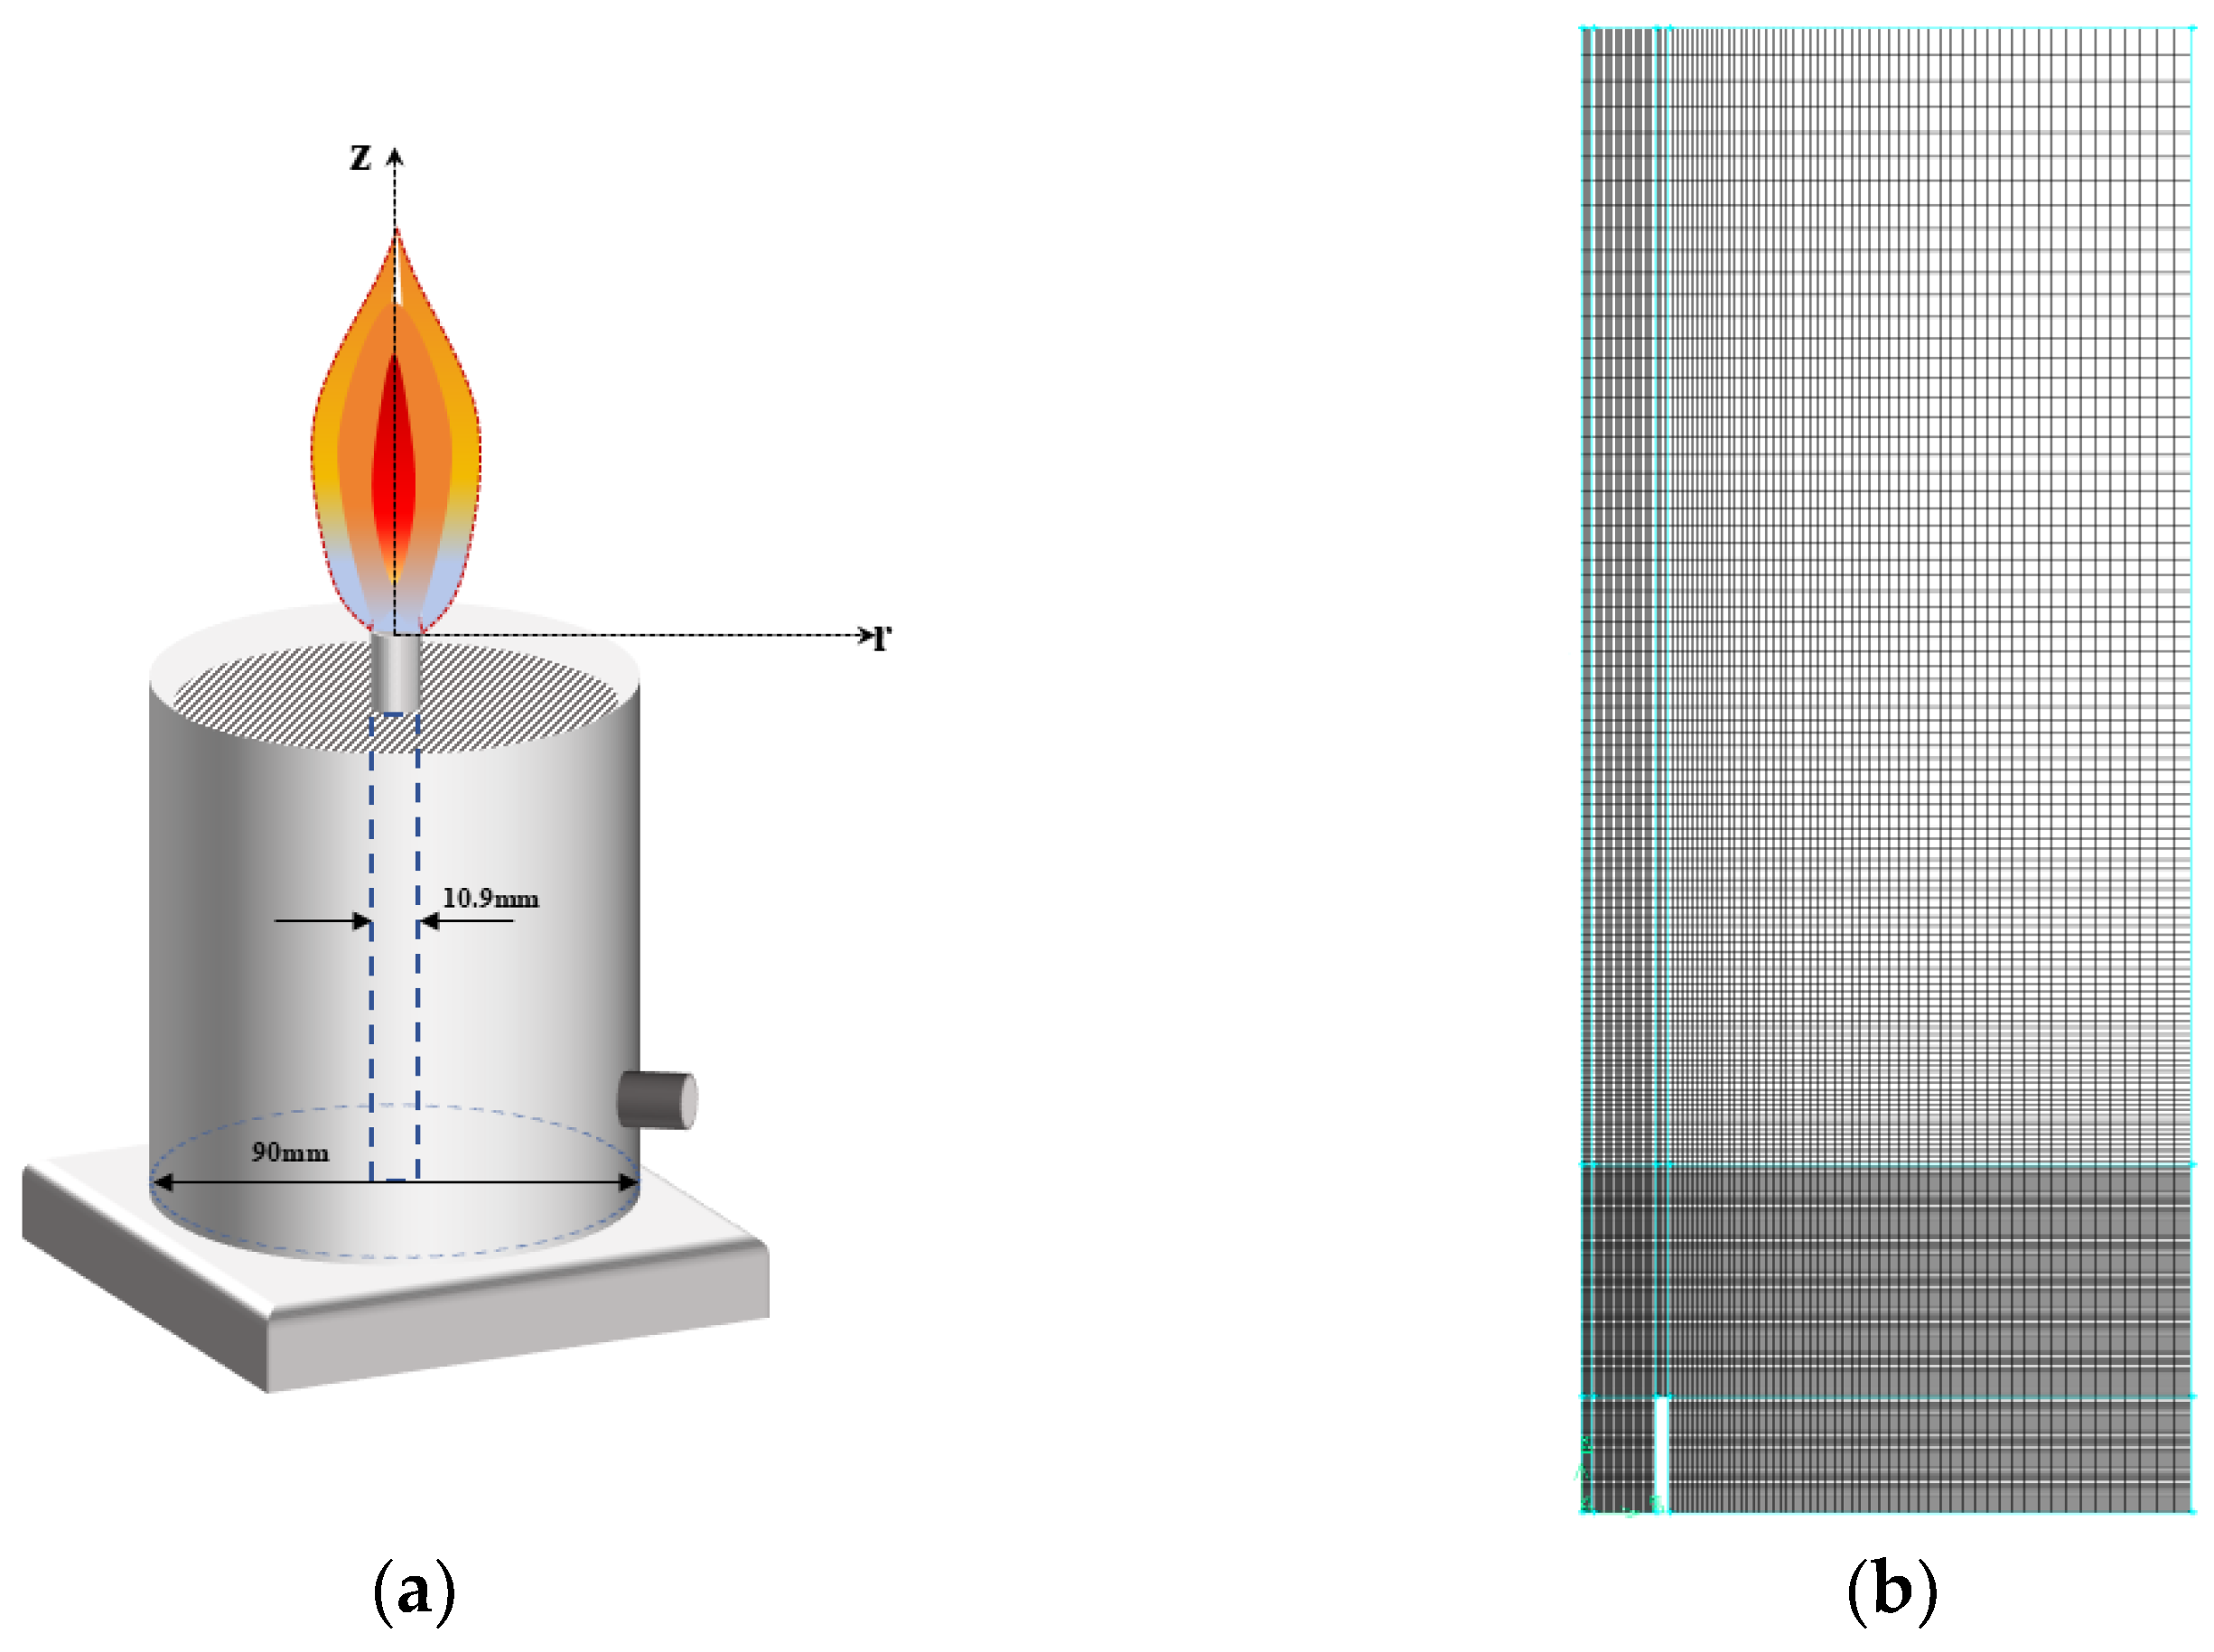
2.4. Numerical Simulation

The numerical simulations for laminar co-flow diffusion flames involving C3H8/(O2/CO2) and C3H8/(O2/H2O) mixtures were conducted using a computational domain structured to reflect the geometry of the actual Gülder burner. As illustrated in Figure 5, a two-dimensional axisymmetric domain was utilized to optimize computational efficiency and ensure accuracy of the simulation results. The domain has axial and radial dimensions of 118 mm and 45 mm. Furthermore, this is discretized into axial and radial control volumes of 194 and 88 mm, with total quadrilateral cells of 20,052. A structured grid with non-uniform spacing was used, focusing refinement in the main reaction area. Initially, a uniform fine grid with 0.2 mm spacing was used for the first 30 mm in the axial direction, followed by a gradual expansion with a factor of 1.0205 across 94 nodes. In the radial direction, the grid initially had a uniform spacing of 0.2 mm for the first 0.8 mm, followed by 19 evenly spaced nodes from 0.80 to 5.45 mm. The interval from 5.45 to 6.45 mm was divided into 4 nodes, with spacing gradually increasing on the gas side, utilizing a total of 61 equidistant nodes and an expansion factor of 1.025. To ensure accurate resolution of boundary layer phenomena, the computational domain extended 10 mm upstream of the fuel nozzle to better capture the fuel outlet velocity profile [26]. The quadrilateral mesh provided the geometric flexibility necessary for structured grid refinement while maintaining computational efficiency.
A grid independence study was conducted to validate the reliability and accuracy of the computational results. This analysis involved comparing the peak flame temperature profiles obtained using three different grid resolutions: a coarse grid with 10,026 cells, a medium grid with 20,052 cells, and a fine grid with 40,104 cells. These grids were systematically refined, particularly in the primary reaction zone where steep gradients in temperature and species concentrations are present.
The peak flame temperature, a critical indicator of combustion dynamics, was selected as the key metric for evaluating the grid sensitivity. The temperature distribution along the flame centerline of the propane axial diffusion flame in an air atmosphere was calculated for each grid resolution (see Figure 6). The medium and fine grids exhibited negligible differences in peak temperature values, with a relative deviation of less than 1%. In contrast, the coarse grid showed noticeable deviations, indicating insufficient resolution for capturing the combustion physics accurately. The findings confirmed that the medium grid with 20,052 cells provides a satisfactory balance between computational efficiency and result accuracy. Based on this validation, the medium grid was adopted for all simulations in this study.
For the boundary conditions, a velocity inlet was designated for both the fuel and accompanying gas inlets. The propane was introduced at a velocity of 1.96 cm/s, while the velocity of the accompanying gas varied depending on the specific working conditions, as detailed in Table 1. The side boundaries were treated as walls with an isothermal condition set at 300 K. To account for fuel preheating, the nozzle wall temperature was elevated to 400 K, while the outlet was maintained at 300 K with a pressure outlet condition, ensuring a smooth return at the outlet boundary. The chemical reaction mechanism used for the gas phase was GRI-Mech3.0, developed by the University of California, Berkeley, CA, USA, which was optimized for simulating the combustion of C1–C3 hydrocarbons and included a 219 elementary reaction with 36 species [27]. All simulations were conducted using ANSYS FLUENT 14.0, where the discrete ordinates (DO) radiation model was applied for radiation heat transfer calculations. The radiative properties of the gas and soot were determined using the weighted sum of the gray gasses model (WSGGM), as formulated by Smith et al. [28] Although the default WSGGM has limitations when applied to oxy-flames, the dominant mechanisms in this study, such as chemical kinetics and thermal effects, remain unaffected. This was verified by the consistent results observed in the experimental and numerical comparisons, as discussed in Section 3.1 and Section 3.2. The Moss–Brookes soot model was employed, which incorporates the polymerization of acetylene as the initial nucleation step for soot formation and utilizes acetylene to promote surface growth. This model effectively captures the soot nucleation, surface growth, and oxidation processes. For the numerical solution, a solver based on pressure–velocity coupling was used, specifically applying the SIMPLE algorithm to manage the coupling between pressure and velocity fields. Temperature monitoring was implemented to ensure stability; once the temperature reached equilibrium, the simulation results were considered converged. The simulation process began with a cold-state simulation, which was followed by the introduction of chemical reactions. To simulate ignition, a high-temperature area was established within the ethylene and oxygen cold mixing zone.
This study employed a distribution separation technique to distinguish the density, transport, thermal, and chemical effects of CO2 by incorporating multiple virtual species into the simulation model. The design conditions for different oxidant flow compositions, using CO2 as a reference, are presented in Table 2. Alongside the baseline conditions, four additional cases (3-2 through 3-5) were defined. In Case 3-2, the virtual species F1CO2 was introduced with identical thermal and transport properties to N2. Also, chemically inert and non-reactive F1CO2 mirrored the elemental composition of CO2 and has a greater molar mass than N2. Consequently, the oxidant’s mixing density exceeded that of the reference condition. The variation in calculation outcomes between Case 3-2 and Case 3-1 is thus attributed to the density effect of CO2. In Case 3-3, the virtual species F2CO2 was introduced, which has the same transport properties and elemental composition as CO2, but with the thermal properties of N2 and chemically inert. The difference in outcomes between Case 3-3 and Case 3-2 highlights the transport effect of CO2. Furthermore, in Case 3-4, the virtual species FCO2 replicates the thermal, transport properties, and elemental composition of real CO2 without engaging in chemical reactions. The thermal effect of CO2 is identified by comparing Case 3-4 with Case 3-3, whereas the chemical effect is determined by the difference between Case 3-5 and Case 3-4 reveals the chemical effect of CO2. Similarly, to isolate the effects of H2O, multiple virtual species were introduced, forming different oxidant flow compositions under similar design conditions, As shown in Table 3. Table 4 summarize the physical properties of the three diluents.

3. Results and Analysis
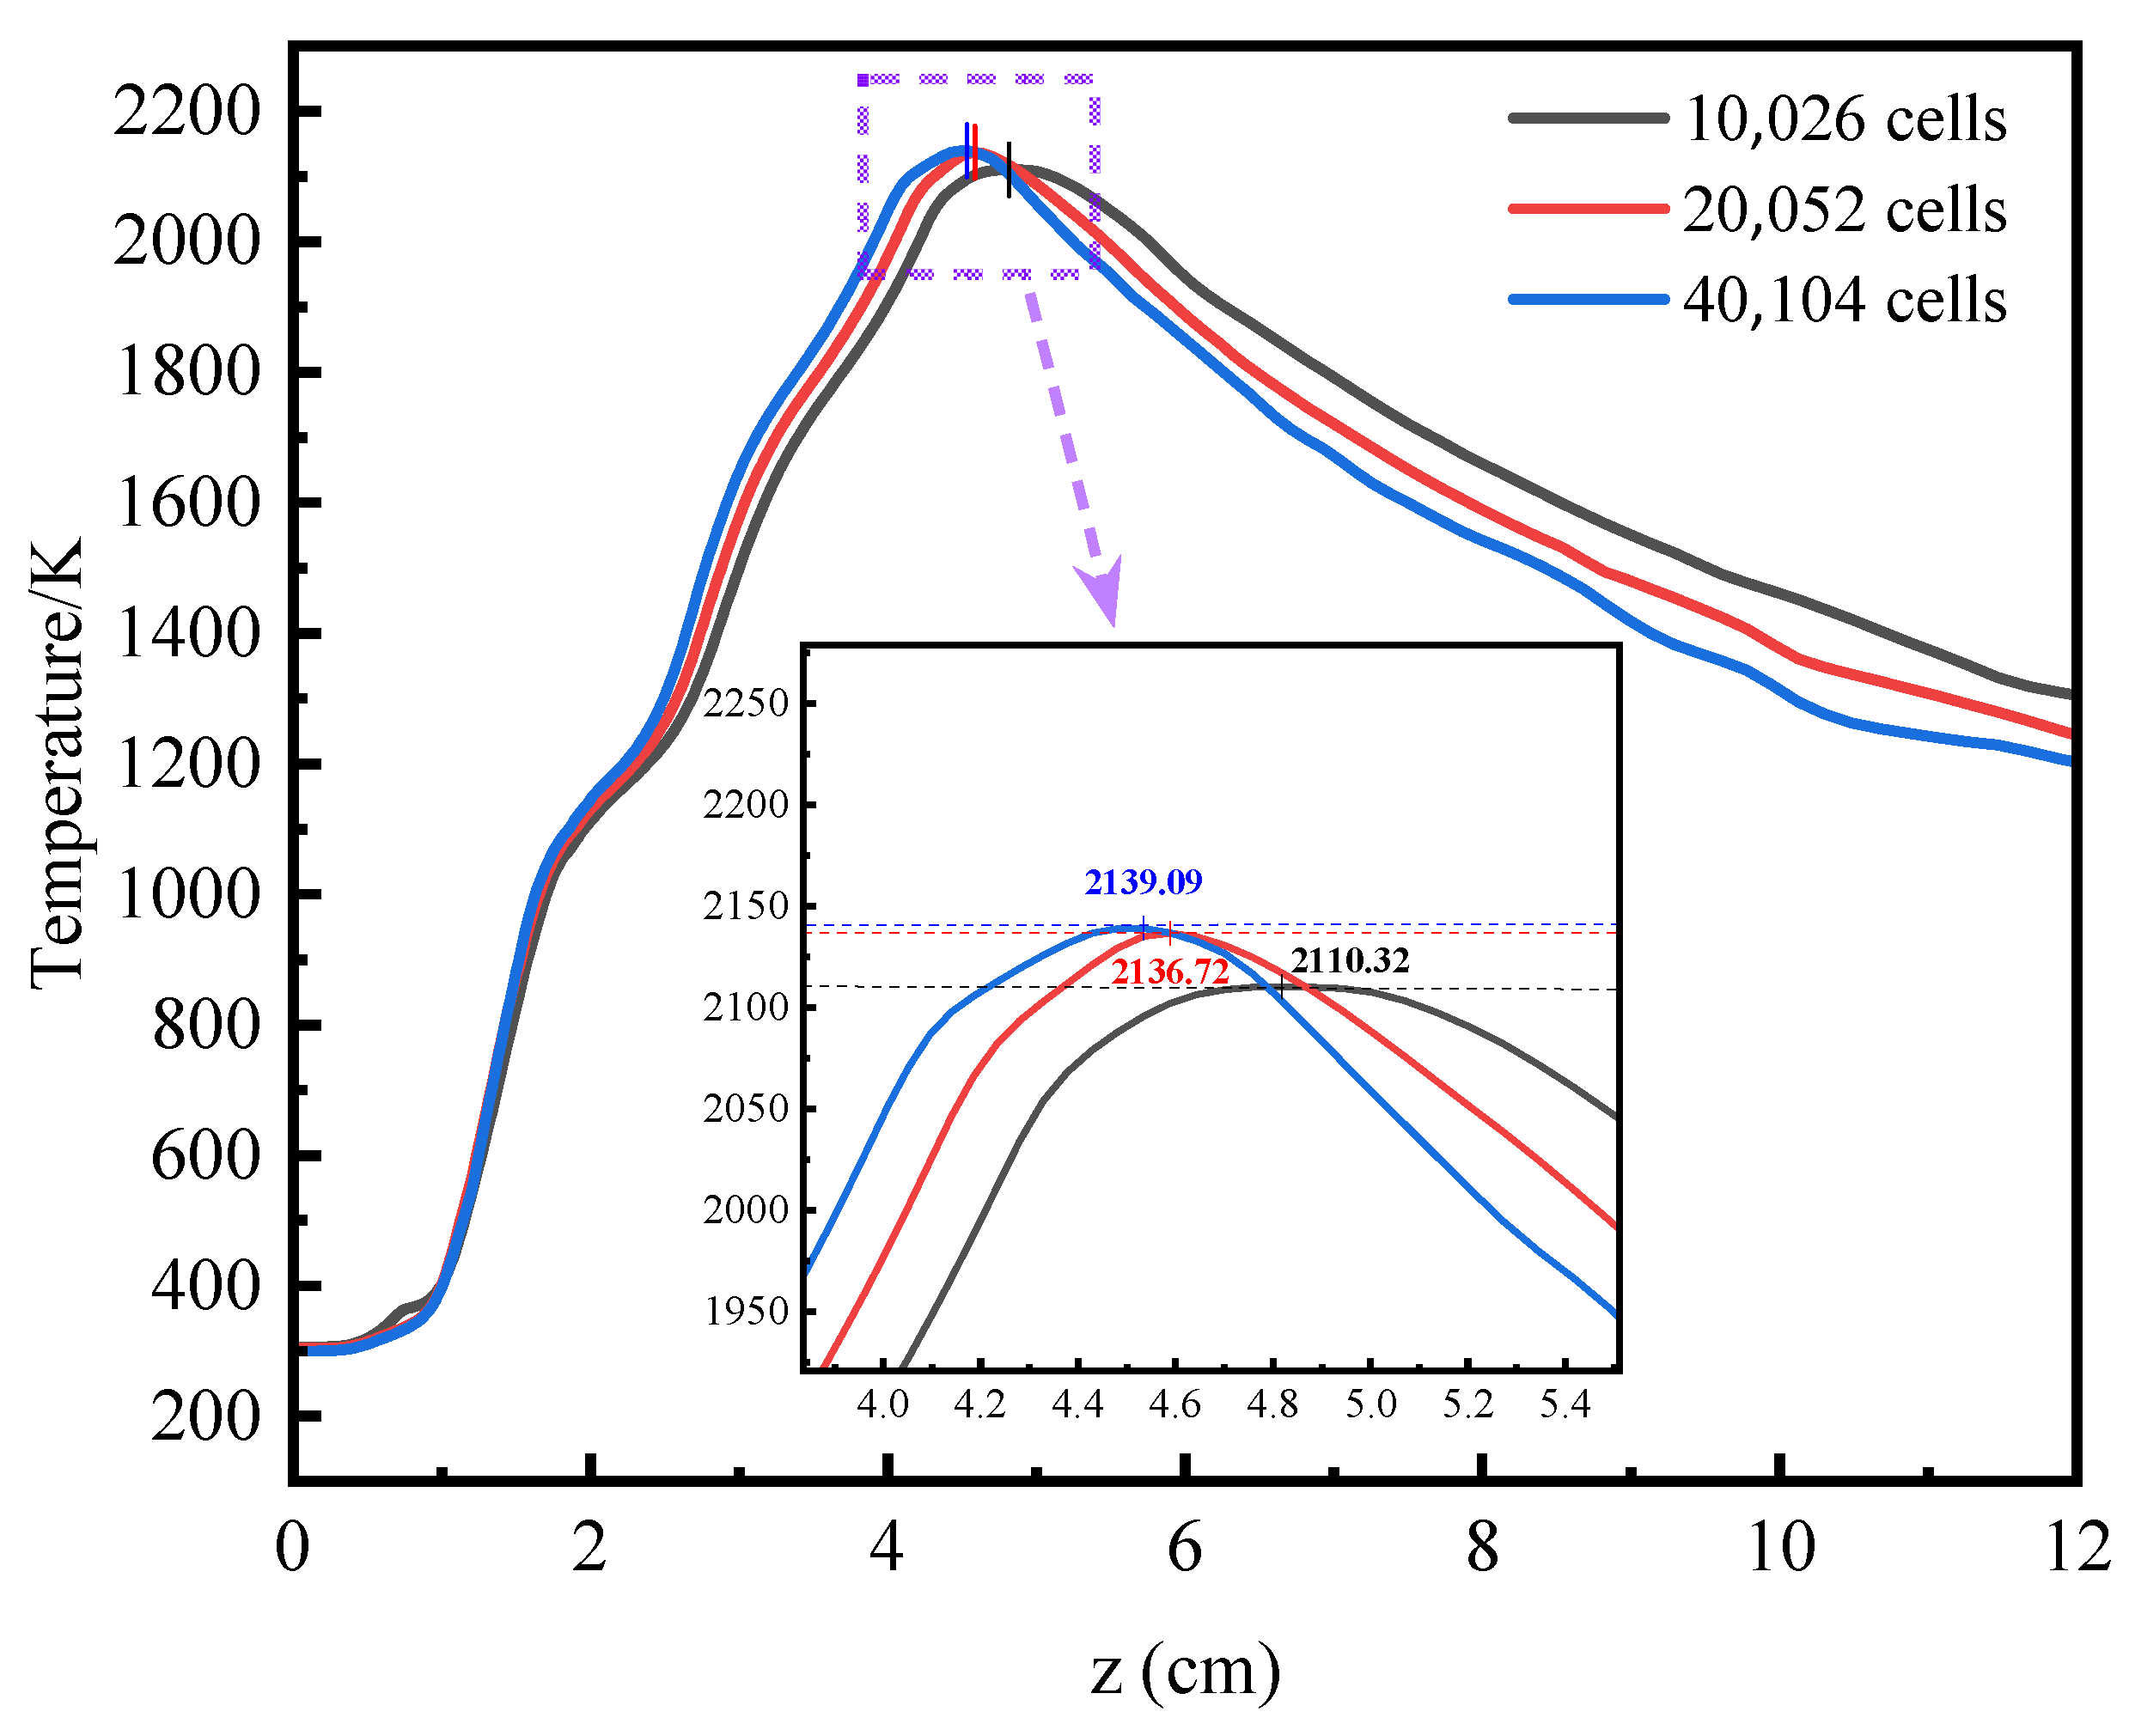
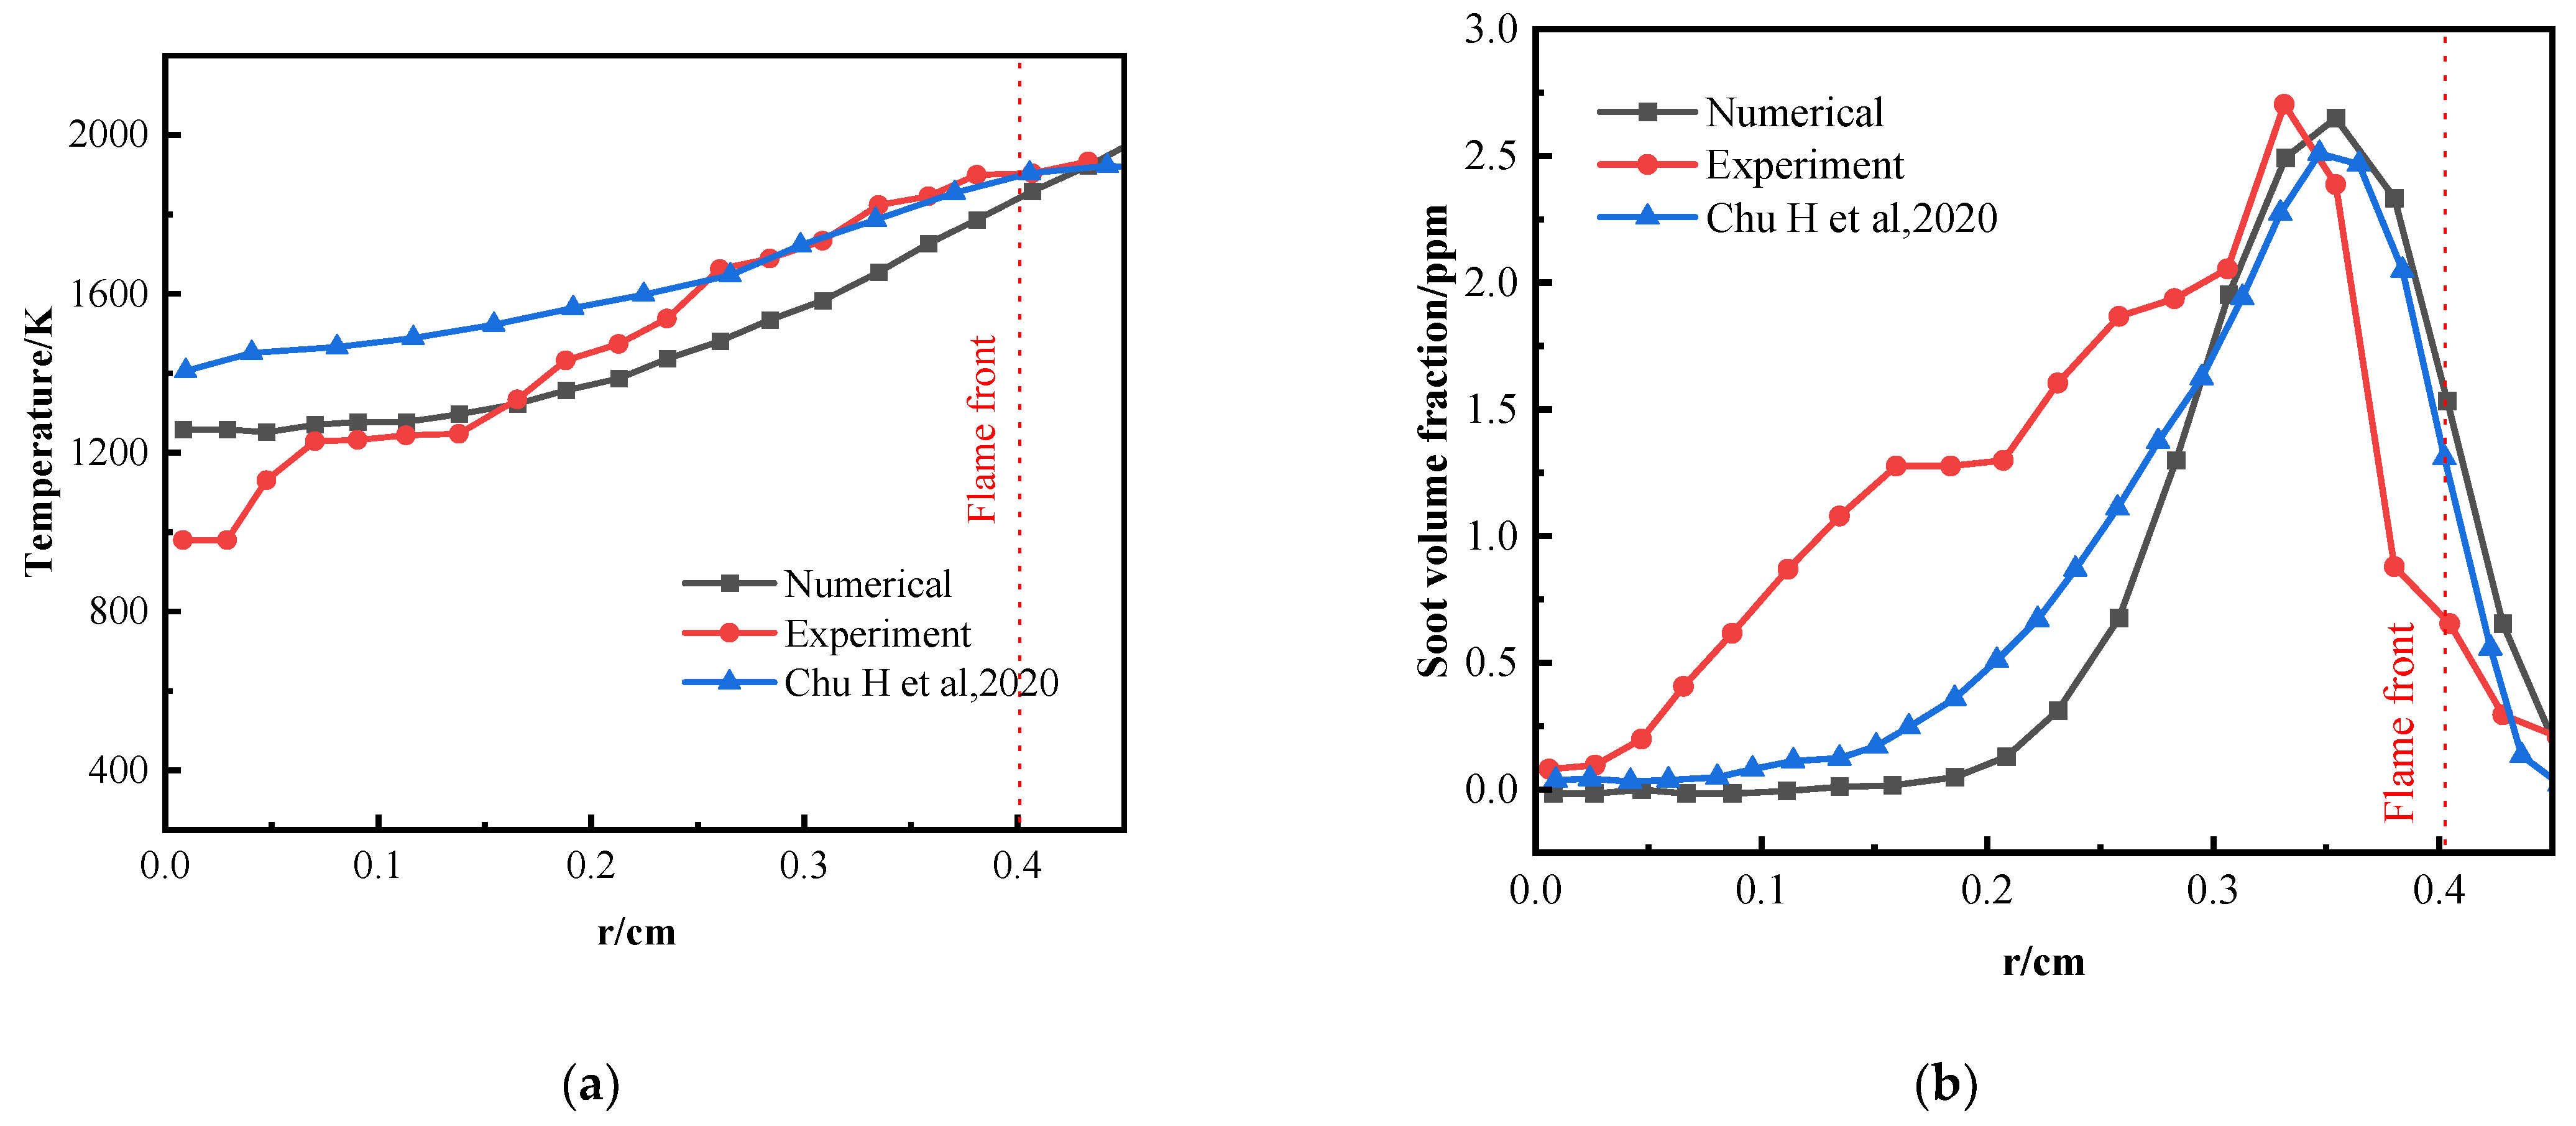
3.1. Verification

A comparative analysis was performed to validate the accuracy of the visible light imaging measurement technique, the reconstruction algorithm, and the numerical calculations. The reconstructed and numerically calculated results for propane combustion at oxygen concentrations of 21% and 25% were evaluated against the experimental data presented by Chu et al. [29]. This comparison serves to verify the reliability of the methods and algorithms employed in the study. The experimental conditions and numerical calculations for Case 2 and Case 3 largely align with those reported in the previous literature, with the primary distinction being the different oxidant flow rate settings used in this study. However, given that the oxidant flow rate has a negligible impact on the overall characteristics of conventional diffusion flames, the soot volume fraction (SVF) and temperature distribution in Case 2 and Case 3 can still be reliably compared with other technical measurement results. At a flame height of 30 mm, Figure 7 and Figure 8 illustrate the radial distribution of temperature and SVF. The experimental measurements and numerical calculations for Case 2 and Case 3 exhibit trends consistent with those reported in the literature, confirming the effectiveness of the measurement method and numerical approach in accurately capturing the SVF and temperature distribution in the diffusion flame. Although radiative heat transfer can contribute significantly to the energy balance, the close agreement between experimental and simulated peak SVF and temperature values suggests that the key conclusions of this study are primarily influenced by chemical kinetics and thermal mechanisms. The potential uncertainties in radiative heat transfer calculations, due to the default WSGGM, do not significantly alter the observed trends in soot formation and temperature distribution. Measurement noise near the flame’s center axis during the experimental process causes minor unevenness in SVF and temperature distributions. While the experimentally predicted peak SVF area at the two wings is marginally closer to the flame center axis compared to the numerical predictions, the predicted peak SVF and peak temperature are closely aligned. To further substantiate the accuracy of the numerical model, Table 5 provides an error analysis of the peak temperature and peak SVF values. The table demonstrates that the numerical predictions are within acceptable error margins, further validating the reliability of the numerical calculations and reconstruction algorithm employed in this study.

3.2. Numerical and Experimental Comparisons

Figure 9 shows the visual images of propane flames in an O2/N2 atmosphere, illustrating the flame characteristics at different oxygen concentrations (19%, 21%, 25%, 29%, and 33%). The figure reveals that, under a constant propane flow rate, increasing the oxygen concentration from 19% to 33%, with a co-flow gas total flow rate of 40 L/min, causes the flame height to decrease significantly from 82 mm to 39 mm, marking a reduction of 52.4%. The most pronounced change occurs when the oxygen concentration rises from 21% to 25%, resulting in a decrease in flame height from 72 mm to 58 mm, a reduction of 19.4%. As the oxygen concentration increases, the flame’s brightness intensifies, shifting from a dark yellow hue to a bright white. This change in thermal radiation characteristics is indicative of the higher emissivity of soot particles compared to gasses, which enhances the flame’s radiative heat transfer. Even a small amount of soot can emit a strong yellow light, consistent with the phenomena observed by Chu et al. [29] in a C3H8/(O2/N2) atmosphere. As oxygen concentration rises, the dark shadow area at the flame’s lower part diminishes, which shows that increased oxygen levels promote soot formation.
Due to the inability of experimental methods to capture the detailed processes of soot formation, numerical simulations were employed for a more in-depth analysis. Based on both experimental measurements and numerical simulations, Figure 10 and Figure 11 present the two-dimensional distribution of soot volume fraction distribution in a C3H8/(O2/N2) flame, derived from experimental measurements and numerical simulations. Comparing these results reveals that both methods produce consistent distribution areas. Both approaches predict that the peak soot concentration occurs in the annular regions of the flame wings. Nevertheless, the numerical simulation forecasts the soot peak at a lower axial position compared to the experimental observations. This discrepancy may be due to the numerical simulation’s inability to accurately capture the soot concentration along the flame’s centerline. The likely cause of the variance is the intrinsic limitations of the soot model and the sensitivity of the current two-color measurement method. The difference may be due to the absence of polycyclic aromatic hydrocarbon (PAH) formation pathways in the simulation, which are crucial for the formation of soot [30]. The comparison of temperature distributions, as illustrated in Figure 12 and Figure 13, reveals that the high-temperature regions are primarily concentrated in the wings of the flame. The peak flame temperature of the C3H8/(O2/N2) mixture rises significantly with increasing oxygen concentration. This increase can be attributed to the higher mole fraction of O2 in the co-flow gas, which enhances the flame’s capacity to entrain O2. As a result, there is a greater production of reactive free radicals such as O and OH, which in turn accelerates the combustion reactions occurring downstream [31].
Figure 14 depicts the rates of soot mass nucleation and surface growth in both O2/N2 and O2/CO2 environments. Higher oxygen concentrations enhance soot formation by increasing nucleation and surface growth rates. A notable decrease in soot nucleation and surface growth rates is evident when comparing O2/N2 and O2/CO2 atmospheres with identical O2 concentrations, underscoring CO2’s suppressive effect. The observed suppression of soot formation in CO2-rich atmospheres can be attributed to several plausible mechanisms: (1) CO2 likely acts as a thermal buffer due to its high specific heat capacity, which reduces flame temperatures and consequently limits the thermal decomposition of fuel into soot precursors. (2) CO2 may participate in chemical interactions that consume intermediate hydrocarbon species, thereby decreasing the availability of key precursors for soot nucleation and growth. (3) the radiative properties of CO2 could enhance heat losses from the flame, further diminishing soot formation processes. From an environmental perspective, reducing soot nucleation and growth can lower particulate matter emissions, a major contributor to air pollution and adverse health effects. Additionally, replacing N2 with CO2 in oxidizing atmospheres may support the development of sustainable combustion strategies, particularly in applications such as carbon capture and storage (CCS), where CO2 is recycled or sequestered. These findings suggest that CO2 addition offers a promising approach to achieving cleaner and more efficient energy production.

3.3. Impacts of CO2 Addition: Combustion Sensitivity Analysis

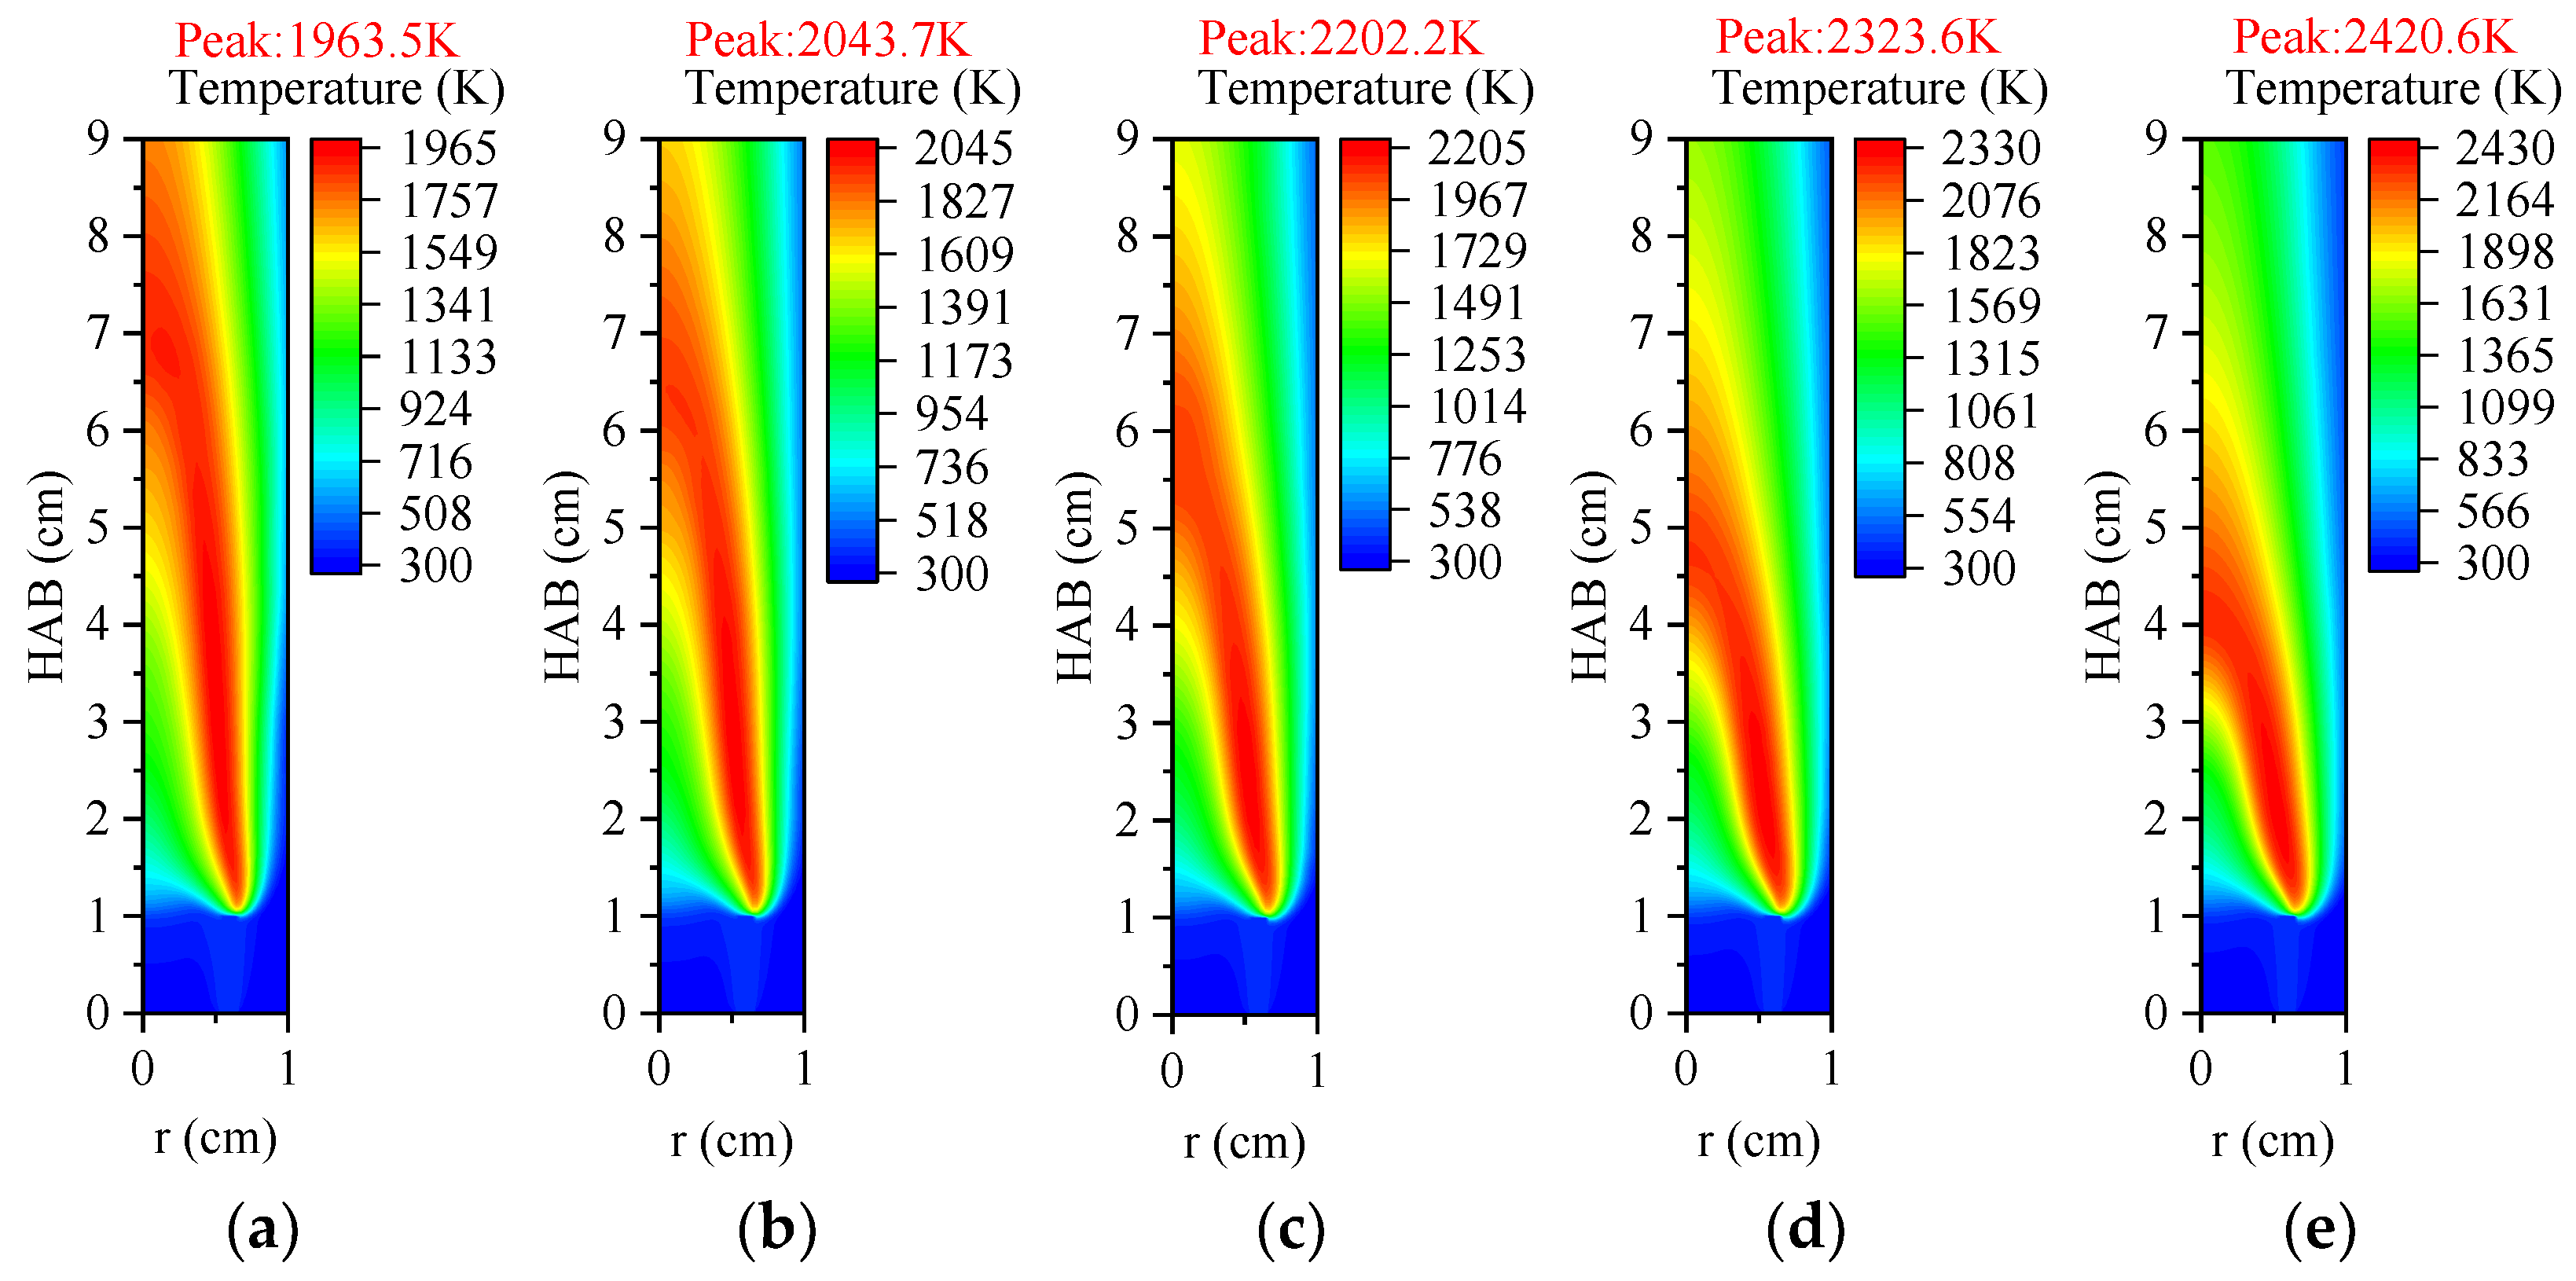
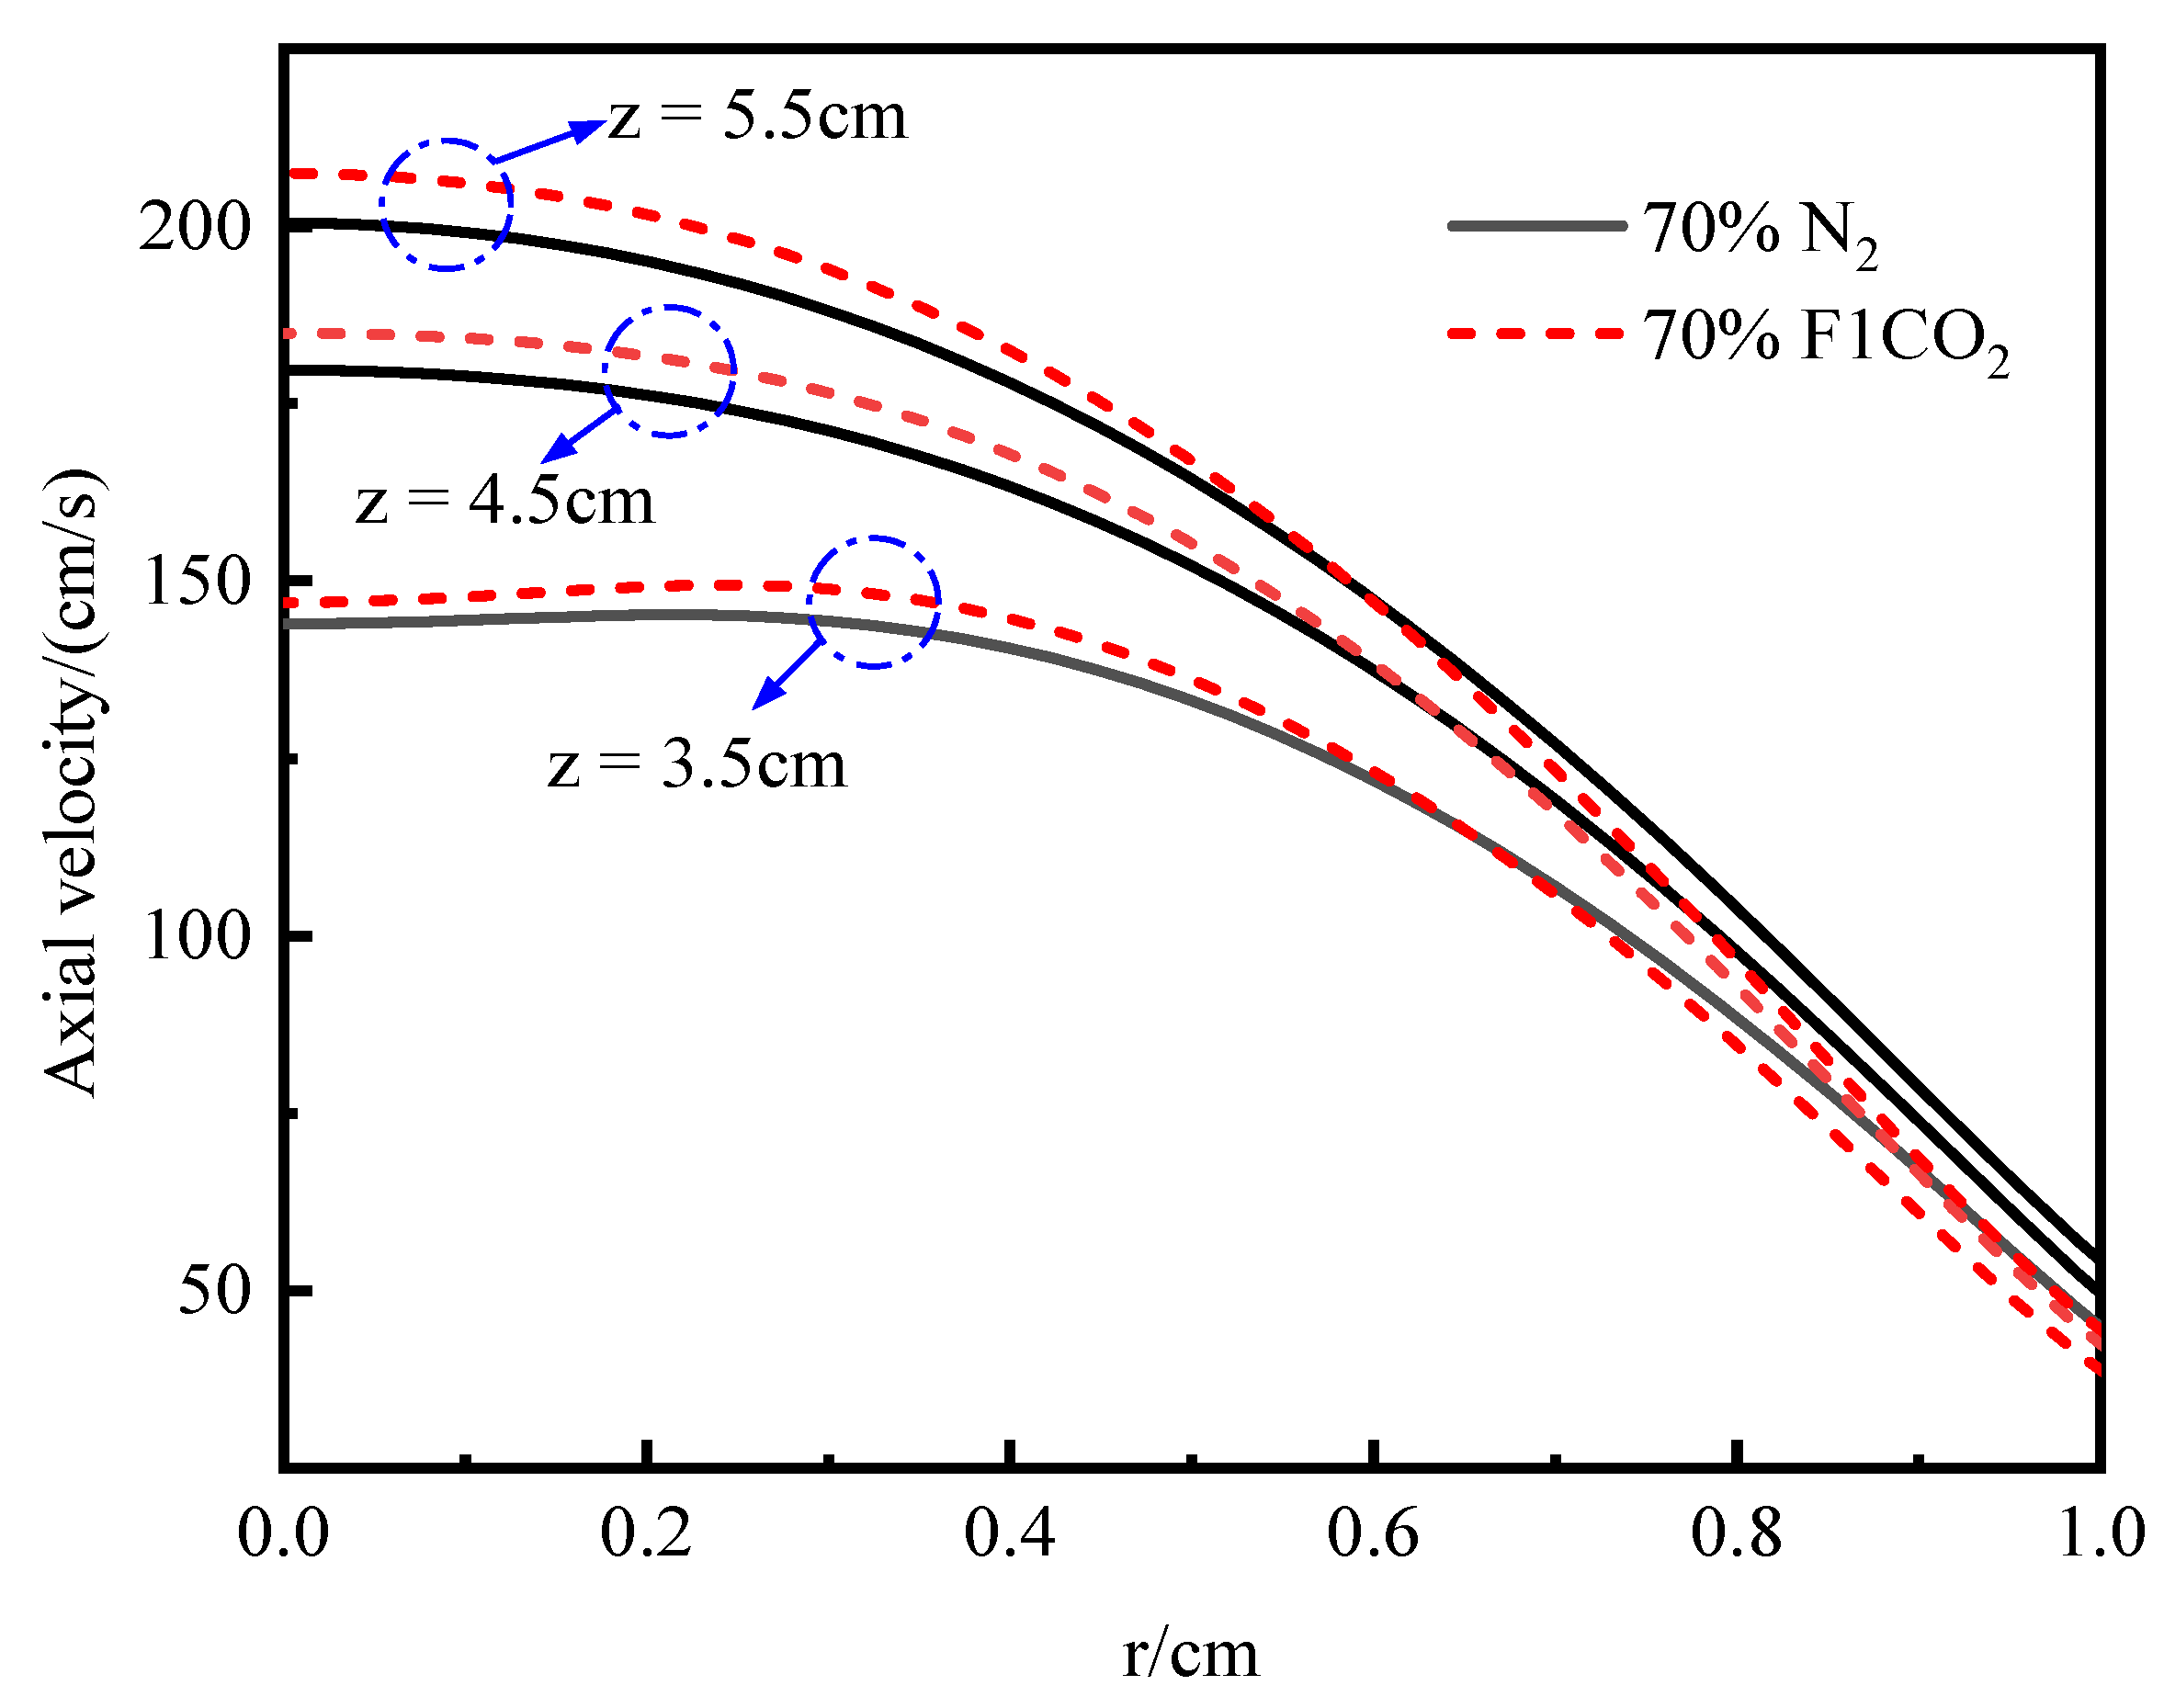
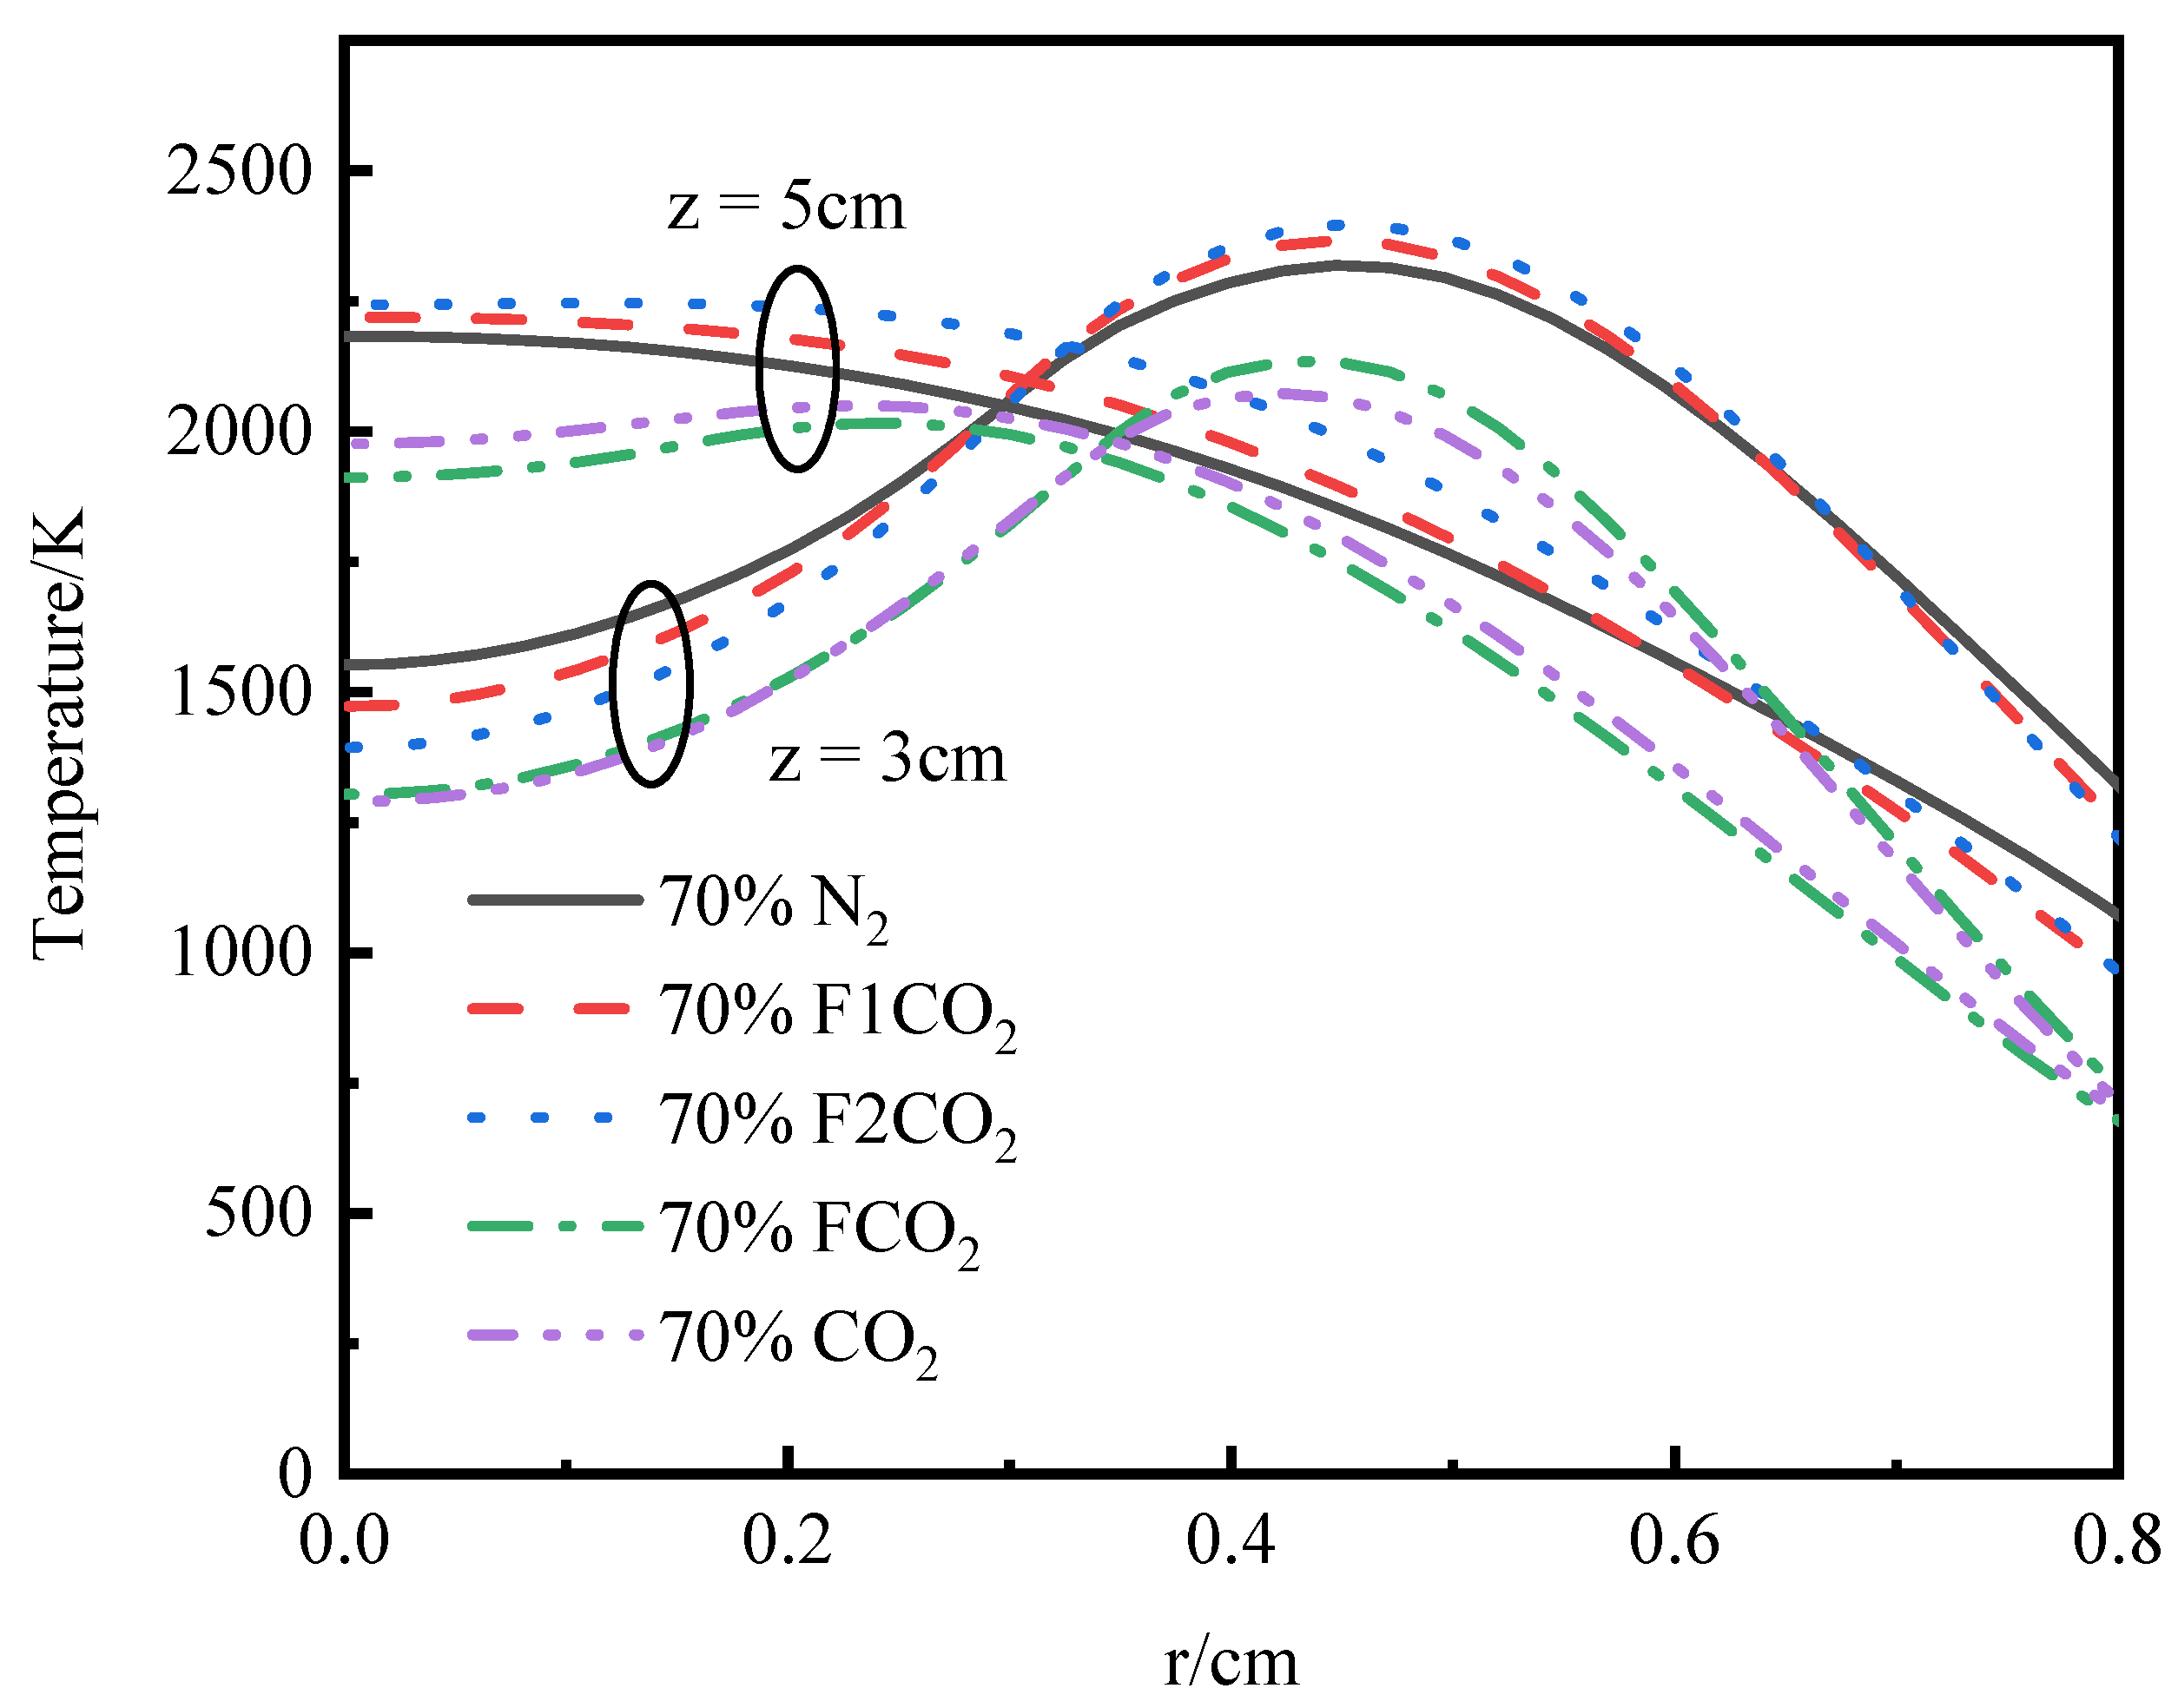
3.3.1. Temperature and Axial Flow Velocity

Figure 15 and Figure 16 present the two-dimensional temperature distributions and central axis temperatures under different conditions to examine the effect of CO2. As shown in Figure 15, the temperature variations are predominantly influenced by the thermal effect of CO2, which is due to its higher heat capacity. Subsequently, the chemical and density effects contribute to the temperature variations, whereas the transport effect has a minimal influence on the overall temperature distribution, typically leading to a modest increase in flame temperature. These results align with the findings reported by Mahmoud et al. [32] which examined the impact of CO2 dilution on n-heptane co-flow diffusion flames in oxygen-rich conditions. Moreover, when CO2 is substituted with FCO2, a noticeable increase in peak temperature occurs, indicating that the influence of chemical interactions from CO2 significantly lowers the peak temperature. This observation also aligns with the conclusions of Wang et al. [33] from their experimental and numerical analysis of soot formation in a laminar co-flow H2/C2H₄ diffusion flame under O2/CO2 conditions.
Figure 16 illustrates that, with flame heights under 6 cm and a constant outlet velocity, the axial velocity of the flame is greater in the atmospheres of O2/N2, relative to O2/CO2. This difference is primarily due to the temperature reduction resulting from the thermal and chemical effects of CO2.
The influence of CO2’s density on velocity and temperature fields is examined by analyzing the radial distribution of axial velocity at different heights above the burner, as illustrated in Figure 17. Near the flame axis, the axial velocity for Case 3-2 (with 70% F1CO2) is marginally higher than in the reference Case 3-1. For positions beyond 0.6 cm from the flame axis, the axial velocity in Case 3-2 is marginally less than in Case 3-1. This difference is due to the higher molar mass of F1CO2 (44.009 g/mol) compared to N2 (28.013 g/mol), resulting in a denser co-flow gas in Case 3-2. In the oxidant region, the increased density away from the reaction zone reduces the mixture’s buoyancy, resulting in a reduced axial velocity. Additionally, the extended mixing time between the fuel and oxidant enhances combustion intensity, leading to an increase in flame temperature.

3.3.2. OH Radical Distribution and Flame Height

Lee’s soot oxidation model highlights OH radicals as key oxidants in combustion, representing the fragmentation state within a flame [34]. Figure 18 illustrates the two-dimensional distribution of OH radical mole fractions under various calculation conditions. The results reveal that OH radicals are predominantly located in the flame’s wings, with peak concentrations occurring less than 2 cm above the burner outlet. The effect of CO2 on the distribution of OH radicals mirrors its impact on the temperature distribution, suggesting that OH concentration serves as a reliable combustion intensity indicator. When O2/CO2 is present in the atmosphere, the peak mole fraction of OH is noticeably lower than when O2/N2 is present. Specifically, CO2 reduces the peak OH mole fraction by 37.4% due to its thermal effect, relative to 22.0% due to its chemical effect. Conversely, CO2 raises the peak OH concentration by 9.6% and 3.1%, respectively. Although CO2’s density and transport effects slightly elevate OH concentrations, its thermal and chemical impacts cause a substantial decrease.
Flame height can be defined in a variety of ways, with some researchers describing it as where the temperature reaches its maximum value along the flame centerline [13,16,35]. Using this definition, Figure 19 illustrates the impact of various CO2 effects on flame height. The increased axial velocity in the reaction zone, due to CO2’s density effect, allows the flow to travel a greater distance within the same residence time. The transport effect of CO2 also results in a taller flame height, which occurs because the binary diffusion coefficient of CO2O2 mixtures is less than that of N2-O2 mixtures. As a result, CO2’s transport properties replace those of N2 in the oxidant, reducing oxygen diffusion and requiring a higher flame position for complete combustion. Also, the thermal effect of CO2 increases flame height, possibly due to CO2’s high specific heat capacity, which absorbs more heat, reduces combustion intensity, and consequently raises flame height. This phenomenon aligns with the reduced combustion intensity associated with lower OH concentrations. In addition, CO2 contributes chemically to an increased flame height and diminished combustion intensity, as illustrated by the OH distribution in Figure 18.

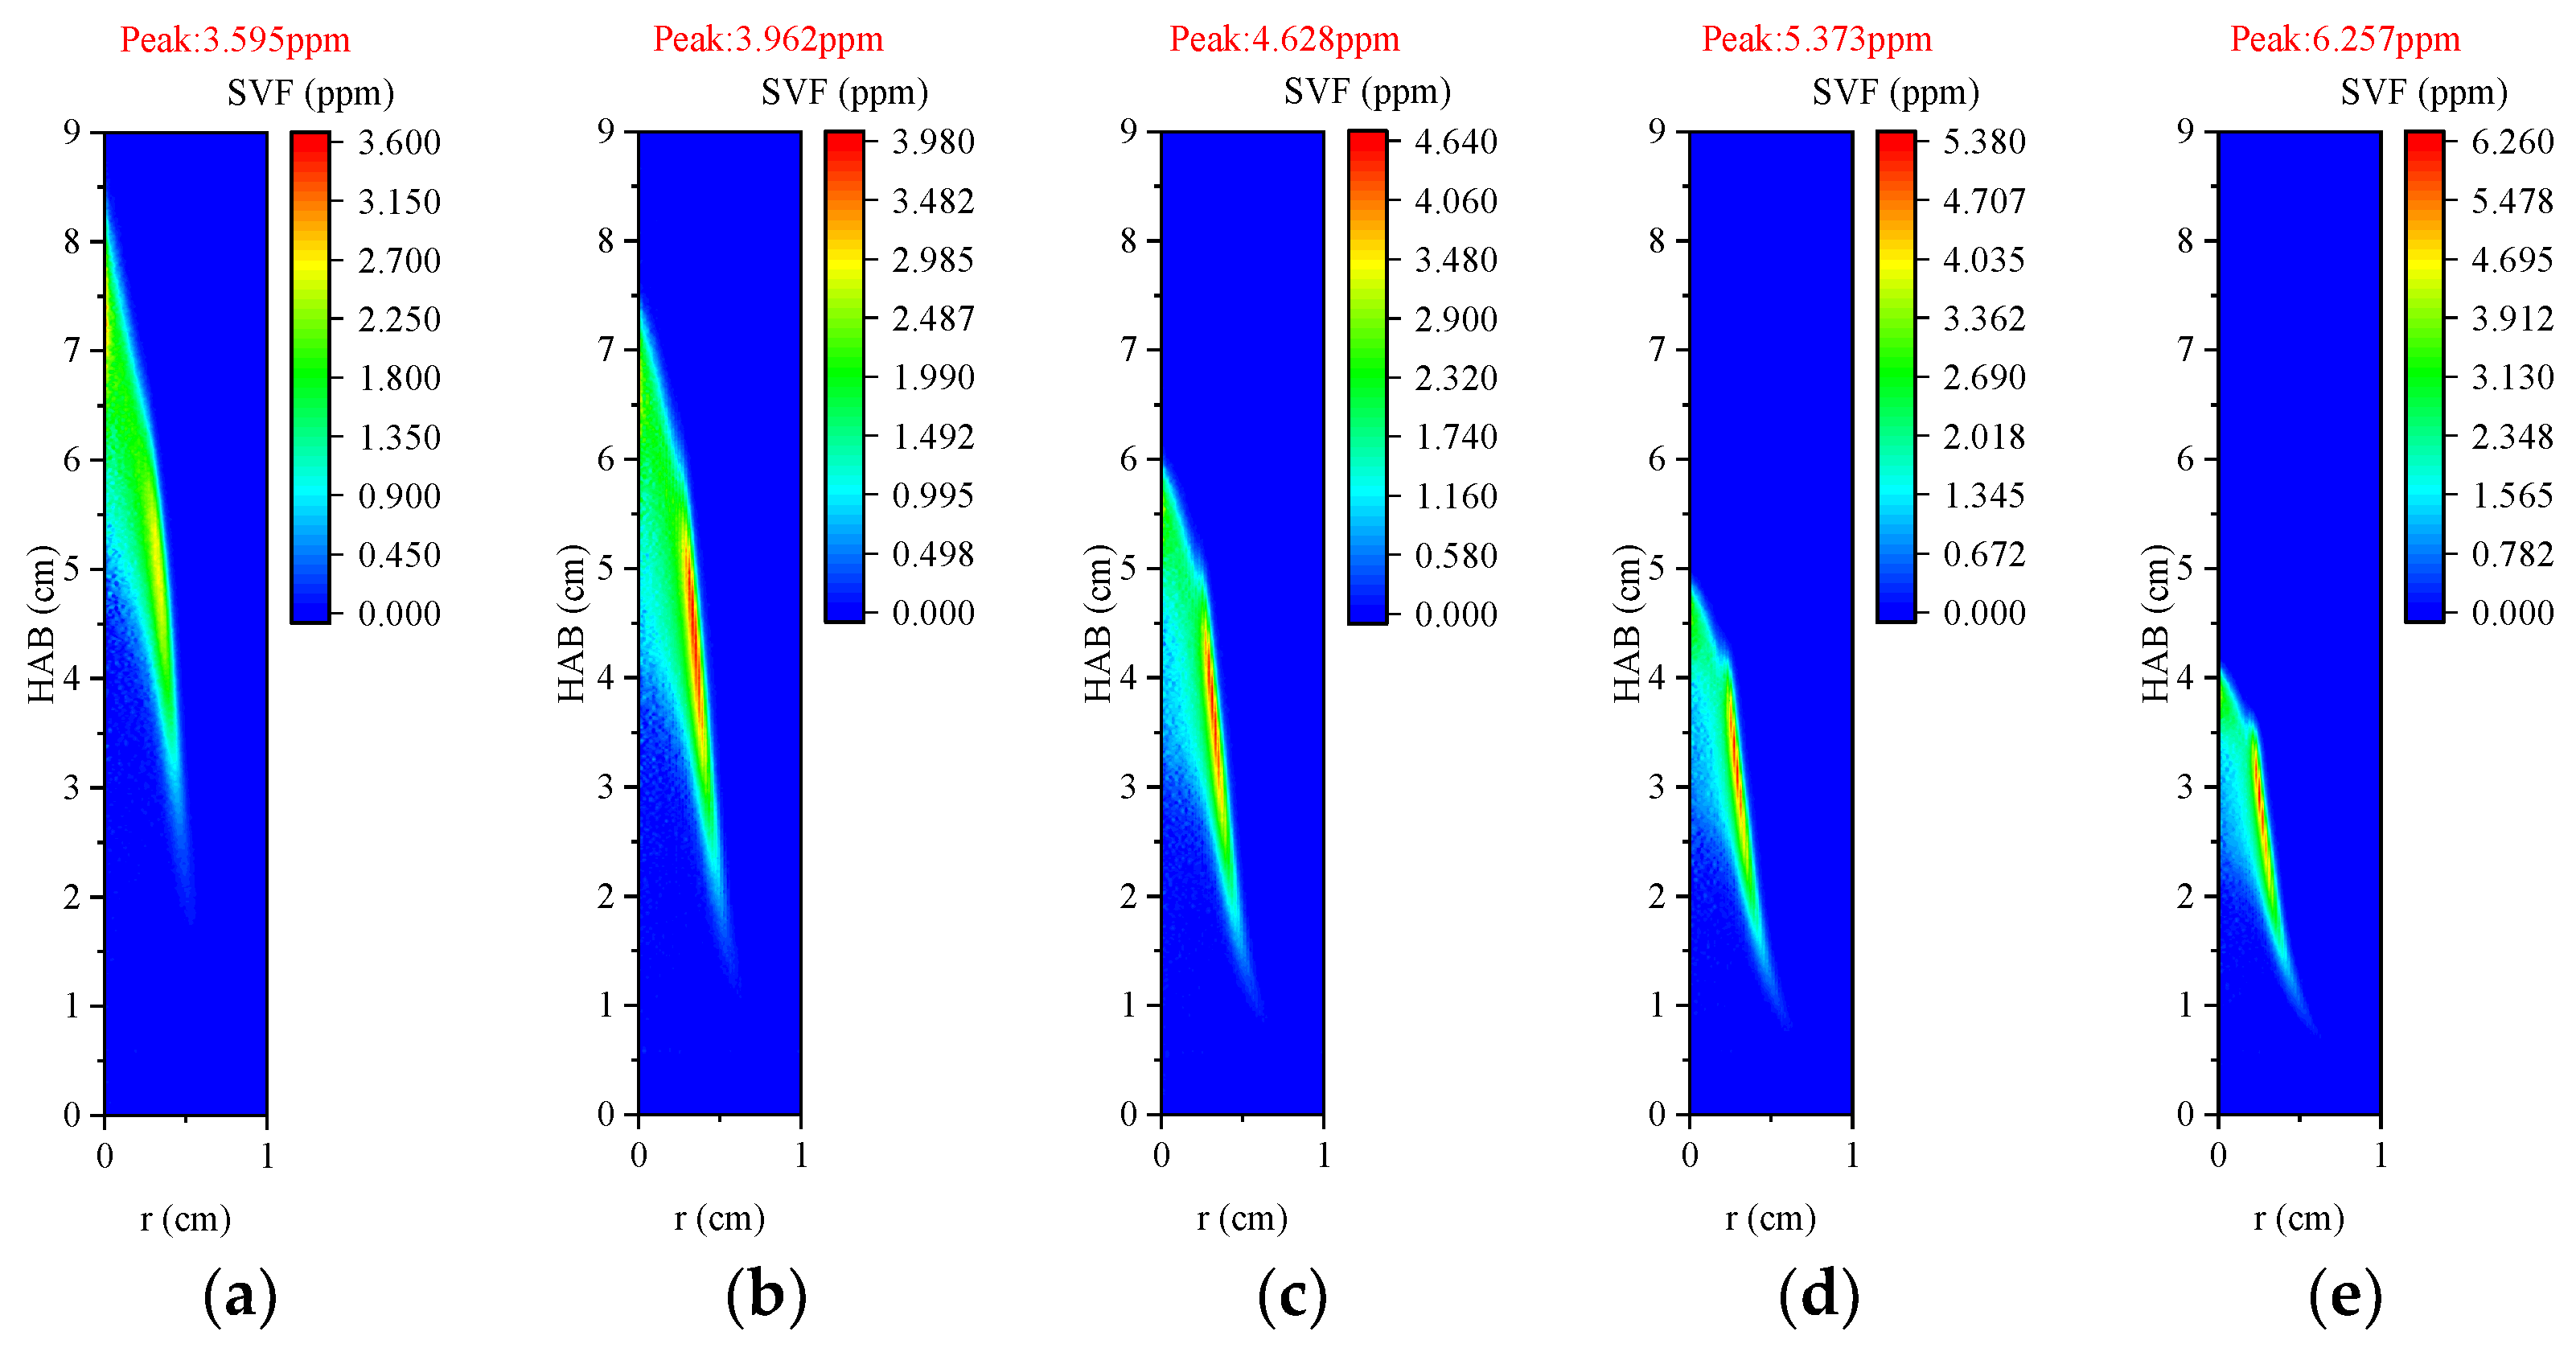
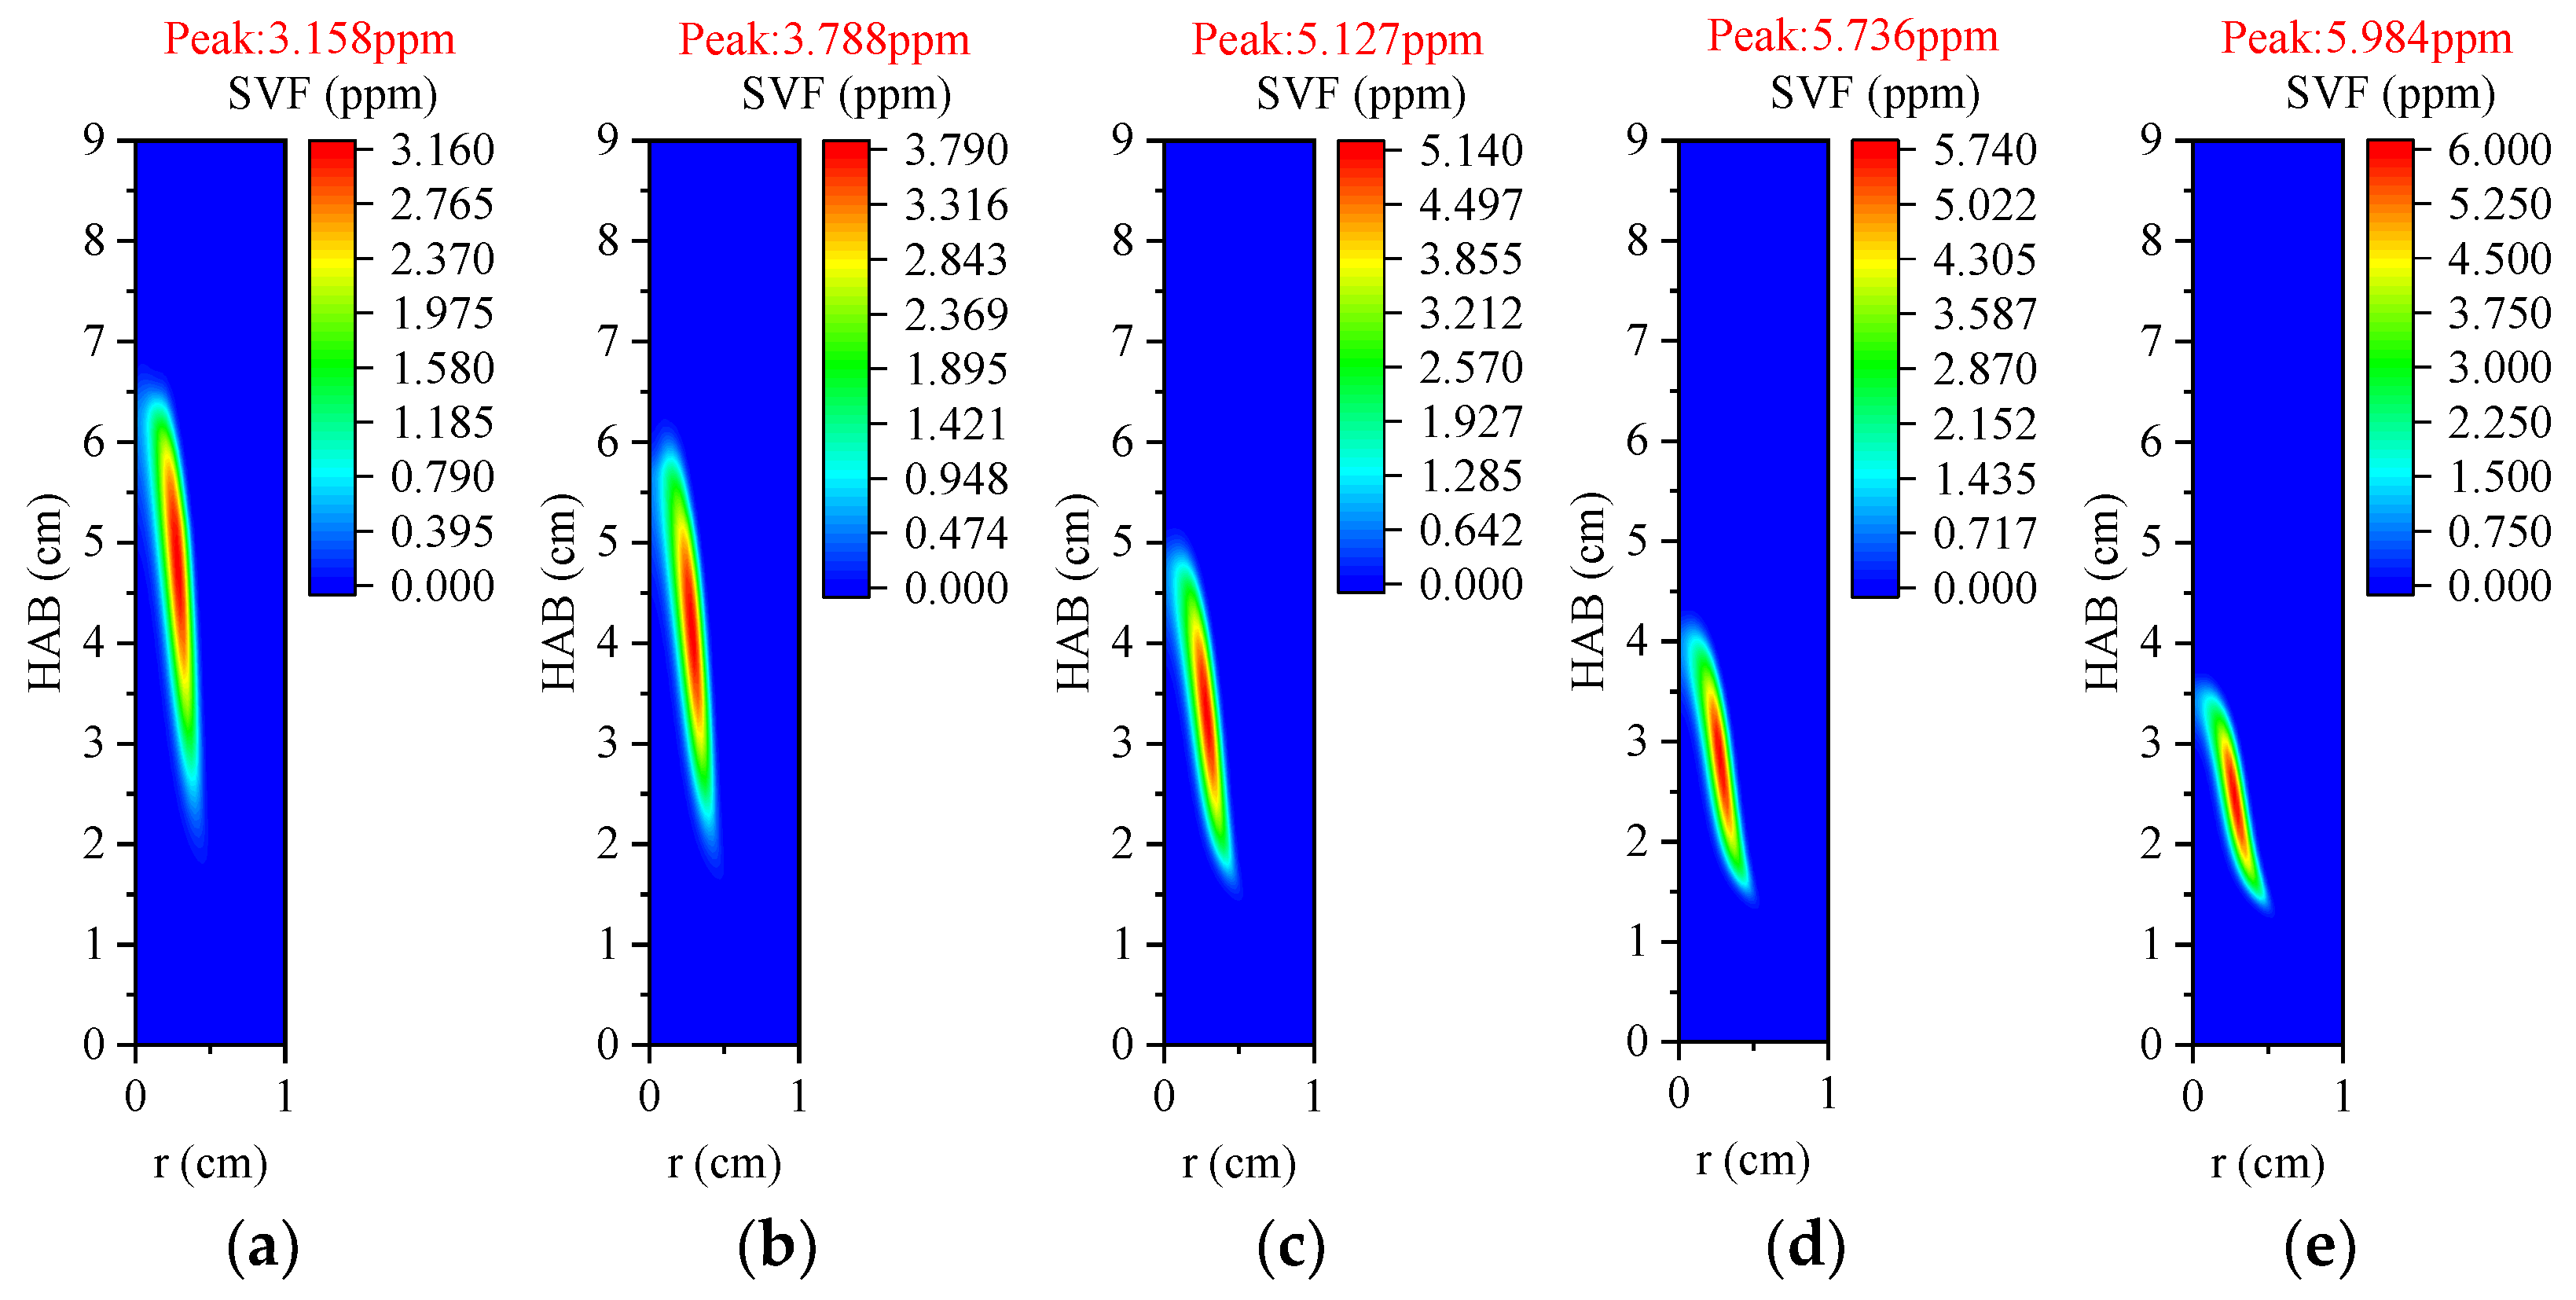
3.3.3. Volume Fraction of Soot

Figure 20 presents the distribution of soot volume fraction in two dimensions, with soot mainly concentrated along the flame’s wings. By defining the visible flame height as the centerline position where soot disappears [36], we can evaluate how the density, transport, thermal, and chemical effects of CO2 affect the visible flame height.
Based on the results, CO2 has the most significant thermal impact. The flame height measured at 4 cm in an O2/N2 atmosphere, increasing to 4.2 cm and 4.4 cm under the influence of density and transport effects, respectively, and reaching approximately 5 cm due to the thermal effect. However, the chemical effect results in a flame height of approximately 4.7 cm. While CO2 moderately inhibits soot formation, this effect is less pronounced compared to its chemical influence. Soot formation is primarily influenced by CO2 through the reaction OH + CO ⇋ H + CO2. While some researchers argue that high concentrations of CO2 enhance soot oxidation by increasing the reverse reaction rate of this elementary reaction and boosting OH radical concentration, others suggest that the primary mechanism is a reduction in H radical concentration [37].
Soot formation is primarily governed by the nucleation of soot particles at the early stages of combustion. This process plays a critical role in determining the density of primary soot particles, even though its contribution to the total soot mass is relatively smaller compared to surface growth [13]. Consequently, nucleation is crucial to the whole process of soot formation, since it dictates the initial surface area available for subsequent surface growth. Figure 21 illustrates the impact of various CO2 effects—thermal, chemical, density, and transport—on the nucleation rate, surface growth rate, and oxidation rate of soot. It can be seen that while the transport effect specifically reduces the oxidation rate, the other effects exhibit similar influences across the nucleation, surface growth, and oxidation stages. The consistency between these processes emphasizes the complex interplay between them and highlights the nuanced role that CO2 plays in modulating the overall dynamics of soot formation.
The study examined the impact of CO2 on soot mass nucleation, surface growth, and oxidation rates at various burner heights by analyzing the radial distributions of temperature, acetylene (C2H2) concentration, and the mole fractions of H and OH radicals, (see Figure 22, Figure 23, Figure 24 and Figure 25). According to the soot formation model, nucleation is primarily initiated by the condensation of C2H2, making the initiation rate highly sensitive to temperature and C2H2 concentration. Figure 22 presents the radial temperature distributions at 3 cm and 5 cm above the burner under varying CO2 effects. The addition of CO2 alters the flame temperature through a combination of density, chemical, and thermal effects. At 3 cm, in the lower flame region, the high specific heat capacity of CO2 induces a pronounced thermal buffering effect, leading to a significant reduction in flame temperature. This reduction is further intensified by radiative heat losses and chemical interactions between CO2 and intermediate hydrocarbon species, including C2H2, which suppress exothermic reactions that typically sustain higher temperatures. Additionally, the proximity to the burner introduces localized flow disturbances, contributing to a more uneven temperature distribution at this height. At 5 cm, the flame enters a more stable development phase, where convective heat transfer plays a dominant role, facilitating a more uniform redistribution of thermal energy across the radial profile. This stabilizing effect results in a smoother temperature distribution and reduces the influence of CO2 observed at lower heights. When combined with the findings in Figure 21, it becomes evident that the CO2-induced temperature reduction at lower flame heights significantly diminishes soot nucleation rates, as these rates are highly dependent on temperature and C2H2 availability. The surface growth of soot particles, primarily influenced by the condensation of PAHs and the incorporation of C2H2, is likewise impacted by these thermal conditions. The temperature, C2H2 concentration, and H radical availability are key factors influencing the contribution of C2H2 to surface growth. The thermal effect of CO2 reduces the radial temperature in the lower flame region, thereby further inhibiting soot surface growth.
The effects of CO2 on the radial distribution of acetylene (C2H2) concentration vary with flame height as shown in Figure 23. The chemical effect of CO2 is particularly significant, leading to a marked reduction in C2H2 concentration within the lower regions of the flame. Even though the C2H2 concentration in a C3H8/(O2/CO2) atmosphere is higher than in a C3H8/(O2/N2) atmosphere, the chemical effect of CO2 continues to inhibit the C2H2 concentration at z = 3 cm. The chemical properties of CO2 exert a persistent suppressive impact on acetylene concentration, even when overall C2H2 levels are high.
Hydrogen (H) is crucial in both the initial nucleation and subsequent growth of soot particles. Its role is key in determining the rate of formation of active centers within the HACA mechanism, which influences the addition of C2H2 to soot [10]. The radial distribution of radical concentration in Figure 24 shows that in a C3H8/(O2/CO2) flame, there is a low concentration of radical H. This is primarily attributed to the thermal and chemical effects of CO2, which reduce the rate of C2H2 addition, thereby influencing the overall process of soot formation.
The critical chain reaction influencing soot formation and related intermediate components is OH + CO ⇋ H + CO2. CO2 shifts the equilibrium of the reaction towards the consumption of H and the production of more OH. According to Figure 25, the thermal effect of CO2 exerts the greatest influence on OH concentration, whereas its chemical effect also contributes to a lesser degree.
Both the thermal and chemical impacts of CO2 lead to a reduction in OH formation, which correlates with the observed decrease in oxidation rate as shown in Figure 21. This suggests that instead of enhancing soot oxidation, CO2 in the co-flow gas primarily influences the formation and growth of soot particles by decreasing the flame temperature and the H molar fraction. This finding aligns with the conclusions drawn by Guo et al. [38] in their study on C2H4/(O2/CO2) flames.
Figure 26 presents a sensitivity analysis of the various effects of adding the virtual component CO2 to key elementary reactions. The reaction OH + CO ⇋ H + CO2 exhibits the highest sensitivity to the chemical effects of CO2. Increasing the mole fraction of reactive CO2 accelerates the reverse reaction rate, leading to reduced CO oxidation heat release and a subsequent decrease in H concentration. When the mole fraction of non-reactive CO2 increases, the reverse reaction rate of the elementary reaction also increases slightly compared to the reference condition. It should be noted that this increase is significantly less pronounced than the effect caused by the chemical action of CO2. The reaction H + O2 ⇋ O+ OH is pivotal in the oxidation of propane, yet its reaction rate in an O2/CO2 atmosphere is lower compared to O2/N2 and O2/FCO2 atmospheres. This disparity may be attributed to the simultaneous competition for H radicals between the reactions H + CH3 (+M) ⇋ CH4 (+M) and H + O2 ⇋ O + OH, which collectively diminish the overall H concentration and, consequently, reduce the reaction rate [39].

3.4. Impacts of H2O Addition: Combustion Sensitivity Analysis

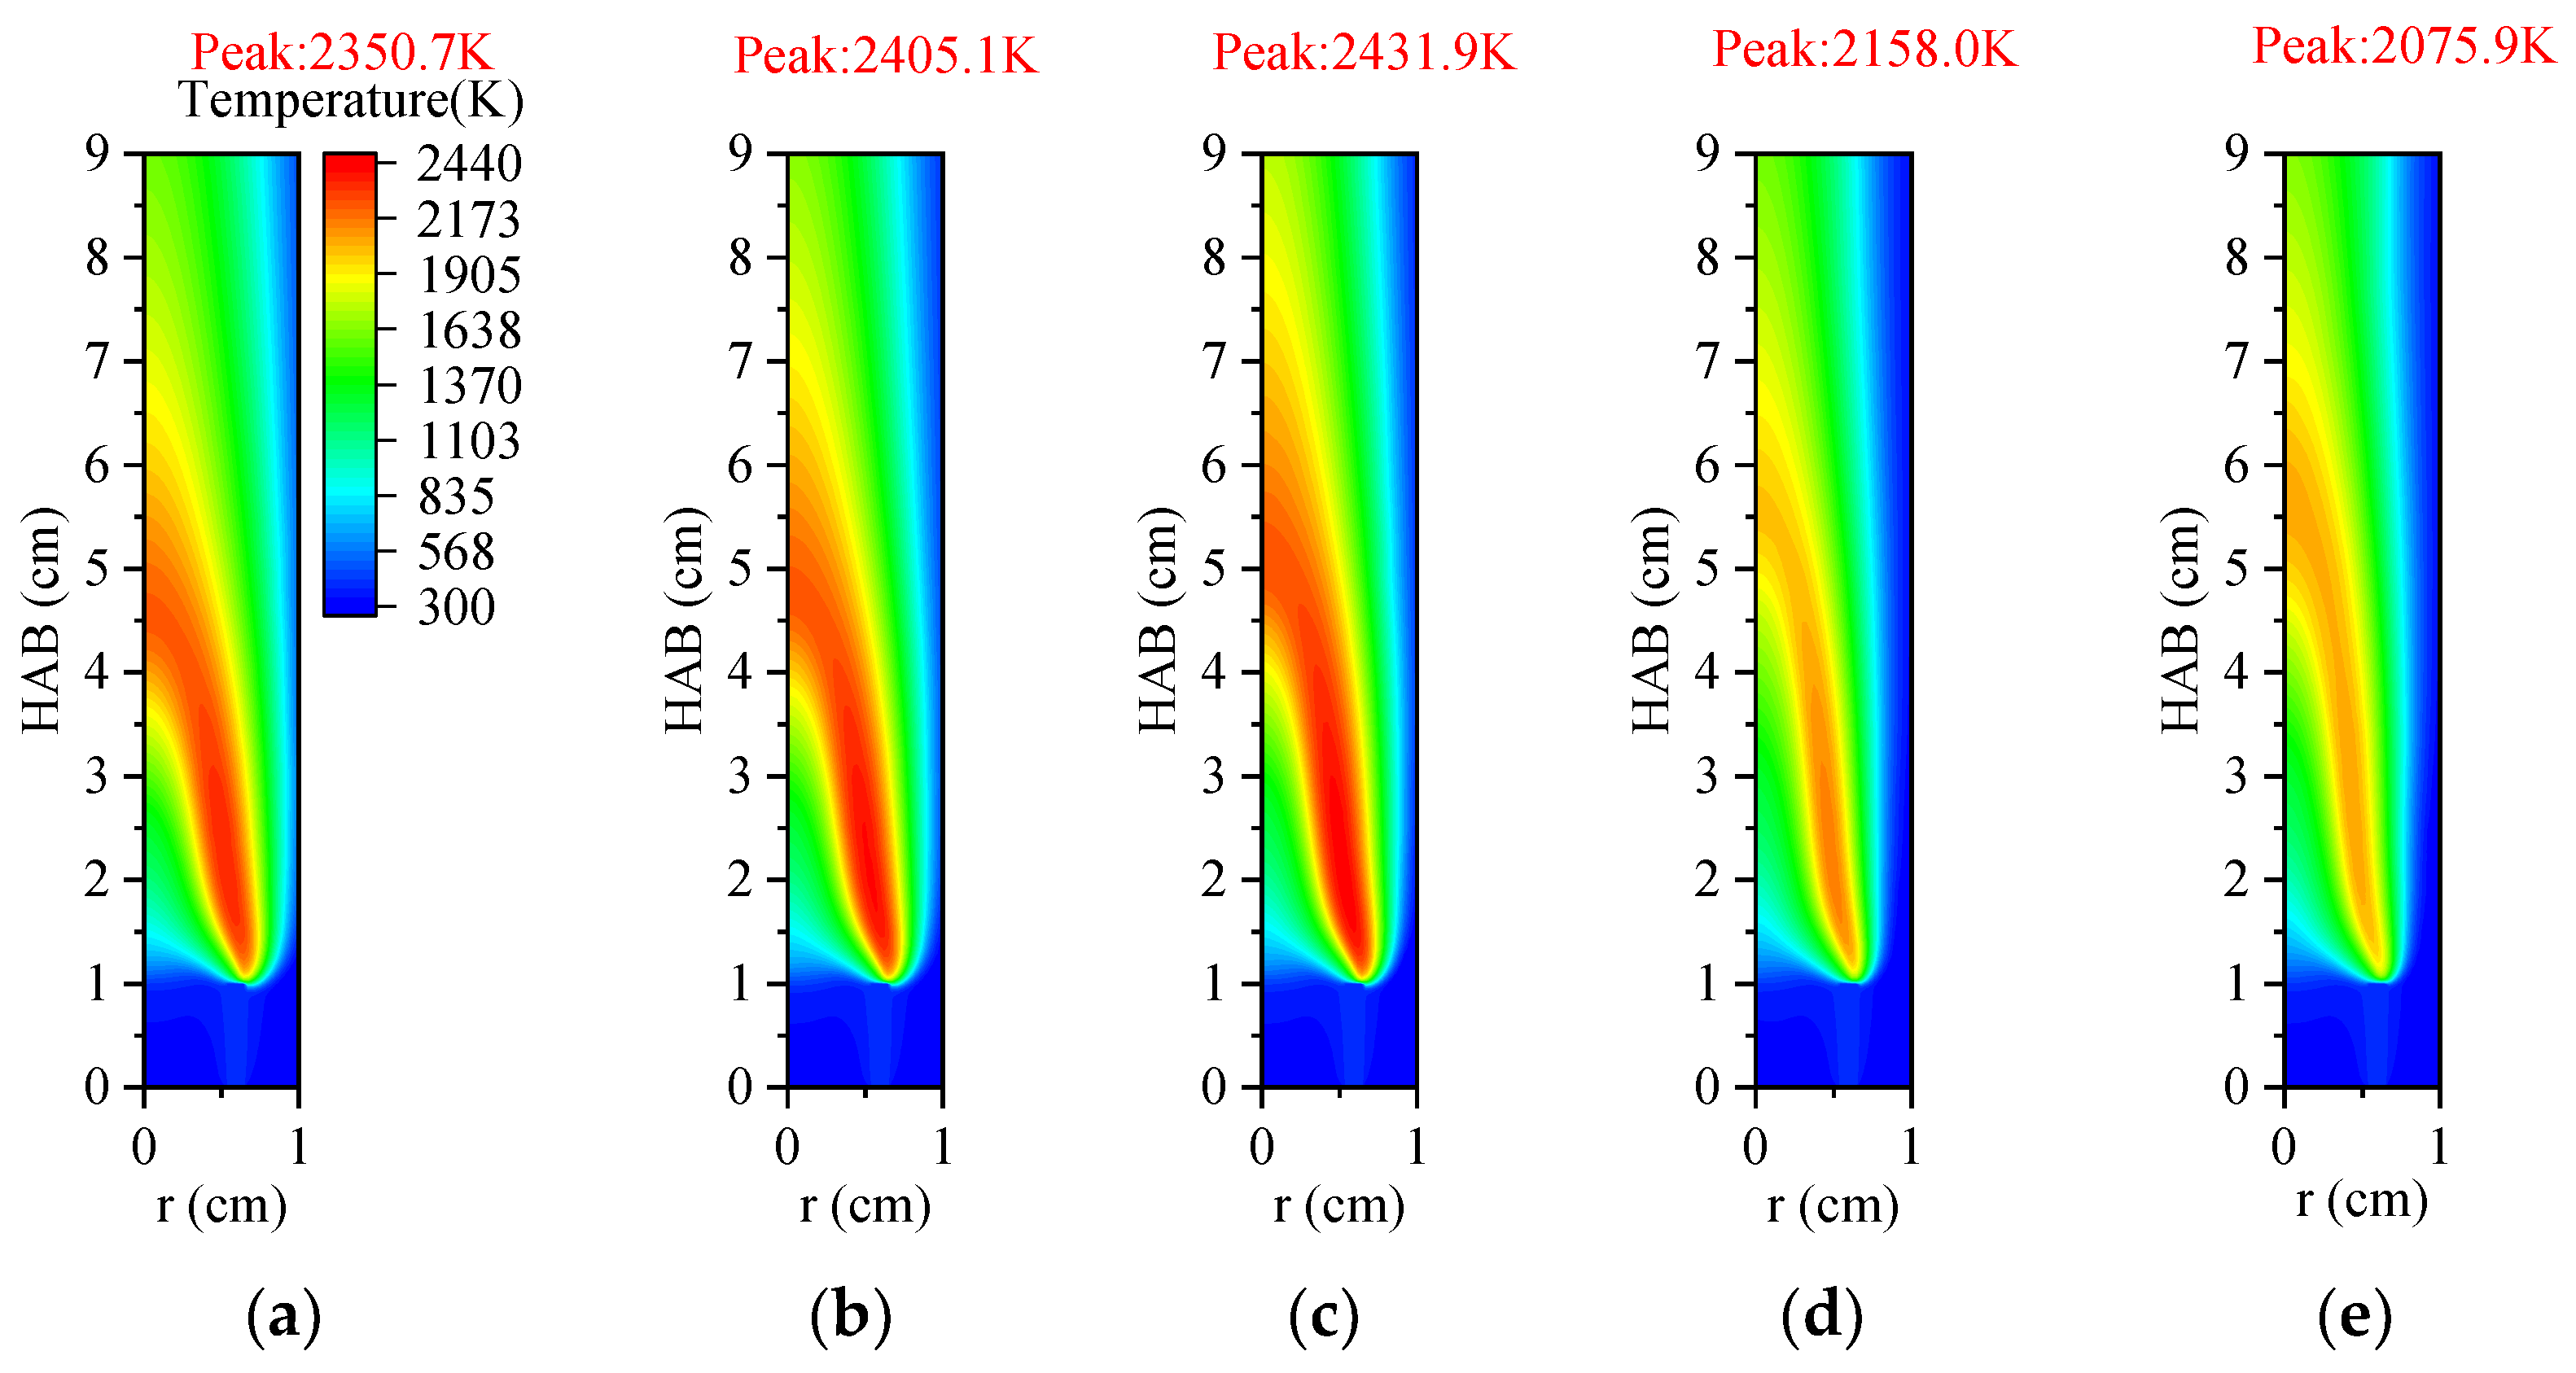
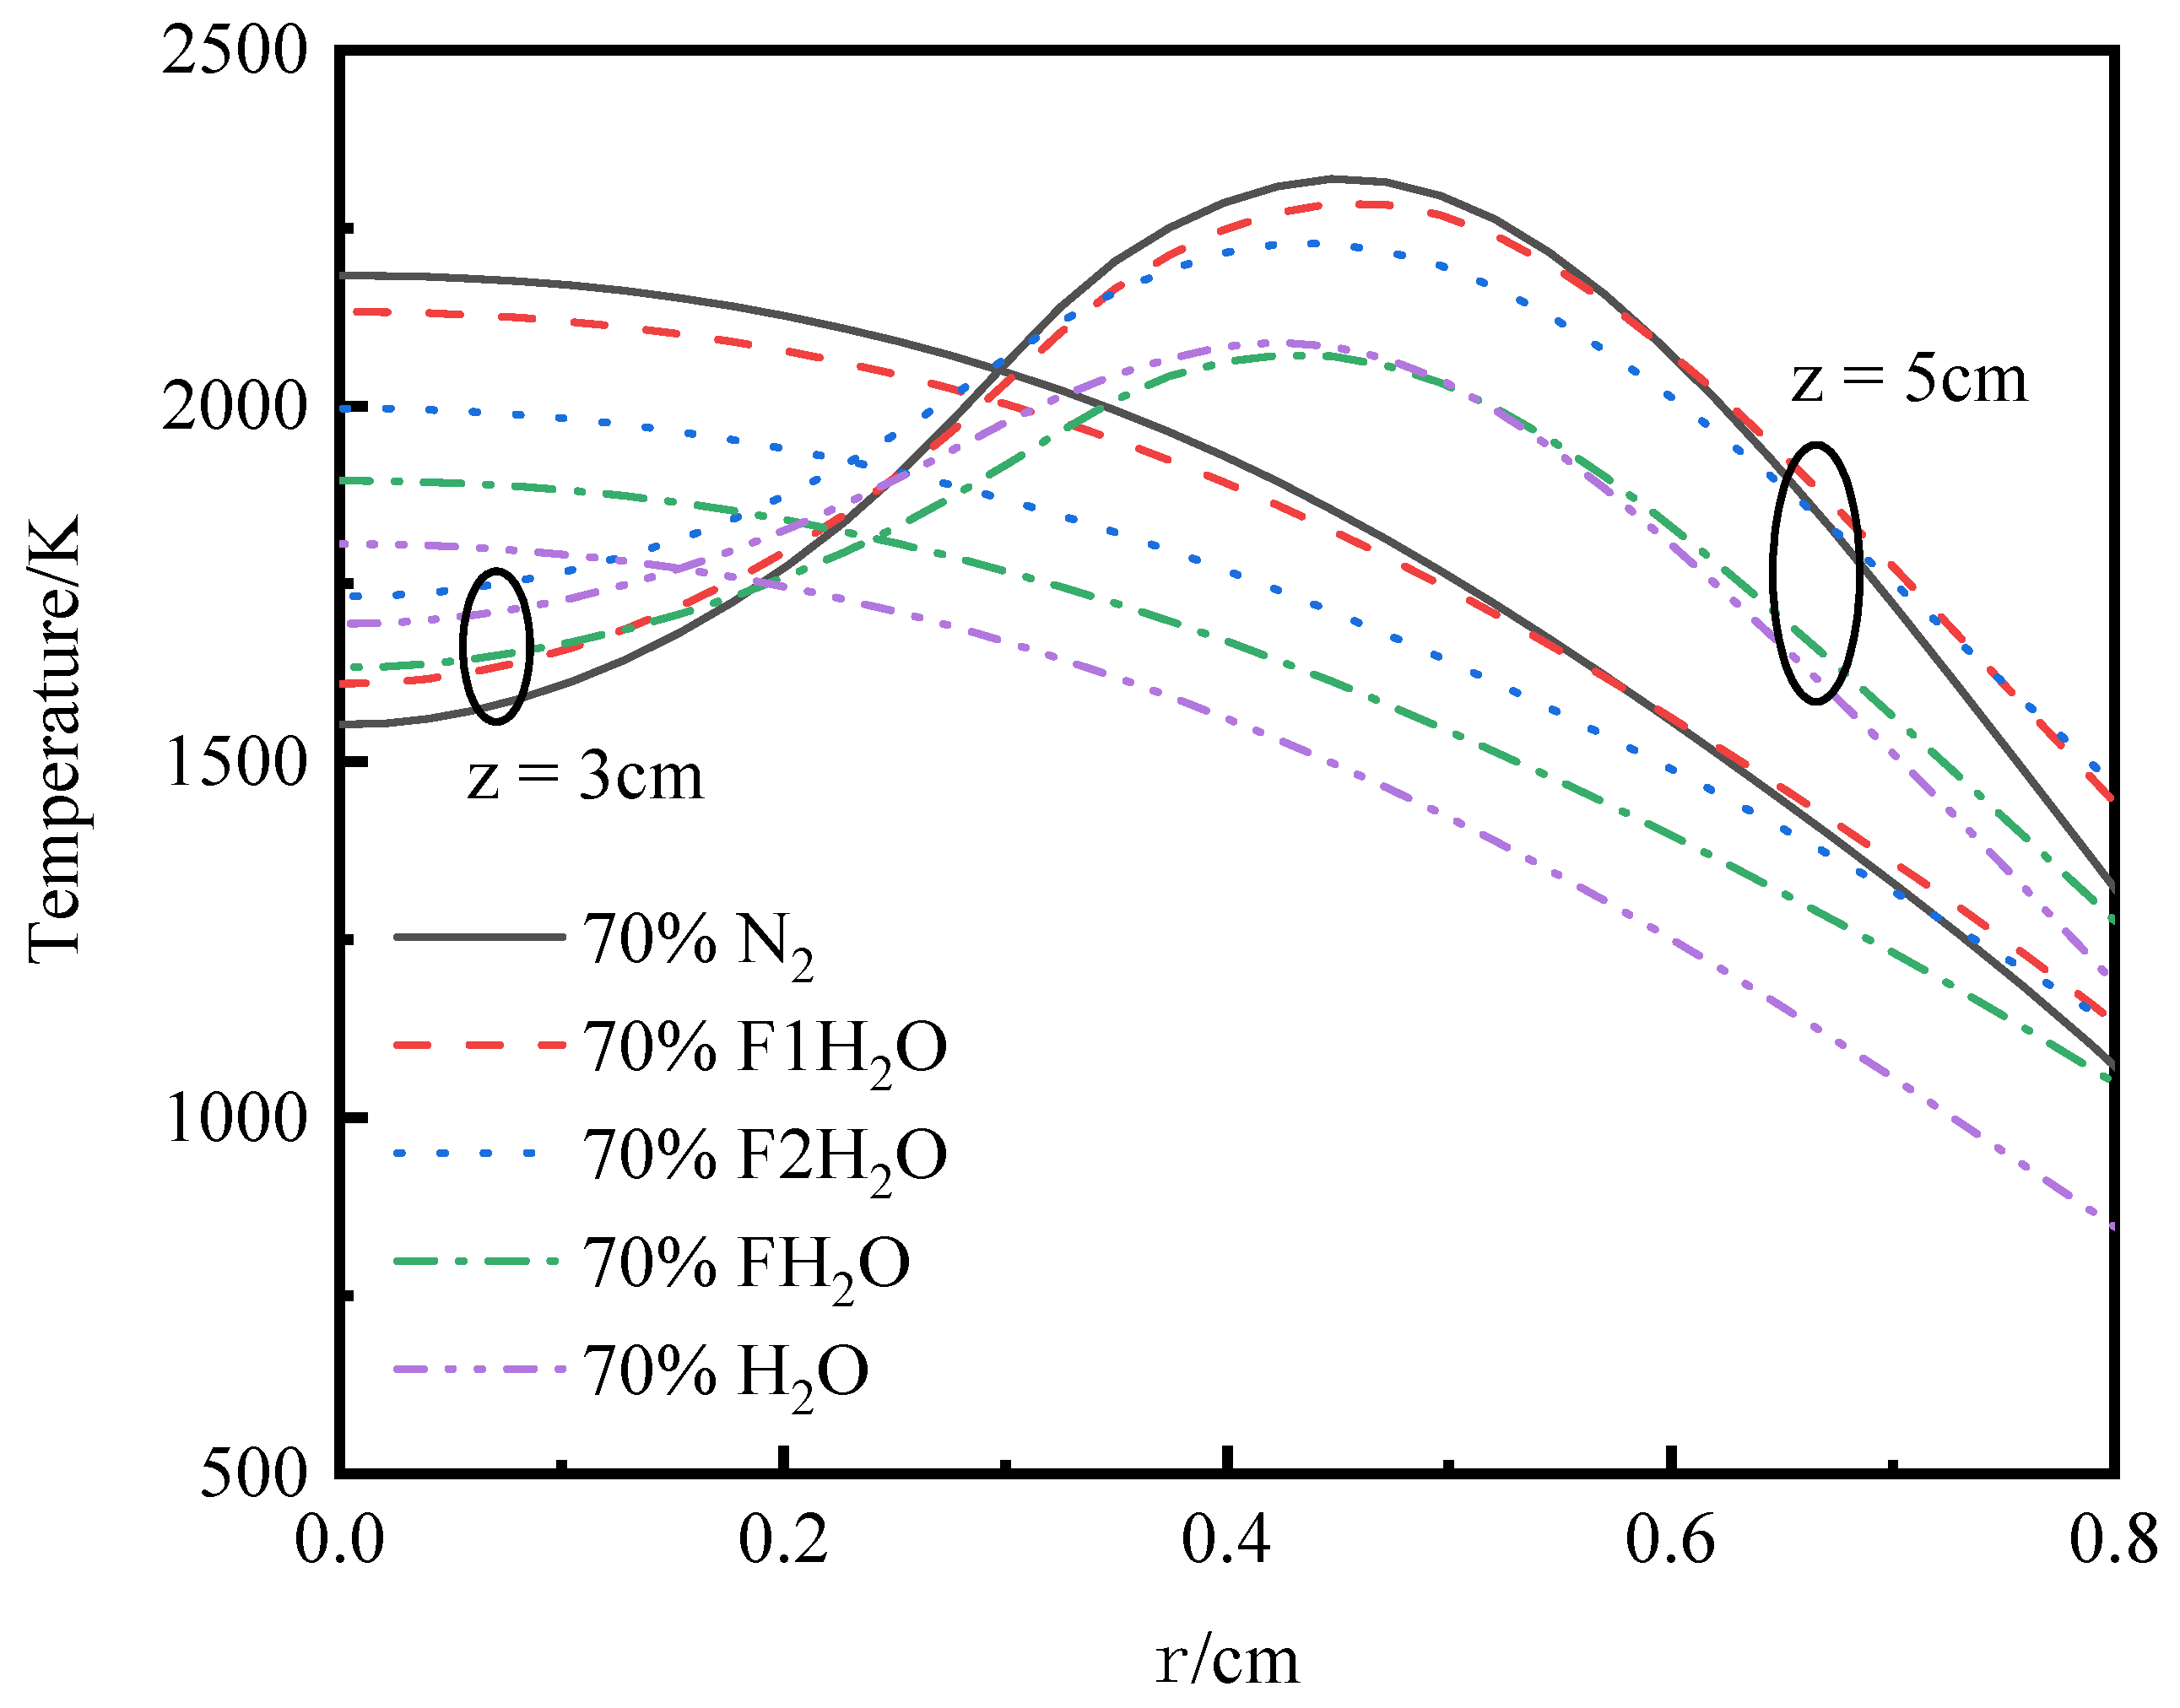
3.4.1. Temperature and Axial Flow Velocity

Figure 27 provides a two-dimensional depiction of the temperature distribution following the introduction of a virtual H2O component into the system. Notably, the density and transport effects exhibit minimal influence on the peak temperature. This outcome is in stark contrast with the behavior observed when CO2 is involved. Among the factors, thermal effect has the most significant impact on flame temperature. Additionally, chemical influence further diminishes the peak temperature. Observing the peak temperature in Figure 27 alongside the axial temperature at the flame center in Figure 28 reveals that the observed temperature differences are primarily due to the thermal effect of H2O, resulting from its high heat capacity. Chemical and transport effects also affect the overall temperature distribution, though to a lesser degree, whereas the density effect has a minimal impact. At constant outlet velocity, Figure 28 further shows that flame height axial velocity under the baseline conditions is greater, relative to other conditions, particularly around the 3.5 cm mark. In this case, the temperature discrepancy is primarily due to the thermal and chemical effects of H2O.
To investigate the impact of water density on velocity and temperature fields, the axial velocity’s radial distribution at different elevations above the burner is analyzed, as shown in Figure 29. According to the findings, the axial velocity in Case 3-7 (70% F1H2O) near the flame axis is slightly lower than Case 3-6. However, the axial velocity in Case 3-7 is greater than that of the reference case in regions far from the flame axis (r > 0.6 cm). This behavior is attributed to the lower m ˙ of F1H2O (18.015 g/mol) compared to N2 (28.013 g/mol), which results in a reduced oxidant density under Case 3-7. There is a rise in axial velocity within these areas due to the increased buoyancy of the mixture distant from the reaction flame. This change shortens the mixing time between oxidant and fuel airflows, subsequently affecting the intensity of flame combustion. Under the density effect, a slight reduction in peak temperature may be due to such an impact.

3.4.2. OH Radical Distribution and Flame Height

Under varying conditions, Figure 30 illustrates the two-dimensional distribution of OH radical mole fractions. The OH radicals are predominantly concentrated on either side of the flame, with their highest concentration observed at a point below 2 cm above the burner outlet. The impact of H2O on OH distribution mirrors its effect on temperature, signifying that OH concentration is indicative of combustion intensity. Notably, in an O2/H2O atmosphere, the peak OH mole fraction is markedly lower than in an O2/N2 environment, primarily due to thermal effects which diminishes OH peak by 26.1%. In addition, OH peak is further reduced by 12.4% due to the density effect of H2O, while the transport effect is negligible. Conversely, the chemical effect of H2O substantially elevates the OH peak by 36.1%, highlighting its role in enhancing OH concentration. Overall, the chemical influence of H2O tends to increase OH concentration, whereas thermal and density effects are significant contributors to its reduction.
Figure 31 depicts the influence of H2O on flame height, analyzed under the same criteria used for the addition of CO2. The chemical, thermal, and transport effects of H2O on flame height are consistent with findings made by Xu H et al. [12] in their study of the impact of H2O-diluted oxidants on the structure and shape of laminar co-flow syngas diffusion flames. As seen in Figure 28, the axial velocity in the presence of H2O (F1H2O) is generally lower than the baseline condition, resulting in a shorter reaction path within the same residence time, which leads to a reduction in flame height due to H2O’s density effect. Furthermore, the transport effect of H2O contributes to a further decrease in flame height, which is attributed to the binary diffusion coefficient of the H2O–O2 mixture being much higher than that of the N2O2 mixture. [16] Consequently, the transport characteristics of H2O in the oxidant enhance the oxygen diffusion process, replacing the role of N2 and reducing the required surface area for complete combustion, ultimately leading to a shortened flame height.

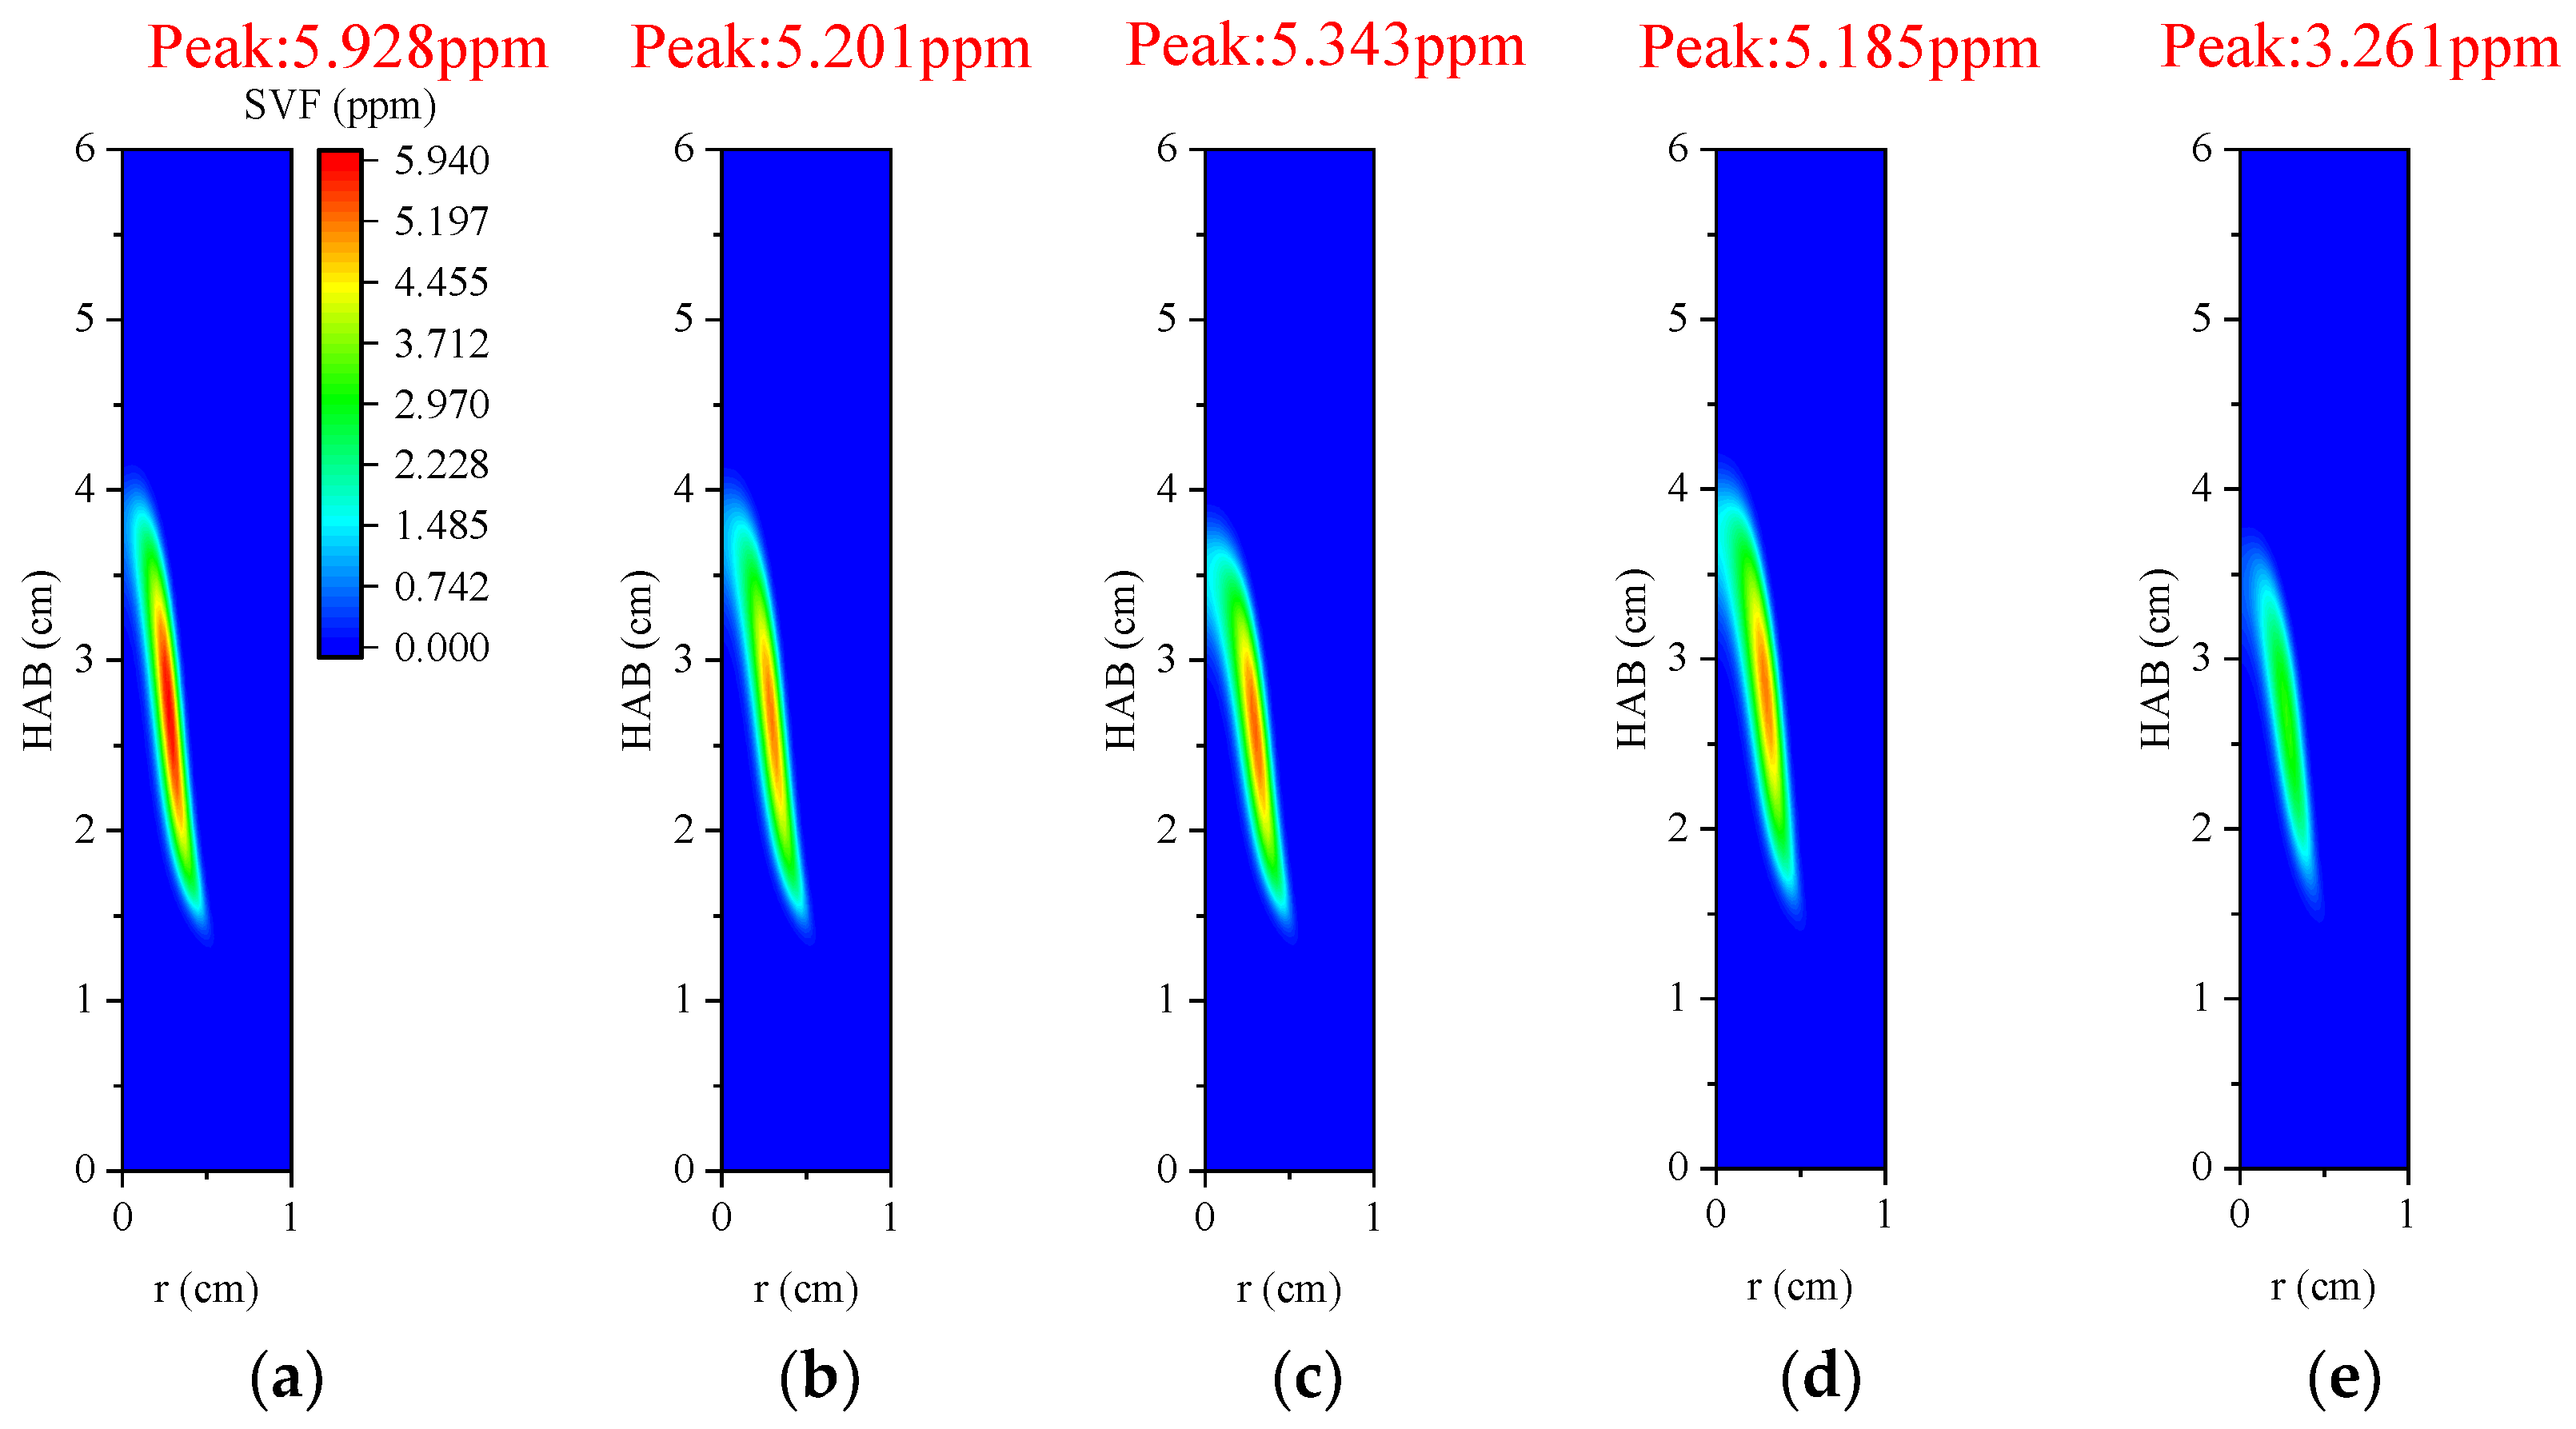
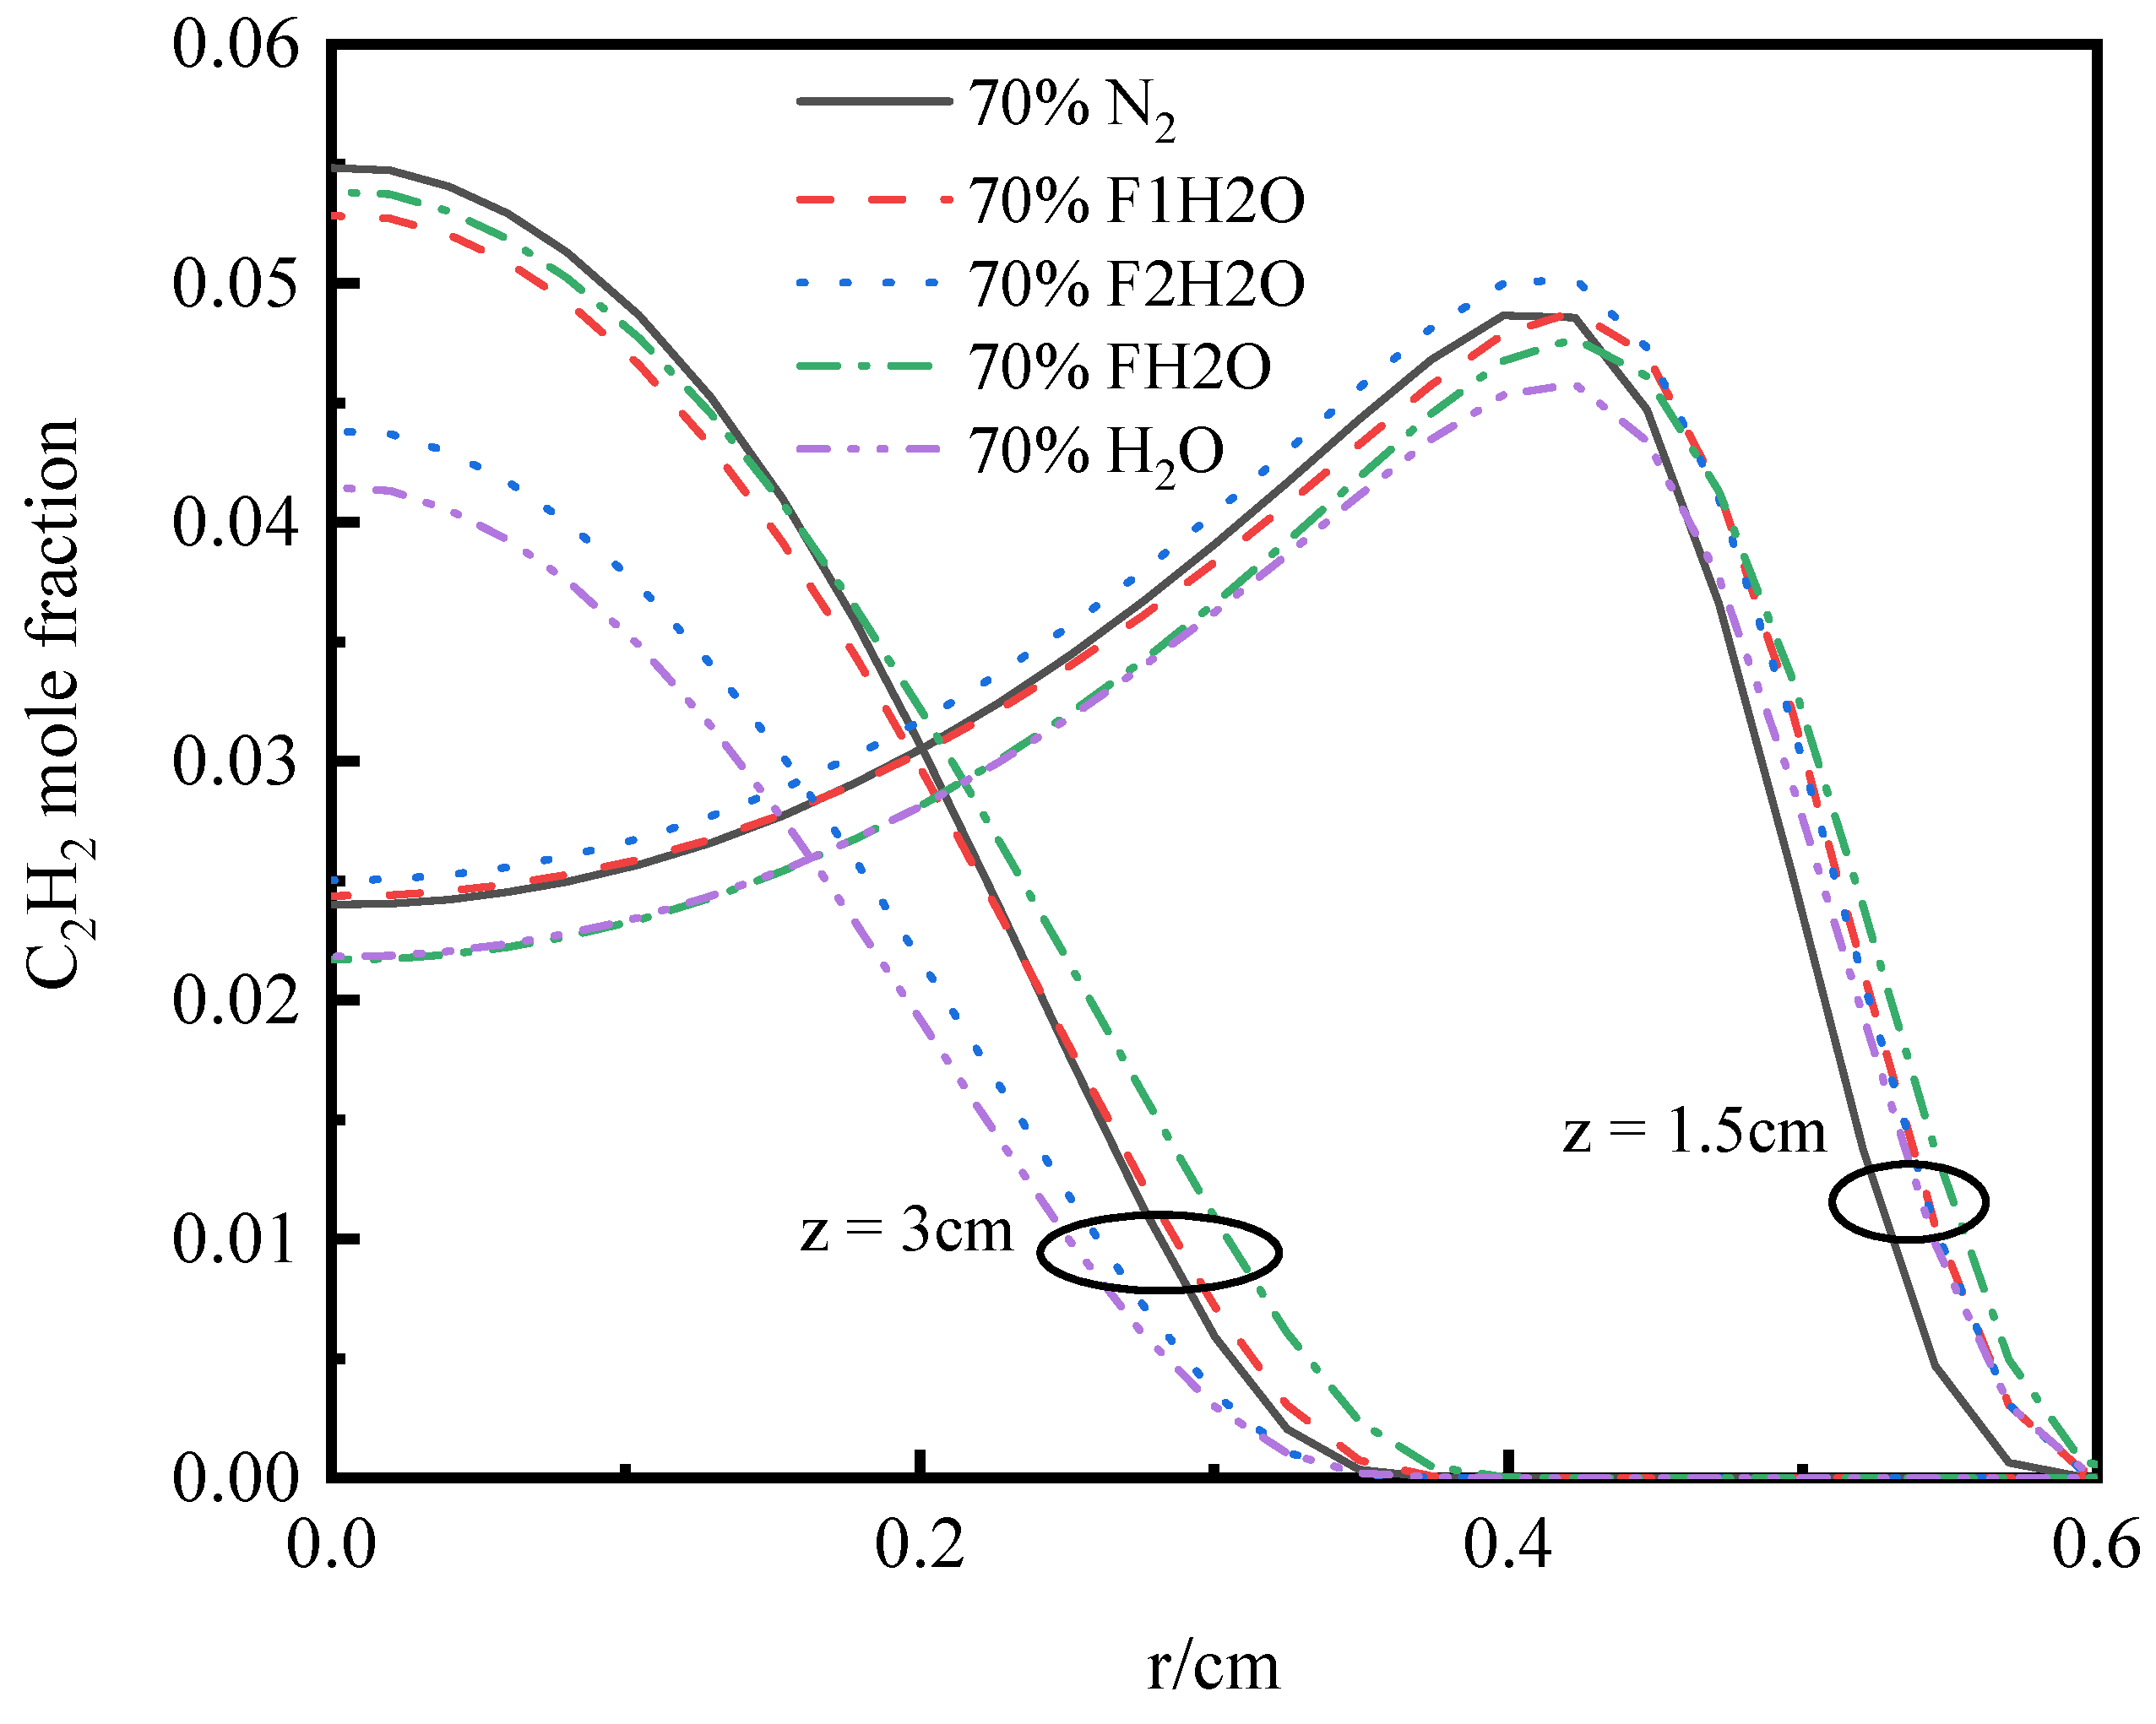
3.4.3. Volume Fraction of Soot

A two-dimensional layout of soot volume fraction in Figure 32 illustrates that soot primarily accumulates along the flame’s wings. The thermal effect of H2O is the primary factor influencing flame height, as demonstrated by a comparison of visible flame height variations caused by different effects of H2O. Specifically, the visible flame height which measures 3.9 cm in an O2/N2 atmosphere decreases slightly to 3.8 cm, and 3.7 cm under density and transport effects. However, under thermal and chemical effect, it increases to approximately 4.1 cm, and 3.6 cm. While the thermal effect exerts a mild inhibitory influence on soot formation, its impact is considerably less significant compared to the chemical effect.
The effect of H2O on nucleation, surface growth, and oxidation rates of soot particles can be seen in Figure 33. It appears that the soot mass nucleation rate is highly sensitive to thermal and chemical effects. Surface growth is notably inhibited by multiple factors, including the density, transport, thermal, and chemical effects, with the density, thermal, and chemical effects exerting the most pronounced decelerating influence. Generally, the oxidation rate depends primarily on density and chemical effects. Despite the chemical effect lowering the oxidation rate, it still surpasses the rates of soot mass nucleation and surface growth.
To investigate the influence of H2O on the mass nucleation, surface growth, and oxidation rates of soot, Figure 34, Figure 35, Figure 36 and Figure 37 show a comparative analysis of temperature, acetylene concentration, and mole fractions of OH and H radicals at various heights above the burner. The soot model, which assumes particle initiation through acetylene condensation, establishes that the initiation rate is contingent on both temperature and acetylene concentration. As shown in Figure 34, the reduced soot nucleation rate is primarily attributed to the thermal effects of water vapor, rather than its chemical properties, in the low flame region. This is due to the negligible temperature differences between H2O and FH2O flames. Soot surface growth is primarily influenced by the addition of C2H2 and polycyclic aromatic hydrocarbon condensation, with C2H2 being the predominant mechanism. The rate of C2H2 is also significantly influenced by temperature, C2H2 concentration, and H radical concentration. The heat impact of water vapor causes the radial temperature to lower in areas where soot accumulates, especially in the lower flame zone, as shown in Figure 33.
Figure 35 reveals that H2O exerts varying effects on the radial distribution of C2H2 concentration at different flame heights. In the low flame region, the chemical effect of H2O significantly lowers the C2H2 concentration. As the radial distance increases, C2H2 concentration in the C3H8/(O2/H2O) atmosphere surpasses that in the C3H8/(O2/N2) atmosphere. However, despite this increase, the chemical effect of H2O continues to exert an inhibitory influence on the overall C2H2 concentration.
It is crucial to understand H radicals in both soot nucleation and growth since they affect the formation of active centers in the HACA mechanism. As shown in Figure 36, the concentration of H radicals which is lower in the C3H8/(O2/H2O) atmosphere is primarily due to the combined thermal and chemical effects of H2O. This reduced H concentration lowers the C2H2 rate, subsequently inhibiting the soot surface growth.
In the C3H8/(O2/H2O) flame, the chain reaction H2 + OH ⇋ H2O + H is crucial in influencing soot formation and key intermediates. The addition of H2O drives the reaction toward increased consumption and production of H and OH. As shown in Figure 37, the H2O chemical effect significantly elevates the OH mole fraction. As a primary oxidizing species, OH directly impacts the soot oxidation rate. As a result, the chemical effect of water vapor is dominant, with increased OH concentrations intensifying soot oxidation.
Figure 38 illustrates the sensitivity analysis of various key elementary reactions under the introduction of an additional virtual component, H2O. It is clear that the elementary reaction OH + H2 ⇋ H + H2O shows the highest sensitivity to the chemical influence of water vapor. As the molar fraction of reactive H2O increases, these reactions predominantly proceed towards consuming H2O to produce more OH. Conversely, an increase in the molar fraction of non-reactive water vapor slightly elevates the reverse reaction rate of OH +H2 ⇋ H + H2O compared to the benchmark condition, although this effect remains significantly less pronounced than the impact of reactive H2O. The elementary reaction 2OH ⇋ O + H2O also demonstrates considerable sensitivity to the chemical presence of H2O, potentially synergizing with OH + H2 ⇋ H + H2O in the reverse direction to augment OH concentrations. Meanwhile, H + O2 ⇋ O + OH stands out as the principal elementary reaction in the oxidation process of C3H8, where the addition of H2O promotes the forward reaction and enhances OH concentrations. Furthermore, the elementary reaction OH + CO ⇋ H + CO2 serves as a primary pathway for the conversion of CO to CO2. Overall, the pivotal roles of OH + H2 ⇋H + H2O and 2OH ⇋ O + H2O in the chemical inhibition of soot formation by H2O are widely supported in the literature. Specifically, studies [12,22] consistently affirm that the chemical impact of H2O primarily inhibits soot formation by augmenting OH concentrations.

4. Conclusions

A laminar diffusion flame under oxygen-enriched combustion conditions was investigated experimentally and numerically for the impact of CO2. Comparing experimentally observed temperature and SVF distributions with numerical predictions in an O2/N2/CO2 atmosphere is presented in this study. Although the simulation accurately captured the flame temperature, it overestimated the SVF in the O2/N2/CO2 environment. Additionally, the influence of O2/CO2 and O2/H2O oxy-fuel combustion on flame structure and soot formation was investigated through numerical simulations of laminar propane co-diffusion flames. By applying a sequential decoupling approach, the distinct effects of diluents—specifically density, transport, thermal, and chemical effects—were isolated, leading to the following conclusions:
(1)
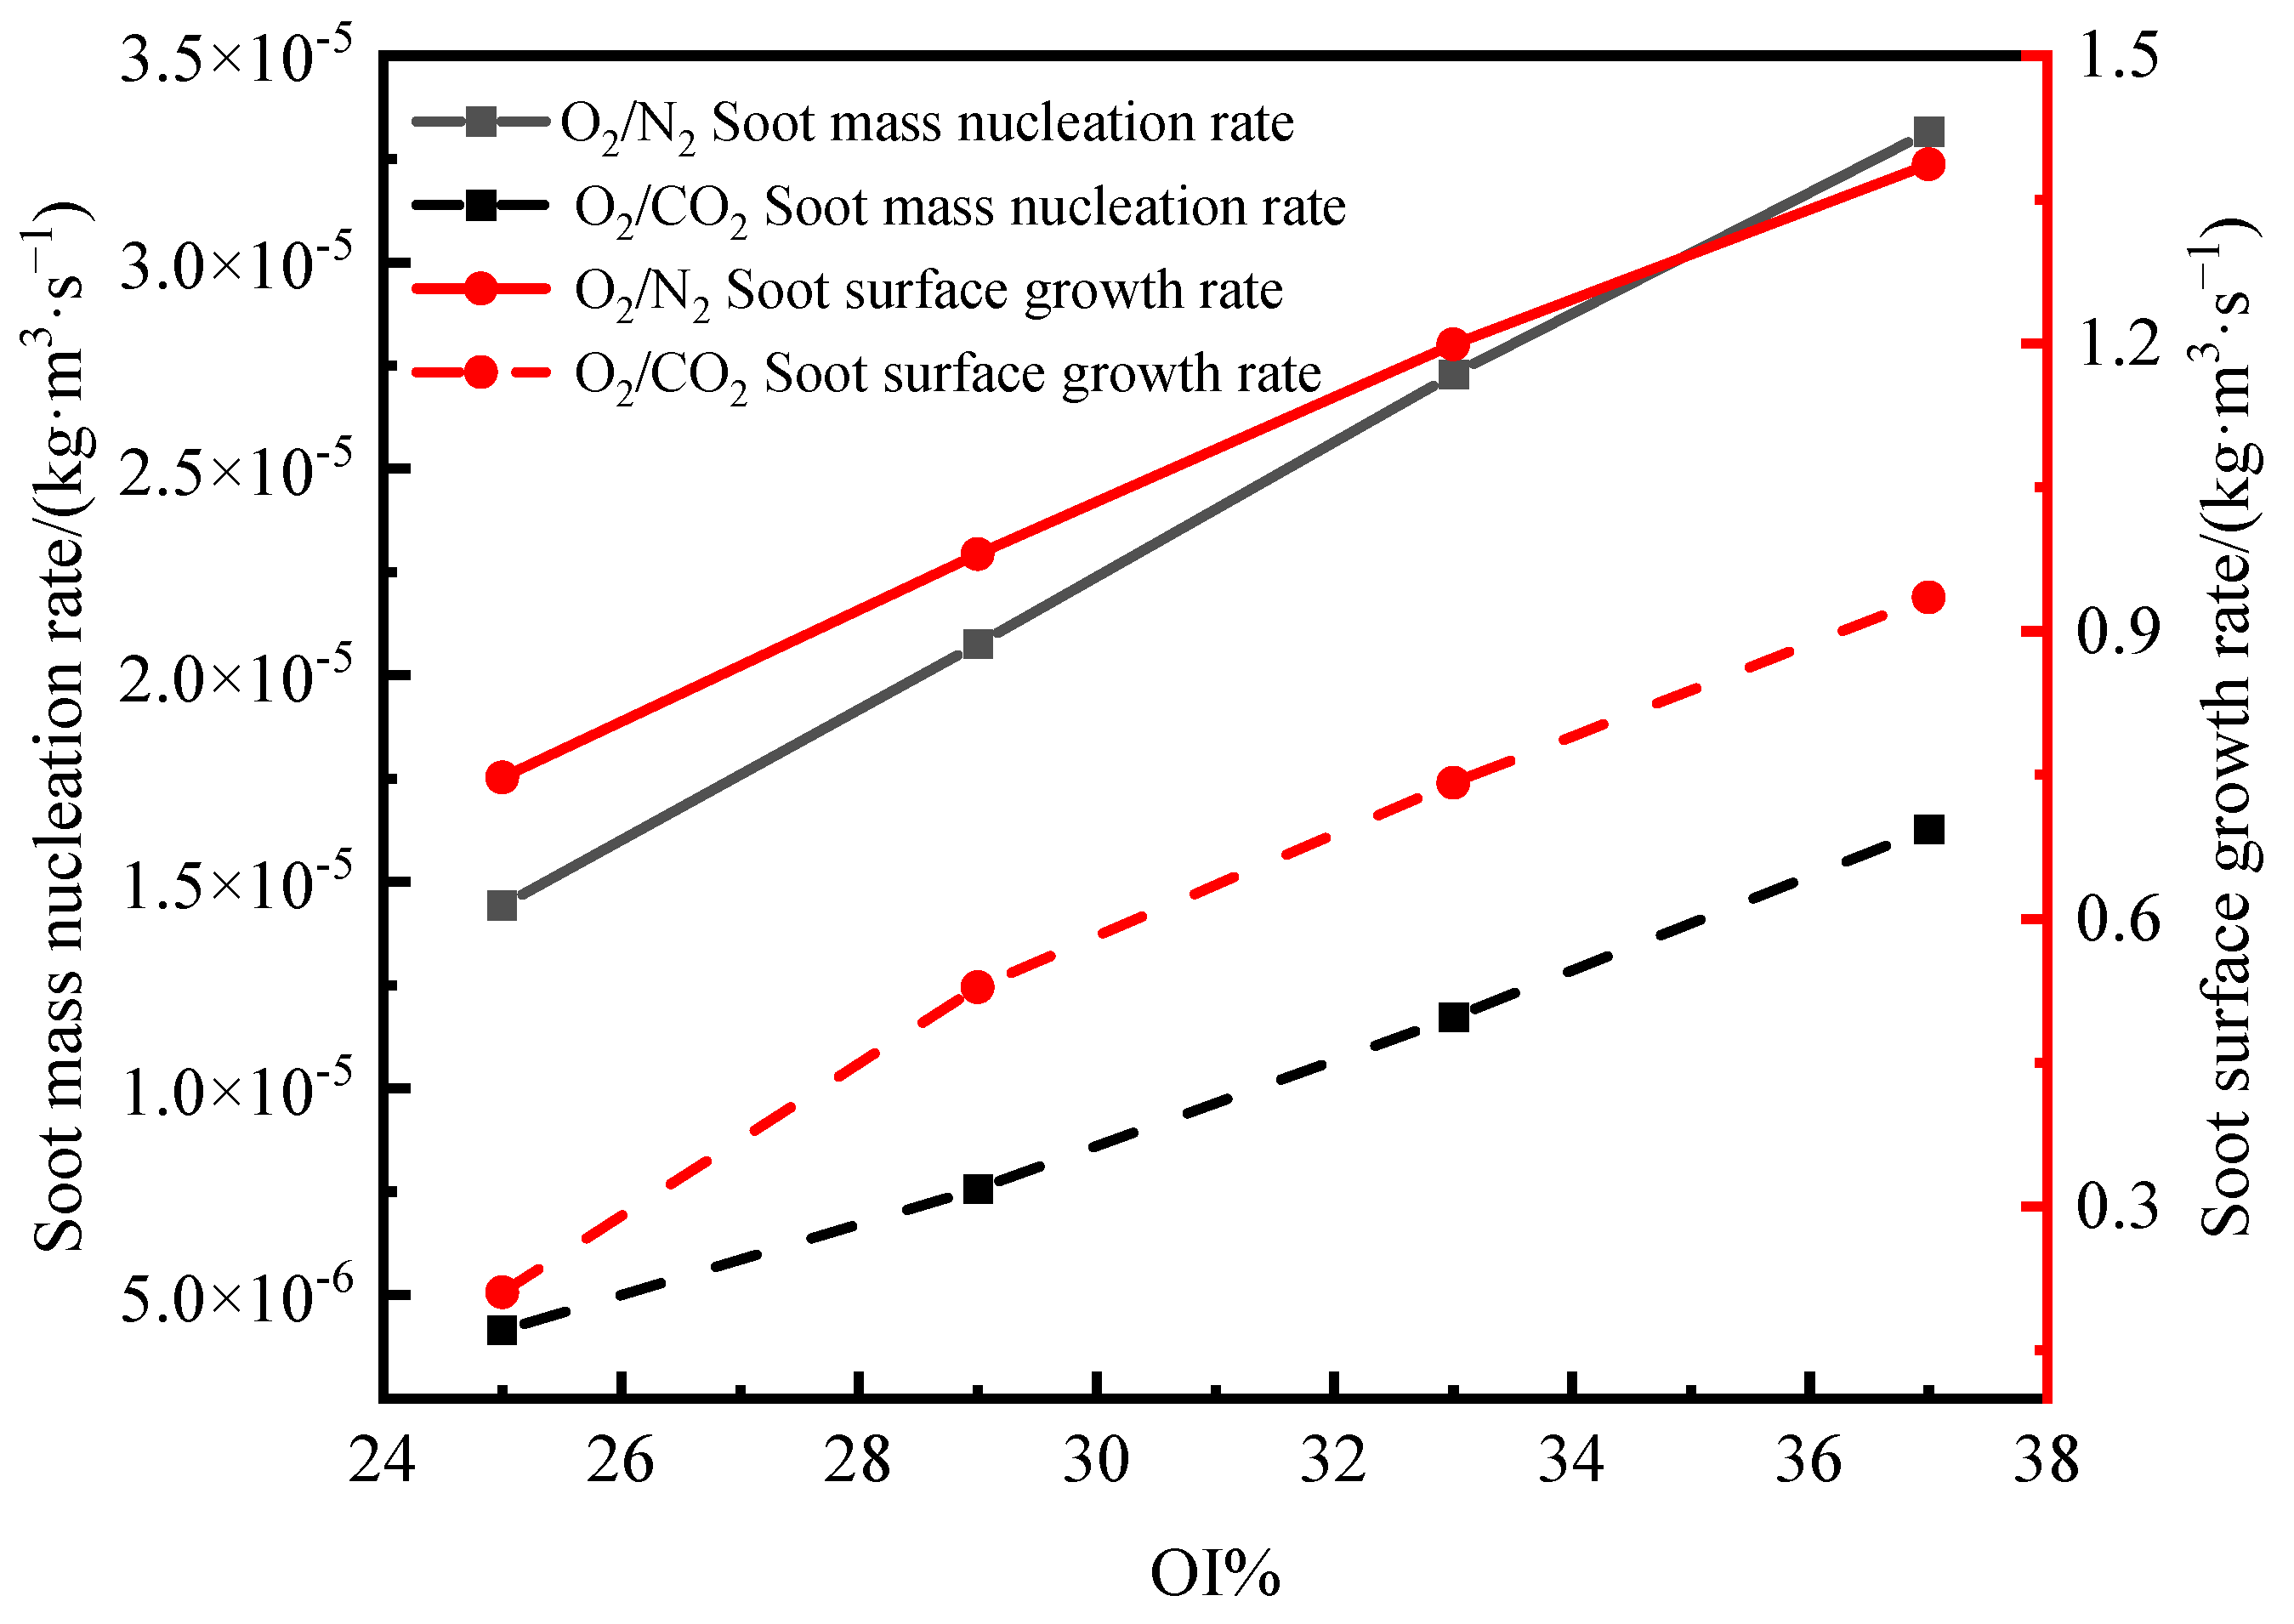
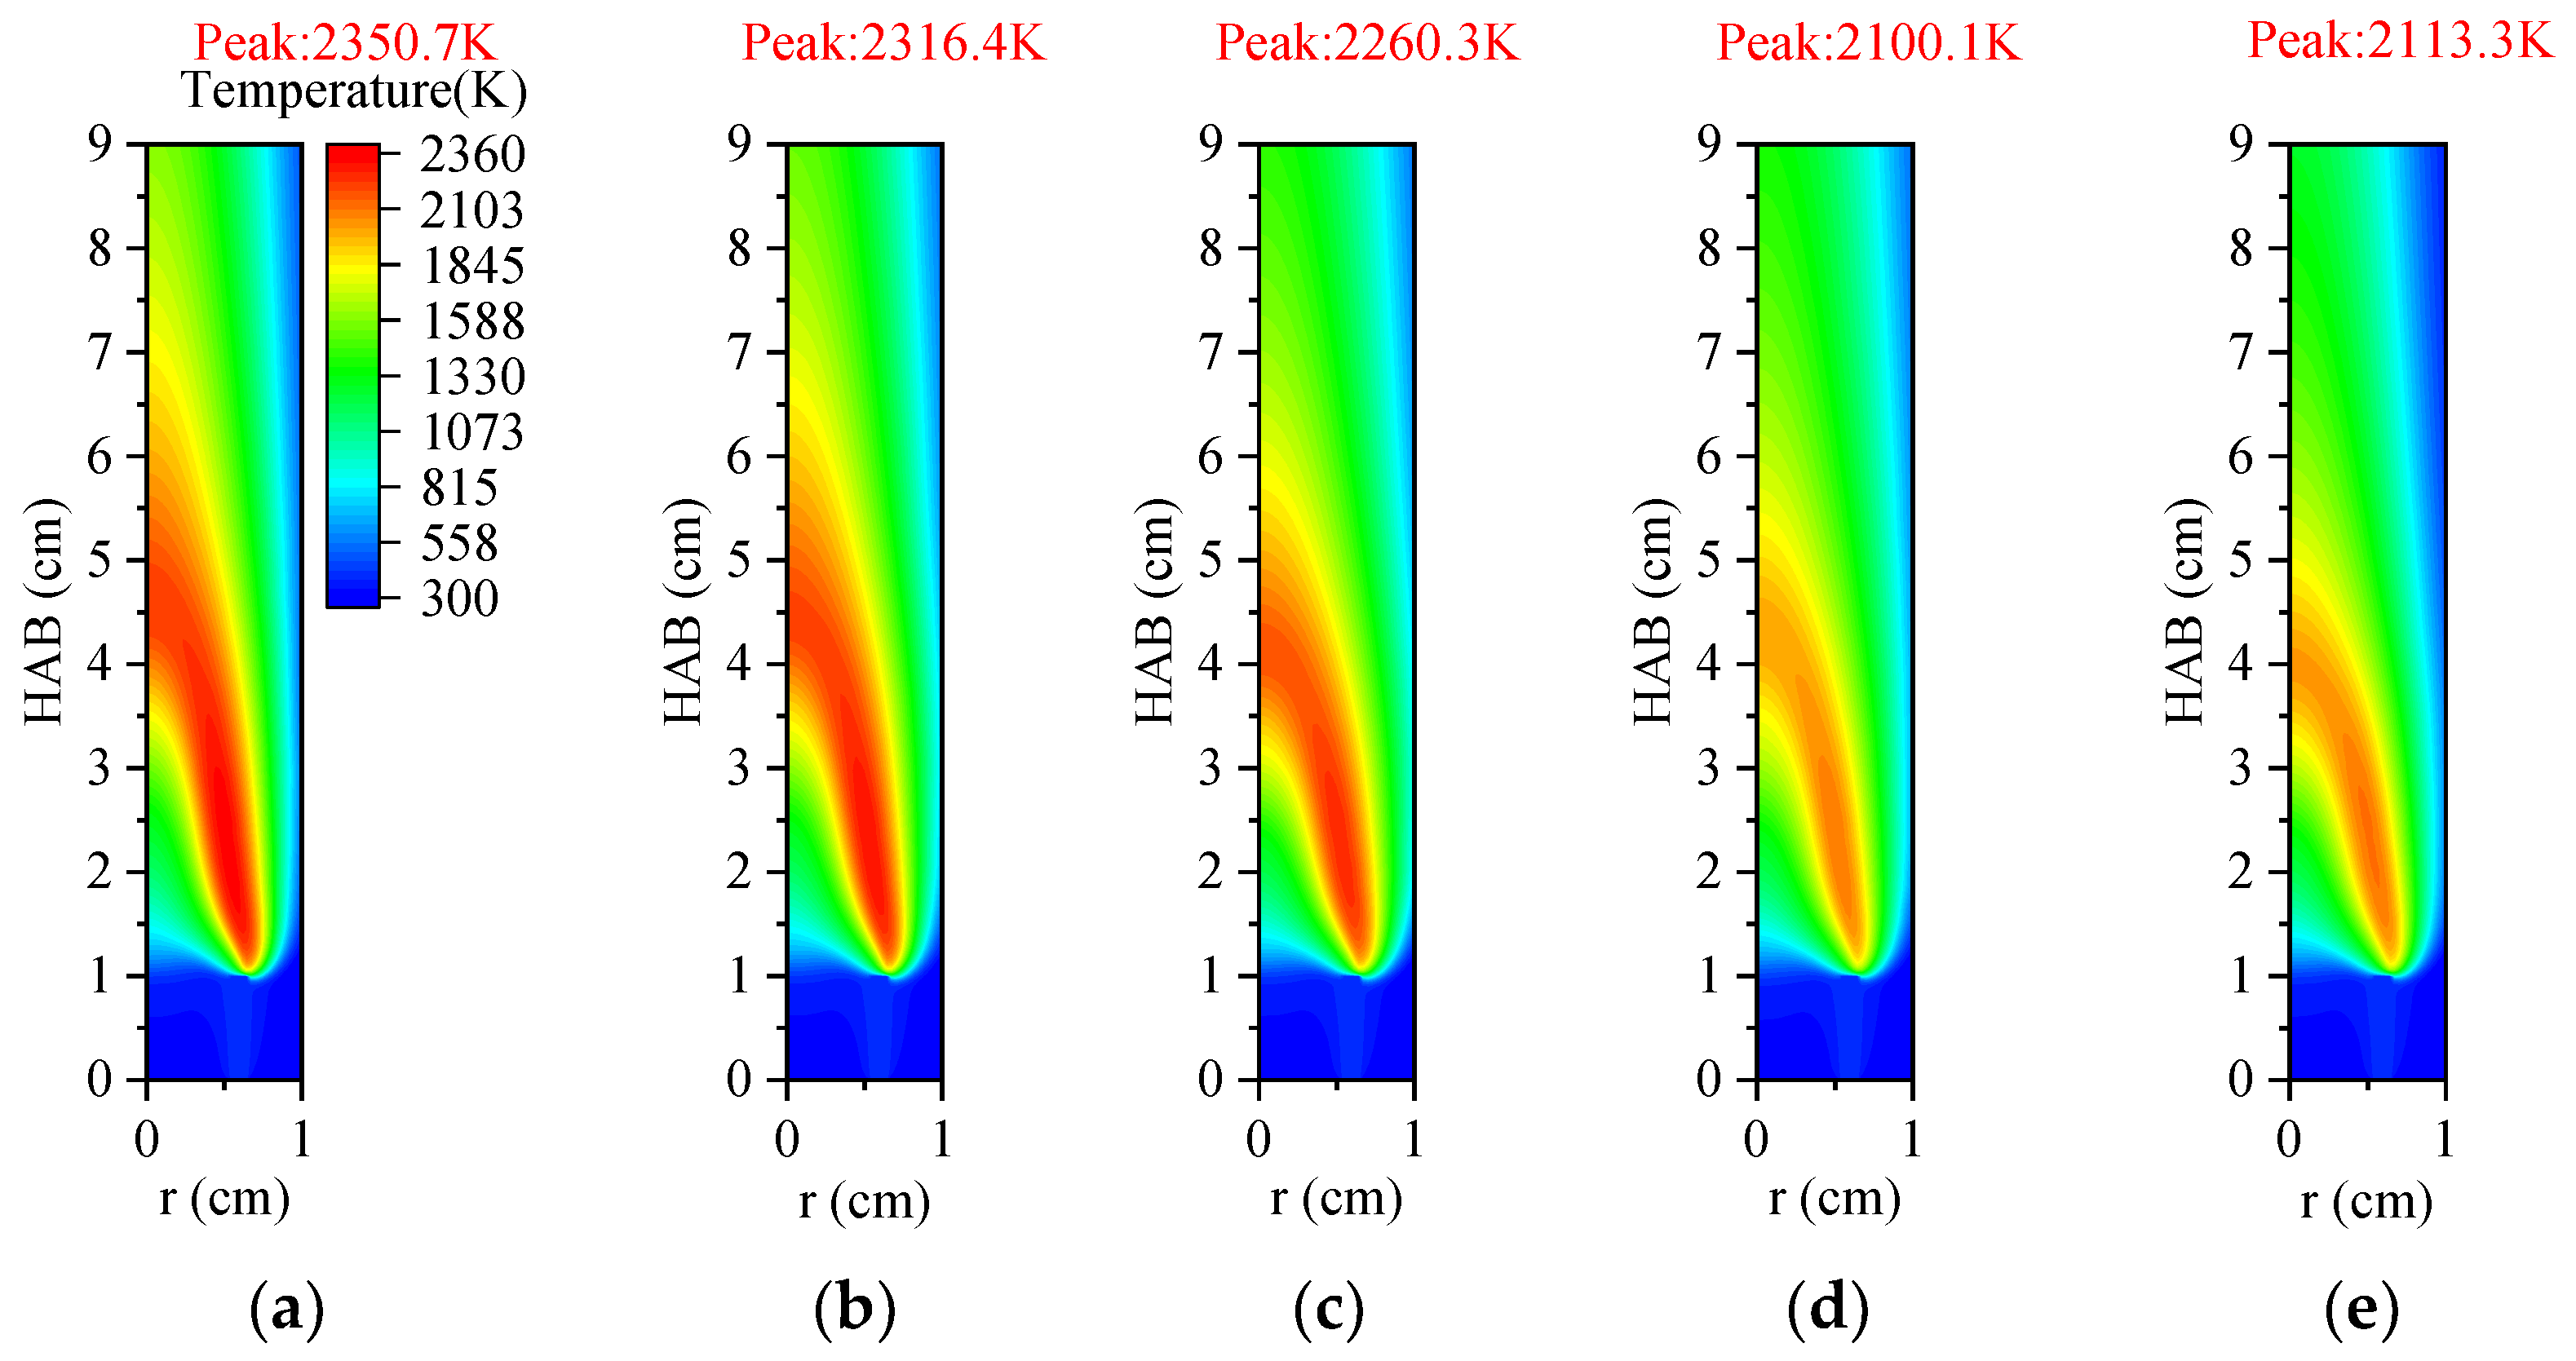
Under an O2 index (OI) of 30%, substituting CO2 for N2 effectively suppresses soot formation. This replacement moves the high-temperature zone from the flame edges to the tip, thus, removing the splitting effect of the flame tip. The reduction in SVF is a result of decreased soot mass nucleation and surface growth rates, which occur when N2 is substituted with CO2.
(2)
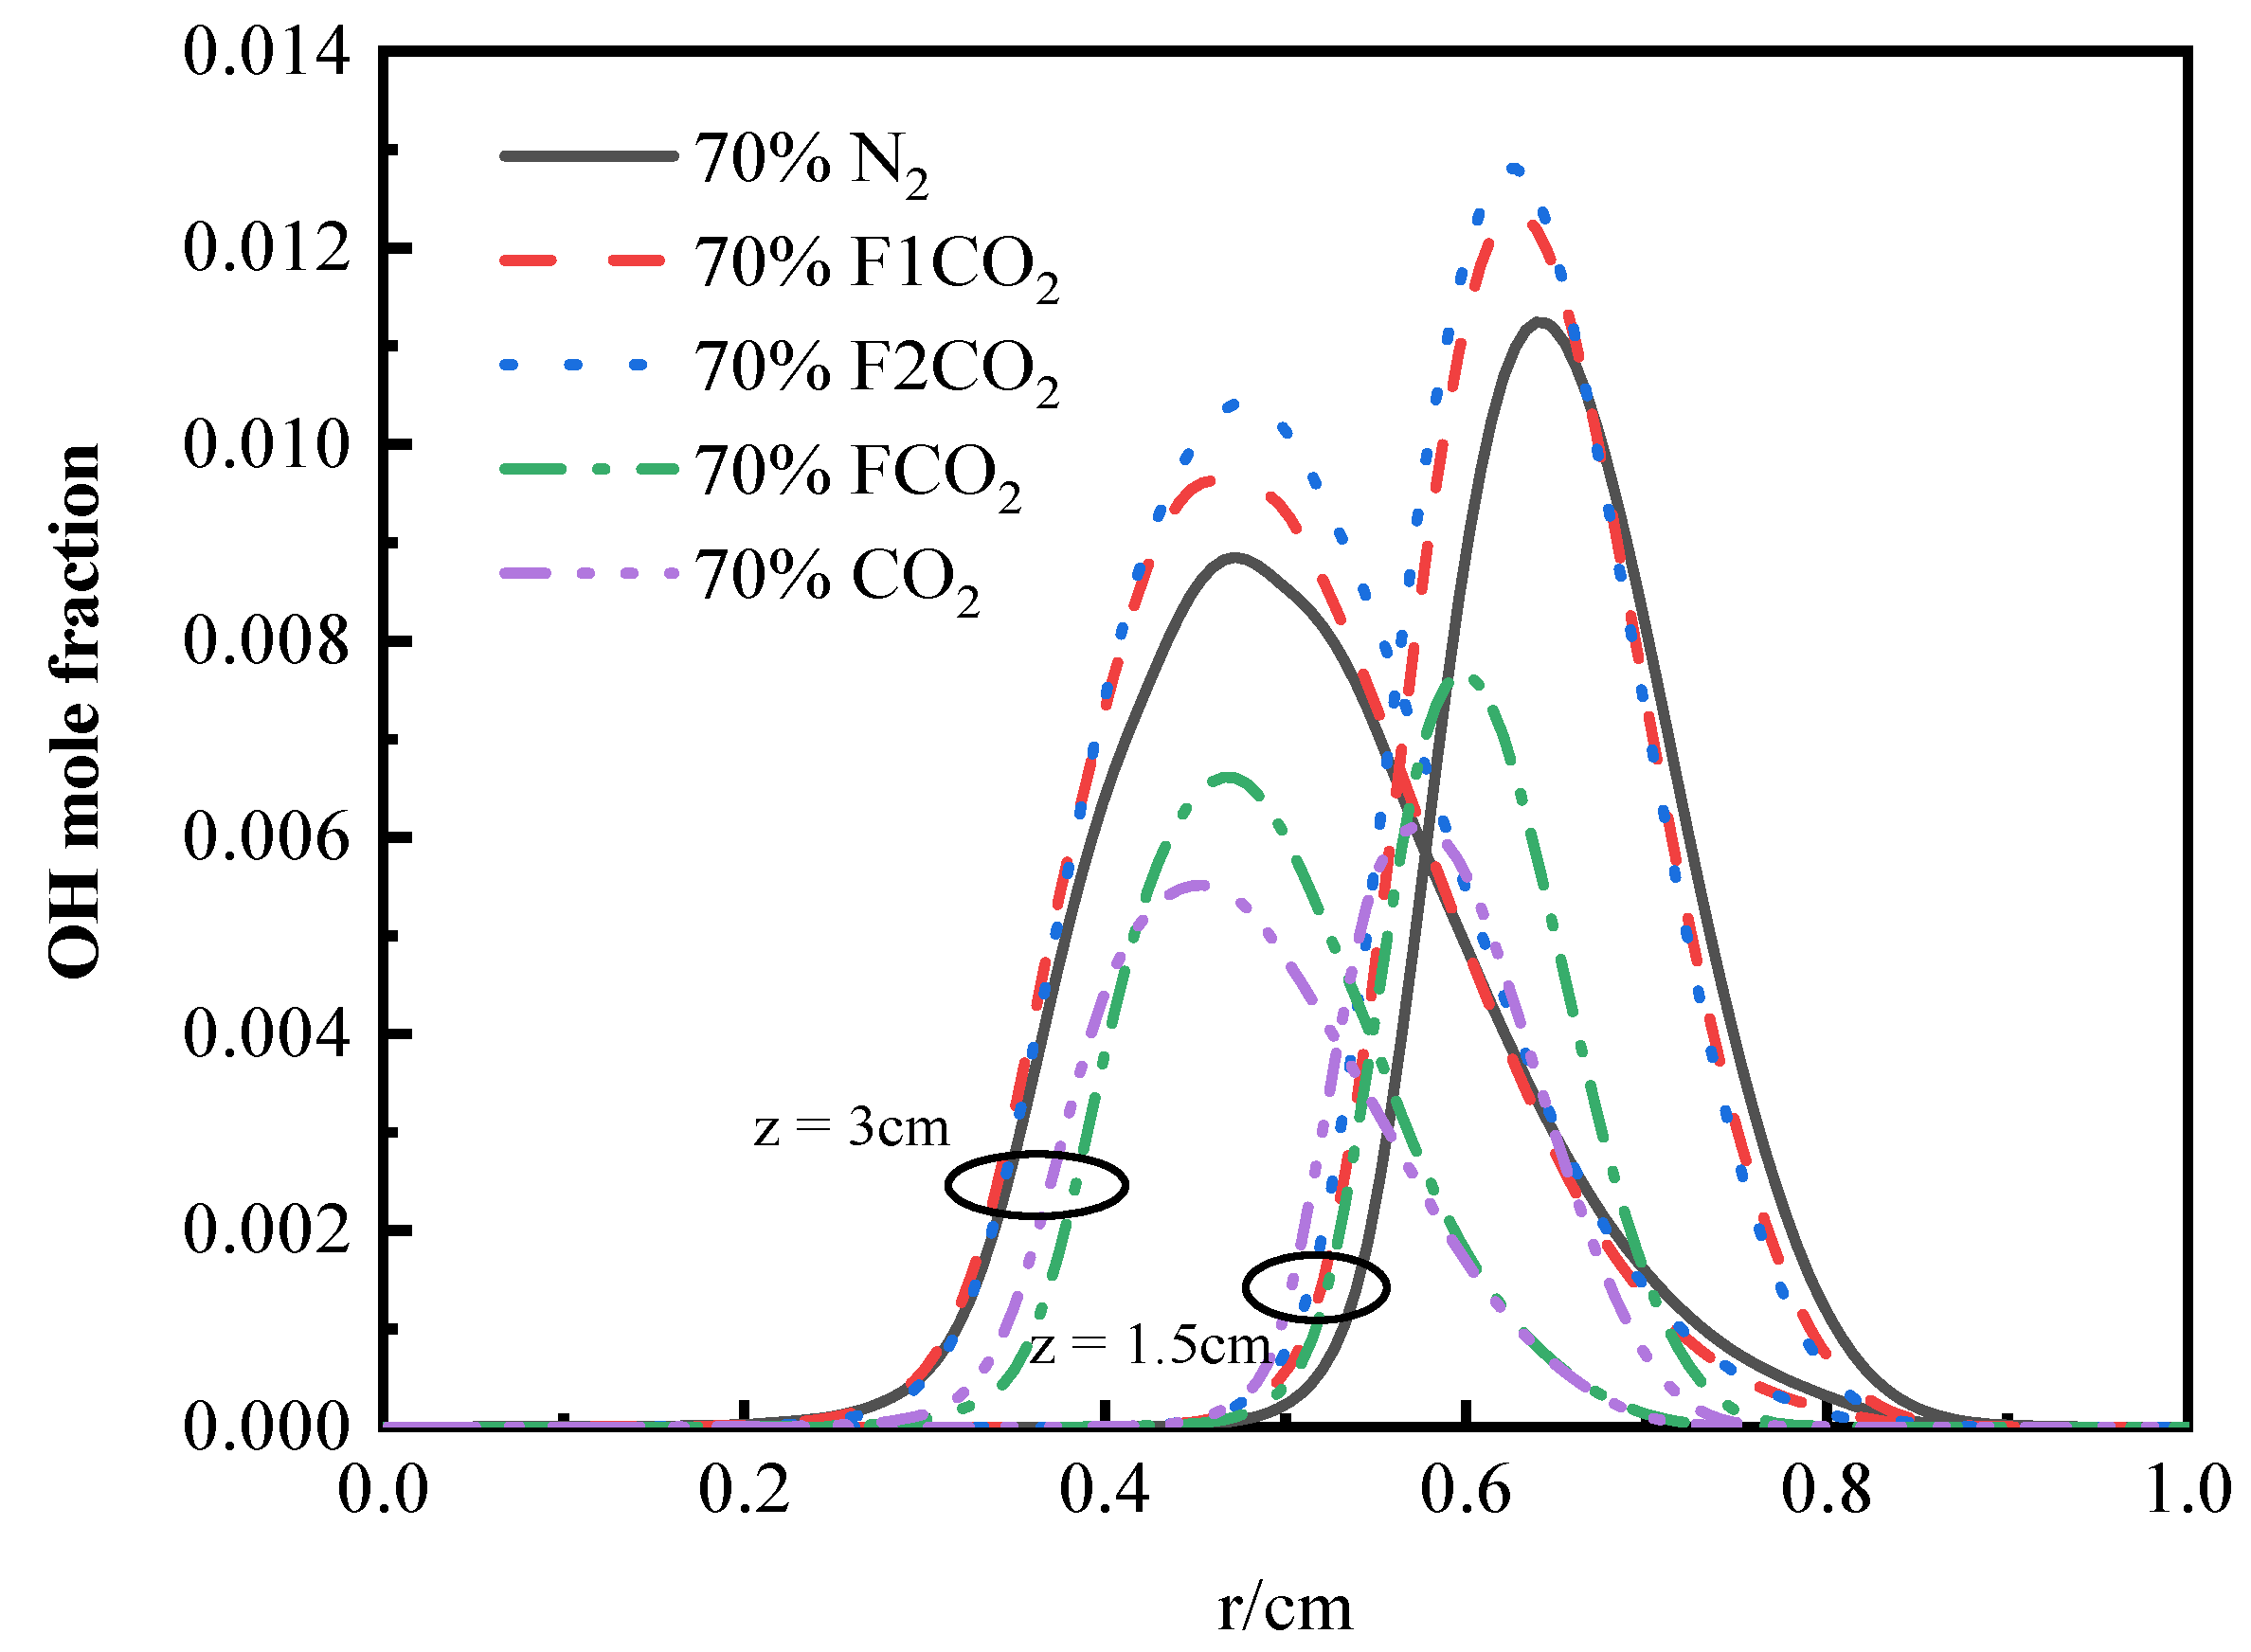
Thermal and chemical interactions with CO2 drive the temperature differences in O2/CO2 combustion mode, while transport and density effects play a less important role. The chemical role of CO2 leads to a reduction in OH radical concentration and temperature, which in turn results in an elongated flame height.
(3)
The differences in temperature distribution during O2/H2O combustion are primarily attributed to the thermal effects and chemical interactions of water vapor. In addition to its chemical effects, H2O has significant thermal effects. The replacement of N2 with H2O leads to a reduction in flame height. The thermal effects of both CO2 and H2O lead to a reduction in OH concentration and a decrease in temperature. However, H2O’s density effect diverges from that of CO2, and its influence on transport processes is less pronounced, highlighting the distinct roles these species play in the system’s dynamics.
(4)
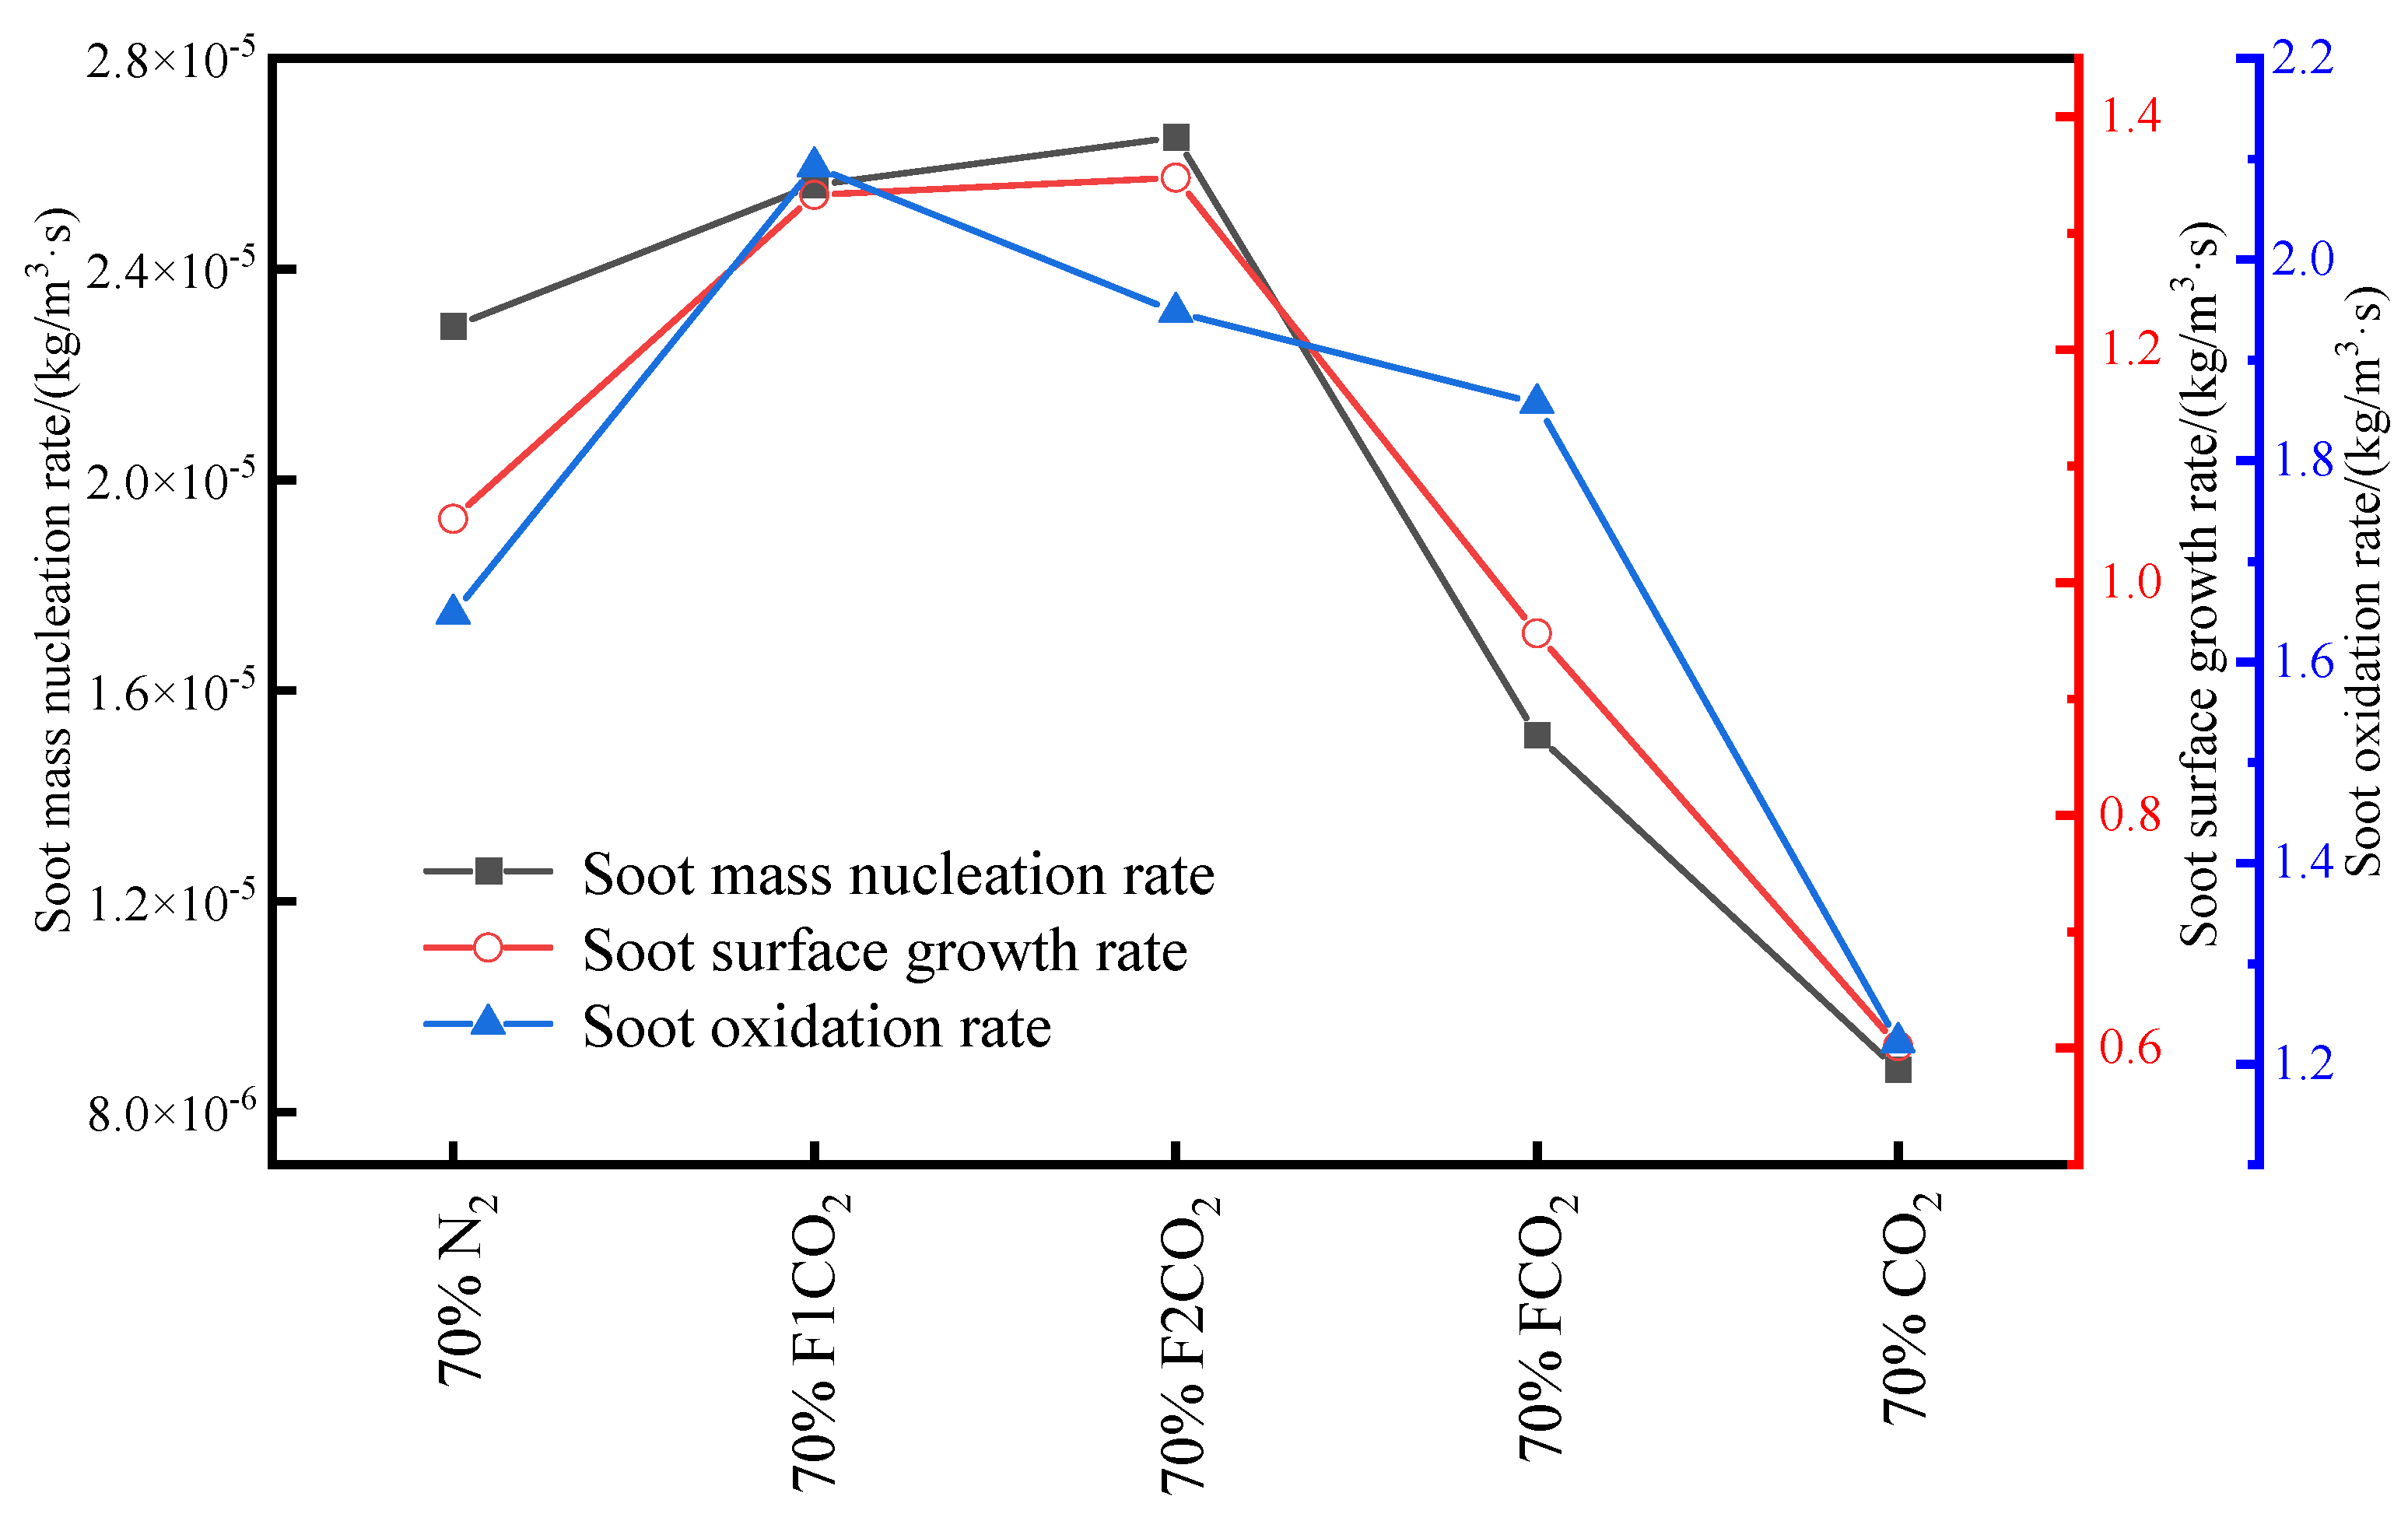
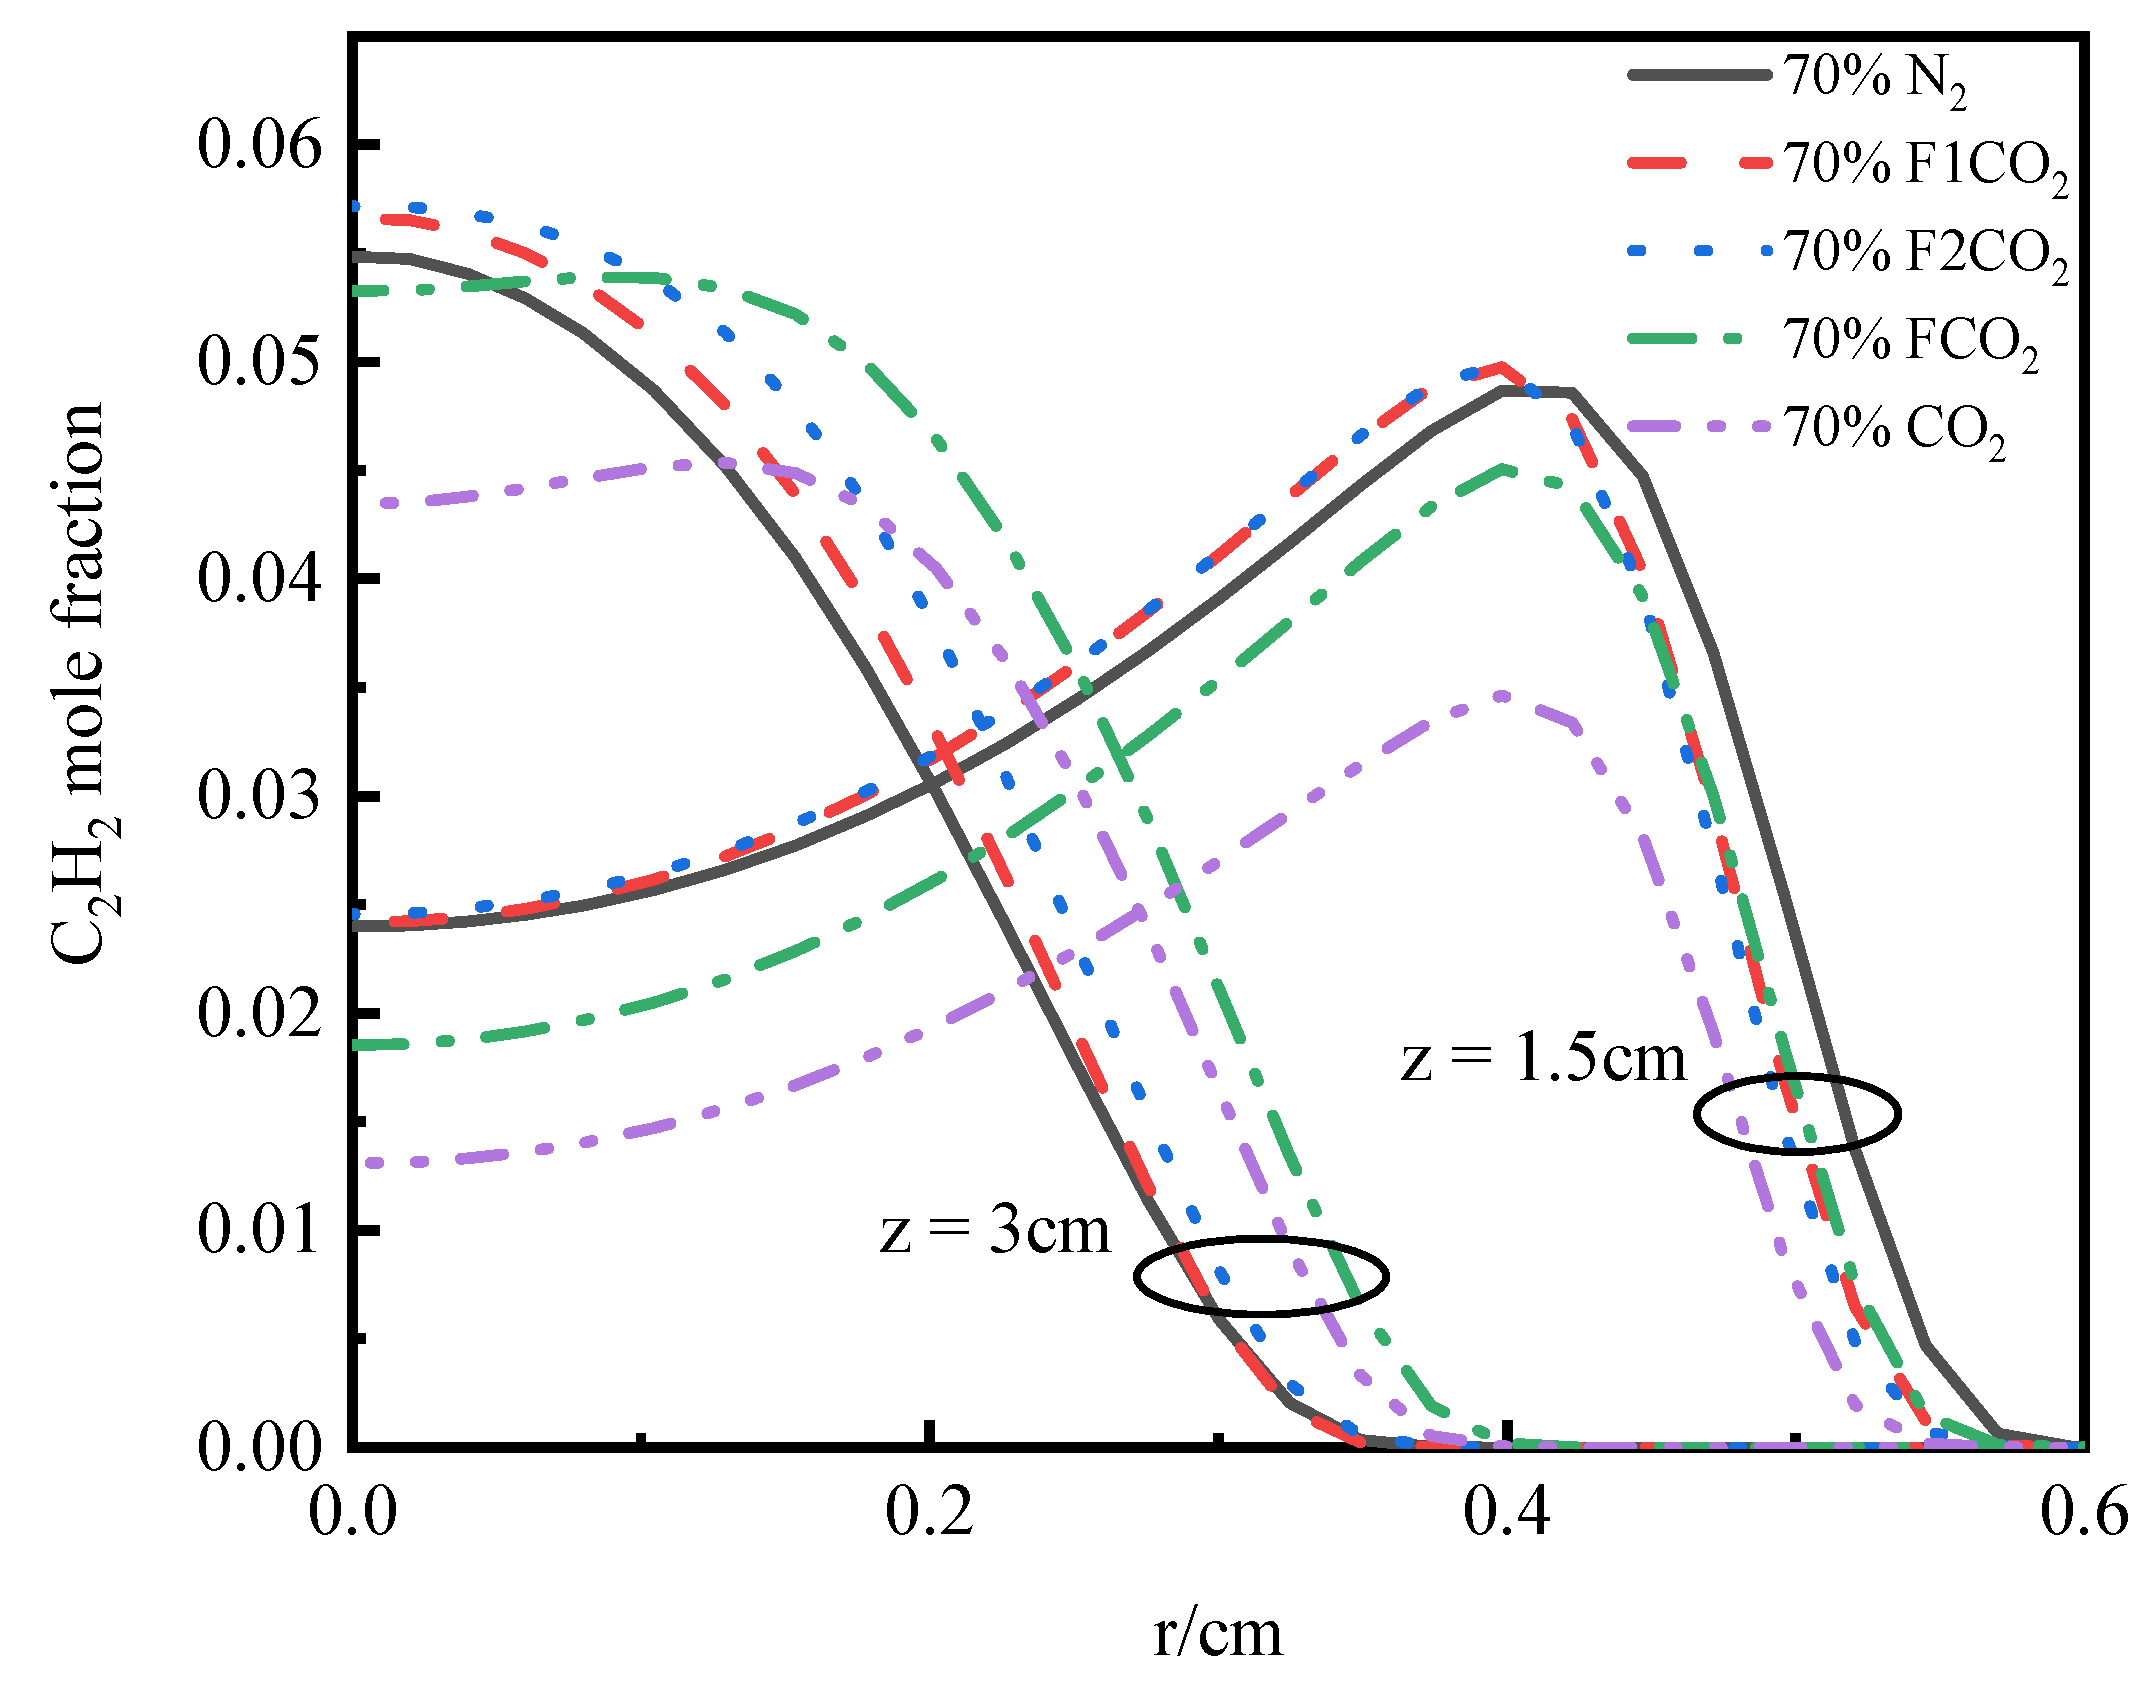
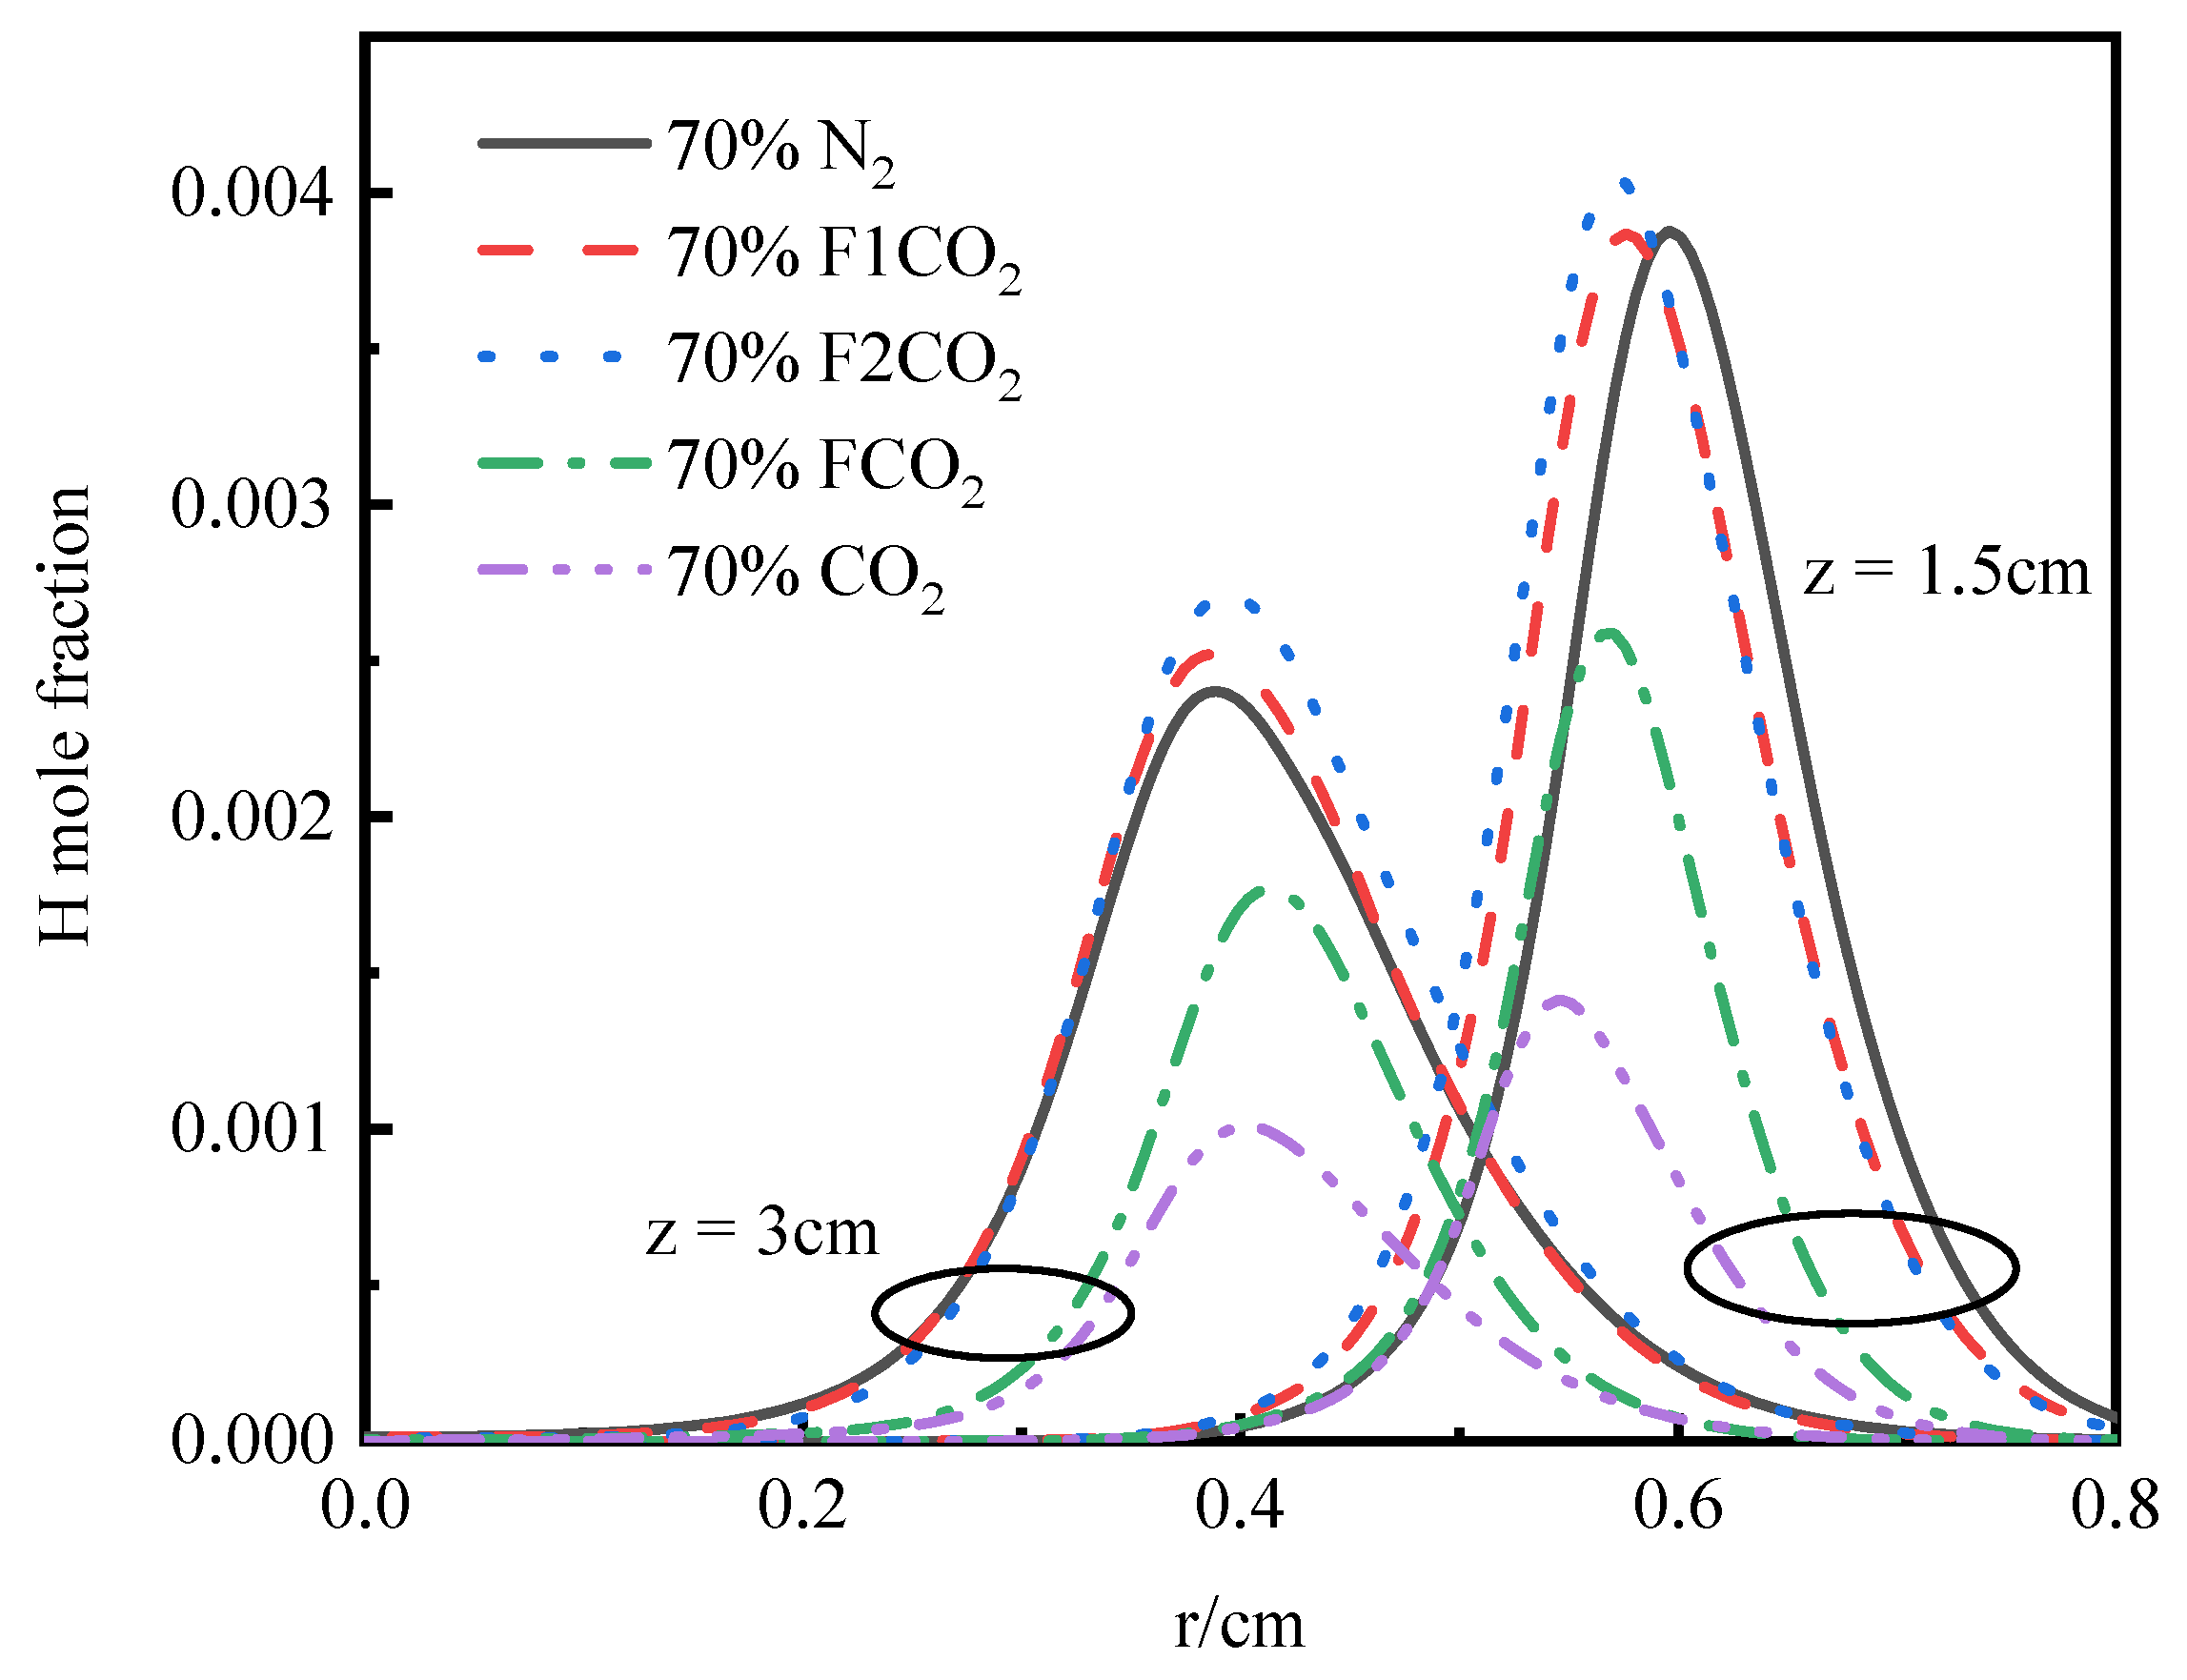
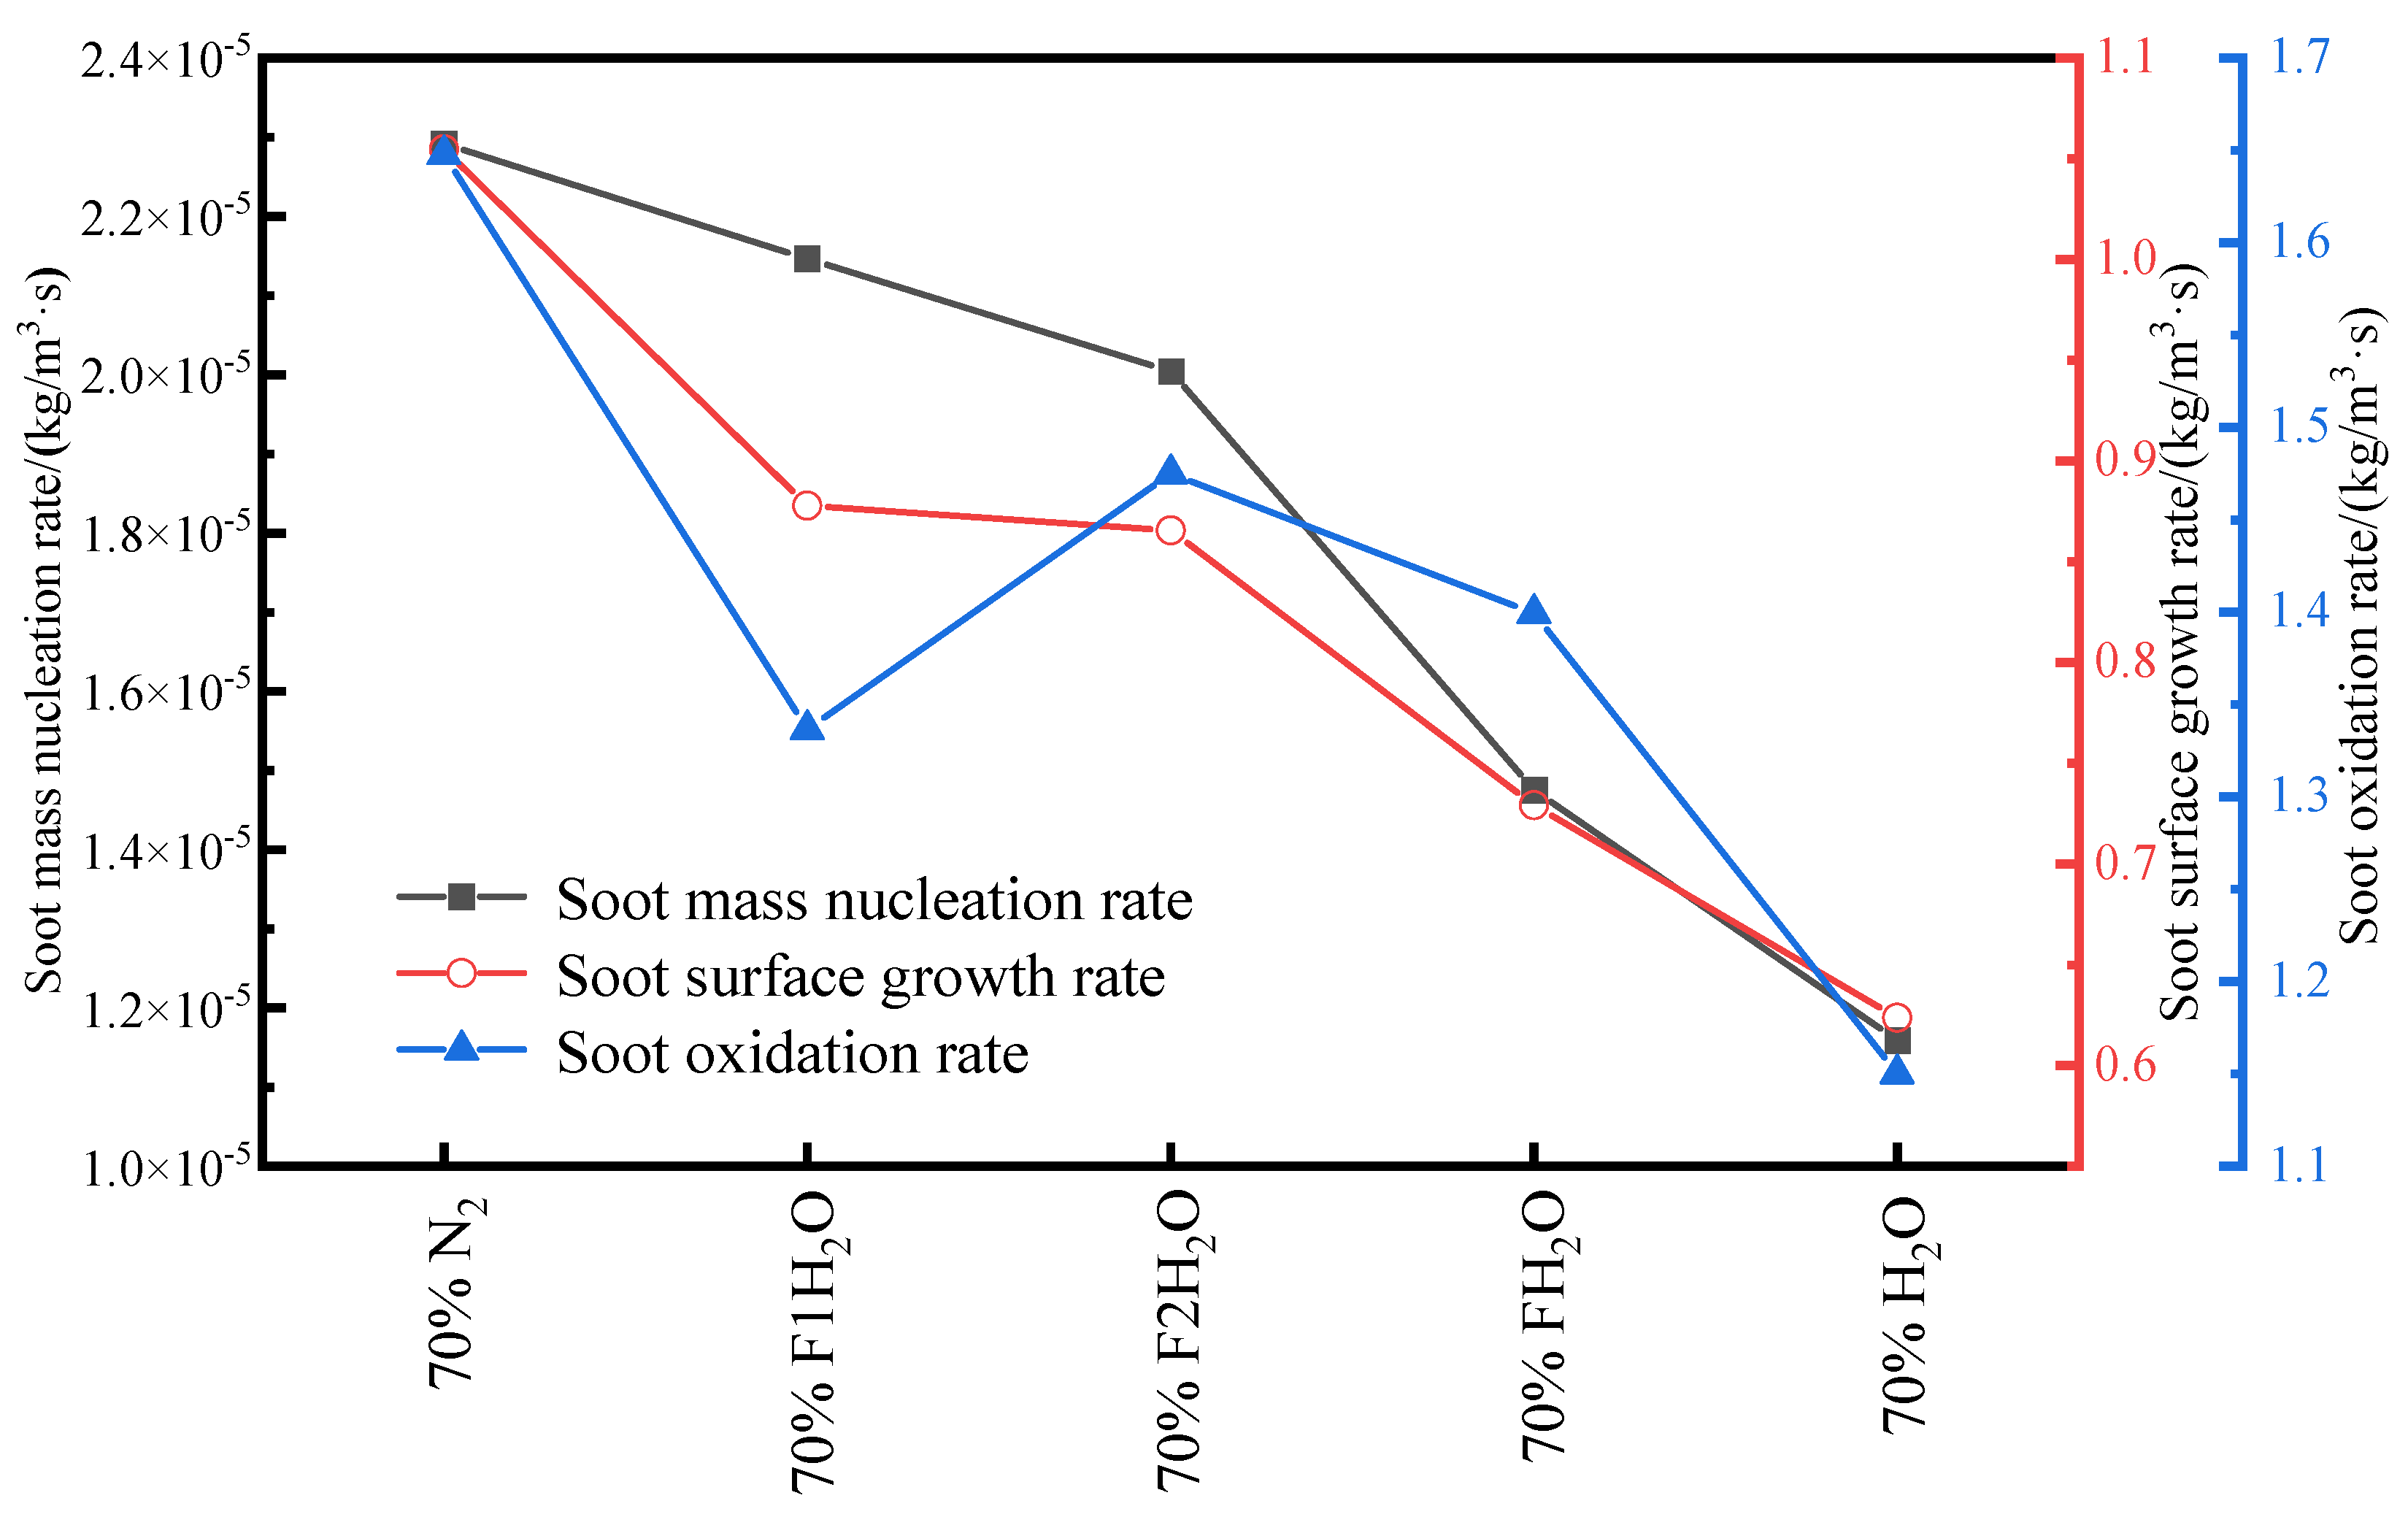
In the oxidizer, CO2 primarily impacts soot nucleation and surface growth rates by lowering flame temperature and reducing the mole fraction of H radicals, rather than by enhancing soot oxidation. In contrast, in oxy-steam combustion, the reaction OH + H2 ⇋ H + H2O plays a crucial role in suppressing soot formation. Here, the chemical effects of water vapor significantly inhibit soot generation by increasing OH radical concentrations.

Author Contributions

Conceptualization, Y.X. and B.L.; methodology, Y.Z.; software, Y.X.; validation, B.L.; formal analysis, Y.X.; investigation, B.L.; resources, Y.Z. and M.S.; data curation, Y.X.; writing—original draft preparation, Y.X.; writing—review and editing, J.J.C.; visualization, Y.X.; Supervision, M.S.; project administration, Y.Z.; funding acquisition, Y.Z. All authors have read and agreed to the published version of the manuscript.

Funding

The authors acknowledge the financial support of the National Natural Science Foundation of China (Nos. 52274060 and 52206218).

Data Availability Statement

The original contributions presented in this study are included in the article. Further inquiries can be directed to the corresponding author(s).

Acknowledgments

The authors acknowledge the financial support of the National Natural Science Foundation of China (Nos. 52274060 and 52206218), the National Overseas Study Foundation of China (201708420106), the Yangtze Youth Talents Fund (No. 2015cqt01). Shadrack Adjei Takyi and Guang Luo are also acknowledged for revision manuscript.

Conflicts of Interest

The authors declare no conflict of interest.

Nomenclature and Abbreviations

rRadial distance
zAxial distance
PAHspolycyclic aromatic hydrocarbons
HACAHydrogen extraction surface addition
OIOxygen-index
m ˙ Molar mass
SVFSoot volume fraction
HABHeight above burner
C2H2acetylene

References

  1. Greiner, P.T.; York, R.; Mcgee, J.A. When are fossil fuels displaced? An exploratory inquiry into the role of nuclear electricity production in the displacement of fossil fuels. Heliyon 2022, 8, e08795. [Google Scholar] [CrossRef] [PubMed]
  2. Shaw, R.; Naskar, S.; Das, T.; Chowdhury, A. A Review on the Advanced Techniques Used for the Capturing and Storage of CO2 from Fossil Fuel Power Plants. In Sustainability in Environmental Engineering and Science, Proceedings of the Select Proceedings of SEES 2019 Springer, Singapore; Springer: Berlin/Heidelberg, Germany, 2020; pp. 193–197. [Google Scholar] [CrossRef]
  3. Luo, Z.; Xiang, Q.; Cheng, Q.; Lou, C. Changing characteristics of flame images under different oxy-fuel atmospheres in a 3-MW pilot-scale furnace. IEEE Trans. Instrum. Meas. 2016, 65, 2265–2271. [Google Scholar] [CrossRef]
  4. Li, Y.; Fan, W.; Wang, Y.; Chen, C. Characteristics of char gasification in staged oxygen-enriched combustion in a down flame furnace. Energy Fuels 2016, 30, 1675–1684. [Google Scholar] [CrossRef]
  5. Lou, C.; Chen, X.; Yan, W.; Tian, Y.; Kumfer, B.M. Effect of stoichiometric mixture fraction on soot fraction and emission spectra with application to oxy-combustion. Proc. Combust. Inst. 2019, 37, 4571–4578. [Google Scholar] [CrossRef]
  6. Lou, C.; Li, Z.; Zhang, Y.; Kumfer, B.M. Soot formation characteristics in laminar co-flow flames with application to oxy-combustion. Combust. Flame 2021, 227, 371–383. [Google Scholar] [CrossRef]
  7. Park, J.; Kim, S.G.; Lee, K.M.; Kim, T.K. Chemical effect of diluents on flame structure and NO emission characteristic in methane-air counterflow diffusion flame. Int. J. Energy Res. 2002, 26, 1141–1160. [Google Scholar] [CrossRef]
  8. Wang, Y.; Chung, S.H. Formation of soot in counterflow diffusion flames with carbon dioxide dilution. Combust. Sci. Technol. 2016, 188, 805–817. [Google Scholar] [CrossRef]
  9. Chen, L.; Zheng, X.; Zhou, J.; Wu, J.; Wu, X.; Gao, X.; Gréhan, G.; Cen, K. Effects of carbon dioxide addition on the soot particle sizes in an ethylene/air flame. Aerosol Air Qual. Res. 2017, 17, 2522–2532. [Google Scholar] [CrossRef]
  10. Zhang, Y.; Liu, F.; Lou, C. Experimental and numerical investigations of soot formation in laminar coflow ethylene flames burning in O2/N2 and O2/CO2 atmospheres at different O2 mole fractions. Energy Fuels 2018, 32, 6252–6263. [Google Scholar] [CrossRef]
  11. Xie, Y.; Wang, J.; Xu, N.; Yu, S.; Huang, Z. Comparative study on the effect of CO2 and H2O dilution on laminar burning characteristics of CO/H2/air mixtures. Int. J. Hydrogen Energy 2014, 39, 3450–3458. [Google Scholar] [CrossRef]
  12. Xu, H.; Liu, F.; Sun, S.; Zhao, Y.; Meng, S.; Tang, W. Effects of H2O and CO2 diluted oxidizer on the structure and shape of laminar coflow syngas diffusion flames. Combust. Flame 2017, 177, 67–78. [Google Scholar] [CrossRef]
  13. Liu, F.; Consalvi, J.L.; Fuentes, A. Effects of water vapor addition to the air stream on soot formation and flame properties in a laminar co flow ethylene/air diffusion flame. Combust. Flame 2014, 161, 1724–1734. [Google Scholar] [CrossRef]
  14. Ying, Y.; Liu, D. Effects of water addition on soot properties in ethylene inverse diffusion flames. Fuel 2019, 247, 187–197. [Google Scholar] [CrossRef]
  15. Cepeda, F.; Jerez, A.; Demarco, R.; Liu, F.; Fuentes, A. Influence of water-vapor in oxidizer stream on the sooting behavior for laminar co-flow ethylene diffusion flames. Combust. Flame 2019, 210, 114–125. [Google Scholar] [CrossRef]
  16. Qiu, L.; Zheng, Y.; Hua, Y.; Zhuang, Y.; Qian, Y.; Cheng, X. Effects of water vapor addition on the flame structure and soot formation in a laminar ethanol/air co flow flame. Combust. Sci. Technol. 2021, 193, 626–642. [Google Scholar] [CrossRef]
  17. Hu, X.; Wei, H. Experimental investigation of laminar flame speeds of propane in O2/CO2 atmosphere and kinetic simulation. Fuel 2020, 268, 117347. [Google Scholar] [CrossRef]
  18. Zhang, Y.; Xin, Y.; Si, M.; Liu, F.; Lou, C. Experimental Study on Soot Formation and Primary Particle Size in Oxy-Combustion Ethylene Diffusion Flames under CO2 Substitution for N2. Case Stud. Therm. Eng. 2023, 48, 103060. [Google Scholar] [CrossRef]
  19. Wu, J.; Chen, L.; Bengtsson, P.E.; Zhou, J.; Zhang, J.; Wu, X.; Cen, K. Effects of carbon dioxide addition to fuel on soot evolution in ethylene and propane diffusion flames. Combust. Flame 2019, 199, 85–95. [Google Scholar] [CrossRef]
  20. Liu, H.; Zheng, S.; Zhou, H. Measurement of soot temperature and volume fraction of axisymmetric ethylene laminar flames using hyperspectral tomography. IEEE Trans. Instrum. Meas. 2016, 66, 315–324. [Google Scholar] [CrossRef]
  21. Wu, Y.H.; Hu, Y.H.; Jiang, F.; Zhang, L.H. Design of temperature measurement system based on two-color imaging in adaptive optics of CCD. In Proceedings of the 5th International Symposium on Advanced Optical Manufacturing and Testing Technologies, Dalian, China, 26–29 April 2010; Volume 7656. [Google Scholar] [CrossRef]
  22. Bowen, L.; Chengjing, W.; Yindi, Z.; Bing, L.; Fanjin, Z.; Takyi, S.A.; Tontiwachwuthikuld, P. Effect of CO2/H2O addition on laminar diffusion flame structure and soot formation of oxygen-enriched ethylene. J. Energy Inst. 2022, 102, 160–175. [Google Scholar] [CrossRef]
  23. Legros, G.; Wang, Q.; Bonnety, J.; Kashif, M.; Morin, C.; Consalvi, J.L.; Liu, F. Simultaneous soot temperature and volume fraction measurements in axis-symmetric flames by a two-dimensional modulated absorption/emission technique. Combust. Flame 2015, 162, 2705–2719. [Google Scholar] [CrossRef]
  24. Smyth, K.C.; Shaddix, C.R. The elusive history of m∼= 1.57 − 0.56 I for the refractive index of soot. Combust. Flame 1996, 107, 314–320. [Google Scholar] [CrossRef]
  25. Zhang, Y.; Liu, F.; Clavel, D.; Smallwood, G.; Lou, C. Measurement of Soot Volume Fraction and Primary Particle Diameter in Oxygen Enriched Ethylene Diffusion Flames Using the Laser-induced Incandescence Technique. Energy 2019, 177, 421–432. [Google Scholar] [CrossRef]
  26. Charest MR, J.; Groth CP, T.; Gülder Ö, L. Effects of gravity and pressure on laminar coflow methane-air diffusion flames at pressures from 1 to 60 atmospheres. Combust. Flame 2011, 158, 860–875. [Google Scholar] [CrossRef]
  27. Sunderland, P.B.; Faeth, G.M. Soot formation in hydrocarbon/air laminar jet diffusion flames. Combust. Flame 1996, 105, 132–146. [Google Scholar] [CrossRef]
  28. Smith, T.F.; Shen, Z.F.; Friedman, J.N. Evaluation of coefficients for the weighted sum of gray gases model. J. Heat Transfer. 1982, 104, 602–608. [Google Scholar] [CrossRef]
  29. Chu, H.; Yan, Y.; Xiang, L.; Han, W.; Ren, F.; Peng, L. Effect of oxygen-rich combustion on soot formation in laminar co-flow propane diffusion flames. J. Energy Inst. 2020, 93, 822–832. [Google Scholar] [CrossRef]
  30. Appel, J.; Bockhorn, H.; Frenklach, M. Kinetic modeling of soot formation with detailed chemistry and physics: Laminar premixed flames of C2 hydrocarbons. Combust. Flame 2000, 121, 122–136. [Google Scholar] [CrossRef]
  31. Kalvakala, K.C.; Katta, V.R.; Aggarwal, S.K. Effects of oxygen-enrichment and fuel unsaturation on soot and NOx emissions in ethylene, propane, and propene flames. Combust. Flame 2018, 187, 217–229. [Google Scholar] [CrossRef]
  32. Mahmoud, N.M.; Zhong, W.; Ibrahim, J.N.; Wang, Q. Flame Structure and Soot-Precursor Formation of Coflow n-Heptane Diffusion Flame Burning in O2/N2 and O2/CO2 Atmosphere. J. Energy Eng. 2021, 147, 04021027. [Google Scholar] [CrossRef]
  33. Wang, Y.; Gu, M.; Gao, Y.; Liu, X.; Lin, Y. An experimental and numerical study of soot formation of laminar coflow H2/C2H4 diffusion flames in O2-CO2 atmosphere. Combust. Flame 2020, 221, 50–63. [Google Scholar] [CrossRef]
  34. Lee, K.B.; Thring, M.W.; Beer, J.M. On the rate of combustion of soot in a laminar soot flame. Combust. Flame 1962, 6, 137–145. [Google Scholar] [CrossRef]
  35. Zhang, Q.; Thomson, M.J.; Guo, H.; Liu, F.; Smallwood, G.J. A numerical study of soot aggregate formation in a laminar coflow diffusion flame. Combust. Flame 2009, 156, 697–705. [Google Scholar] [CrossRef]
  36. Liu, F.; Ai, Y.; Kong, W. Effect of hydrogen and helium addition to fuel on soot formation in an axisymmetric coflow laminar methane/air diffusion flame. Int. J. Hydrogen Energy 2014, 39, 3936–3946. [Google Scholar] [CrossRef]
  37. Wang, Y.; Gu, M.; Zhu, Y.; Cao, L.; Zhu, B.; Wu, J.; Lin, Y.; Huang, X. A review of the effects of hydrogen, carbon dioxide, and water vapor addition on soot formation in hydrocarbon flames. Int. J. Hydrogen Energy 2021, 46, 31400–31427. [Google Scholar] [CrossRef]
  38. Guo, H.; Smallwood, G.J. Numerical study on the influence of CO2 addition on soot formation in an ethylene/air diffusion flame. Combust. Sci. Technol. 2008, 180, 1695–1708. [Google Scholar] [CrossRef]
  39. Bedick, C.R.; Kolczynski, L.; Woodside, C.R. Combustion plasma electrical conductivity model development for oxy-fuel MHD applications. Combust. Flame 2017, 181, 225–238. [Google Scholar] [CrossRef]
Figure 1. Test platform for laminar diffusion flame combustion of hydrocarbon fuels.
Energies 17 06232 g001
Figure 2. Illustrative diagram of the experimental apparatus.
Energies 17 06232 g002
Figure 3. Illustrative diagram of horizontal cross-section measurement of the flame [22].
Energies 17 06232 g003
Figure 4. M330 high temperature blackbody furnace.
Energies 17 06232 g004
Figure 5. Physical modeling and computing domain grid. (a) Burner Modeling; (b) meshing.
Energies 17 06232 g005
Figure 6. Axial centerline temperature profiles and peak temperatures of a propane diffusion flame at three grid resolutions.
Energies 17 06232 g006
Figure 7. Radial distribution of temperature and soot volume fraction at z = 30 mm under OI = 21%, compared to Chu H. et al. [29] (a) Temperature; (b) SVF.
Energies 17 06232 g007
Figure 8. Radial distribution of temperature and soot volume fraction at z = 30 mm under OI = 25%, compared to Chu H. et al. [29] (a) Temperature; (b) SVF.
Energies 17 06232 g008
Figure 9. Specification of C3H8/(O2/N2) flames under different working conditions.
Energies 17 06232 g009
Figure 10. Two-dimensional soot volume fraction distribution in C3H8/(O2/N2) atmosphere. (a) Case 3-1; (b) Case 3-2; (c) Case 3-3; (d) Case 3-4; (e) Case 3-5.
Energies 17 06232 g010
Figure 11. Simulated two-dimensional soot volume fraction distribution in C3H8/(O2/N2) atmosphere. (a) Case 3-6; (b) Case 3-7; (c) Case 3-8; (d) Case 3-9; (e) Case 3-10.
Energies 17 06232 g011
Figure 12. Two-dimensional distribution of flame temperature measurement in C3H8/(O2/N2) atmosphere. (a) Case 3-1; (b) Case 3-2; (c) Case 3-3; (d) Case 3-4; (e) Case 3-5.
Energies 17 06232 g012
Figure 13. Simulated two-dimensional flame temperature distribution in C3H8/(O2/N2) atmosphere. (a) Case 3-6; (b) Case 3-7; (c) Case 3-8; (d) Case 3-9; (e) Case 3-10.
Energies 17 06232 g013
Figure 14. Nucleation and surface growth rates of soot under O2/N2 and O2/CO2 atmospheres.
Energies 17 06232 g014
Figure 15. Simulated two-dimensional temperature distribution with CO2 as a virtual component. (a) Case 3-1; (b) Case 3-2; (c) Case 3-3; (d) Case 3-4; (e) Case 3-5.
Energies 17 06232 g015
Figure 16. Central axis temperature and axial velocity of the flame with the addition of the virtual component CO2.
Energies 17 06232 g016
Figure 17. Radial axial velocity profiles at various heights with CO2 as a virtual component.
Energies 17 06232 g017
Figure 18. Simulated two-dimensional OH mole fraction distribution with CO2 as a virtual component. (a) Case 3-1; (b) Case 3-2; (c) Case 3-3; (d) Case 3-4; (e) Case 3-5.
Energies 17 06232 g018
Figure 19. Overall and relative impact of CO2 on flame height.
Energies 17 06232 g019
Figure 20. Simulated two-dimensional soot volume fraction with CO2 as a virtual component. (a) Case 3-1; (b) Case 3-2; (c) Case 3-3; (d) Case 3-4; (e) Case 3-5.
Energies 17 06232 g020
Figure 21. Soot formation rates with CO2 as a virtual component.
Energies 17 06232 g021
Figure 22. Radial temperature profiles with CO2 as a virtual component.
Energies 17 06232 g022
Figure 23. C2H2 radial distribution after the addition of CO2 as a virtual component.
Energies 17 06232 g023
Figure 24. H radial distribution after the addition of CO2 as a virtual component.
Energies 17 06232 g024
Figure 25. OH radial distribution after the addition of CO2 as a virtual component.
Energies 17 06232 g025
Figure 26. Change in elementary reaction rate as a result of adding CO2 as a virtual component.
Energies 17 06232 g026
Figure 27. Simulated two-dimensional temperature distribution with H2O as a virtual component. (a) Case 3-6; (b) Case 3-7; (c) Case 3-8; (d) Case 3-9; (e) Case 3-10.
Energies 17 06232 g027
Figure 28. Central axis temperature and axial velocity of the flame with the addition of the virtual component H2O.
Energies 17 06232 g028
Figure 29. Radial axial velocity profiles at various heights with H2O as a virtual component.
Energies 17 06232 g029
Figure 30. Simulated two-dimensional OH mole fraction distribution with H2O as a virtual component. (a) Case 3-6; (b) Case 3-7; (c) Case 3-8; (d) Case 3-9; (e) Case 3-10.
Energies 17 06232 g030
Figure 31. Overall and relative impact of H2O on flame height.
Energies 17 06232 g031
Figure 32. Simulated two-dimensional soot volume fraction with H2O as a virtual component. (a) Case 3-6; (b) Case 3-7; (c) Case 3-8; (d) Case 3-9; (e) Case 3-10.
Energies 17 06232 g032
Figure 33. Soot formation rates with H2O as a virtual component.
Energies 17 06232 g033
Figure 34. Radial temperature profiles with H2O as a virtual component.
Energies 17 06232 g034
Figure 35. C2H2 radial distribution after the addition of H2O as a virtual component.
Energies 17 06232 g035
Figure 36. H radial distribution after the addition of H2O as a virtual component.
Energies 17 06232 g036
Figure 37. OH radial distribution after the addition of H2O as a virtual component.
Energies 17 06232 g037
Figure 38. Change in elementary reaction rate as a result of adding H2O as a virtual component.
Energies 17 06232 g038
Table 1. Experimental condition.
Test ConditionsFuel Flow/(mL·min−1)OICo-Flow Air Flow Rate/(L·min−1)
C3H8TotalN2
Case 1109.819%4032.4
Case 2109.821%4031.6
Case 3109.825%4030
Case 4109.829%4028.4
Case 5109.833%4026.8
Table 2. Design conditions of different oxidant components.
CaseOxidant Composition (Mole Fraction) Remark
XO2 **XN2XF1CO2XF2CO2XFCO2XCO2The Velocity of Co-Current Gas Flow/(m·s−1)
3-10.30.7 0.1783Bench
3-2 0.7 0.17831 and 2, Density effect
3-3 0.7 0.17832 and 3, Transport effect
3-4 0.7 0.17833 and 4, Thermal effect
3-5 0.70.17834 and 5, Chemical effect
** X is used to refer to virtual matter, and these symbols in Table 2 and Table 3 (e.g., XF, XF1, XF2) are only used to identify virtual species with different effects and have no actual physical meaning.
Table 3. Design conditions of different oxidant components.
CaseOxidant Composition (Mole Fraction) Remark
XO2XN2XF1H2OXF2H2OXFH2OXH2OThe Velocity of Co-Current Gas Flow/(m·s−1)
3-60.30.7 0.1783Bench
3-7 0.7 0.17831 and 2, Density effect
3-8 0.7 0.17832 and 3, Transport effect
3-9 0.7 0.17833 and 4, Thermal effect
3-10 0.70.17834 and 5, Chemical effect
Table 4. Physical properties of N2, CO2 and H2O (1000 K, 0.1 MPa).
CasDensity (kg/m3)Heat Capacity (J/mol·K)Isobaric Specific Heat Capacity (J/mol·K)Coefficient of Thermal Conductivity (W/m·K)Thermal Diffusivity (m2/s)
N20.3432.96341.2930.0970851.95 × 10−4
CO20.544654.3220.0705711.08 × 10−4
H2O0.2224.38632.7030.0659911.68 × 10−4
Table 5. Error analysis of peak temperature and soot volume fraction.
OIParameterCurrent Numerical ResultsExperimental ResultsChu et al. [29] ResultsRelative Error (%): Current vs. ExperimentalRelative Error (%): Current vs. Chu et al. [29]
21%Peak Temperature (K)1986.581933.311922.312.763.34
Peak SVF (ppm)2.652.702.511.855.58
25%Peak Temperature (K)2161.712106.572172.412.620.49
Peak SVF (ppm)4.714.864.523.094.20
Disclaimer/Publisher’s Note: The statements, opinions and data contained in all publications are solely those of the individual author(s) and contributor(s) and not of MDPI and/or the editor(s). MDPI and/or the editor(s) disclaim responsibility for any injury to people or property resulting from any ideas, methods, instructions or products referred to in the content.

