1. Introduction
Current energy consumption in buildings, which includes heating and hot water production, accounts for approximately 40% of the total energy consumption in the European Union. A portion of this energy is supplied through central heat sources, often connected to district heating plants. These plants typically rely on fossil fuels as their primary energy source, leading to increased CO
2 emissions [
1]. Therefore, the European Union supports energy projects aimed at strengthening the use of renewable energy sources [
2]. Among renewable sources, biomass plays a key role in central heating systems, but its further development faces certain limitations. Solar energy thus appears to be the most promising renewable source for obtaining heat, making it necessary to pay increased attention to solar thermal plants [
3]. However, like other renewable energy sources, solar energy has one significant drawback: its performance is unstable and fluctuates according to daily, weekly, and seasonal cycles [
4]. This leads to a mismatch between energy demand and availability [
5]. In the case of solar heat, this mismatch means high availability in the summer when demand is low and low availability during the winter heating season when demand is highest [
6]. Among various methods of thermal energy storage (TES), one system stands out as promising for overcoming the intermittent availability of solar energy [
7]. Specifically, seasonal TES systems are significant for addressing the mismatch between excess heat obtained during summer and the demand for it during the winter heating season. This TES system allows for the storage of excess energy generated from intermittent sources and its subsequent use as needed, where and when energy demand is highest. TES systems thus provide a solution to the temporal mismatch between energy supply and demand. These systems are applicable across a broad spectrum of applications, from buildings (district heating, cooling, central heating, and hot water heating) to industrial use (storage of technical or waste heat). In recent years, TES systems have received increased attention as devices for the better utilization of energy from renewable sources [
8]. The proper selection of a TES system largely depends on the specific application and operational conditions (e.g., temperature range, volume, lifespan), storage duration (e.g., daily or seasonal), and economic feasibility [
9]. TES systems can be categorized into short-term and long-term storage systems. Short-term systems typically involve charging and then discharging energy over a few days, a practice referred to as daily thermal energy storage. Numerous studies have focused on various aspects of and perspectives on thermal energy storage. For example, Sarbu et al. reviewed sensible heat storage methods like water tanks and underground storage, as well as latent heat storage using phase change materials (PCMs). TES is particularly important for the solar heating/cooling of buildings, solar water heating, heat pump systems, and concentrated solar power (CSP) plants. It resulted in conclusion that TES can significantly reduce energy demand and CO
2 emissions in buildings and industrial sectors [
10].
Yang et al. confirmed that the seasonal storage of solar thermal energy through supercooled phase change materials offers a promising solution for decarbonizing space and water heating in winter and demonstrated that the common ultrasonication method can be the key to unlocking the latent heat stored in the CG-thickened erythritol, showing great potential to serve as a material for high-performance, ecofriendly PCMs for long-term seasonal solar energy storage [
11]. Aydin, D. et al. [
12] and Schmidt, T. et al. [
13] presented research that examines the storage materials used in relevant studies and the models used to predict and enhance system performance. One study [
12] aims to improve the efficiency and effectiveness of thermal energy storage by analyzing different materials and modeling techniques, and another [
13] provides insights into the performance and monitoring of these systems, highlighting their potential to store and utilize solar energy efficiently over long periods. These studies contribute to understanding how different materials and models can optimize thermal energy storage systems, making them more efficient and reliable.
The latest advancements in thermal energy storage (TES) for solar plants, as reviewed by Barrasso et al. [
14], emphasize the critical role of TES in enhancing the economic viability and energy continuity of solar systems. Arévalo et al. [
15] further explore recent developments in TES systems for renewable energy, highlighting significant technological breakthroughs in phase change materials and hybrid storage systems. Codd et al. [
16] focus on innovative concepts in concentrated solar power (CSP) and TES, showcasing advanced receiver designs and system architectures that promise increased efficiency and dispatchable power production. Collectively, these studies underscore the importance of TES in achieving sustainable and reliable renewable energy solutions.
Existing TES systems like aquifer thermal energy storage and borehole thermal energy storage effectively capture thermal energy but often present issues such as significant thermal losses, high initial costs, and complex maintenance requirements. ATES systems, for instance, risk heat dissipation to surrounding groundwater layers, while BTES installations face considerable upfront costs due to drilling requirements and are sensitive to climatic variations. This study builds on these challenges by advancing tank thermal energy storage technology through strategies that directly address thermal loss reduction and cost-effectiveness. By implementing a novel surface covering technique to reduce evaporation and deploying advanced sensor-based stratification monitoring, this research enhances energy retention within TTES, thereby offering a more efficient and economically feasible solution for seasonal thermal energy storage.
While current TES technologies, such as aquifer thermal energy storage, borehole thermal energy storage, and phase change material (PCM) systems, offer promising solutions for short- and long-term thermal storage, they still face significant challenges in efficiency, stratification management, and material stability over extended periods. This research addresses these limitations by introducing a novel approach to tank thermal energy storage, focusing on enhanced stratification stability and extended energy retention capabilities through optimized design and material innovations. Specifically, our study explores the potential of surface covering techniques and advanced sensor-based monitoring to mitigate heat loss and improve thermal stratification, thereby bridging the gap between intermittent renewable energy generation and consistent energy demand.
Working based on a review, the research at the Technical University of Košice aims to analyze and improve the efficiency of long-term thermal energy storage systems, particularly focusing on storage tanks and their ability to retain energy over time. Challenges with solar energy led us to discuss the instability of solar energy supply, which results in a mismatch between energy demand and availability, particularly in seasonal cycles.
2. Principles of Seasonal Thermal Energy Storage Technology
An analysis of the principles of seasonal thermal energy storage (STES) technology was conducted. The TES system serves to collect and store thermal energy for later use. This technology can be considered innovative as it enhances the efficiency of the energy system while contributing to a reduction in fossil fuel consumption by promoting the use of renewable energy sources [
17]. As mentioned earlier, the seasonal TES system is particularly significant for the application of solar energy sources, as it addresses the seasonal mismatch between the excess heat obtained during summer and the demand for it during the winter season. From a technical perspective, the STES system is considered complex [
18]. This complexity arises from the requirement for a large storage volume in order to meet seasonal needs. These systems can be located on the surface, partially embedded in the ground, or completely buried, where they provide underground thermal energy storage (UTES). The most common types of TES, according to their construction, include the aquifer thermal energy storage (ATES) system, borehole thermal energy storage (BTES) system, tank thermal energy storage (TTES), and pit thermal energy storage (PTES) [
19,
20].
2.1. Aquifer Thermal Energy Storage System
The ATES system uses a combination of natural water and earth (such as rock formations) to store thermal energy in underground layers, where two wells are drilled into the aquifer geological layer. One serves as the warm source, while the other functions as the cold source. Given the basic types of UTES systems, artificial tanks are not used in this case, eliminating the need for increased investment costs for their construction, which is a significant advantage. For this system, it is important that the aquifer layers are permeable, making it essential to choose a suitable medium that prevents the risk of contamination of groundwater and geological strata [
21].
2.2. Borehole Thermal Energy Storage
ATES systems use water to store energy in geological formations [
22]. In BTES systems, water can be replaced by other transfer agents such as glycol or brine depending on the specific requirements and conditions of the system [
23]. The water in these boreholes transfers thermal energy to the surrounding ground. The main difference between the ATES and BTES systems lies in the fact that BTES does not face the same limitations regarding the risk of the contamination of the geological substrate, which is a significant advantage over the ATES system [
24]. BTES systems are more sensitive to climatic fluctuations, which can affect the efficiency of thermal energy storage. These climatic changes can lead to higher thermal losses from the stored energy.
2.3. Tank Thermal Energy Storage
In this system, thermal energy is stored in tanks that are artificially constructed from reinforced concrete or stainless steel. Water is commonly used as the transfer medium [
25]. Due to the large area used for seasonal storage, these tanks have a thick layer of insulation. These tanks require a large amount of space, which is why they are built underground or partially underground. Freestanding tanks usually have a small volume. These tanks operate using stratification, where the medium (e.g., water) forms distinct temperature layers [
26]. In the tank, temperature layering can be observed, with the upper layer being warmer than the lower layer of the medium [
27]. Due to the difference in density, the cooler water settles at the bottom, creating a thermocline that acts as a barrier, preventing the mixing of warm- and cold-water layers [
28,
29].
2.4. Pit Thermal Energy Storage
This type of TES is often compared with the previous TTES system. In terms of operation, both systems can utilize temperature stratification [
30]. The main difference compared to TTES lies in the fact that the stored thermal energy is placed in excavations equipped with insulation and waterproof elements. The construction can also be made from reinforced concrete or stainless steel. However, this type of construction is more complex than that used in the TTES system. Geometrically, this structure differs in shape, with walls inclined and the entire structure resembling an inverted pyramid with a rectangular base [
31]. Water is used as the medium, but a mixture of gravel and water is also often used. It is important to note that this mixture has a different specific heat capacity, meaning that the volume of the storage tank must be approximately 50% larger than that in the TTES to compensate for the difference in specific heat capacity [
10,
32].
2.5. Financial Aspects of Thermal Energy Storage
TES systems can have high initial costs due to the technology and infrastructure required. However, these costs can vary significantly based on the type and scale of the system. The payback period for TES systems can be long, often ranging from 10 to 15 years. This period can be reduced with subsidies and incentives, making the investment more attractive. Many governments offer subsidies and incentives to promote renewable energy projects, including TES systems [
33,
34,
35].
3. Materials and Methods
The hypothesis of this study is that thermal energy storage systems can effectively bridge the gap between energy supply and demand, particularly for renewable energy sources like solar energy, by storing excess energy for later use.
The overall tasks in the construction of large-volume storage tanks include utilizing storage tanks to accumulate waste heat from machines and equipment operated within the laboratories of the Faculty of Civil Engineering (e.g., high-performance presses, breaking tracks, other machinery), and simultaneously using these tanks for the long-term accumulation of heat obtained from the solar system in order to support indoor heating and hot water systems.
The research content also includes the investigation of processes associated with charging tanks from a solar system, the study of water tank cooling processes, and the investigation of factors in tanks such as stratification, environmental impact, and surface evaporation losses. The output is a proposal for measures to increase heat accumulation in water tanks and optimize the use of accumulated heat for hot water and heating by considering direct withdrawal or cooling with a water/water heat pump. Based on tank research, a simulation tool for evaluating tank accumulation is developed.
Objectives
Given the wide scope of the research presented, we focused on the following sub-objectives:
The experimental measurement of cooling processes in storage tanks;
The evaluation of cooling and the effect of covering the tank surface;
The determination of the effect of the size of the storage tank on the cooling rate;
The investigation of the process of temperature stratification of water in tanks;
The development of a simulation tool for evaluating tanks.
The research presented is based on measurements conducted on real tanks under the climatic conditions of Slovakia. The size, shape, and location of the tanks were primarily influenced by technical conditions, basic construction conditions, and financial constraints in the construction of buildings and storage tanks as part of them.
3.1. Experimental Measurement of Cooling Processes in Storage Tanks
The experiments were conducted in a newly constructed building on the campus of the Technical University of Košice. Storage tanks (
Figure 1) for long-term thermal energy storage were integrated into the building’s design from the outset. During construction, minor adjustments were made to these tanks, which were installed beneath the building. This investment was part of the construction of the laboratory hall buildings.
3.1.1. Operating Conditions
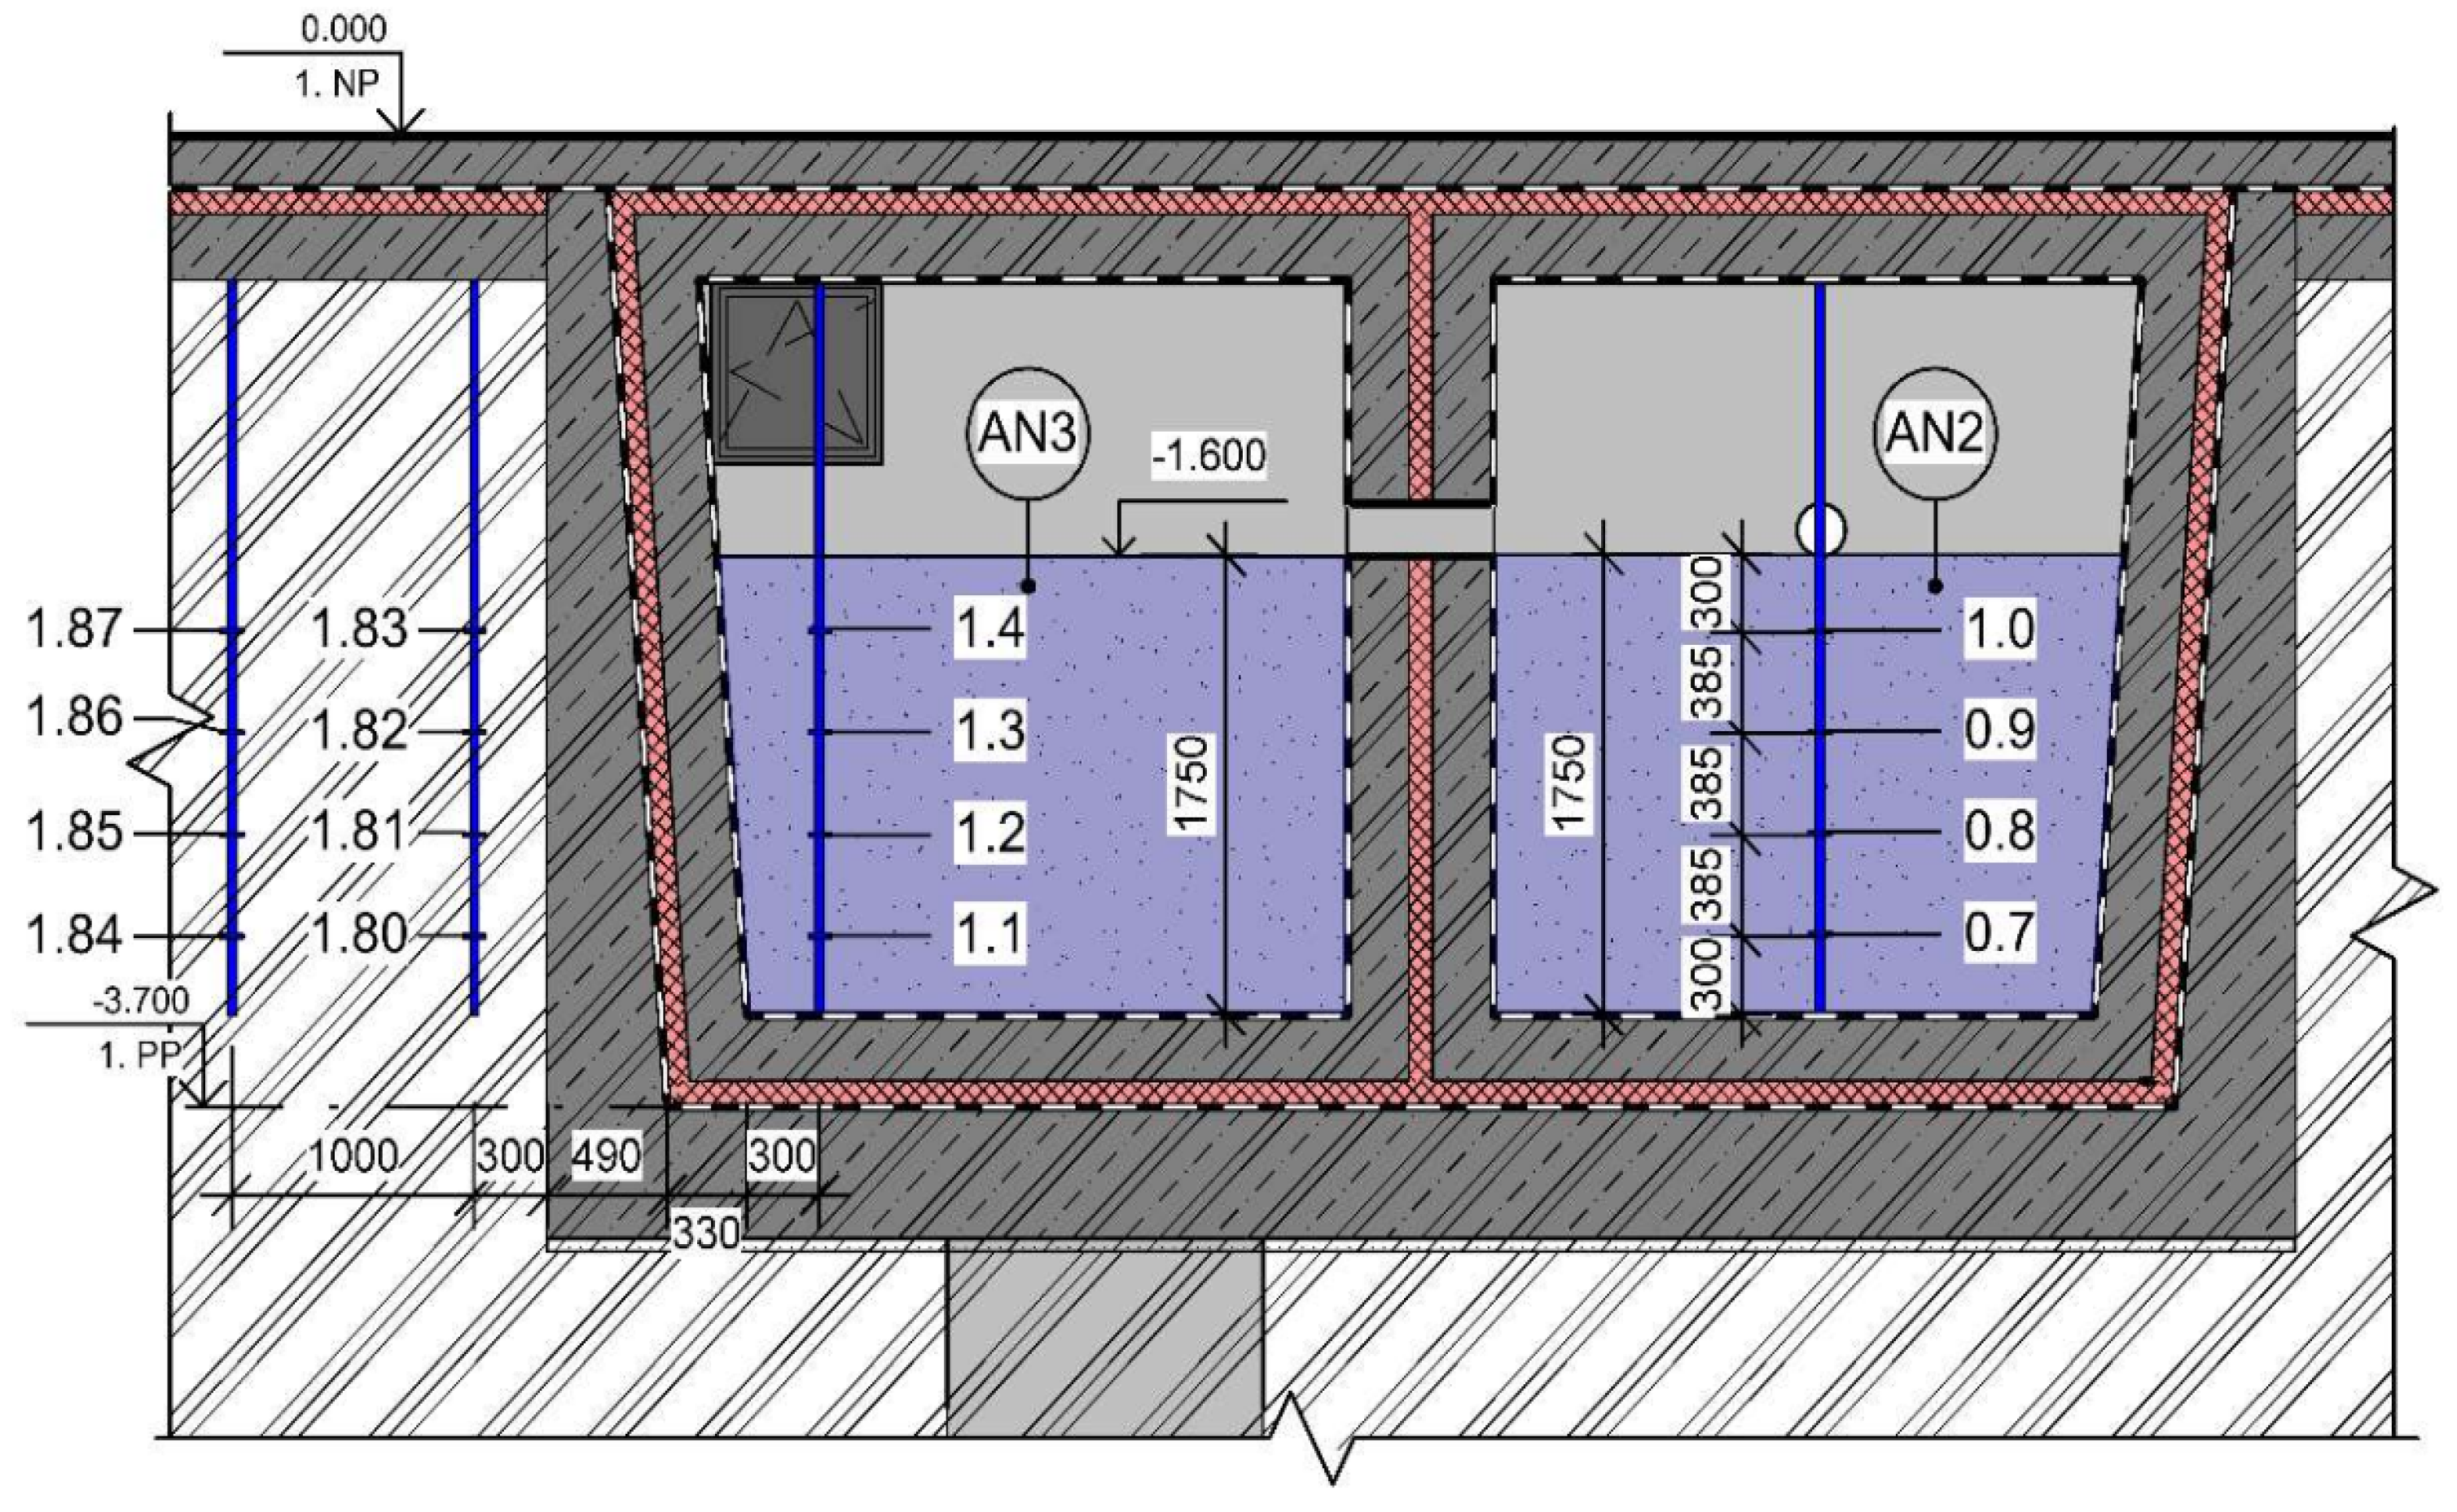
The underground tanks (
Figure 2) are made of reinforced concrete and designed to withstand significant mechanical loads and temperature variations. A special hydro-insulation coating is applied inside the tanks to prevent water seepage through micro-cracks in the concrete. This coating is crucial for maintaining the integrity of the tanks, especially given the temperature fluctuations and mechanical stresses they endure. Additionally, the tanks are insulated against ground moisture, ensuring stability and minimizing thermal losses. The groundwater level is situated 2 to 3 m below the bottom of the tanks, contributing to the overall stability and efficiency of the thermal energy storage system.
The tanks are accessed directly from the technical room, which has openings that provide access to temperature sensors. The technical room is located at the bottom level of the storage tanks and is accessible via a staircase. This room houses heat exchangers, pumps, fittings, pipes, measurement and regulation equipment, and other components of the tank system. The temperature in the technical room remains around 20 °C throughout the year, serving as a reference value for energy balance comparisons.
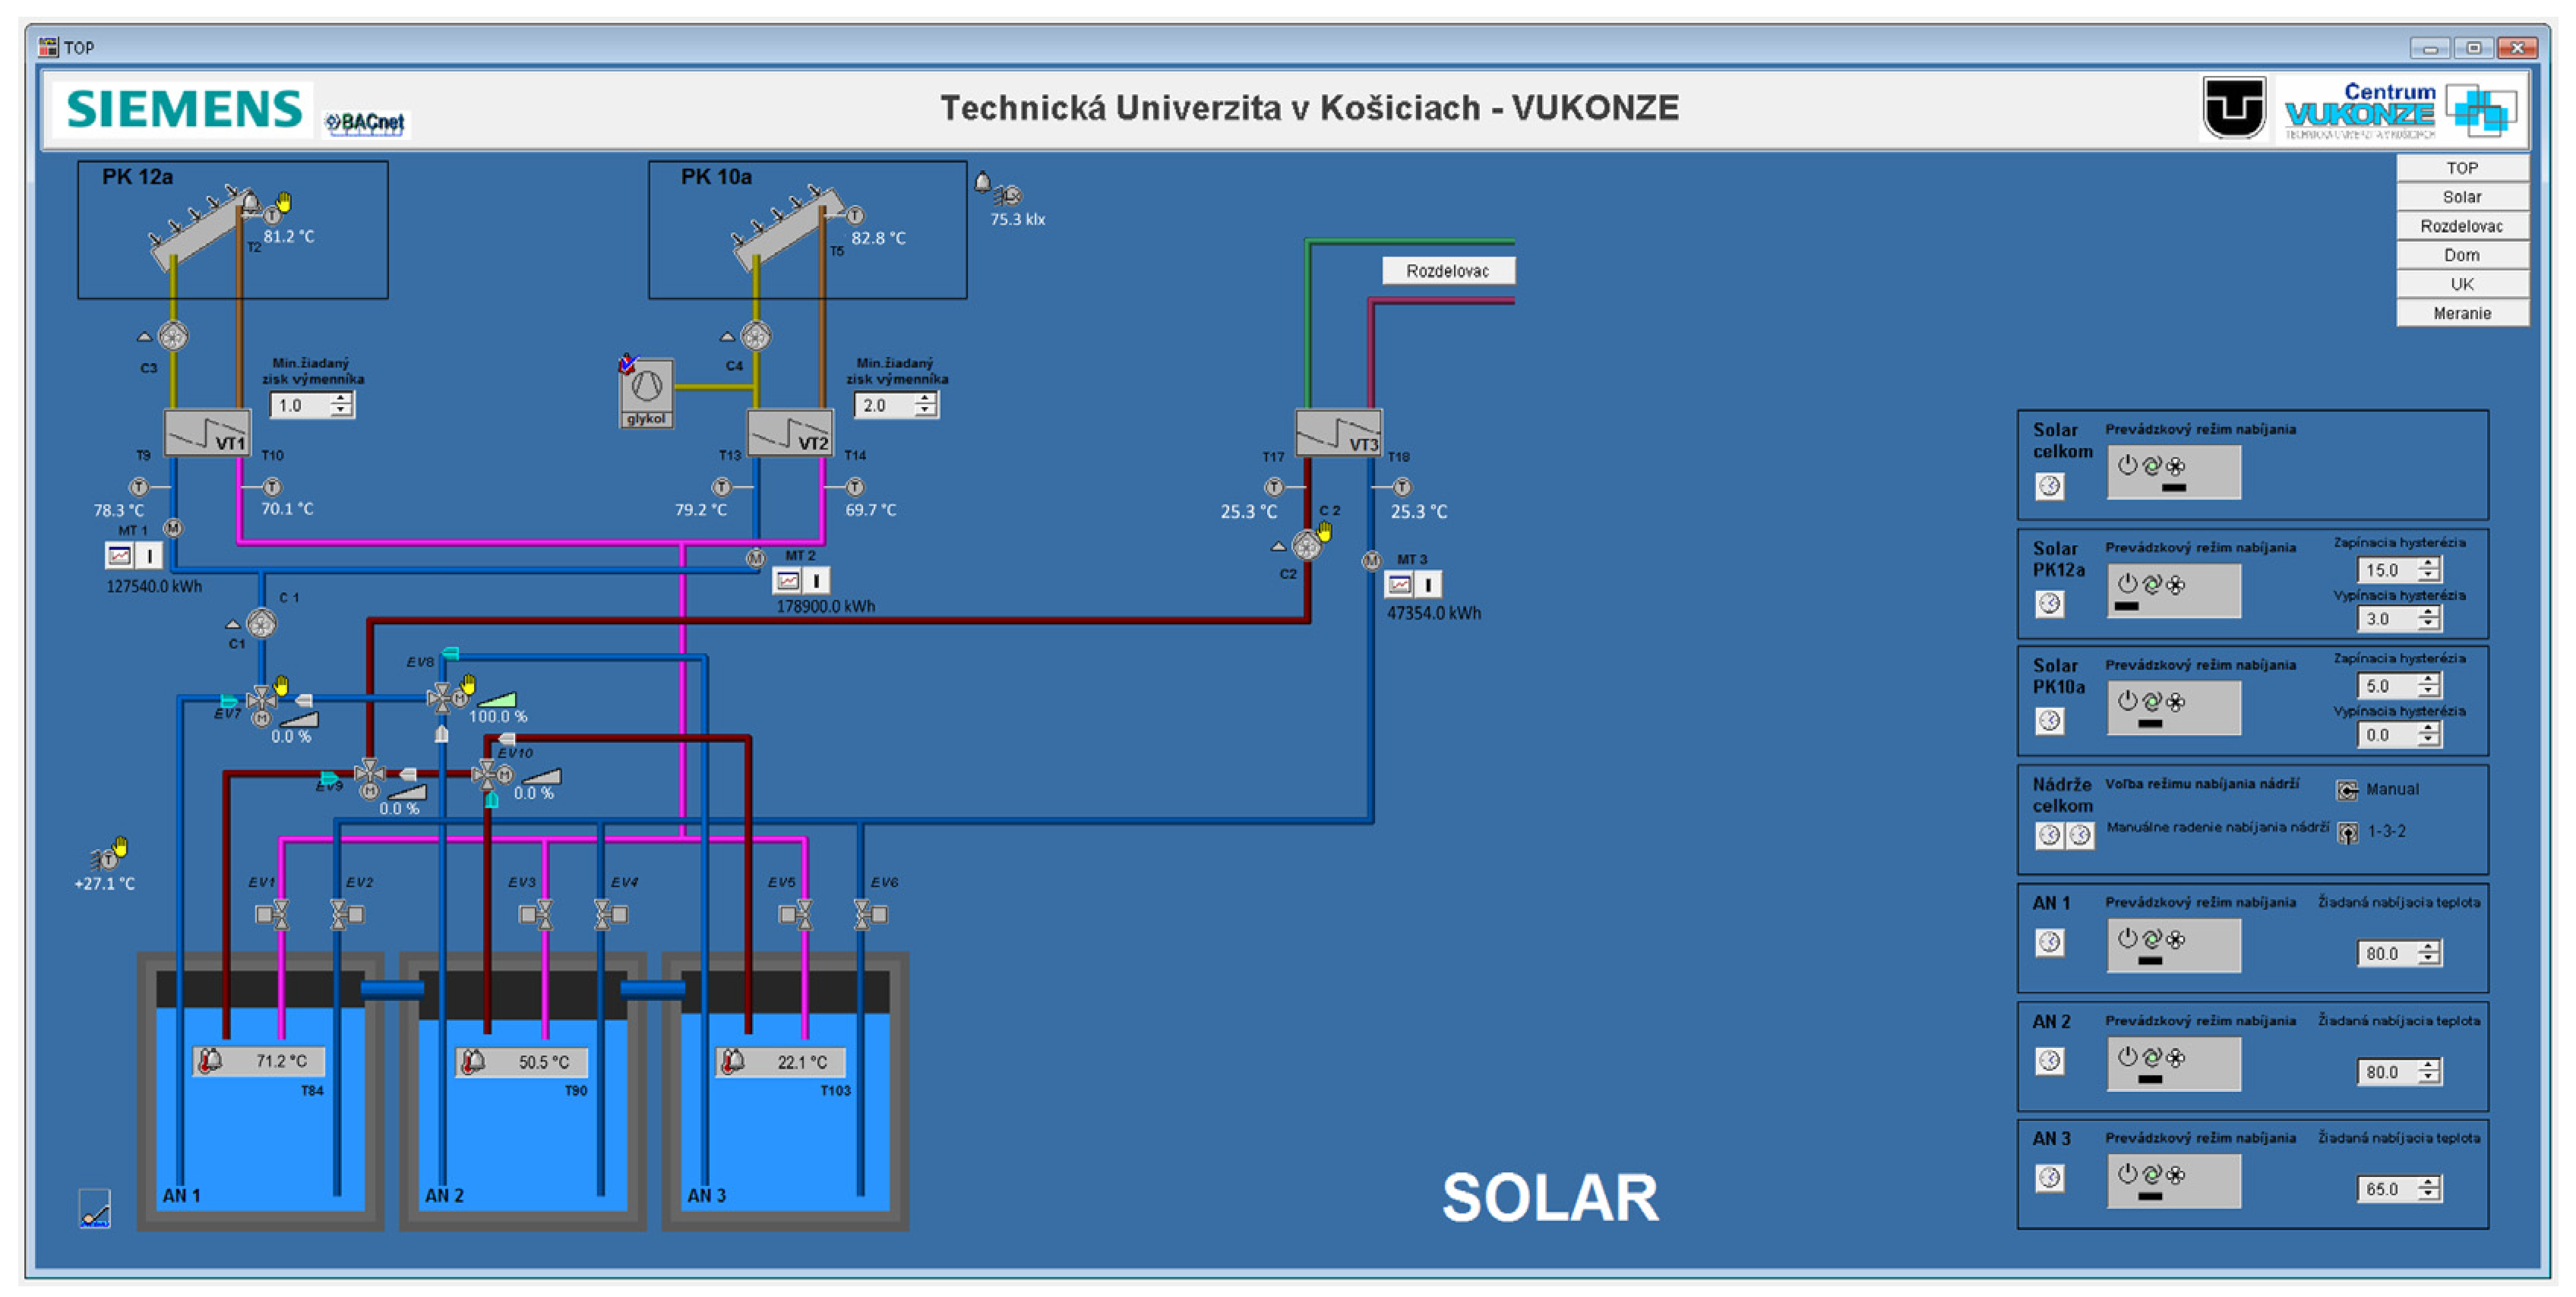
A distributor/collector system was designed to provide multiple energy accumulation options. Thermal energy can be sourced from the laboratory devices = cogeneration unit, hydraulic presses (technological heat), and thermal solar collectors. For research purposes, the tanks were exclusively charged using thermal solar collectors. These collectors were installed on the building’s roof at a 45° angle with an azimuth of 150°. The installation involved 72 Thermo-solar TS-300 flat selective collectors (Ahlborn Mess- und Regelungstechnik GmbH, Holzkirchen, Deutschland), each with an absorption area of 1.78 m2 and an optical efficiency of 81%, resulting in a total absorption area of 128.16 m2. The collectors are arranged in three fields, each containing four rows, with six collectors in the series. The parameters and properties of storage tanks AN1, AN2, and AN3 are described below.
3.1.2. Storage Tank AN1
The storage tank labeled AN1 is (
Table 1) the smallest of the analyzed tanks. It has a volume of 24 m
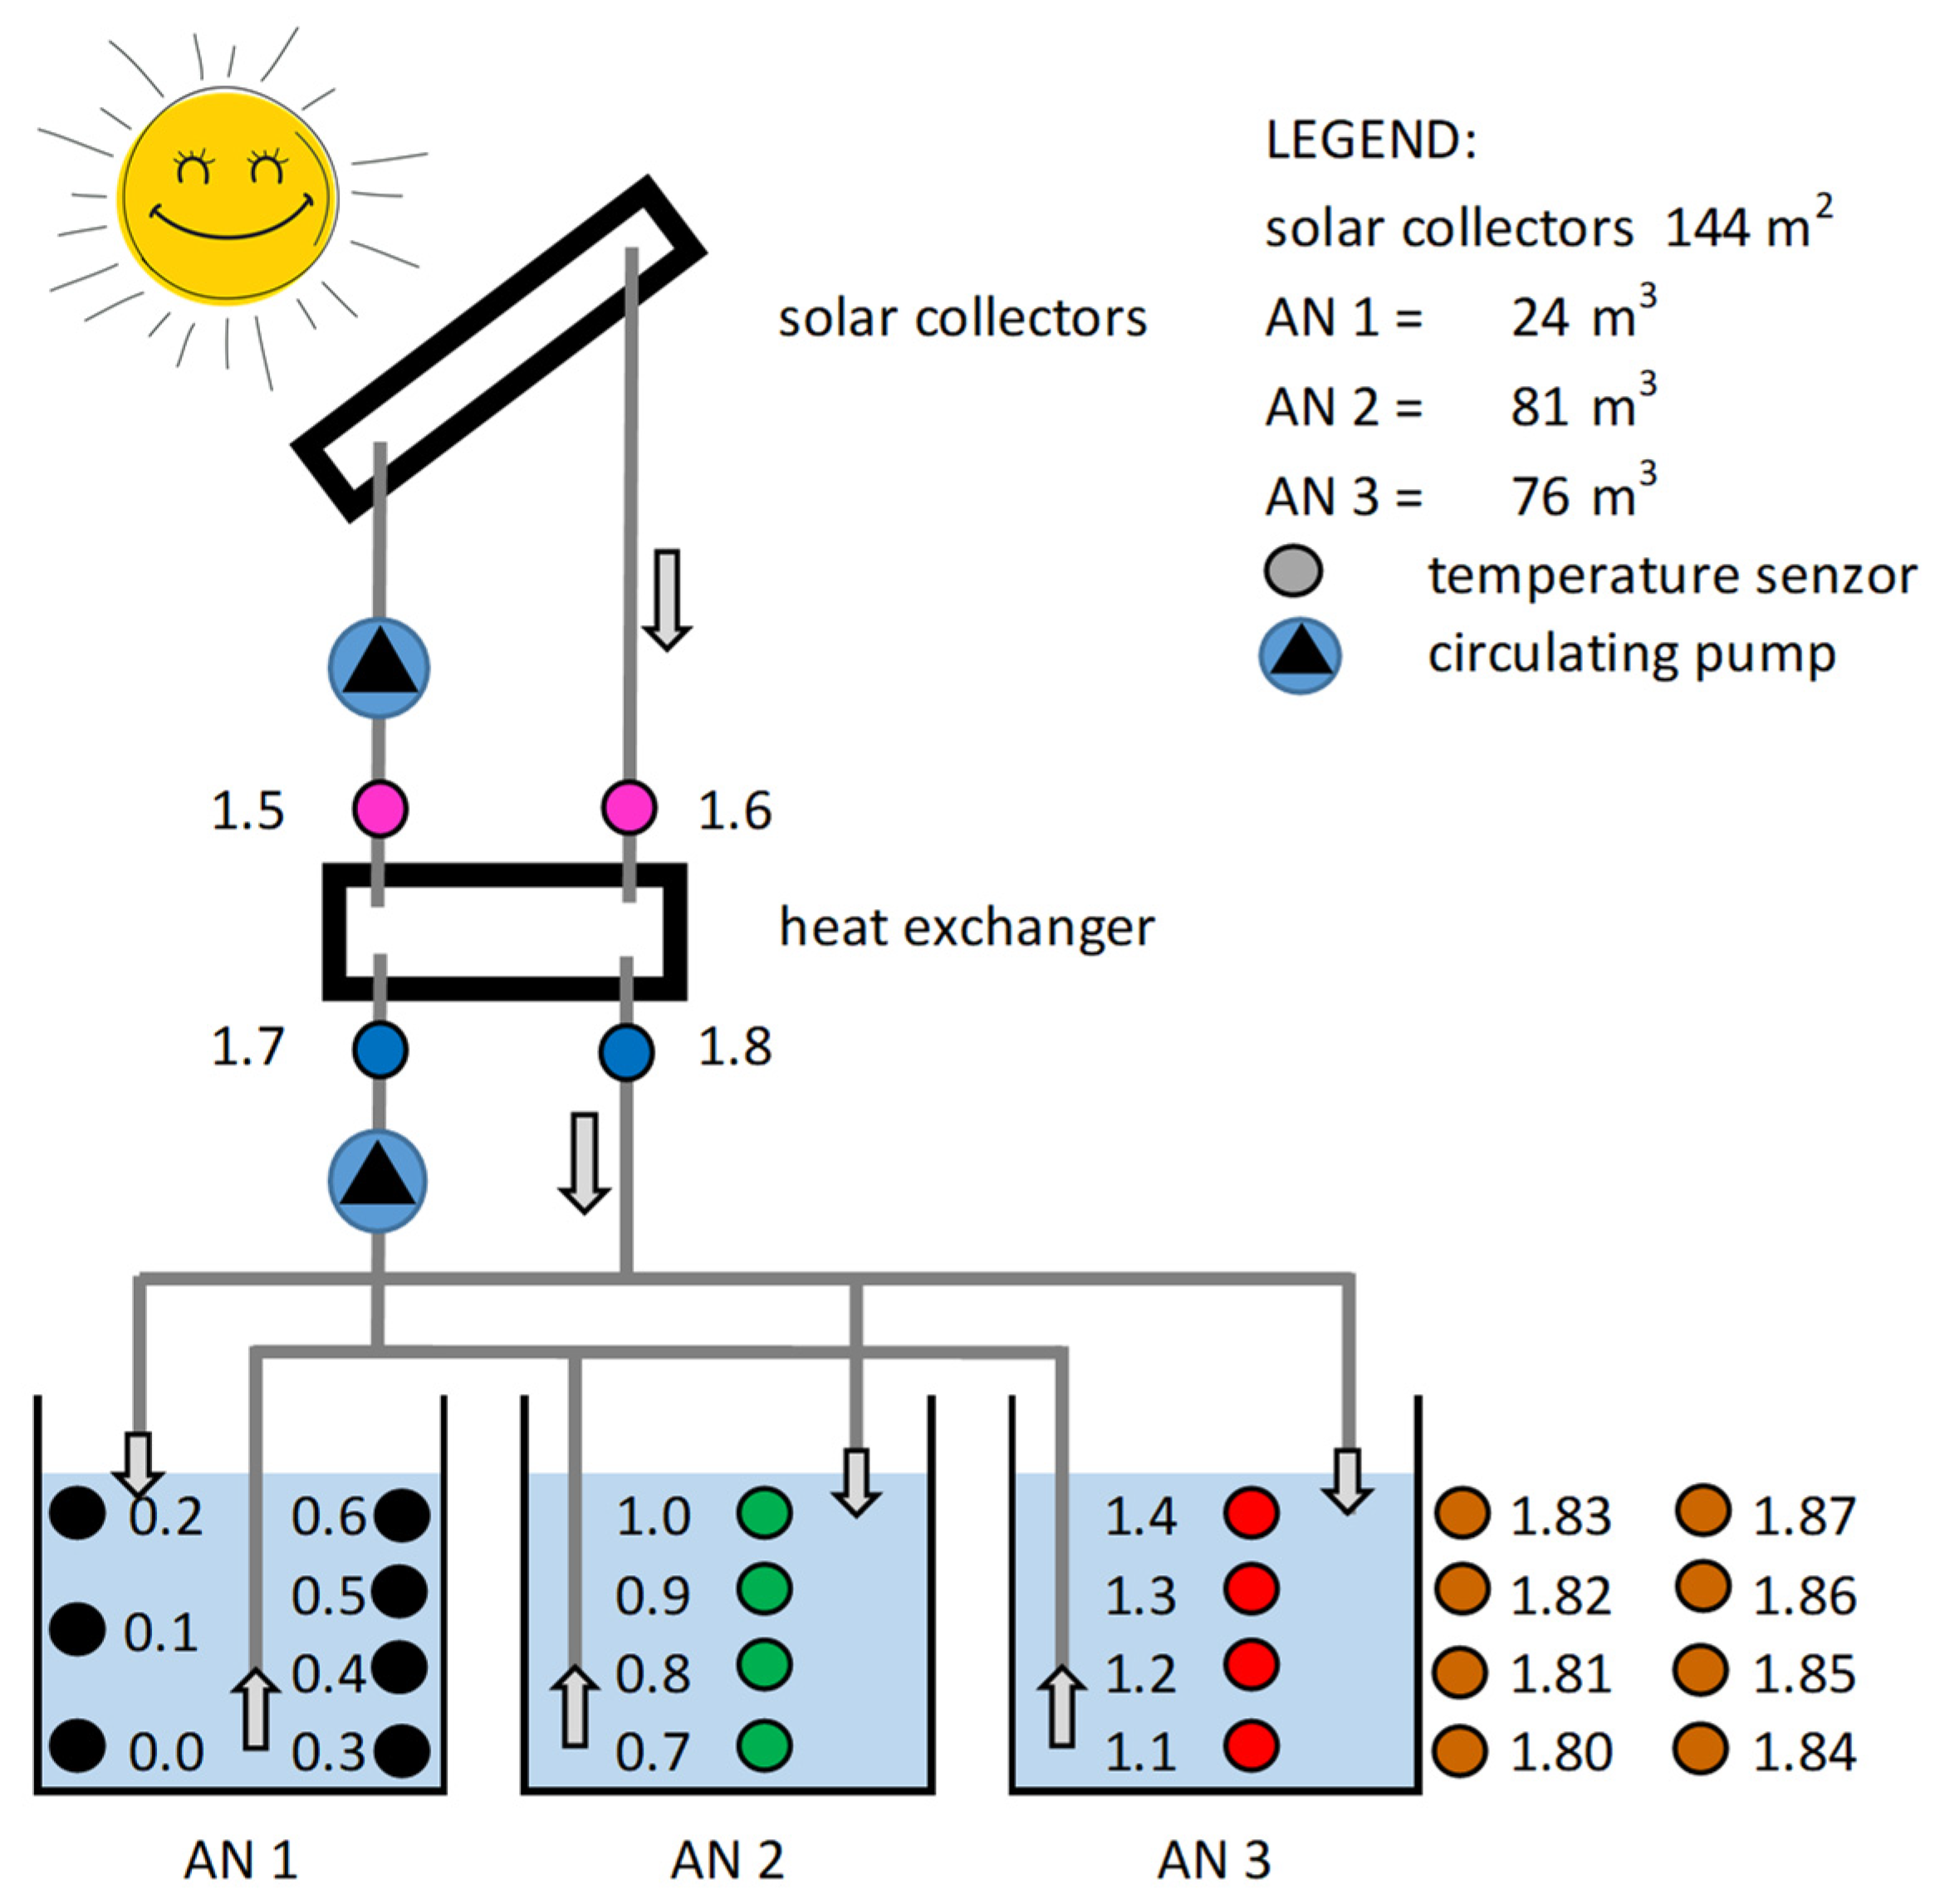
3 with a water level height of 1.8 m. There are 2 measuring points in the tank (point 1 is away from the water filling = 3 sensors by height, marked 0.0, 0.1, and 0.2; point 2 = 4 sensors at the water filling point by height, marked 0.3, 0.4, 0.5, and 0.6). The measurement was carried out in two phases.
Phase 1 measurement of cooling and stratification = the water level was free, without covering.
Phase 2 measurement of cooling and stratification = the water level was covered.
We covered the water level in the tank with 20 mm thick expanded polystyrene. The polystyrene boards floated on the surface and formed a solid surface. They prevented water from evaporating from the surface, significantly reducing the cooling of the tank.
3.1.3. Storage Tank AN2
The tank labeled AN2 (
Table 1) is the largest of the analyzed tanks. It has a volume of 81 m
3 with a water level of 1.8 m. There is 1 measuring point in the tank (point 1 = 4 sensors at the water filling point by height, marked 0.7, 0.8, 0.9, 1.0). The measurement was carried out in one phase.
Phase 1 measurement of cooling and stratification = the water level was free, without covering.
3.1.4. Storage Tank AN3
The tank labeled AN3 (
Table 1) is the medium-sized one among the analyzed tanks. It has a volume of 76 m
3 with a water level of 1.8 m. There is 1 measuring point in the tank (1 point = 4 sensors at the water filling point by height, labeled 1.1, 1.2, 1.3, 1.4).
The measurement was carried out in only one phase. Phase 1 measurement of cooling and stratification = the water level was free, without covering.
3.2. Methods for Temperature Measurement
Measurements are conducted at two levels:
First level: This level is used for the measurement and management of tanks, including the switching of charging/discharging pumps and the control of switching valves and other devices. It also involves energy balances, such as the use of calorimeters to measuring energy flows and weather stations, and solar radiation measurements in the plane of solar collectors and the horizontal plane (
Figure 3). The operation of these devices is not evaluated in this publication.
- 2.
Second level: This level focuses on the measurement of processes in storage tanks, such as cooling and stratification (
Figure 2 and
Figure 4, and
Table 1). These measurements form the basis for research on tanks.
The selection of the measuring set is conducted as follows:
Ni-Cr class K temperature sensors with AL-MEMO® ZA9020FS connectors (thermocouples with a measurement accuracy of 0.1 °C, calibration performed) (Ahlborn Mess- und Regelungstechnik GmbH, Holzkirchen, Deutschland);
ALMEMO® 5690-1M09TG8 (Ahlborn Mess- und Regelungstechnik GmbH, Holzkirchen, Deutschland) data logger.
Number of measuring sensors: there were 15 sensors in the water within the tanks, plus 8 sensors in the ground outside the tanks.
Measurement location: sensors are distributed along the height of the tanks at the water filling point (
Figure 2 and
Figure 4).
Measurement interval: Measurements were taken at 2 min intervals, with continuous measurement from 2020 to 2024. For this publication, suitable periods were selected for each tank, and these were not identical in duration.
Data processing:
Data measured at 2 min intervals were statistically adjusted and averaged into daily values for analysis.
The EXCEL program was used for shorter time periods due to the large amount of data.
Adjusted data were combined into files representing the evaluated time periods (measurement phases).
In each tank, temperature sensors are distributed along the height of the tank, as shown in
Figure 3 and
Figure 4. A limitation of the measurement system is that the distribution of measurement points is not in the center of the tank but near the tank walls. Sensors are located at different depths inside the tank: 10 cm above the bottom, in the middle of the tank, and 10 cm below the surface. Outside the tank, sensors are placed in the ground at depths of 1.5, 2.0, 2.5, and 3.0 m from the upper edge of the tank ceiling. This system allows us to monitor not only the temperature of the medium in the tanks but also the thermal conditions in the immediate surroundings, which is crucial for a comprehensive evaluation of the system’s efficiency and stability. The leakage of heat into the ground is not evaluated in this work.
In accordance with the objectives of the work, the measurements were divided into phases (also described for AN1, AN2, AN3):
Phase 1: This included measurements that were performed without covering the water level in the tanks (
Table 1). This applies to AN1, AN2, and AN3. Cooling and stratification are simultaneously evaluated from the measurements. Each measurement was carried out in a different period, as the measurements were based on a tank charge of 70 °C. This could not be ensured simultaneously for all the tanks.
Phase 2: This included measurements performed with covering the water level in the tank (
Table 1). This only applies to AN1. Cooling and stratification are simultaneously evaluated from the measurements.
4. Data Analysis and Results—Evaluation of Measurements
For the analysis, we need to understand the inputs described in
Section 3.1 and
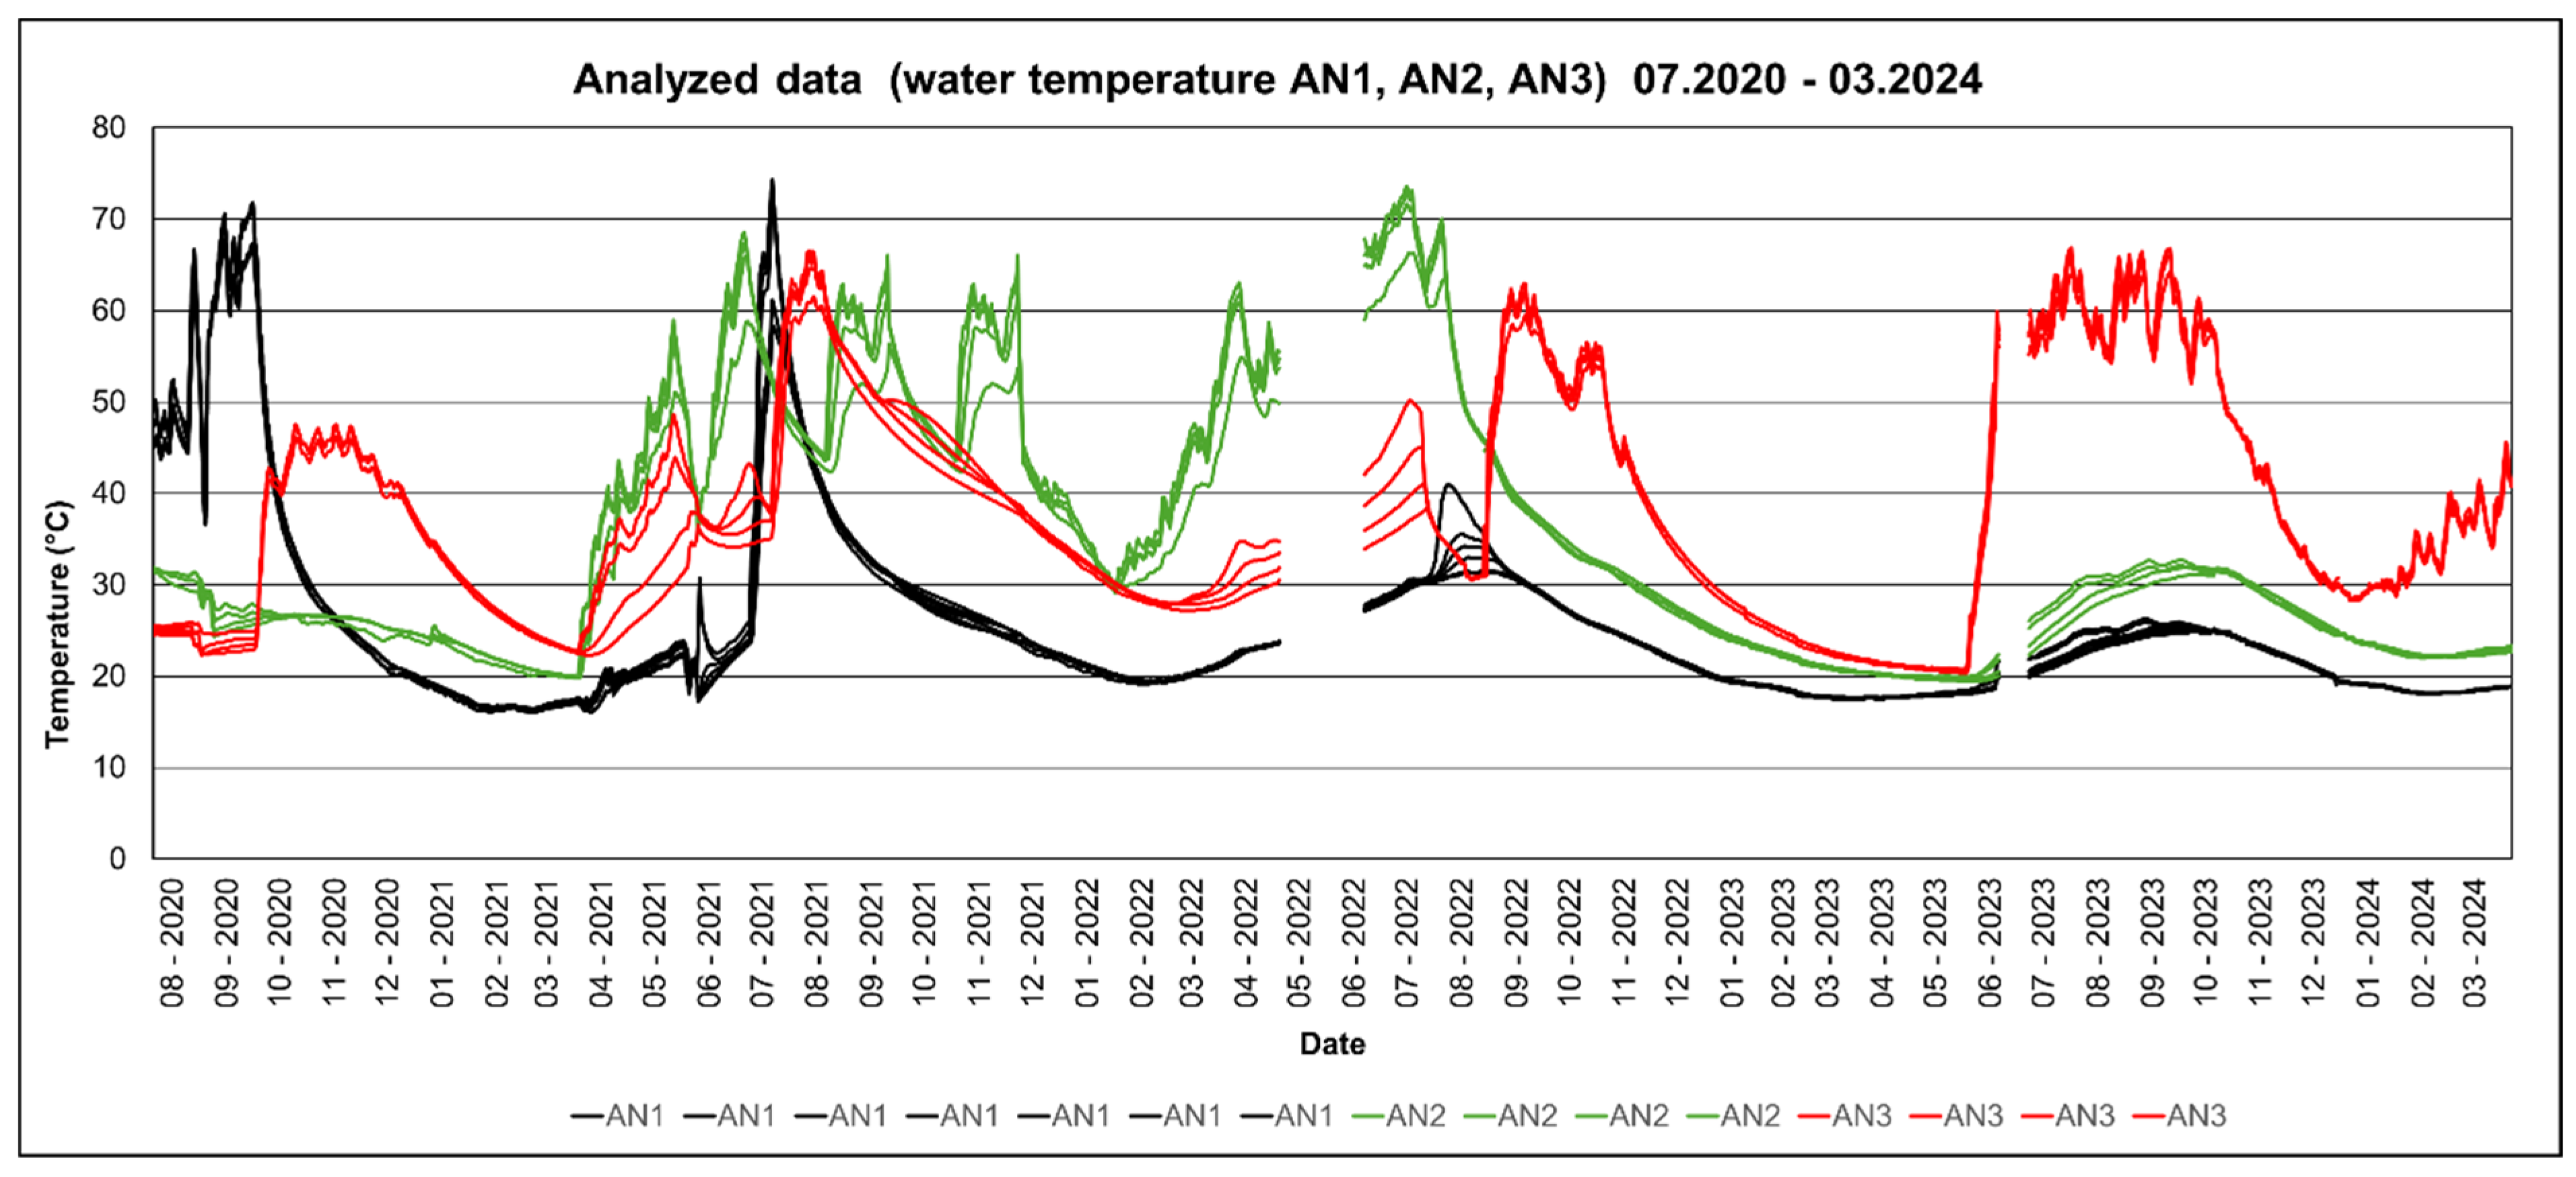
Section 3.2. We took into account the density of water and used spline interpolation, which uses multiple polynomials to create a smooth curve that models nonlinear behavior better. The analysis of the measured data from 22 July 2020 to 22 March 2024 focuses on the temperature values in the reservoirs, as shown in
Figure 4. A total of 15 temperature sensors, distributed in three reservoirs, were monitored. During the observation period, temperature data were recorded every two minutes. This corresponds to 262,800 values per sensor per year. For all 15 sensors, this amounts to a total of 3,942,000 measured values per year. Data outages occurred during the measurements of May–June 2022 and during part of May–June 2023, as shown in
Figure 5. Only periods that we considered significant were selected for evaluation. Data preparation prior to processing is briefly described in
Section 3.2.
4.1. Evaluation of Cooling and the Impact of Tank Level Covering
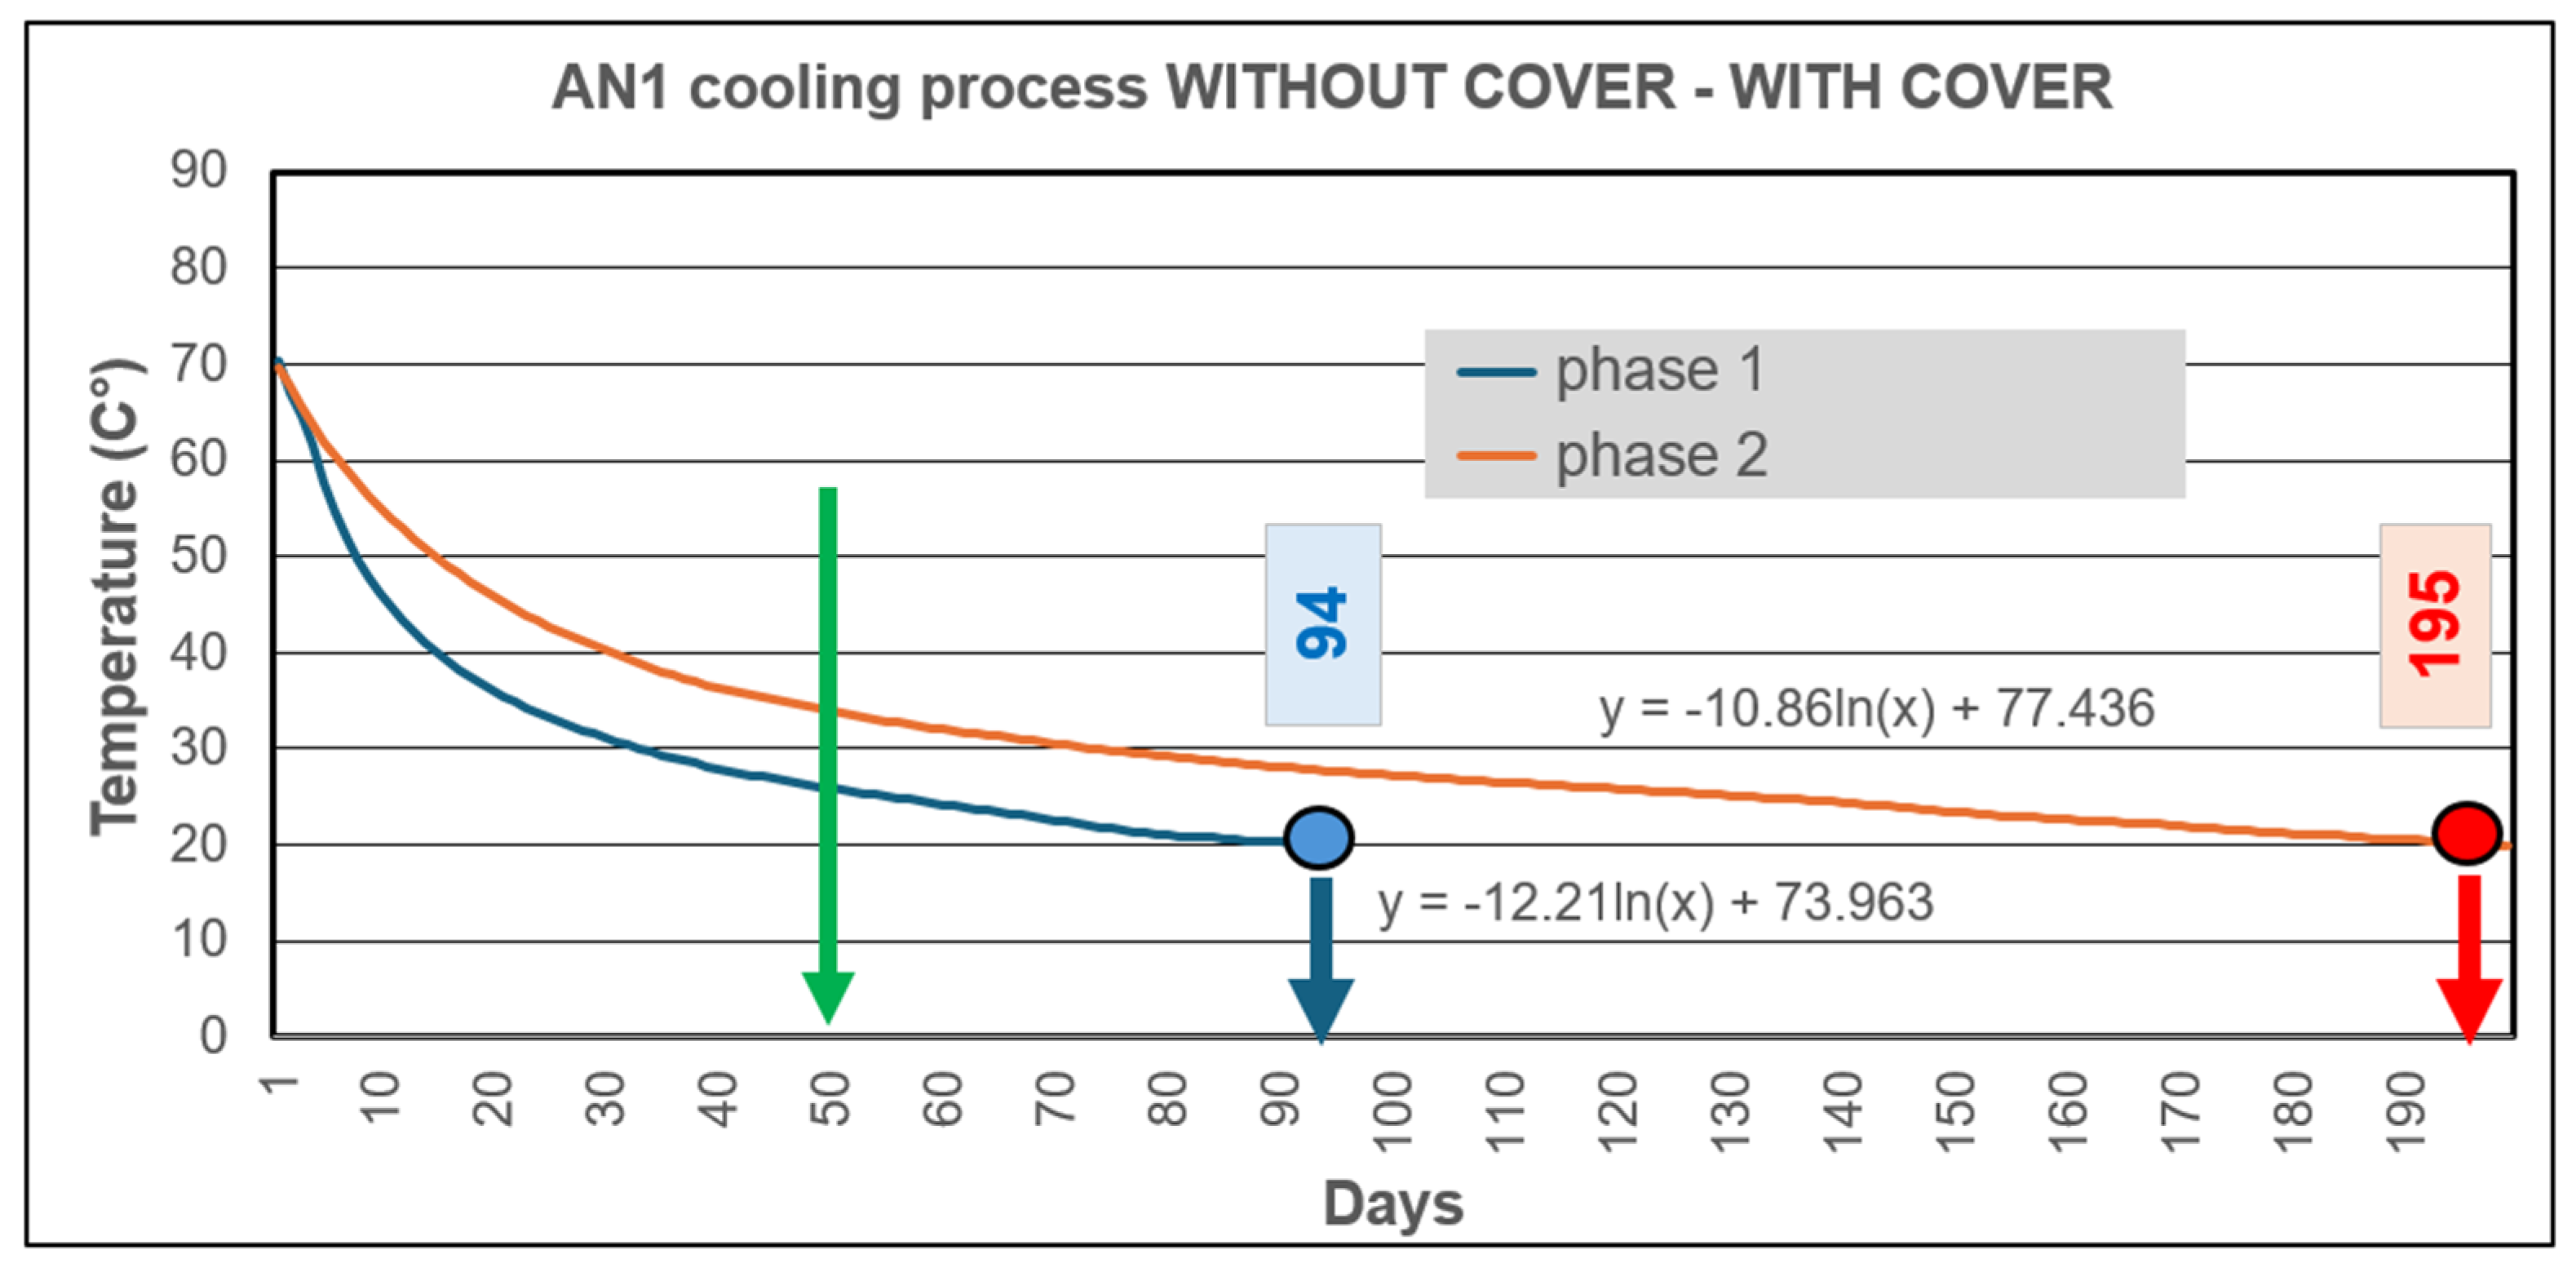
4.1.1. AN1 Cooling Without Covering—Phase 1
The first period represents the initial stage of monitoring the storage tank AN1, providing valuable data on its behavior during system startup. This period begins before the actual data recording, indicating that the tank was being charged prior to data collection. Consequently, some of the initial operations occurred without the possibility of recording them, leaving us without information on the charging duration. However, from the available data, it can be seen that the self-cooling (phase 1
Figure 6) of this tank began on 16 September 2020 and lasted until 18 December 2020, for a total of 94 days. This heat loss process was crucial as it allowed for the evaluation of the duration of the loss of stored energy. This interval was assessed until the temperature reached 20 °C, which was also the ambient temperature in the technical room where the tank was located.
4.1.2. AN1 Cooling with Covering—Phase 1
Phase 2 (
Figure 6) differs in that thermal insulation (20 mm thick polystyrene foam) has been placed on the water surface, preventing direct contact between the water surface and the air above the tank. This cover reduces the flow rate of the water during charging, thereby reducing mixing throughout the volume. The temperature at the surface (sensor 0.2) is measured at 73 °C, while the temperature at the bottom (sensor 0.0) is 61 °C. The temperature difference of 73–61 = 12 °C confirms the presence of a thermocline. Water evaporation is minimal and there is no condensation on the ceiling. The cooling of the water through the surface is significantly slower; however, the temperatures in the layers eventually equalize. Below 30 °C (after 75 days of cooling), the influence on the thermocline disappears. The tank cools to 20 °C in 195 days (
Table 2).
The analyzed periods, i.e., phase 1 and phase 2, and their comparison confirm the significant impact on cooling of covering the tank. Numerically, these are the values of 94 days and 195 days, respectively. Energy comparison after 50 days (temperature potential at 20 °C) revealed a starting state of 100% = 1407 kWh, and after the next 50 days, phase 1 = 12% = 169 kWh, and phase 2 = 28% = 394 kWh. The costs of covering the surface were negligible compared to the energy benefits.
4.2. Effect of Storage Tank Size on Cooling Rate
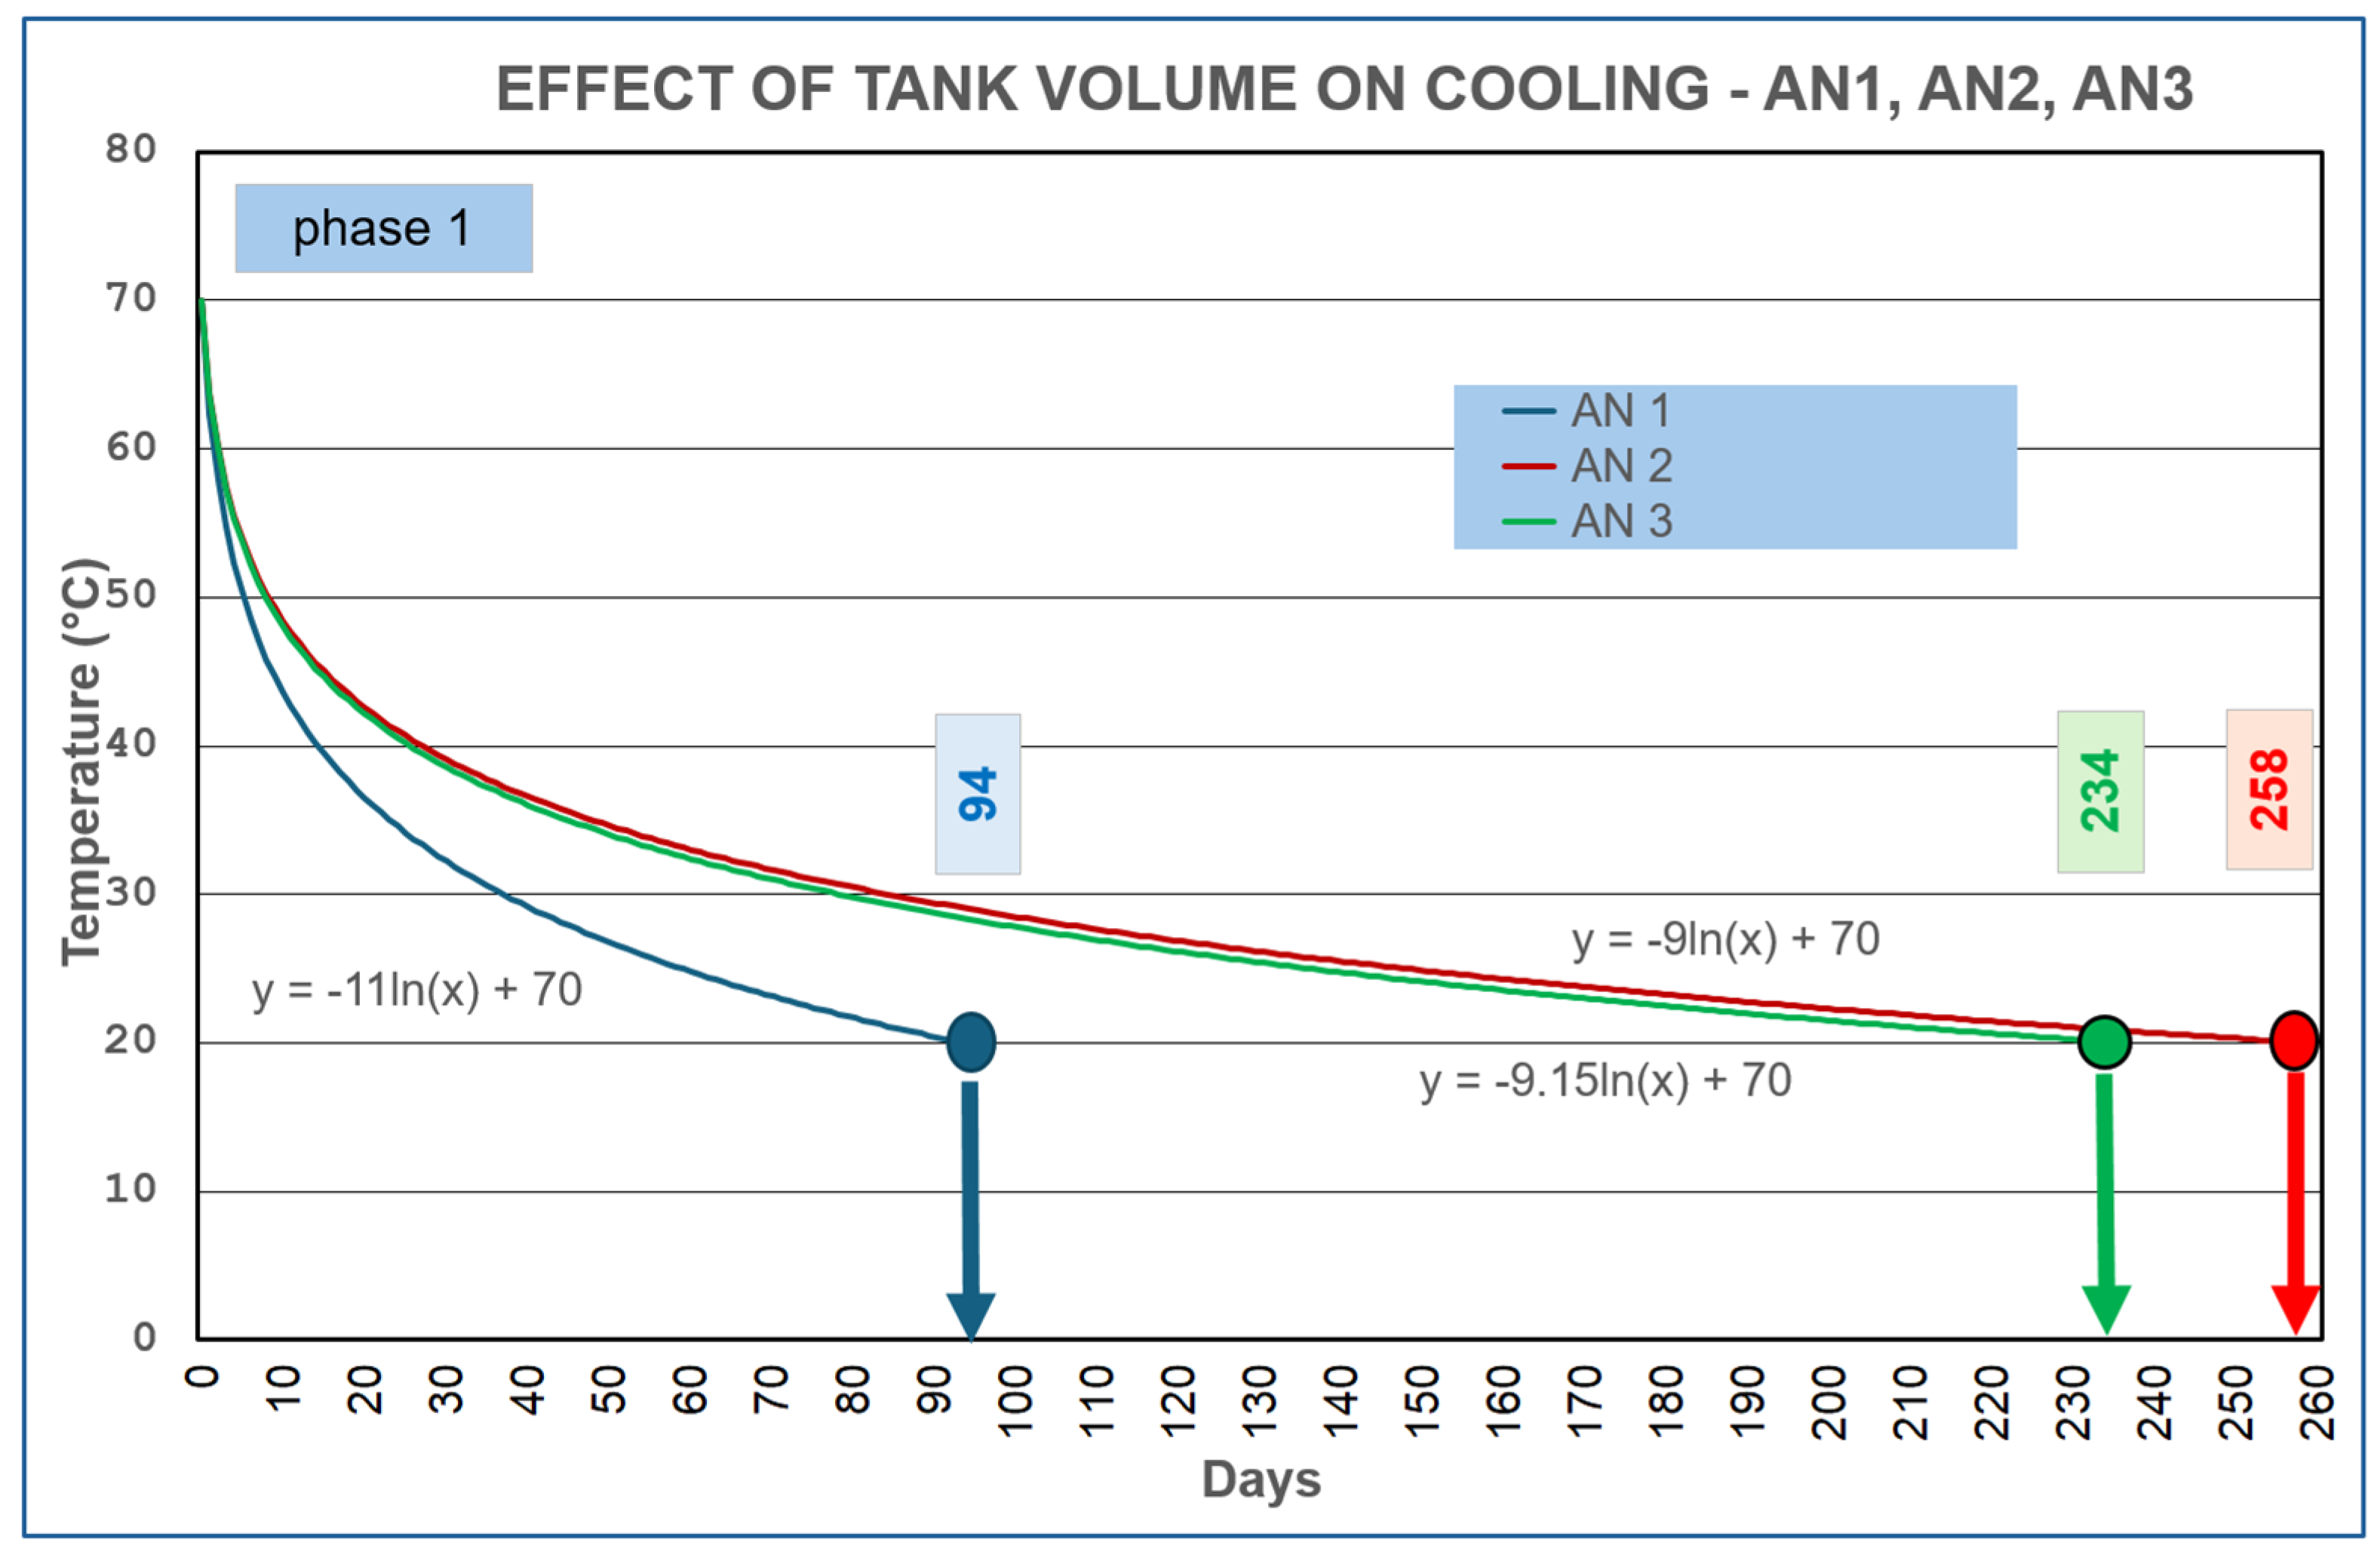
4.2.1. Cooling Measurement AN1, AN2, AN3 Without Covering—Phase 1
Working from the measurements taken over the entire time period (
Figure 5), we selected a cooling period for each tank. For an objective comparison, we only used measurements from when tank AN1 and the others were not covered (phase 1). The boundary conditions for the measurements were as follows:
The initial cooling temperature was approximately 70 °C.
The cooling temperature was 20 °C.
For simplicity, we considered the ambient temperature to be constant and did not include it in the evaluation, although it was accounted for in the mathematical models.
In the tanks, several temperatures were measured at different heights, and due to stratification, these temperatures varied. Therefore, the tank temperature was represented by the average temperature obtained from the measured data.
For each tank, it was confirmed that the cooling trend in the measurements followed a logarithmic dependence. Consequently, curves were created from the measured data for each tank (the formulas are provided next to the curves), and a cooling graph was compiled using these curves (
Figure 7) (
Table 3).
4.2.2. Cooling Evaluation of AN1, AN2, AN3 Without Covering—Phase 1
The following parameters are included in the comparison:
- -
Tank dimensions = tank volume, cooled surface;
- -
Cooling duration (day);
- -
Temperature difference = initial and final.
The following parameters are evaluated:
Energy lost during the cooling period (kWh);
Heat loss per cooling day (kWh/day);
Heat loss per cooling day converted to cooled surface (kWh/(m2.day));
Heat loss per cooling day converted to water volume in the tank (kWh/(m3.day)).
By comparing tanks AN1 and AN2, it is clearly demonstrated that the volume of accumulated water has a significant impact on cooling. The comparison of the criteria of the tanks AN1 and AN2 is conducted as follows:
A—volume ratio (m3) AN2/AN1 = 80.6/24.2 = 3.33; tank AN2 is larger by 3.33×.
B—cooling ratio (kWh/(m2.day)) AN1/AN2 = 0.276/0.116 = 2.39; tank AN1 cools 2.39 × faster.
C—cooling ratio (kWh/(m3.day)) AN1/AN2 = 0.618/0.225 = 2.74; tank AN1 cools 2.74 × faster.
It is possible to achieve better results:
- -
By optimizing the shape of the tank (in our case, these are unsuitable cuboids) into a cylindrical shape;
- -
By reducing evaporation from the surface (either by solving the shape of the tank or by covering the surface) as it is confirmed in the previous
Section 4.1.
5. Investigation of the Process of Temperature Stratification of Water in Reservoirs
The purpose of stratification research is to understand how layers are formed in the tank due to different water temperatures. The process can be defined in four modes:
First mode: the tank is filled with warmer water than the existing water in the tank.
Second mode: The tank is at rest, with neither charging nor discharging occurring. The tank cools spontaneously. This mode is investigated and described.
Third mode: energy is withdrawn from the tank, defined as discharging.
Fourth mode: simultaneous charging and discharging occur.
The tank was charged to an average temperature of approximately 70 °C.
The self-cooling process of tanks AN1 and AN2 was monitored. Both tanks were without covers. The tanks were monitored at different times and under different charging conditions.
The same measured data were used as in the cooling process described in
Section 3.2.
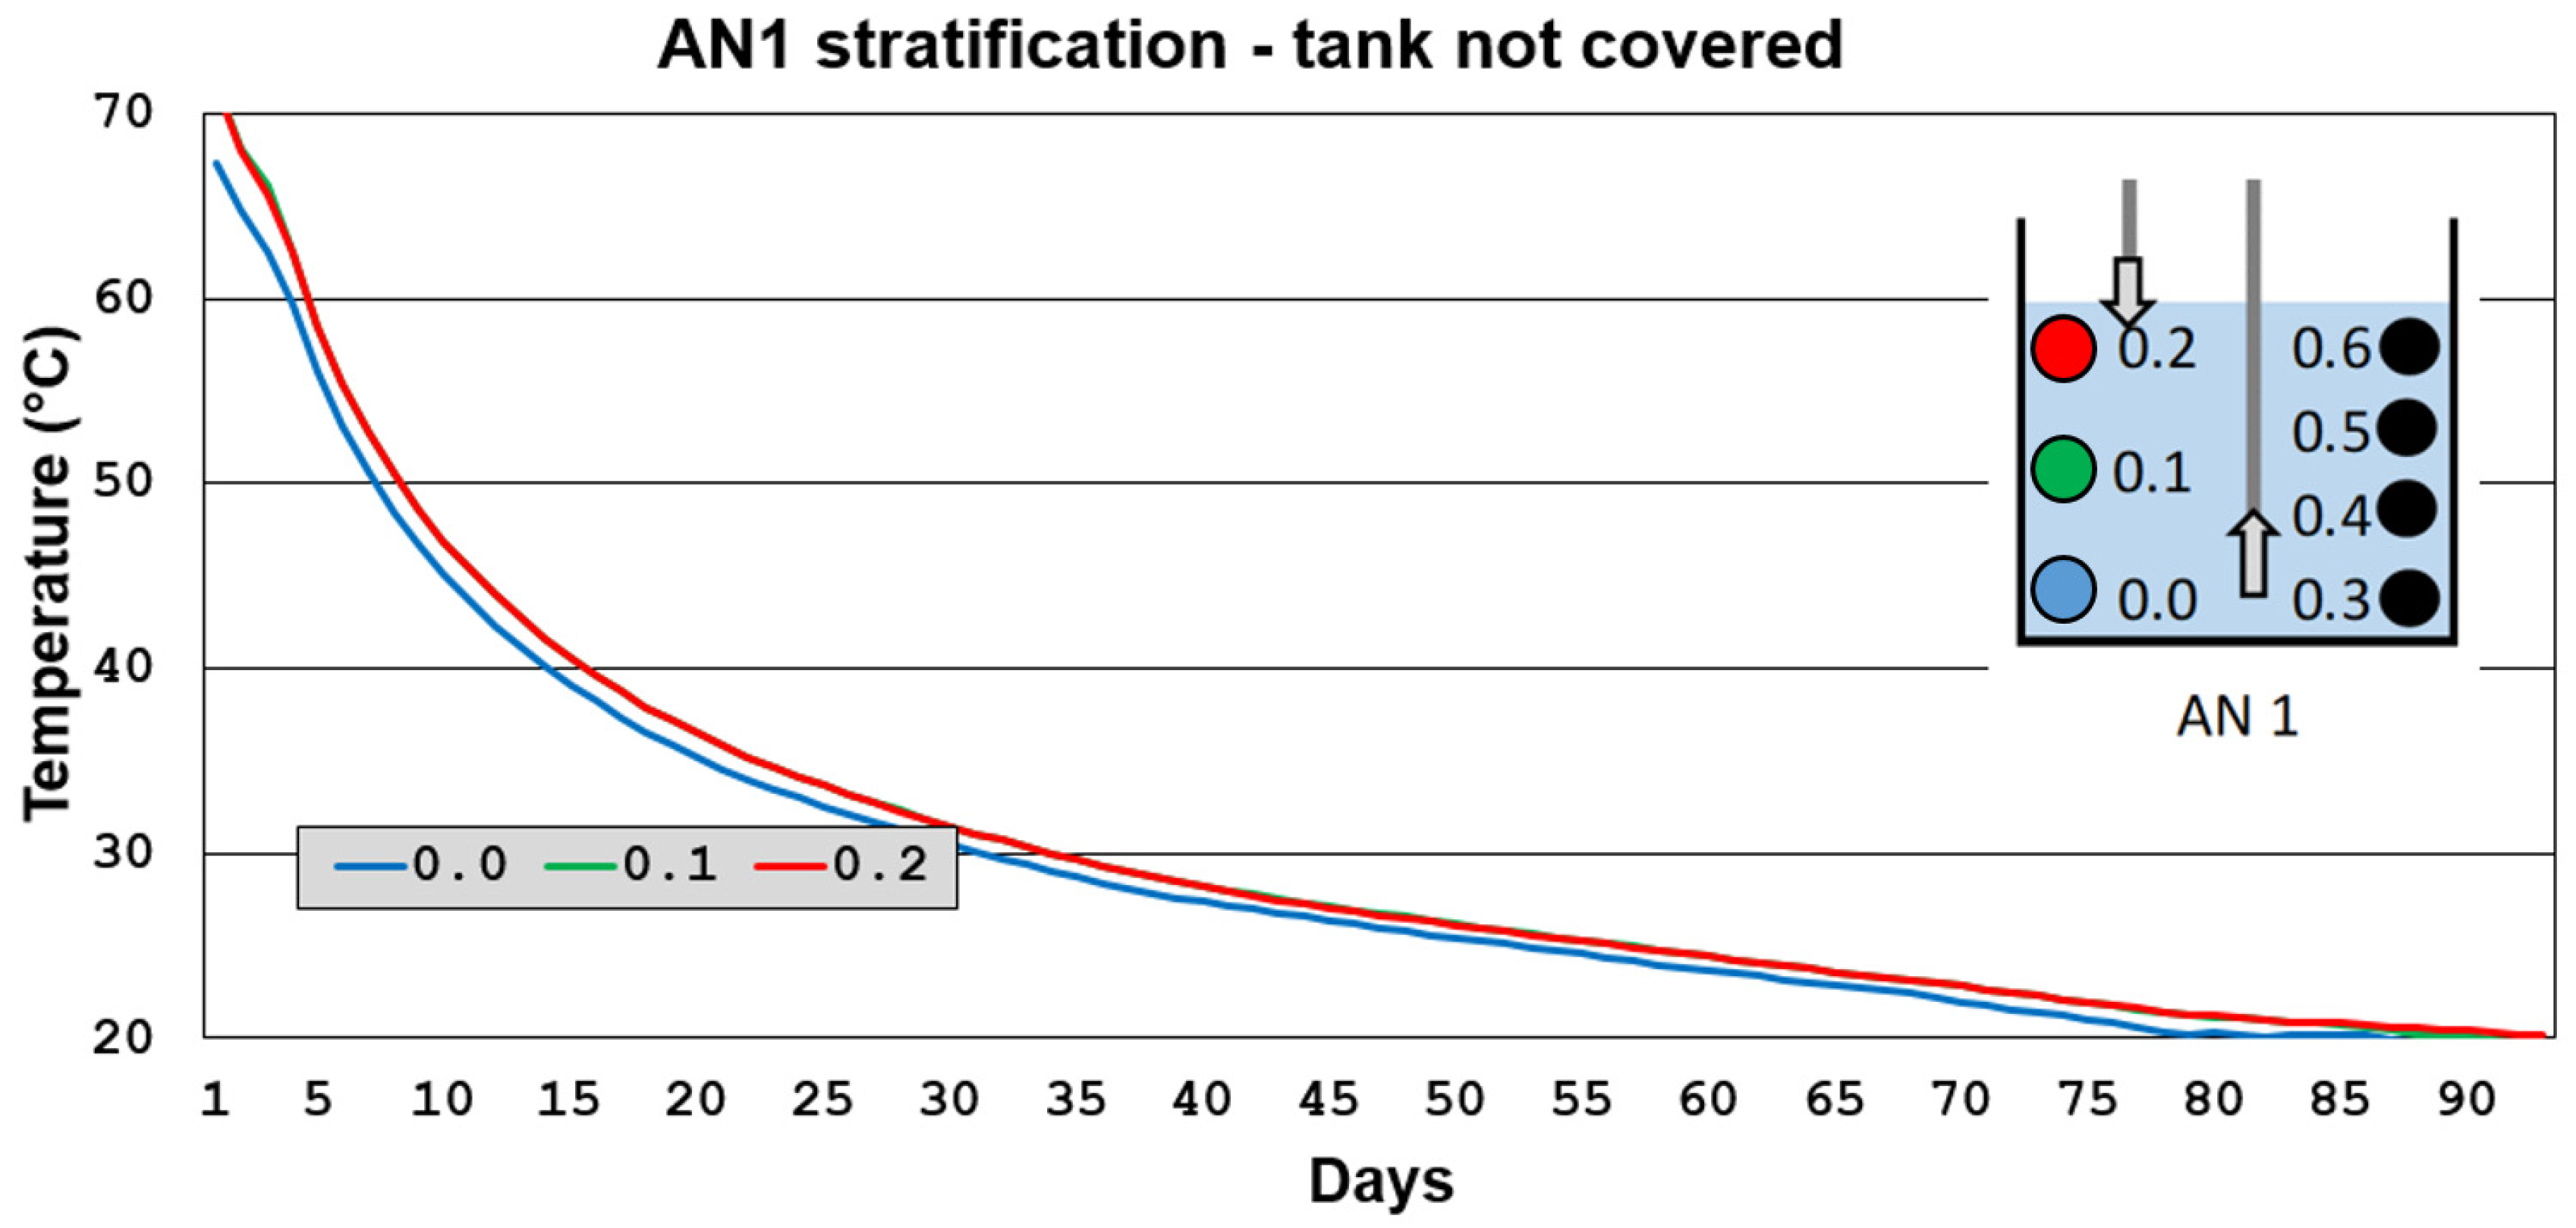
5.1. AN1 Stratification Evaluation
This is the smallest tank. The end of charging marks the beginning of cooling. In
Figure 8, it can be seen that the temperature difference between the bottom of the tank (10 cm above the bottom) and just below the surface (10 cm below the surface) shows stratification at the level of 4–5 °C. This low temperature difference is due to the high temperatures in the collectors, around 90–95 °C. This results in a lower efficiency of the collectors-distribution-exchangers-tank system, approximately 65%. With even lower solar radiation, around 500 W/m
2, and changes in the angle of incidence of radiation, the temperature difference in the collectors (at constant flow) is less than 5 °C. Thus, achieving stratification greater than 5 °C is difficult. It makes a difference whether charging occurs in the summer months under ideal conditions or in the winter months. In this case, the tank was charged in September–October 2020.
As the temperature gradually cools at the measured points, it is observed that the temperature drops faster below the surface than at the bottom of the tank. Note that we are analyzing the tank without a cover. In
Section 4.1, it was shown that significant heat loss occurs through the tank surface. Due to the high surface temperature above 50 °C, evaporation occurs from the water surface into a closed space with a height of approximately 800 mm above the surface. The evaporated water condenses on the tank ceiling. The condensed, cooled water drips onto the surface, cooling it even more. Intensive cooling on the surface is more pronounced than through the bottom and walls of the tank. The water temperature equalizes in layers, minimizing the impact on the thermocline. The unfavorable shape of the tank, shallow depth, and small volume of water also contribute to the elimination of the thermocline. Gradual cooling to a temperature level of approximately 30 °C below the surface (in 35 days) results in a state where the impact on the thermocline is negligible. High heat losses through the surface will cause the reservoir to cool to 20 °C in approximately 94 days, simultaneously equalizing temperatures along the height of the reservoir.
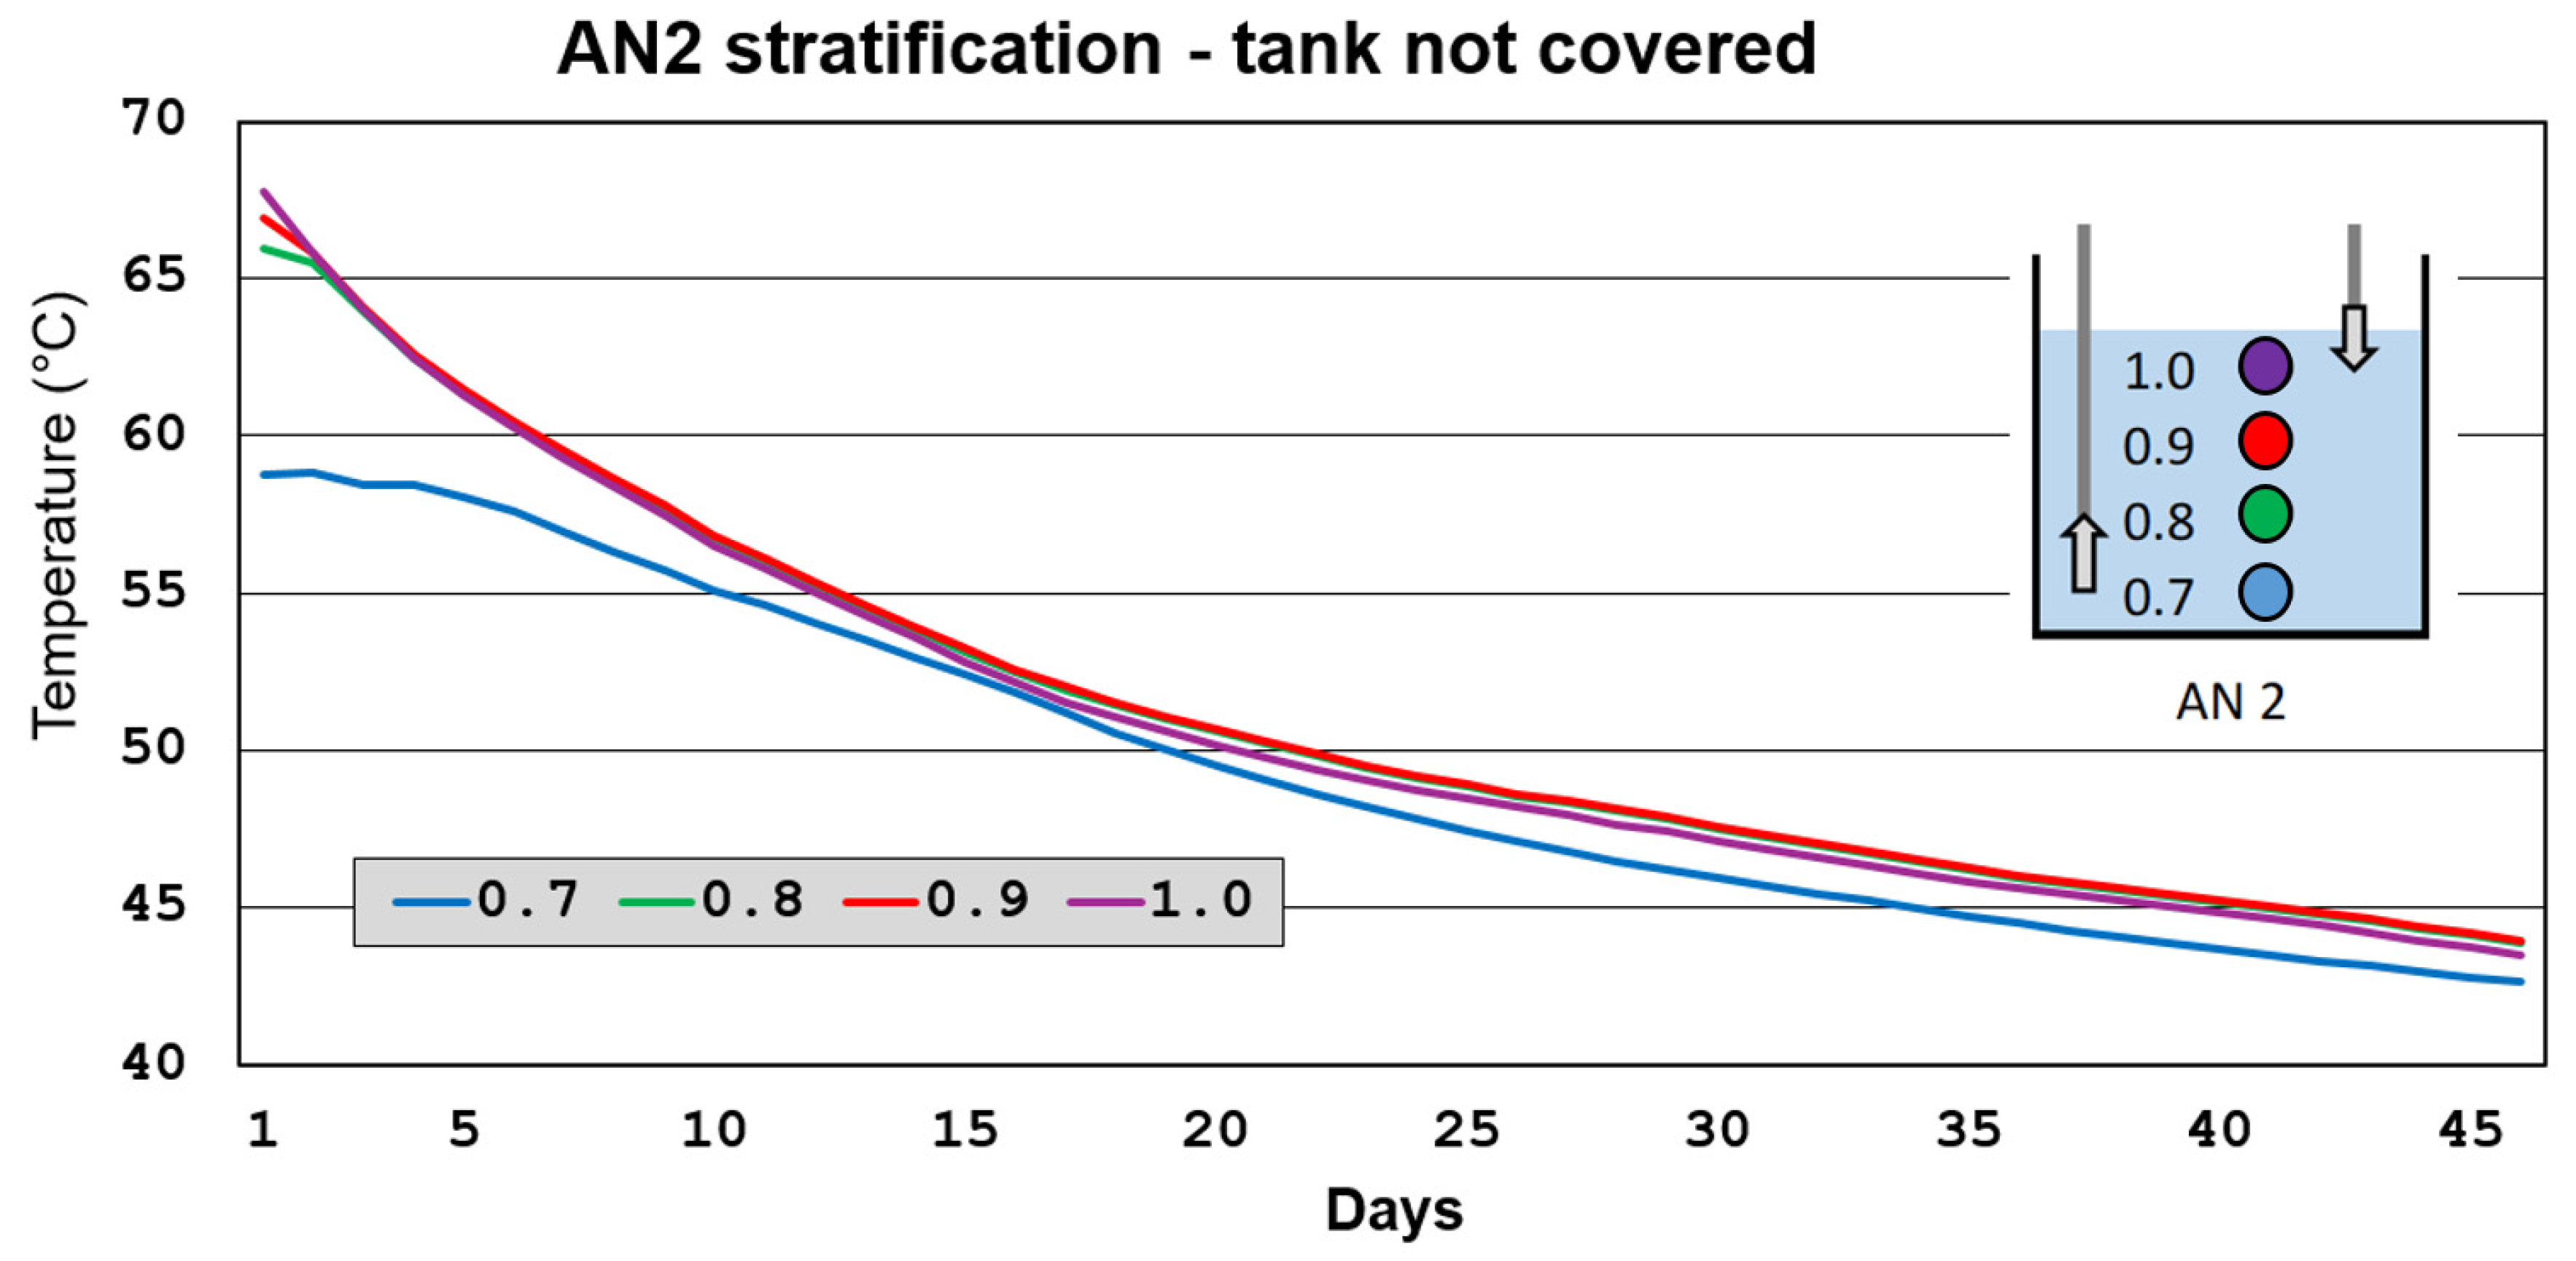
5.2. AN2 Stratification Evaluation
This is the largest tank. The principles and description of the system are similar to those in the case of the small tank in point 5.1. We only list the differences. At the beginning of cooling, the temperature difference between the bottom and the bottom was significantly higher (approx. 10 °C). Charging was carried out in the period of July–August 2022 under significantly more favorable conditions with higher collector efficiencies.
Figure 9 shows that the temperature difference between the bottom of the tank and the surface during the entire period under consideration is maintained at a level of approx. 2.5–3 °C. As with the AN1 tank, evaporation occurred and caused similar problems. In this case, the significantly larger size of the tank had a positive effect on the thermocline. Similarly, at temperatures below 30 °C, temperatures leveled off along the height of the tank.
If we implemented the fourth mode (simultaneous charging and discharging of the tank including natural cooling), the thermocline would be significantly affected. This was confirmed in certain test modes. The differences were at the level of about 15–20 °C. We do not analyze this mode or other operating modes in this work.
6. Development of a Simulation Tool for Tank Evaluation
6.1. Development of a Simulation Tool
Long-term measurements from 3 reservoirs refine the mathematical simulation and the plausibility of the outputs.
In this research, convolutional neural networks (CNNs) were used to predict temperature changes during the cooling process of accumulation tanks. CNNs are designed to process grid-structured data, making them suitable for analyzing temperature trends. The CNN models were applied to input data, which included tank volume, dimensions, and precise sensor positions, with the goal of capturing complex patterns and cooling dynamics.
The first step involved
scaling the data using StandardScaler, which ensured that all inputs had the same range, contributing to more stable and efficient training. The normalization was performed according to the following formula:
where
X represents the input value,
μ is the mean of the data, and
δ is the standard deviation.
The data were split in a ratio of 80:20, with 80% used for training and 20% used to test the model:
The CNN models were configured with varying numbers of layers, filter sizes, and dropout rates to minimize overfitting. For each training iteration, the CNN output was a vector of predicted temperature values, which was compared with the actual values using an error function such as Mean Squared Error (
MSE):
To optimize training, early stopping was used. This halts training if the model’s accuracy on the validation set ceases to improve. The best models were subsequently used to predict the cooling behavior of various tanks.
The simulation results showed that the cooling time of the tanks is directly dependent on their volume. For example, it was found that a tank with a volume of 10 m3 was cooled for 83 days, while a tank with a volume of 100 m3 needed 392 days to reach the target temperature. The shape of the tank only had a marginal effect on the cooling time; for example, the difference between rectangular tanks and tanks with regular walls was only two to five days at a volume of 100 m3. The accuracy of the simulation tool for tanks above 100 m3 must be verified in practice with experimental measurements. Therefore, we do not present tanks with larger volumes.
The use of CNNs enabled the analysis of complex temperature patterns that traditional methods would struggle to capture with similar levels of precision. The prediction results were verified by comparing them with real data, ensuring the accuracy and reliability of the simulation for further industrial applications in the control and monitoring of accumulation systems.
6.2. Limitation of Work and Data Correction
The correction of charging data is complex and often only provides an estimate of possible developments. That is why we mainly assessed cooling. We performed several corrections for missing data or improper operation. These corrections were crucial for accurate analysis of temperature trends and their correct interpretation. Each correction began with adding dates and times to the table, followed by the addition of temperature values. In the cooling period from July 2021 to February 2022 for tank AN2, it was necessary to make a correction due to the drawdown of a previous energy replenishment. Each correction was performed using the PCHIP (Piecewise Cubic Hermite Interpolating Polynomial) method, which ensures a smooth and realistic fit between the data points without unwanted oscillations. Piecewise Cubic Hermite Interpolating Polynomial (PCHIP) is an interpolation method that ensures that the interpolated result is smooth, monotonic (if the data are monotonic), and free of oscillations between points [
36].
7. Discussion
The issue of using renewable energy sources and their long-term accumulation is attracting a lot of interest due to the uncertainty of energy supplies on world markets and unstable price levels. The effort is to displace the production of energy from fossil fuels and become independent of them, or at least minimize the need for them. In this context, we present our work.
Economic studies and balance sheets are currently characterized by a high degree of unreliability. Our project and subsequent study are being implemented in Slovakia. Here, the differences in prices and costs are very significant compared to other EU states. Therefore, we do not consider it responsible to draw economic conclusions. We focused on the energy balance of specific problems that we wanted to describe. We experimentally verified and presented our results.
Our research also addresses other related issues in parallel, for which we have created suitable conditions. The disadvantage is the long periods required, usually spanning a year. From 2017 to 2020, we operated the system in an active use mode without measuring devices without the research mode. By installing research measurement technology, we fulfilled the first goal set in this work: the long-term measurement of the cooling (
Section 3) of the storage tanks from 2020 to 2024. Based on the projected methods of use and experience, we were able to develop and correct the methodology for specific tasks. Since there are many in the publication, we present those mentioned. The processes of the active use of the tanks are very non-standard for the supplied objects (laboratories with devices with high energy demand) in terms of time periods and the amounts of heat obtained and removed. Therefore, at this stage, we focused only on cooling, potential, and regularities of accumulation.
The measurements confirmed that there were high heat losses due to spontaneous cooling. For this reason, we addressed another goal: covering the water surface (
Section 4.1) as a measure to reduce heat losses. By covering the tank surface, we can double the cooling time of the tank.
The advantage of having three tanks lies in the possibility of comparing different operations and effectively using the accumulated energy. From three tanks of different sizes, we can compare the influence of size (
Section 4.2) on accumulation and verify theoretical laws experimentally. A larger tank can store energy for a longer time than smaller tanks.
Measurements confirm the influence of volume and the dependence of the cooled surface on energy losses from tanks. We present the conclusions in the section on tanks with a volume of up to 100 m3.
Another goal was to determine the laws of temperature stratification (
Section 5) of water in tanks. Experimental measurements confirm the conclusions of different stratification according to the tank usage regime. In self-cooling, the stratification process is limited. The best results are achieved in the mode of simultaneous charging, discharging, and cooling. Stratification allows for the better use of the energy potential. It would be an advantage would be to expand heat extraction from different heights of the water column where the required temperature is suitable for use.
The final purpose of the experiments is the development of a mathematical model for the design and evaluation of storage tanks in conjunction with renewable sources (the development of solar collectors and heat pumps to extract low-potential energy). The model was developed using the neural network method (
Section 6), which learned from the measured data. Due to the extensive nature of the issue, we are not publishing this software tool in this article.
We implemented all the goals presented in the publication, and after gaining experience, we developed proposals for improving the operation of the system and the method of use.
8. Conclusions
In conclusion, long-term and seasonal thermal energy storage is a key element in optimizing the use of renewable energy sources, especially solar energy, in buildings. Different thermal storage systems, such as ATES, BTES, TTES, and PTES, offer various advantages in specific applications and conditions.
This study identified several shortcomings in the operation and measurement of water cooling in large-volume tanks, including the low number of measurement points, water stratification issues due to the filling and extraction process, and significant heat losses through evaporation. Solutions such as increasing the number of temperature sensors, supplying water at multiple locations, and covering additional tanks were proposed to address these problems. The evaluation of solar radiation and energy supply parameters, as well as losses to the surrounding soil, were also highlighted as areas requiring further analysis.
The practical benefits of this work include a detailed examination of the design and operation of the tanks, an analysis of the behavior of the tanks during the cooling process, and the demonstration of energy efficiency over time. Scientifically, this study contributes to the understanding of cooling processes and the development of a mathematical model using a neural network, enhancing the potential for solving energy balances through simulation.
Future work will incorporate the experience and feedback from this study to improve the use of storage tanks, thereby expanding the evaluation criteria to increase system performance. This research provides a valuable basis for the design and operation of systems aimed at long-term heat accumulation in water, offering both practical and scientific advances in this field.


 ,
, 

