
Assessing Grid Reliability for Optimal Integration of System-Integrated Modular Advanced Reactor Technology (SMART) for Kenya: A Case of the Nairobi Distribution Network


Abstract
1. Introduction
2. Literature Review
2.1. Reliability Assessment Methods
2.2. Global and Regional Studies on Reliability
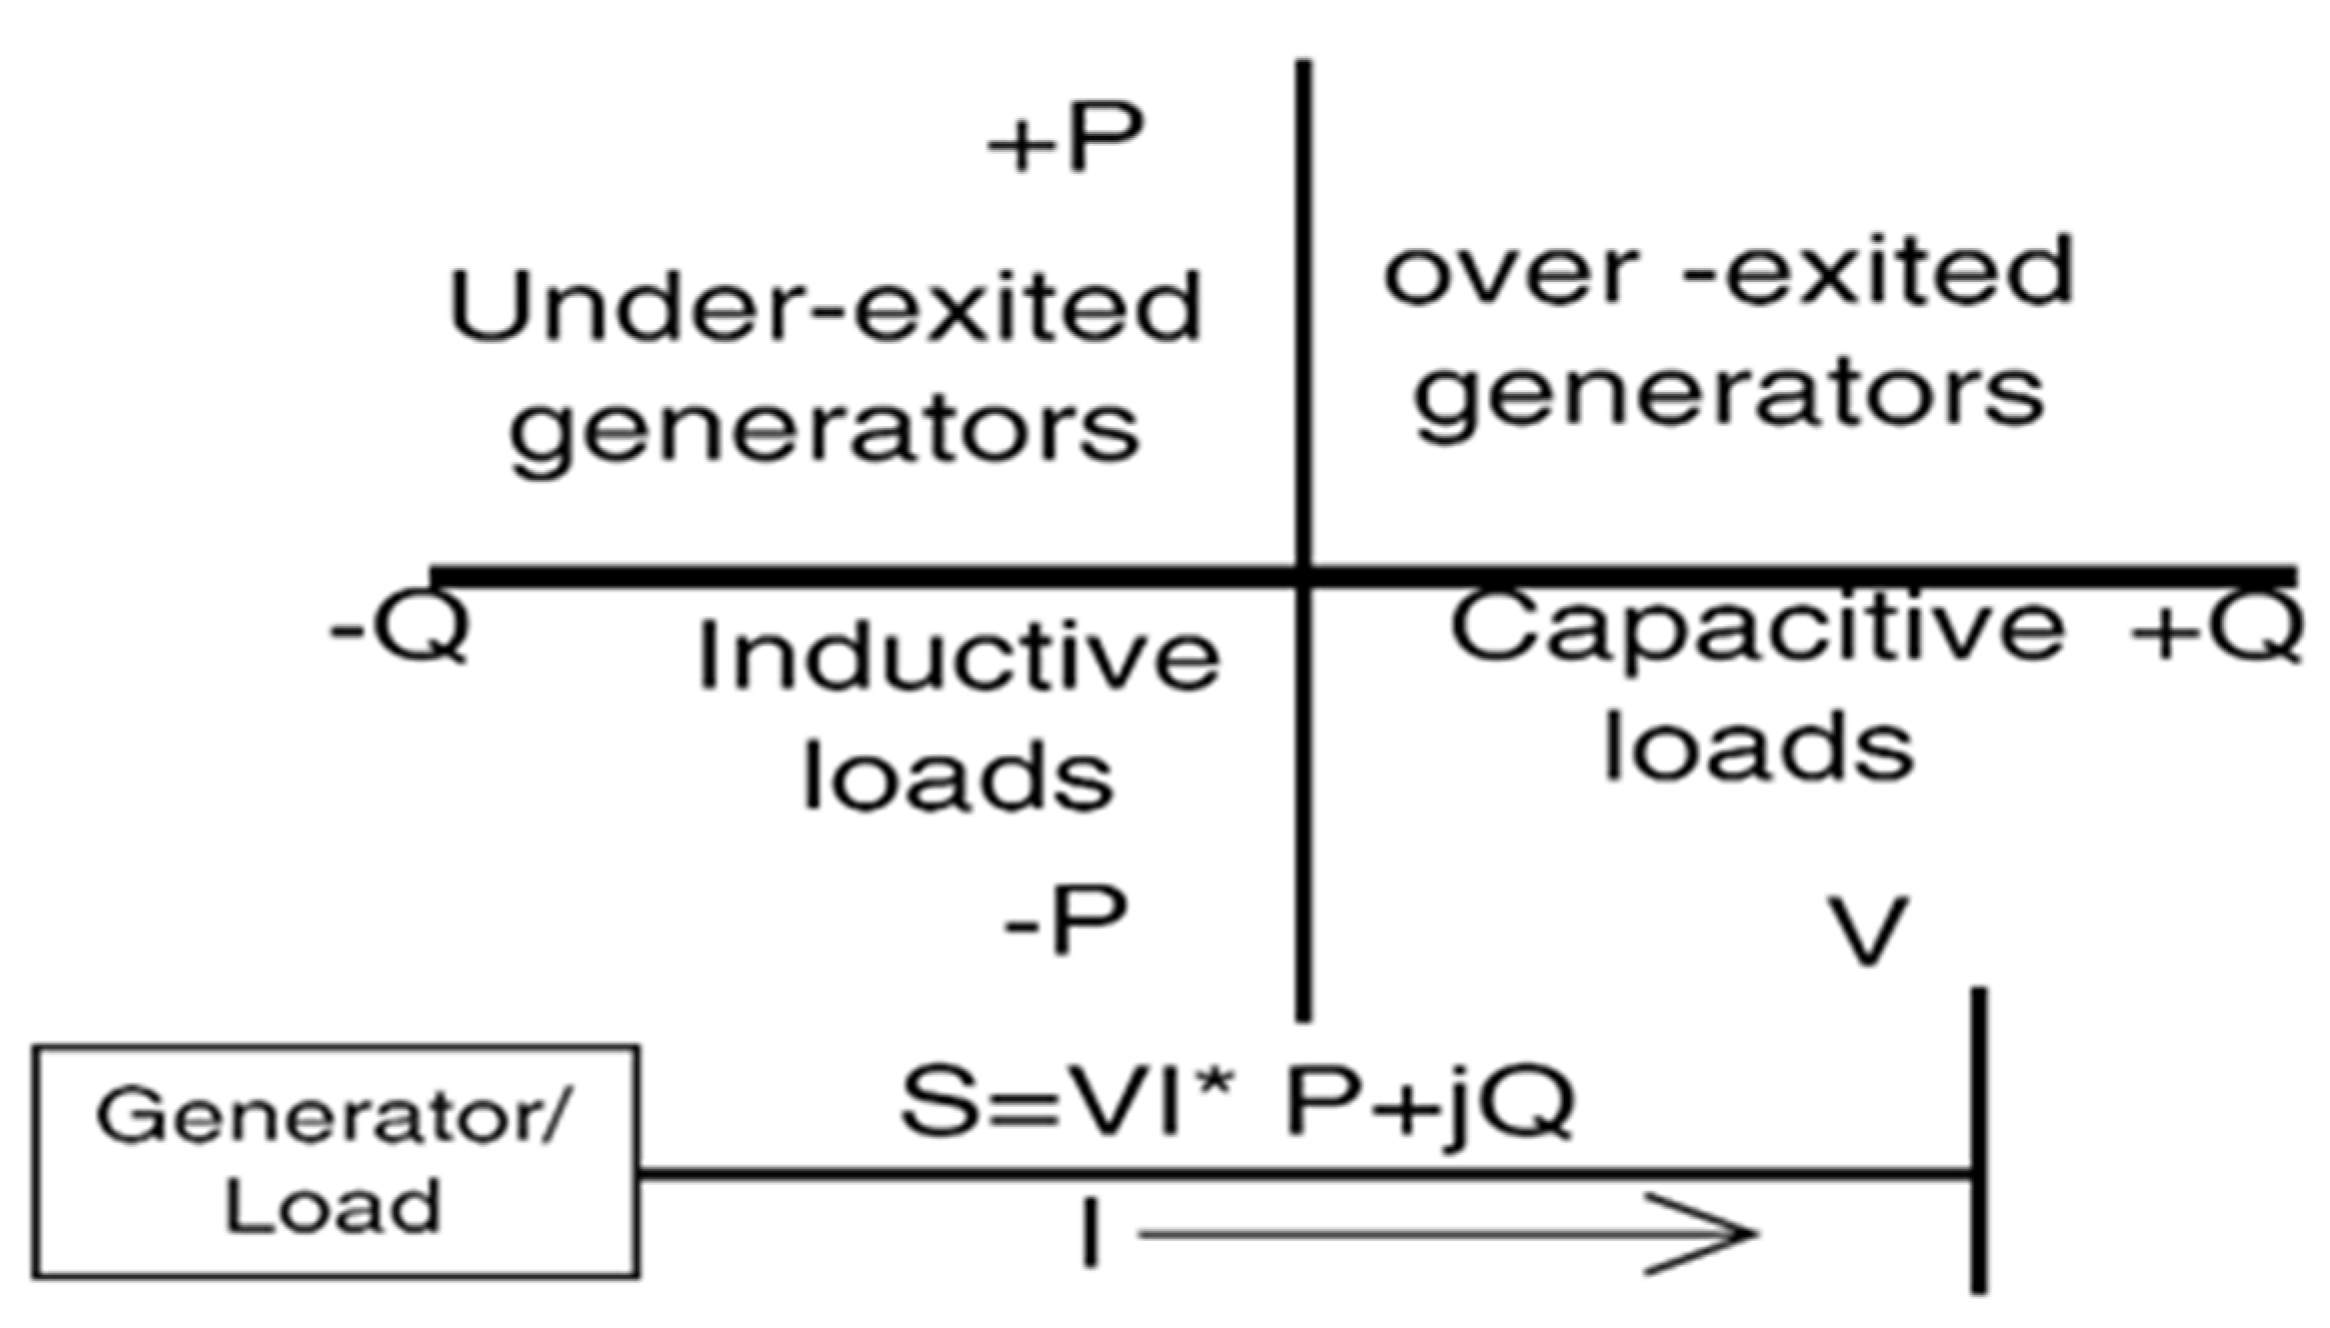
2.3. Systems Reliability Indices
- The System Average Interruption Frequency Index (SAIFI) quantifies the average number of sustained interruptions experienced by customers annually. Lower SAIFI values indicate higher reliability [7].
- 2.
- The System Average Interruption Duration Index (SAIDI) represents the average total outage duration per customer annually, where reduced values signify shorter outages [7].
- 3.
- The Customer Average Interruption Duration Index (CAIDI) measures the average restoration time for sustained interruptions, reflecting the utility’s service efficiency [7].
- 4.
- The Expected Energy Not Supplied (EENS) estimates the total energy lost due to service interruptions, with lower values indicating minimal energy wastage.
2.4. SMART Load-Following Techniques
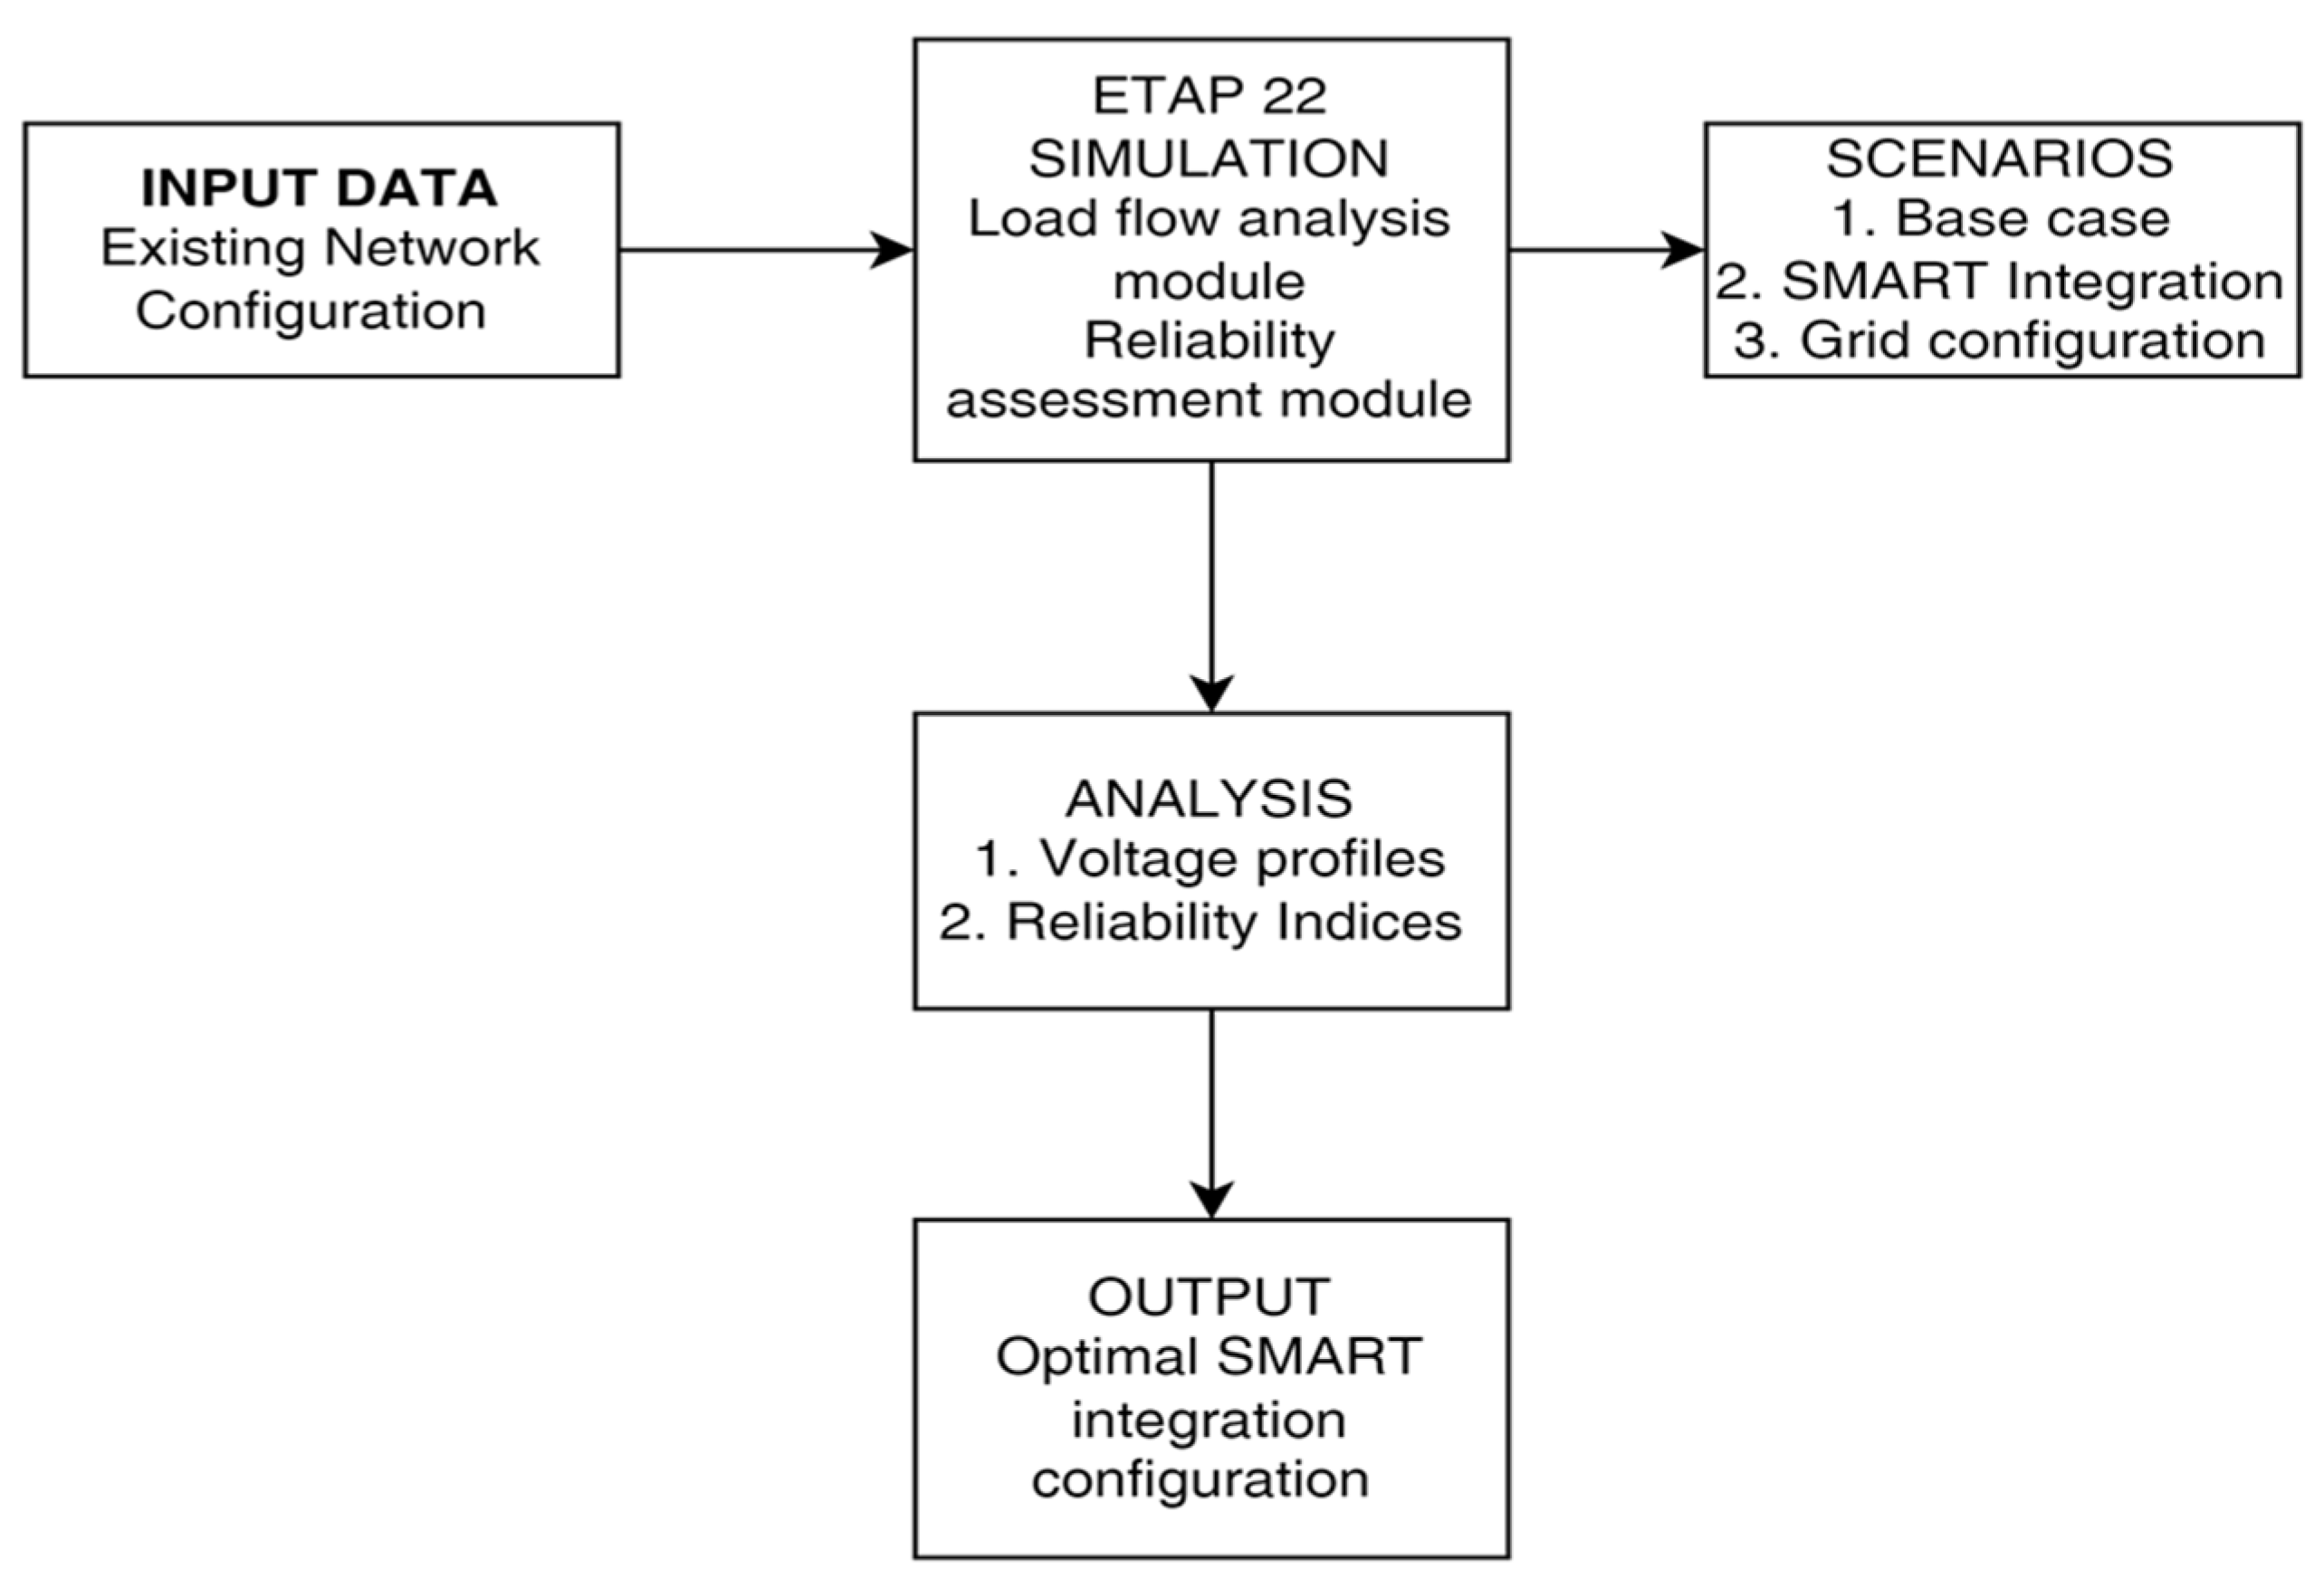
3. Methodology
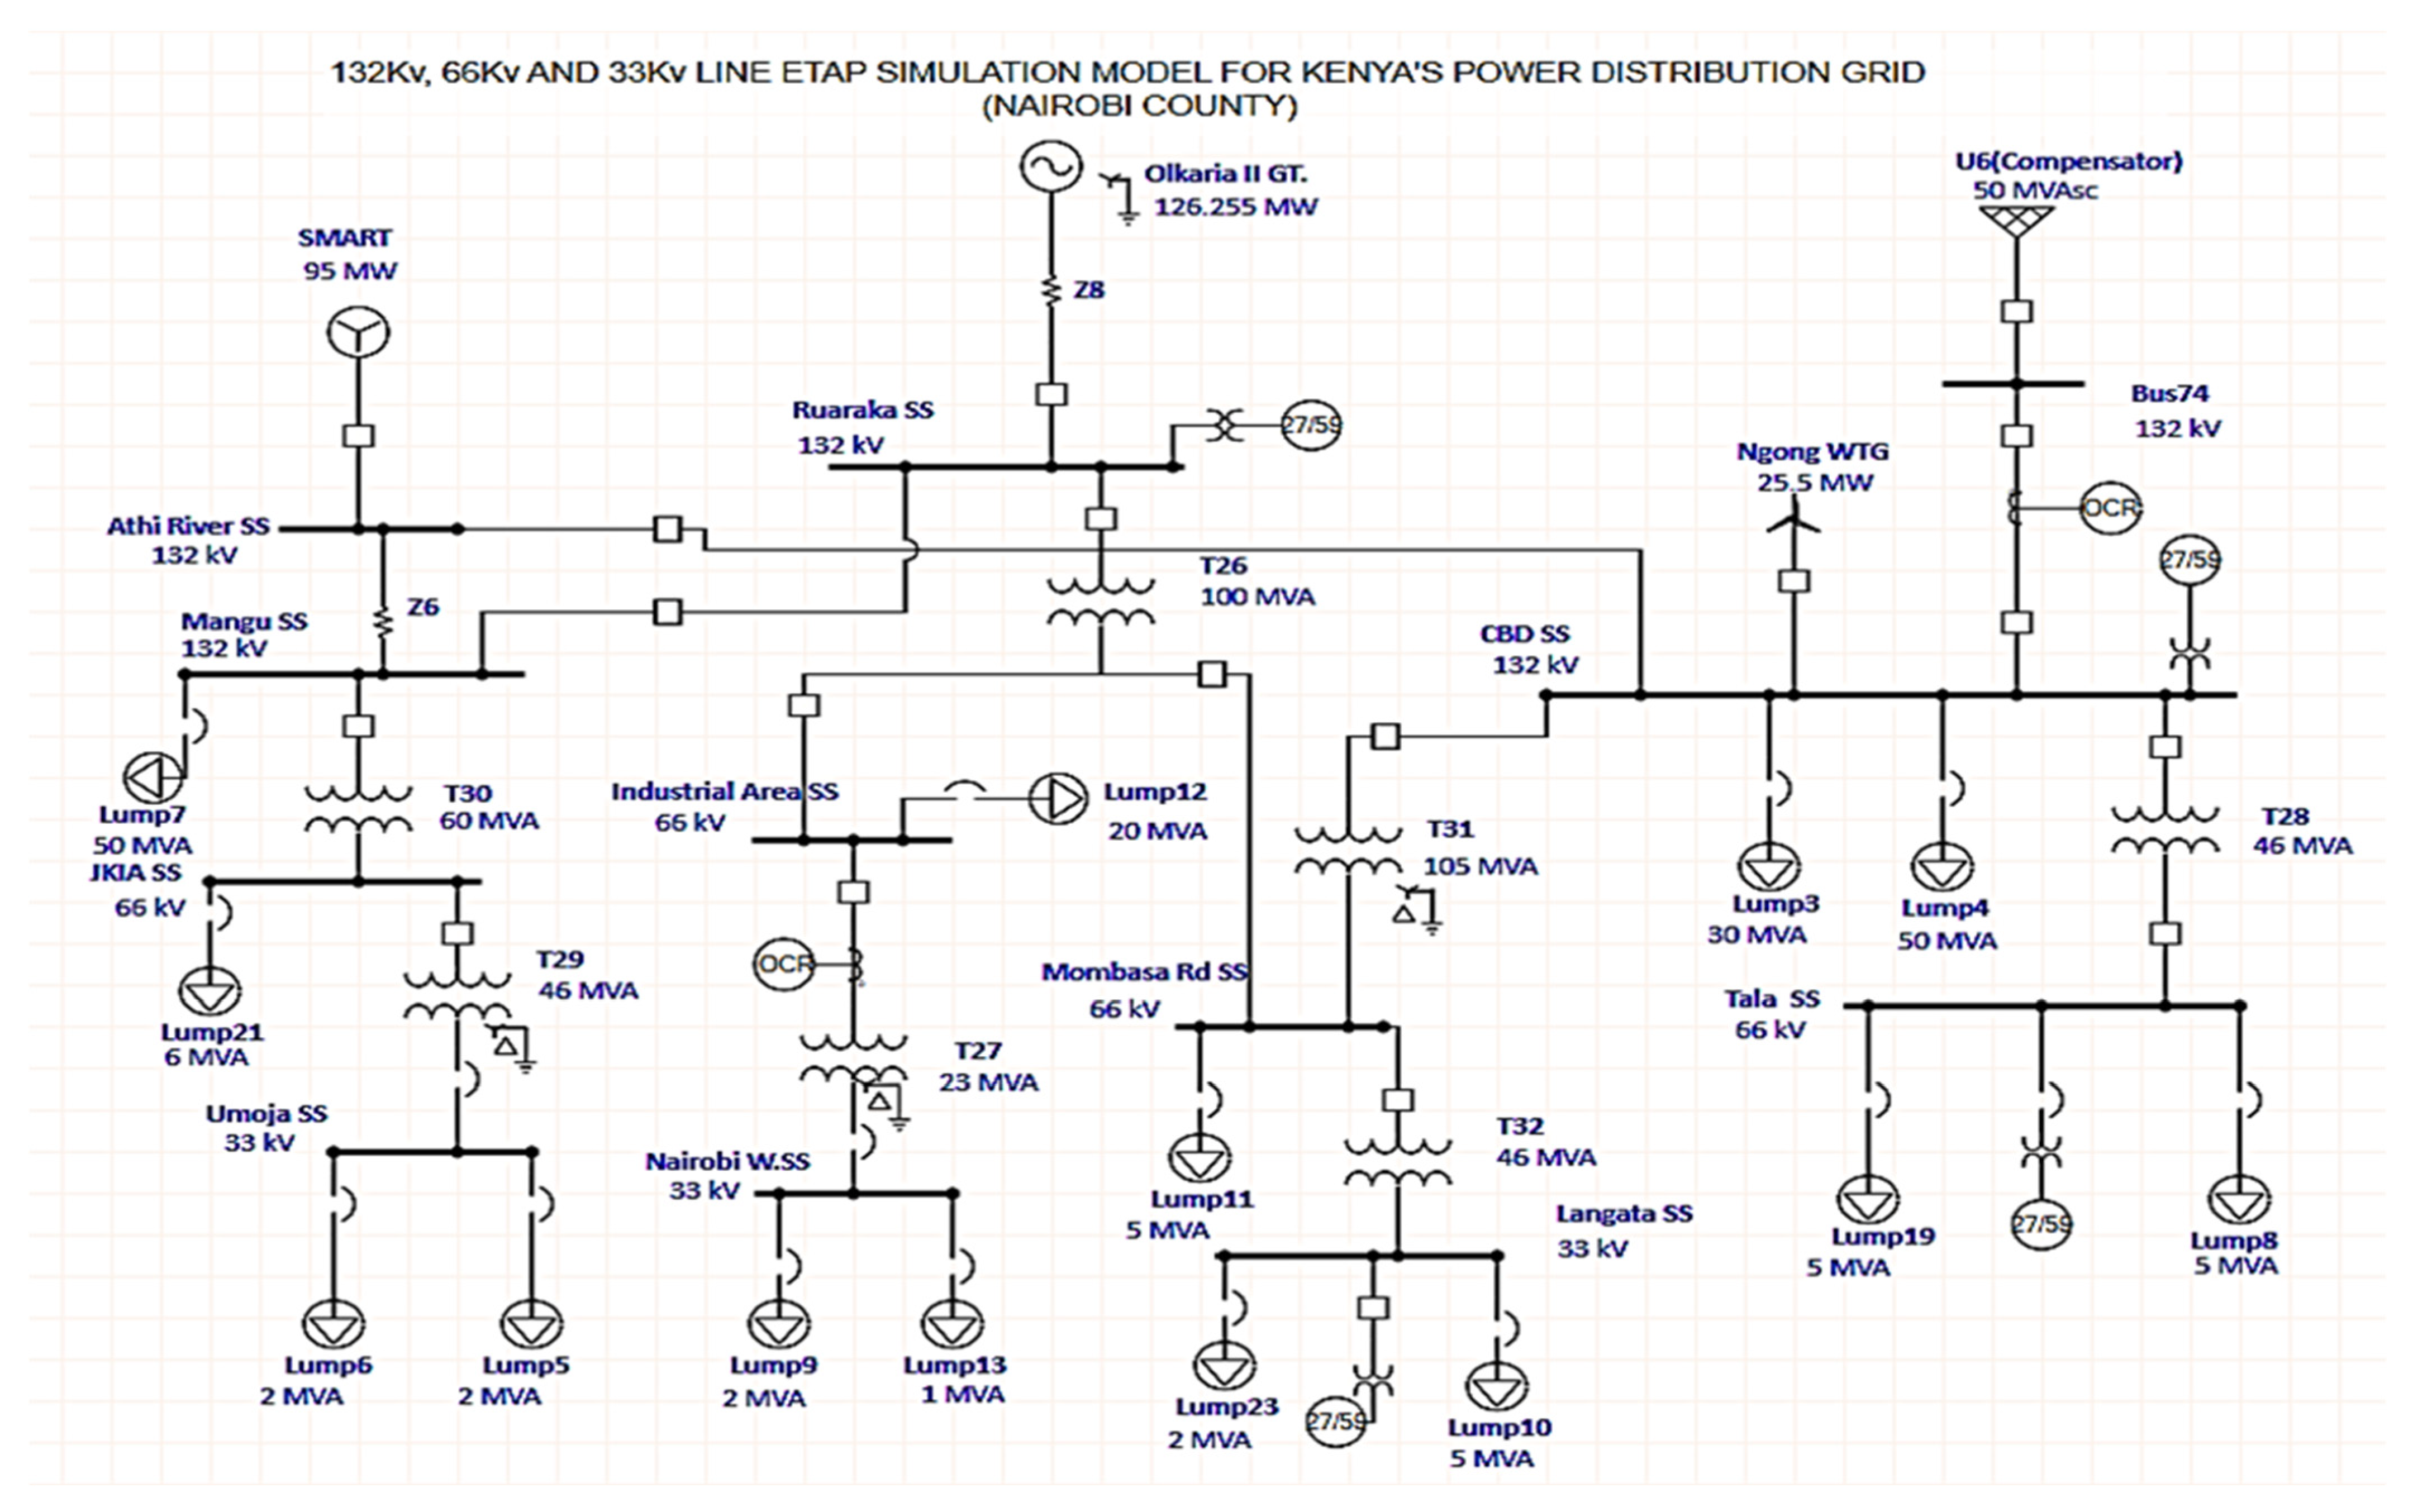
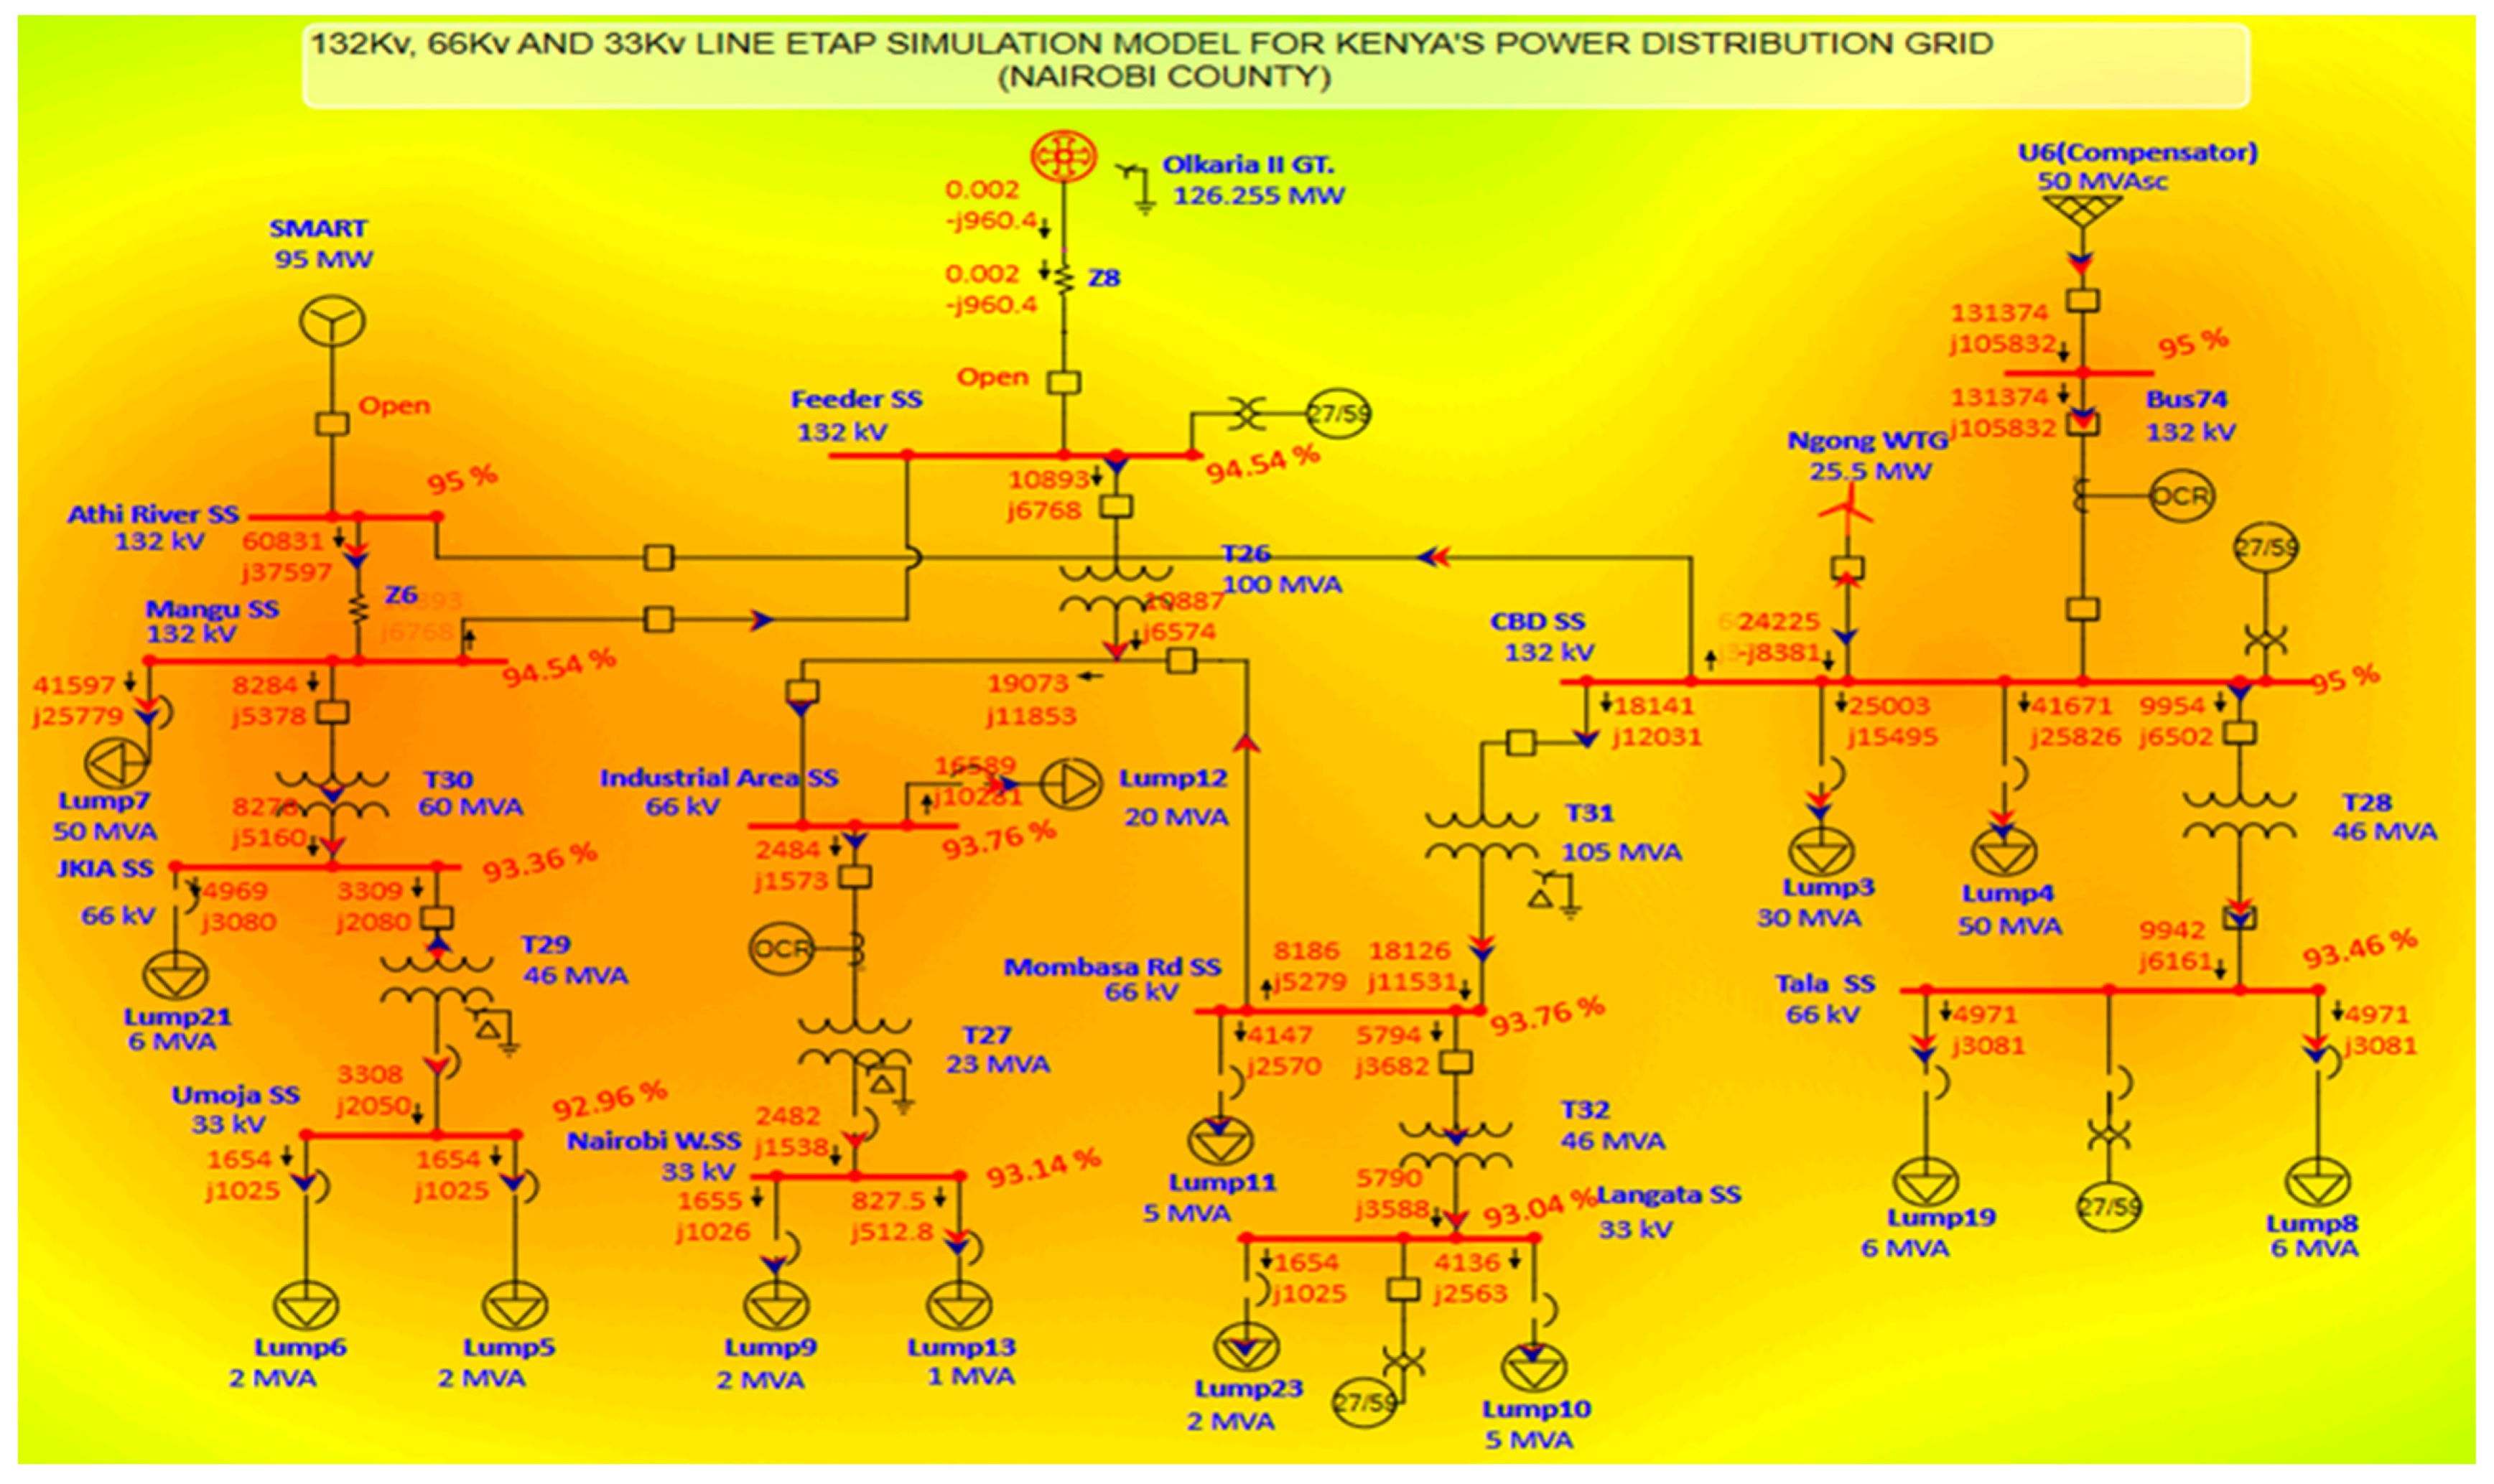
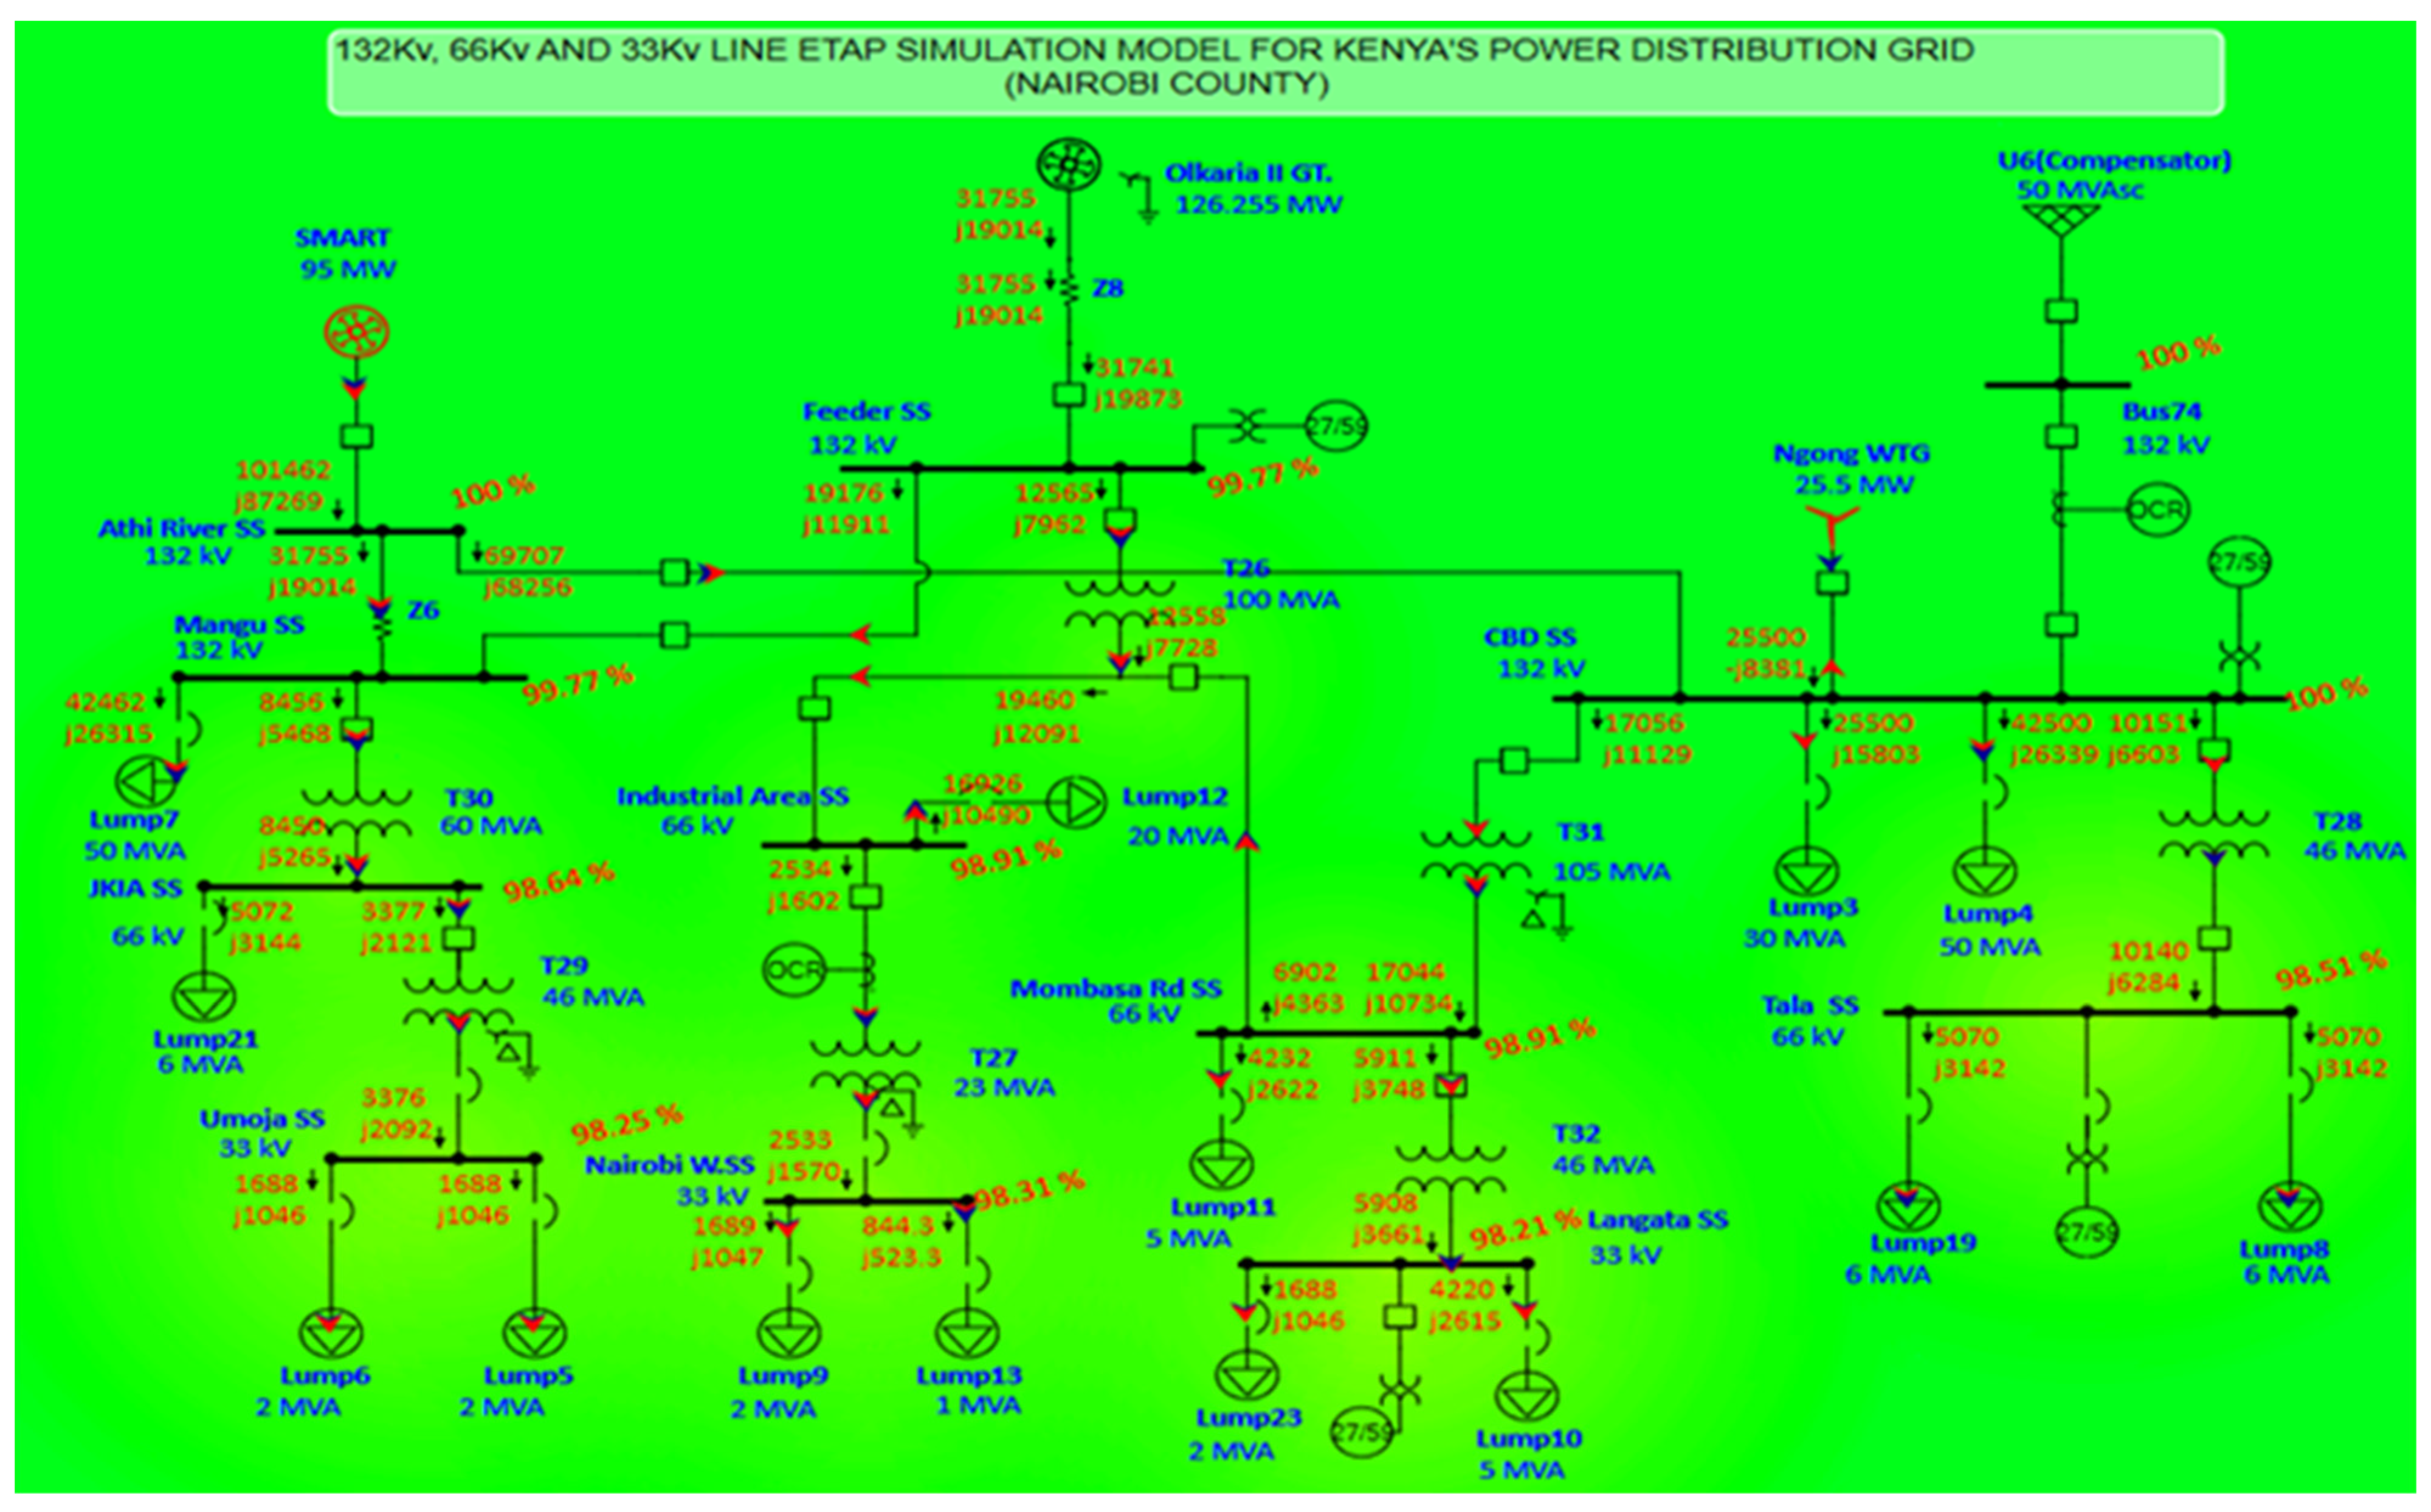
3.1. System Scenario Modelling
3.2. Modelling Assumptions
3.3. Scenarios Modelled
- Base case: No SMART-SMR Unit
- 2.
- Scenario 2: Wind and Compensator providing power
- 3.
- Scenario 3: SMART-SMR Integration with existing power sources
3.4. Network Configuration with Protection Devices
4. Results and Discussion
4.1. Comparative Analysis of Scenarios
4.2. Reliability Enhancement
4.3. Impact of SMART Integration
4.4. Effects of Network Reconfiguration and Protection Devices
5. Conclusions
Author Contributions
Funding
Data Availability Statement
Acknowledgments
Conflicts of Interest
References
- Ministry of Energy. Kenya National Elecritification Strategy; Ministry of Energy: Nairobi, Kenya, 2018.
- Kenyas LCPDP 2022-2041 Sector Report Final 2022_31082022 (005). Available online: https://www.energy.go.ke/electrical-power-development-0 (accessed on 28 November 2024).
- IAEA. Nuclear Power Reactors in the World; IAEA: Vienna, Austria, 2018. [Google Scholar]
- Idowu, K.; Uhunmwangho, R.; Okafor, E.C.N.; Big-Alabo, A. Reliability Improvement Study of a Distribution Network with Distributed Generation. Appl. Model. Simul. 2021, 5, 53–65. [Google Scholar]
- Guimarães, I.O.; da Silva, A.M.L.; Nascimento, L.C.; Fotuhi-Firuzabad, M. Reliability assessment of distribution grids with DG via quasi-sequential Monte Carlo simulation. Electr. Power Syst. Res. 2024, 229, 110122. [Google Scholar] [CrossRef]
- Ahmad, S.; Sardar, S.; Asar, A.U.; Karam, F.W. Reliability Analysis of Distribution System using ETAP. Int. J. Comput. Sci. Inf. Secure 2017, 15, 197–201. [Google Scholar]
- Operation Technology Inc. ETAP 22.0: Electrical Power System Analysis Software Documentation; Operation Technology, Inc.: Irvine, CA, USA, 2023. [Google Scholar]
- IEEE Standard 1366-2012; IEEE Guide for Electric Power Distribution Reliability Indices. IEEE Power & Energy Society: Piscataway, MJ, USA, 2012.
- KAERI. Status Report 77-System-Integrated Modular Advanced Reactor (SMART); KAERI: Daejeon, Republic of Korea, 2011. [Google Scholar]
- Weedy, B.M.; Cory, B.J.; Jenkins, N.; Ekanayake, J.B.; Strbac, G. Electric Power Systems; Wiley: Hoboken, NJ, USA, 2012. Available online: https://books.google.ro/books?id=JkQdhXtGBtYC&printsec=copyright&rdir_esc=y#v=onepage&q&f=false (accessed on 28 November 2024).
- KPLC. Grid Development and Maintenance Plan 2016-17–2020-21; Nairobi City County 132kV-66kv-33kV—Distribution Grid Combined_20221207; KPLC: Nairobi, Kenya, 2021. [Google Scholar]
- IEC 60909; Short-Circuit Currents in Three-Phase A.C. Systems. Part 0, Calculation of Currents, 2.0. International Electrotechnical Commission: Geneva, Switzerland, 2016.
- Tiwary, A.; Tiwary, S. Evaluation of Customer Orientated Indices and Reliability Study of Electrical Feeder System Evaluation of Customer Orientated Indices and Reliability Study of Electrical Feeder System. Reliab. Theory Appl. 2020, 15, 36–43. [Google Scholar]


| Parameter | Value | Unit |
|---|---|---|
| Reactor thermal output | 330 | MWth |
| Power plant output, gross | 100 | MWe |
| Power plant output, net | 90 | MWe |
| Power plant efficiency, net | 30.3 | % |
| Generator rated power | 111 | MVA |
| Generator active power | 105 | MW |
| Generator voltage | 18.0 | kV |
| Generator frequency | 60 | Hz |
| Turbine speed | 1800 | rpm |
| HP turbine inlet pressure | 5.2 | MPa(a) |
| HP turbine inlet temperature | 296.4 | °C |
| Main steam pressure (nominal) | 5.2 | MPa |
| Main steam temperature (nominal) | 296 | °C |
| Feedwater temperature | 200 | °C |
| Plant availability target | >95 | % |
| Electrical system configuration | Two train approach | - |
| Backup power | Diesel generators and batteries | - |
| Load-following capability | Yes | - |
| Seismic design (SSE) | 0.3 | g |
| Component Type | Quantity | Specifications | Failure Rate (f/yr) |
|---|---|---|---|
| Buses | 15 | 132 kV, 66 kV, 33 kV | Varies (0.001100–0.011000) |
| Transformers | 7 | Two-winding type | 0.015000 |
| Circuit breakers | 34 | HV and LV types | 0.004500 |
| Lumped loads | 14 | Various sectors | Varies (0.005800–0.099000) |
| Generators | 4 | - | - |
| MART reactor | 1 | Synchronous (95 MW) | 0.000000 |
| Olkaria II GT | 1 | Synchronous (126.255 MW) | 0.990000 |
| U6 Compensator (Grid) | 1 | Power grid (50 MVA) | 0.743000 |
| Ngong WTG | 1 | Wind turbine (25.5 MW) | 0.199000 |
| Component | Type | Input Data (Given) | With SMART-SMR Output Data (Simulated) |
|---|---|---|---|
| SMART Reactor | Generator | Rated Power: 111 MVA Active Power: 105 MW Failure Rate: 0.000000 f/yr | - Power Output: 117.317 MW - Reactive Power: 122.885 Mvar |
| Olkaria II GT | Generator | - Capacity: 126.255 MW - Failure Rate: 0.990000 f/yr | - Power Output: 44.826 MW - Reactive Power: 15.081 Mvar |
| Ngong WTG | Generator | - Capacity: 25.5 MW - Failure Rate: 0.199000 f/yr | - Power Output: 26.417 MW - Reactive Power: −7.951 Mvar |
| U6 Compensator (Grid) | Power grid | - Capacity: 50 MVA - λ: 0.743000 f/yr | - Power Output: 0.606 MW - Reactive Power: −0.953 Mvar |
| Athi River SS | Bus (132 kV) | - λ: 0.017500 f/yr | - λ: 0.020530 f/yr |
| CBD SS | Bus (132 kV) | - λ: 0.032400 f/yr | - λ: 0.002410 f/yr |
| Mangu SS | Bus (132 kV) | - λ: 0.017500 f/yr | - λ: 0.000540 f/yr |
| Industrial Area SS | Bus (66 kV) | - λ: 0.038000 f/yr | - λ: 0.008300 f/yr |
| JKIA SS | Bus (66 kV) | - λ: 0.044200 f/yr | - λ: 0.007200 f/yr |
| Mombasa Rd SS | Bus (66 kV) | - λ: 0.030100 f/yr | - λ: 0.001100 f/yr |
| Tala SS | Bus (66 kV) | - λ: 0.067500 f/yr | - λ: 0.007500 f/yr |
| Langata SS | Bus (33 kV) | - λ: 0.059700 f/yr | - λ: 0.009700 f/yr |
| Nairobi W.SS | Bus (33 kV) | - λ: 0.077000 f/yr | - λ: 0.007200 f/yr |
| Umoja SS | Bus (33 kV) | - λ: 0.079510 f/yr | - λ: 0.002510 f/yr |
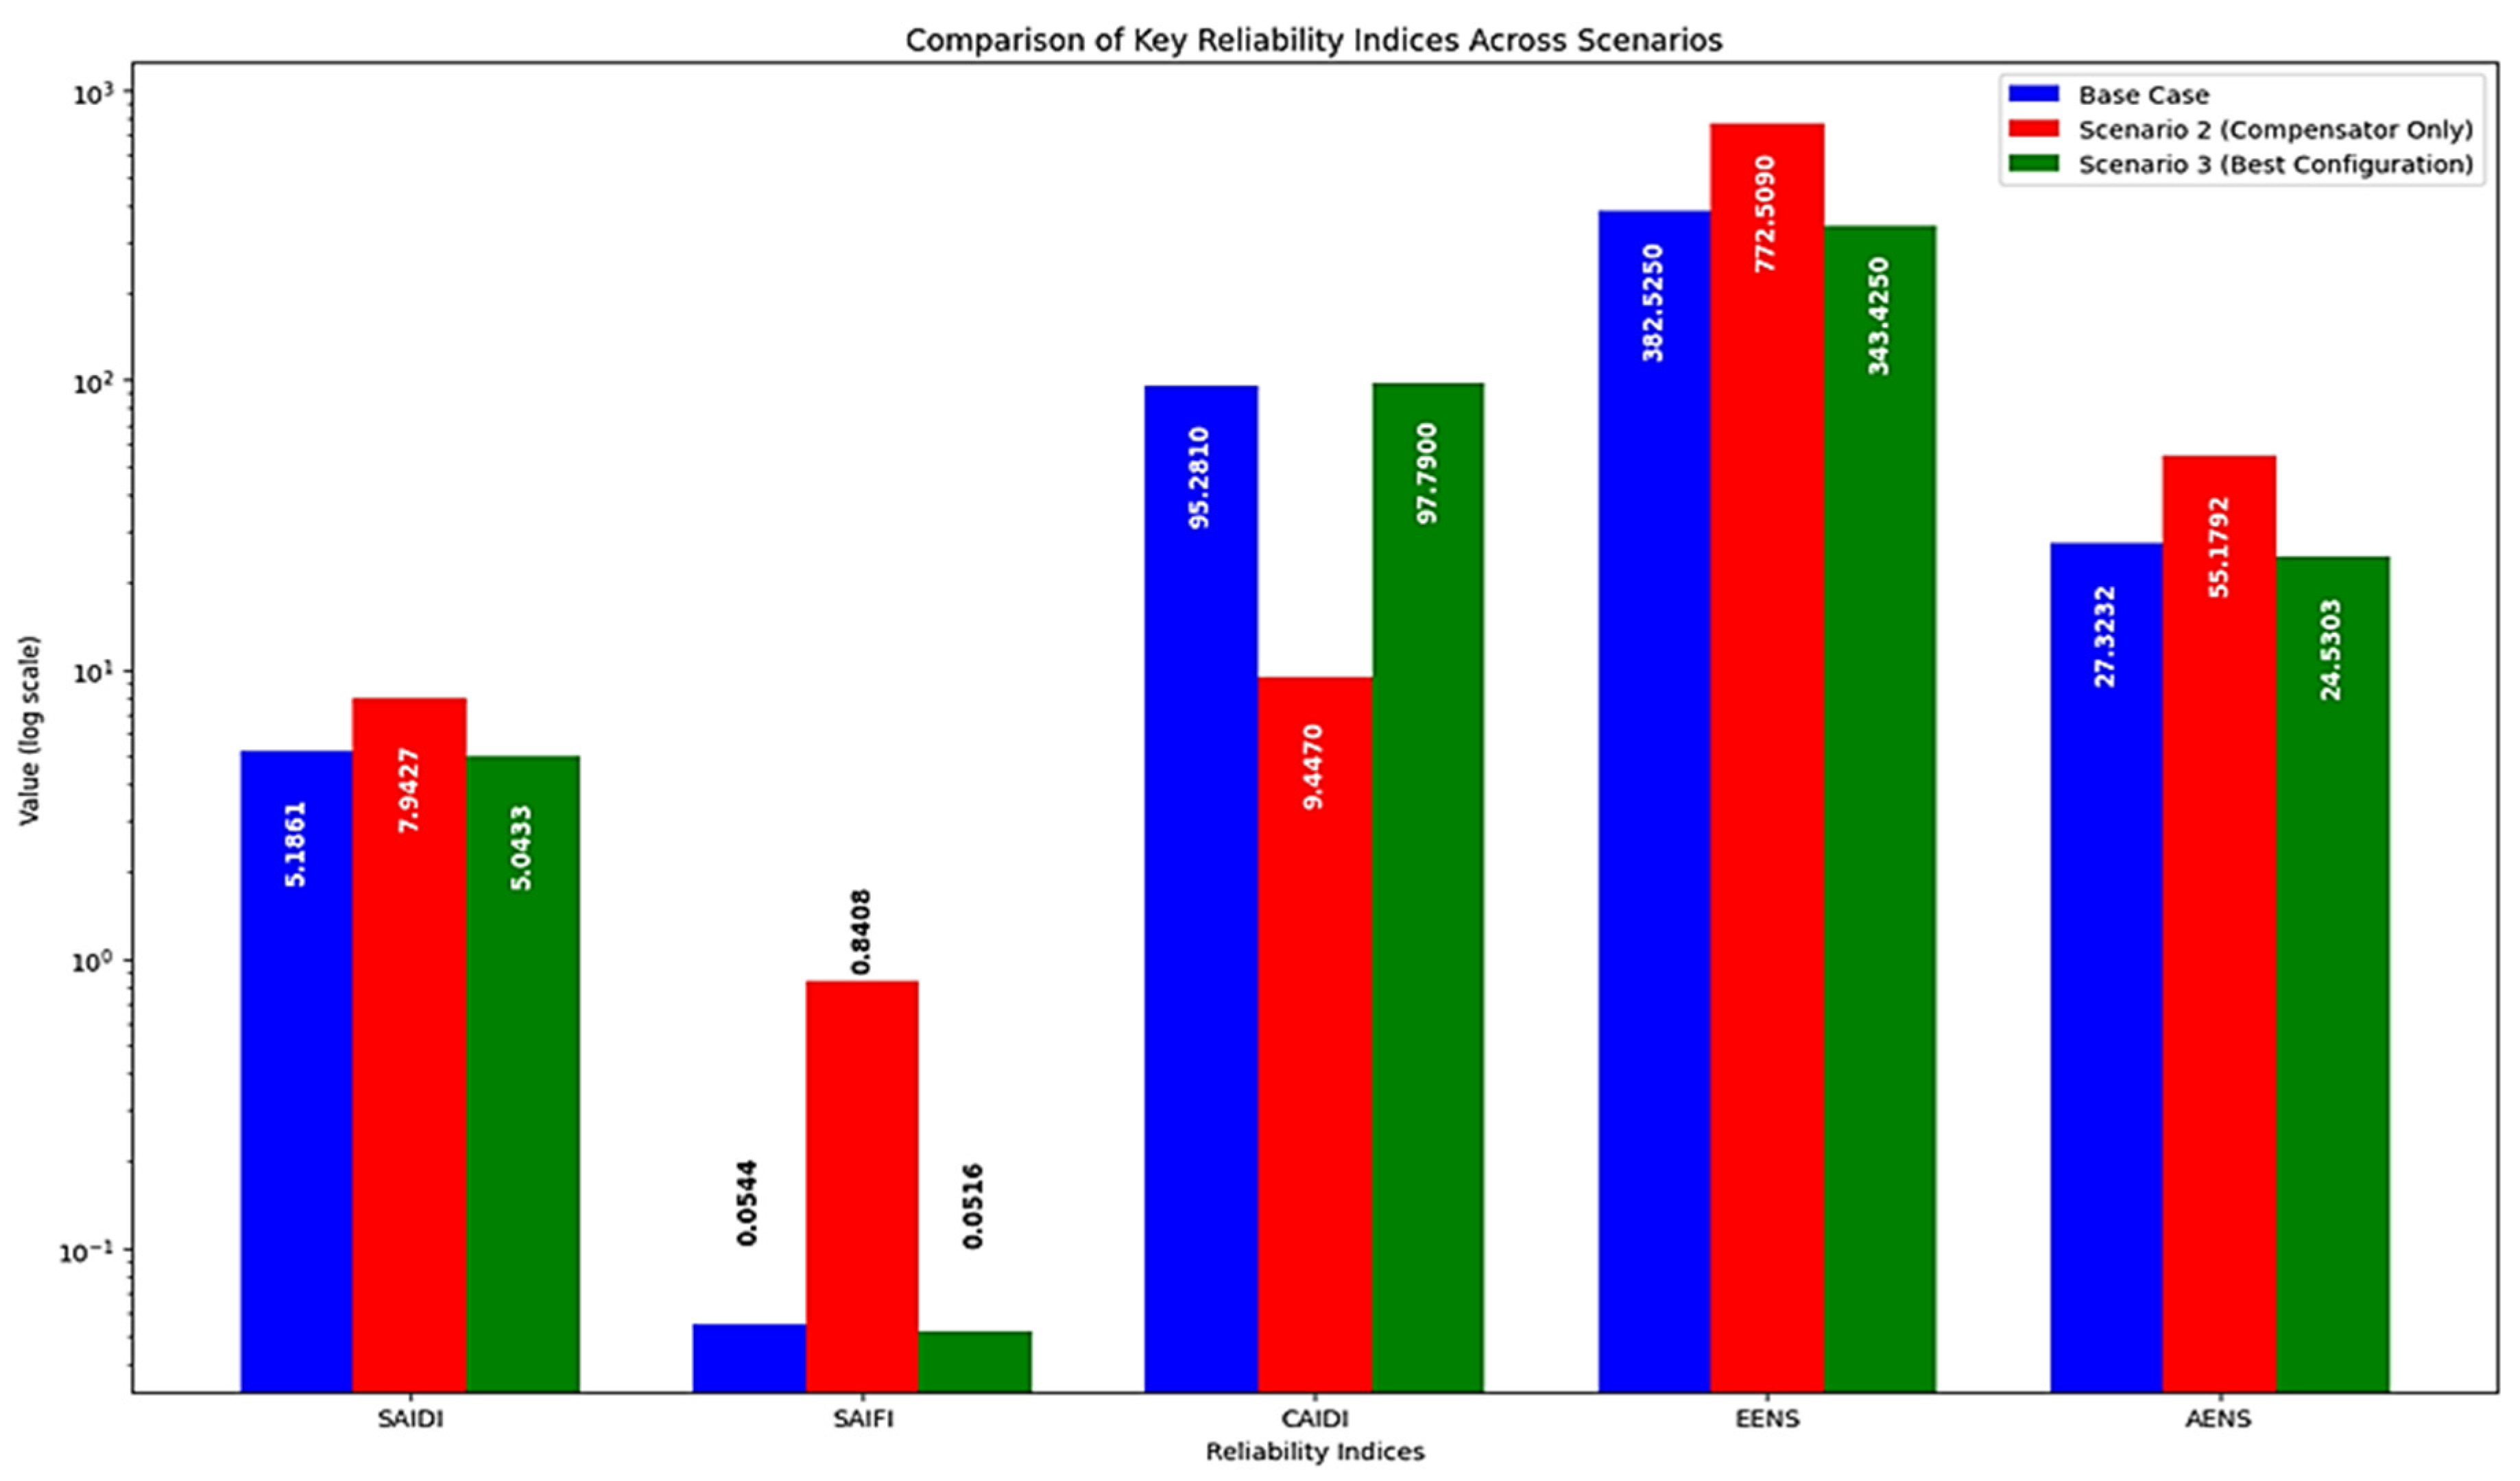
| Index | Base Case | Scenario 2 (Compensator Only) | Scenario 3 (Best Configuration) |
|---|---|---|---|
| SAIDI | 5.1861 | 7.9427 | 5.0433 |
| SAIFI | 0.0544 | 0.8408 | 0.0516 |
| CAIDI | 95.281 | 9.447 | 97.790 |
| ASAI | 0.9994 | 0.9991 | 0.9994 |
| EENS | 382.525 | 772.509 | 343.425 |
| AENS | 27.3232 | 55.1792 | 24.5303 |
| IEAR | 7.918 | 8.116 | 7.797 |
| Substation | Voltage Level | Scenario 1 (Base Case) | Scenario 2 (Compensator Only) | Scenario 3 (SMART-SMR Integration) |
|---|---|---|---|---|
| 132 kV Lines | ||||
| Athi River SS | 132 kV | λ: 0.017500 f/yr | λ: 0.811600 f/yr | λ: 0.020530 f/yr |
| CBD SS | 132 kV | λ: 0.032400 f/yr | λ: 0.797100 f/y | λ: 0.002410 f/y |
| Mangu SS | 132 kV | λ: 0.017500 f/yr | λ: 0.811600 f/y | λ: 0.000540 f/yr |
| 66 kV Lines | ||||
| Industrial Area SS | 66 kV | λ: 0.038000 f/yr | λ: 0.835100 f/y | λ: 0.008300 f/yr |
| JKIA SS | 66 kV | λ: 0.044200 f/yr | λ: 0.838300 f/yr | λ: 0.007200 f/yr |
| Mombasa Rd SS | 66 kV | λ: 0.030100 f/yr | λ: 0.824200 f/y | λ: 0.001100 f/yr |
| Tala SS | 66 kV | λ: 0.067500 f/yr | λ: 0.832200 f/yr | λ: 0.007500 f/yr |
| 33 kV Lines | ||||
| Langata SS | 33 kV | λ: 0.059700 f/yr | λ: 0.853800 f/yr | λ: 0.009700 f/yr |
| Nairobi W.SS | 33 kV | λ: 0.077000 f/yr | λ: 0.874100 f/yr | λ: 0.007200 f/yr |
| Umoja SS | 33kV | λ: 0.079510 f/yr | λ: 0.873610 f/yr | λ: 0.002510 f/yr |
| Parameter | Value |
|---|---|
| SMART-SMR Power Output | 117.317 MW |
| Reactive Power Support | 122.885 Mvar |
| Voltage Profile Improvement (Industrial Area SS) | 93.76% to 98.84% |
| Voltage Profile Improvement (Mombasa Rd SS) | 98.91% |
| SAIDI | 5.0433 h/customer-year |
| SAIFI | 0.0516 interruptions/customer-year |
| EENS | 343.425 MWh/year |
| ASAI | 0.9994 |
| Load-Following Range | 20–100% of rated capacity |
| Exciter Voltage | 2.8 pu |
| Exciter Current | 3 pu |
| Failure Rate (132 kV Substation Example—Mangu SS) | 0.000540 f/yr |
| Failure Rate (66 kV Substation Example—JKIA SS) | 0.007200 f/yr |
| Failure Rate (33 kV Substation Example—Umoja SS) | 0.002510 f/yr |
Disclaimer/Publisher’s Note: The statements, opinions and data contained in all publications are solely those of the individual author(s) and contributor(s) and not of MDPI and/or the editor(s). MDPI and/or the editor(s) disclaim responsibility for any injury to people or property resulting from any ideas, methods, instructions or products referred to in the content. |
© 2024 by the authors. Licensee MDPI, Basel, Switzerland. This article is an open access article distributed under the terms and conditions of the Creative Commons Attribution (CC BY) license (https://creativecommons.org/licenses/by/4.0/).
Share and Cite
Goga, O.K.; Chang, C.-k. Assessing Grid Reliability for Optimal Integration of System-Integrated Modular Advanced Reactor Technology (SMART) for Kenya: A Case of the Nairobi Distribution Network. Energies 2024, 17, 6160. https://doi.org/10.3390/en17236160
Goga OK, Chang C-k. Assessing Grid Reliability for Optimal Integration of System-Integrated Modular Advanced Reactor Technology (SMART) for Kenya: A Case of the Nairobi Distribution Network. Energies. 2024; 17(23):6160. https://doi.org/10.3390/en17236160
Chicago/Turabian StyleGoga, Ondiegi Kapis, and Choong-koo Chang. 2024. "Assessing Grid Reliability for Optimal Integration of System-Integrated Modular Advanced Reactor Technology (SMART) for Kenya: A Case of the Nairobi Distribution Network" Energies 17, no. 23: 6160. https://doi.org/10.3390/en17236160
APA StyleGoga, O. K., & Chang, C.-k. (2024). Assessing Grid Reliability for Optimal Integration of System-Integrated Modular Advanced Reactor Technology (SMART) for Kenya: A Case of the Nairobi Distribution Network. Energies, 17(23), 6160. https://doi.org/10.3390/en17236160