1. Introduction
In contemporary times, one of the most crucial aspects of road networks is adherence to traffic regulations. These rules are established in specific cases to ensure that every road user can feel safe while traveling to their destination [
1]. Therefore, these regulations are of utmost importance, especially for ensuring the safety of the most vulnerable road users, such as pedestrians and cyclists [
2]. Nowadays, many studies explore the huge problem of driving behavior [
3]. What was studied most often is aggressive driving [
4], seat belt use [
5], and using mobile phones during driving [
6]. It has been observed that, in modern times, a significant issue is the failure of drivers to use turn signals when they are exiting a roundabout. Not many studies have investigated the rates of turn signal usage at multiline urban roundabouts, but one of them is an investigation about the factors affecting turn signal usage [
7]. The reasons behind omitting turn signal usage remain largely unknown. Drivers are most likely engaging in this practice due to inattention or negligence. However, even such a seemingly minor issue can have a significant impact on urban traffic flow [
8]. It is particularly frustrating when, as a driver, we wish to enter traffic on a roundabout, but the driver exiting the roundabout fails to signal their intention to leave, preventing us from completing our maneuver sooner despite being able to do so safely. Roundabouts are among the safest types of intersections in road traffic [
9]; therefore, other factors are directly dependent on the actions of the drivers themselves. Fuel consumption [
10] by vehicles is the result of numerous factors, including the driver’s style of driving, their skills, and their experience. Sudden acceleration and braking contribute to increased fuel consumption and, consequently, a rise in exhaust emissions [
11,
12] into the environment [
13]. Road conditions [
14] also directly affect the number of pollutants released; thus, in cities striving for sustainable transport [
15], one of the key objectives of traffic management is often the improvement of traffic flow [
16]. Additional factors that influence fuel consumption are closely related to the vehicle itself, such as its weight, technical condition, and the type of engine. It is well known that a heavy-duty vehicle will consume more fuel than a small passenger car [
17]. The main objective of this study is to show how a parameter such as measuring drivers using turn signals at a roundabout can affect the accuracy of microsimulation measurement results in road traffic.
2. Materials and Methods
In order to address the question of the actual impact of not using turn signals when exiting a roundabout to the right, a model was developed using PTV VISSIM software [
18]. Vissim’s traffic flow model is a stochastic, time step-based, microscopic model that treats driver–vehicle units as basic entities [
19]. As the model accounts for psychological aspects as well as for physiological restrictions of drivers’ perception, it is called the psycho-physical car-following model. It contains a psycho-physical car following model for longitudinal vehicle movement and a rule-based algorithm for lateral vehicle movement. This software is designed for microsimulation of road traffic. It employs a leader–following traffic model, specifically the Wiedemann model [
20]. Microsimulation of road traffic is crucial in studies focused on specific cases within the road network. It utilizes very fine data aggregation and high model detail, as each road user plays an essential role in the scenarios under investigation. Microsimulation is applied for various aspects, such as assessing road capacity, verifying the functionality of traffic signals, considering changes to urban infrastructure, or examining the impact of different transport modes or road users on traffic flow. All of these factors can be tested in a properly constructed model to prevent incorrect implementations in the urban network. In the case under study, the model was developed based on sections of the road network, with traffic volume data added according to measurements taken by the Municipal Roads Authority of Warsaw, valid as of the specific date 24 October 2023 [
21]. The data used are real and reflect the challenging traffic conditions during the morning peak hours. Subsequently, the type and directional structure of traffic within the network were incorporated. Due to the detailed nature of the study, data regarding bicycle crossings as well as pedestrian volumes at specific pedestrian crossings within the network were also included. The studied section of the road network does not feature traffic signals; thus, this element was excluded from the constructed model. In the prepared network, the traffic regulations applicable in Poland were implemented. On the studied section of the road network, these regulations follow the right-hand driving system. A parameter, referred to as Anticipate Routes, was introduced to distinguish the results, and it will be described in greater detail later in this chapter. This parameter was directly related to the “conflict areas” function within PTV VISSIM, which allowed us to determine which vehicle had priority at a conflict point. The driving behavior of vehicles approaching a conflict area shall produce the maximum capacity for a minor flow, without affecting vehicles in the major flow. Vehicles in the major flow might be hindered by vehicles on the merge lane, and the smaller the user-defined safety distance factor is, the greater the hindrance [
19].
The model was then calibrated and validated. To ensure the accuracy of the number of vehicles exiting the network, the GEH statistic [
22] was applied, and the results are shown in
Table 1. GEH is a metric used for comparing two values of traffic flow—measured and modeled. The desired result should be below 5, which indicates that the GEH suggests the model accurately reflects the actual traffic volume.
The model was created using PTV VISSIM version 25. The model was built using real traffic measurement data from the city of Warsaw. Warsaw, the capital of Poland, is located in Central Europe.
Figure 1 below shows the layout of the studied road segment. The studied road network consists of a roundabout, an intersection, and another roundabout. The morning peak period, characterized by exceptionally high traffic volume due to the proximity of residential areas, was examined. Some evaluation was conducted via node evaluation. Node evaluation was especially used to determine specific data from intersections without first having to define all sections manually in order to determine the data. In
Figure 1, the measurement area of the node is highlighted by a black line.
Table 2 shows the distance from the stop line to the edge of the node.
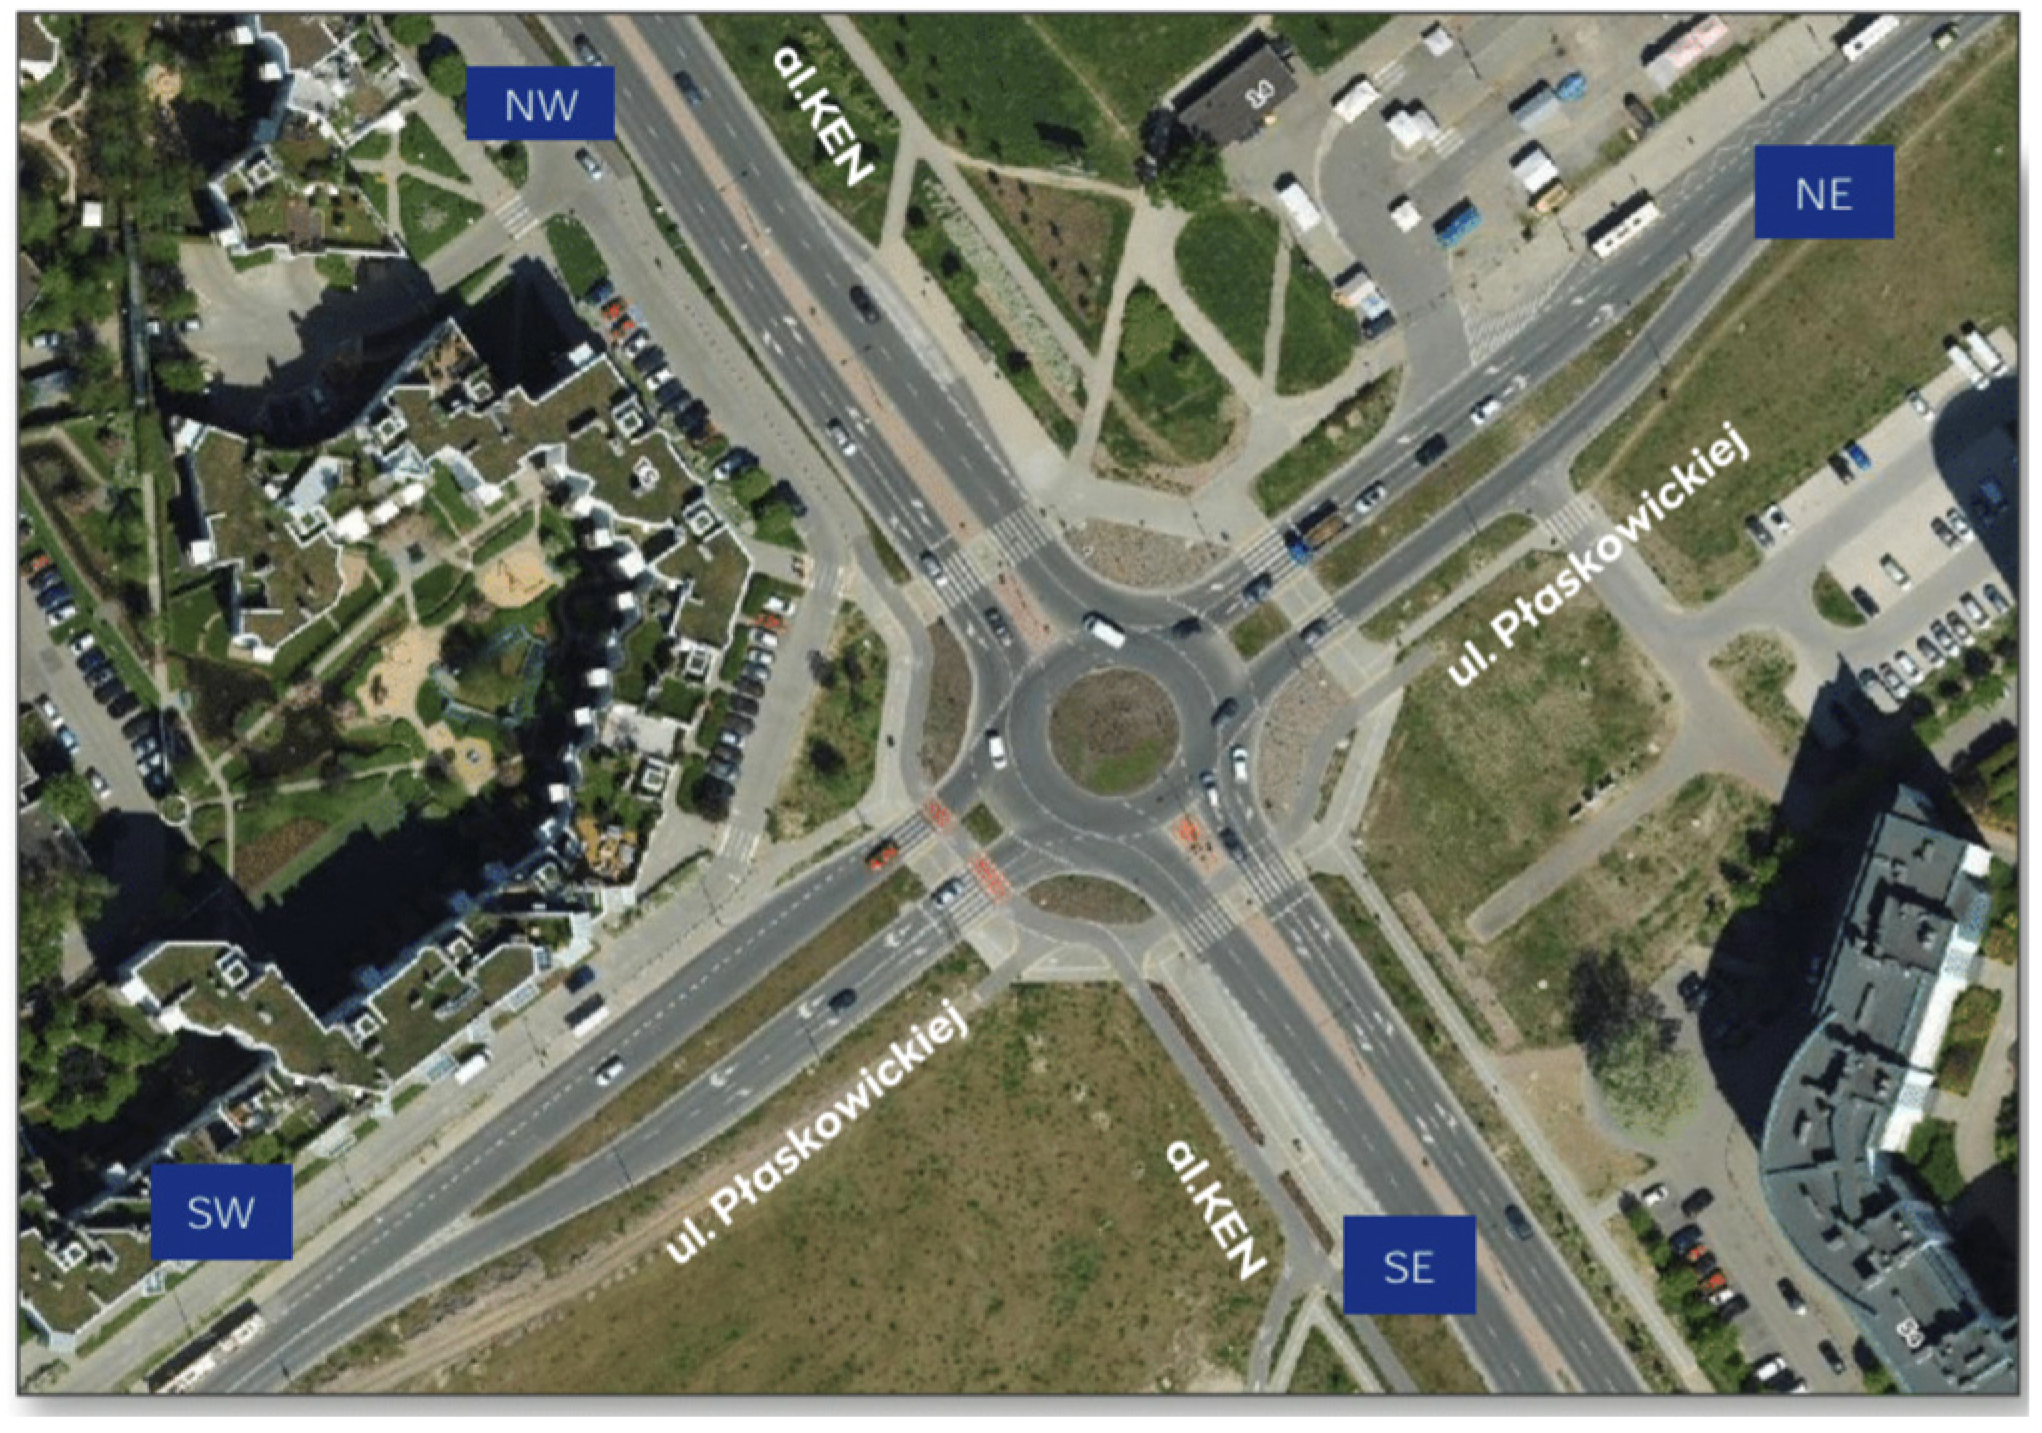
Roundabout 1 (52.145412, 21.051792) was designated as Intersection 47 for the purposes of this study. This roundabout consists of the following: NW (Komisji Edukacji Narodowej Avenue)—two traffic lanes on the approach, including one lane for straight and right turns, and one lane for straight and left turns; NE (Płaskowickiej Street)—two traffic lanes on the approach, including an additional, dedicated lane for right turns, and one lane for straight, right, and left turns; SE (Komisji Edukacji Narodowej Avenue)—two traffic lanes on the approach, including one lane for straight and right turns, and one lane for straight and left turns; SW (Płaskowickiej Street)—two traffic lanes on the approach, including an additional, dedicated lane for straight, right, and left turns, and one lane for right turns. Pedestrian crossings are present at each approach. Bicycle crossings are located at the SW (Płaskowickiej Street) and SE (Komisji Edukacji Narodowej Avenue) approaches. A visual representation of the roundabout is shown in the diagram below—
Figure 2.
The traffic composition at Intersection 46 was as follows: 1.1% motorcycles, 91.9% passenger vehicles, 4.5% delivery vehicles, 1% buses, 1.4% trucks, and 0.1% articulated vehicles (trucks with trailers/semi-trailers).
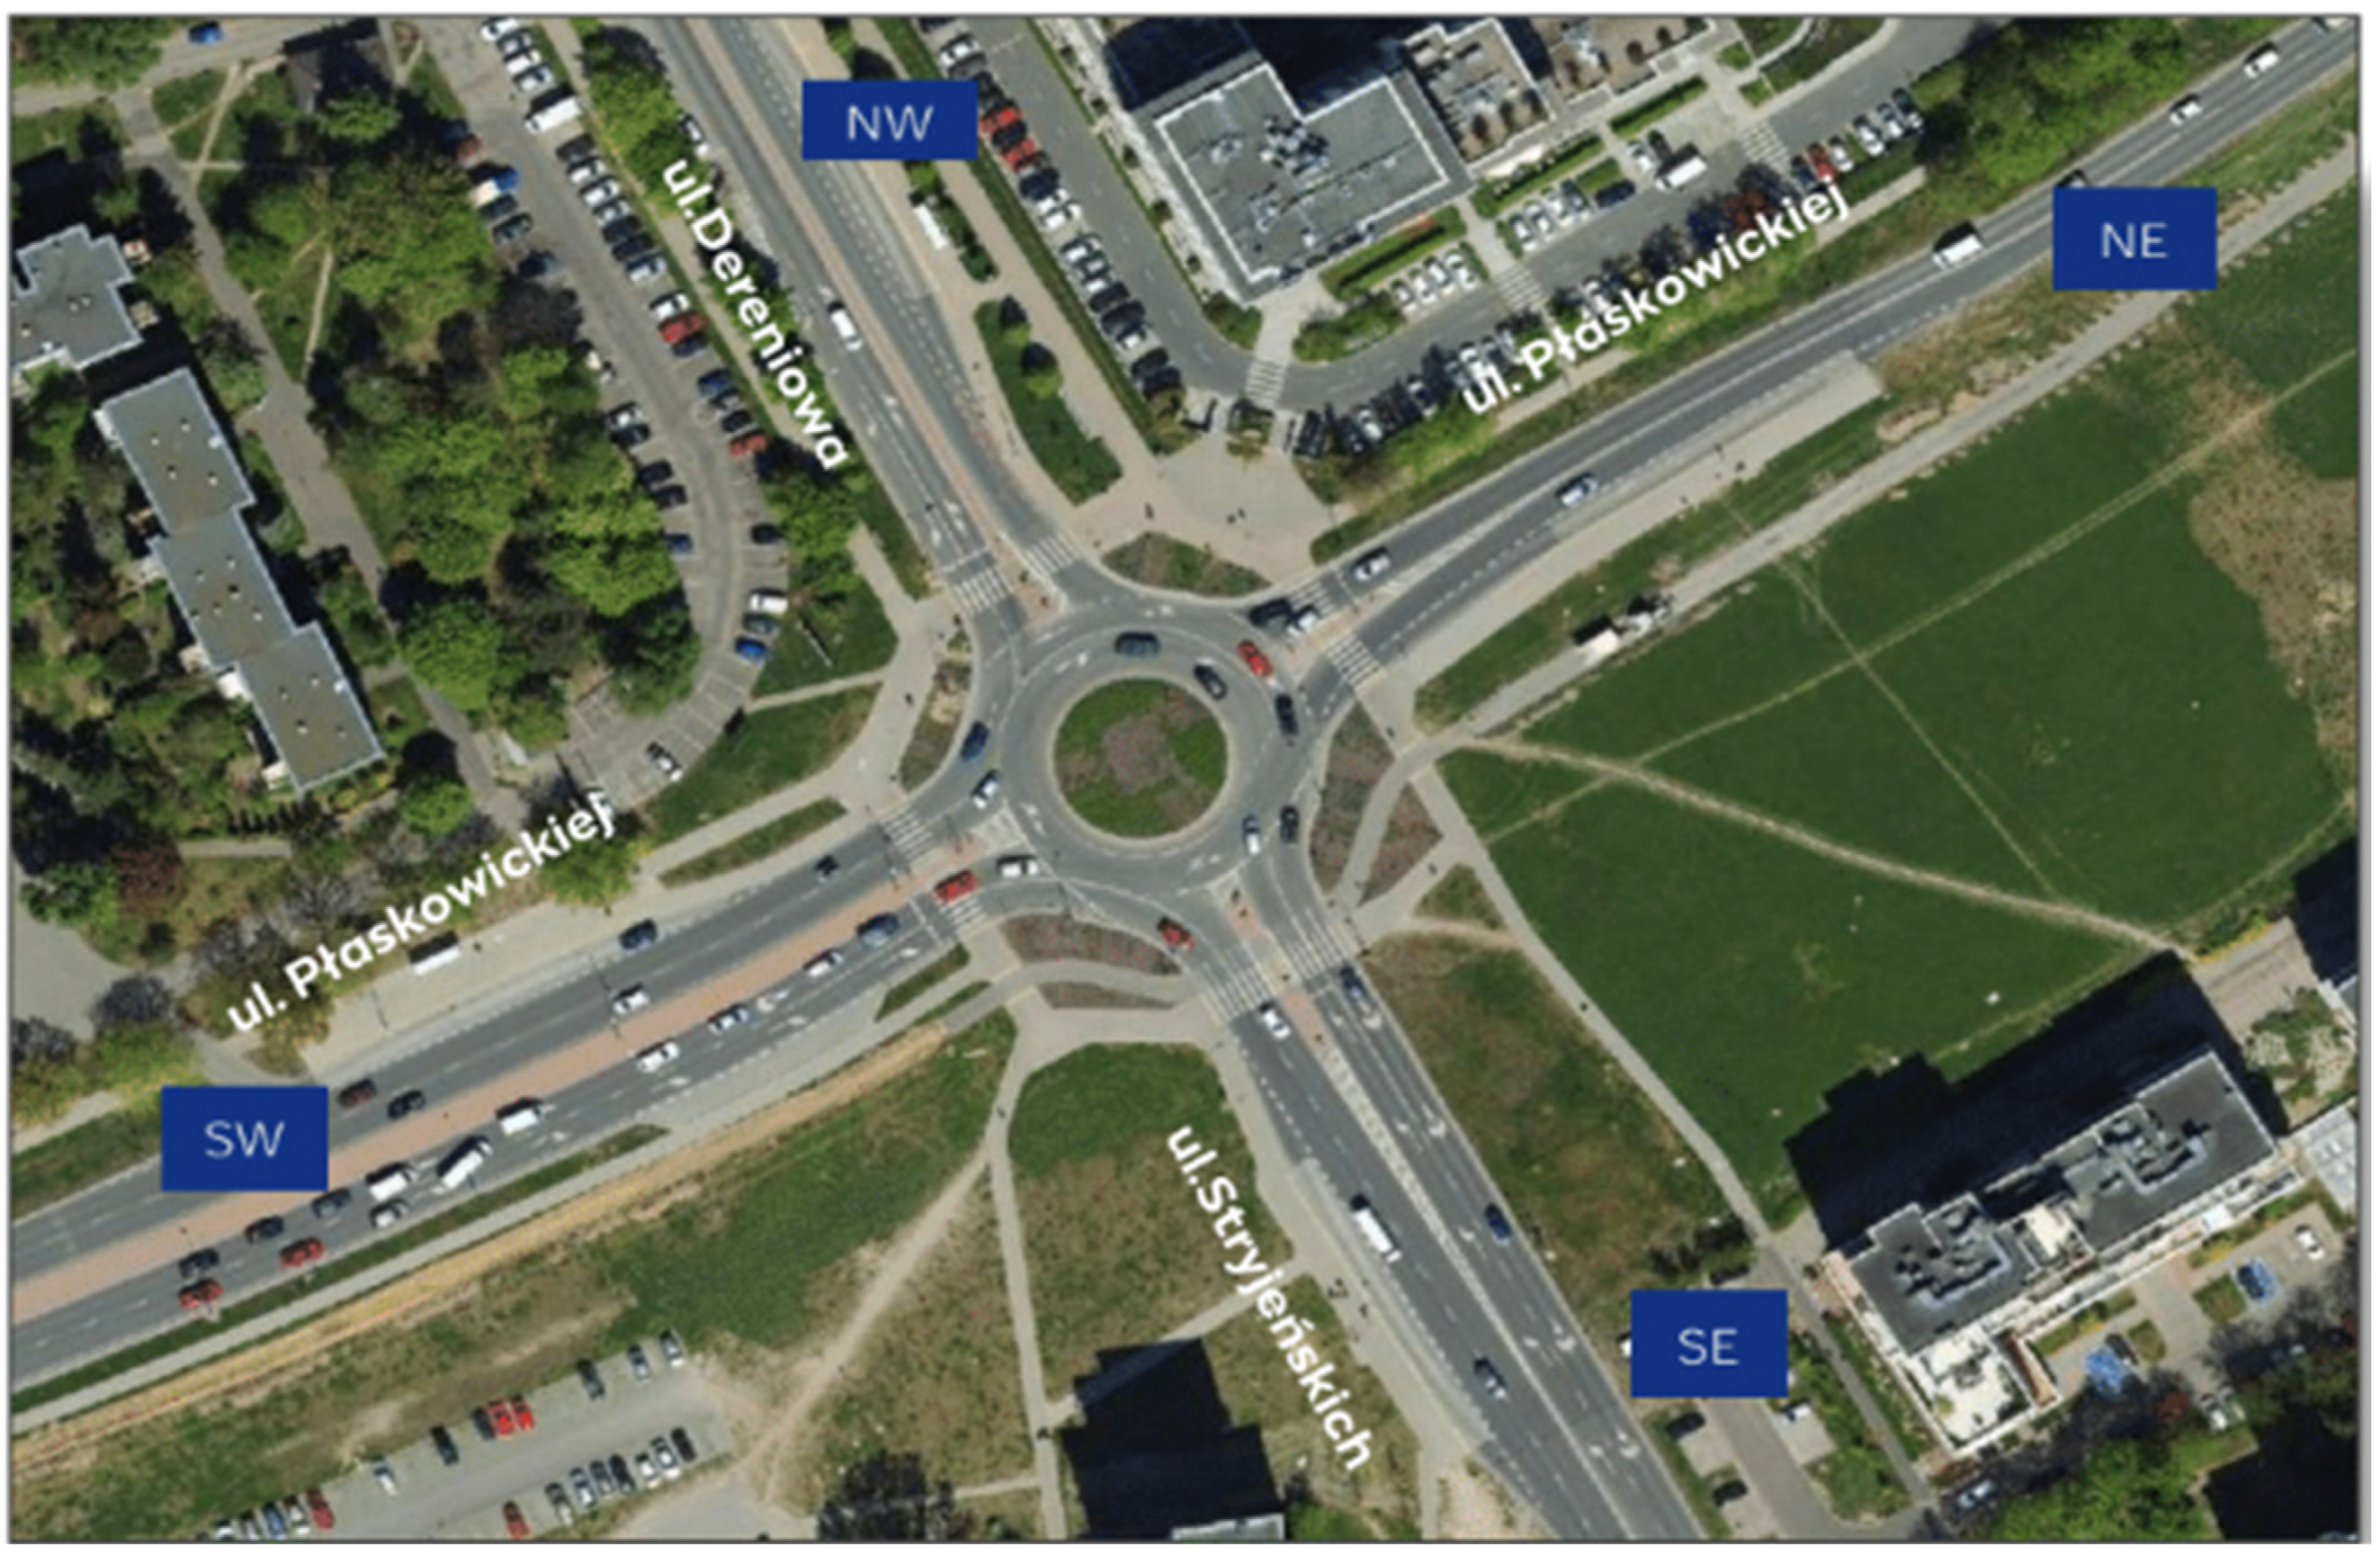
Roundabout 2 (52.142270, 21.044947) in the model was designed as Intersection 46. This roundabout consists of four entry points: North-West (Dereniowa Street)—Two lanes on the entry, including a dedicated right-turn lane, and one lane for straight-through and left turns. North-East (Płaskowickiej Street)—One lane on the entry. South-East (Stryjeńskich Street)—Two lanes on the entry, including a dedicated left-turn lane and one lane for straight-through, right, and left turns. South-West (Płaskowickiej Street)—Two lanes on the entry, including one lane for right turns and one lane for straight-through, right, and left turns. Pedestrian crossings are present at each entry point. There are no bicycle crossings. A visual representation of the roundabout is shown in the figure below—
Figure 3.
The vehicle composition was as follows: motorcycles, 0.6%; passenger cars, 91.8%; delivery vehicles, 4.6%; buses, 1.2%; trucks, 1.6%; and articulated trucks with trailers/semi-trailers, 0.2%.
Between the roundabouts, there is an intersection that is primarily transit-oriented. The traffic flow from the subordinate entries is low, as these are mainly access points to local small parking areas.
The model utilized the Scenario Management option. Each scenario included an increment of 10% in the Anticipate Routes parameter. The accompanying software manual explains this attribute as follows: “Percentage of vehicles required to yield that account for the routes of vehicles with the right of way. These vehicles approach with the major flow and will turn further upstream, meaning they will not reach the conflict area. For example, this can be used to determine the percentage of vehicles entering a roundabout because they trust that priority vehicles will exit the roundabout before reaching the conflict area, based on the turn signal of the priority vehicle. The value range is from 0 to 100%, with the default set at 0%. This attribute does not affect pedestrians who do not have to wait. For pedestrians who are required to wait, the following applies: 100% means all pedestrians required to wait to observe the routes of approaching vehicles with the right of way in the major flow. Less than 100% means pedestrians required to wait do not observe the routes of approaching vehicles with the right of way in the major flow”. Thus, starting with a value of 0, representing 0% of drivers paying attention to the turn signals of vehicles turning right at the roundabout, this scenario reflects the worst traffic conditions. In this case, the driver entering the roundabout would be forced to stop before making the entry maneuver until ideal traffic conditions are achieved. At 100%, where 100% of drivers pay attention to the turn signals of other drivers, theoretical conditions would result in the best possible traffic flow. In this scenario, the movement would be smooth. A total of 11 variants of the microsimulation were tested. For each scenario, the traffic intensity was identical and matched the measured actual traffic intensities. In these prepared scenarios, fuel consumption was measured at each of the studied roundabouts. It should be noted that the PTV Vissim software measures this in gallons. Since in Poland, as the unit of measurement for fuel is liters, the results were converted from gallons to liters. Simultaneously, the total carbon monoxide emissions (CO) [
23,
24,
25] were measured at each of the studied roundabouts.
3. Results
The measurement results for the morning peak traffic intensity were obtained by recording parameters during the period from 7:30 a.m. to 8:30 a.m. Additionally, the model employed a network filling method for the first 15 min, with traffic intensity consistent with real-world conditions. This was followed by two hours representing the morning peak and an additional 15 min of simulation for a cool-down phase to stabilize the network. In total, the simulation lasted 2.5 h, lasting from 7:15 a.m. to 9:00 a.m.
CO Emissions
In the first part of the microsimulation analysis, CO emissions produced by vehicles in the studied network are compared to the number of vehicles. It is important to note that the number of vehicles, or traffic intensity, is consistent across all tested scenarios. The discrepancies observed concerning the percentage of anticipated routes are due to the fact that this analysis was conducted during the morning peak hours. As a result, varying numbers of vehicles were able to reach the control points, where traffic counters were placed. It is crucial to understand that the number of vehicles entering the network is directly influenced by several factors, such as traffic flow, intensity, and the ability to perform certain maneuvers, such as turning or going straight.
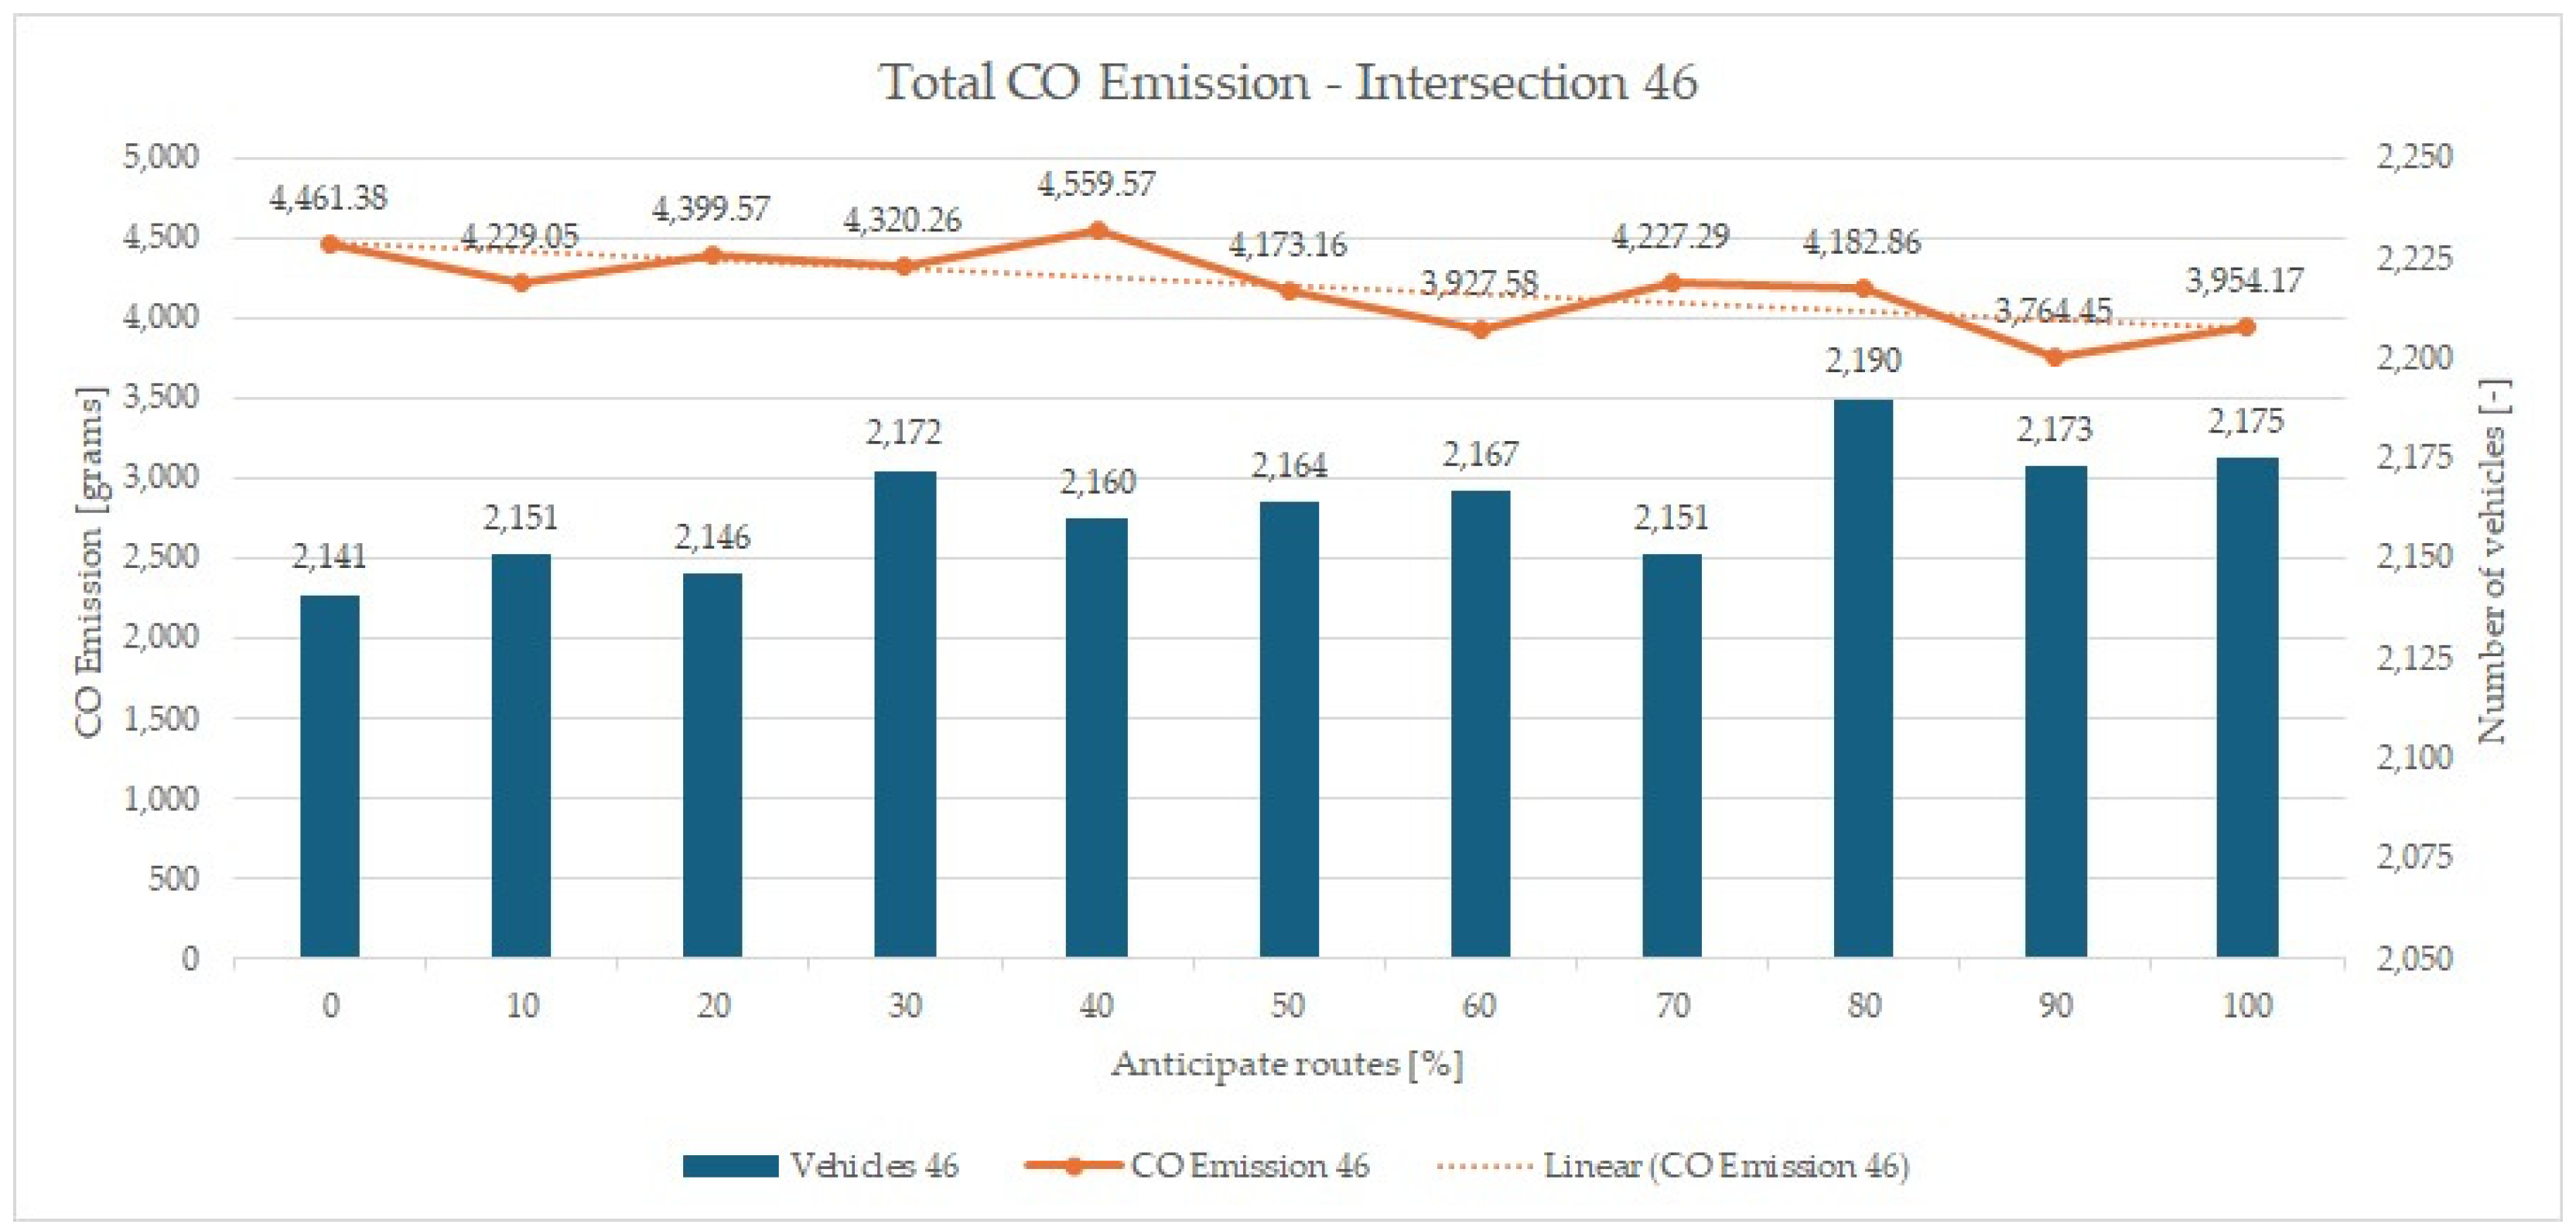
At Intersection 46, the total number of vehicles at the measurement control points ranges from a minimum of 2141 to a maximum of 2190 vehicles, resulting in a difference of nearly 50 vehicles per hour. Similarly, the total CO emissions fluctuate within a range of 3764 g (minimum) to 4559 g (maximum). CO emission results are directly related to traffic intensity. Therefore, such a comparative analysis is presented in
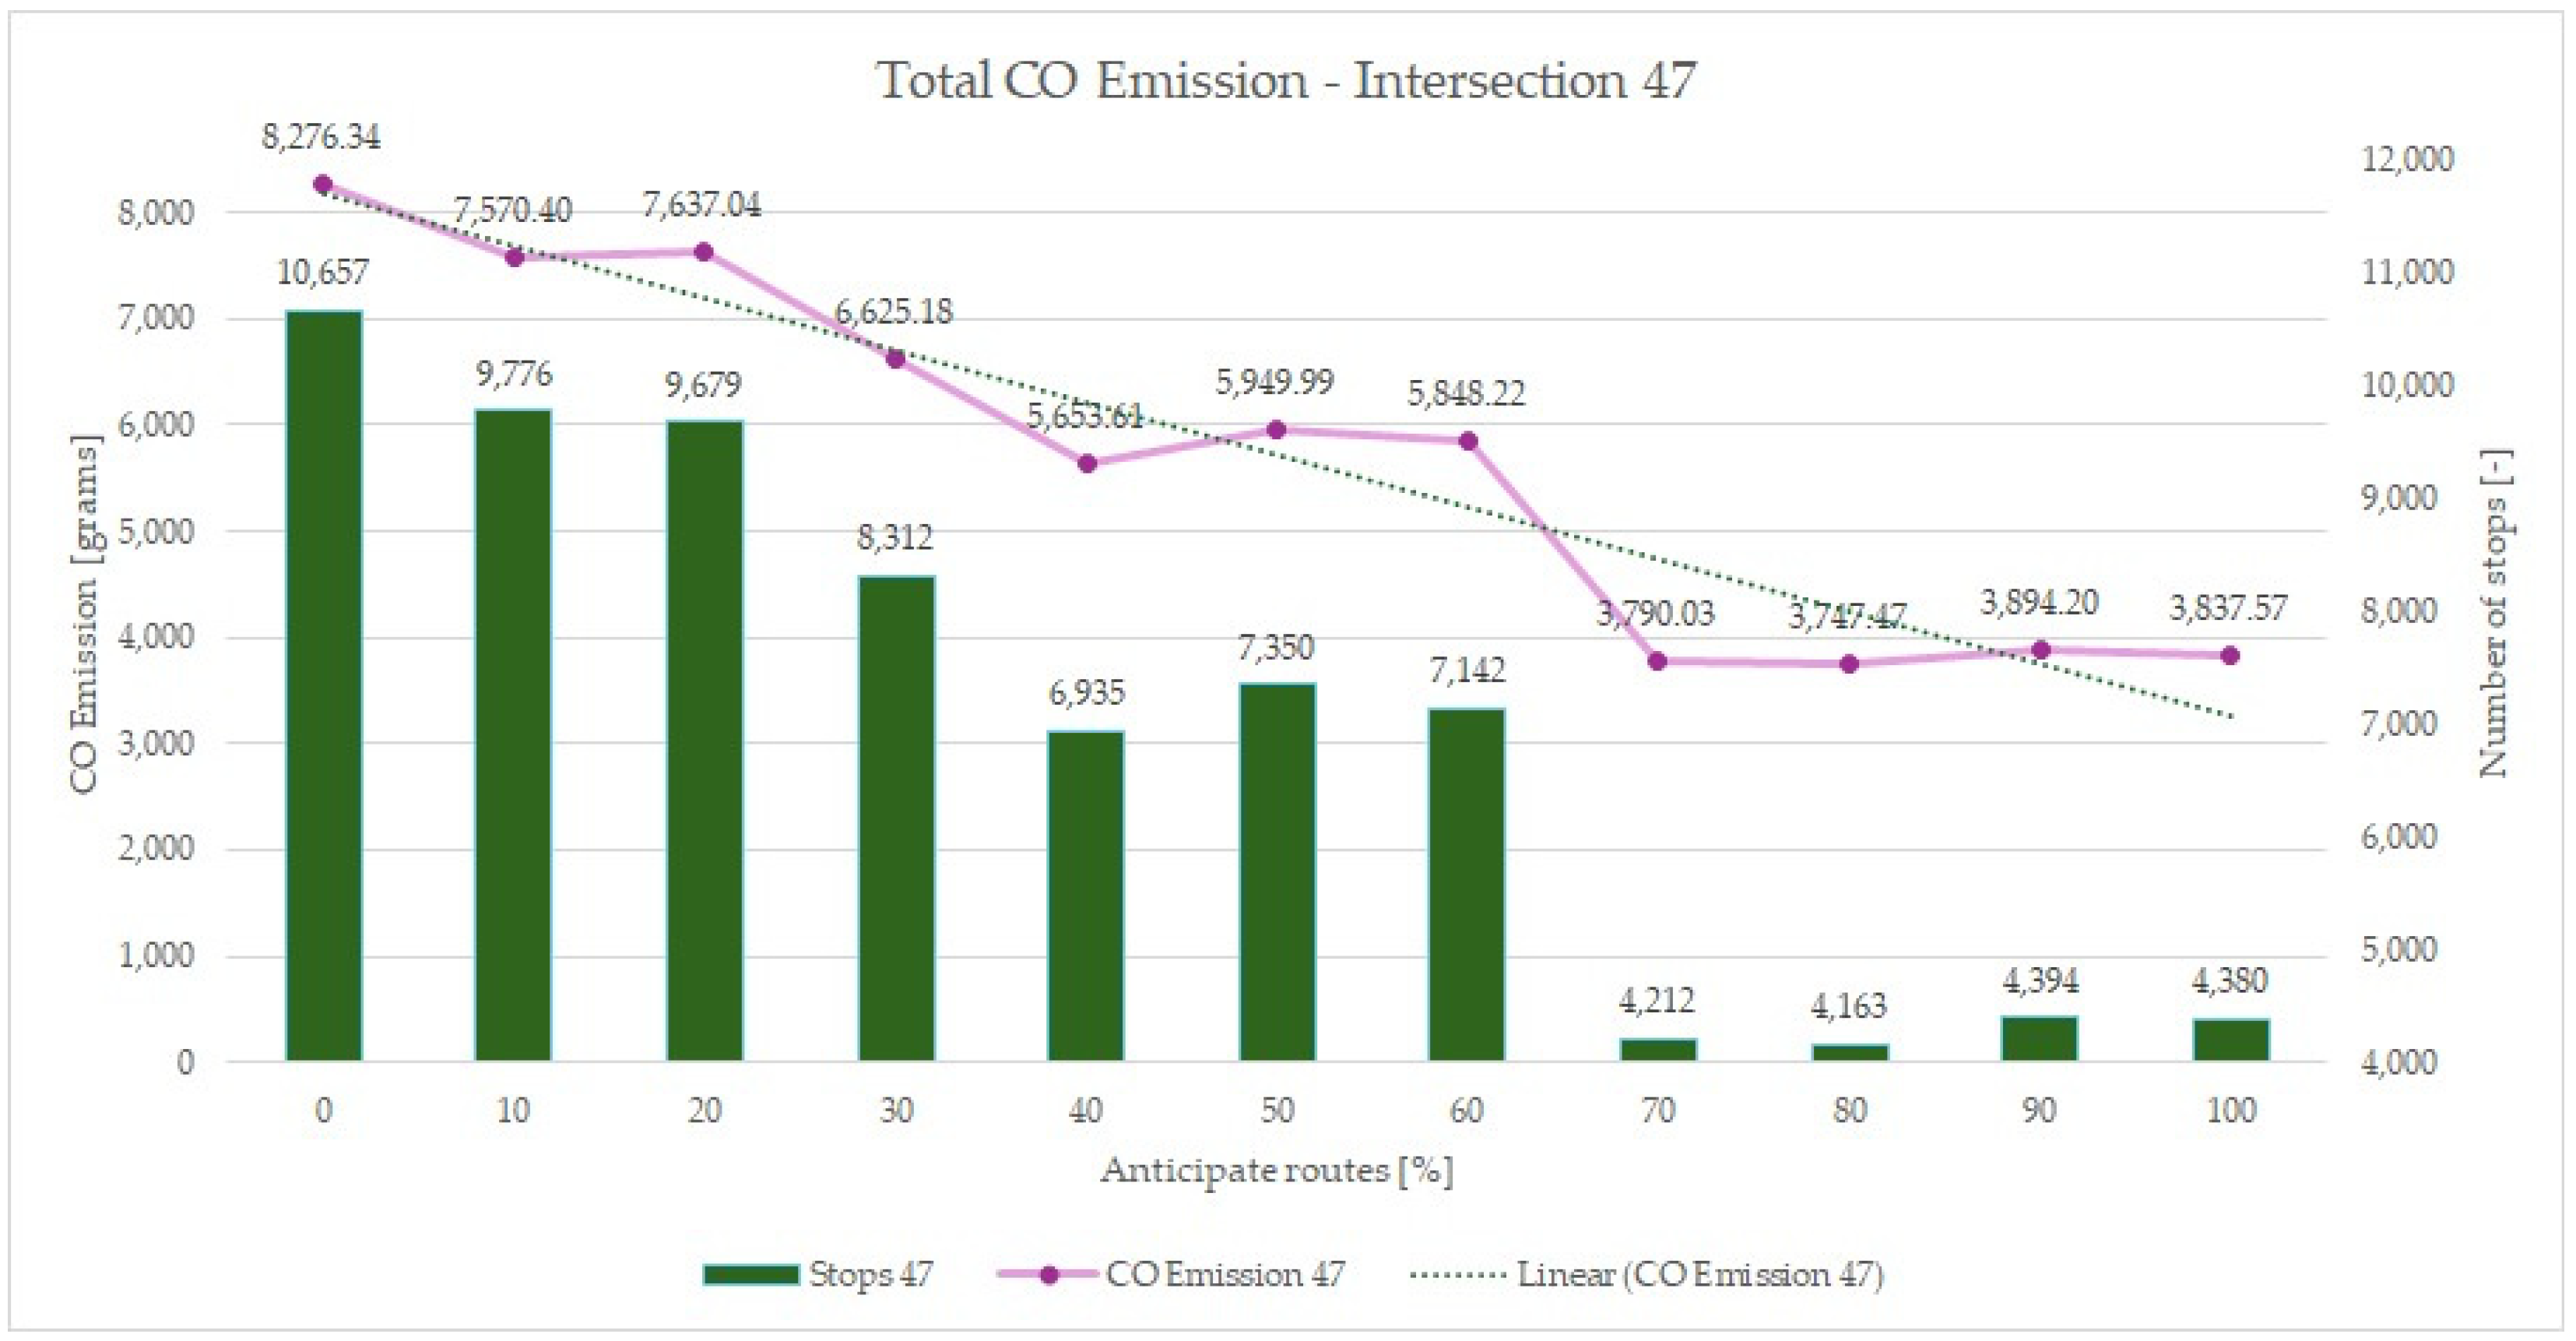
Figure 4. At Intersection 47, the discrepancies in the results are even more pronounced. The total number of vehicles at the measurement control points ranges from a minimum of 2568 to a maximum of 2625 vehicles, leading to a difference of 57 vehicles per hour. Similarly, the total CO emissions range from a minimum of 3747 g to a maximum of 8276 g. As with Intersection 46, at Intersection 47, the results show a decreasing trend with each subsequent scenario (
Figure 5).
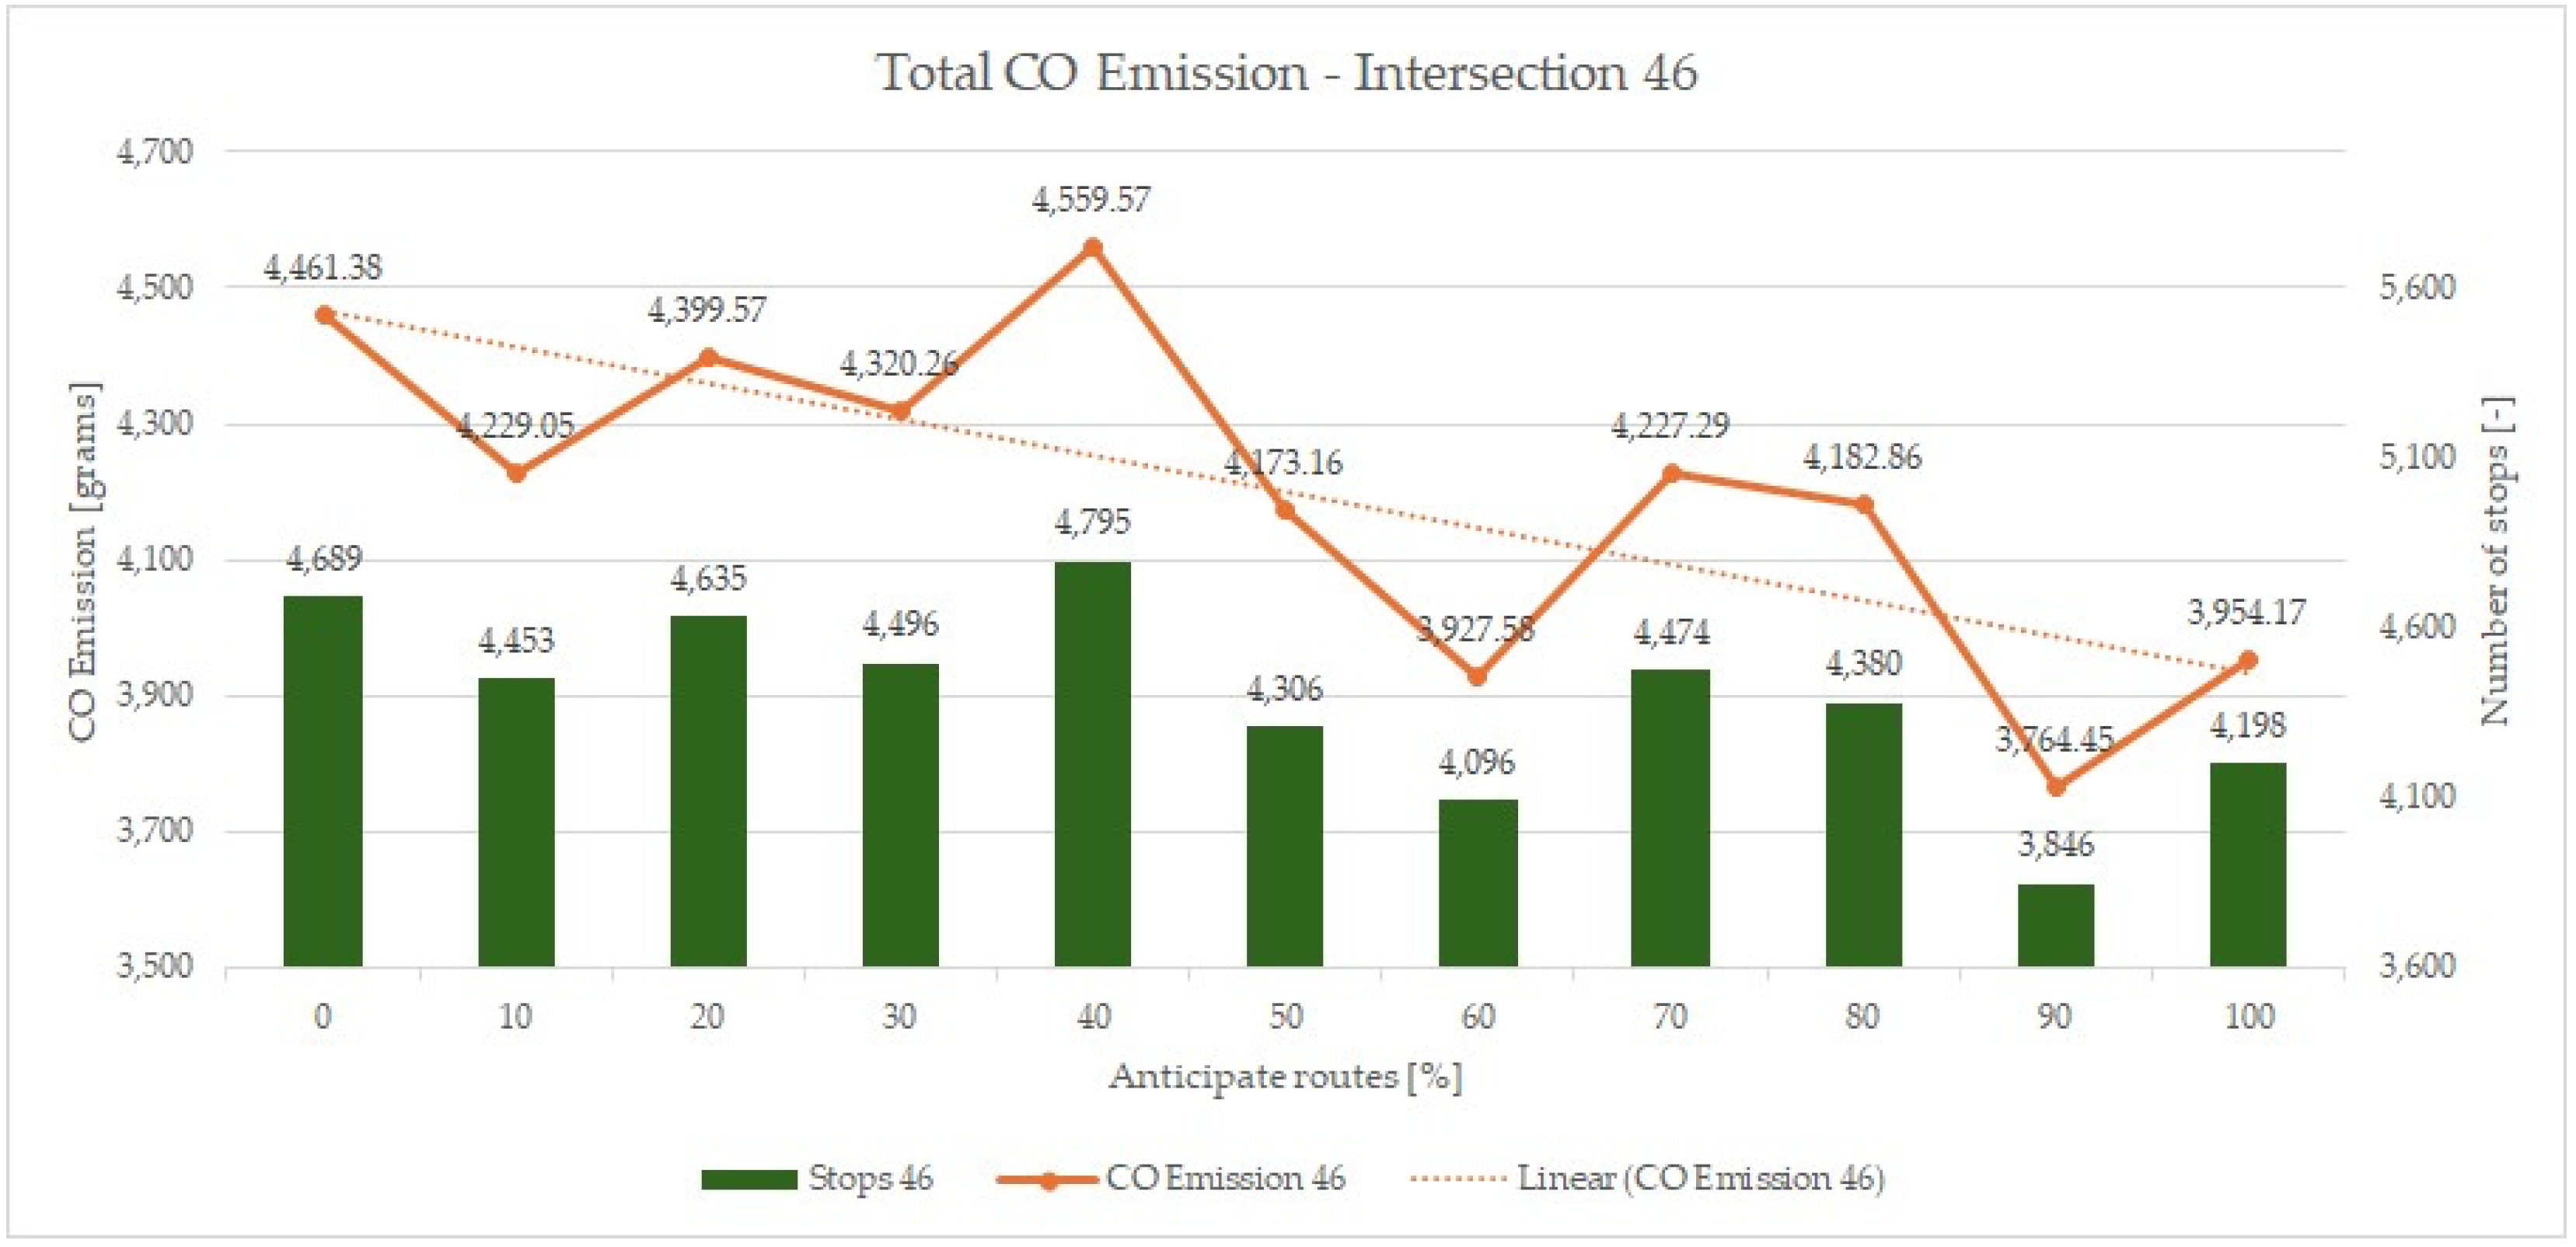
Since the comparative results of the number of vehicles and CO emissions were not conclusive, the microsimulation model also analyzed the total number of vehicle stops at the studied roundabouts. This indicator, along with the number of vehicles identified in the previous study, revealed that at Intersection 46, the difference between the highest and lowest number of stops was nearly 950 (
Figure 6). On the other hand, for Junction 47, these differences were much more pronounced and began to drastically decrease only when the share of vehicles in the Anticipate Routes indicator reached 80%. The difference between the highest and lowest number of stops at this junction was almost 6500 (
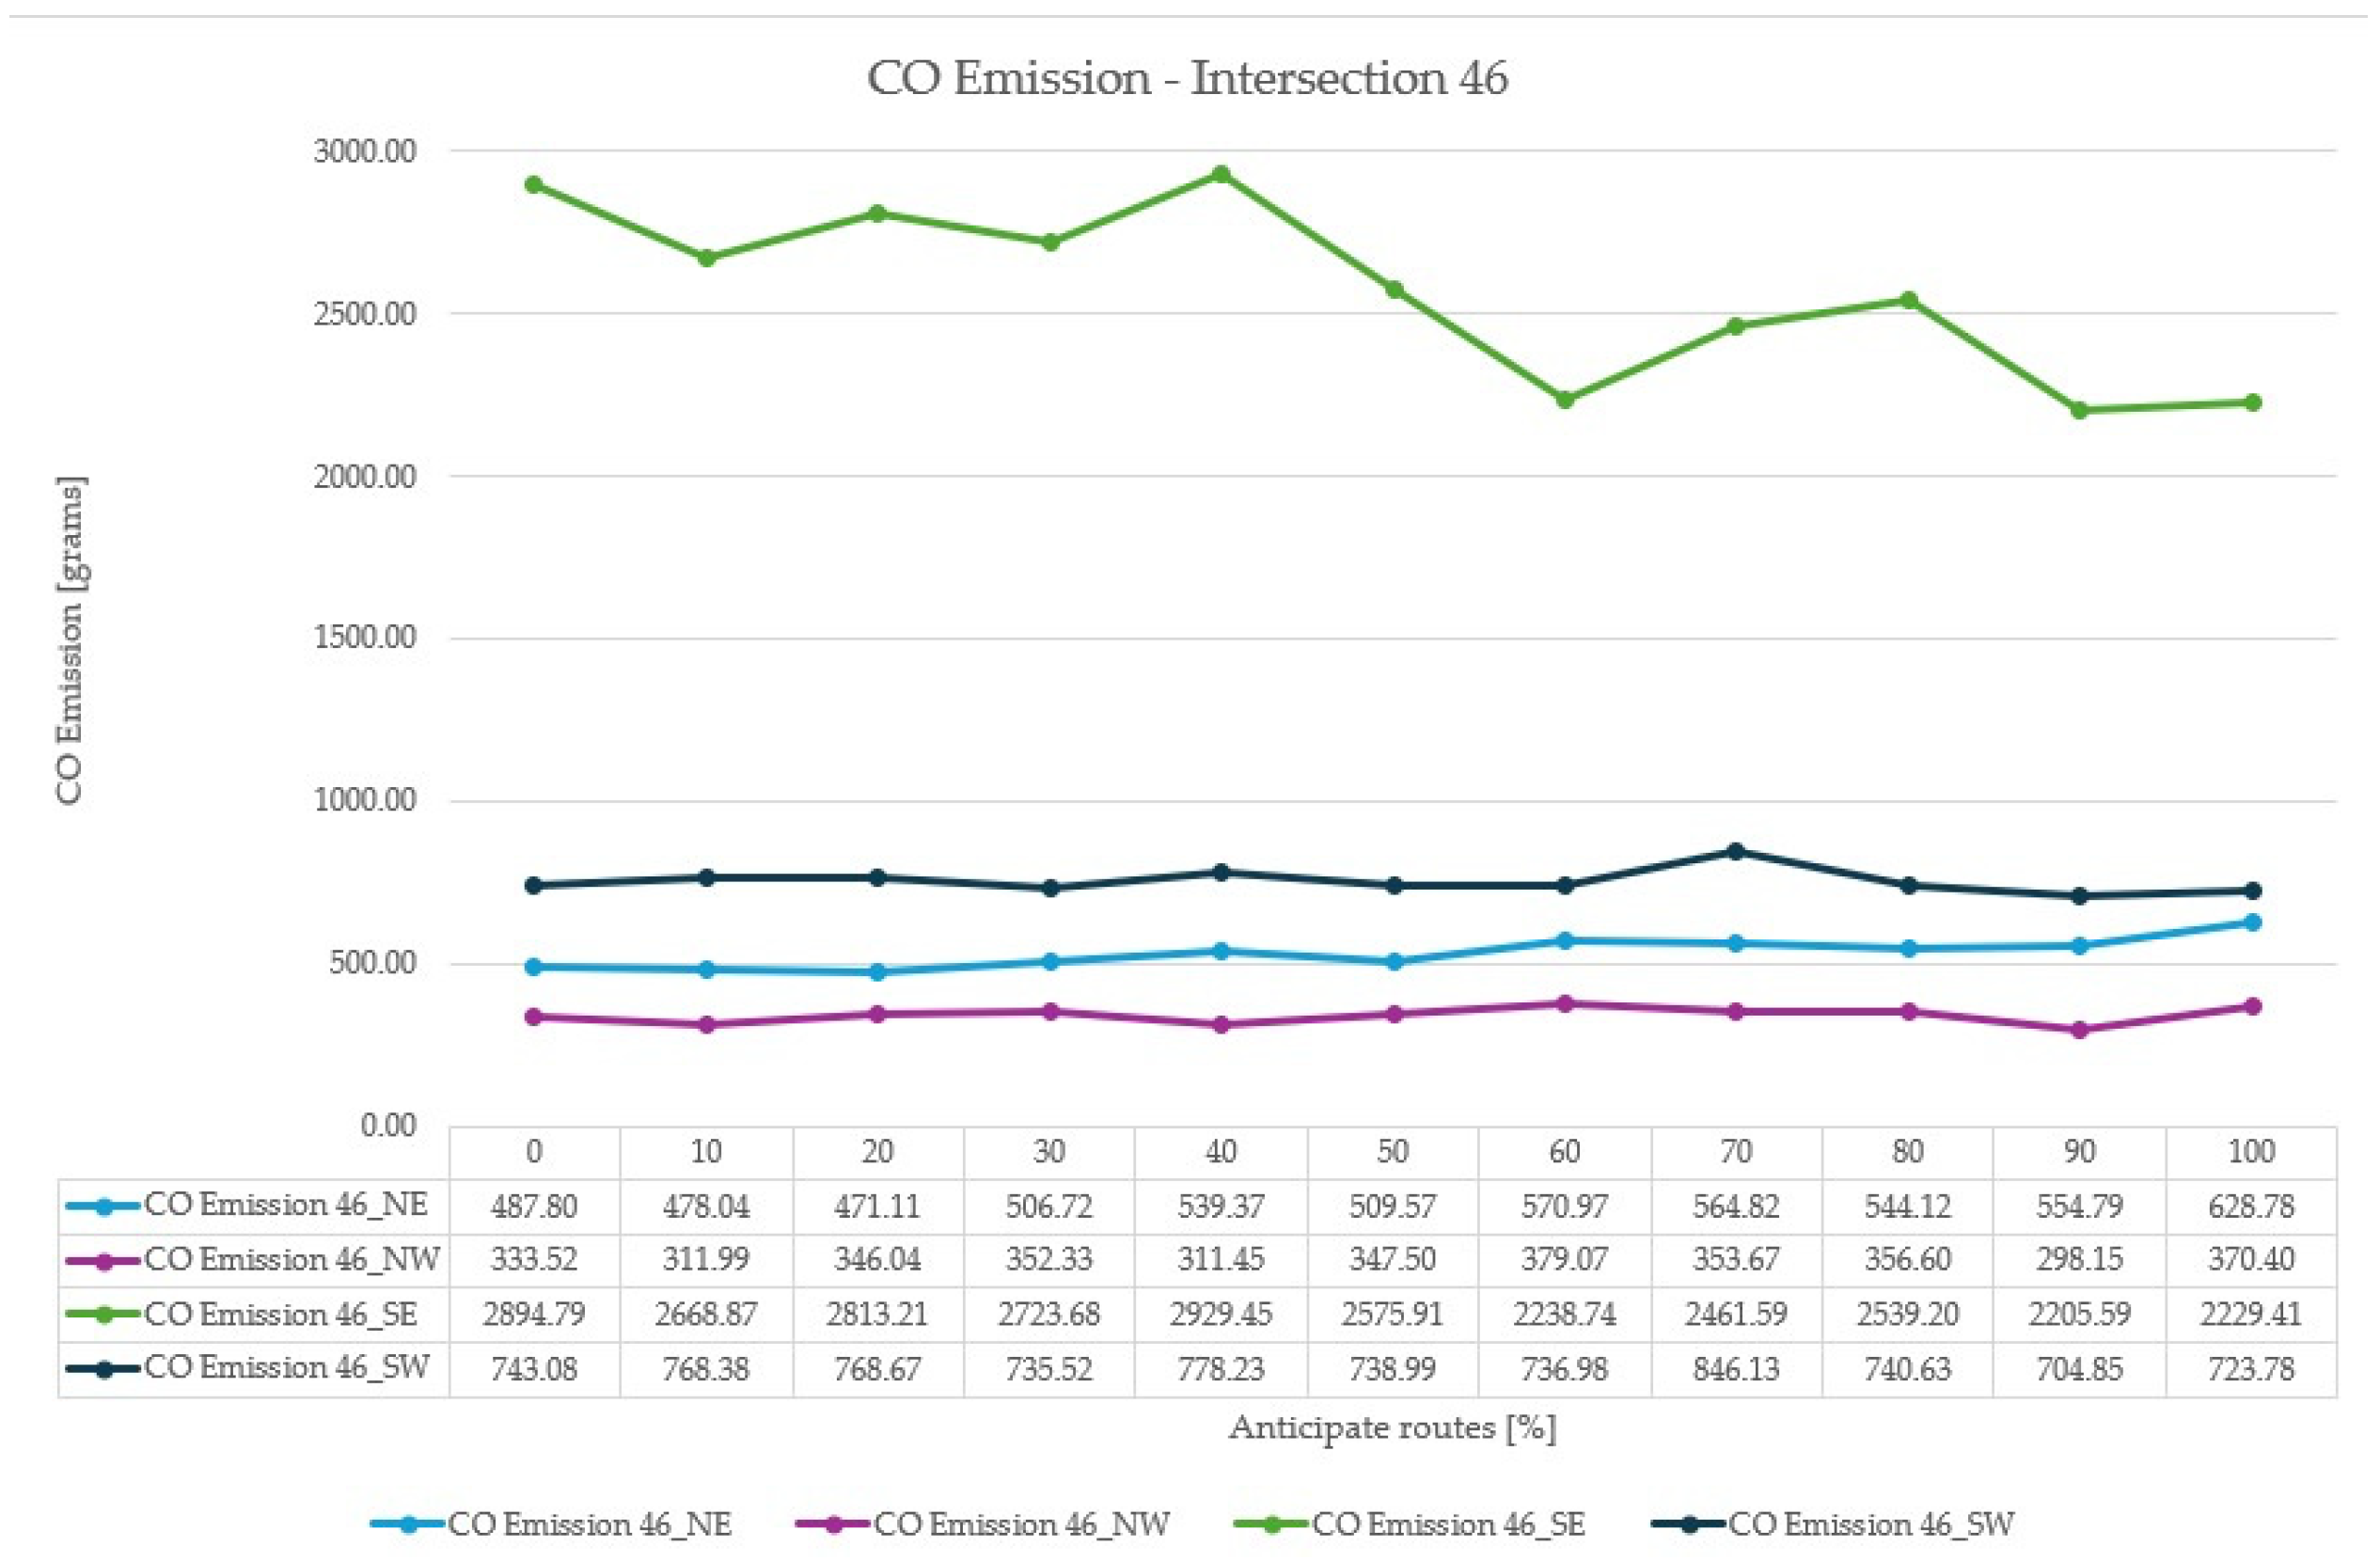
Figure 7). Further detailed analysis in the microsimulation model was also conducted with a breakdown by individual entries. Since the entries to the roundabouts significantly differed in terms of both geometry and traffic intensity during the morning peak hours, the CO emissions at these entries also varied considerably.
Factors such as traffic volume, the share of turning movements, and the influence of other entries and their turning movements also contribute to these results. The entry to a roundabout is not independent in itself, as is the case with traffic signals and directional signals. When comparing the entries at Intersection 46, it is evident that only the SE entry is dominant, and it is primarily responsible for the majority of CO emissions at this studied roundabout (
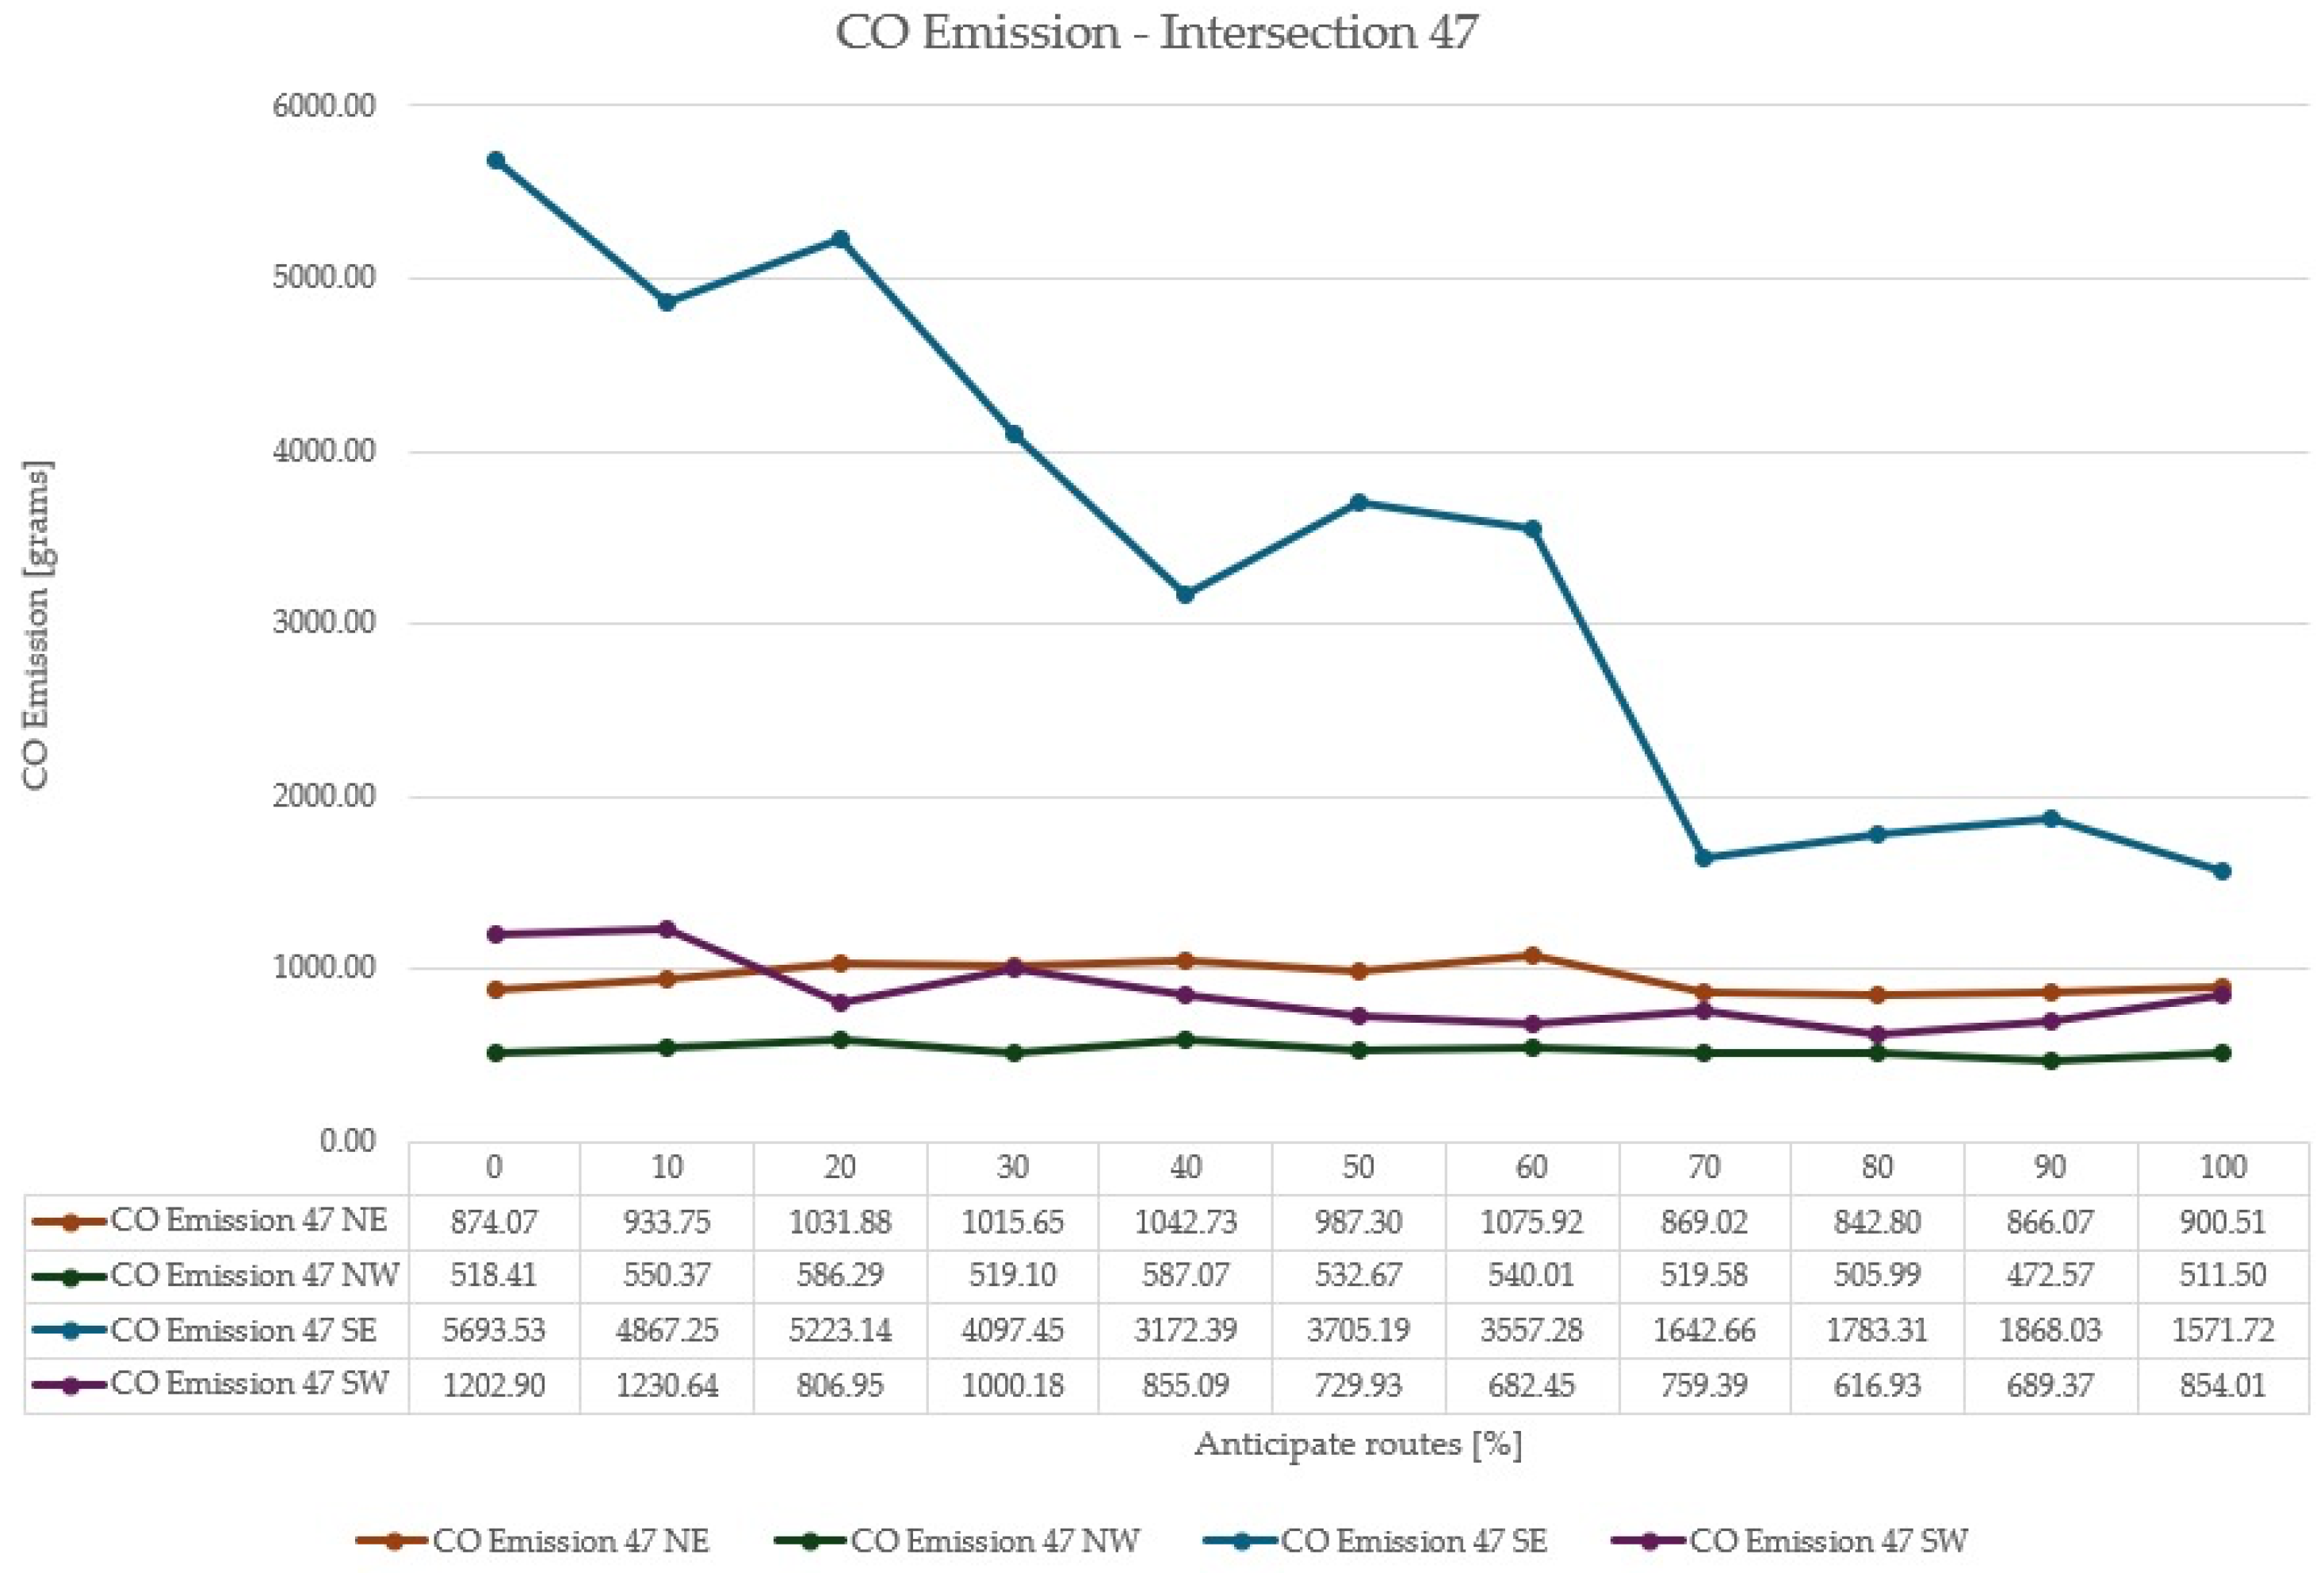
Figure 8). A similar situation occurs at Intersection 47, where the SE entry also has the greatest impact on the emission of pollutants. Additionally, at this entry, it is observable that as the number of drivers using turn signals increases, the emission of pollutants related to individual transportation decreases (
Figure 9).
The results are directly correlated with the traffic volume and directional structure at the roundabout. It is well established that vehicles intending to exit to the right from their entry point spend the least time on the roundabout, as they have the shortest distance to cover. These vehicles also have the least impact on other directions and entry points. In scenarios such as the one analyzed in this study, where the highest traffic volume occurs at the SE entry point and the majority of vehicles make a left turn, this significantly influences all measured traffic parameters. In a microscopic simulation model, where the research methodology is based on the follow-the-leader approach, these factors are of critical importance. In cases similar to the one presented, it is not feasible to expect linear increases or decreases in the results due to the numerous variables present in the modeled road network. The findings highlight the significance of considering the percentage of drivers using turn signals when studying CO emissions.
4. Conclusions
The presented study illustrates how a seemingly simple issue, such as the use of turn signals when exiting a roundabout, can significantly affect traffic flow, and consequently the environmental pollution associated with vehicle emissions. The use of turn signals plays a crucial role in facilitating smooth traffic movement by improving communication between road users, reducing uncertainty, and preventing abrupt maneuvers. As a result, this leads to more efficient traffic circulation, reducing congestion and the need for sudden acceleration or braking, which in turn decreases fuel consumption and lowers the levels of harmful exhaust emissions. The results presented reveal a clear correlation: when more than 30% of drivers cease to use their turn signals while exiting a roundabout, particularly when combined with an entry point experiencing the highest traffic volume, there is a significant impact on emissions and air pollution. This study shows that this behavior leads to an increase in the average number of stops, which in turn raises fuel consumption. With each additional percentage of drivers failing to comply with the regulations in this scenario, the conditions worsen further, amplifying the negative effects on both traffic flow and environmental pollution. The results available in the work refer to those in which the speed of vehicles with the parameters of the infrastructure itself was tested [
26]. A similar convergence of results can also be seen in [
27], where the authors wrote “emission data obtained by crossing the roundabout, it can be noticed an increased emission of harmful exhaust components, at the moment of acceleration at entries, and the driving around the island, as well as at the exit points, wherein particular the highest CO
2 emission occurs”. The next similarity in results can be found in publication [
28], where authors measured quantities of traffic and emission impacts of single-lane roundabouts in urban corridors.
The most unlikely scenario, where no one adheres to traffic regulations, is unlikely to ever occur in reality. However, it serves as a reference point for comparing the remaining measurement data. By considering this extreme case, it becomes possible to better understand the impact of varying degrees of non-compliance with traffic laws on traffic flow, fuel consumption, and environmental factors.
The presented microsimulation study highlights another crucial relationship. Specifically, it suggests that future general measurement studies should consider incorporating the tracking of drivers who fail to use their turn signals. Due to significant variations in vehicle flow within the network during peak traffic periods (in this case, the morning rush), it becomes apparent how this factor influences the measured data. A well-calibrated and validated model is essential to obtain reliable and meaningful simulation results. Such an approach ensures that the data reflect real-world conditions more accurately, allowing for better insights into the impacts of driver behavior on traffic flow and environmental factors. This underscores the importance of incorporating behavioral elements, such as the use of turn signals, into traffic simulation models to enhance the quality and applicability of the results. The presented study also demonstrates the validity of implementing public awareness campaigns highlighting the negative consequences of failing to use turn signals when exiting a roundabout. Such campaigns would help to inform drivers about how this simple yet crucial action can significantly improve traffic flow, reduce fuel consumption, and lower emissions. By addressing the behavioral aspects of road safety, these campaigns could contribute to safer, more efficient driving practices, ultimately benefiting both traffic efficiency and environmental sustainability.
Further research in this area is needed to be able to enter the comparison page of the capabilities of the PTV Vissim software for determining priority using priority rules, where without the use of additional external programmable parameters, it is not possible to adjust the number of drivers complying with the use of the turn signal compared to the method used in this article.


