Article

Research on Fault Feature Extraction Method for Hydroelectric Generating Unit Based on Improved FMD and CDEI

1
China Yangtze Power Co., Ltd., Yichang 443000, China
2
School of Power and Mechanical Engineering, Wuhan University, Wuhan 430072, China
*
Authors to whom correspondence should be addressed.
Energies 2024, 17(23), 6134; https://doi.org/10.3390/en17236134
Submission received: 12 October 2024 / Revised: 22 November 2024 / Accepted: 29 November 2024 / Published: 5 December 2024

Abstract

:
As core pieces of equipment in hydropower generation, the operational condition of critical components such as the rotor and thrust bearing is crucial for the stability of hydropower units. The essence of fault diagnosis for hydroelectric generating units is pattern recognition. To achieve high recognition accuracy, it is necessary to maximize the distinguishability of different fault features. However, traditional time–frequency signal processing methods seldom consider this issue during the decomposition process, resulting in low sensitivity of the extracted features to different fault types. To address this issue, this paper proposes a fault feature extraction method for hydroelectric generating units based on Feature Modal Decomposition (FMD) and the Comprehensive Distance Evaluation Index (CDEI). By improving the FMD algorithm, the objective function for selecting modal components during the FMD decomposition process is set as the CDEI, which can measure the sensitivity of fault features, thereby enhancing the distinguishability of the obtained fault features. Next, the Distance Evaluation Index (DEI) is used to measure the sensitivity of the obtained features, and the most sensitive features are selected. Experiments using a rotor test bench and actual signals before and after thrust bearing horizontal adjustment from a hydroelectric generating unit were conducted and compared with related methods. The results show that the proposed method can effectively improve the sensitivity of the obtained fault features and achieve accurate fault diagnosis for hydroelectric generating units.

1. Introduction

As the core equipment in hydropower generation, the operating status of the rotor and thrust bearing of hydropower units has a significant impact on the stable operation of power grids and hydropower stations [1,2,3]. However, with the increase in unit capacity in recent years, as well as the improvement in equipment integration, automation, and intelligence levels, the complexity of units has also escalated, leading to a higher probability of malfunctions and more severe consequences of these failures. Therefore, researching efficient methods for extracting fault features of units and enhancing the accuracy of fault identification are of great significance for promptly taking measures to reduce unit damage and ensure the safe operation of power grids and hydropower stations.
Vibration signals are often the preferred choice for fault diagnosis in hydropower units due to their rich fault information content [4]. The methods for extracting features from vibration signals primarily encompass time-domain, frequency-domain, and time–frequency-domain approaches. Time-domain analysis primarily employs statistical methods to process the time series of vibration signals. Frequency-domain analysis, utilizing Fourier transform, reveals hidden frequency characteristics, but both methods struggle to simultaneously capture complex local information in both time and frequency domains. Time–frequency analysis methods have overcome these limitations and become the mainstream approaches for signal analysis, including Short-Time Fourier Transform (STFT) [5], Wavelet Transform (WT) [6], Empirical Mode Decomposition (EMD) [7], and Variational Mode Decomposition (VMD) [8]. STFT, by introducing a sliding window into the traditional Fourier transform, enables the simultaneous analysis of signal information in both time and frequency domains. However, its fixed window function characteristic prevents it from achieving both high temporal and high frequency resolutions simultaneously. WT, with its variable window size, can effectively analyze the time–frequency characteristics of non-stationary and nonlinear signals, but the selection of its basic functions is often based on experience, limiting its adaptive decomposition capability for signals. EMD, through iterative decomposition, obtains modal components that reflect the time-varying behavior of different frequency bands within the signal. However, issues such as endpoint effects and mode mixing often adversely affect the signal decomposition results. VMD, on the other hand, performs adaptive orthogonal decomposition of signals within a variational framework, decomposing the signal into modal components with distinct center frequencies. It boasts a more solid mathematical foundation and stronger noise resistance. Nevertheless, VMD’s decomposition objective is to minimize the sum of bandwidths across the frequency bands of each center frequency, without explicitly considering enhancing the fault information content of the extracted features.
To maximize the fault information in features, Miao et al. [9] proposed Feature Mode Decomposition (FMD) in 2023. This method considers that Correlated Kurtosis (CK) can measure the content of periodic impulse components in signals. By maximizing CK as the optimization objective, it seeks an optimal Finite Impulse Response (FIR) filter bank to decompose the signal into modal components across multiple frequency bands, thereby enabling the more accurate extraction of fault features. This approach has garnered widespread attention [10,11,12]. However, while this method effectively identifies faults in equipment such as rolling bearings, in which vibration signals tend to exhibit periodic impulse components during faults, for hydropower units, many faults do not manifest obvious periodic impulse components, making it challenging to achieve ideal results in fault diagnosis for hydropower units. Additionally, the FMD method, which optimizes for maximum CK, does not consider enhancing the sensitivity of the extracted fault features, resulting in poor ability to distinguish between different faults.
The time series data derived from decomposition methods typically necessitate feature extraction to discern distinct fault characteristics. Nevertheless, with the multitude of extractable features currently available, it is crucial to discern which are most sensitive to various faults. Several studies have emphasized the importance of information screening prior to the diagnostic process. For instance, the authors of [13] employed the correlation analysis method to screen sensor signals and applied it to diagnose water wall tube leakage in the boilers of steam power plants. The authors of [14] conducted an optimal sensor selection utilizing various feature selection techniques, such as correlation analysis, mRMR, and the extra-tree classifier, for fault identification in the boilers and turbines of thermal power plants. Meanwhile, the authors of [15] achieved satisfactory results in screening the fault features of rotating machinery by utilizing the Comprehensive Distance Evaluation Index (CDEI).
Based on the above analysis, this paper proposes a fault feature extraction method for hydropower units that combines an improved FMD with the CDEI [15]. In this method, the CDEI serves as the objective function for optimizing the filter bank and the modal selection criterion in the FMD algorithm, enhancing the overall fault discrimination ability of the resulting modal components. Furthermore, the characteristic parameters of the extracted components are utilized, and the Distance Evaluation Index (DEI) is employed to select sensitive parameters, ultimately yielding highly sensitive fault features for fault identification. The proposed method is validated using data from a rotor testbed and field-collected data from hydropower units. The results indicate that compared to the original FMD method, the proposed approach can extract more sensitive fault features and improve the fault identification rate.

2. Research Method

2.1. FMD Method

Compared to methods such as EMD and VMD, FMD has garnered attention from scholars due to its pioneering consideration of highlighting fault features such as periodic impulse components in the resulting modal components. The main steps of this method include initialization of the FIR filter bank, filter updating, and modal component selection. The specific process is as follows:
(1) Set the relevant parameters for FMD, including the number of decomposition modes, the filter length, the maximum number of iterations, the number of filter frequency bands, and the number of frequency band divisions K. Initialize the iteration count i = 1.
(2) Initialize FIR filters using a Hanning window, and uniformly divide the frequency band of the original signal into K segments. The cut-off frequency for the f k th frequency band is calculated as [16]:
f l = k × f s 2 K f u = k + 1 × f s 2 K ,
In the formula, f s is the sampling frequency of the original signal, f l and f u are the lower and upper limits, respectively, of the frequency band, k = 0 , 1 , 2 , , K 1 .
(3) Assuming x ( n ) is the original signal with a length of N, the FIR filter is used to filter the signal x ( n ) to obtain u k i = x f k i , where denotes the convolution operator, and u k i is the k-th modal component at the i-th iteration.
(4) Using the original signal and the obtained u k i , the filter coefficients are updated, combined with Equation (2),
arg max f k ( l ) C K M u k = n = 1 N m = 0 M u k n m T s 2 n = 1 N u k ( n ) 2 M + 1 s . t .   u k ( n ) = l = 1 L f k ( l ) x ( n l + 1 ) ,
where T s represents the input periodic parameter, M denotes the shift order, and CK is the correlation kurtosis.
(5) Judge whether the iteration count i has reached the maximum value I. If it has, proceed to step (6); otherwise, return to step (3) to continue the loop.
(6) Calculate the correlation coefficient CC between each pair of the obtained modal components and construct a matrix C C ( K × K ) based on the obtained correlation coefficients. Select the two modal components corresponding to the maximum correlation coefficient from the matrix, and calculate their correlation kurtosis CK. Choose the modal component with the largest CK value among the two to highlight the periodic impulse components of the obtained modal component, and let K = K 1 . The definition of the correlation coefficient between modal components u p and u q is given by Equation (3) [17].
C C p q = n = 1 N u p ( n ) u ¯ p u q ( n ) u ¯ q n = 1 N u p ( n ) u ¯ p 2 n = 1 N u q ( n ) u ¯ q 2 ,
where u ¯ p and u ¯ q represent the mean values of modal components, u p and u q , respectively.
(7) Judge whether the number of obtained modal components n has reached the set number of modal components K. If not, proceed to step (3); otherwise, output the obtained n modal components.

2.2. Introduction to CDEI

To measure the sensitivity of fault characteristics in hydropower units, an index that quantifies the distance between different fault categories is required. Generally, the larger the sample distance between different faults corresponding to unit characteristics, the better the inter-class dispersion; the smaller the sample distance between the same faults, the better the intra-class aggregation, indicating that the fault characteristic has better fault sensitivity. To this end, [15] constructed the Distance-based Evaluation Index (DEI) using the ratio of inter-class distance to intra-class distance. A higher DEI value indicates higher sensitivity of the corresponding fault characteristic and better classification ability for faults. By utilizing DEI, feature parameters with good performance can be selected, thereby improving the accuracy of fault diagnosis while reducing the feature dimensionality and computational load.
Assuming the existence of a fault characteristic set q m , t , p , where q m , t , p represents the p-th feature value calculated using the m-th sample under the t-th unit state, T is the number of unit states, t = 1 , 2 , , T , P is the number of features, p = 1 , 2 , , P , and M t is the number of samples for the th unit state, m = 1 , 2 , , M t , then the calculation process for DEI is as follows:
(1) Calculate the average distance of fault characteristics between different samples:
d t , p = 1 M t M t 1 l , m = 1 M t q m , t , p q l , t , p ,
where l , m = 1 , 2 , , M t , l m .
(2) Calculate the mean value of d t , p across all equipment states:
d p w = 1 T t = 1 T d t , p ,
(3) Calculate the variation factor of d p w :
v p w = max d t , p min d t , p ,
(4) Obtain the mean value of each feature corresponding to all samples under each unit’s state:
d t , p = 1 M t m = 1 M t q m , t , p ,
and calculate the mean distance of this value between different unit states for all unit states:
d p b = 1 T T 1 s , t = 1 T u t , p u s , p ,
where s t .
(5) Define and calculate the variation factor of d p b
v p v = max u t , p u s , p min u t , p u s , p ,
where s t .
(6) Calculate the compensation factor as follows:
λ p = 1 v p w max v p w + v p b max v p b ,
(7) Calculate the DEI as follows:
α p = λ p d p b d p w ,
where d p b denotes the inter-class distance of samples corresponding to different unit states for the p-th feature, and d p w denotes the intra-class distance between samples within the same unit state for the p-th feature. Thus, DEI represents the ratio of inter-class distance to intra-class distance. The higher the DEI, the better the sensitivity of the corresponding fault feature.
To measure the overall sensitivity of the fault feature set, the DEIs of all features are summed in this paper to obtain CDEI, which is defined as
β = p = 1 P α p ,
CDEI can be used to evaluate the overall sensitivity of the fault feature set obtained from the decomposed feature modes in this paper, and thus serves as a criterion for selecting optimal fault feature sets.

2.3. Fault Feature Extraction Method for Hydroelectric Generating Units Based on Improved FMD and CDEI

The original FMD method aims to maximize CK when screening modal components, with the purpose of highlighting periodic impulse fault components in the signal. However, this may not necessarily yield good results for fault diagnosis of rotor equipment such as hydroelectric generating units. To obtain better modal components and improve the sensitivity of fault features in hydroelectric generating units, this paper improves the FMD method by utilizing CDEI as a criterion for modal screening. Furthermore, a fault feature extraction method for hydroelectric generating units based on improved FMD and CDEI is proposed. The flowchart for this method is shown in Figure 1, and the specific steps are as follows:
(1)
Set the relevant parameters for the improved FMD, including the filter length L, the maximum number of iterations I, the number of filter bands C, and the number of frequency band divisions K. Initialize the iteration count i = 1.
(2)
Initialize FIR filters using a Hanning window and uniformly divide the frequency band of the original signal into segments K.
(3)
Filter the original signal x ( n ) using the FIR filters to obtain u k i = x f k i .
(4)
Use the original signal and the obtained u k i to update the filter coefficients according to Formula (2).
(5)
Check whether the iteration count i has reached the maximum value I. If so, proceed to step (6); otherwise, continue the loop by returning to step (3).
(6)
Extract P feature parameters from each of the K modal components obtained and calculate the CDEI index β k , k = 1 , 2 , , K , for each feature mode according to Formulas (4) to (12).
(7)
Select the modal component corresponding to the maximum CDEI index from the K modal components as the desired modal component for fault feature extraction.
(8)
Use DEI to evaluate the P feature parameters extracted from the optimal modal component and select the q feature parameters with the highest DEI values for output.
Figure 1. Flowchart for the fault feature extraction method for hydroelectric generating units based on improved FMD and CDEI.
Energies 17 06134 g001

3. Application Experiments

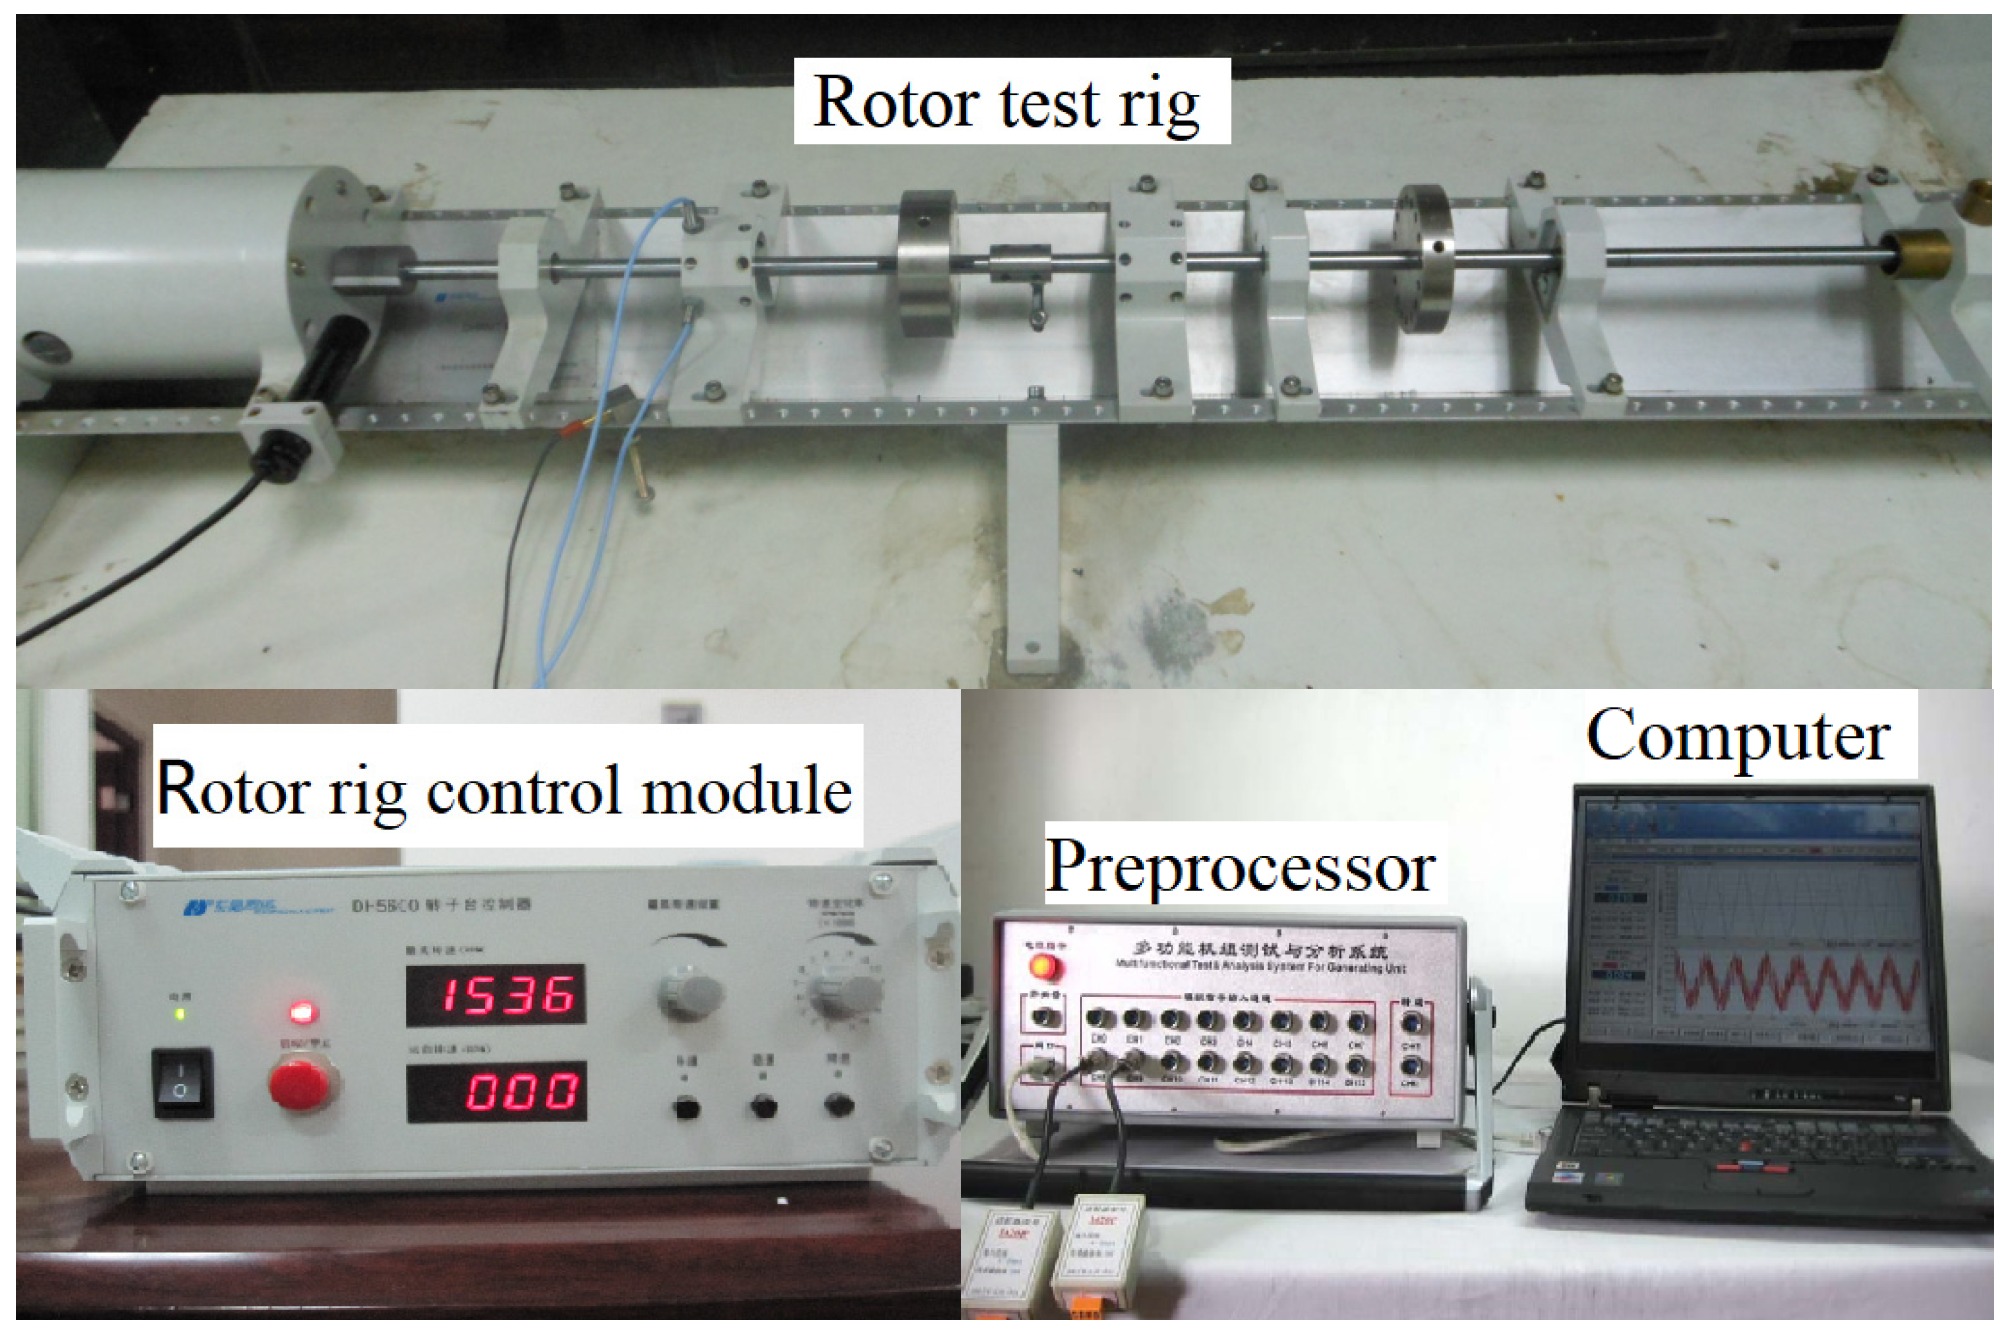
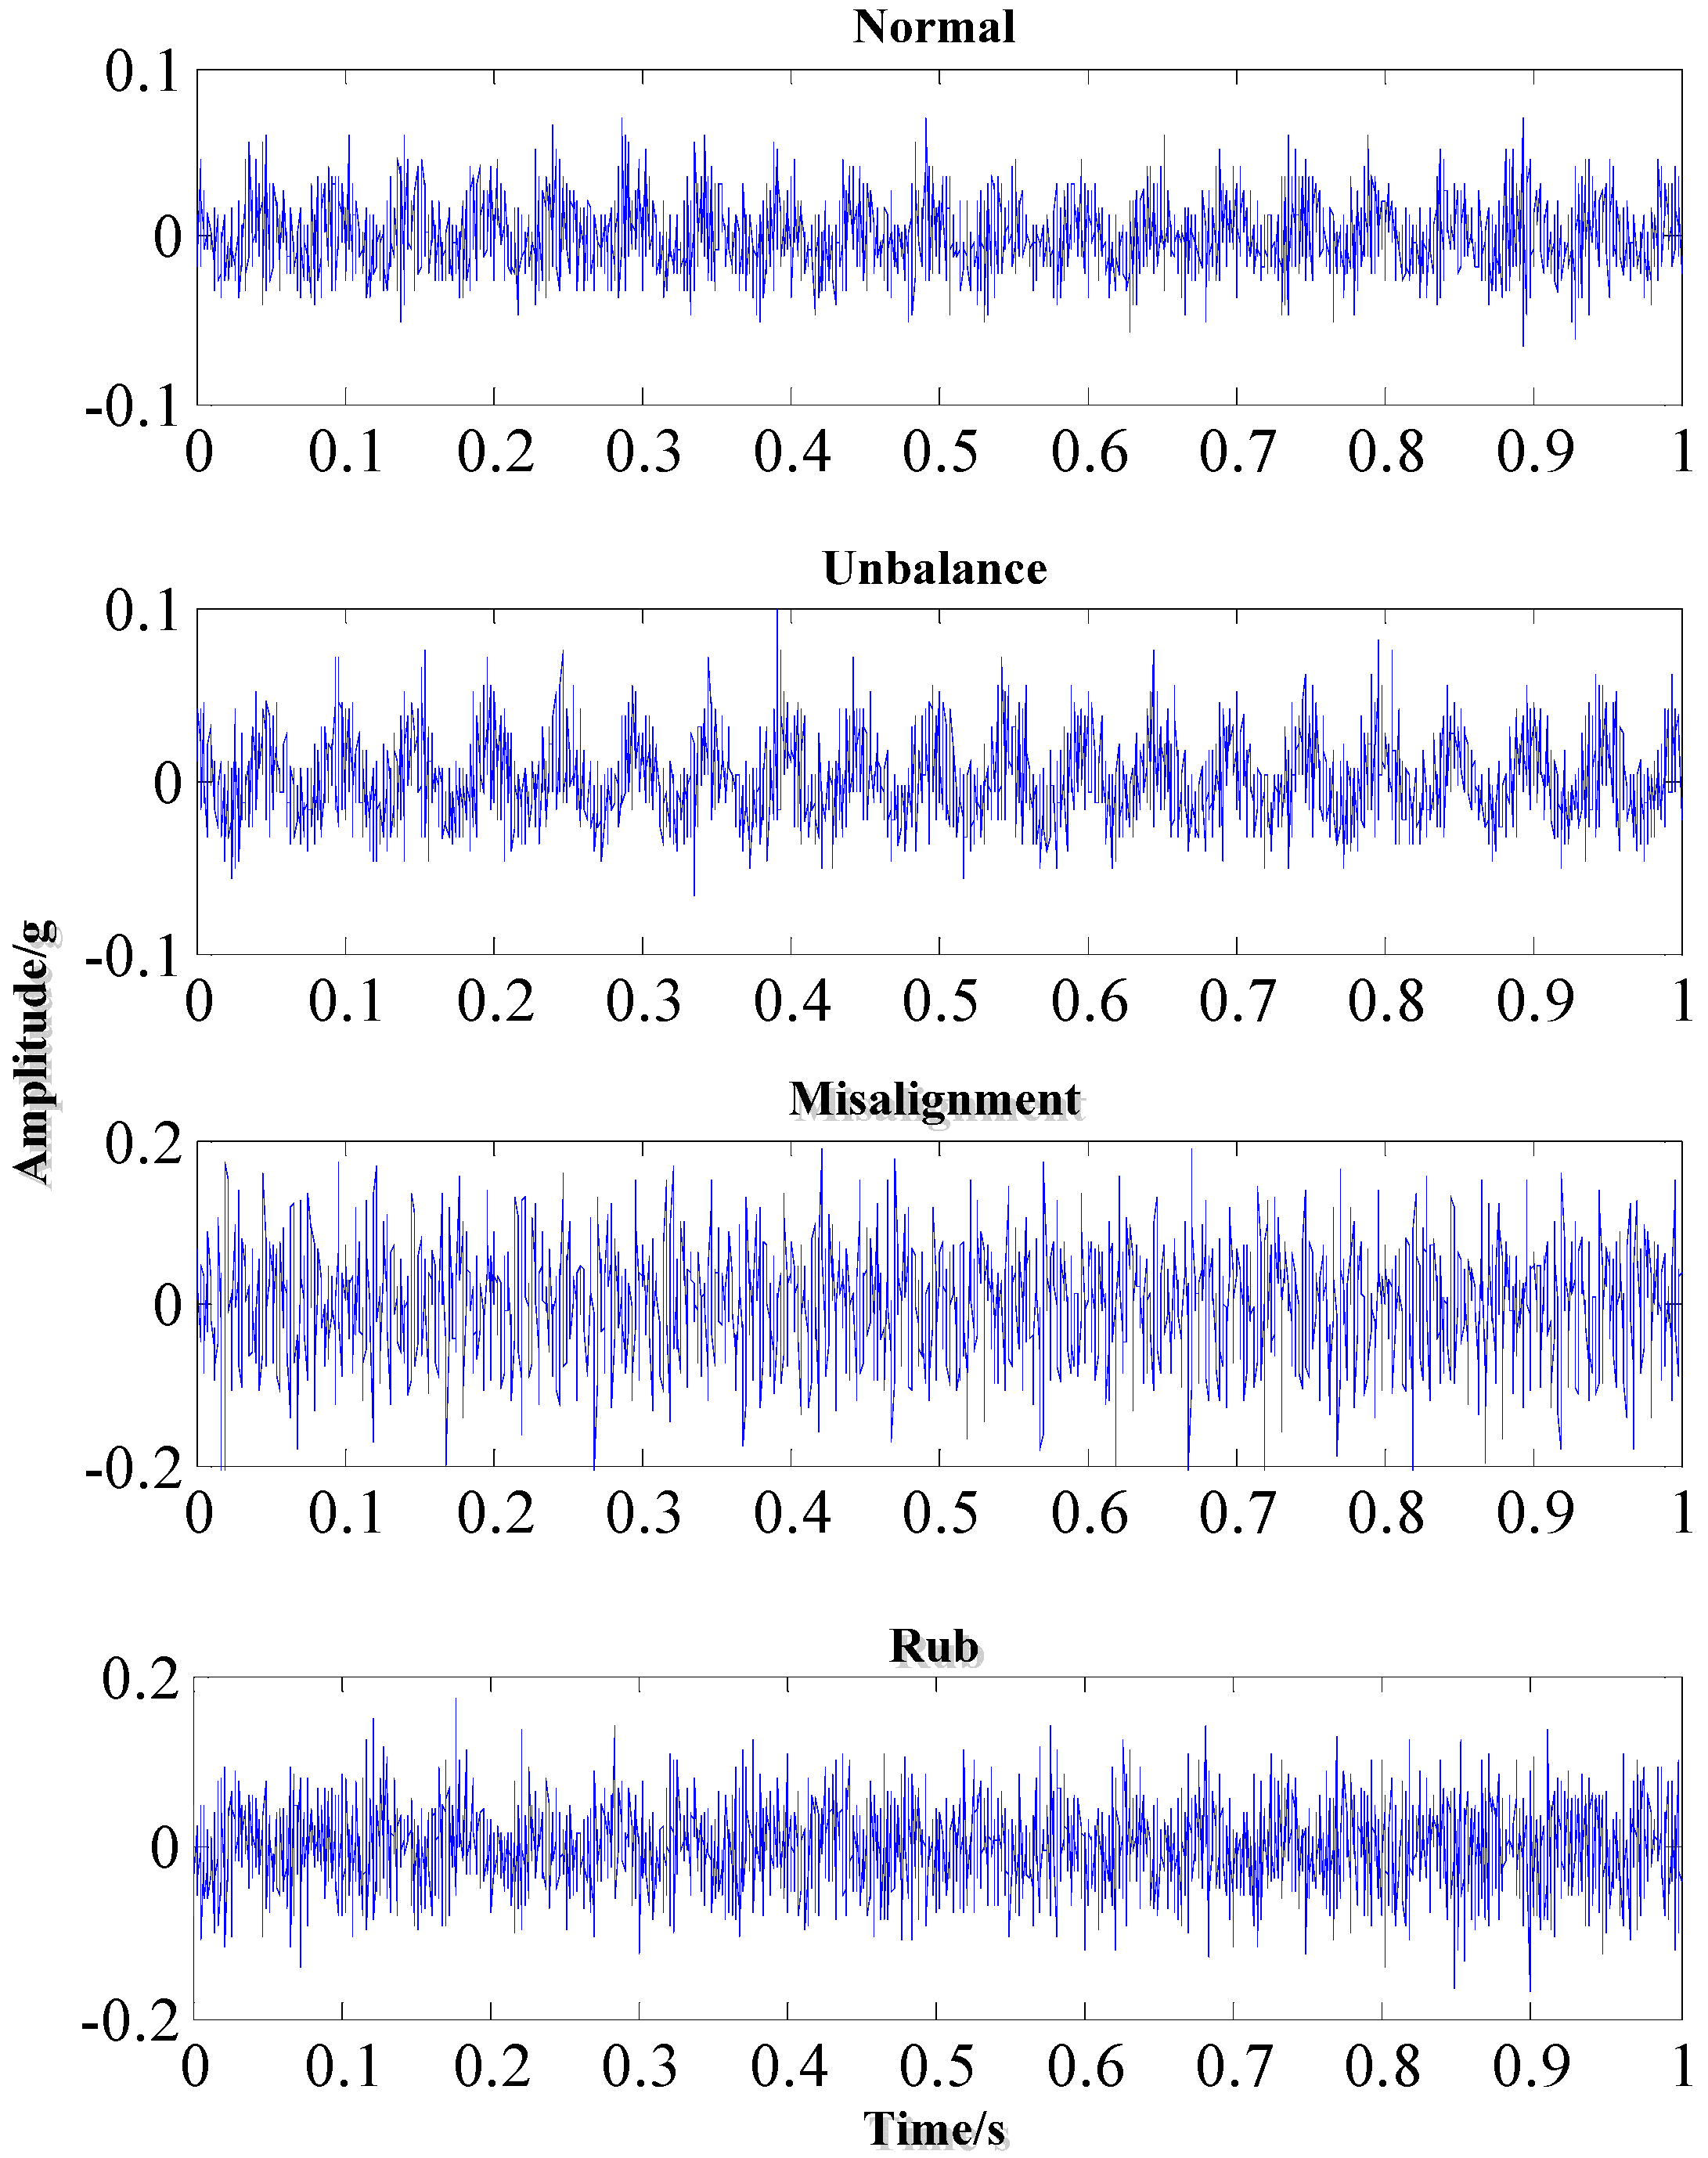
3.1. Experiment Data

To verify the effectiveness of the proposed method, this paper employs experimental data from a rotor test rig and field data from a hydroelectric generating unit.
(1)
Rotor Test Rig Data
The structure of the rotor test rig, shown in Figure 2, comprises the rotor test rig itself, a preprocessor device, a computer processing unit, and a rotor rig control module. Using this platform, vibration signals are collected from the equipment under four conditions: normal, imbalance, misalignment, and rubbing. The equipment’s rotational speed is maintained at 1200 rpm, with a sampling frequency of 2048 Hz. Twenty sets of sample data are collected for each condition, and each sample contains 2048 sampling points. Figure 3 displays a representative signal waveform diagram.
(2)
On-site Data of Hydropower Turbine Unit
The on-site data of a hydropower turbine unit originate from the operational data of a specific power station’s unit. During operation, severe vibration was observed in one of the units. Upon inspection, an imbalance fault was identified, prompting technical personnel to conduct a dynamic balancing test. Following the test, the unit operated smoothly. Therefore, this paper utilizes data collected before and after the thrust bearing balancing adjustment to validate the proposed method, with labels set as “imbalance” and “normal” states, respectively. The rotational speed of the unit is 500 rpm, and the sampling frequency is 500 Hz. A total of 36 sets of data, each consisting of 512 sample points, are used for method validation. Figure 4 illustrates the waveform of one such data set.

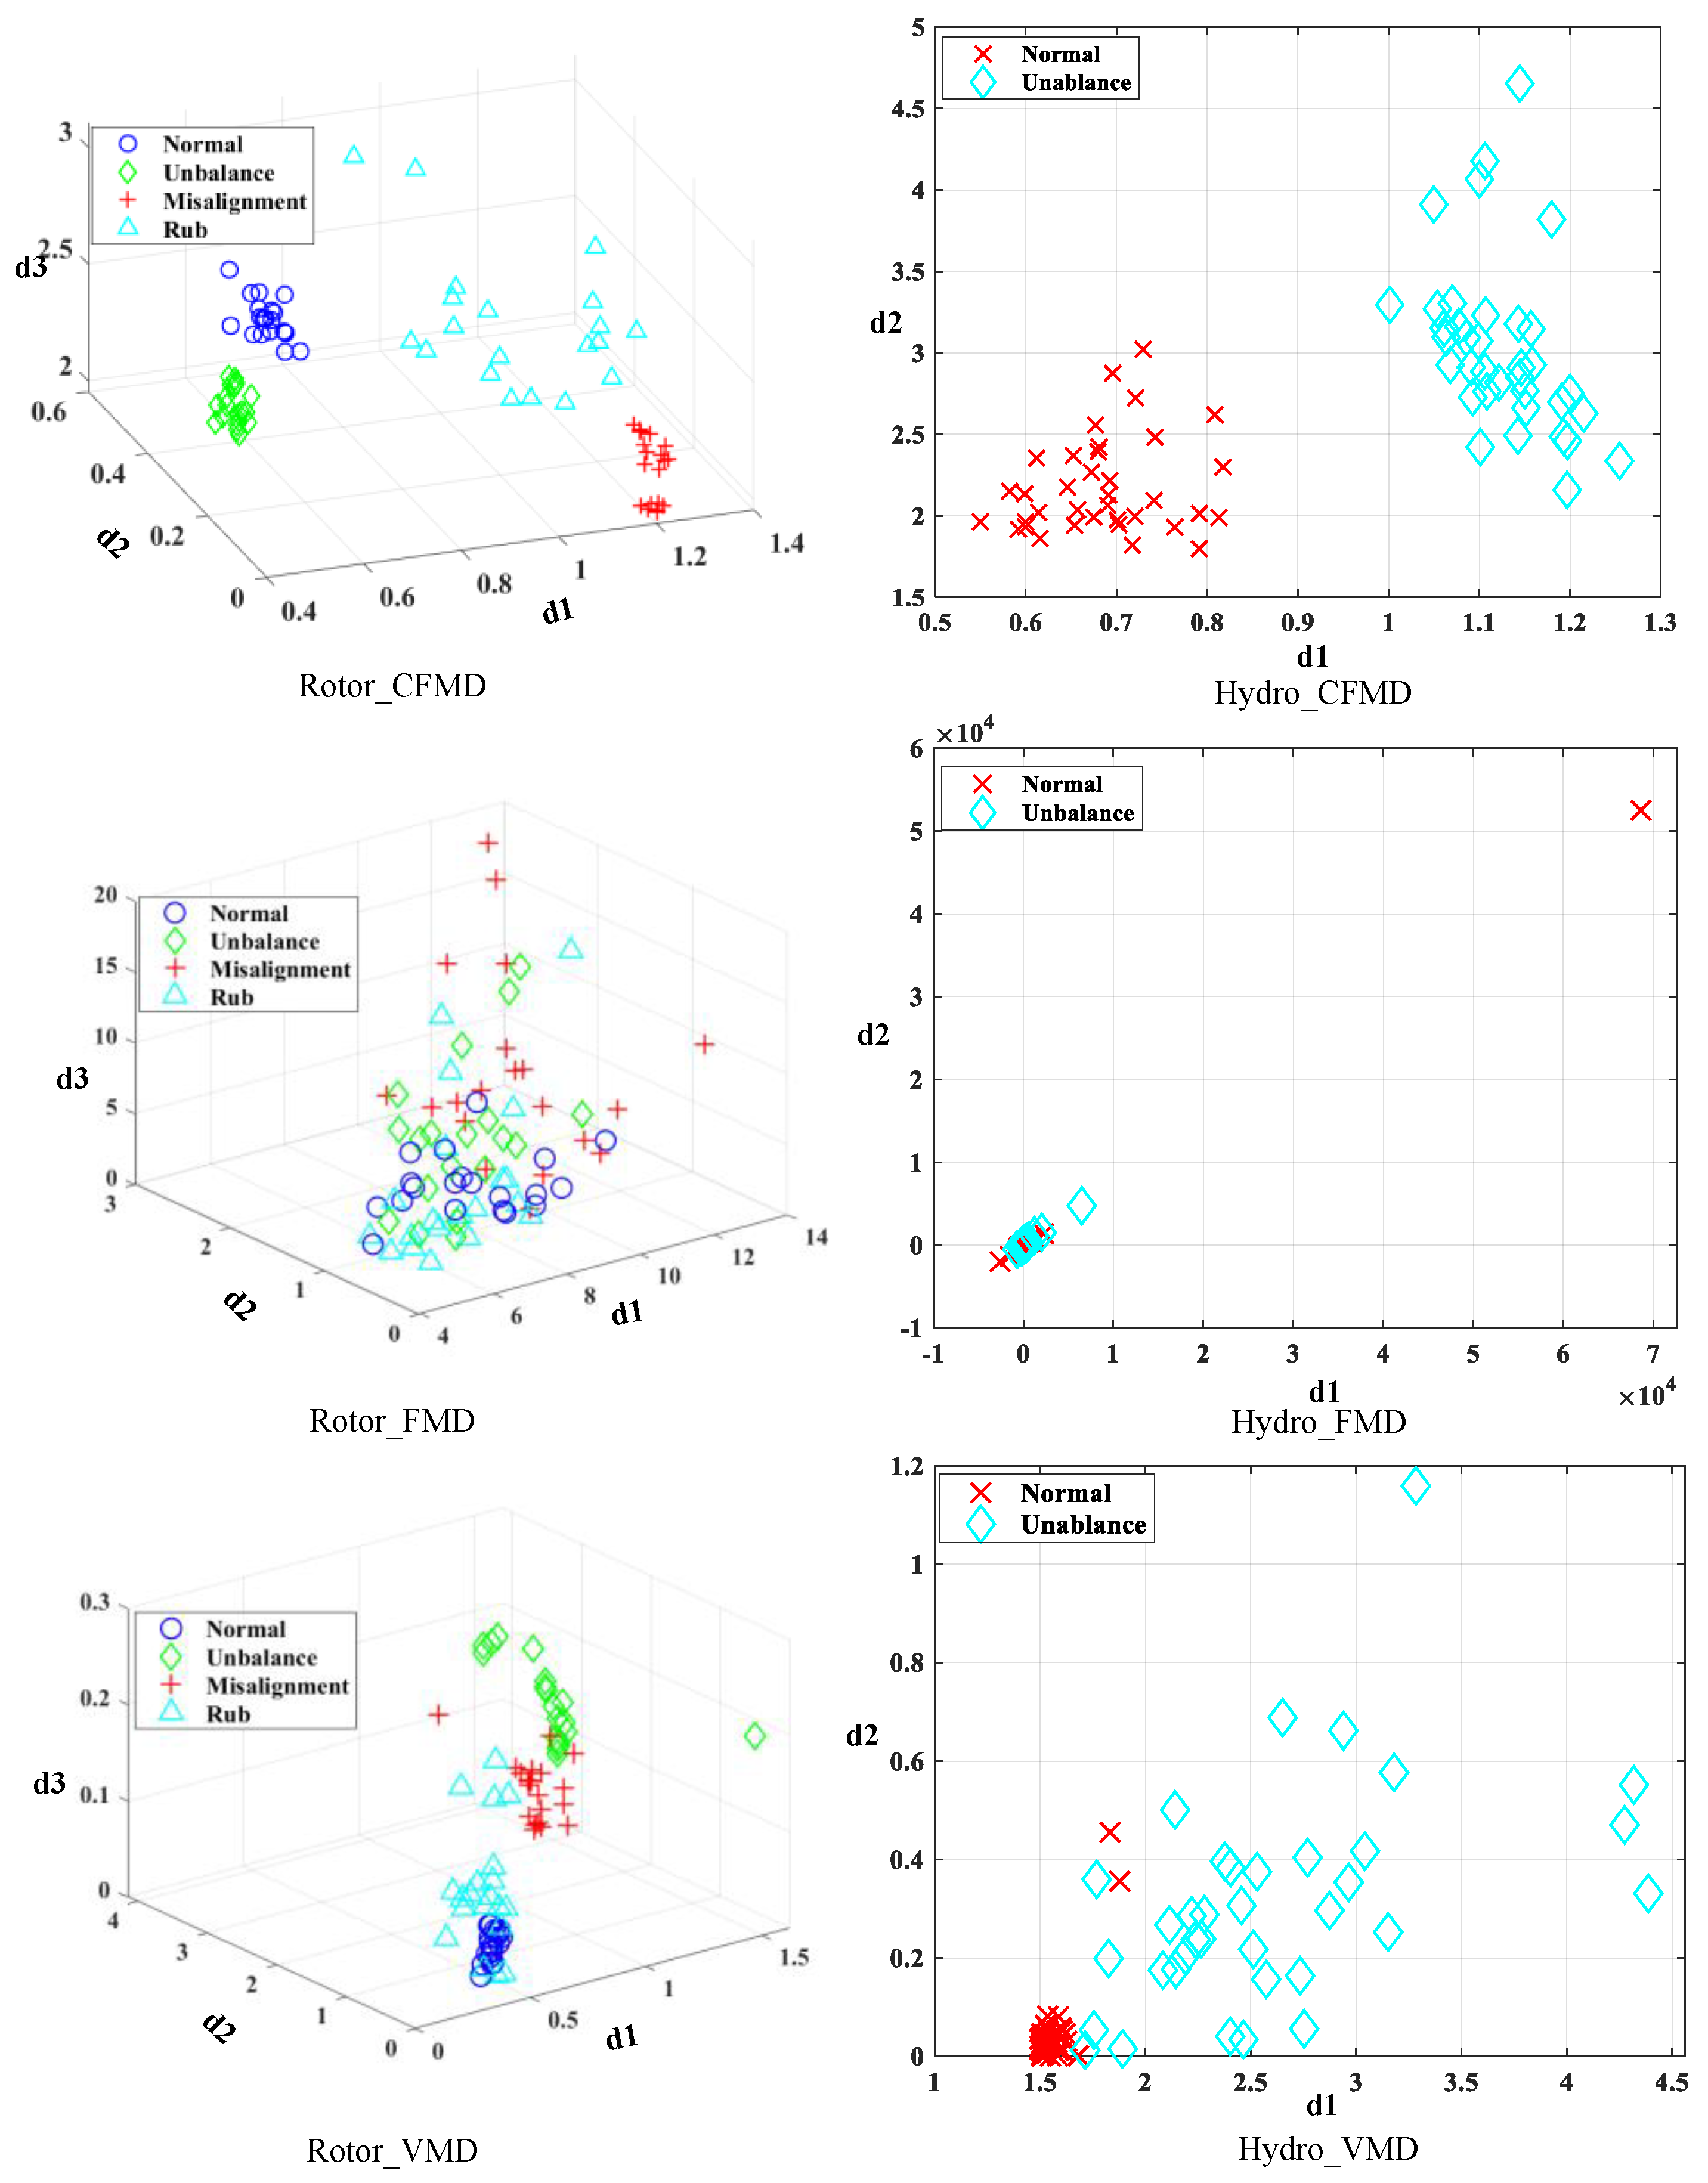
3.2. Feature Extraction Results

By inputting the vibration signals into the method described in Section 2.3, with the number of frequency bands set to 35, a filter size of 30, and an iteration count of 20 for both experiments, the optimal modal components can be obtained. For the rotating machinery experiment and the hydropower turbine unit, the optimal modal components are the fifth and fourth modes, respectively. From these optimal modal components, 10 feature parameters are extracted using the calculation formulas listed in Table 1. In the table, x i represents the sampling points of the signal; x p i and x v i are the peak and trough values of x i , respectively; x ¯ , x ¯ p , and x ¯ v are the mean values of x i , x p i , and x v i , respectively; and σ , σ p , and σ v are the standard deviations of x i , x p i , and x v i , respectively.
The DEI of each parameter is calculated, and the results are presented in Table 2. RM denotes the rotating machinery experiment, while HU represents the hydropower turbine unit experiment. Considering that rotating machinery has more diverse operating states compared to hydropower turbine units, three-dimensional and two-dimensional features are selected for visualization, respectively. As shown in Table 2, the P3, P4, and P6 of RM have higher DEI values, while the P4 and P6 of HU have higher DEI values. Therefore, these feature parameters were selected as the final features for visualization. The results are shown in Figure 5. It can be observed that using the proposed method for feature extraction, features of the same category cluster together, while there is a certain distance between features of different categories. This indicates that the proposed method can effectively distinguish between the different operating states of the units.
To validate the advantages of the proposed method, the original FMD method is also used to process the vibration signals. However, the results show that it is not ideal for distinguishing different operating states of the units, as features of various categories are mixed and difficult to distinguish. This may be because the original FMD utilizes the maximum CK as the optimization objective, aiming to highlight periodic impulse components. However, for rotating systems such as hydropower turbine units, periodic impulse components may not be prominent after a fault occurs. In addition, a comparison was also made with the VMD method. During the experiment, the number of modes after decomposition was set to 10, and the penalty factor was set to 500. The results obtained are shown in Figure 5. It can be observed from the figure that using VMD for feature extraction does not allow for clear distinction among all faults based on the extracted features.
To further validate the effectiveness of the features extracted by the method proposed in this paper, the K-means method was utilized to classify the extracted features. The results are presented in Table 3. It can be seen that for both the rotor test-bed experiments and the hydropower unit experiments, the fault recognition rate obtained by the method proposed in this paper was the highest among the three methods, thereby verifying the superiority of the proposed method in terms of recognition accuracy.
In addition to the visual comparison of fault features, this paper also records the runtime of different methods, as shown in Table 3. It can be observed that the runtime of the proposed method is approximately one-seventh of that of the original FMD method, and that it is also shorter than the time consumed by the VMD method, indicating that the proposed method significantly reduces the runtime.
In summary, the method proposed in this paper enhances the discrimination of different fault features and shortens the runtime, which is of great significance for accurate fault diagnosis in hydropower turbine units.

4. Conclusions

Considering the unique fault characteristics of hydropower turbine units, this paper has advanced the FMD method by incorporating the CDEI as the optimization criterion for feature selection. A novel fault feature extraction method is proposed for hydropower turbine unit fault diagnosis. To validate the efficacy of our method, we conducted experiments using vibration signals from rotating machinery and also analyzed field-collected vibration signals from actual hydropower turbine units.
Our key findings reveal that the features extracted using the proposed method are notably more effective in distinguishing various equipment states compared to traditional methods. Furthermore, the runtime of our method is significantly shorter than those of the original FMD feature extraction method and the VMD method, thereby enhancing the efficiency of fault feature extraction.
Despite these promising results, it is important to acknowledge certain limitations of this study. For instance, the sample size and diversity of the datasets used for validation may not fully represent the wide range of fault scenarios encountered in hydropower turbine units. Additionally, while our method demonstrates improved efficiency, further optimizations may be possible to enhance its applicability in real-world scenarios.
In light of these findings, future research directions could explore the application of the proposed method to larger and more diverse datasets, as well as the integration of additional feature selection and extraction techniques to further improve the accuracy and efficiency of fault diagnosis in hydropower turbine units.

Author Contributions

Conceptualization, T.W. and H.G.; methodology, T.W.; software, Z.G.; validation, T.W., H.G. and J.D.; formal analysis, H.G.; investigation, Z.G.; resources, J.D.; data curation, H.G.; writing—original draft preparation, T.W.; writing—review and editing, F.Y.; visualization, Z.G.; supervision, F.Y.; project administration, H.G.; funding acquisition, T.W. All authors have read and agreed to the published version of the manuscript.

Funding

This work was funded by the China Yangtze Power Co., Ltd. Scientific Research Project Grant No. 2323020047, entitled “Research on Thrust Bearing Force Measurement Technology and Equipment Development”.

Data Availability Statement

The raw/processed data cannot be shared at this time. Due to the nature of this research, participants in this study did not agree for their data to be shared publicly.

Conflicts of Interest

Authors Tao Wu, Haipeng Gong, Zaiming Geng, Jian Deng were employed by the company China Yangtze Power Co., Ltd. The remaining authors declare that the research was conducted in the absence of any commercial or financial relationships that could be construed as a potential conflict of interest.

References

  1. Liu, W.; Zheng, Y.; Ma, Z.; Tian, B.; Chen, Q. An intelligent fault diagnosis scheme for hydropower units based on the pattern recognition of axis orbits. Meas. Sci. Technol. 2023, 34, 025104. [Google Scholar] [CrossRef]
  2. Li, X.; Zhang, J.; Xiao, B.; Zeng, Y.; Lv, S.; Qian, J.; Du, Z. Fault Diagnosis of Hydropower Units Based on Gramian Angular Summation Field and Parallel CNN. Energies 2024, 17, 3084. [Google Scholar] [CrossRef]
  3. Dao, F.; Zeng, Y.; Zou, Y.; Qian, J. Fault diagnosis method for hydropower unit via the incorporation of chaotic quadratic interpolation optimized deep learning model. Measurement 2024, 237, 115199. [Google Scholar] [CrossRef]
  4. Chen, J.; Zheng, Y.; Deng, X.; Wang, Y.; Hu, W.; Xiao, Z. Design of a progressive fault diagnosis system for hydropower units considering unknown faults. Meas. Sci. Technol. 2024, 35, 015904. [Google Scholar] [CrossRef]
  5. Nawab, S.H.; Quatieri, T.F. Short-time Fourier transform. In Advanced Topics in Signal Processing; ACM: New York, NY, USA, 1987; pp. 289–337. [Google Scholar]
  6. Peng, Z.K.; Chu, F.L. Application of the wavelet transform in machine condition monitoring and fault diagnostics: A review with bibliography. Mech. Syst. Signal Process. 2004, 18, 199–221. [Google Scholar] [CrossRef]
  7. Huang, N.E.; Shen, Z.; Long, S.R.; Wu, M.C.; Shih, H.H.; Zheng, Q.; Liu, H.H. The empirical mode decomposition and the Hilbert spectrum for nonlinear and non-stationary time series analysis. Proc. R. Soc. London. Ser. A Math. Phys. Eng. Sci. 1998, 454, 903–995. [Google Scholar] [CrossRef]
  8. Dragomiretskiy, K.; Zosso, D. Variational mode decomposition. IEEE Trans. Signal Process. 2013, 62, 531–544. [Google Scholar] [CrossRef]
  9. Miao, Y.; Zhang, B.; Li, C.; Lin, J.; Zhang, D. Feature Mode Decomposition: New Decomposition Theory for Rotating Machinery Fault Diagnosis. IEEE Trans. Ind. Electron. 2023, 70, 1949–1960. [Google Scholar] [CrossRef]
  10. Yan, X.; Jia, M. Bearing fault diagnosis via a parameter-optimized feature mode decomposition. Measurement 2022, 203, 112016. [Google Scholar] [CrossRef]
  11. Zuo, J.; Lin, J.; Miao, Y. Period enhanced feature mode decomposition and its application for bearing weak fault feature extraction. Meas. Sci. Technol. 2024, 35, 116127. [Google Scholar] [CrossRef]
  12. Meng, T.; Jiang, X.; Song, Q.; Hu, Z.; Guo, J.; Zhu, Z. Modified Feature Mode Decomposition Guided by Spectral Structure Information for Machinery Fault Diagnosis. IEEE Trans. Instrum. Meas. 2024, 73, 3525810. [Google Scholar] [CrossRef]
  13. Khalid, S.; Lim, W.; Kim, H.S.; Oh, Y.T.; Youn, B.D.; Kim, H.-S.; Bae, Y.-C. Intelligent Steam Power Plant Boiler Waterwall Tube Leakage Detection via Machine Learning-Based Optimal Sensor Selection. Sensors 2020, 20, 6356. [Google Scholar] [CrossRef] [PubMed]
  14. Khalid, S.; Hwang, H.; Kim, H.S. Real-World Data-Driven Machine-Learning-Based Optimal Sensor Selection Approach for Equipment Fault Detection in a Thermal Power Plant. Mathematics 2021, 9, 2814. [Google Scholar] [CrossRef]
  15. Lu, N.; Xiao, Z.; Zhang, G.; Sun, Z. Rotating machinery fault feature extraction based on adaptive multi-wavelets and synthesis distance evaluation index. J. Vib. Shock. 2014, 33, 194–210. [Google Scholar]
  16. Miao, Y.; Zhao, M.; Lin, J.; Lei, Y. Application of an improved maximum correlated kurtosis deconvolution method for fault diagnosis of rolling element bearings. Mech. Syst. Signal Process. 2017, 92, 173–195. [Google Scholar] [CrossRef]
  17. Kundu, P.; Darpe, A.K.; Kulkarni, M.S. A correlation coefficient based vibration indicator for detecting natural pitting progression in spur gears. Mech. Syst. Signal Process. 2019, 129, 741–763. [Google Scholar] [CrossRef]
Figure 2. Rotor test rig.
Energies 17 06134 g002
Figure 3. Vibration signal of the rotor test rig.
Energies 17 06134 g003
Figure 4. Vibration signal of the hydropower turbine unit.
Energies 17 06134 g004
Figure 5. Feature visualization.
Energies 17 06134 g005
Table 1. Equations of the feature parameters.
ParametersP1P2P3P4P5
Equations σ x ¯ i = 1 N x i 2 σ 2 i = 1 N ( x i x ¯ ) 3 N σ 3 i = 1 N ( x i x ¯ ) 4 N σ 4 x ¯ p x ¯
ParametersP6P7P8P9P10
Equations x ¯ p σ i = 1 N p ( x p i x ¯ p ) 3 N p σ p 3 i = 1 N p ( x p i x ¯ p ) 4 N p σ p 4 i = 1 N v ( x v i x ¯ v ) 3 N v σ v 3 i = 1 N v ( x v i x ¯ v ) 4 N v σ v 4
Table 2. DEI values of the feature parameters corresponding to the optimal modal components.
ParametersP1P2P3P4P5P6P7P8P9P10
RM0.8415.13104.8359.370.26126.1616.3322.9131.5345.46
HU0.080.460.231.380.094.850.701.130.290.78
Table 3. Fault recognition results and running times.
ExperimentsFault Recognition Result/%Running Time/s
Hydro_CFMD94.4449.53
Hydro_FMD51.39348.14
Hydro_VMD80.85268.66
Rotor_CFMD98.75134.02
Rotor_FMD42.45893.60
Rotor_VMD58.75181.37
Disclaimer/Publisher’s Note: The statements, opinions and data contained in all publications are solely those of the individual author(s) and contributor(s) and not of MDPI and/or the editor(s). MDPI and/or the editor(s) disclaim responsibility for any injury to people or property resulting from any ideas, methods, instructions or products referred to in the content.

