1. Introduction
Due to the diversification of future energy sources and most clean energy not having the function of energy storage, the current clean energy applications in distributed power generation systems generally use batteries as auxiliary power systems, and multiple sets of converters are required to achieve joint power; the purpose being to become a large-scale energy storage system in the future. This will have the functions of storing electric energy and heat energy, storing and releasing energy during off-peak and peak power consumption.
A reversible solid oxide cell (RSOC) provides a dual function of performing power generation and energy storage. When a RSOC is in SOEC mode, it can be used for hydrogen generation; conversely, an SOFC-mode RSOC can also act as a fuel cell to produce electricity.
This paper reports the resulting performance, both in SOEC mode and SOFC mode, based on the cell’s operating parameters, such as temperature, inlet vapor composition (humidity), etc.
The structure of an RSOC in this paper consists of three parts: a hydrogen electrode, an air electrode, and a solid electrolyte. These three parts are described as follows:
1.1. Hydrogen Electrode
In SOFC-mode reactions, hydrogen electrodes must have good catalytic capacity and electrical conductivity, in addition to being stable in a reducing environment. Structurally, water vapor and hydrogen must be allowed to enter and exit. Therefore, the hydrogen current must have a porous structure. Currently, the most common fuel electrode material for RSOC is a ceramic–gold material (cermet, Ni-YSZ), which is a mixture of nickel (Ni) and polonium-stabilized zirconia (YSZ) in the appropriate proportions. The presence of fuel electrode conductivity can reach more than 105 s/cm while reducing the difference in the coefficient of thermal expansion between the fuel electrode and the solid electrolyte.
1.2. Air Electrode
The properties of the air electrode material and the hydrogen electrode material are similar, and the structure must have high conductivity, catalytic capacity, and porosity. But the air rod may be used in an oxidizing atmosphere. So, general metal materials are not suitable, and oxides with electronic conductivity may be used. The air electrode material is usually strontium-containing lanthanum cobalt oxide (Sr-doped-LaCoO
3, LSC) or strontium-containing lanthanum manganese oxide (Sr-doped-LaMnO
3, LSM) [
1]. As a result, it has a conductivity of more than 100 s/cm.
1.3. Solid Electrolyte
During operation, oxygen from the air channel is transported through porous air electrodes and then reduced to oxygen ions (O2−) at the gas–air electrode–electrolyte three-phase boundary. The oxygen ions formed at the air electrode–electrolyte interface are then transported to the fuel electrode–electrolyte interface via the ionic conductive electrolyte. At the same time, the fuel from the fuel channel is delivered through a porous fuel electrode to the fuel electrode–electrolyte interface, where it is electrochemically oxidized to the product at the gas–fuel electrode–electrolyte three-phase boundary. The products, such as H2O and CO2, are then transported back to the fuel channel through the porous fuel–electrode structure. The transport resistance of the gas-phase species in the porous electrode and the O2− in the electrolyte, as well as the excitation energy barrier of the electrochemical reaction, lead to various polarizations.
The main contribution to Ohmic polarization comes from the transport resistance of O
2− in the electrolyte. Concentration polarization is due to the transmission resistance of gaseous substances through porous composite electrodes, and activation polarization is related to the charge transfer process at the electrode–electrolyte interface. These different polarizations are a function of operating conditions and the physical properties of the battery. Operating conditions include temperature, pressure, and fuel and oxidizer concentrations. Battery properties involve the material; the macroscopic and microstructure of electrolytes and composite electrodes, including the porosity, tortuosity, permeability, and thickness of fuel electrodes and air electrodes; the ionic conductivity and thickness of electrolytes; and the active area and activity of electrode–electrolyte interfaces [
2].
The vast majority of the modeling literature uses only a few, and usually only one, global charge transfer reactions, and the rates are expressed using the Butler–Volmer approximation [
3]. The purpose of this article is to identify common aspects of electrochemistry and to find a basis for designing and implementing software that is universally applicable to a variety of material groups and applications. The development of new technologies should be accelerated and improved by incorporating electrochemical complexities (e.g., multi-step, basic charge transfer reactions, and support for ion and electron transport) into the analysis and interpretation of scientific results. The spirit of the method is similar to the role Chemkin plays in homogeneous chemical modeling, especially combustion. The COMSOL Multiphysics
® software has several electrochemical features that provide the basis for future expansions.
2. Literature Review
Nagata et al. [
4] investigated the SOFC performance of the recombinant using numerical methods. In addition, they investigated the effect of recombinants on the performance of the above-mentioned SOFC using a one-dimensional molar distribution of temperature and flow direction. The results show that increasing the reaction rate of the recombinant will lead to a slight decrease in efficiency and, at the same time, an increase in the gas outlet temperature.
Henriques et al. [
5] built a model for a five-layer fuel cell pack of a proton exchange membrane fuel cell using the COMSOL software to study its effect on fuel cell performance based on changing the geometry of the air electrode runner plate. They also studied the generation of air electrode water and the current density distribution across different cross-sections. Fuel cell efficiency evaluation is typically represented by a cell voltage versus current density equation. Moreover, its characteristic curve is also known as the cell polarization curve [
6].
Many research teams (see
Table 1) have conducted extensive research using the materials of SOFC as a fuel cell electrolyte.
The power generation performance of a fuel cell will not be improved significantly after the fuel electrode porosity increases to 0.4. And the power generation performance of a fuel cell will also increase as the porosity of the air electrode increases [
7]
The porosity of the air electrode has a significant impact on the hydrogen production efficiency of the fuel cell. But, the increase in the hydrogen production efficiency is not obvious in a fuel electrode [
8].
3. Finite Element Modeling in Multi-Physics Field
COMSOL Multiphysics® software is used to build a RSOC model to shorten the development cycle and avoid the waste of resources.
3.1. The Governing Equation
The chemical reaction of the SOEC is:
The external voltage to be applied in the SOEC mode is estimated by the following formula:
The equilibrium potential can be estimated by the Nernst equation:
among which:
The concentration overpotential can be obtained by the following formula:
The current can also be calculated by using the Butler–Volmer equation:
The Ohmic overpotential is:
where
T stands for temperature
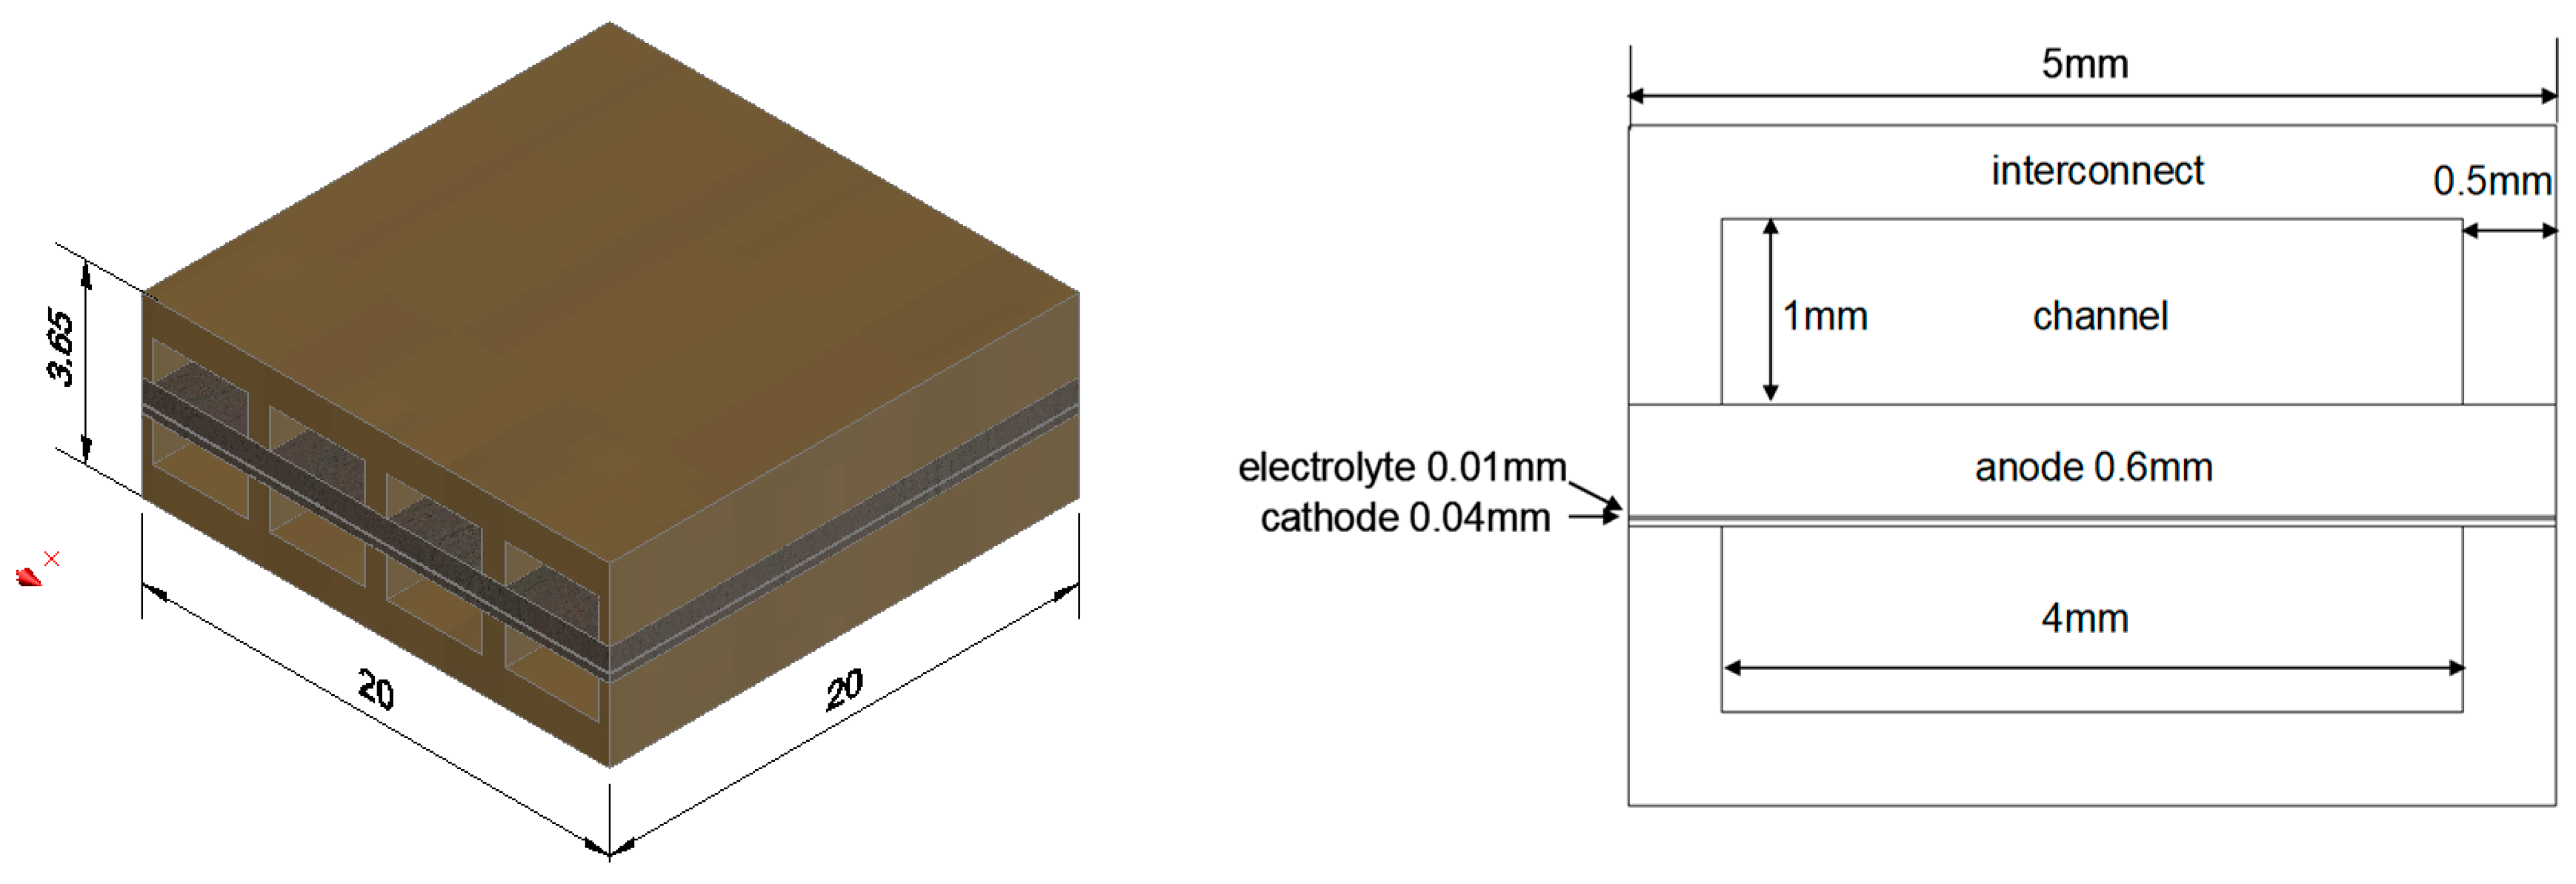
3.2. Geometric Model
The parameters designed in the geometry are defined as: electrode porosity, pore size, permeability, and average effective surface area of the electrode. The flow channel is a straight channel design, the flow pattern is counter-current, and the reaction area of the fuel electrode support plate fuel cell is 4 cm
2.
Figure 1 shows the geometry and size of the entire 3D numerical simulation model.
4. Numerical Simulation Method and Algorithms
The requirements for simulation are not the same. In order to effectively evaluate this research, COMSOL Multiphysics® (version 5.4) software is used.
COMSOL Multiphysics® version 5.4 introduces the Composite Materials Module, as well as the COMSOL Compiler™ for compiling simulation applications. In addition, version 5.4 adds several new modeling tools and improves the core performance of the software. After using the Application Builder to customize the user interface for a simulation model, COMSOL users can use COMSOL Compiler™ to further compile it in the new version to generate a simulation application that can be executed independently. These applications run with COMSOL Multiphysics® have been confirmed over many years and around the word and can be validated by anyone for further use.
To increase the complexity of the research: The kinetic characteristics of electrochemical reactions are highly dependent on the electrode, electro catalytic materials, and electrolyte composition. Very few materials databases list kinetic parameters, so electrochemists must use experiments to determine the specific parameters of their equipment.
However, it is difficult to run complex controlled experiments in closed systems such as fuel cells, especially since these systems have many different physical parameters that can affect the electrochemical process.
The fuel cell module provides physical interfaces that can simulate these experiments, such as electrochemical impedance spectroscopy and cyclic voltammetry, as well as loading data, drawing graphics, and even estimating its operating parameter Tools (which requires an optimization module) [
9].
After establishing the electrochemical kinetic theory, one can incorporate it into one’s fuel cell and fuel cell research through the secondary current distribution model. In these models, the charge transfer mechanism and activation over potential directly affect the electrochemical reaction. Such models can better indicate the operating voltage and current of the system, can be used to determine electrode and electro catalyst materials, and enable one to consider activation over-potential loss in any heat transfer process research.
The secondary current distribution interface can be coupled with the chemical substance transfer interface; the chemical substance transfer interface describes the transfer of substances in the pores (for example, in the gas diffusion electrode, GDE). In the description of a GDE, a condensate model or film model can be used to describe the transfer of dissolved gasses in the pore electrolyte and their transfer to the activation site. Then, the gas transfer in the pores can also be coupled to the transfer and flow in the gas channel (such as the fuel cell bipolar plate) [
10].
The homogeneous reaction can be described by the kinetic expression of the mass transfer interface in the fuel cell and fuel cell module, in which any sink and source terms can be defined. Alternatively, you can define them in the physical interface in the chemical reaction engineering module and couple them to the fuel cell model.
The calculations were carried out by finite element analyses. The cell size of this RSOC is 16 × 16 cm2, with an active area of 10 × 10 cm2. The numerical simulation was carried out based on the notion that the grid of the electrochemical active area is the 30 elements based on the RSOC stack consisting of 900 identical block modules.
In our previous published paper, the performance curves under different operating temperatures of 600, 700, and 800 °C for RSOC are compared with the results of the simulation to validate the same model as is used in this paper. This revealed the same trends for the effects of higher temperature on cell performance in both the measured data and the prediction results. The applicability of this RSOC model was validated by the predicted cell performance curves in both the SOFC mode and the SOEC mode, which corresponded well with the measured data [
11].
5. Numerical Simulation Results
The parameters of this simulation are listed in
Table 2. The results are discussed for SOEC mode and SOFC mode individually.
5.1. SOEC Mode
Figure 2 shows the effect of air electrode porosity on the hydrogen production trend. The results showed that there was no significant difference in the hydrogen production performance when the air electrode porosity increased from 0.4 to 0.6. But, the hydrogen production performance increased slightly when the air electrode porosity increased from 0.2 to 0.4.
The reaction for hydrogen production is mainly on the air electrode. The air electrode porosity can extend the contact areas of reactants to improve the reaction efficiency, but the effect may possess a limit condition for the reactant-compatible speed.
Figure 3 shows the effect of the average pore size of the air electrode on the hydrogen production trend. The results show that the average pore size of the air electrode has a limited effect on hydrogen production performance.
The influence of different water vapor inlet concentrations on the hydrogen production trends is shown in
Figure 4. It shows that the higher the water vapor concentration, the better the hydrogen production. This is because hydrogen comes from the electrolysis of water vapor. Therefore, the more water vapor is provided, the more hydrogen is produced by electrolysis under the same operating conditions.
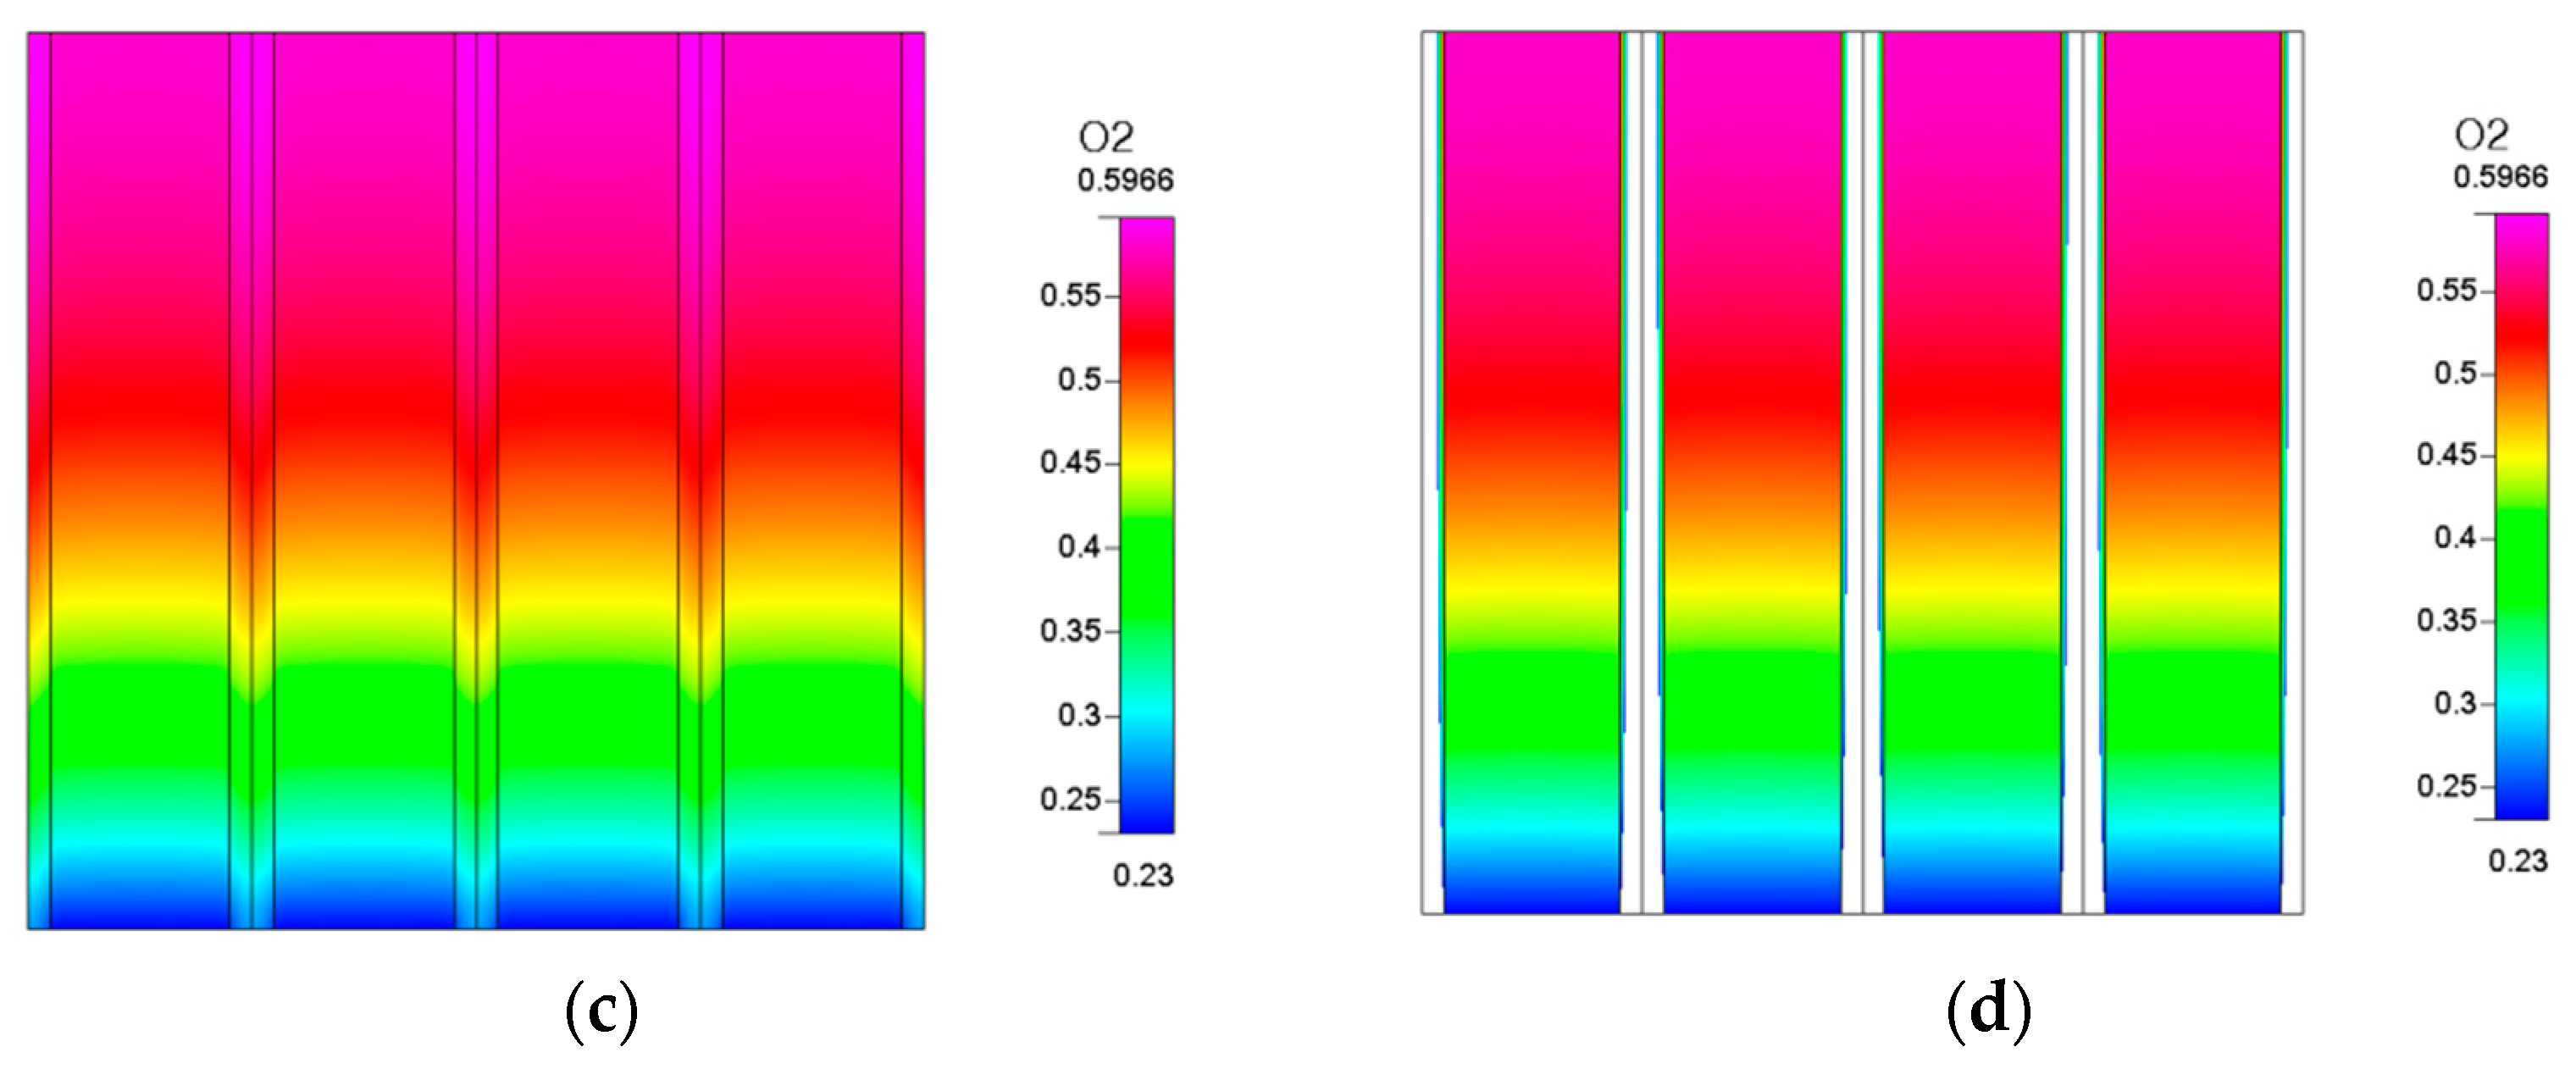
In addition to the hydrogen production trends, we can observe the distribution of oxygen and hydrogen in the fuel cell via the simulation results. After the RSOC reaction, the distribution of hydrogen and oxygen in the electrode and the flow channel is shown in
Figure 5. It shows that regardless of whether the gas is hydrogen or oxygen, the region with a high concentration points to the downstream part. The gas generated by the reaction was forced from the upstream to the downstream section due to the influence of the flow channel. This results in the highest concentration being near the outlet.
The average pore size is not the important factor for the fixed-air electrode porosity (contact area), especially when enough water vapor concentration causes the reaction complete speed to be quick enough.
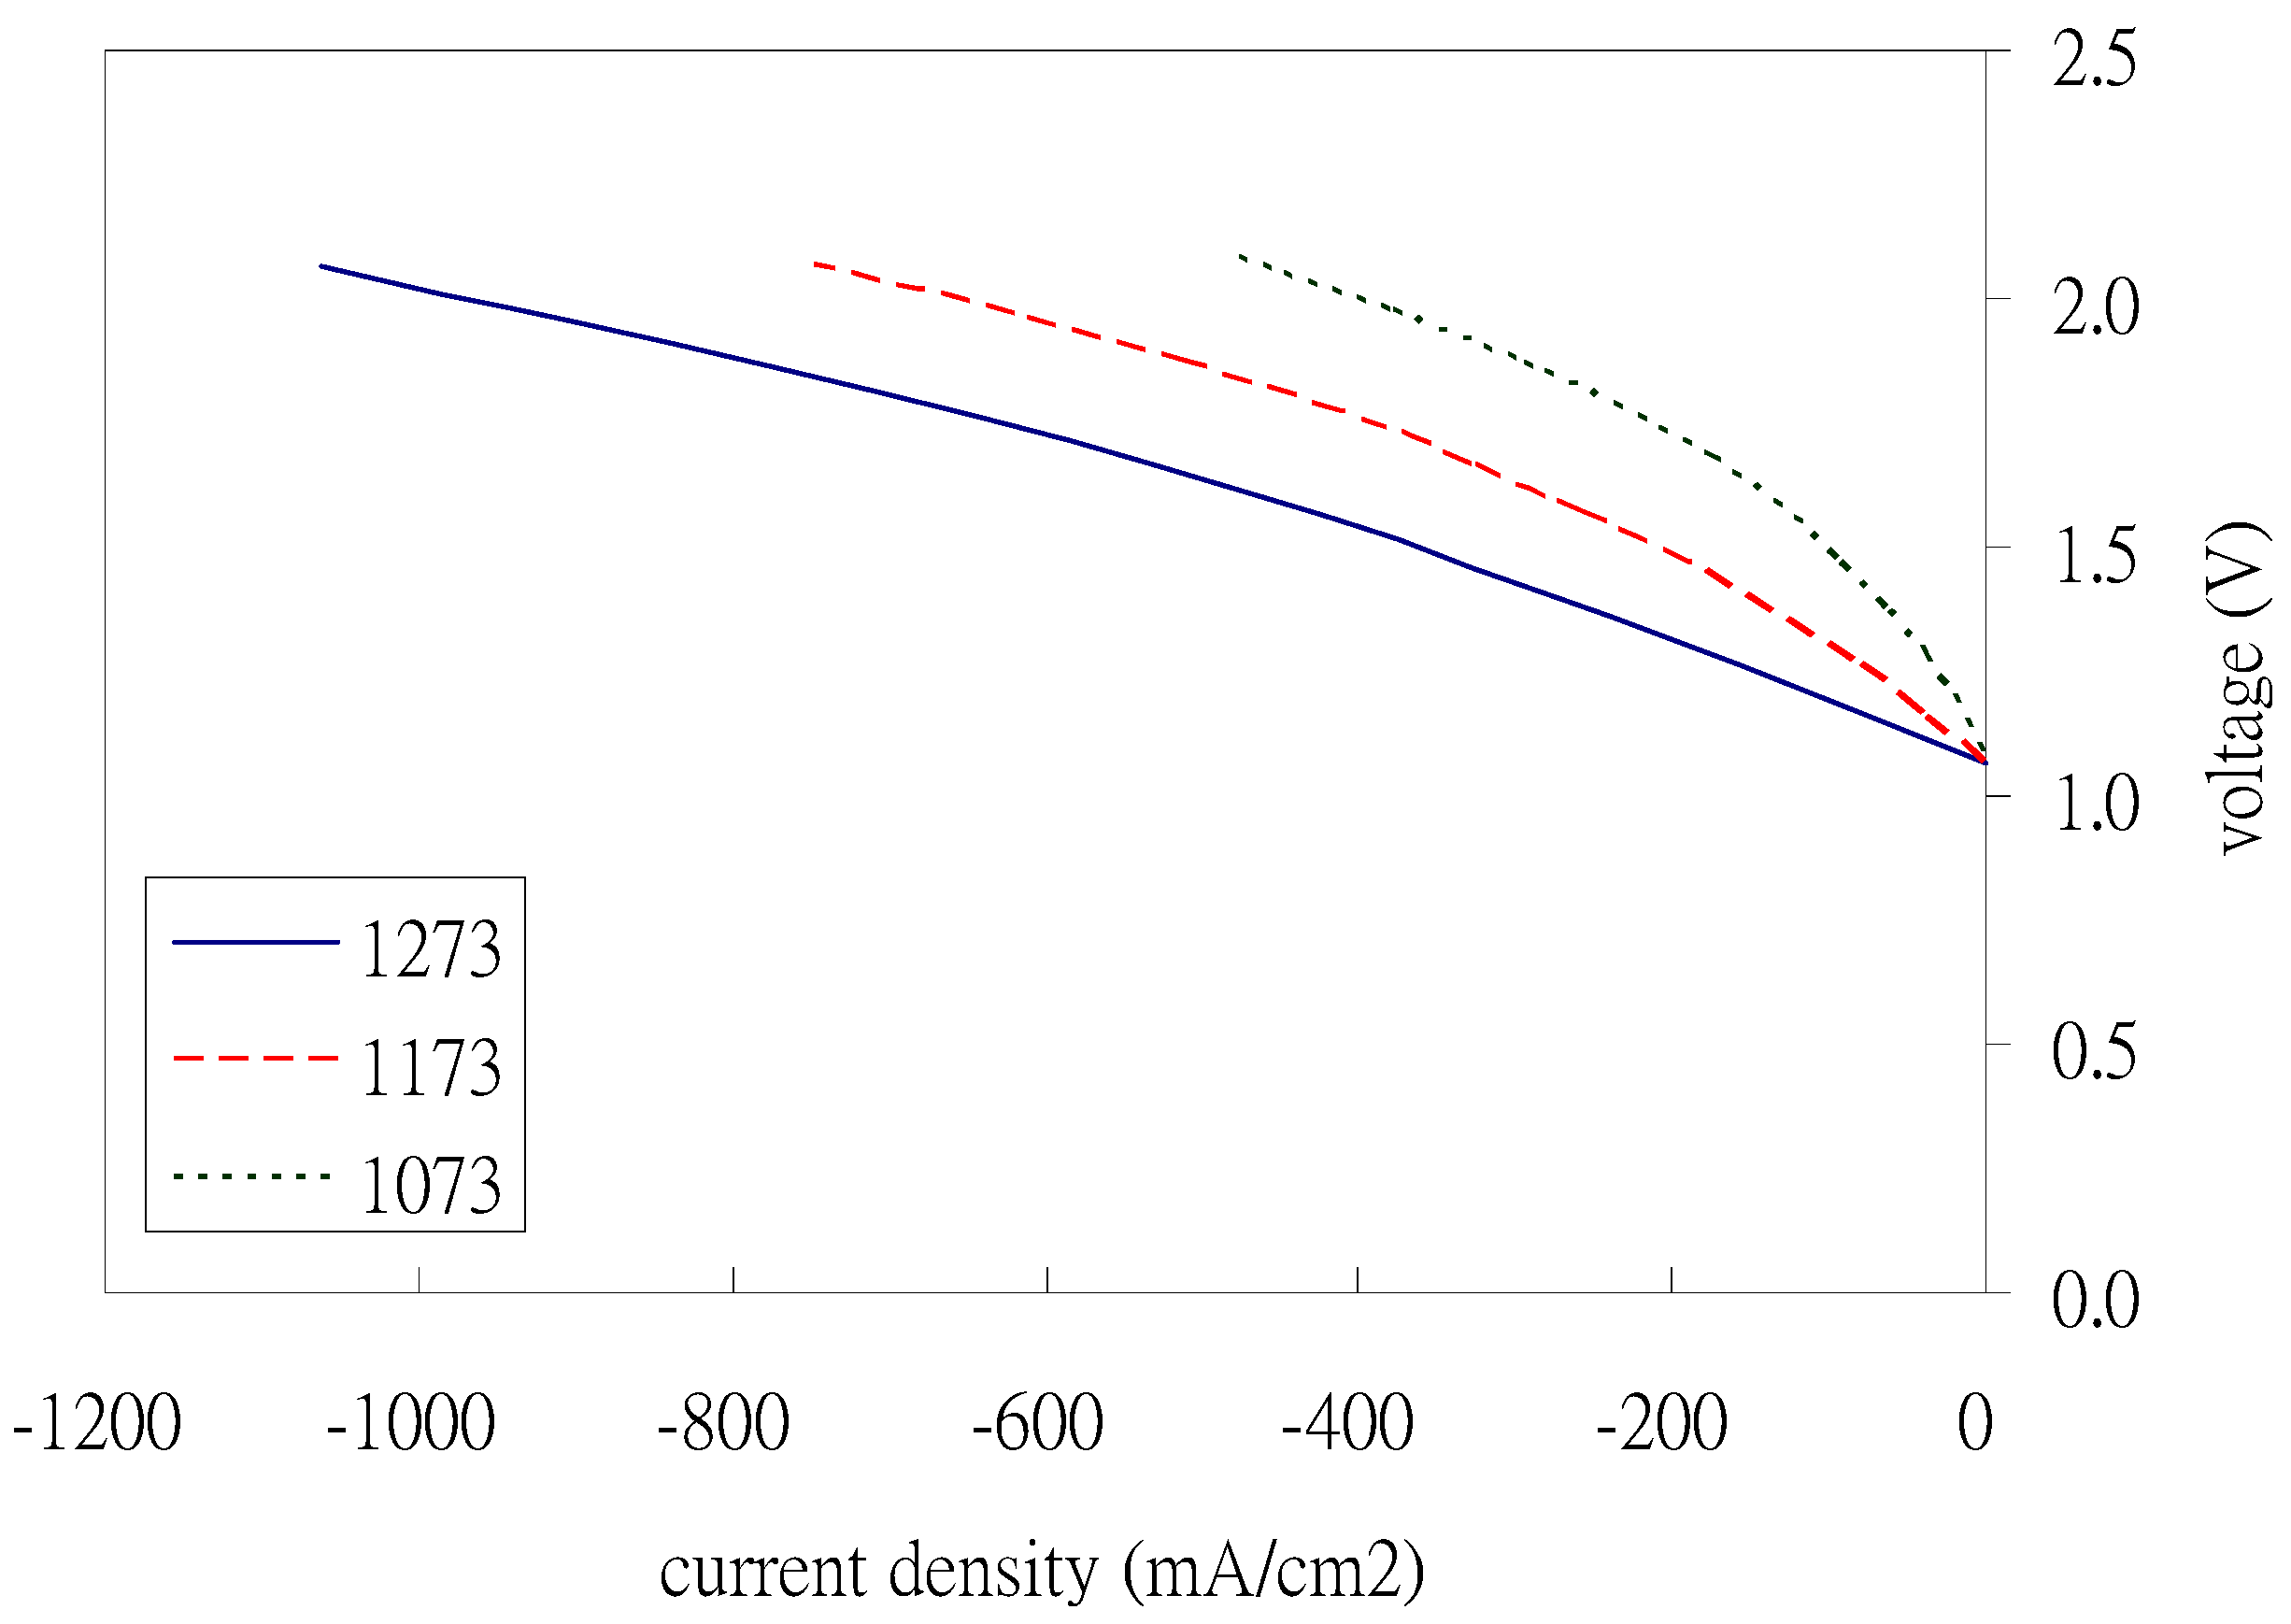
The influence of different operating temperatures is shown in
Figure 6 for the hydrogen production trends. It shows that the higher the operating temperature, the more hydrogen is produced. The reason is that a high temperature can accelerate the chemical reaction which results in it producing more hydrogen.
The highest temperature part of the fuel cell in the electrolyte is shown in
Figure 7. Although the temperature distributions in the upstream, midstream, and downstream do not seem to be significantly different, careful observation reveals that the part with the highest electrolyte temperature actually occurs in the midstream position, because the flow channel is mainly designed in the form of counter-flow.
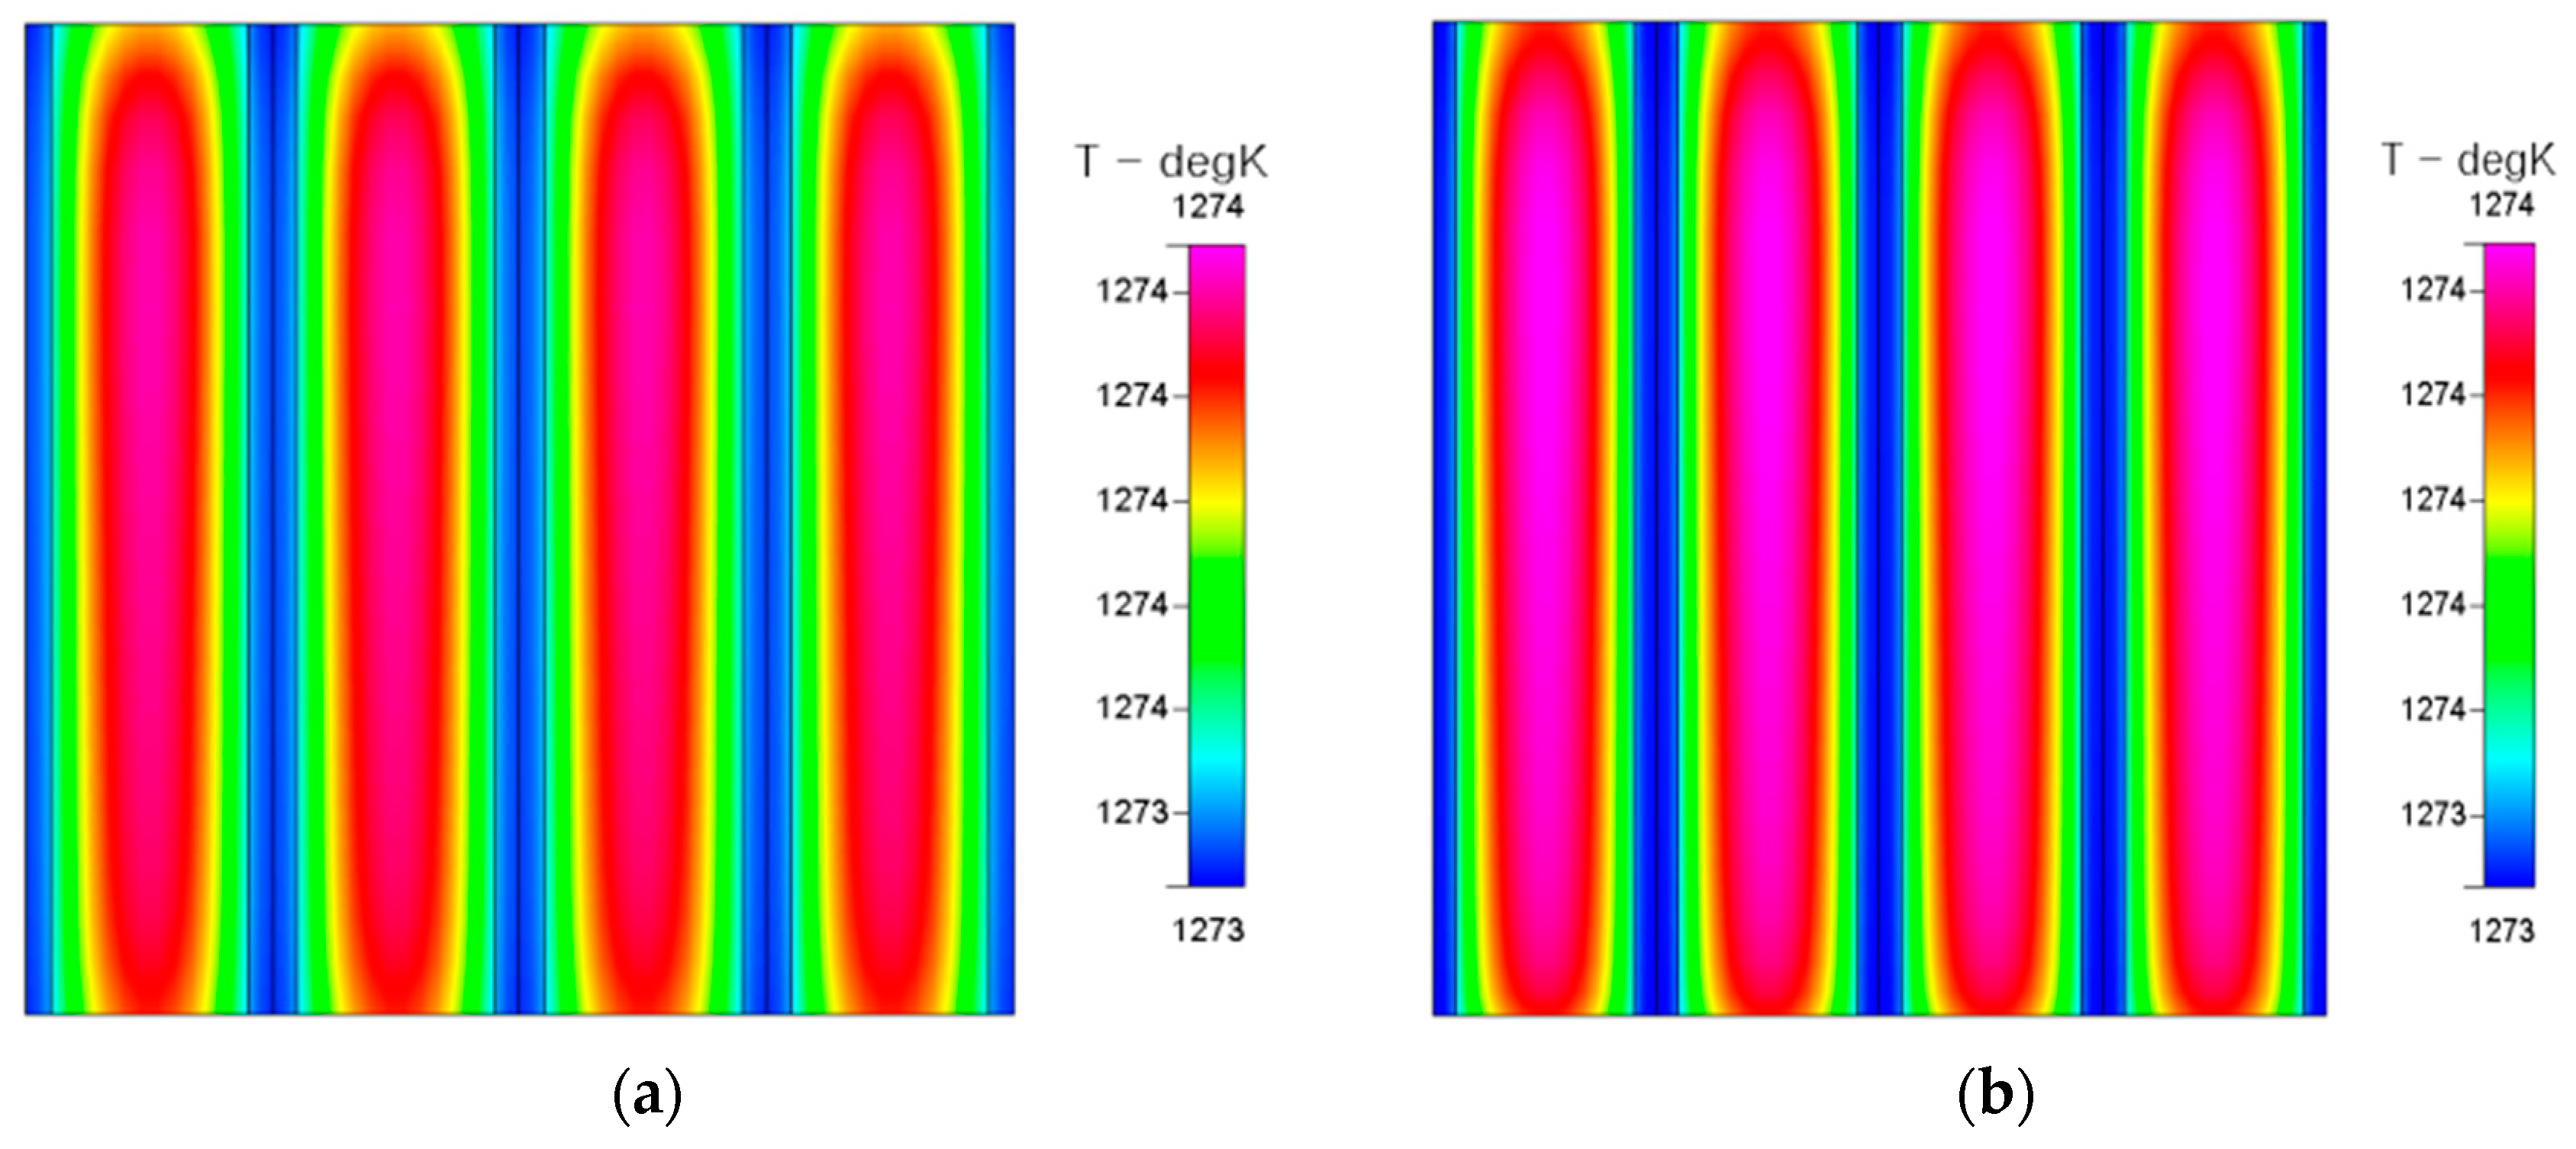
The temperature distributions of an air electrode and fuel electrode in a fuel cell are shown in
Figure 8. The temperature distributions show similar trends and the temperature in the lower region is higher in this figure. It is also worth noting that the temperature distributions of the air electrode and fuel electrode are actually different, although this is not obvious. This slight difference in the temperature distribution can be explained by the thermal responses of the air electrode and fuel electrode.
Due to the counter-flow effect of this RSOC, the recirculation zone formed in the midstream causes the heat accumulation for the reaction of the hydrogen production mode.
This ultra-stable counter flow diverging mini-channel heat sink mechanism [
12] causes the highest electrolyte temperature to actually occur in the midstream position shown in
Figure 8. The central part of the internal temperature distribution for the fuel electrode is higher than that for the air electrode in SOEC mode shown in
Figure 9. This is also evidence for this “heat sink mechanism”, especially for the heat supply at the fuel electrode.
It seems that the better the performance, the higher the temperature. However, it must be noted that the temperature gradient will also increase with the increase in the operating temperature. An excessive temperature gradient will cause the problem of thermal expansion matching between different materials. Therefore, other material factors must be considered accordingly to improve the operating temperature.
The average pore size has a very limited impact on the hydrogen production trend. In contrast, the operating temperature, air electrode porosity, and water vapor inlet concentration have significant effects on the hydrogen production trend. The hydrogen production trend increases slightly when the air electrode porosity increases from 0.2 to 0.4. But when the air electrode porosity increased from 0.4 to 0.6, there was no significant difference. The higher the water vapor inlet concentration, the better the hydrogen production effect; the higher the operating temperature, the more hydrogen was produced. The reason is that the high temperature could accelerate the chemical reaction, which results in the production of more hydrogen.
R. Peters etc. studied the fuel electrode recycling utilization and concluded that the main drivers for fuel electrode recycling are increased fuel efficiency and the independence of the external water supply for the fuel pre-reforming process [
13]. The effects of the fuel electrode are slight enough to be neglected.
In summary, although a higher operating temperature and a higher the water vapor inlet concentration will improve the hydrogen production effect, these higher parameters (temperature and vapor concentration) may cause corrosion and may destroy the air electrode. The other effects (air electrode porosity and average pore size) cause the hydrogen production trend to increase slightly. In conclusion, it is suggested that air electrode porosity and average pore size can be neglected or can be limited (to a 1 μm average pore size and an air electrode porosity of 0.2) to retain the strength of the air electrode and its toleration of corrosion; then, the operating temperature and the water vapor inlet concentration may be set to their maximum their values. These maximum conditions may be further investigated for different air electrode materials, especially the operating temperature.
5.2. SOFC Mode
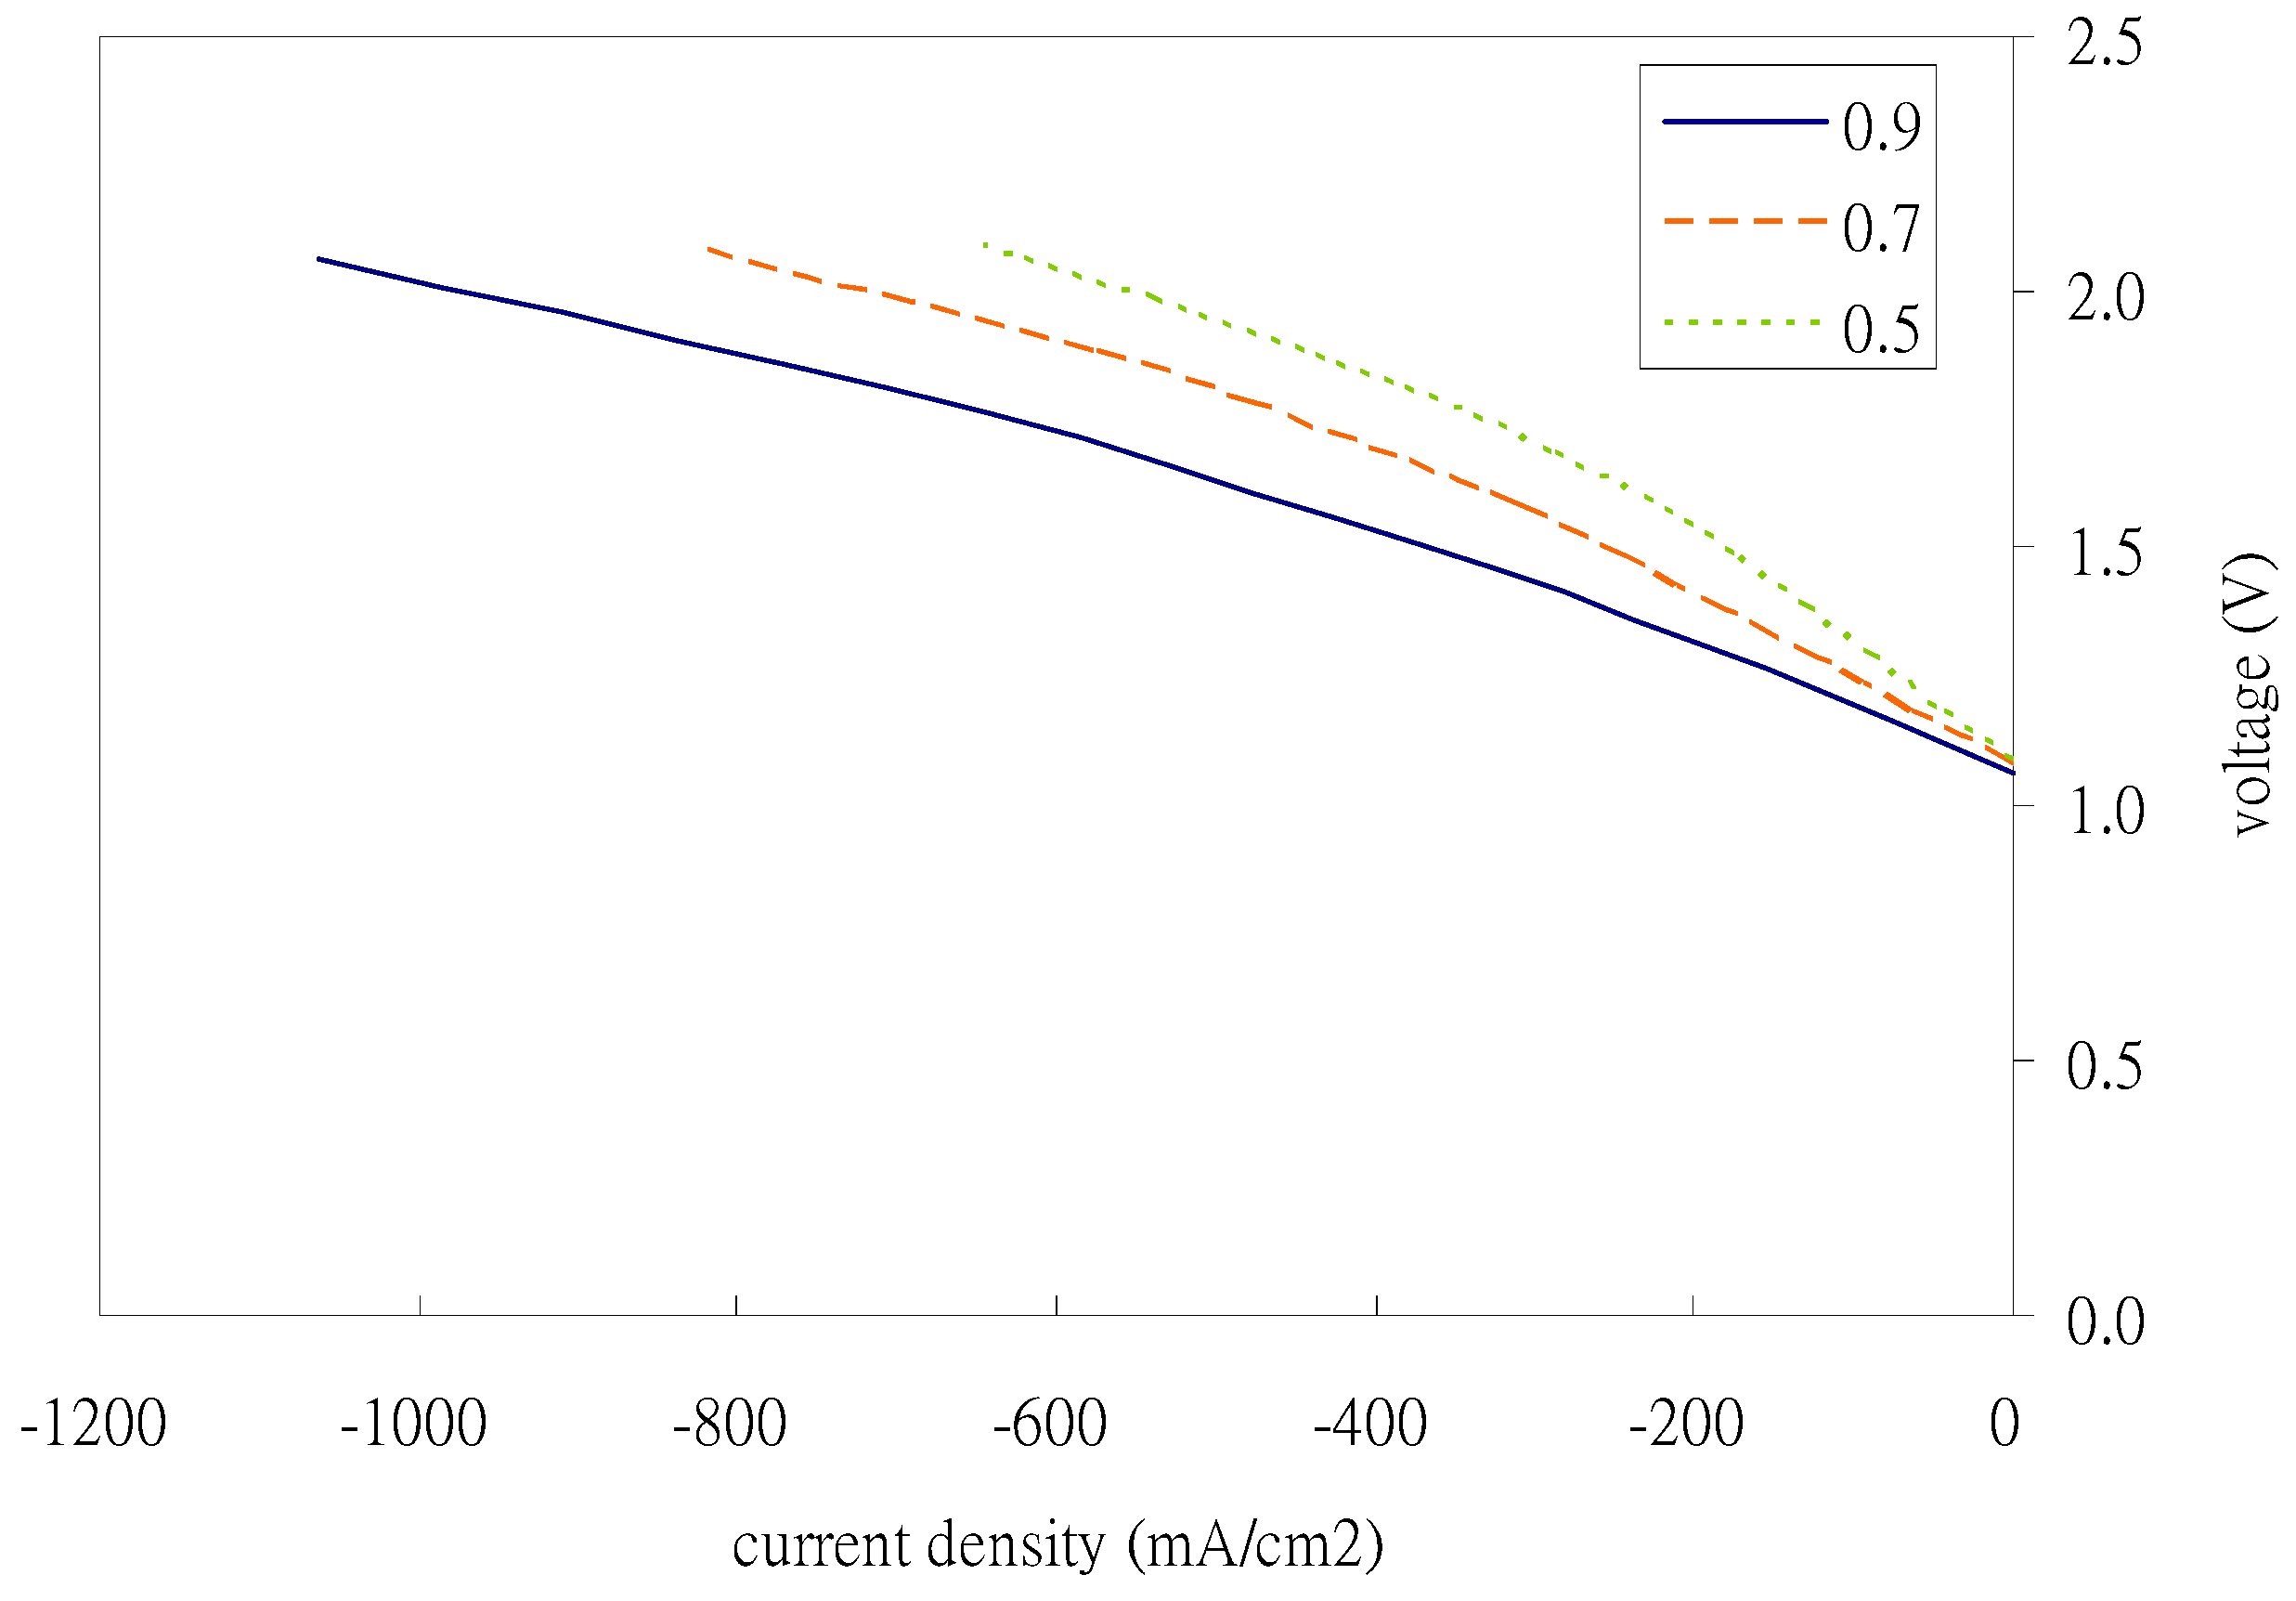
Figure 9 illustrates the effect of electrode porosity on the power generation performance of the fuel cell. As can be seen from the figure, the porosity of the fuel electrode increases and the fuel cell efficiency increases slightly, but after it exceeds 0.4, the fuel cell performance does not improve significantly. However, the air electrode porosity has a significant impact on the power generation efficiency of the fuel cell; not only does the performance of the fuel cell increase with the increase in porosity, but the increase in performance is much greater than the impact on the fuel electrode.
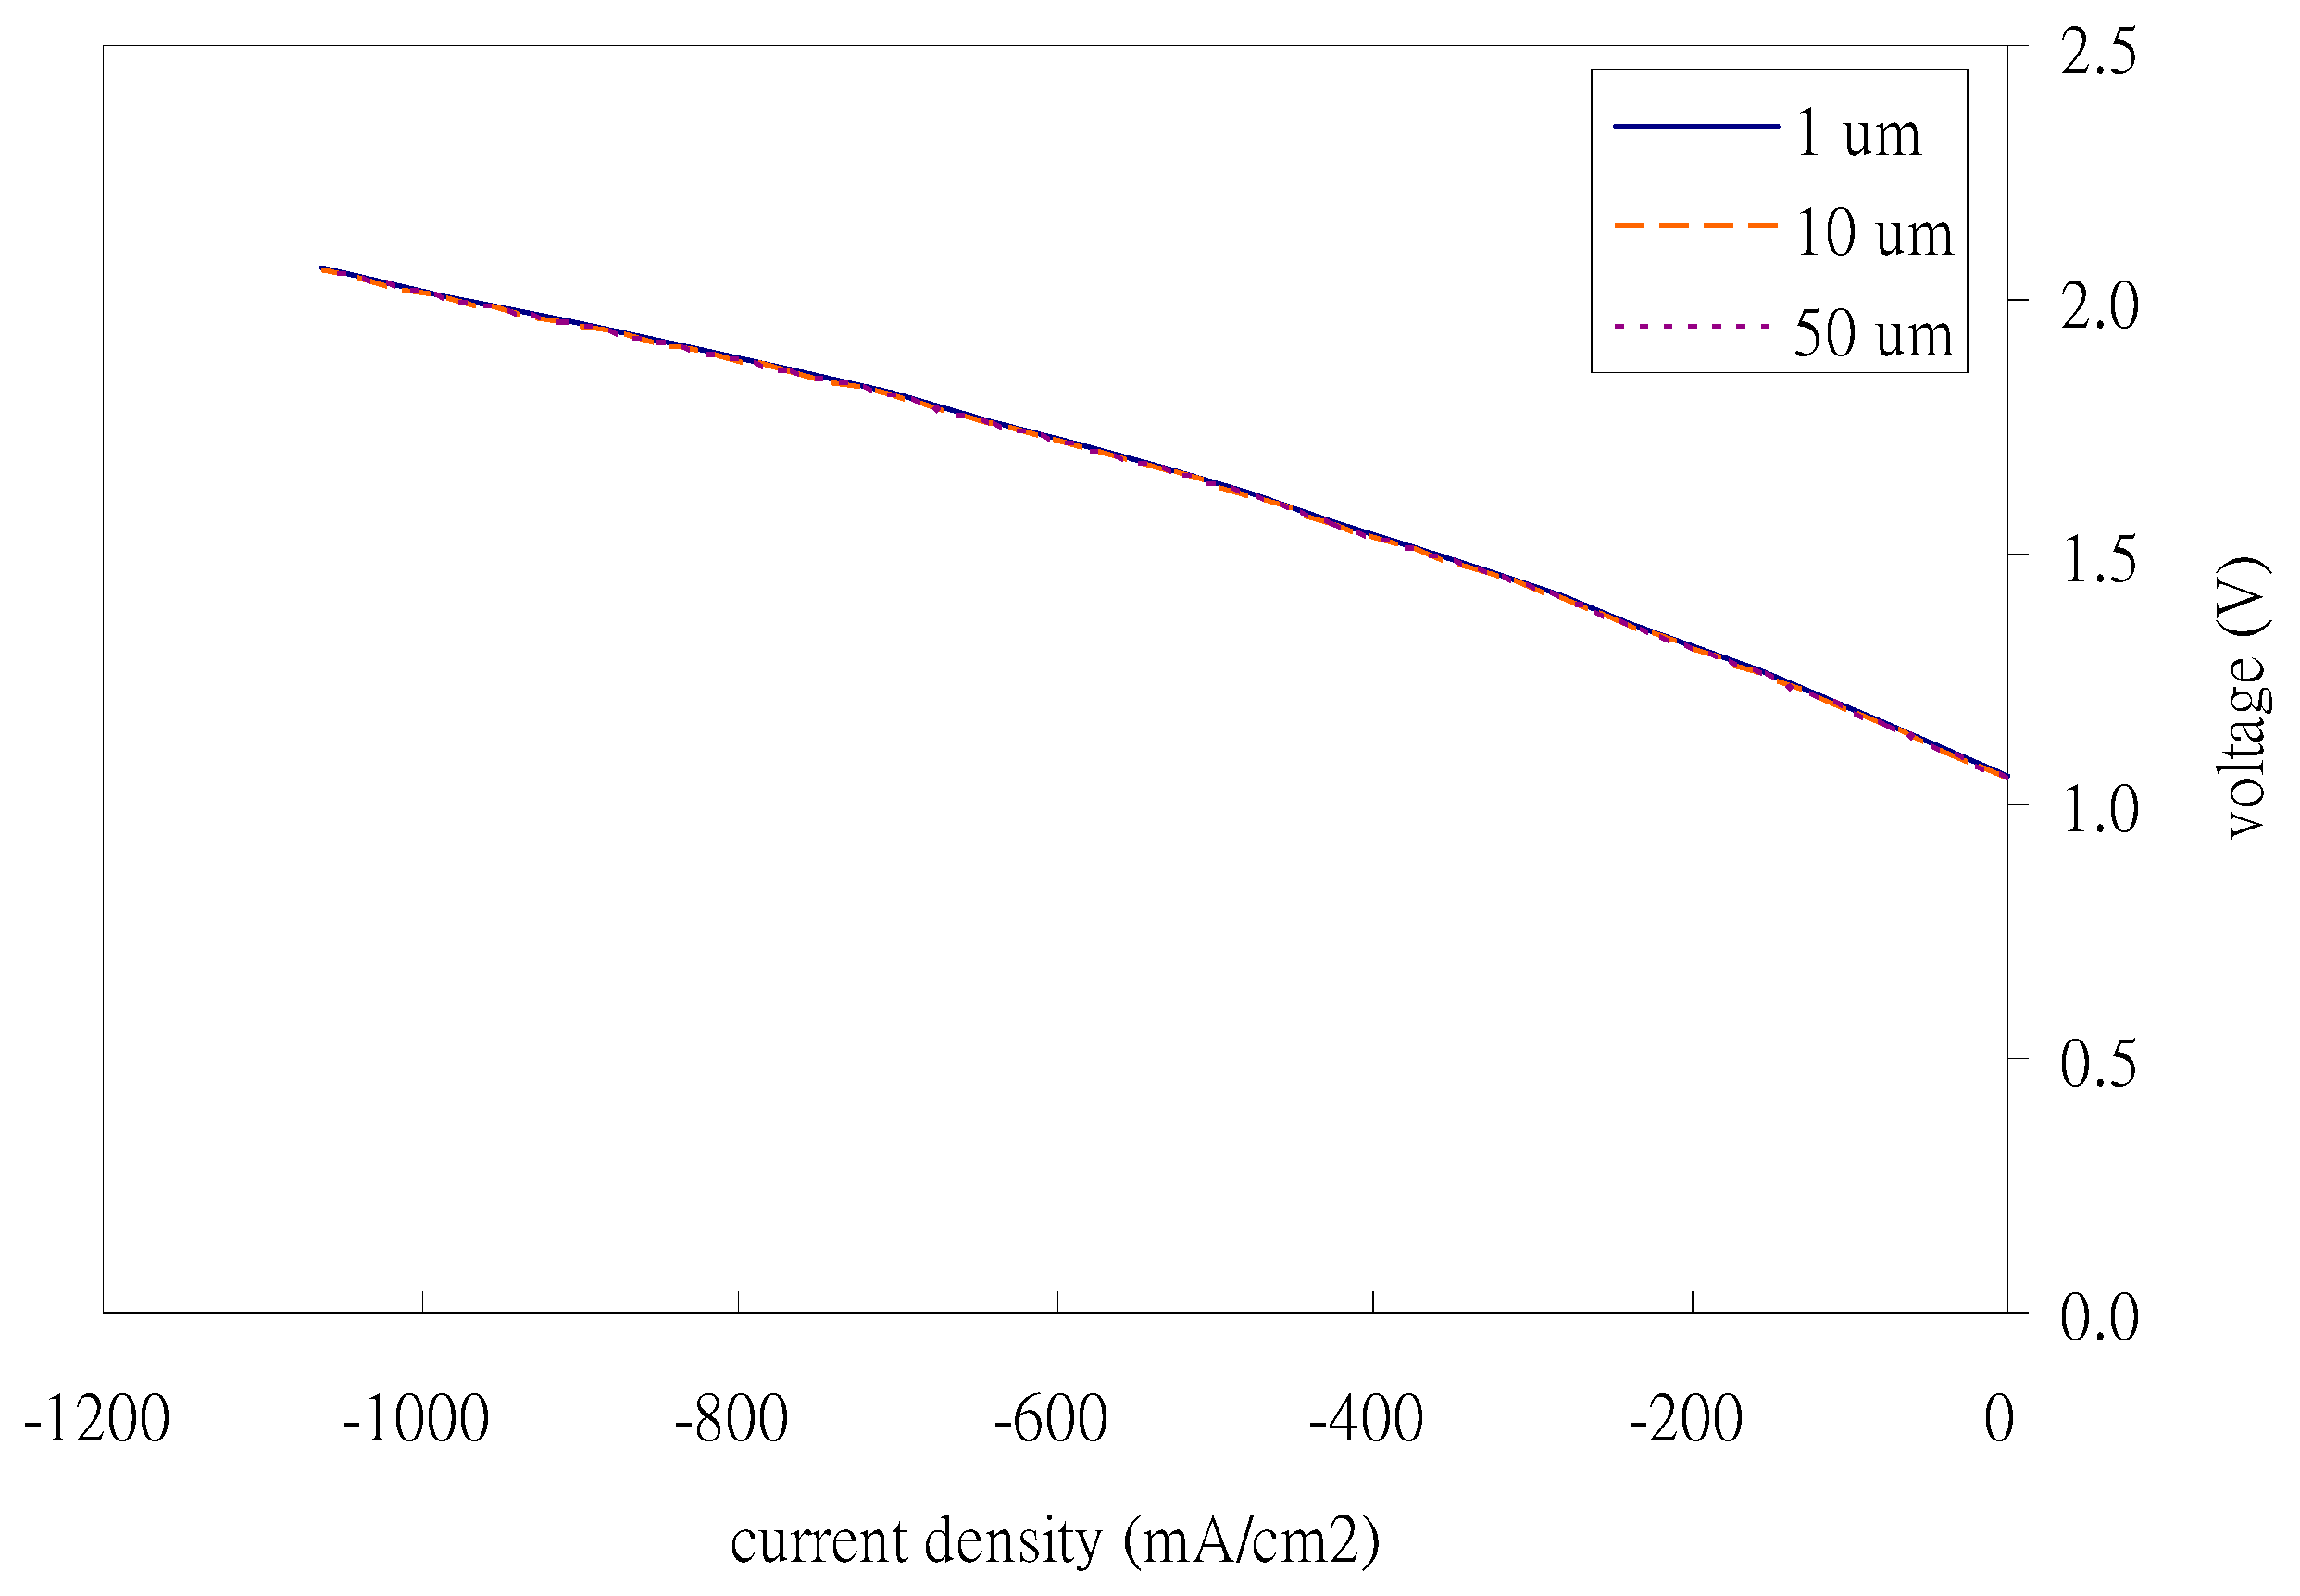
The effect of the average pore size on the performance of the fuel cell is not significant at the fuel electrode (
Figure 10), but at the air electrode, it will not be noticeable until the average pore size is increased to 50 μm.
Figure 11 is a diagram of the influence of air electrode permeability on the low energy of fuel cell power generation, from which it can be seen that the smaller the permeability, the worse the performance. This is because the decrease in permeability weakens some of the small quantities of gas transmitted through convection inside the electrode, which in turn reduces the performance.
Ni-YSZ/YSZ/LSM can be used at 850 °C, a fuel cell performance of 2.0 A/cm
2 (@0.6V), and 1.5 A/cm
2 (@1.3V); GE changes the air electrode materials: LSM, LSF, LSCF. The fuel cell performance obtained at 800 °C is 1.1 A/cm
2, 1.9 A/cm
2, 2.9 A/cm
2 (@0.6V), while the electrolytic performance is 0.9 A/cm
2, 1.2 A/cm
2, 1.6 A/cm
2 (@1.3V). The performance of LSF and LSCF is not only better than LSM, but also because of the ion conductivity is better than LSM, LSCF can run stably for a long time [
1].
That is, the characteristics of the air electrode (not the fuel electrode) materials are the important factors for the performance of solid oxide cells. The reasons are that a better conductivity and/or a more stable thermal stress resistance of the material will improve the effects of porosity and pore size on fuel cell performance.
In summary, quite differently to the SOEC mode, the effects of air electrode porosity and its average pore size cause the power generation trend to increase significantly in SOFC mode. Fuel electrode porosity and average pore size can be neglected or can be limited (to a 1 μm average pore size and a fuel electrode porosity of 0.2), which is the same as in the hydrogen mode. The other effect is that the smaller the permeability, the worse the performance. That is, the material of the air electrode must be focused on higher permeability, but the strength of the air electrode and its toleration of corrosion must be retained for the increase in porosity and average pore size to account for some of the operating temperature and the water vapor inlet concentration. In conclusion, the optimal parameters (the air electrode porosity and the average pore size) must be further investigated for certain materials (of fixed permeability) for air electrodes at certain (maximum) operating temperatures and water vapor inlet concentrations.
The simulation in this study only catches the trends of the operational parameters. In a practical case, they may be limited by the material of the electrodes in terms of their temperature resistance, abrasion resistance, and strength.
6. Conclusions
The effects of air electrode porosity and average pore size are significant especially for the SOFC mode. The fuel electrode porosity and the average pore size can be neglected or can be limited according to the situation. It is also worth noting that the temperature distributions of the air electrode and fuel electrode are actually different. This difference in the temperature distribution can be explained by the thermal response of the air electrode and fuel electrode.
It seems that the better the performance, the higher the temperature. However, it must be noted that the temperature gradient will also increase with the increase in the operating temperature. An excessive temperature gradient will cause the problem of thermal expansion matching. Therefore, other material factors must be considered accordingly to improve the operating temperature.
The contribution of this paper is to identify that, quite differently to the hydrogen production mode, the effects of air electrode porosity and average pore size cause the power generation trend to increase significantly for the SOFC mode. That is, the material of the air electrode must be focused on higher permeability, but the strength of the air electrode and its toleration of corrosion must be retained for the increase in porosity and average pore size to account for some of the operating temperature and the water vapor inlet concentration.
In this simulation study, the trends of the recommended optimal parameters are the operating temperature (1273 K), the water vapor inlet concentration (100%), the electrode porosity, and the average pore size of the air electrode have a limited effect on the performance in the SOEC mode.
For the SOFC mode, the trends of the recommended optimal parameters of the maximum electrode porosity of the air electrode approach 0.6, with the average pore size being as smaller as possible, approaching 50 μm.
In a practical case, for a certain material (of fixed permeability) of air electrode at a certain (maximum) operating temperature and water vapor inlet concentration, the trends of these optimal parameters may be similar but must be investigated accurately.


