Abstract
Mechanical failures in the operating stacks of solid oxide fuel cells (SOFCs) are frequently related to thermal stresses generated by a temperature gradient and its variation. In this study, a computational fluid dynamics (CFD) model is developed and further applied in full-size SOFC stacks, which are fully coupled and implemented for analysis of heat flow electrochemical phenomena, aiming to predict thermal stress distribution. The primary object of the present investigation is to explore features and characteristics of the thermal stress influenced by electrochemical reactions and various transport processes within the stacks. It is revealed that the volume ratio of the higher thermal stress region differs nearly 30% for different stack flow configurations; the highest probability of potential failure appears in the cell cathodes; the more cells applied in the stack, the greater the difference in the predicted temperature/thermal stress between the cells; the counter-flow stack performs the best in terms of output power, but the predicted thermal stress is also higher; the cross-flow stack exhibits the lowest thermal stress and a lower output power; and although the temperature and thermal stress distributions are similar, the differences between the unit cells are bigger in the longer stacks than those predicted for shorter stacks. The findings from this study may provide a useful guide for assessing the thermal behavior and impact on SOFC performance.
1. Introduction
As a high-temperature (600–800 °C) power generation device, a solid oxide fuel cell (SOFC) can directly convert chemical energy stored in hydrocarbon fuel gases into electrical energy with high conversion efficiency and the minimal emission of pollutants [1]. However, its short working life has limited its commercial applications. According to reports, coking, poisoning, particle coarsening/agglomeration, and stress generated in the fuel electrodes are the primary problems leading to SOFC performance degradation. The stresses involved in SOFCs consist of the following: the residual stress/strain caused by the manufacturing process (including redox strain), thermal stress/strain, high-temperature creep strain during long-term operation, and chemical expansion coupled with electrochemical–mechanical effects [2]. The thermal stresses due to high temperatures and mismatching between the coefficients of thermal expansion (CTEs) of the electrode materials during the stable operation of SOFC stacks are significant contributors to the cracks in the electrodes [3]. These cracks can result in component breakdown and thus affect the durability of the stack. Therefore, a reasonable thermal stress distribution is essential to enhance stability and prolong the operating life of the stacks [4]. Currently, most numerical studies of the thermal stresses adopt the method of one-way coupling, wherein the temperature field obtained from multiple physical fields is used to simulate the thermal stress field. Given that current experimental studies take a longer time and have a complex equipment arrangement which is often difficult to implement, numerical simulation methods have become important for analyzing the thermal stresses in SOFC stacks [5].
A few of the published work have been conducted for various aspects of SOFCs in general, from micro- to macroscopic scales using various numerical analysis methods, as outlined in [6]. Some of these studies focus on SOFC stack operating processes and overall performance including the thermal stress distribution but mainly take the looped-material components or even assume the positive/electrolyte/negative (PEN) as a grouped cell component [7]. Others have looked at single channels, ignoring the effects of constraints on other SOFC components (such as seals, metal frames, etc.) [8]. It is also a fact that the thermal stress distribution in SOFC stacks depends not only on the operational conditions of the cells, encompassing the gas properties, but also on the overall stack designs/configurations [9]. It is therefore essential to consider all details of the cell components included in the stacks (particularly industrial-sized ones) in a systematic manner (the so-called full-size stack model and simulation method).
Lin et al. [7] first considered the complete stack model by coupling computational fluid dynamics (CFD) or the finite element method (FEM). They investigated the effects of stack support conditions, the viscosity of glass ceramic sealants, the temperature gradients, and the mismatched coefficients of thermal expansion (CTEs) between the components on seal performance. Nakajo et al. [10] employed a similar approach to evaluate the stress and contact pressure distribution of various components in the single-cell stack model. Lin [11] developed a three-dimensional model of the SOFC stack using a commercial finite element analysis (FEA) tool to study the effect of external loads on the thermal stress distribution of planar designed SOFC stacks with compression seal designs. Zheng et al. [12] developed an SOFC stack model using a multi-physics coupling method to evaluate the effects of different flow patterns, manifold configurations, electrolyte layer thicknesses, and sealant materials on the thermal stress distribution of planar SOFC stacks. Xu et al. [13] established a two-dimensional mathematical model to study the thermal response of tubular methanol-fueled SOFCs. The results indicate that the harmful temperature gradients caused by high current density cannot be resolved by excessive air supply. The key to effectively control the current density is to optimize the operating potential.
In simulating thermal stresses in large-scale SOFC stacks, the simplification of multi-physics fields or geometric structures is mainly employed. As for simplifying multi-physics fields, Peksen et al. [14] studied a 36-cell stack to determine the distribution of thermal stress, deformation degree, and transient stress response without considering the heat generated by the actual electrochemical reactions and electron transfer process within the stack components. Yuan et al. [15] developed a Fortran language code to study the impact of various air intake configurations on the performance as well as the thermal stress of a 20-cell stack in cross-flow mode, and it was revealed that changing the air flow direction significantly reduced the thermal strain while leaving the power output of the SOFC stacks unaffected. However, the coupling effect of the electrochemical reactions and transport process with the temperature field was simplified, which does not consider the structural details of the stack manifolds and seals, etc. Wang et al. [16] studied the influence of different fuel cycling modes on the maximum temperature of the SOFC system, and the application of heat exchangers can effectively improve the system’s electrical efficiency.
In terms of simplifying geometric structures, the homogenization method has achieved certain research outcomes. For different research objectives, the PEN components, channels, and ribs, or even the entire unit cell, can be assumed to be a single entity. Navasa et al. [17] established a 3D SOFC stack model consisting of 100 unit cells based on the homogenization method and the volume averaging technique, significantly reducing computational time while ensuring computational accuracy. Meanwhile, a detailed distribution of internal thermal stresses can be retrieved by sub-models. Using the same approach, Rizvandi [18] investigated the effects of different operating parameters and structures on the thermal stress distribution in the stack. Miao et al. [19] conducted the first study of the localized fracture phenomena at the full-scale stack level by employing fracture mechanics to examine the localized mechanical failures. This model can be utilized for optimizing stack design and operating conditions, aiming for reducing the risk of localized mechanical ruptures and enhancing stack reliability.
In summary, the analysis of the thermal stresses generated during the operation of SOFCs has been mainly conducted through numerical simulation. However, there are several key issues that remain unresolved:
- (1)
- Only gas flow within the stack is considered, aiming to optimize the stack structure and to improve gas distribution uniformity. On the other hand, only the average temperature field is considered in some cases, aiming to explore the distribution of temperature or stress distribution within the stack, without accounting for the electrochemical reactions.
- (2)
- Only the electrochemical reactions are considered but simplified by reducing the three-dimensional electrochemical reactions occurring within the electrodes into two-dimensional ones.
- (3)
- The full-size of the stack and the coupling of the multi-physics processes are considered, yet the stack size is relatively small and cannot fully reflect the characteristics appearing inside the industrial-sized stacks.
- (4)
- Large-sized stacks and multi-physics coupling are all considered, while the real geometric details may be omitted.
These simplifications significantly reduce the computational time and improve the convergence performance of the developed models, but they may introduce some uncertainties in the simulation results and even incorrect conclusions. In reality, the structures of large-sized SOFC stacks are complex, and the distribution of the physical parameters is very uneven. Therefore, it is necessary to establish an SOFC model that can reflect the actual geometric structure and details of the stack by coupling with multi-physics transport processes, aiming to identify the main contributions of the operating/configuration conditions, as well as their effects on the thermal stress distribution.
Based on the discussion above, it is essential to develop the suitable models and simulation methods for evaluating the internal thermal stress and its distribution and identifying stack regions and locations with too big thermal stresses, as well as for investigating the thermal stress difference between the cell layers. For this investigation, a mathematical framework is formulated and applied for capturing the thermal stresses in a full-size SOFC stack assembly consisting of 10 cells including all components and structural details.
The developed model uses the finite element method (FEM) to address all coupled governing equations for mass, momentum, charge, and heat transport coupled with the electrochemical reactions that occur in each single cells. The computational domain includes all components such as the PEN components, the inlet/outlet manifolds, the seals, the frames, and the current collectors, etc. To verify the precision of the model, the predicted results of the model will be compared with the experimental data.
Creative modeling techniques are employed to implement large-scale fully coupled multi-physics modeling without simplifying geometric details and physical processes, aiming to assess the impact on the thermal stress. The predicted results are the identified regions of the highest thermal stress generated during the steady-state operation of hydrogen-fueled SOFC stacks. Furthermore, the thermal stress differences between the unit cells in the stack are analyzed and compared with the predicted results for a shorter stack to understand the influence of stack size. Predicted failure probabilities under the aforementioned operating conditions are provided, aiming to offer new insights on identifying the risk levels of potential component failures and improving the design of SOFC stacks.
2. Modeling Methods and Validation
This section details the creation of a linked multi-physics process model operating under steady-state conditions. The model comprises the geometric model, governing equations, and boundary conditions. Additionally, the subsequent assumptions are employed in this study:
- (1)
- The gases in the model flow laminarly (based on the estimated Reynolds number) are ideal and incompressible.
- (2)
- The thermal radiation inside the SOFC is neglected.
- (3)
- Homogeneity is exhibited by the porous electrode.
- (4)
- The constant temperature of 800 °C is maintained by the external ambient.
- (5)
- The anode, electrolyte layer, and cathode materials are isotropic and linear elastic materials.
- (6)
- The thermophysical characteristics of all materials composing the SOFC stack remain constant, irrespective of the local temperature.
- (7)
- The anode, cathode, and electrolyte layer interfaces, along with the connecting body and sealing material, form a continuous structure that permits collective deformation without fracturing.
- (8)
- The external loads imposed during the preparation and assembly of the stack and the residual stresses in the material are negligible.
2.1. Stack Parameters and Geometric Model
The investigated structure of the SOFC stack is shown in Figure 1. The air flows into/out from the stack through the inlet/outlet manifolds, while the fuel gas is isolated from the air by the seals. Each unit cell includes a metal bipolar plate, anode, electrolyte layer, cathode, and seal.
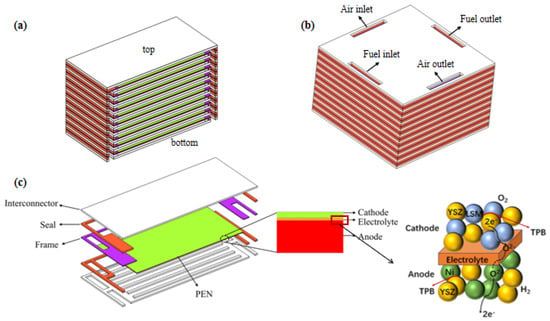
Figure 1.
Geometry of modeled SOFC stack with (a) co- and count- flow mode; (b) cross-flow mode; (c) its unit cell with enlarged PEN and active region.
From a vertical perspective, the first layer of the cells at the bottom is designated as the base unit cell, with the number of the unit cells gradually increased upward, and the final cell is designated as the top one. For the co-/counter-flow configuration of the stack, based on the symmetry characteristics of the stack physical field as well as its structure, only half of the stack geometry is included with the middle plane designated as the symmetry; while for the cross-flow arrangement of the stack, the complete stack geometry is included. The cell dimensions are 91 × 91 mm2, and the number of flow channels in the stack is 13, with a width ratio of 5:2 between the flow channels and the ribs [20], as shown in Table 1.

Table 1.
Geometric characteristics of the modeled cell.
2.2. Governing Equations
2.2.1. Electrochemical Model
The controlling equation of the ion/electron transport process in the porous electrode is as follows:
where i, σ, and ϕ represent the resulted current density, electron/ionic conductivity, and potential. The subscripts i and e represent the ions and electrons, while ▽ represents the gradient operators.
The stack’s operating voltage is given by
where E is the operating voltage, and EOCV is the open-circuit voltage. Inside the cell, ηact, ηohm, and ηconc denote the activation polarization, ohmic polarization, and concentration polarization.
The open-circuit voltage is typically determined using the standard electrode potential, gas constant R, temperature T, pressure p, the Faraday constant, and the concentration of substance i [21]:
where E0 is solely dependent on the temperature and remains unaffected by changes in pressure and gas concentration. This value can be computed using the subsequent equation:
In this paper, the electrode reaction kinetics is elucidated through the Butler–Volmer equation. This equation delineates the connection between activation polarization and local current density, as represented by the expressions for the anode and cathode provided below [22]:
where αa and αc denote the electron transfer coefficients at the anode and the cathode, the parameter n represents the quantity of electrons transferred by 1 mole of the gas reactants engaged in the electrochemical reactions, Av represents the effective specific surface area active within the porous electrodes, the superscripts a and c represent the anode and cathode, and the concentration of the gas component i is denoted by ci. i0 is the exchange current density, as expressed by the following equation [23]:
The pre-exponential factor for the electrodes, Ai, and the activation energy of the reaction, Ea, are represented by the following:
Based on Ohm’s Law, the ohmic polarization of a SOFC stack can be described as
where h is the thickness, e is the electrolyte layer, and int is the internal connector.
The SOFC anode and cathode activation polarization can be found by the subsequent equation:
where x is the molar fraction.
Temperature-dependent electrode conductivity is expressed as follows:
The electronic conductivity of the interconnect material is 8.7 × 10⁵ S·m−1.
Adjusting the conductivity of electrons/ions is crucial given the influence of the porous microstructure of the electrodes. The specific correction formula used is as follows:
where θ represents the porosity, τ denotes the tortuosity, and Veff signifies the percentage of each material per unit volume. Table 2 lists the parameters involved in the concerned electrochemical reactions [24].

Table 2.
Parameters related to electrochemical reactions.
2.2.2. Gas Flow and Momentum Equations
Based on the assumption of laminar gas flow, the continuity equation in the gas flow channels is as stated below [25]:
where ρ denotes the density of the mixed gases, and v denotes the velocity vector.
The momentum conservation in the porous electrodes is depicted by adjusting the typically employed Navier–Stokes equation with the inclusion of a Darcy coefficient that considers the porosity of the electrodes:
Amongst these, k signifies the permeability, whereas μ signifies the dynamic viscosity of the mixed gases.
The density and dynamic viscosity of the mixed gases can be acquired by the following:
where Mi denotes the molar mass of the substance. Smass stands for the mass source term composed of the consumption and production of the gas components during the electrochemical reactions. The mass source terms inside the porous electrode of the anode and cathode are formulated as follows:
2.2.3. Gas Species Transport Equation
The electrochemical reactions within the SOFC stack take place at the triple-phase boundary (TPB) at the interface between the porous electrode and the electrolyte layer. The conservation equation for every gas species can be formulated as follows [26]:
where ji is the mass flow rate, computed by
The effective diffusion coefficient of the gas species i is represented by [26].
2.2.4. Heat Transfer Equation
The universal energy conservation equation is implemented as follows [12]:
which describes the balance of energy in a system, accounting for various forms of energy and their interconversion within the system. Cp is the specific heat capacity of the mixed gases, λeff denotes the effective thermal conductivity, and Q denotes the heat source term inside the SOFC stack. What is determined is the thermal conductivity effectiveness of the porous electrodes [12]:
where λs and λg denote the thermal conductivity of the solid and gas.
The coefficients employed in the governing equations discussed above are detailed in Table 3 [27].

Table 3.
Physical parameters of SOFC stack components.
2.2.5. Thermal Stress–Strain Relation and Failure Probability Analysis Method
Anticipated to be minimal is the resulting thermal stress-induced distortion, presuming all solid materials are linearly elastic. The stress can be articulated as follows [12]:
where σ represents the stress tensor, D stands for the elastic matrix, εel denotes the elastic strain, and σ0 is the initial stress.
The total strain comprises two components as follows:
where εth is the thermal strain.
The elastic strain can be acquired from [28]:
where is the gradient of the displacement field , representing the spatial variation in displacements within the material. is the transpose of the gradient of the displacement field.
The thermal strain is derived from
where α is CTE, and T denotes the temperature change.
where Tref represents the state of the zero thermal stress adopted at 800 °C [29].
Commonly specified for the elastic matrix of an isotropic material is the following [12]:
where Y is Young’s modulus, and v is the Poisson ratio.
The PEN structure of SOFC stacks is composed of brittle ceramic materials, exhibiting very apparent brittle characteristics. The typical cermet electrodes with potential defects may appear; hence Weibull statistics are commonly used to evaluate SOFC failure probabilities. It is worth noting that this method does not consider the variation in the defects over time. In the Weibull method, the failure probability of the brittle materials under multi-axial stress is determined as follows [30]:
where V is the volume of the brittle material, σw is the Weibull strength of the brittle material, m is the Weibull modulus, and V0 is the reference volume obtained by the following formula [31]:
where σmax represents the maximum principal stress of the brittle materials.
The detailed parameters needed for the current study are outlined in Table 4 [32].

Table 4.
Weibull parameters for the SOFC materials utilized in the current study.
2.3. Effective Properties of Porous Composite Materials
According to Chin-Lung-Hsieh’s model [33], the maximum and minimum limits of the material properties of Ni and YSZ after mixing are determined by both the material properties and respective volume fractions, while the average of the maximum and minimum limits assumed to be the mechanical properties is applied to determine Young’s modulus, the Poisson ratio, and the CTE of the electrode materials under different mixing ratios.
The equivalent properties of the porous composite electrodes are related to not only the constituent materials but also the porosity, which is a key factor affecting their properties. It is revealed that the influence of the porosity on the CTE can be ignored [34], and the relationship of Young’s modulus and the Poisson ratio with the porosity can be expressed as follows [35]:
When the porosity is 0.3, the estimated mechanical parameters of the electrode materials and other components are shown in Table 5 [36].

Table 5.
The parameters estimated in this study.
2.4. Boundary Conditions
This section provides the boundary conditions and physical parameters. The cathode, electrolyte layer, and anode are made of LSM, YSZ, and Ni/YSZ materials, respectively. LSM is renowned for its high electronic conductivity and excellent catalytic properties, which are crucial for the oxygen reduction reaction on the cathode; YSZ is known for its high oxygen ion conductivity at high temperatures, which is essential for the operation of SOFCs; and Ni/YSZ exhibits good conductivity and high porosity, allowing for the effective diffusion and reaction of fuel gases, making it a suitable material for SOFCs.
The connecting plate and sealing material are made of stainless steel and Flexitallic 866, respectively. Stainless steel is suitable for use as the interconnect material in SOFCs due to its excellent high-temperature resistance, corrosion resistance, and mechanical strength. Flexitallic 866 is suitable for use as the sealing material in SOFCs due to its excellent sealing performance and high-temperature resistance.
As shown in Table 6, the fuel consists of 97% hydrogen and 3% water, with an intake flow rate of 1500 sccm. The gas inflow temperature is 800 °C, and the air intake flow rate is 4500 sccm. The initial SOFC stack temperature after preheating is also set at 800 °C. The stack’s upper and lower surfaces are assumed to be adiabatic, while the remaining surfaces experience natural convection and radiative heat transfer, with a convective heat transfer coefficient of 2 W m−2 K−1 [20] and surface emissivity of 0.3 [37], exchanging heat with the surroundings. For the electron and ion potential field, the boundary conditions are grounded (0 V) at the bottom of the stack and N × 0.7 V at the top, where N represents the quantity of cell layers.

Table 6.
Boundary conditions of SOFC stack model.
2.5. Grid Arrangement and Model Validation
The SOFC stack consists of multiple repeating SOFC unit cells, so the grid detail is exampled by one of the unit cells. In this study, the PEN is divided into three layers, as shown in Figure 2. As shown in Table 7, a coarser mesh is used for the interconnectors; the metal frame and the seals are solely engaged in heat transfer, so the meshing is also coarser, while the PEN, the ribs, and the fluid channels involve the multi-physics parameters, e.g., heat and mass transfer with a large temperature gradient, and a dense meshing is required.
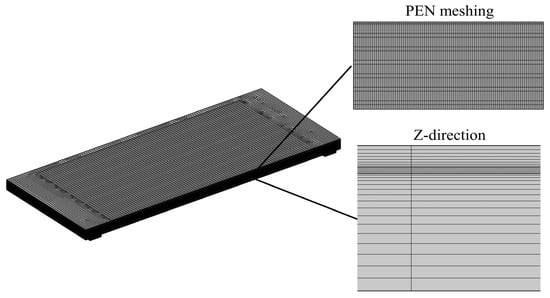
Figure 2.
Schematic diagram of the grid and meshing in the exampled SOFC unit cell.

Table 7.
Grid type of SOFC stack.
The grid independence is assessed in the x, y, and z directions of each cell PEN in terms of the highest temperature at the top and bottom cells and at the midpoint of the centerline. When the number of the grids is doubled (i.e., increased to 6.01 × 10⁵), the resulting variation in the highest temperatures of the three points is below 1%, as shown in Figure 3a, suggesting that this grid number (6.01 × 10⁵) is adequate for achieving a solution independent of the grid.
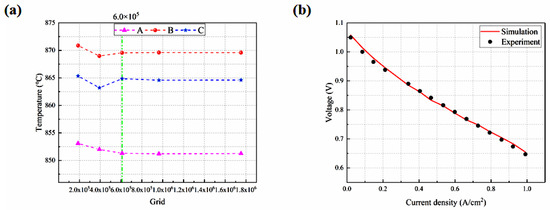
Figure 3.
(a) Grid independence testing; (b) predicted I-V characteristics compared with the experimental one.
Under the same conditions, the experimental data [27] are compared with the predicted results. The root mean square error (i.e., RMSE) is around 1%, as defined in Equation (40). As depicted in Figure 3b, the modeling outcomes closely match the empirical data.
3. Results and Discussion
The distribution of the gas flow, temperature, and thermal stress is predicted and analyzed for the studied 10-cell stack under different gas flow configurations (i.e., the co-/counter-/cross-flow stack design), while the difference in the temperature and thermal stress between the cell layers is outlined and discussed. The stack power generation, temperature distribution, and stress distribution of the 3-cell and 10-cell stacks arranged in co-flow mode are compared, aiming to identify the stack size effect. Finally, the failure probabilities of the electrodes and the stack are calculated and presented for all the above operating conditions.
3.1. Effect of Flow Arrangement and Configurations
The prediction of the stack parameters is intricately linked to the electrochemical reaction rates and temperature, subsequently influencing the distribution of thermal stress. Understanding these relationships is crucial for optimizing stack performance and durability.
Figure 4 presents the gas distribution within the stack across various flow arrangements. The observations indicate that the gas concentration distribution in each channel of the stack is highly consistent for both H2 and O2 under the co- and counter-flow cases, while it becomes uneven due to the flow pattern particularity in the cross-flow case. It is also true that the consumption of hydrogen is greater in the counter-flow stack. In the co-flow stack, as a result of electrochemical reactions, hydrogen diminishes in the direction of gas flow, experiencing a sharp decline in the initial portion of the H2/O2 flow channels, followed by a more gradual decline in the latter portion of the channels.
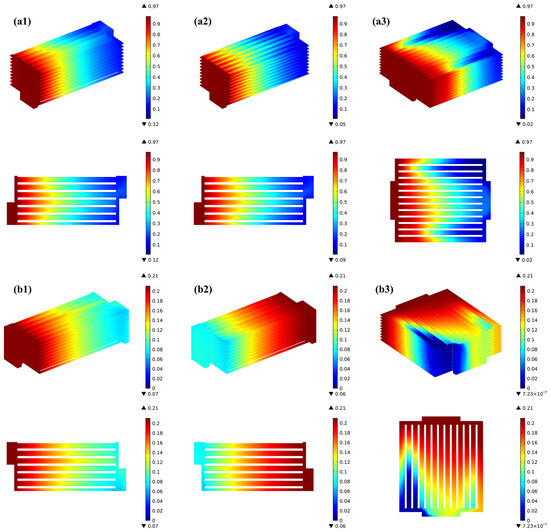
Figure 4.
Prediction of various gas distribution for (a1) co-flow H2, (a2) counter-flow H2, (a3) cross-flow H2, (b1) co-flow O2, (b2) counter-flow O2, (b3) cross-flow O2.
For the counter-flow stack, the hydrogen distribution matches that of the co-flow case, but due to oxygen flowing in the opposite direction, the rate of its flow is three times greater than that of hydrogen. Oxygen experiences rapid depletion in the region corresponding to the hydrogen inlet area. In the cross-flow mode, the oxygen in the air is rapidly consumed near the hydrogen inlet region due to electrochemical reactions, hydrogen gradually decreases in the direction of flow, but its distribution is relatively uneven, while the oxygen concentration is higher due to the depletion of hydrogen in the channels on the opposite side near the hydrogen outlet region.
The distribution of the gases between different cells or within different flow channels in the same cell is commonly assessed by the normalized mass flow, which is calculated as shown below [38]:
The mass flow rate at cell i is denoted as mL,i.
Firstly, the gas distribution uniformity in the flow channels is investigated by selecting cells 1, 5, and 10 in the 10-cell stack (representing the bottom, the middle, and the top cell) in the co-flow mode, as shown in Figure 5. It was found that the gas distribution in the flow channels between different cells was similar with a minor difference. Based on this finding, a comparison of the hydrogen distribution within the flow channels in the three flow configurated stacks can be carried out by arbitrarily selecting a specific cell. In this paper, the first cell (i.e., the bottom one) is taken as an example, and it is found that the hydrogen distribution within each channel of the initial cell is analogous for the co- and counter-flow modes, owing to the comparable stack configuration, while a more uniform hydrogen distribution is predicted within the channels for the cross-flow mode due to the longer distance between the air inlet and the hydrogen inlet manifolds. In this case, less influence on each other can be expected, while the longer transfer distance makes the flow rate of hydrogen in both side channels (i.e., channel 1 and channel 13) smaller, which may further affect the stack performance as highlighted in the following sections.
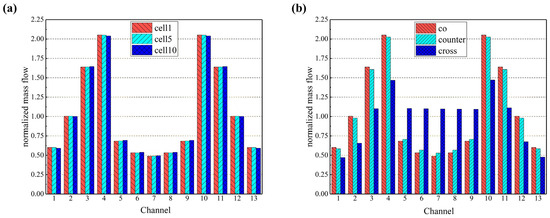
Figure 5.
Normalized mass flow rates predicted for (a) different cells in the co-flow stack; (b) first layer in co-/counter-/cross-flow stacks.
The generated current density for the three flow stacks is 0.639 Acm−2, 0.656 Acm−2, and 0.560 Acm−2, respectively. This indicates that for the same operating conditions, the counter-current flow stack exhibits superior power generation capabilities, which aligns with the forecasted hydrogen utilization, while the cross-flow mode has the worst power generation performance.
The cloud plot of the hydrogen concentration distribution for all three flow stacks shows that the hydrogen concentration is lower in the flow channels close to the outlet region. If one wishes to use the assumptions (e.g., the average current density or uniform gas flow) to calculate the stack gas distribution and temperature field distribution, a certain pre-assessment procedure is required and should be conducted because the distribution of current density within the stack is not consistently uniform. Overall, only the coupled multi-physics field modeling may reflect or predict the realistic conditions of the multi-physics parameters distributed within the long stacks, such as in this study.
Figure 6 illustrates the temperature distribution of various flow stack configurations. There are conspicuous differences in temperature distribution under different flow conditions. Temperatures are focused at the central region of the stack and decrease progressively towards the periphery. In the co-flow stack configuration, the maximum temperature reaches 895 °C, with the high-temperature region situated at the center of the stack. This is because the electrochemical reactions in the stack mainly occur against the inlet region, and this heat is further carried to the center of the stack through the flowing of the generated products. The highest temperature of the counter-flow stack is 905 °C, which is the highest within the three flow modes studied. The predicted high-temperature region primarily resides within the hydrogen inlet area, attributable to the air flow rate being three times greater than that of hydrogen, and the specific heat capacity of the products on the air side is also greater than that on the hydrogen side, so most of the heat is carried forward to the hydrogen inlet, forming a high-temperature zone; the highest temperature of the cross-flow mode stack is 896 °C, and the high-temperature zone is primarily situated in the central region near the air outlet, which is also caused by the gas flow effect. The flow direction of the gases, the electrochemical exotherm, and the thermal coupling between the fluid and the solid ultimately determine the temperature field distribution of the SOFC stack.

Figure 6.
Temperature distribution predicted for (a) co-, (b) counter-, and (c) cross-flow stack.
Due to the difference in the temperature field predicted for various flow arrangements, the thermal stress distributed in the stacks also differs considerably. The distribution of the thermal stresses at the electrodes for the three flow cases (i.e., co-/counter-/cross-flow stack configurations) is shown in Figure 7(a1–a3). The predicted findings, regardless of the flow arrangements, reveal that the electrolyte layer experiences a significantly higher thermal stress than the anode and cathode, while the thermal stress distribution trend is basically similar in all three layers. In the co-flow mode, the thermal stresses are mainly concentrated at the edges in the width direction, with the inlet and outlet regions being slightly higher than the intermediate regions, while in the counter-flow mode, the stresses are not only concentrated at the edges in the width direction but also in the air outlet (i.e., the hydrogen inlet) region. On the other hand, in the cross-flow mode, the thermal stresses are primarily focused in the hydrogen inlet area, with the thermal stresses below the ribs of the flow channels being greater than those below the gas channels, which are similar to those found in the co- and counter-flow modes. The primary reasons for this are the thermal expansion of the ribs and the pre-compression of the cell functional layers of the stack, resulting in a concentration of the mechanical stresses in this region. The maximum thermal stresses in the electrolyte layer are 138 MPa, 142 MPa, and 146 MPa, respectively. In the anode, they are 32 MPa, 33 MPa, and 34 MPa, respectively. In the cathode, they are 22 MPa, 24 MPa, and 25 MPa, respectively. So the maximum thermal stress in all three flow configurations occurs in the electrolyte layer.
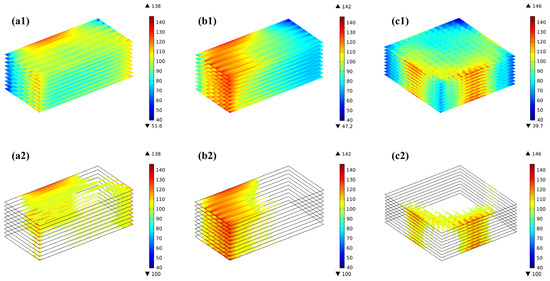
Figure 7.
First principal stress distribution and the region with the first principal stress greater than 100 MPa for (a1,a2) co-, (b1,b2) counter-, (c1,c2) cross-stack.
The temperature distribution cloud is shown in Figure 6. A comprehensive analysis shows that the highest thermal stress distribution in the electrodes does not coincide exactly with that of the highest temperature. For instance, the highest temperature is predicted in the center region of the stack close to the hydrogen inlet, while the maximum thermal stress is mainly concentrated close to the edge of the electrode width close to the hydrogen inlet and air outlet regions. In other words, the formation of the thermal stresses is not entirely determined by the highest temperature. Further analysis should be carried out to correlate the highest thermal stress with the highest temperature and the temperature gradient under various stacks.
The concept of high stress regions is introduced in this study, as discussed below, aiming to provide both qualitative and quantitative analyses of the thermal stress-affecting factors. Figure 7(a2–c2) presents the regions where the thermal stress in the electrolyte layer exceeds 100 MPa (hereafter, the high thermal stress region or HTSR). The reason for choosing 100 MPa as the basis for analysis is mainly based on two points: first, as shown in Table 8, if 110 MPa is chosen as the analysis basis, the volume proportions of the thermal stress regions within the electrolyte layer in the three flow patterns are 3.5%, 11.1%, and 1.5%, respectively; and if 120 MPa is chosen as the analysis basis, then the proportions are 0.3%, 2.4%, and 0.2%, respectively. These proportions are essentially consistent with the characteristics obtained for the high-stress region when selecting 100 MPa as the analysis basis. Second, considering the data for failure probability analysis, which will be discussed in the next section (i.e., the probability of failure). It is found that the distribution of the predicted HTSR is completely different for the three flow cases. Although the maximum thermal stresses are similar for the three flow stacks, the counter-flow mode is significantly subject to a bigger region with high thermal stress than both the co-flow and cross-flow modes, while in the cross-flow stack, the thermal stress is maximum in the air outlet region, owing to the increased flow rate of the air, which may carry more heat out through the air flowing.

Table 8.
Proportion of different flow patterns exceeding corresponding thermal stress regions.
The total volume of the electrolyte layers in the stack is 10 × 91 × 91 × 0.02 mm3. It is found that the volume ratio with the thermal stress on the electrolyte layers exceeding 100 MPa in the three flow stacks is 19.7%, 37.0%, and 7.1%, respectively, with the biggest ratio predicted for the counter-flow stack. In other words, the biggest and smallest ratio is about five times differed in the counter- and cross-flow modes. Clearly, as far as the flow arrangement is concerned, the thermal stress distribution is predominantly affected by the stack air flow configuration.
The SOFC stack in this study consists of 10 identical repeating unit cells, but the difference in the gas distribution and the electrochemical reaction rates between the cells will lead to different temperature and thermal stress distributions. The analysis of these differences between the cell layers will help to identify the weak stack components or regions with big thermal stress generated, which could potentially result in the component failures of the operating stacks.
The thermal stress on the electrolyte layers in the SOFC stack is much greater than that on the anodes and cathodes, so in this section, the electrolyte layer is taken as the main object for further evaluation. It should be noted that the first cell is specified near the inlet side and the 10th layer specified away from the inlet side.
In Figure 8a, it is found that the difference in the distribution of hydrogen uniformity across the cell layers of the stack is small for all three flow forms, with the flow rate of hydrogen monotonically decreasing from cell layer 1 to 10. Figure 8b shows the difference between the maximum and minimum temperatures predicted for the electrolyte layers in the cells. It is evident that the maximum temperature for the co-, counter- and cross-flow stacks is 895 °C, 905 °C and 896 °C, respectively, which is observed in cell 7; while the lowest temperatures is 847 °C, 844 °C and 835 °C, respectively, which is predicted in cell 1. The predicted maximum and minimum temperatures look to be similar in all cells, but the maximum temperature in the counter-flow stack is notably greater compared to that in the co- and cross-flow stacks, while the minimum temperature reaches its peak in the co-flow stack, then in the counter-flow stack, and is lowest in the cross-flow stack.
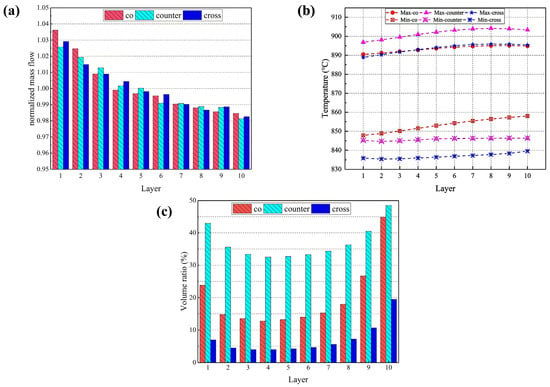
Figure 8.
(a) Normalized mass flow rates; (b) highest and the lowest temperature; and (c) volume ratio with thermal stress beyond 100 MPa predicted for individual cell electrolyte layers in different flow stacks.
Because the bottom cell has a high mass flow rate, the heat emitted from the electric stack is rapidly dissipated, while some of the heat carried away by the fluid is transferred to the upper cell layers, resulting in the highest temperature in the top cell. The gases in the cross-flow mode flow in the opposite direction, and the high-temperature gas in the exhaust manifold can transfer some of the heat to the gas in the inlet region to warm it up and speed up the electrochemical reaction. The electrochemical reaction rate in the co- and cross-flow modes is lower than that in the counter-flow, where the heat production is also lower. As depicted in Figure 6, the high-temperature region in the co-flow mode is at the center of the stack and radiates evenly around the stack, with heat gradually transferred upwards with the gas flow, resulting in a gradual rise in the minimum temperature; the high-temperature region in the cross-flow mode is biased towards the hydrogen inlet, while the minimum temperature is lower in the air inlet region due to the low hydrogen content and the slower electrochemical reaction.
Using 100 MPa as the cut-off value of the predicted thermal stress, the volume ratio of each electrolyte layer subjected to thermal stress beyond this value is calculated and compared with that in different stacks, as shown in Figure 8c. In all three flow cases, the volume ratio is larger in the 1st cell electrolyte layer and becomes gradually smaller and then increases until the maximum value is reached in the 10th cell layer. The volume ratios are 44.9%, 48.5%, and 19.5%, respectively. The counter-flow stack has the largest volume ratio, while the cross-flow stack has the smallest. Not only is the counter-flow stack subjected to the higher thermal stress, but the volume where the thermal stress in each electrolyte layer exceeds 100 MPa is also significantly larger than the other two modes. The cross-flow stack is subjected to the maximum thermal stress more than the co- and counter-flow modes, but the volume ratio where the stress in each cell layer exceeds 100 MPa is the smallest, indicating that most of the electrolyte layers are subjected to low thermal stress.
3.2. Failure Probability Analysis
The Weibull distribution is widely used in various fields, including electrical engineering, mechanical engineering, etc., for predicting the probability distribution of the potential faults, failures, and lifespans [39]. This indicates the broad applicability of the Weibull distribution, which can be used for different types of equipment and systems, including SOFCs. There are various parameter estimation methods available, which are particularly important for SOFCs operated for a long period with only limited failure data [40]. Moreover, even with a small sample size, the Weibull distribution can provide reliable parameter estimations and reliability assessments. However, there are also limitations, such as the uncertainty of the parameter estimation and a high dependence on data quality and initial settings [41]. Therefore, when applying the Weibull distribution for assessing SOFC failure probabilities, it is necessary to carefully select suitable parameter estimation methods and ensure the quality and integrity of the data.
The Weibull analysis is employed for predicting the probability of failure of the electrodes within the stack, as plotted in Figure 9a–d. The electrolyte layer in the counter-flow configuration is investigated in this section, followed by the volume ratio of the electrolyte layer at different thermal stresses. The corresponding contribution to the failure probability is defined as the likelihood of failure in the region above the specified thermal stress as a proportion of the total failure likelihood, as shown in Figure 9a. It is found that the contribution of the failure probability increases rapidly at the beginning and then grows slowly with an increase in the proportion of high thermal stress areas, which is different from the linear growth pattern of volume proportion of the high thermal stress areas. When the thermal stress is above 100 MPa, the volume share of the electrolyte layer is relatively small, accounting for 37%, but it contributes significantly to the failure probability, accounting for 78%. When the pressure is below 100 MPa, the volume share of the electrolyte layer is relatively large, accounting for 63%, but it contributes minimally to the failure probability, accounting for 22%. The probability of the component failure increases slowly. Therefore, 100 MPa is considered as the basis value of the thermal stress, as mentioned previously.
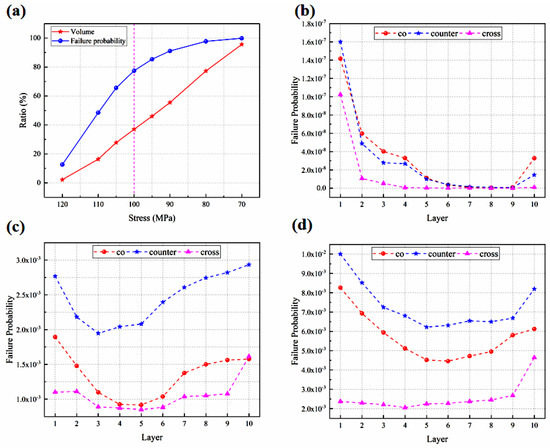
Figure 9.
Failure probability predicted for (a) volume ratio and probability of failure contribution; (b) anode; (c) electrolyte layer; (d) cathode. The stack designed with different flow configurations.
From the cell component perspective, the failure probability is greatest in the porous cathode, followed by the electrolyte layer and the porous anode, and the Weibull strength and modulus presented in Table 4 can account for this. A higher Weibull strength means a more stable material and vice versa. The dense electrolyte layers have the biggest Weibull strength and the second biggest Weibull modulus, which means that the electrolyte layer is extremely stable. While the porous cathode has the lowest Weibull strength and Weibull modulus, it is most probable to result in cracks.
This is due to the fact that the electrodes in the counter-flow stack mode are subjected to a higher thermal stress than those in the other flow stacks, not only in terms of the maximum thermal stress but also in terms of the volume ratio with higher thermal stress. The cross-flow stack has the lowest probability of failure, and although the thermal stress is the highest, the volume ratio of the higher thermal stress is the smallest, which is consistent with the previous findings.
3.3. Comparative Study with Shorter and Longer Stacks
The co-flow mode is a conventional and commonly employed flow mode in SOFC stacks. For the distribution of thermal stress within a shorter stack, a comparative investigation is conducted under identical configurations and operating conditions, aiming to identify any unique features only appearing in the longer stacks as well as the stack size effects. In addition, the short stack consisting of three cells may represent the long stack’s geometrical features, represented by the top- and bottom-end cells and the middle cell, as shown in Figure 10.

Figure 10.
Bottom-end, middle, and top-end cells in three-cell stack represent the typical ones in a multi-cell long stack.
The comparison revealed that the 3-cell stack has an average current density of 0.641 Acm−2 and reaches its highest temperature of 887 °C, whereas the 20-cell stack has an average current density of 0.634 Acm−2 and reaches its highest temperature of 903 °C. As shown in Figure 11, with the temperature scales adjusted to the same range, the area of the elevated temperatures of the 20-cell stack is mainly located at the upper cells compared to the 10-cell stack due to the bigger gas flow rate of the pile and the fact that the main electrochemical reactions occur in the upper half of the stack.

Figure 11.
Temperature distribution predicted for (a) 3-cell; (b) 10-cell; and (c) 20-cell stack.
As shown in Figure 12a–c, the highest, lowest, and average temperatures of the 3-cell stack are basically the same (about 886 °C), while those in the 10-cell stack differ by 5 °C, 10 °C, and 4 °C, respectively, and those in the 20-cell stack by 17 °C, 24 °C, and 15 °C respectively. The maximum temperature, the minimum temperature, and average temperature of all cells except the bottom one gradually increase along the upwind direction of the stack. This may result from the fact that, in the same inlet manifold size and arrangement, the longest 20-cell stack has the biggest gas inlet flow velocity, resulting in a slower electrochemical reaction in the bottom cell, and the lowest temperature as heat is quickly removed.
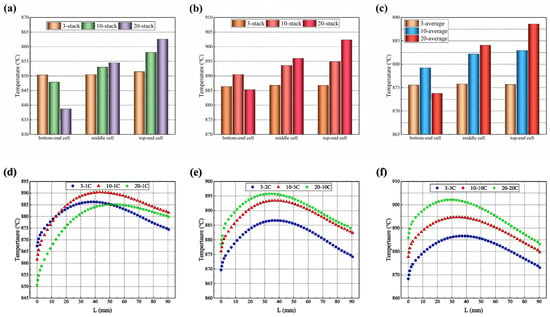
Figure 12.
Temperature distribution in 3-cell and 10-cell stacks: (a) highest temperatures; (b) lowest temper-atures; (c) average temperature; and (d) bottom-end cell; (e) middle cell; (f) top-end cell along the hydrogen main flow direction predicted for representing cells (in the figure, L refers to the length of electrolyte along the flowing direction of hydrogen gas).
As mentioned above, the longer stacks with a big number of single cells have higher temperatures and larger temperature differences between the cells due to their more complex structure with poor heat dissipation. Therefore, the modelling and analysis of the heat transfer and temperature distribution in kW-scaled stacks is necessary, such as the one in this study.
The temperature distribution of the electrolyte layers is compared along the central line of the symmetry plane, following the path of the primary hydrogen flow, as shown in Figure 12d–f. The predicted temperature gradually increases with the increased L (here, L refers to the length of electrolyte along the direction of the hydrogen flow) and then gradually decreases. This feature of the temperature distribution is consistent with that observed in the cloud-style plot of the temperature distribution in the co-flow mode of the 10-cell stack presented in Figure 6a.
Figure 13 shows a comparison of the thermal stress distribution among three stacks with different numbers of cells under the same conditions. The thermal stress distribution between the 3-cell and 10-cell stacks shows similarities, while the thermal stress in the electrolyte layer at the bottom of the 20-cell stack is significantly smaller; the higher the cell location, the greater the volume ratio of high thermal stress.

Figure 13.
Comparison of the first principal stresses predicted for electrolyte layers in (a) 3-cell; (b) 10-cell; and (c) 20-cell stack.
Comparing the bottom-end, middle, and top-end cells of the three stacks, it can be found that there is no considerable distinction between the representing cell layers; the thermal stress in the top-end layer of the 10-cell stack is significantly greater compared to the middle and bottom layers, with a difference of 9.5% in the top and middle layers. This difference is more clearly predicted in the 20-cell stack, with the highest thermal stress of 156 MPa in the top-end cell and 126 MPa in the bottom-end cell, i.e., a difference of 23.8%, as shown in Figure 14.
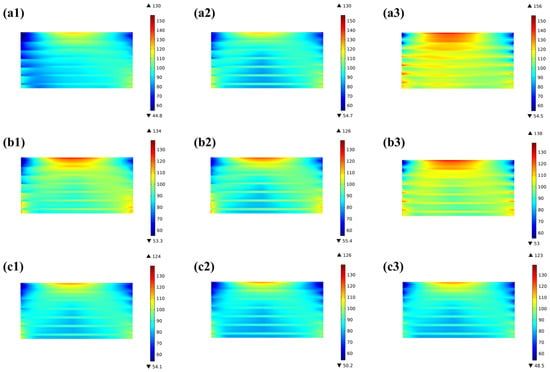
Figure 14.
Thermal stress distribution predicted for representing cells in 20-cell stack at (a1) bottom-end cell, (a2) middle cell, (a3) top-end cell; 10-cell stack at (b1) bottom-end cell, (b2) middle cell, (b3) top-end cell; and 3-cell stack at (c1) bottom-end cell, (c2) middle cell, (c3) top-end cell.
According to Figure 15, the average thermal stress in the electrolyte layer of the 3-cell stack is lower in the middle layer and slightly greater in the bottom-end and top-end cells, but the variance is minimal. The distribution in the 10-cell stack resembles that of the 3-cell stack, but the variation is larger, with the lowest in the middle layer being 92 MPa and the highest in the top-end cell being 100 MPa, i.e., a difference of 8.7%, and the lowest is in the bottom-end cell of the 20-cell stack (93 MPa) and the highest in the top-end layer (112 MPa), i.e., a difference of 20.4%. In addition, the volume ratio with high thermal stress (above 100 MPa) in the top-end electrolyte layer is 5.3% for the 3-cell stack, 19.7% for the 10-cell stack, and 92.4% for the 20-cell stack. In comparison to the 3-cell stack, the 20-cell stack has an about 17 times increased volume ratio of the high thermal stress in the top-end electrolyte layer. This finding is mainly because the longer stacks have a higher gas flow velocity in the entrance, resulting in slower electrochemical reactions and less heat produced.
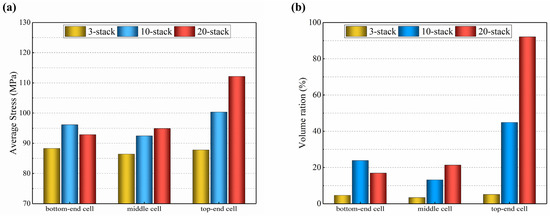
Figure 15.
Predicted for 3-cell, 10-cell, and 20-cell stacks: (a) average thermal stress; (b) volume ratio of higher thermal stress.
Furthermore, due to the complexity of the longer stack structure, the heat dissipation is much poorer, which results in higher overall temperatures and a bigger temperature difference between the cells. It is also a fact that, due to the structural constraints, the variation in the thermal stress distributed in the longer stacks is significantly greater than that in the shorter stacks. In view of the above findings and discussion, it is reasonable to point out that as the quantity of the cells rises, the average current density gradually decreases, while the maximum temperature and thermal stress increase gradually, as does the variation between cells. It would be inaccurate or even unreasonable if the findings and conclusions drawn for small-sized and shorter stacks are directly applied or extrapolated to large-sized longer stacks.
4. Conclusions
This study presents the CFD model for the planar designed full-size SOFC stack. The effects of different stack flow configurations on the stack performance and the thermal stress distributions are evaluated, together with the corresponding failure probabilities. The forecasted outcomes are also contrasted with the representing cells in the shorter and longer stacks to identify the stack size effect. The principal discoveries include the following:
- (1)
- In identical situations, the counter-flow stack has the highest power output together with the greater forecasted thermal stress; the cross-flow stack has the lowest power output accompanied by the highest thermal stress. The electrolyte layer experiences greater thermal stress, and the volume ratio with the thermal stress beyond 100 MPa on the electrolyte layer is the highest in the counter-flow stack and the lowest in the cross-flow stack (the reduction in the volume ratio is about 30% in the cross-flow stack). The thermal stress distribution is primarily influenced by the stack air flow direction under the same conditions.
- (2)
- The highest and lowest temperatures vary similarly between the unit cells, and the highest temperature appears in the counter-flow stack, and the lowest temperature is slightly higher in the co-flow stack than in the other stacks. The HTSR on the electrolyte layer in each cells decreases first and then increases, reaching a maximum value in the 10th cell (the top-end cell).
- (3)
- The longer and shorter stacks have similar temperature and thermal stress distributions, but their difference between the unit cells of the longer stack is bigger than that predicted for the shorter stack. It would be inaccurate or even unreasonable if the findings and conclusions drawn for small-sized and shorter stacks are directly applied or extrapolated to large-sized longer stacks.
- (4)
- The probability of failure of the porous cathodes significantly exceeds that of the porous anodes and electrolyte layers; the probability of failure of the counter-flow stacks is the highest, particularly in the longer stack.
This study is based on a coupled CFD model of the multi-physics fields in SOFC stacks, aiming to simulate and analyze the distribution of temperature and thermal stress as well as the influencing factors. Due to the difficulty in measuring the thermal stress of the stack under complex operating conditions, the simulation method proposed in this paper may serve as a good reference for predicting the electrochemical performance and thermal stress of the stack. However, the model does have some limitations and shortcomings, which are worthy of further investigations, e.g.,
- (1)
- The accuracy of the model has been validated by comparing with experimental I-V curves, which needs further improvement. Future research could incorporate temperature distribution within the stack as the modeling validation.
- (2)
- The focus of this paper is on the distribution of thermal stress in the stack under steady-state operation. Future research could be extended to capture the transient operating performance of the stack with different stack configuration parameters and start–stop operations.
Author Contributions
Conceptualization, X.Z. and J.Y.; software, X.Z., M.W., H.W. and Y.L.; validation, X.Z., M.W., L.X. and J.Y.; formal analysis, X.Z., M.W. and J.Y.; resources, J.Y., L.X. and D.O.; data curation, X.Z., M.W., H.W. and Y.L.; writing—original draft preparation, X.Z. and M.W.; writing—review and editing, L.X., J.Y. and D.O.; funding acquisition, L.X. and J.Y. All authors have read and agreed to the published version of the manuscript.
Funding
This research was funded by the National Key Research and Development Project of China (2018YFB1502204); Ningbo major special projects of the plan “Science and Technology Innovation 2025” (2018B10048).
Data Availability Statement
The original contributions presented in the study are included in the article, further inquiries can be directed to the corresponding authors.
Conflicts of Interest
Author Dingrong Ou was employed by the China Southern Power Grid Co., Ltd. The remaining authors declare that the research was conducted in the absence of any commercial or financial relationships that could be construed as a potential conflict of interest.
References
- Guo, M.; Lin, Z. Long-term evolution of mechanical performance of solid oxide fuel cell stack and the underlying mechanism. Int. J. Hydrogen Energy 2021, 46, 23293–24304. [Google Scholar] [CrossRef]
- Yang, C.; Guo, R.; Jing, X.; Li, P.; Yuan, J.; Wu, Y. Degradation mechanism and modeling study on reversible solid oxide cell in dual-mode—A review. Int. J. Hydrogen Energy 2022, 47, 37895–37928. [Google Scholar] [CrossRef]
- Peksen, M. Numerical thermomechanical modelling of solid oxide fuel cells. Prog. Energy Combust. Sci. 2015, 48, 1–20. [Google Scholar] [CrossRef]
- Zhang, X.; Yu, S.; Wang, M.; Dong, S.; Parbey, J.; Li, T.; Andersson, M. Thermal stress analysis at the interface of cathode and electrolyte in solid oxide fuel cells. Int. Commun. Heat Mass Transf. 2020, 118, 104831–104840. [Google Scholar] [CrossRef]
- Zhang, S.; Peters, R.; Varghese, B.; Deja, R.; Kruse, N.; Beale, S.B.; Blum, L.; Peters, R.; Eichel, R.-A. Modeling of reversible solid oxide cell stacks with an open-source library. J. Electrochem. Soc. 2022, 169, 114501–114512. [Google Scholar] [CrossRef]
- Colombo, K.; Kharton, V. Reliability analysis of a multi-stack solid oxide fuel cell from a systems engineering. Chem. Eng. Sci. 2021, 238, 116571–116585. [Google Scholar] [CrossRef]
- Lin, C.-K.; Chen, T.-T.; Chyou, Y.-P.; Chiang, L.-K. Thermal stress analysis of a planar SOFC stack. J. Power Sources 2007, 164, 238–251. [Google Scholar] [CrossRef]
- Wang, K.; An, B.; Chu, Z.; Wang, Y.; Liu, Z. Evaluation of gas channel structures on cell performance and thermal stress in a solid oxide fuel cell. Energy Sources Part A 2021, 1–16. [Google Scholar] [CrossRef]
- Molla, T.T.; Kwok, K.; Frandsen, H.L. Modeling the mechanical integrity of generic solid oxide cell stack designs exposed to long-term operation. Fuel Cells 2018, 19, 96–109. [Google Scholar] [CrossRef]
- Nakajo, A.; Wuillemin, Z.; Favrat, D. Simulation of thermal stresses in anode-supported solid oxide fuel cell stacks. Part I: Probability of failure of the cells. J. Power Sources 2009, 193, 203–215. [Google Scholar] [CrossRef]
- Lin, C.-K.; Huang, L.-H.; Chiang, L.-K.; Chyou, Y.-P. Thermal stress analysis of planar solid oxide fuel cell stacks: Effects of sealing design. J. Power Sources 2009, 192, 515–524. [Google Scholar] [CrossRef]
- Zheng, J.; Xiao, L.; Wu, M.; Lang, S.; Zhang, Z.; Chen, M.; Yuan, J. Numerical analysis of thermal stress for a stack of planar solid oxide fuel cells. Energies 2022, 15, 343. [Google Scholar] [CrossRef]
- Xu, Q.; Guo, M.; Xia, L. Temperature Gradient Analyses of a Tubular Solid Oxide Fuel Cell Fueled by Methanol. Trans. Tianjin Univ. 2023, 29, 14–30. [Google Scholar] [CrossRef]
- Peksen, M. 3D thermomechanical behaviour of solid oxide fuel cells operating in different environments. Int. J. Hydrogen Energy 2013, 38, 13408–13418. [Google Scholar] [CrossRef]
- Yuan, P.; Liu, S.-F. Effect of air flow rate distribution and flowing direction on the thermal stress of a solid oxide fuel cell stack with cross-flow configuration. Int. J. Hydrogen Energy 2022, 47, 6799–6810. [Google Scholar] [CrossRef]
- Wang, X.; Hou, R. Effect of Fuel Utilization on Tri-reforming-SOFC Systems with Different Heat Management Strategies. J. Phys. Conf. Ser. 2023, 2520, 012007. [Google Scholar] [CrossRef]
- Navasa, M.; Miao, X.Y.; Frandsen, H.L. A fully-homogenized multiphysics model for a reversible solid oxide cell stack. Int. J. Hydrogen Energy 2019, 44, 23330–23347. [Google Scholar] [CrossRef]
- Rizvandi, O.B.; Miao, X.Y.; Frandsen, H.L. Multiscale modeling of degradation of full solid oxide fuel cell stacks. Int. J. Hydrogen Energy 2021, 46, 27709–27730. [Google Scholar] [CrossRef]
- Miao, X.Y.; Rizvandi, O.B.; Navasa, M.; Frandsen, H.L. Modelling of local mechanical failures in solid oxide cell stacks. Appl. Energy 2021, 293, 116901. [Google Scholar] [CrossRef]
- Li, Q.; Xu, Z.; Cheng, M.; Ma, Y.; Zhang, X.; Li, G. Transient thermomechanical analysis of a solid oxide fuel cell stack based on 3D multiphysical field model. Mod. Phys. Lett. B 2020, 34, 2050158–2050181. [Google Scholar] [CrossRef]
- Buttler, A.; Koltun, R.; Wolf, R.; Spliethoff, H. A detailed techno-economic analysis of heat integration in high temperature electrolysis for efficient hydrogen production. Int. J. Hydrogen Energy 2015, 40, 38–50. [Google Scholar] [CrossRef]
- Yang, F. Generalized Butler-Volmer relation on a curved electrode surface under the action of stress. Sci. China Phys. Mech. Astron. 2016, 59, 50–56. [Google Scholar] [CrossRef]
- Hernández-Pacheco, E.; Singh, D.; Hutton, P.N.; Patel, N.; Mann, M.D. A macro-level model for determining the performance characteristics of solid oxide fuel cells. J. Power Sources 2004, 138, 174–186. [Google Scholar] [CrossRef]
- Andersson, M.; Yuan, J.; Sundn, B. SOFC modeling considering electrochemical reactions at the active three phase boundaries. Int. J. Heat Mass Transf. 2012, 55, 773–788. [Google Scholar] [CrossRef]
- Cui, T.; Xiao, G.; Yan, H.; Zhang, Y.; Wang, J.Q. Numerical simulation and analysis of the thermal stresses of a planar solid oxide electrolysis cell. Int. J. Green Energy 2023, 16, 432–444. [Google Scholar] [CrossRef]
- Jiang, C.; Gu, Y.; Guan, W.; Zheng, J.; Ni, M.; Zhong, Z. 3D thermo-electro-chemo-mechanical coupled modeling of solid oxide fuel cell with double-sided cathodes. Int. J. Hydrogen Energy 2020, 45, 904–915. [Google Scholar] [CrossRef]
- Zhang, Z.; Yue, D.; Yang, G.; Chen, J.; Zheng, Y.; Miao, H.; Wang, W.; Yuan, J.; Huang, N. Three-dimensional CFD modeling of transport phenomena in multi-channel anode-supported planar SOFCs. Int. J. Heat Mass Transf. 2015, 84, 942–954. [Google Scholar] [CrossRef]
- Ai-Kah, S.; Chen, W. Finite element formulations of strain gradient theory for microstructures and the C0–1 patch test. Int. J. Numer. Methods Eng. 2004, 61, 433–454. [Google Scholar] [CrossRef]
- Frandsen, H.L.; Makowska, M.; Greco, F.; Chatzichristodoulou, C.; Ni, D.W.; Curran, D.J.; Strobl, M.; Kuhn, L.T.; Hendriksen, P.V. Accelerated creep in solid oxide fuel cell anode supports during reduction. J. Power Sources 2016, 323, 78–89. [Google Scholar] [CrossRef]
- Weibull, W. A statistical distribution function of wide applicability. J. Appl. Mech. 1951, 18, 293–297. [Google Scholar] [CrossRef]
- Frandsen, H.L. Weibull statistics effective area and volume in the ball-on-ring testing method. Mech. Mater. 2014, 73, 28–37. [Google Scholar] [CrossRef]
- Radovic, M.; Lara-Curzio, E. Mechanical properties of tape cast nickel-based anode materials for solid oxide fuel cells before and after reduction in hydrogen. Acta Mater. 2004, 52, 5747–5756. [Google Scholar] [CrossRef]
- Hsieh, C.-L.; Tuan, W.-H. Elastic and thermal expansion behavior of two-phase composites. Mater. Sci. Eng. A 2006, 425, 349–360. [Google Scholar] [CrossRef]
- Vaßen, R.; Czech, N.; Mallener, W.; Stamm, W.; Stover, D. Influence of impurity content and porosity of plasma-sprayed yttria-stabilized zirconia layers on the sintering behaviour. Surf. Coat. Technol. 2001, 141, 135–140. [Google Scholar] [CrossRef]
- Ramakrishnan, N.; Arunachalam, V.S. Effective elastic moduli of porous solids. J. Mater. Sci. 1990, 25, 3930–3937. [Google Scholar] [CrossRef]
- Nakajo, A.; Kuebler, J.; Faes, A.; Vogt, U.F.; Schindler, H.J.; Chiang, L.-K.; Modena, S.; Van herle, J.; Hocker, T. Compilation of mechanical properties for the structural analysis of solid oxide fuel cell stacks. Constitutive materials of anode-supported cells. Ceram. Int. 2012, 38, 3907–3927. [Google Scholar] [CrossRef]
- Banerjee, A.; Wang, Y.; Diercks, J.; Deutschmann, O. Hierarchical modeling of solid oxide cells and stacks producing syngas via H2O/CO2 Co-electrolysis for industrial applications. Appl. Energy 2018, 230, 996–1013. [Google Scholar] [CrossRef]
- Bi, W.; Chen, D.; Lin, Z. A key geometric parameter for the flow uniformity in planar solid oxide fuel cell stacks. Int. J. Hydrogen Energy 2009, 34, 3873–3884. [Google Scholar] [CrossRef]
- Hirose, H. Reliability of the Estimates of the Weibull Parameters. IEEJ Trans. Fundam. Mater. 1990, 110, 903–912. [Google Scholar] [CrossRef][Green Version]
- Balaban, H.S.; Haspert, K. Estimating Weibull parameters for a general class of devices from limited failure data. IEEE Trans. Reliab. 1972, R-21, 111–117. [Google Scholar] [CrossRef]
- Baklizi, A.; Ahmed, S.E. On the estimation of reliabilty function in a Weibull lifetime distribution. Statistics 2008, 42, 351–362. [Google Scholar] [CrossRef]
Disclaimer/Publisher’s Note: The statements, opinions and data contained in all publications are solely those of the individual author(s) and contributor(s) and not of MDPI and/or the editor(s). MDPI and/or the editor(s) disclaim responsibility for any injury to people or property resulting from any ideas, methods, instructions or products referred to in the content. |
© 2024 by the authors. Licensee MDPI, Basel, Switzerland. This article is an open access article distributed under the terms and conditions of the Creative Commons Attribution (CC BY) license (https://creativecommons.org/licenses/by/4.0/).
