Article

Optimized Scheduling Model Considering the Demand Response and Sequential Requirements of Polysilicon Production

1
State Grid Sichuan Electric Power Research Institute, Chengdu 610041, China
2
Sichuan Provincial Key Laboratory of Electric Power Internet of Things, Chengdu 610041, China
3
School of Electrical Engineering and Automation, Wuhan University, Wuhan 430072, China
4
State Grid Sichuan Electric Power Company, Chengdu 610041, China
*
Author to whom correspondence should be addressed.
Energies 2024, 17(23), 6048; https://doi.org/10.3390/en17236048
Submission received: 24 October 2024 / Revised: 24 November 2024 / Accepted: 27 November 2024 / Published: 2 December 2024

Abstract

:
The polysilicon production process has significant potential to be made adjustable, and actively changing its production schedule to participate in grid dispatch can effectively alleviate the pressure on the power supply and balance demand while promoting renewable energy consumption. Considering the complex inter-coupling relationship between the sequential requirements and adjustable potential of polysilicon production, this paper analyzes the electricity consumption characteristics of various stages of a polysilicon production process that uses the improved Siemens method as its primary approach to production. The interaction between the polysilicon production process, equipment, and materials is modeled through the state–task network method, and the production timing requirements are transformed into constraint expressions. An optimized scheduling model that includes the production’s sequential requirements within a time-of-use electricity pricing context is established. Our analysis shows that the proposed model can formulate a feasible production plan with the lowest power purchase cost for polysilicon plants while meeting the production’s sequential requirements and product order demands.

1. Introduction

As process-oriented industrial actors, polysilicon companies have strict sequential requirements to their production process. The start and stop times of production equipment must follow a pre-determined schedule, and once operation begins, the power supply cannot be arbitrarily cut off [1]. To ensure the timely and sufficient completion of product orders, these companies are generally not highly motivated to participate in incentive-based demand response programs, such as direct load control, which may disrupt normal production [2,3,4]. However, price-based demand response interferes less with electricity users and can guide them to proactively adjust their electricity usage behavior without significantly affecting their comfort. Therefore, utilizing time-of-use electricity pricing and real-time price signals to encourage polysilicon companies to shift their electricity consumption and avoid peak production times has become an important means of fully leveraging their demand response potential [5,6,7,8].
Current research on user responses to electricity prices can be broadly divided into four types:
  • Statistical modeling, which involves distributing a large number of surveys to gather sufficient statistical data and analyze the relationship between electricity demand and price. However, such surveys may not accurately reflect the real demand response situation [9,10,11,12].
  • Psychological modeling, which considers the psychological reaction of users to electricity prices and its impact on their electricity demand. This assumes that the user response behavior to price changes has a dead zone and a saturation zone. Only when the price changes fall between the thresholds of the dead zone and the saturation zone will the user’s electricity demand change accordingly. Otherwise, the user either does not respond or their response does not change. However, this method does not clearly distinguish between the adjustments in electricity demand made at different times during the same period (peak, off-peak, and flat periods), and thus still has many shortcomings [13,14,15,16].
  • The matrix modeling of demand price elasticity, which uses the ratio of the rate of change in the electricity demand to the rate of change in price (demand price elasticity coefficient) to represent the user’s response to price. This indicator intuitively reflects the degree of user response to price during different periods, providing a theoretical basis for formulating pricing policies. However, calculating the demand price elasticity coefficient requires a large amount of historical load data, and the quality of these data significantly impacts model accuracy [17,18,19,20].
  • The detailed modeling of user and equipment electricity consumption characteristics is used by some scholars, considering the complex operational characteristics of user loads, to propose a model in which users respond rationally to prices with the goal of minimizing their electricity costs. This method, compared to the three previous black-box models, better reveals the mechanism by which price signals influence user electricity usage behavior, making it more suitable for analyzing the electricity response behavior of polysilicon companies, which have clear electricity plans and a strong desire to reduce costs, as industrial users of large amounts of energy [21,22,23,24,25].
The main production stages of polysilicon are shown in Figure 1 and can be summarized as follows: First, metallurgical silicon is combined with hydrogen chloride to synthesize trichlorosilane gas, which is easy to purify. The trichlorosilane is then distilled for purification and converted into high-purity polysilicon through a reduction reaction and chemical vapor deposition. In a closed-loop system, exhaust gasses from the reduction reaction are recovered and separated. The recovered silicon tetrachloride is sent to the hydrogenation stage, where it is converted back into trichlorosilane, which, along with the trichlorosilane separated from the exhaust gasses, is sent back to the distillation system for reuse. The hydrogen separated from the exhaust gasses is returned to the reduction furnace, while hydrogen chloride is sent back to the fluidized bed in the trichlorosilane synthesis unit, completing the material recycling loop [26]. Thus, the reduction furnace alone accounts for approximately 65% of the total electricity consumed in the polysilicon production process, making it a key power-consuming and production device [27]. It is also the most potentially adjustable load in polysilicon production [28]. Therefore, research on the adjustable characteristics of polysilicon production primarily focuses on the reduction furnace. Although current research on individual reduction furnaces has revealed some of the demand response potential within polysilicon companies, focusing solely on the adjustable characteristics of the reduction furnace without considering the entire production process may lead to electricity arrangements that are not feasible [29,30], limiting the company’s ability to contribute to the peak load shaving and valley filling of the power grid.
At present, the research on the modeling problem of polysilicon mainly focuses on the analysis of the balance of materials and the temperature field obtained from the physical production process, while there are few studies on its power characteristics, which mainly include two aspects. First, as mentioned above, is the analysis of the core production of polysilicon and the reduction furnace, such as the comprehensive analysis of the polysilicon production process available in [31], which clarifies the power-adjustable potential of the polysilicon load in a grid frequency modulation scenario and takes the reduction furnace equipment as its analysis object. A power characteristic model is established from the perspective of the conservation of matter and energy. In [32], the power characteristics of the polysilicon load are simplified to the power characteristics of the reduction furnace and the power regulation boundary and adjustable power capacity of the polysilicon load are then determined. However, this method only analyzes the core equipment, the reduction furnace, in the polysilicon production process and is unable to analyze the whole process of polysilicon production, meaning the tunable potential of polysilicon is not fully explored. The second method considered involves dividing the load into interruptible, transferable and other types according to a number of characteristics and then carrying out unified modeling and optimization according to the type of load being considered. This was the case in the analysis of the whole process of polysilicon production conducted in [33]; based on the various types of load equipment and processes involved, the load was divided into the transferable load, interruptible load, reducible load and other types for unified modeling, and the user’s response to electricity prices was analyzed on this basis. However, this method does not consider the core problem in the industrial production process, which is the mutual coupling between links. It is difficult to determine the upper and lower limits of the load and the duration of the adjustment, which may make a production plan unfeasible.
To address the limitations of existing research, this paper first analyzes the entire polysilicon production process, detailing the tasks and technological characteristics involved. After identifying the key production equipment used and their electricity characteristics, it highlights the coupling relationships between the company’s electricity consumption behavior and its production processes, equipment, and materials. The interactions within each stage of the process are then summarized. Following the modeling rules of the state–task network (STN) method [34,35,36], both graphical representations and abstract mathematical models are used to systematically describe the interactions between the state of objects, equipment, and electricity and tasks in the polysilicon production process. The sequential requirements of each production stage are clarified. Finally, an optimized scheduling model is developed under time-of-use electricity pricing, aimed at minimizing the comprehensive electricity cost of polysilicon loads. The results of case studies show that the proposed model can formulate operational plans for polysilicon plants that ensure both safety and economic efficiency.

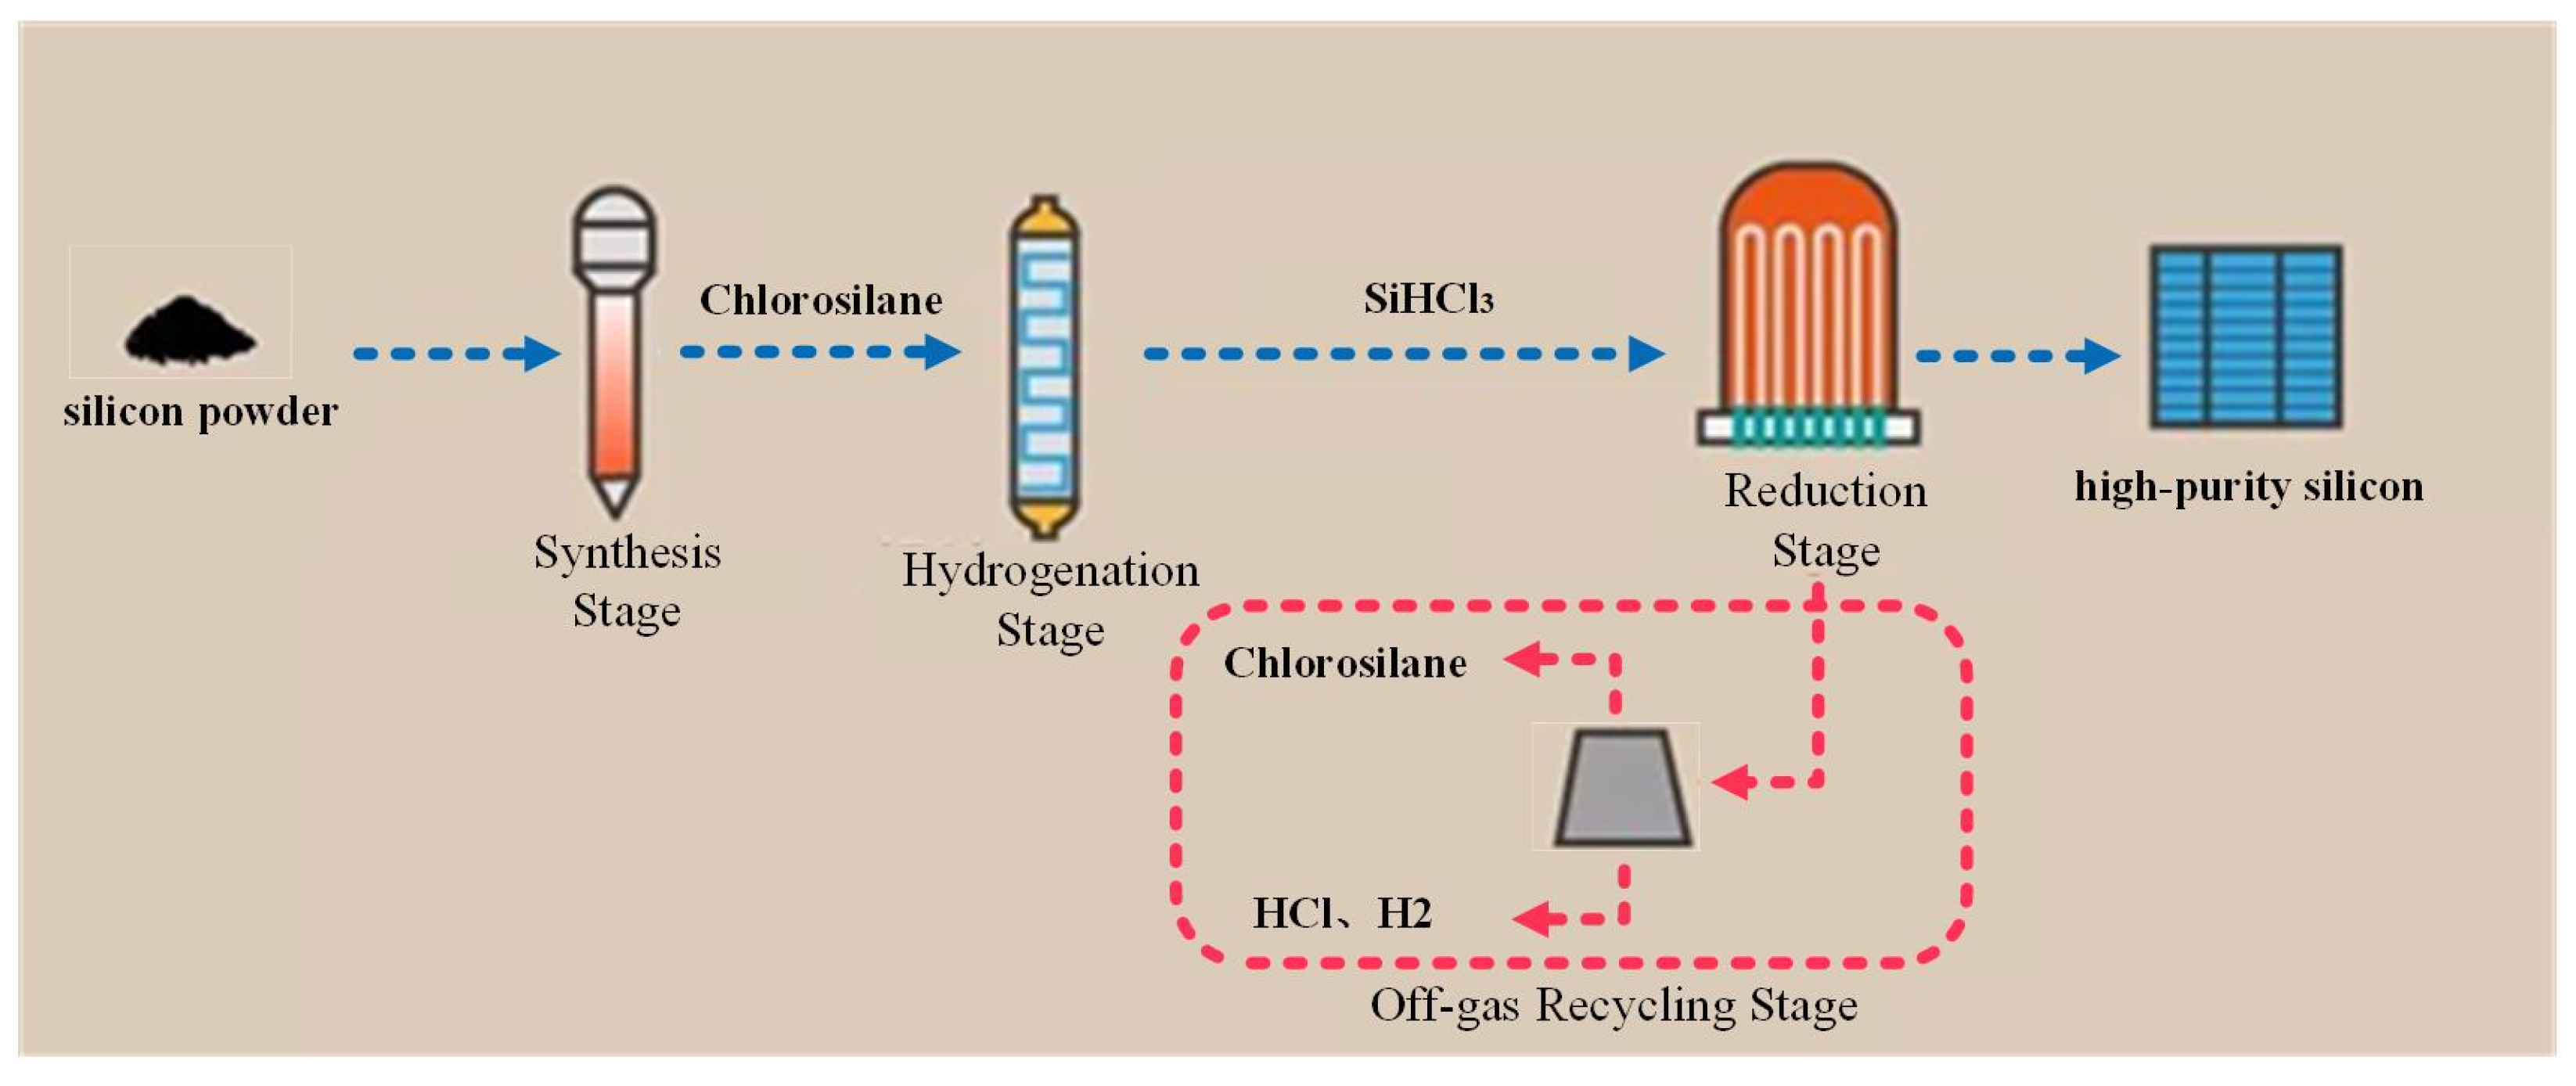
2. Analysis of the Sequential Requirements of Polysilicon Production

The improved Siemens method is the dominant method used for producing polysilicon today. According to the “China Photovoltaic Industry Development Roadmap (2023–2024)”, in 2023, 82.7% of China’s polysilicon products were produced using the improved Siemens method. The main production process of this method is shown in Figure 2. Industrial silicon is combined with purchased hydrogen chloride to synthesize trichlorosilane, which is then separated and distilled to create high-purity trichlorosilane and other chlorosilanes. These gasses are mixed with hydrogen in specific proportions and fed into a reduction furnace, where a gas phase deposition reaction takes place, producing polysilicon. The polysilicon grows on the high-temperature silicon cores, gradually increasing the diameter of the silicon rods. To achieve the closed-loop recycling of materials, the improved Siemens method includes a tail gas recovery stage and a silicon tetrachloride hydrogenation stage. This ensures the full utilization of hydrogen, hydrogen chloride, trichlorosilane, and silicon tetrachloride from the reduction tail gas.
Based on the production process, the requirements for each sequential production stage can be analyzed as follows.

2.1. Synthesis Stage

The production principle of the synthesis stage is as follows:
S i ( s ) + 3 H C l ( g ) 280 ~ 320 ° C S i H C l 3 ( g ) + H 2 ( g )
When the temperature is not properly controlled, the number of side reactions will increase, leading to a decrease in the production of trichlorosilane and an increase in the production of other chlorosilanes.
S i ( s ) + 4 H C l ( g ) 350 ° C S i C l 4 ( g ) + 2 H 2 ( g )
S i ( s ) + 4 H C l ( g ) 280 ° C S i H 2 C l 2 ( g ) + H 2 ( g )
At this stage, the process involves crushing industrial silicon in a crusher and grinding it in a pulverizer. After being sieved and dried, the silicon is fed into a fluidized bed reactor (boiling furnace). When the temperature in the boiling furnace reaches the reaction temperature, hydrogen chloride is added, and the two react to produce trichlorosilane, which is then sent to the storage tank for storage.
In this process, the consumed materials are silicon powder and hydrogen chloride, while the produced material is synthesis off-gas (the main components of which are chlorosilanes, including trichlorosilane and byproducts like tetrachlorosilane). The equipment used is a synthesis furnace (SF). Considering that the trichlorosilane synthesis reaction requires a precise temperature, the power of the fluidized bed furnace and associated equipment should remain stable, making this a device requiring start–stop control.

2.2. Purification Stage

This stage involves the removal of impurities through distillation, which exploits the volatility differences among the components of the synthesis mixture to separate highly purified trichlorosilane and tetrachlorosilane, which are then sent to the reduction and hydrogenation stages, respectively. In actual industrial production, the purification stage can only begin when the synthesis stage is in operation and there is a sufficient supply of chlorosilanes in the storage tanks.
In this process, the consumed material is a mixture of chlorosilanes, and the products are high-purity trichlorosilane and tetrachlorosilane. The equipment used is a distillation column (DC). As distillation is based on differences in the boiling points of components, temperature control is critical, so the power of the distillation column and its auxiliary equipment must be stable, making this a device that requires start–stop control.

2.3. Reduction Stage

The main reaction occurring during the reduction stage is as follows:
S i H C l 3 + H 2 1080 ~ 1100 ° C S i + 3 H C l
Simultaneously, trichlorosilane decomposition reactions also occur:
4 S i H C l 3 1080 ~ 1100 ° C S i + 3 S i C l 4 + 2 H 2
During this stage, purified trichlorosilane and hydrogen are introduced into the reduction furnace in a set ratio. At a temperature of 1080–1100 °C, trichlorosilane is reduced by hydrogen, depositing high-purity silicon on the silicon core of the heating element. In industrial production, the reduction furnace can only be operated once there is a sufficient supply of trichlorosilane.
The materials consumed in this process are high-purity trichlorosilane and hydrogen, and the products are high-purity silicon and reduction off-gas. The equipment used is a reduction furnace (RF). Considering that the trichlorosilane reduction reaction is conducted at around 1080–1100 °C in actual industrial production, if the temperature is too low, temperature stratification can occur, reducing product quality; if the temperature is too high, the amount of impurity reduction increases, thereby lowering the purity of the silicon. Therefore, the adjustable temperature range is very narrow, and power adjustments for the reduction furnace are not considered, making this a device that requires start–stop control.

2.4. Off-Gas Recycling Stage

During this stage, various techniques such as condensation, separation, absorption and desorption are used to recover and separate the trichlorosilane, tetrachlorosilane, hydrogen and hydrogen chloride from the off-gas. The recovered trichlorosilane and hydrogen are returned to the reduction stage for further polysilicon production, while tetrachlorosilane is sent to the hydrogenation stage for conversion into trichlorosilane. Hydrogen chloride is sent to the synthesis stage for trichlorosilane production.
The materials consumed in this process are the off-gasses from the synthesis, hydrogenation, and reduction stages. The products are trichlorosilane, tetrachlorosilane, hydrogen and hydrogen chloride. The equipment used is a CDI Recycling System (CDI). Since the operation of the off-gas recycling stage depends on the volume of off-gas generated by the reduction stage, it is synchronized with the reduction furnace and is considered to require start–stop control. Thus, the operational state of the CDI system matches that of the reduction furnace based on the off-gas volume.

2.5. Hydrogenation Stage

In the currently predominant thermal hydrogenation process, the following reaction occurs:
S i C l 4 ( g ) + H 2 ( g ) 1200 ~ 1250 ° C S i H C l 3 ( g ) + H C l ( g )
During this stage, hydrogen and tetrachlorosilane are vaporized in a vaporizer and then fed into the hydrogenation furnace, where they are heated by a graphite heating element at 1200–1250 °C. A thermal reduction reaction occurs, producing trichlorosilane. The gasses produced are then purified, cooled and transferred to other stages for use.
The materials consumed in this process are tetrachlorosilane and hydrogen, and the product is hydrogenation off-gas. The equipment used is a hydrogenation furnace (HR). Similarly to the reduction furnace, the hydrogenation furnace also operates within a narrow temperature range, so power adjustments are not considered. It is classified as a device requiring start–stop control.

3. Polysilicon Scheduling Optimization Model

3.1. Sequential Constraints for Polysilicon Production

Through the analysis of the sequential requirements of the polysilicon production process mentioned above, an STN model of polysilicon production, as shown in Figure 3, can be derived. The STN model contains two types of nodes: state and task nodes. The state nodes have two attributes: the initial amount of material and the maximum storage capacity of that material; task nodes have six attributes: the minimum input, maximum input, minimum output, maximum output, production equipment, and operating power.
Based on the STN model of polysilicon production, this paper constructs the timing constraints for production that must be met when formulating a production schedule for polysilicon.

3.1.1. Material Balance Constraint

R n t = R n t 1 + k K μ n , k t · y k t   t 1 , T ,   n N
where R n t is the quantity of the nth material available in the tth period, μ n , k t is the quantity of (+)/consumption (−) of the nth material in the tth period when a single core electrical device used in the kth task and running at its rated power, and y k t is the number of pieces of core equipment started in the kth task in the tth period.

3.1.2. Power Balance Constraint

P E t = k K μ e , k t · y k t   t 1 , T
where P E t is the total power consumption of the polysilicon plant in the tth period, μ e , k t is the rated power of a single core consumer used in the kth task, and y k t is the number of pieces of core equipment started in the kth task in the tth period.

3.1.3. Storage Constraint

L B n R n t U B n   n N
where L B n and U B n   are, respectively, the lower and upper limits of the storage of the nth kind of material, which are related to the capacity and safety of the material storage warehouse.

3.1.4. Production Output Constraint

R p T R p 0 L B p , f i n a l
where R p T and R p 0 are the quantities of high-purity polysilicon (final product) at the end of the scheduling period T and the beginning of the scheduling period, respectively. L B p , f i n a l indicates the daily output requirements of high-purity polysilicon.
This constraint allows the normal production of polysilicon to be unaffected while meeting the daily production requirements.

3.1.5. Purification Task Constraint

x D C t x D C t 1 y S F t   t 1 , T
R r t L B 1 · x D C t x D C t 1   t 1 , T
where x D C t is the start–stop state of each distillation column used in the purification task in the tth period. L B 1 is the minimum amount of chlorosilane liquid required at the start of the purification task.
This constraint characterizes the start conditions of the purification task, which are as follows: the synthesis task has been started and there is a sufficient amount of chlorosilane liquid available.

3.1.6. Reduction Task Constraint

R f t L B 2 · x R F t x R F t 1   t 1 , T
where x R F t is the start–stop state of each reduction furnace used in the restoration task in the tth period. L B 2 is the minimum amount of high-purity trichlorosilane required at the start of the purification task.

3.2. Objective Function of Polysilicon Scheduling Optimization Model

The model considers the minimum overall power purchase cost of polysilicon plants as the goal and considers the power purchase cost of polysilicon plants in terms of time-of-use electricity prices, and its objective function is expressed as follows:
m i n C = t = 1 T λ e t · P e t · δ
where λ e t denotes the time-of-use electricity price of period t and δ denotes the length of the period.

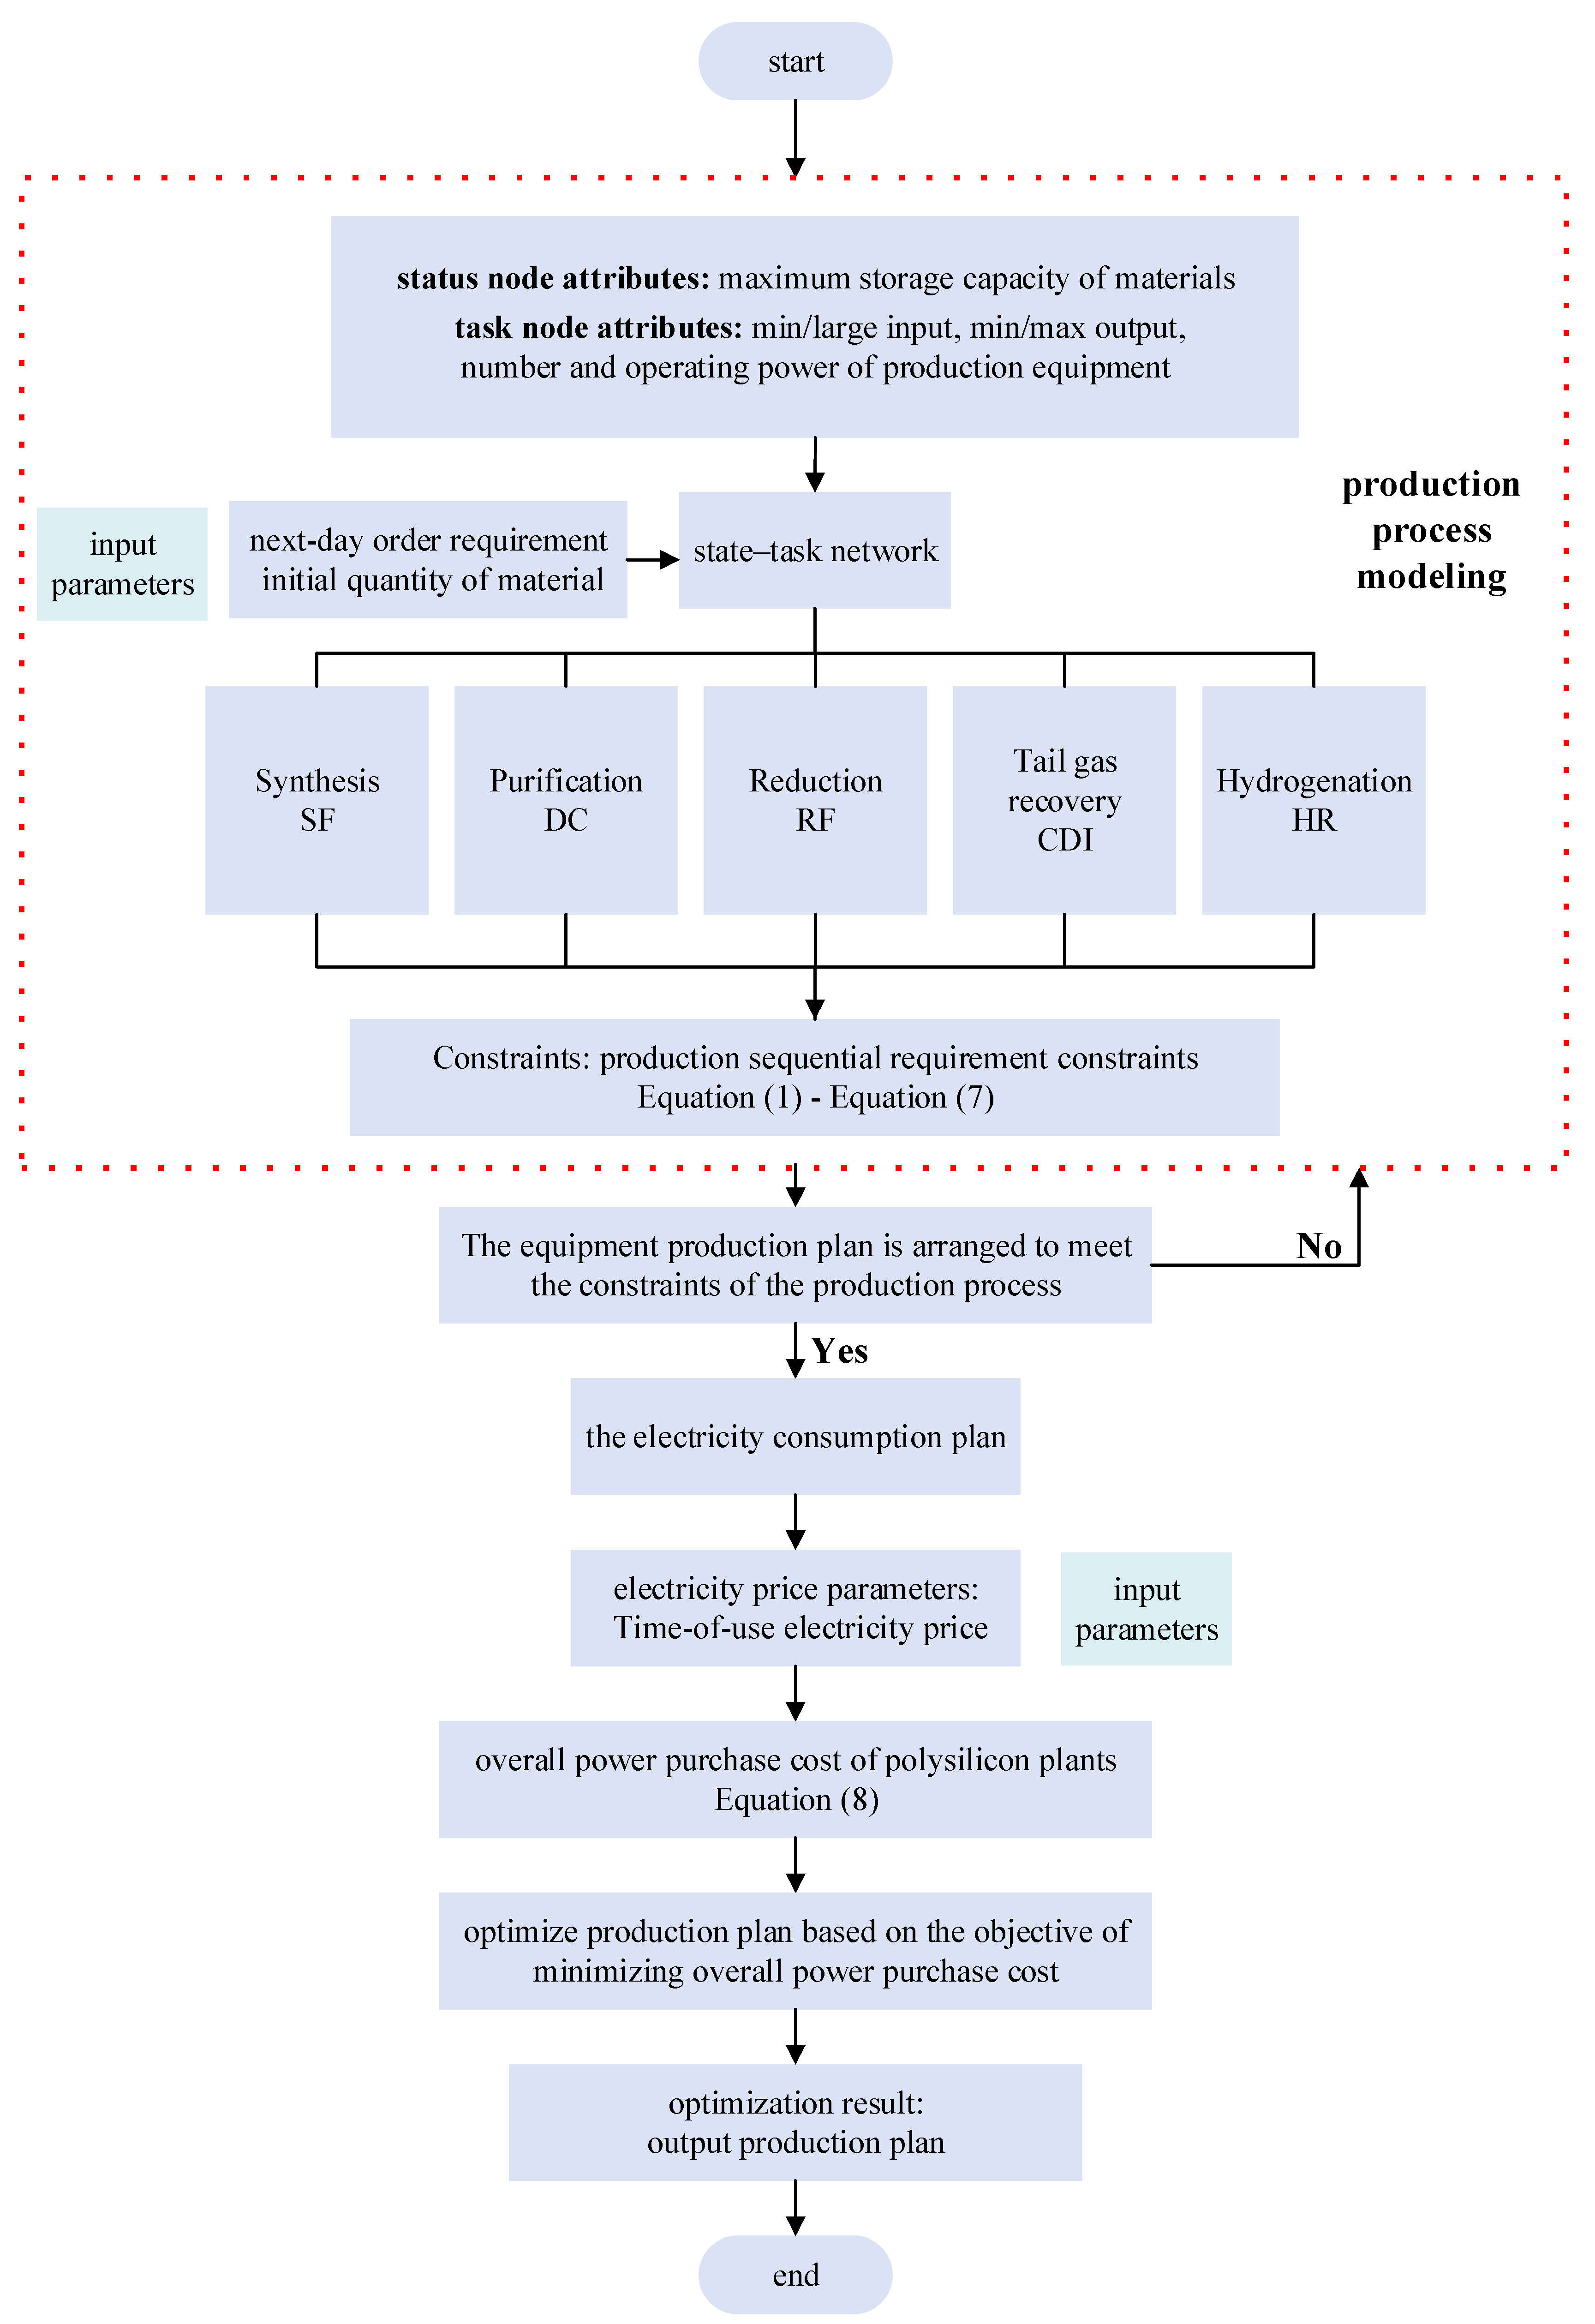
3.3. Solution Procedure for Polysilicon Scheduling Optimization Model

The purpose of the proposed scheduling model, which accounts for timing requirement constraints under time-of-use electricity pricing, is to adjust the production schedule of the polysilicon plant from a day-ahead perspective to minimize electricity costs while ensuring that the normal production of the enterprise is not affected. The procedure of the model is shown in Figure 4.
Based on the load production data of a polysilicon plant, the model optimizes the start–stop states of various production tasks (including synthesis, purification, reduction, tail gas recovery, and hydrogenation). After optimizing these start–stop states, it checks whether the production timing constraints (i.e., Equations (1)–(7)) are met. If the production constraints are met, the total electricity purchase cost for the following day is calculated based on Equation (8) and compared with the previous electricity cost result. This process continues until the start–stop configuration of tasks that generates the minimum total electricity cost and satisfies the production timing constraints is obtained, which is the economically optimal production plan for the polysilicon plant.
In Matlab 2021b, the YALMIP platform is used to call on the CPLEX solver to solve this mixed-integer linear programming problem. The parameters of the polysilicon production scheduling optimization model are determined based on the actual production situation and sequential requirements of the polysilicon plant, and the model is solved to obtain a production schedule that balances safety and economic conditions within the plant’s various production tasks.

4. Case Study Analysis

This paper uses a polysilicon plant in Sichuan Province as the subject of its simulation analysis. Considering the sequential requirements of production and product order demands, day-ahead scheduling is conducted for the production plan of the polysilicon plant, with a scheduling interval of 15 min.
The rated power and quantity settings of the main production equipment for each production task in the polysilicon plant are shown in Table 1. For the same task, the equipment that are of the same type have identical rated powers.
Table 2 shows the price of electricity for large industrial users in Sichuan Province.
Based on the above data, a simulation analysis was conducted, resulting in a daily production schedule for the polysilicon plant, as shown in Figure 5; the corresponding power usage is shown in Figure 6. It can be observed that production is mainly concentrated to within valley periods, but due to storage equipment capacity constraints and product order requirements, some equipment operates during flat and peak periods.

4.1. Impact of Considering Production Processes on the Daily Production Schedule of the Polysilicon Plant

To verify the necessity of considering production process constraints in the scheduling of the polysilicon plant, three situations with different process constraints are established for a comparative analysis:
  • Situation 1: Minimize total electricity costs; remove storage, purification and reduction task constraints; keep production quantity constraint.
  • Situation 2: Minimize total electricity costs; remove storage constraint; keep other constraints.
  • Situation 3: Minimize total electricity costs and keep all process constraints, i.e., the optimized scheduling model in this paper, which considers the sequential requirements of production.
Using time-of-use pricing for industrial consumers in Sichuan Province, the electricity costs for the polysilicon plant in the above three situations are shown in Table 3. Comparing the electricity costs across the three situations, it can be seen that the electricity cost decreases when production process constraints are not considered.
By analyzing the operating status of the equipment and material inventories, the variation in the stock of high-purity trichlorosilane over time is shown in Figure 7. It is evident that high-purity trichlorosilane, used to produce the final product, is only consumed and not produced. This is because, without constraints on amount of material required, the quantities of silane liquid, high-purity trichlorosilane, and high-purity silicon tetrachloride can be less than zero. As a result, production quantity constraints can be met without executing upstream tasks, and only the reduction task needs to be activated to produce sufficient high-purity silicon. However, this does not align with actual production requirements. Therefore, the production process constraints proposed in this paper are necessary to describe the relationships between production tasks, ensuring a safe and feasible production plan for this polysilicon plant.

4.2. Impact of Different Modeling Methods on the Daily Production Schedule of the Polysilicon Plant

In order to compare the influence of different modeling methods on the daily production planning of polysilicon plants, this paper compares and analyzes three modeling methods from the literature [31,32,33].
  • Modeling method 1: This comes from Refs. [31,32], with the goal of minimizing the electricity cost in the reduction task while removing storage constraints and purification task constraints, and keeping production quantity constraints and reduction task constraints.
  • Modeling method 2: Based on Ref. [33], the task equipment considered in this paper belongs to the transferable load in this method. With the goal of minimizing the total electricity cost, the storage constraint and the purification and reduction task constraints are removed, and the production quantity constraint is kept, and the constraint of a minimum continuous operation time of 2 h is increased to ensure that all production tasks are completed within the scheduled cycle.
  • Modeling method 3: Minimize total electricity costs and consider all process constraints, i.e., the optimized scheduling model in this paper, which considers the sequential requirements of production.
Using the above three modeling methods, the electricity cost of the polysilicon plant is shown in Table 4.
As can be seen from Table 4, compared with modeling methods 1 and 2, the total electricity cost and the electricity cost of the reduction task in modeling method 3 are obviously increased, because the coupling relationship between the links is considered in modeling method 3, while modeling method 1 only analyzes the reduction furnace equipment, and not the whole process of polysilicon production, meaning it cannot provide a complete production plan for the enterprise and the production process needs to be analyzed to determine the arrangement of other links after an operation plan for the reduction link is determined. Modeling method 2 only considers the characteristics of the transferable and interruptible load models, such as the duration of their operation, but ignores the coupling relationships and start–stop constraints brought about by the production process, resulting in an unfeasible work plan and a situation in which the chlorosilane liquid reserve is less than 0, as shown in Figure 8.

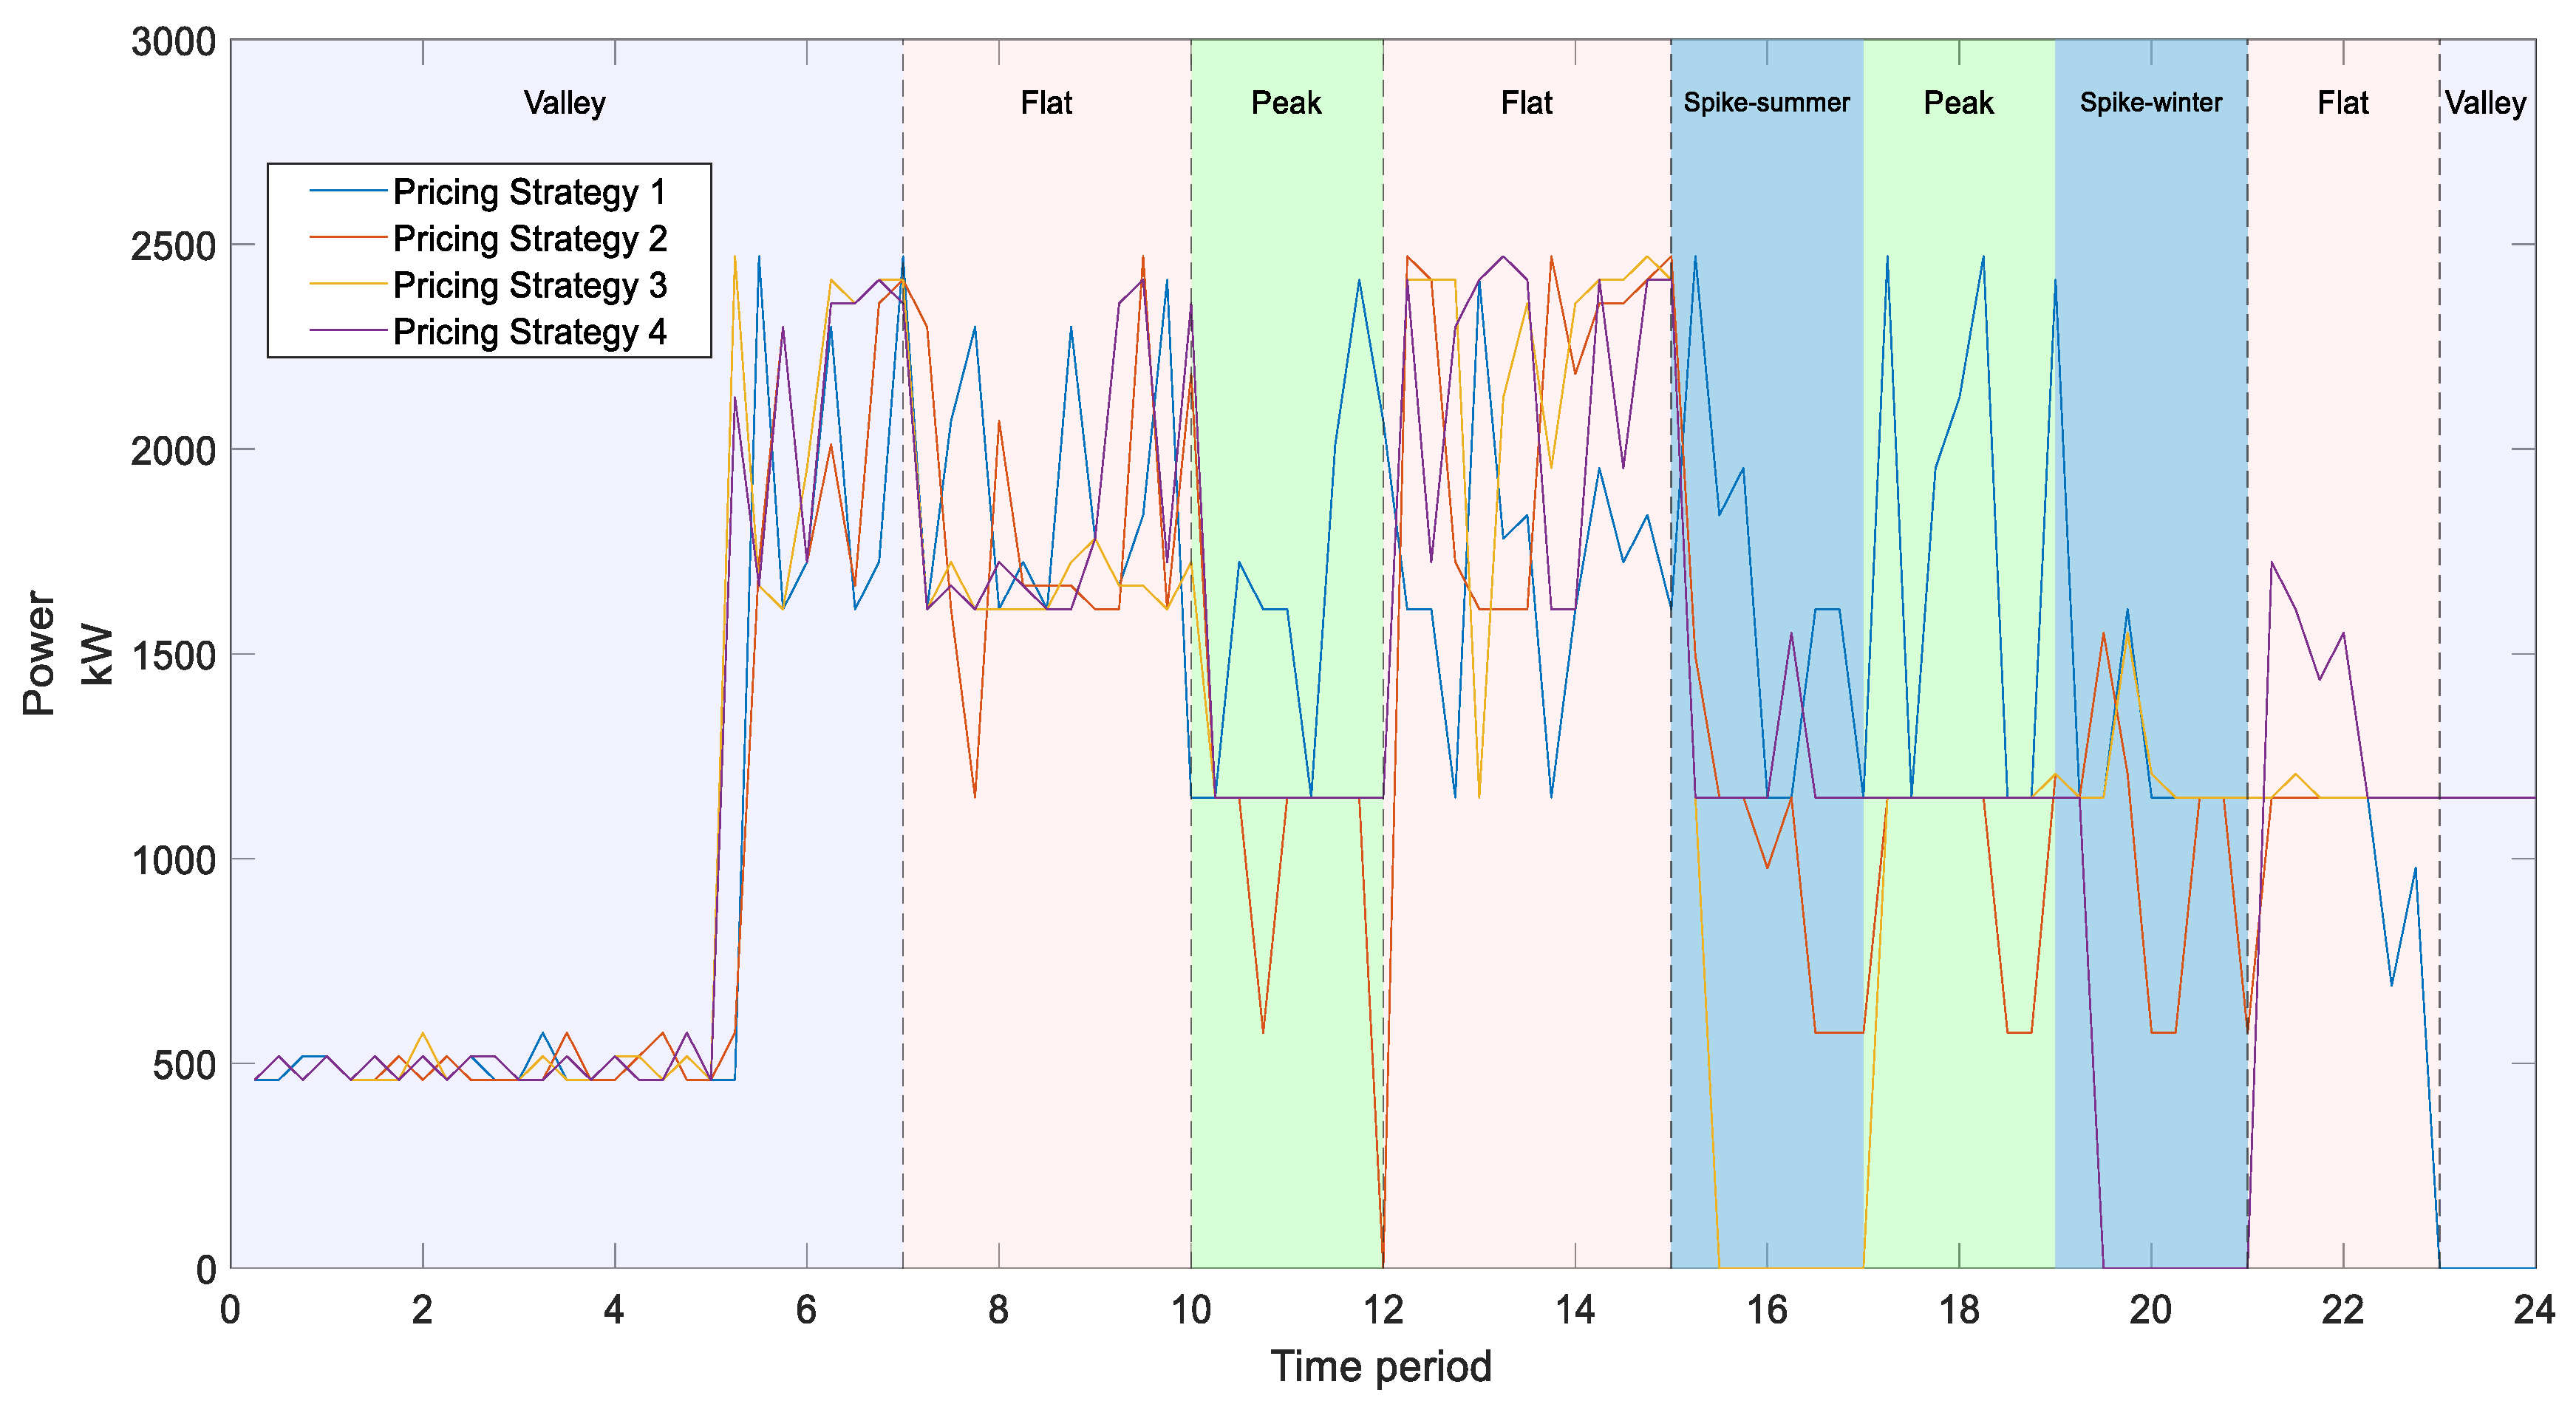
4.3. Impact of Different Time-of-Use Pricing Strategies on the Daily Production Schedule of the Polysilicon Plant

To analyze the impact of different time-of-use pricing strategies on the daily production schedule of the polysilicon plant, this paper proposes the following four different time-of-use pricing strategies according to the time-of-use electricity price policy for large industrial users in Sichuan Province, taking into account the high-price electricity periods in July and August in summer and January and December in winter. In all cases, in order to see the differences in each time-of-use pricing strategy more clearly, the order output is set at 4500 kg.
  • Time-of-use Pricing Strategy 1: Implement a fixed electricity price, which is determined by the weighted average of the time-of-use electricity price, and then the polysilicon plant executes the power consumption plan with the shortest completion time;
  • Time-of-use Pricing Strategy 2: Implement the time-of-use electricity prices of peak, flat and valley times, as in this paper;
  • Time-of-use Pricing Strategy 3: Consider the electricity price to spike from 15:00 to 17:00 in July and August in summer, during which time the electricity price is 1.1313 CNY/kWh
  • Time-of-use Pricing Strategy 4: Consider the electricity price to spike from 19:00 to 21:00 in January and December in winter, during which time the electricity price is 1.1313 CNY/kWh.
Using the above four strategies, the electricity costs of the polysilicon plant are shown in Table 5, while its power usage over the entire day is shown in Figure 9.
Combining the table and the figure, it can be seen that, limited by the quantity of materials, the load power is low at 0:00–5:00, which is the early stage of the first electricity price valley. Under electricity price strategy 1, the load later in each period is relatively balanced, there is no obvious law, and the comprehensive electricity cost is the highest.
Under electricity price strategy 2, the load of the polysilicon plant is concentrated in the valley sections with the lowest electricity price and the flat sections with a low electricity price, while during the peak periods of electricity prices, 10:00–12:00 and 15:00–21:00, there is a significant drop in the power load, and the power purchase cost of polysilicon plant reaches its lowest point at this time. Under electricity price strategy 3, the load of the polysilicon plant is shifted at 15:00–17:00, during the spike hours, but due to limited material reserves, most of the load during these spike hours is transferred to other peak hours, and a small amount of load is still required in the spike hours, meaning that the power purchase cost for the polysilicon plant is slightly higher than that of electricity price strategy 2. Under electricity price strategy 4, the power purchase cost for the polysilicon plant is higher than that of electricity price strategy 3, because it is necessary to take into account the equipment’s operation status and the material coupling relationships between links, while the load transfer space at 19:00–21:00, during spike hours, is insufficient, resulting in higher power requirements and higher power purchase costs during spike hours. From this analysis, it can be seen that the time-of-use electricity pricing method can initially guide the power consumption behavior of polysilicon plants so that their power consumption is concentrated within the low electricity price range, which provides a basis for realizing peak shaving and valley filling and promoting new energy consumption.

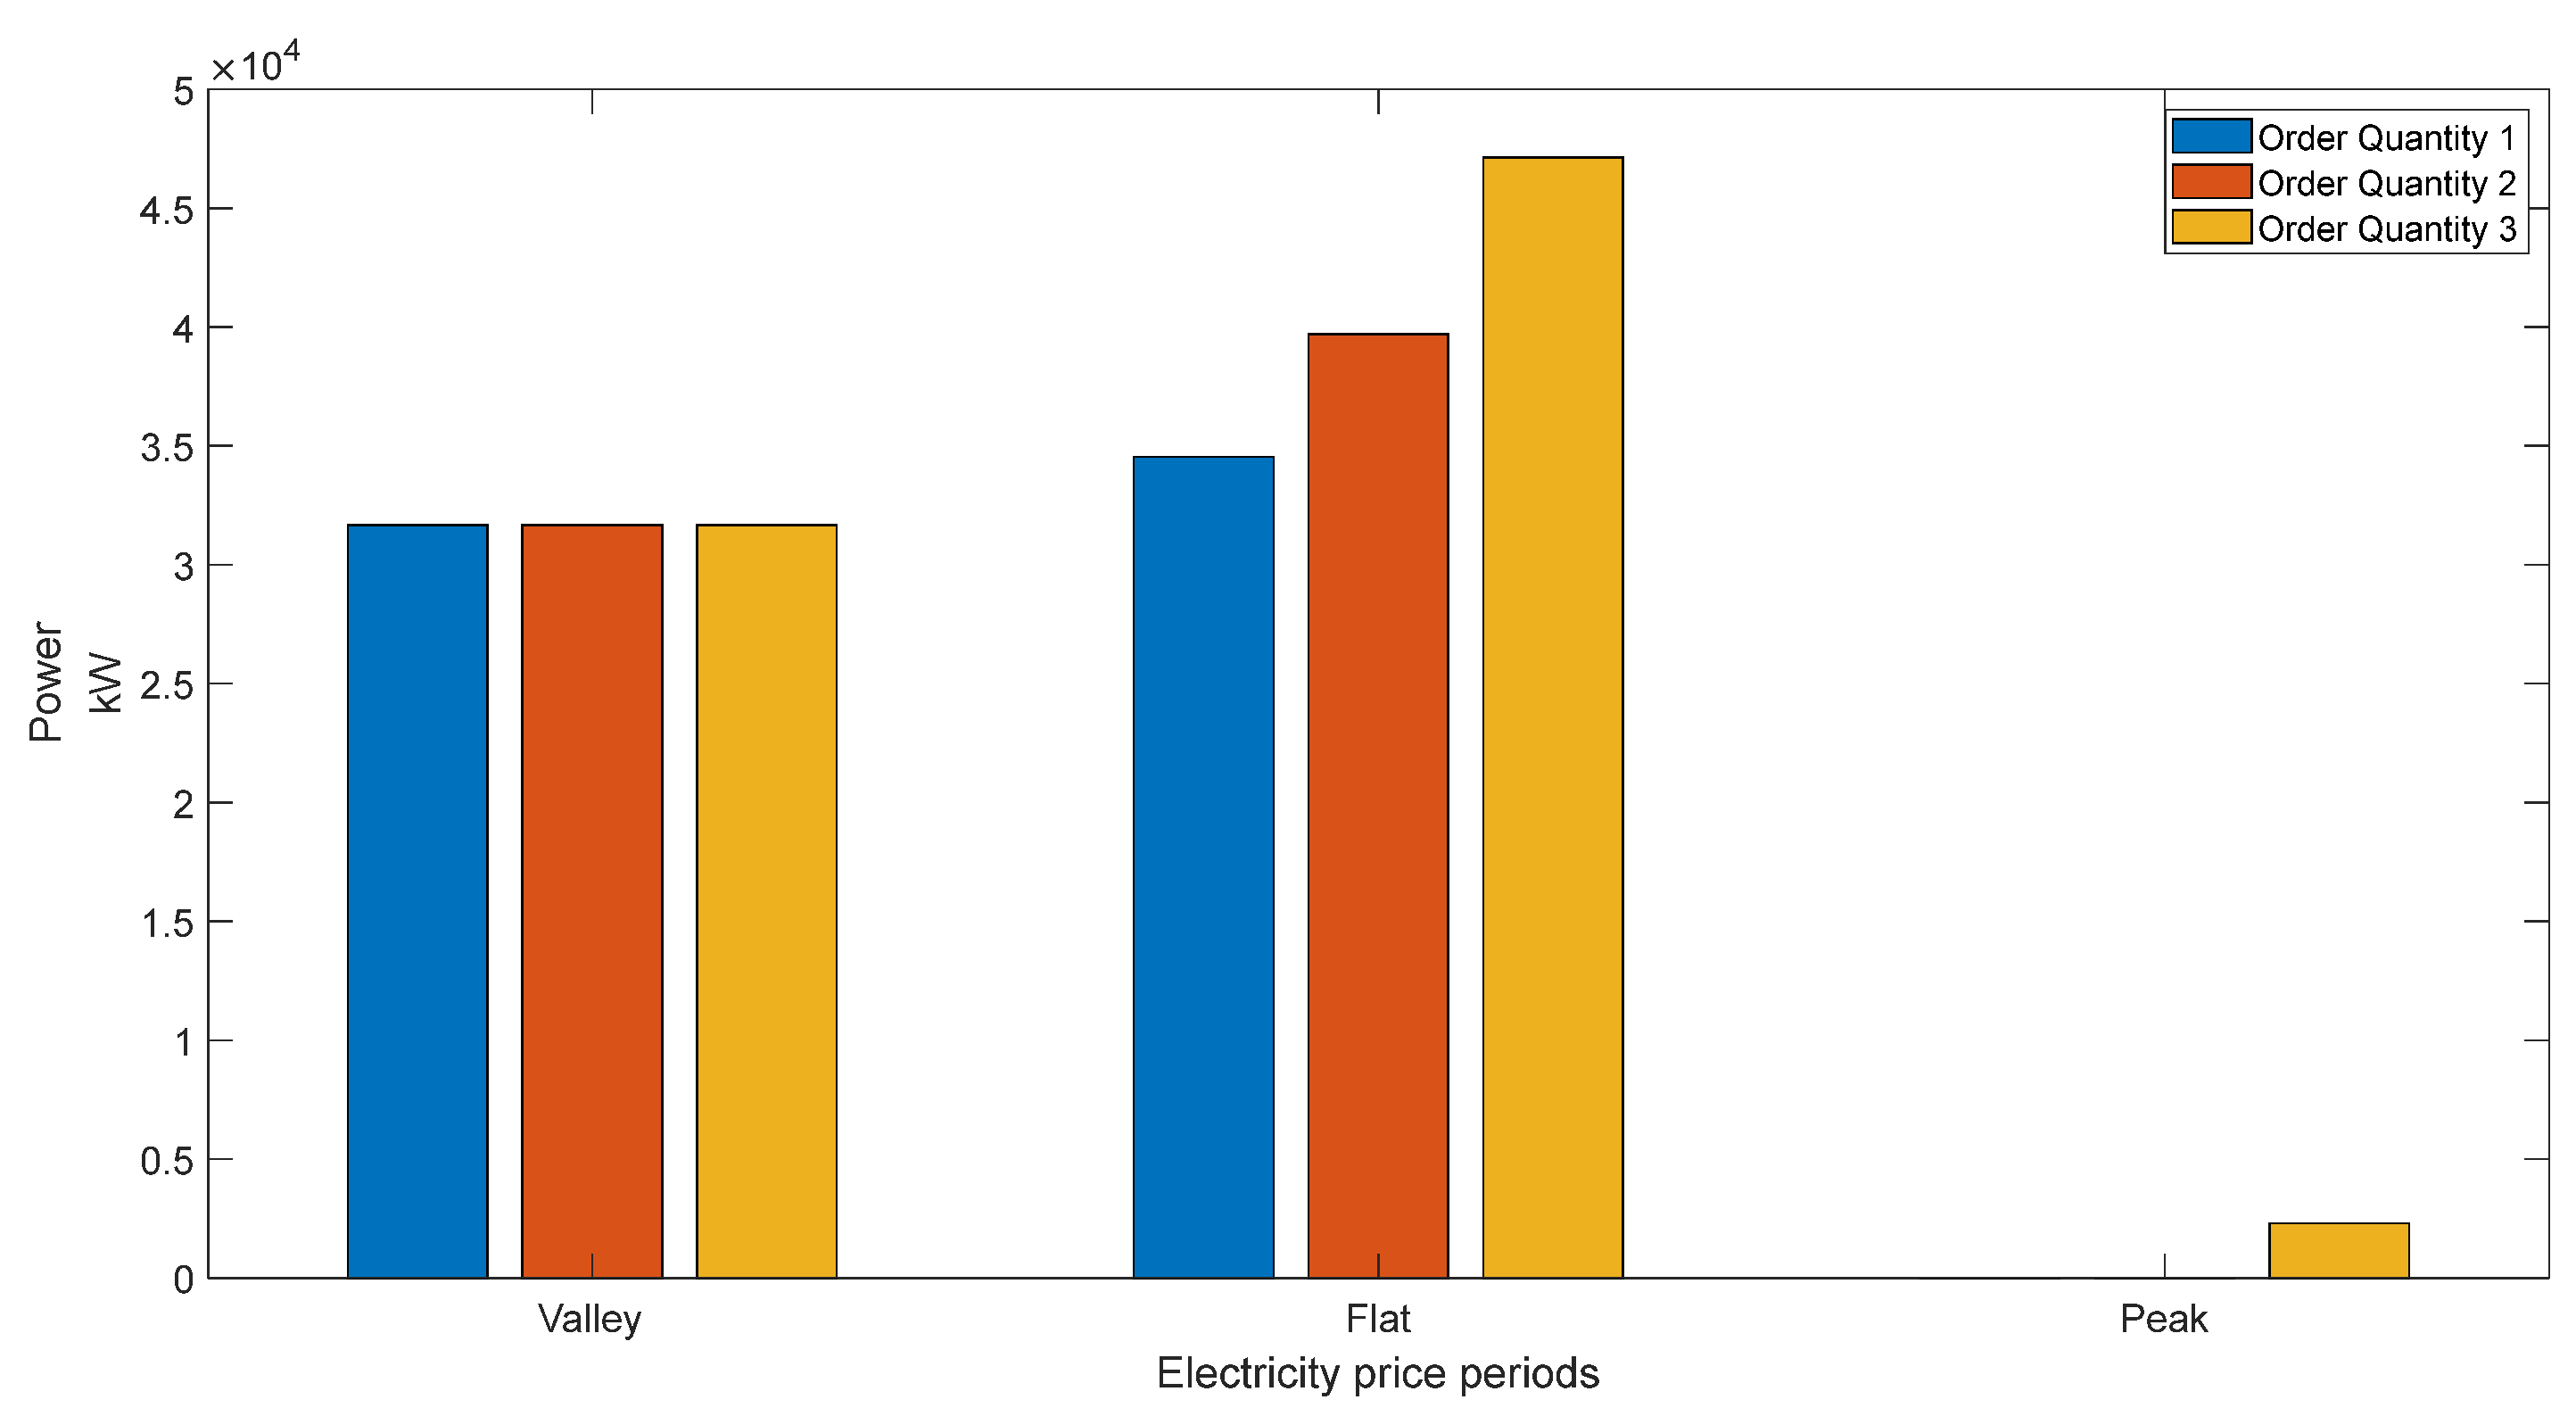
4.4. Impact of Different Product Order Quantities on the Adjustable Capacity of the Polysilicon Plant

To analyze the adjustable capacity of the polysilicon plant under different product order quantities, three order quantities are used for comparison:
  • Order Quantity 1: 3200 kg;
  • Order Quantity 2: 3600 kg;
  • Order Quantity 3: 4000 kg.
Under these three order quantity constraints, the production schedule of the plant is optimized, and the comparison of its electricity costs is shown in Table 6, while the comparison of its power usage over the entire day is shown in Figure 10, and the comparison of its power usage across different electricity price periods is shown in Figure 11.
By comparing the electricity costs of different order quantities, it can be observed that the electricity cost increases with the increase in order quantity, but not in a simple linear fashion. This is because the electricity prices vary by time period, and the rate of the cost increase differs from the rate of the order quantity increase. From Figure 10 and Figure 11, it can be seen that the increased power usage from Order Quantity 1 to Order Quantity 2 mainly occurs during the flat periods from 07:00 to 10:00 and 12:00 to 15:00. From Order Quantity 2 to Order Quantity 3, power usage increases further during the flat periods, as well as during the peak periods from 10:00 to 12:00 and 15:00 to 21:00.
This indicates that the adjustable potential of electricity usage differs under different order quantities. When the production task is smaller, there is more room for adjustment, providing support for the enterprise participating in grid regulation. However, when the production task is larger, the space in which to shift electricity usage is compressed, making it difficult to provide sufficient resources for grid regulation.

5. Conclusions

The precise modeling of industrial load production processes is essential for ensuring production safety and meeting order requirements during the adjustment process, which is key to enhancing the willingness of industrial enterprises to participate in grid interactions. This paper develops an optimized scheduling model that considers the sequential requirements of polysilicon production and evaluates the capacity of polysilicon loads to adjust to different order conditions. The main contributions of this paper are as follows:
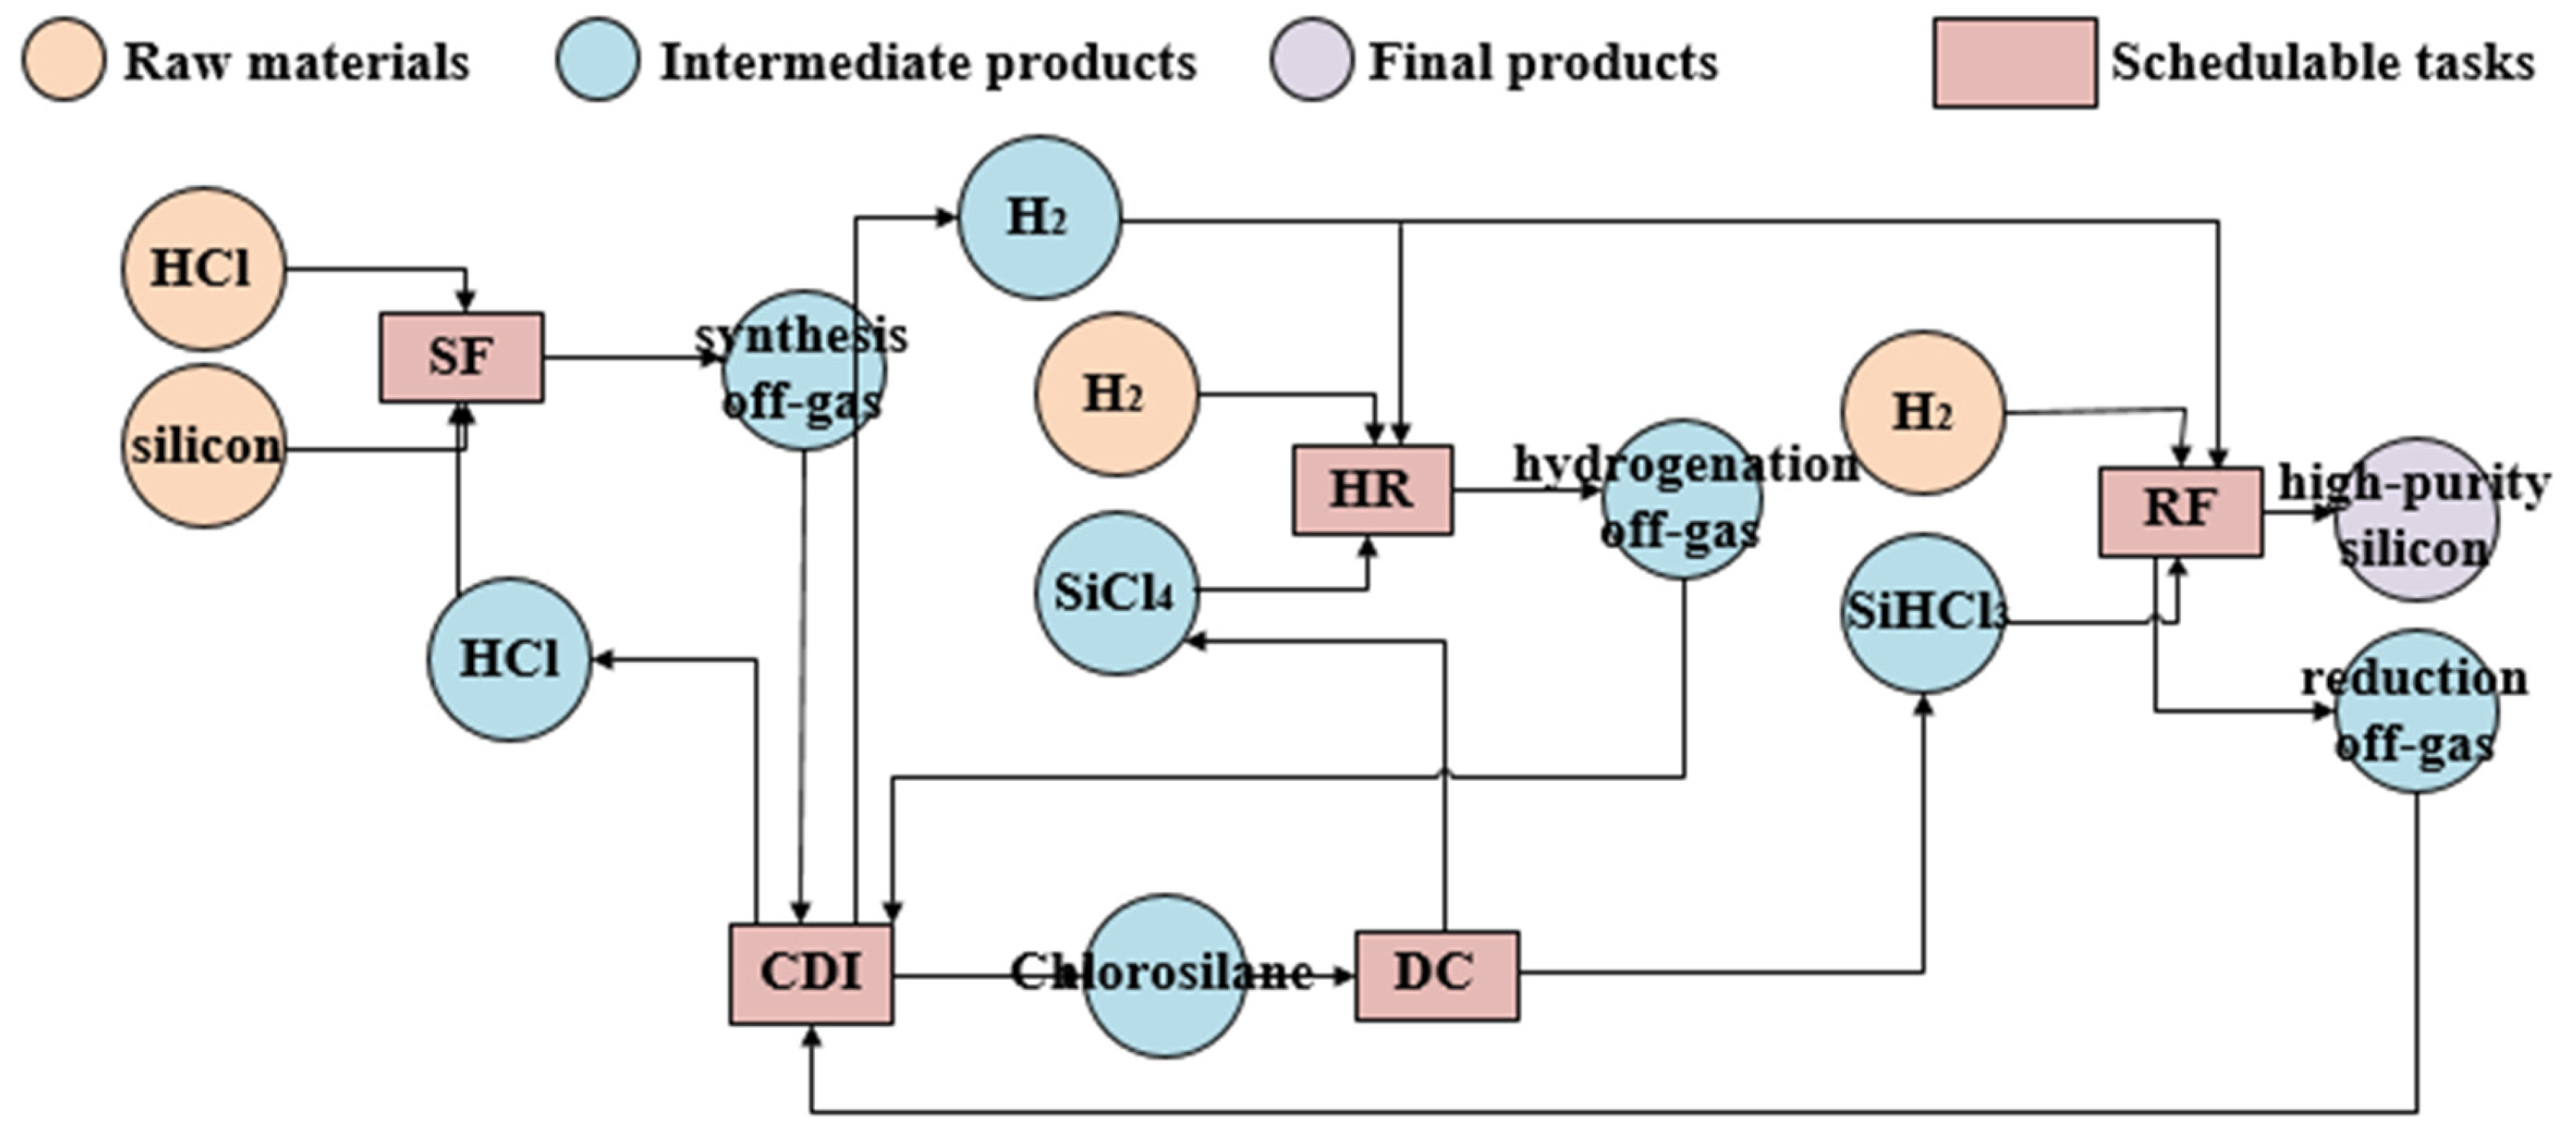
  • An Analysis of Polysilicon Production Sequential Requirements: Focusing on the most common polysilicon production method, the improved Siemens method, this study analyzes the production processes involved in its synthesis, purification, reduction, exhaust gas recovery, and hydrogenation stages. From this analysis, the production requirements, core electricity-consuming equipment, equipment adjustment methods, and material flow for each stage are extracted, providing a foundation for constructing a polysilicon production STN model and proposing constraints on the sequential requirements of production.
  • The Development of Polysilicon Optimized Scheduling Model: Based on the polysilicon production STN model, an optimized day-ahead scheduling model that considers the sequential requirements of polysilicon production is established in the context of time-of-use electricity pricing. This model optimizes the operating status of the production equipment at each stage, with the objective of minimizing the overall electricity cost for the polysilicon plant. It provides an economically optimal and feasible production plan for polysilicon enterprises, encouraging them to actively adjust their production schedules to enable their off-peak and peak-avoidance operation without affecting normal production. The constraints considered include material balance, electricity balance, storage, production quantity, purification task, and reduction task constraints. At the same time, by comparing the equipment operation status and material reserves of polysilicon plants under different process constraints, the necessity of considering all production constraints within the model in this paper is illustrated.
  • The Analysis of Polysilicon Adjustable Capacity: The optimized scheduling model is run under different order quantities to analyze how electricity consumption changes as the order volume increases. The results show that the adjustable capacity of polysilicon enterprises varies with different order volumes. Specifically, when the ordered output is small, the output requirements can be met while only running the plant during the valley periods of electricity prices; with an increase in the ordered output, only running the plant during the valley periods of electricity prices cannot meet the output requirements of the order, and the plant needs to be operated during flat sections or even during peak periods of the electricity price. At this time, in order to meet the requirements of the order, the space available for shifting electricity consumption is compressed to meet the order requirements, resulting in a decrease in its capacity for adjustments.
In addition, similar to the polysilicon load, most processed industrial loads, such as iron and steel loads, electrolytic copper loads, cement loads, etc., are coupled with different parts of the production process through the input and output of materials, which can also be decoupled by using the production process modeling method proposed in this paper, which is based on the state–task network. However, it should be noted that different industries have their specific production requirements; just as the polysilicon industry needs to consider purification task constraints and reduction task constraints, other industries would also need to add their industry characteristics to the general model. Take a short-flow steel load as an example: the main production links include primary smelting, decarburization, refining, continuous casting and rolling, and it is necessary to add special waiting time constraints to prevent the equipment from staying outside of the furnace for too long, resulting in the quality of the cast embryo being damaged. When taking an electrolytic copper load as an example, the main production links include the preparation of materials, fire refining, enhanced melting and electrolytic refining, and it is also necessary to consider the boundary constraints on the control of continuous equipment, such as electrolytic refining needing to consider the upper and lower limits of the electrolyzer’s temperature; if the temperature is too high, it will lead to bubbles and crusts on the surface of the metal, affecting the output and quality of the product, while a temperature that is too low may cause the electrolyzer to condense, affecting production and even causing safety problems. When taking a cement load as an example, the main production links include crushing raw material, grinding raw material, fuel grinding, clinker firing and cement grinding; considering the production habits of the cement industry, it is necessary to add additional continuous work constraints for rotary kilns.

Author Contributions

Conceptualization, X.W. and B.C.; methodology, Y.X.; software, S.L.; validation, X.W. and B.C.; formal analysis, X.Y.; investigation, J.B.; resources, X.W.; data curation, B.C.; writing—original draft preparation, X.W. and B.C.; writing—review and editing, Y.X. and S.L.; visualization, X.Y.; supervision, J.B.; project administration, X.W.; funding acquisition, B.C. All authors have read and agreed to the published version of the manuscript.

Funding

The research was supported by the Science and Technology Project of State Grid Sichuan Electric Power Company, grant number 521997230019.

Data Availability Statement

The original contributions presented in the study are included in the article, further inquiries can be directed to the corresponding author.

Conflicts of Interest

Author Xi Ye is employed by the State Grid Sichuan Electric Power company. The authors declare that the research was conducted in the absence of any commercial or financial relationships that could be construed as a potential conflict of interest.

References

  1. Gholian, A.; Mohsenian-Rad, H.; Hua, Y.; Qin, J. Optimal Industrial Load Control in Smart Grid: A Case Study for Oil Refineries. In Proceedings of the 2013 IEEE Power & Energy Society General Meeting, Vancouver, BC, Canada, 21–25 July 2013. [Google Scholar]
  2. Tan, M. Analysis and Scheduling of Slab Hot Rolling Load Based on Power Demand Response. Ph.D. Thesis, Xiangtan University, Xiangtan, China, 2015. [Google Scholar]
  3. Liu, X.; Wang, Z.; Gao, F.; Wu, J.; Guan, X.; Zhou, D. Power Consumption Response of High Energy-Consuming Enterprises under Time-of-Use Pricing. Autom. Electr. Power Syst. 2014, 38, 41–49. [Google Scholar]
  4. Zhang, Q.; Wang, X.; Wang, J.; Feng, C.; Liu, L. A Review of Demand Response Research in Power Markets. Autom. Electr. Power Syst. 2008, 32, 97–106. [Google Scholar]
  5. Tian, S.; Wang, B.; Zhang, J. Key Technologies of Demand Response under Smart Grid Conditions. Proc. Chin. Soc. Electr. Eng. 2014, 34, 3576–3589. [Google Scholar]
  6. Tao, X.; Zhou, W. Research Progress and Literature Review on Power Demand Response. J. Beijing Inst. Technol. (Soc. Sci. Ed.) 2014, 16, 32–40. [Google Scholar]
  7. Lu, R.; Bai, R.; Huang, Y.; Li, Y.; Jiang, J.; Ding, Y. Data-Driven Real-Time Price-Based Demand Response for Industrial Facilities Energy Management. Appl. Energy 2021, 283, 116291. [Google Scholar] [CrossRef]
  8. Luo, Z.; Hong, S.H.; Kim, J.B. A Price-Based Demand Response Scheme for Discrete Manufacturing in Smart Grids. Energies 2016, 9, 650. [Google Scholar] [CrossRef]
  9. Zhang, H. Dynamic Economic Dispatch of Power Systems with Wind Farms Based on User-Side Interaction. Master’s Thesis, Shenyang Agricultural University, Shenyang, China, 2021. [Google Scholar]
  10. Huang, Y.; Kang, C.; Li, H.; Xia, Q.; Wang, G.; Hu, Z. Modeling and Application of Electricity Demand Curves. New Technol. Electr. Eng. Energy 2004, 2004, 29–33. [Google Scholar]
  11. Ding, W.; Yuan, J.; Hu, Z. Decision-Making Model for Time-of-Use Pricing Based on User Price Response and Satisfaction. Autom. Electr. Power Syst. 2005, 2005, 14–18. [Google Scholar]
  12. Liu, J. Benefit Assessment and Characteristic Analysis of Power Demand Side Response. Ph.D. Thesis, Shandong University, Jinan, China, 2014. [Google Scholar]
  13. De, J.C.; Hobbs, B.F.; Belmans, R. Optimal Generation Mix with Short-Term Demand Response and Wind Penetration. IEEE Trans. Power Syst. 2012, 27, 830–839. [Google Scholar]
  14. Li, G. Research on Time-of-Use Pricing Optimization Based on User Demand Response. Master’s Thesis, Nanjing University of Posts and Telecommunications, Nanjing, China, 2023. [Google Scholar]
  15. Zhao, N. Research on Demand Response Characteristics Modeling and Application for Energy Interconnection. Ph.D. Thesis, Southeast University, Nanjing, China, 2022. [Google Scholar]
  16. Ruan, W.; Wang, B.; Li, Y.; Yang, S. Research on User Response Behavior under Time-of-Use Pricing. Power Syst. Technol. 2012, 36, 86–93. [Google Scholar]
  17. Hu, Y.; Li, Y.; Chen, L. Multi-Objective Optimization of Time-of-Use Price for Tertiary Industry Based on Generalized Seasonal Multi-Model Structure. IEEE Access 2019, 7, 89234–89244. [Google Scholar] [CrossRef]
  18. Li, Z. Assessment of the Potential for Power Demand Response and Its Applications. Master’s Thesis, South China University of Technology, Guangzhou, China, 2018. [Google Scholar]
  19. Yang, H.; Shi, R.; Ma, Y. Scheduling Strategy for Power Storage Systems Considering Multiple Time-of-Use Prices and Benefit Potential. Power Autom. Equip. 2021, 41, 130–137. [Google Scholar]
  20. Sun, W.; Li, S. Research on Time-of-Use Pricing in Power Demand Side Management. Electr. Appl. 2008, 2008, 63–66. [Google Scholar]
  21. Hou, H.; Fan, H.; Xie, J.; Luo, J.; Ke, X. Optimal Charging Strategy for Rational Price Users under Time-of-Use Pricing. China Electr. Power 2018, 51, 171–178. [Google Scholar]
  22. Liao, S.; Xiao, Y.; Xu, J.; Li, L.; Xu, X.; Jia, H. Economic Dispatch Model Considering Production Process of the Energy-Intensive Industrial Load Under Demand Response. Autom. Electr. Power Syst. 2024, in press. [Google Scholar]
  23. Yang, M. Optimization Scheduling of Power Load Based on Demand Side Management. Master’s Thesis, Huazhong University of Science and Technology, Wuhan, China, 2019. [Google Scholar]
  24. Liao, S.; Xie, H.; Xu, J.; Sun, Y.; Ke, D.; Jiang, Y. Demand Response Control Strategy for High-energy-consuming Loads Aligned with Demand-side Market Response Transaction Rules. Proc. Chin. Soc. Electr. Eng. 2024, in press. [Google Scholar]
  25. Liao, S.; Bian, S.; Xu, J.; Ke, D.; Sun, Y. Evaluation of Grid-load Interactive Adjustable Capacity of Electrolytic Aluminum Load Considering Optimization of Electrolytic Cell Energy Flow. Proc. Chin. Soc. Electr. Eng. 2024, in press. [Google Scholar]
  26. Hou, Y. Theoretical Analysis and Modeling of the Improved Siemens Method for Preparing Polycrystalline Silicon. Ph.D. Thesis, Kunming University of Science and Technology, Kunming, China, 2014. [Google Scholar]
  27. Xiao, Y. Energy Consumption Analysis and Prediction of the Reduction Process in Polycrystalline Silicon Reduction Furnaces. Master’s Thesis, Guangdong University of Technology, Guangzhou, China, 2019. [Google Scholar]
  28. Xiao, Y.; Liao, S.; Li, L.; Yang, J.; He, X.; Liang, J. Optimization Scheduling Strategy Considering Polycrystalline Silicon Production Process under Combined Demand Response. In Proceedings of the 2024 6th Asia Energy and Electrical Engineering Symposium (AEEES), Chengdu, China, 28–31 March 2024. [Google Scholar]
  29. Yao, M.; Han, X.; Zheng, Y.; Hu, Z. Thoughts on Promoting Participation of High Energy-Consuming Industries in the Power Auxiliary Service Market. China Energy 2018, 40, 22–26+47. [Google Scholar]
  30. Zhang, X.; Hug, G.; Harjunkoski, I. Cost-Effective Scheduling of Steel Plants with Flexible EAFs. IEEE Trans. Smart Grid 2017, 8, 239–249. [Google Scholar] [CrossRef]
  31. Chen, Y. Research on Frequency Control Strategy of Isolated Wind Power Grid with High Permeability Based on Polysilicon Load Control. Master’s Thesis, Wuhan University, Wuhan, China, 2018. [Google Scholar]
  32. Jiang, X.; Xu, J.; Liao, S.; Sun, Y. Cooperative control method for multi-type load coordination to stabilize wind power fluctuation in industrial parks considering the difference of industrial users’ response intentions. Geomat. Eng. Sci. Wuhan Univ. 2022, 55, 876–885. [Google Scholar]
  33. Lv, H.; Deng, B.; Zhang, P.; Han, G.; Zhang, K. Optimal Scheduling of Industrial Loads in Chemical Park in Low-Carbon. In Proceedings of the 2024 IEEE 2nd International Conference on Power Science and Technology (ICPST), Dali, China, 9–11 May 2024; pp. 2035–2041. [Google Scholar]
  34. Dai, X.; Che, H.; Xiao, D.; He, Q. A Review of the Application and Research of Industrial Demand Response Technologies in the Power Market Environment. Power Grid Technol. 2022, 46, 4169–4186. [Google Scholar]
  35. Ding, Y.M.; Hong, S.H.; Li, X.H. A Demand Response Energy Management Scheme for Industrial Facilities in Smart Grid. IEEE Trans. Ind. Inform. 2014, 10, 2257–2269. [Google Scholar] [CrossRef]
  36. Lin, J.; Shi, J.; Wen, F.; Li, L.; Qian, F.; Xiang, L. Coordinated Optimization Scheduling of Industrial Microgrids Considering Controllable Loads. Electr. Power Constr. 2018, 39, 1–9. [Google Scholar]
Figure 1. Schematic diagram of polysilicon production.
Energies 17 06048 g001
Figure 2. Flowchart of polysilicon production using the improved Siemens method.
Energies 17 06048 g002
Figure 3. STN model of polysilicon production.
Energies 17 06048 g003
Figure 4. Solution procedure for the scheduling optimization model of a polysilicon plant with time-of-use electricity pricing and considering production timing requirement constraints.
Energies 17 06048 g004
Figure 5. Daily production schedule of the polysilicon plant.
Energies 17 06048 g005
Figure 6. Comparison of time-of-use electricity prices and power usage at the polysilicon plant.
Energies 17 06048 g006
Figure 7. Variation in high-purity trichlorosilane inventory over time.
Energies 17 06048 g007
Figure 8. Variation in chlorosilane inventory over time.
Energies 17 06048 g008
Figure 9. Power usage of different time-of-use pricing strategies over the entire day.
Energies 17 06048 g009
Figure 10. Power usage of different order quantities over the entire day.
Energies 17 06048 g010
Figure 11. Power usage comparison of different order quantities across different electricity price periods.
Energies 17 06048 g011
Table 1. Rated power of polysilicon plant equipment.
EquipmentSynthesis
Furnace
Distillation
Column
Reduction
Furnace
CDI Exhaust Gas
Recovery System
Hydrogenation
Furnace
Production StageSynthesisPurificationReductionGas RecoveryHydrogenation
Rated Power
(kW)
2305857550345
Number22222
Table 2. Time-of-use pricing strategy for Sichuan Province industrial consumers.
PeakFlatValley
Time Period10:00–12:00
15:00–21:00
07:00–10:00
12:00–15:00
21:00–23:00
00:00–07:00
23:00–24:00
Price
(CNY/kWh)
0.94270.58920.2357
Table 3. Electricity costs under different situations.
SituationSituation 1Situation 2Situation 3
Electricity Cost (CNY 10,000)1.55082.48533.0860
Table 4. Electricity costs under different conditions.
Modeling MethodModeling Method 1Modeling Method 2Modeling Method 3
Total Electricity Cost (CNY 10,000)/2.53003.0860
Electricity Cost of the Reduction Task (CNY 10,000)1.55081.84202.3228
Table 5. Electricity costs under different time-of-use pricing strategies.
StrategyStrategy 1Strategy 2Strategy 3Strategy 4
Electricity Cost (CNY 10,000)7.37136.83026.95007.0022
Table 6. Electricity costs under different order quantity constraints.
Order QuantityOrder Quantity 1Order Quantity 2Order Quantity 3
Electricity Cost (CNY 10,000)2.78123.08603.7395
Disclaimer/Publisher’s Note: The statements, opinions and data contained in all publications are solely those of the individual author(s) and contributor(s) and not of MDPI and/or the editor(s). MDPI and/or the editor(s) disclaim responsibility for any injury to people or property resulting from any ideas, methods, instructions or products referred to in the content.

