
Comprehensive Comparative Review of the Cement Experimental Testing Under CO2 Conditions


Abstract
1. Introduction
2. Chemical Compositions and Cement Reactions
2.1. Chemical Composition of Class G Cement
2.2. Cement Hydration Reaction
2.3. Reaction of Silicate Phase
2.4. Reaction of Aluminate Phase
2.5. Reaction of Ferrite Phase
- Ferrite + gypsum + water → ettringite + ferric aluminum hydroxide + lime
- 2.
- While in the second step, ferrite will react with the produced ettringite and yield garnet
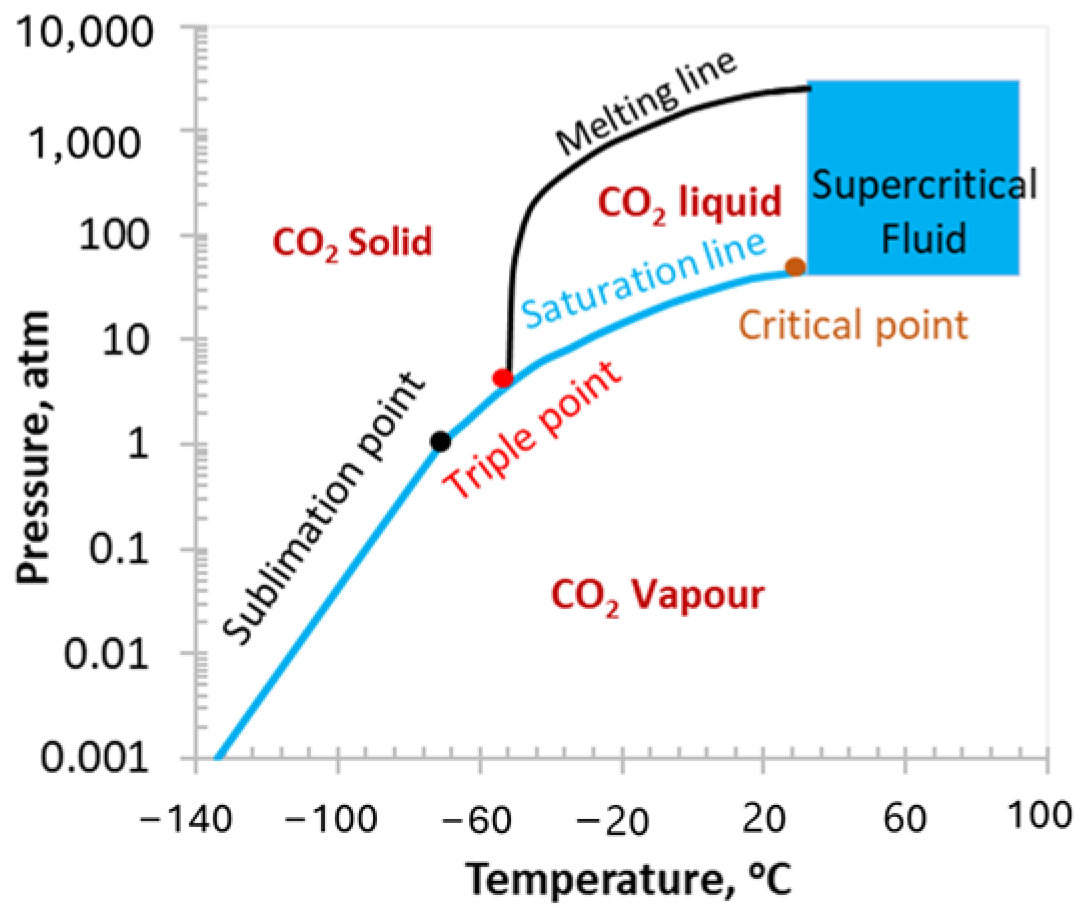
2.6. Supercritical CO2
2.7. Reaction of Cement with Carbon Dioxide
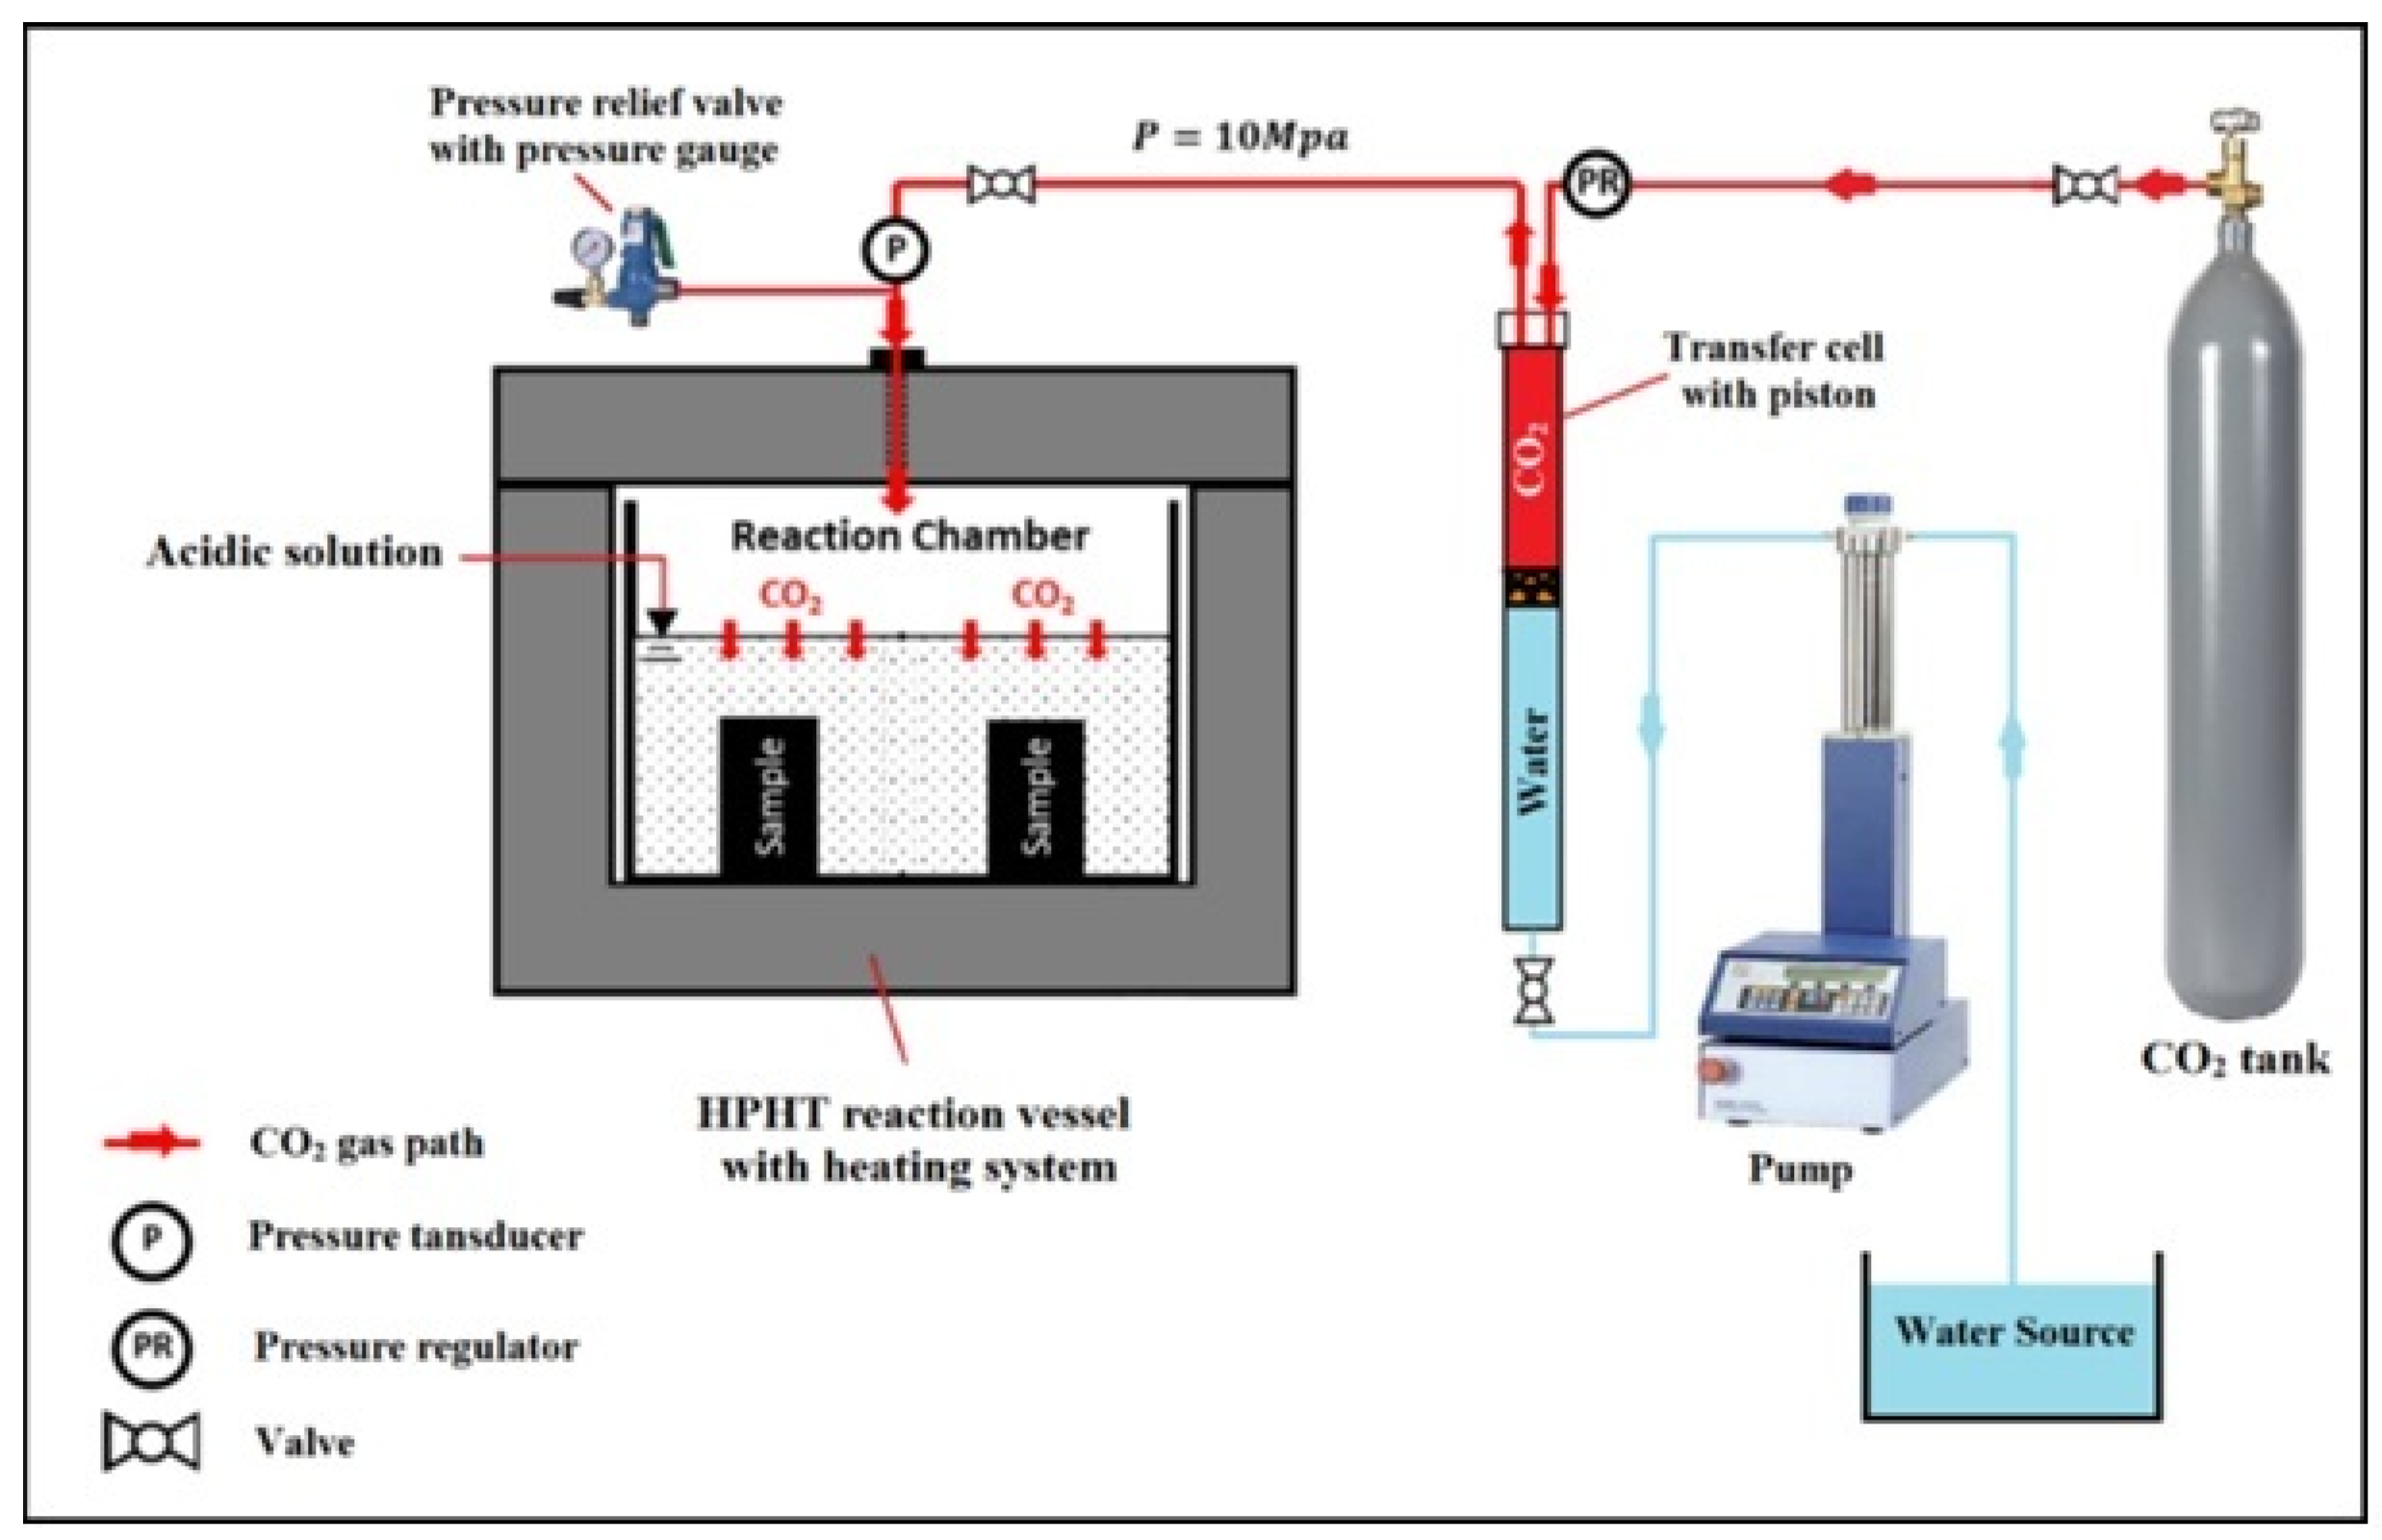
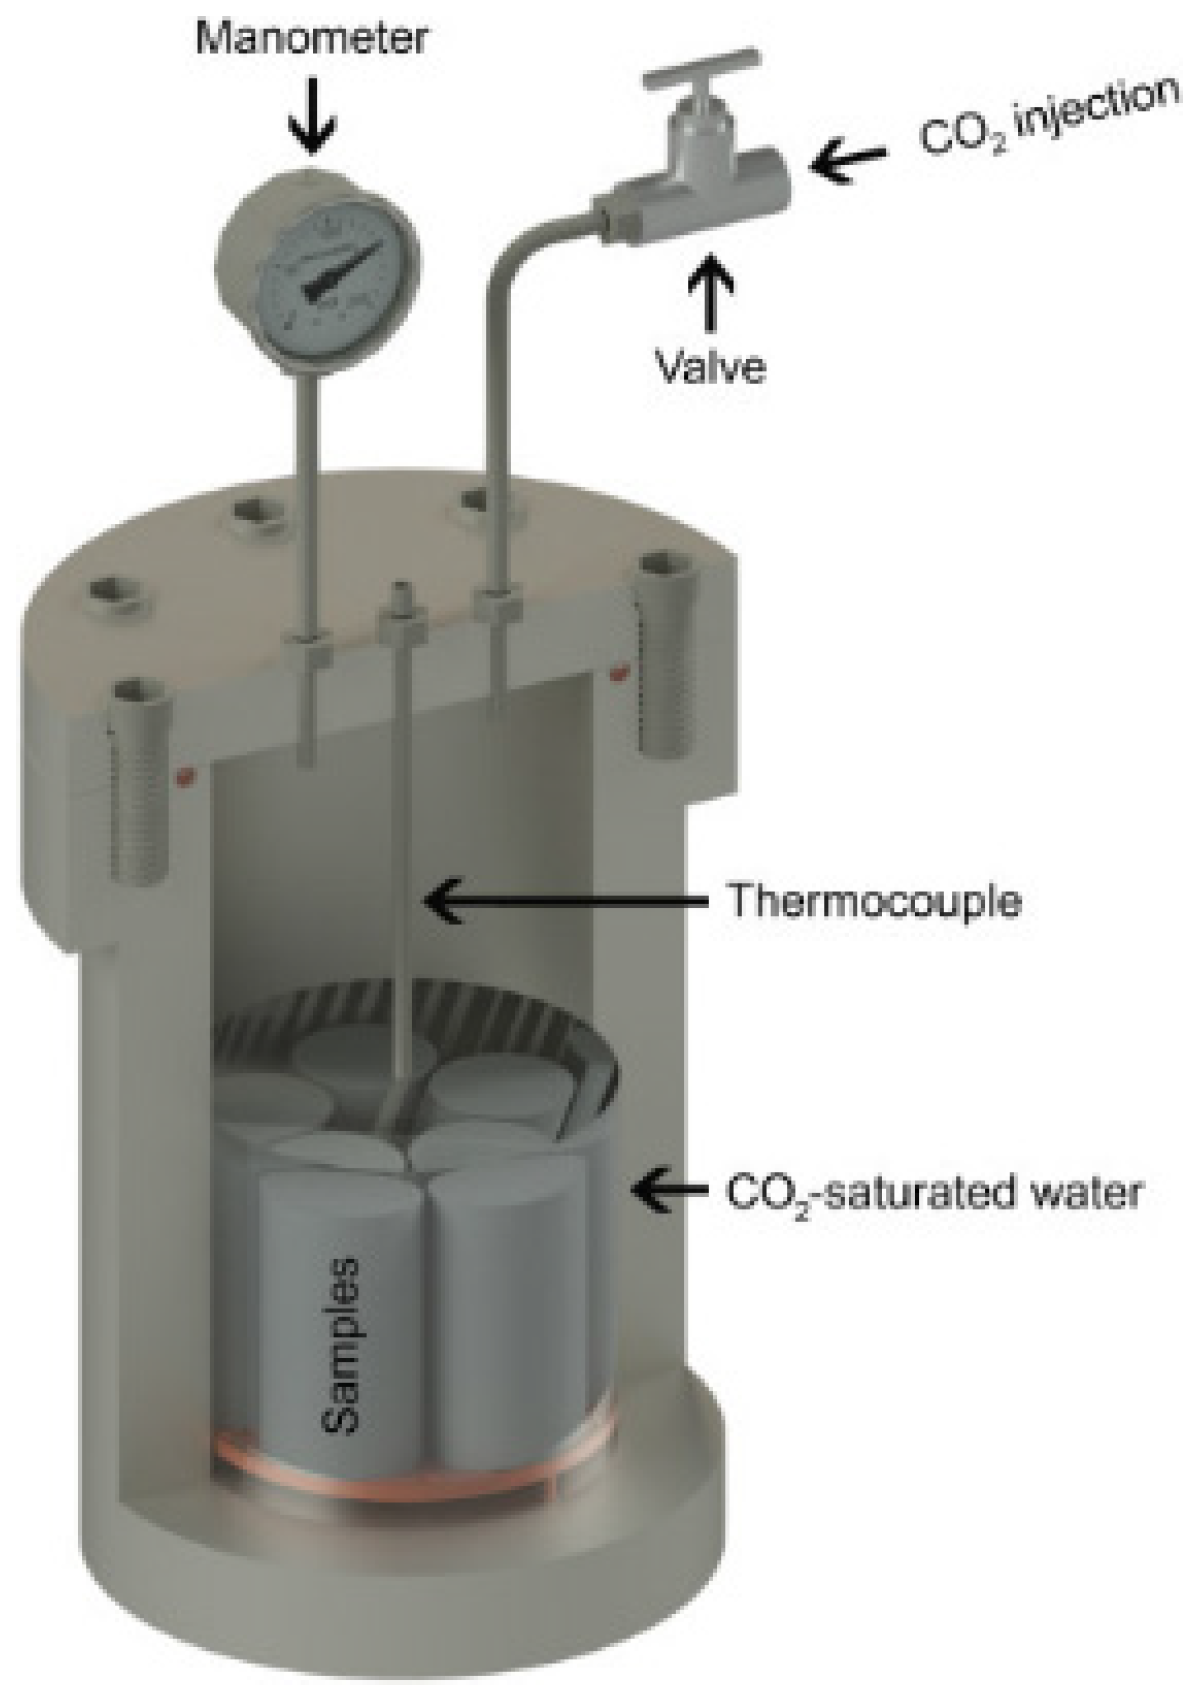
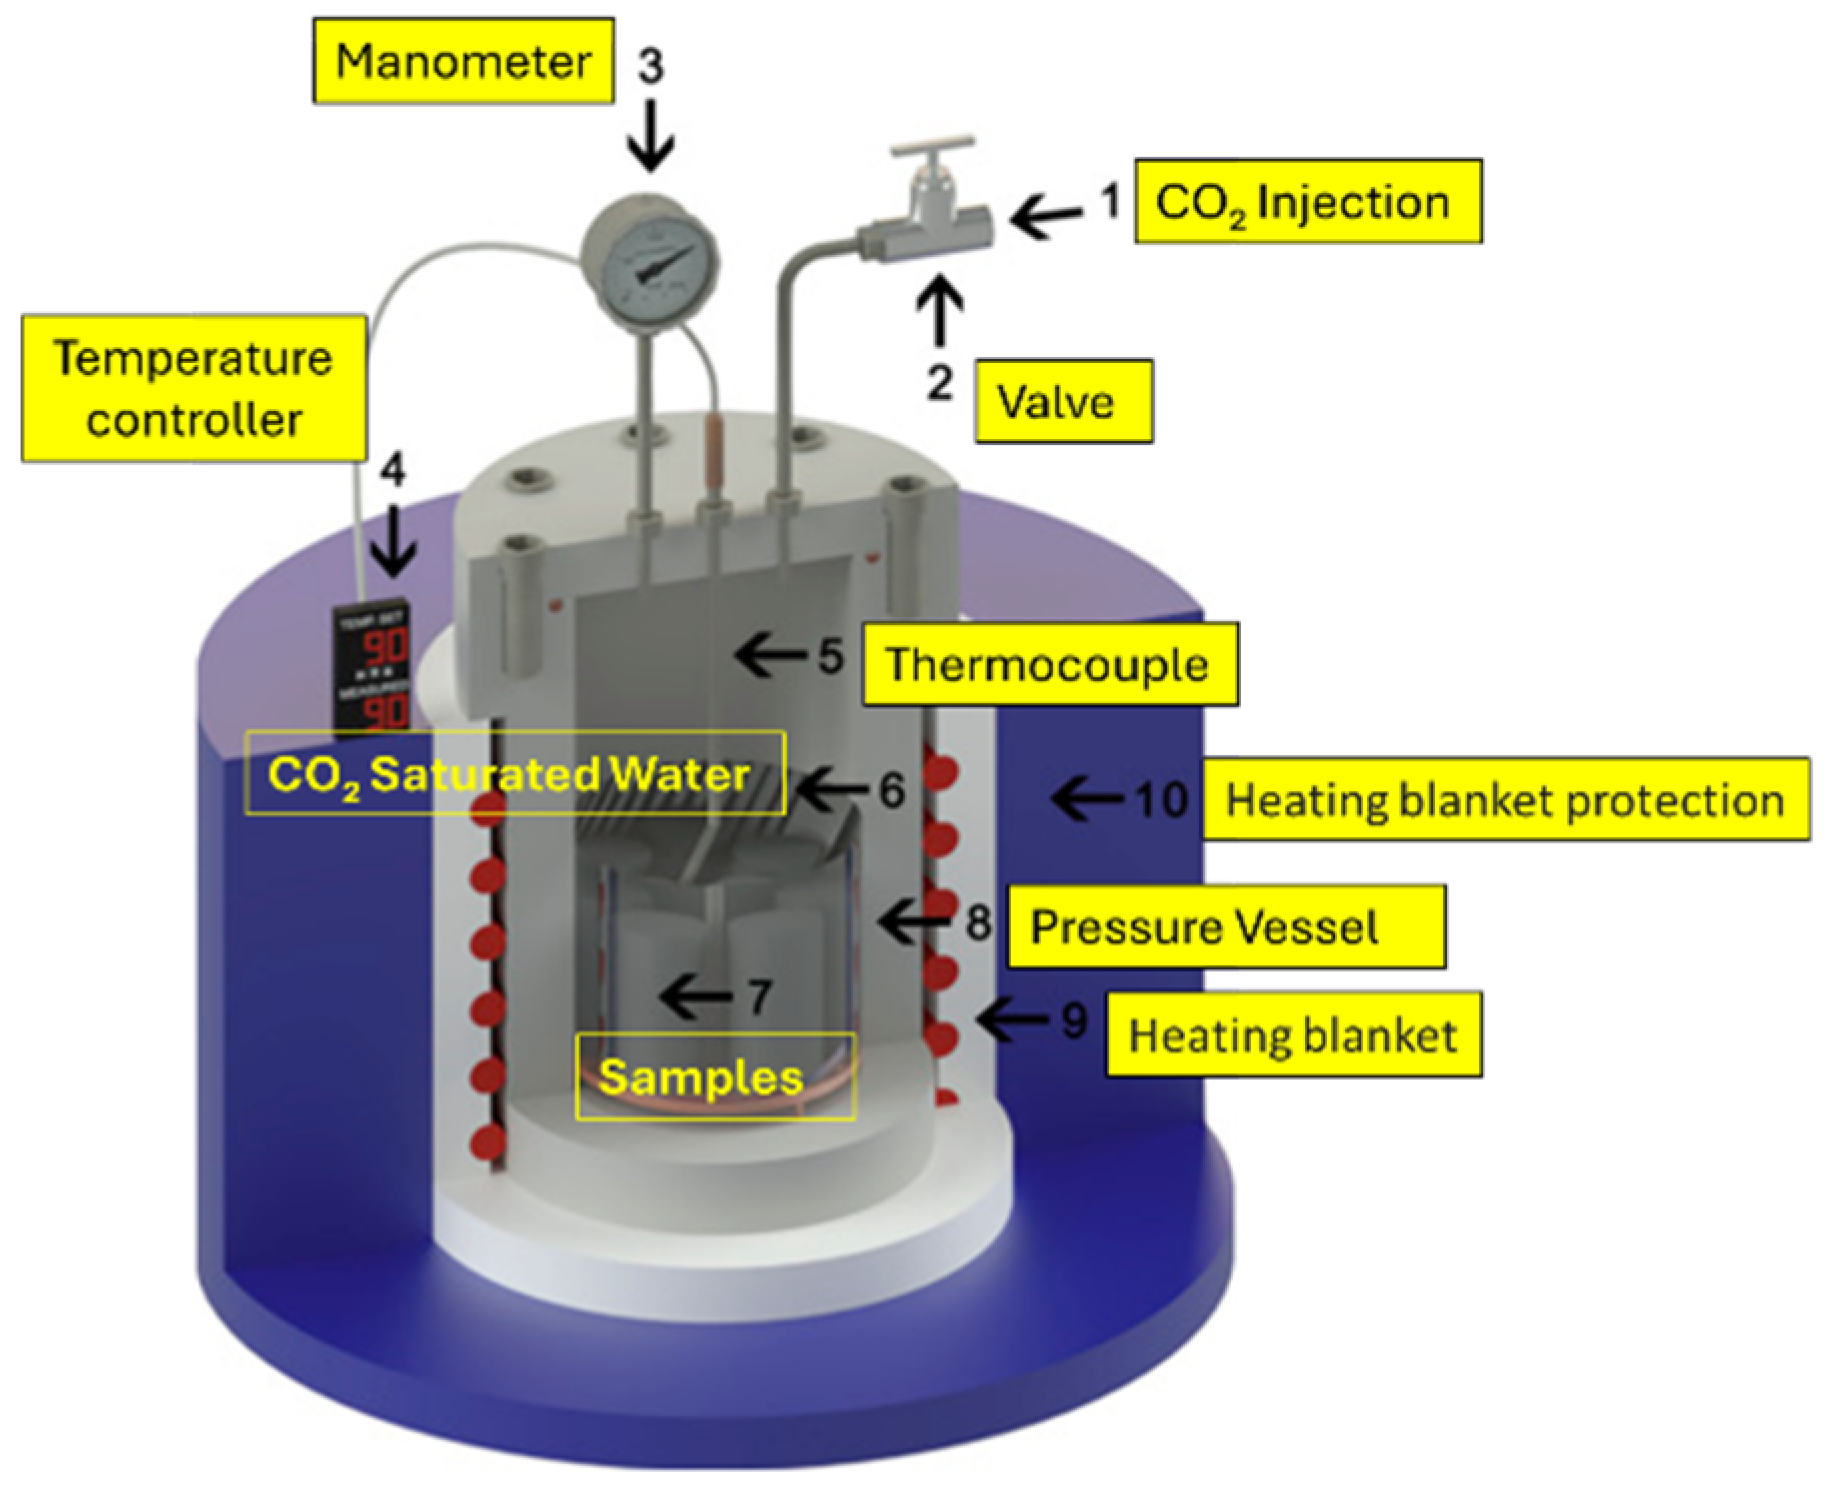
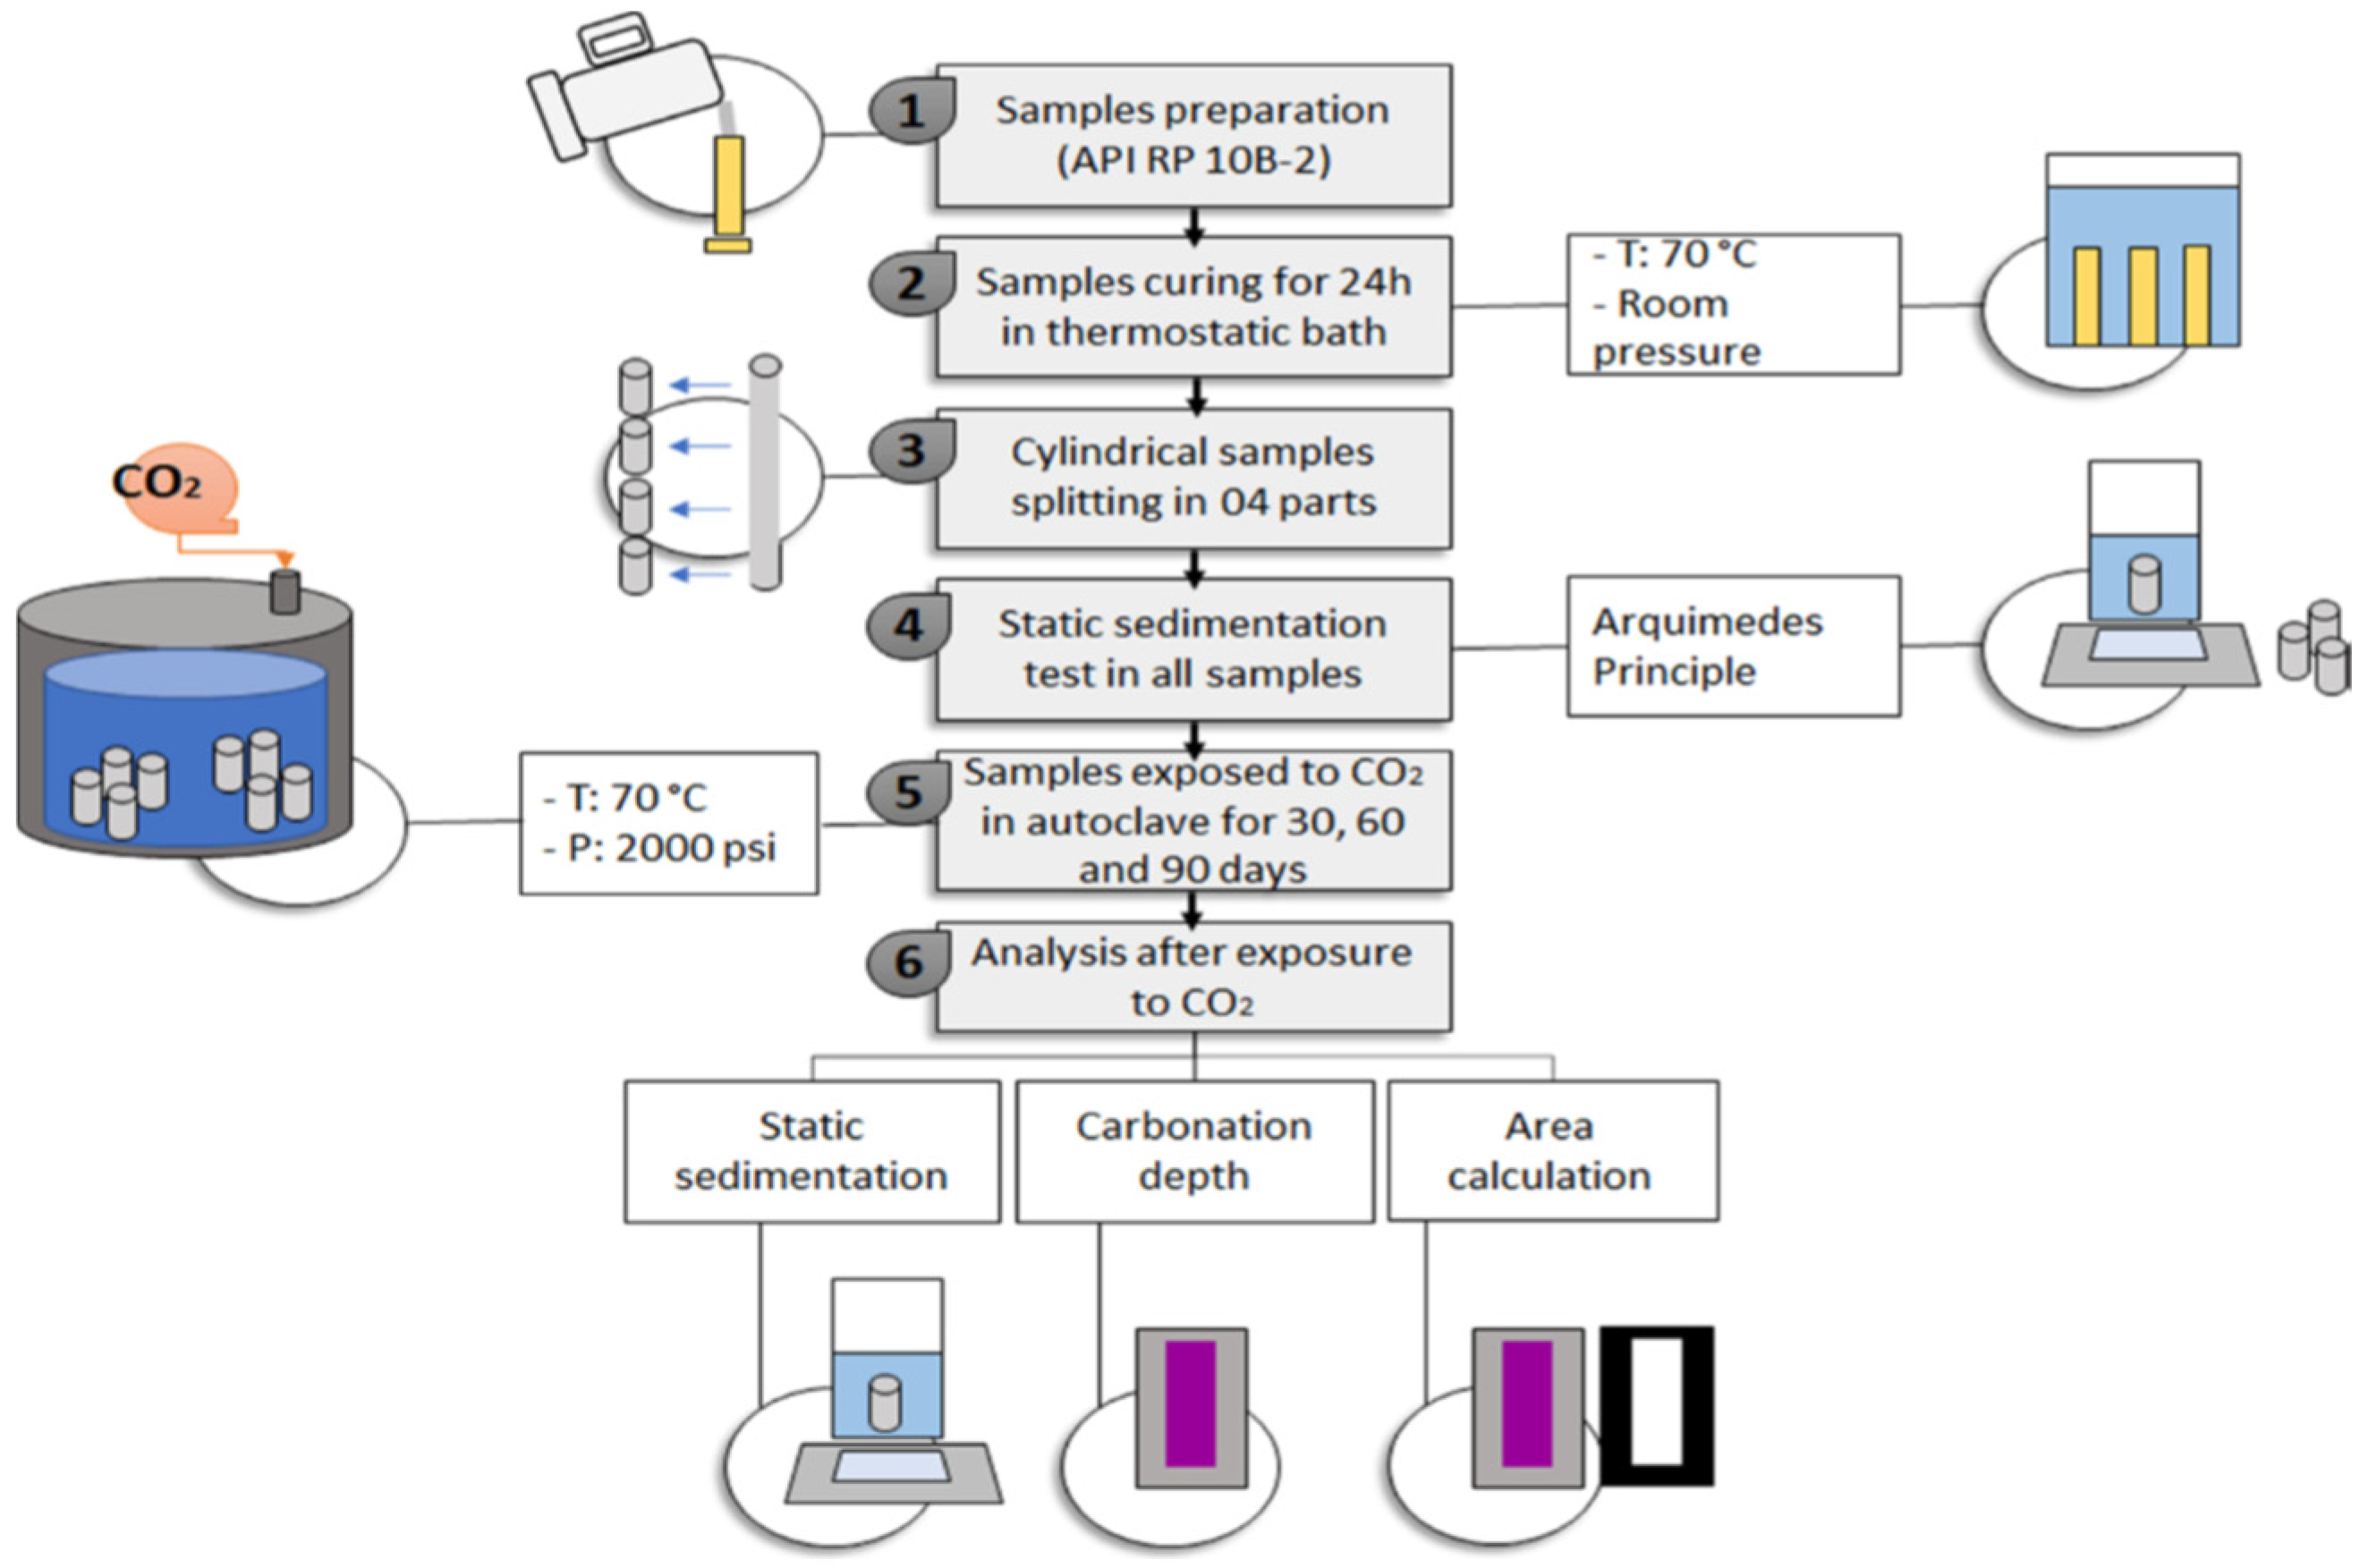
3. Review of Experimental Testing by Different Authors
3.1. Case Study 1
3.2. Case Study 2
3.3. Case Study 3
3.4. Case Study 4
3.5. Case Study 5
3.6. Case Study 6
3.7. Case Study 7
3.8. Case Study 8
3.9. Case Study 9
3.10. Case Study 10
3.11. Case Study 11
3.12. Case Study 12
3.13. Case Study 13
3.14. Case Study 14
3.15. Case Study 15
3.16. Case Study 16
3.17. Case Study 17
3.18. Case Study 18
3.19. Case Study 19
3.20. Case Study 20
3.21. Case Study 21
3.22. Case Study 22
3.23. Case Study 23
3.24. Case Study 24
3.25. Case Study 25
3.26. Case Study 26
3.27. Case Study 27
3.28. Case Study 28
3.29. Case Study 29
3.30. Case Study 30
3.31. Case Study 31
3.32. Case Study 32
3.33. Case Study 33
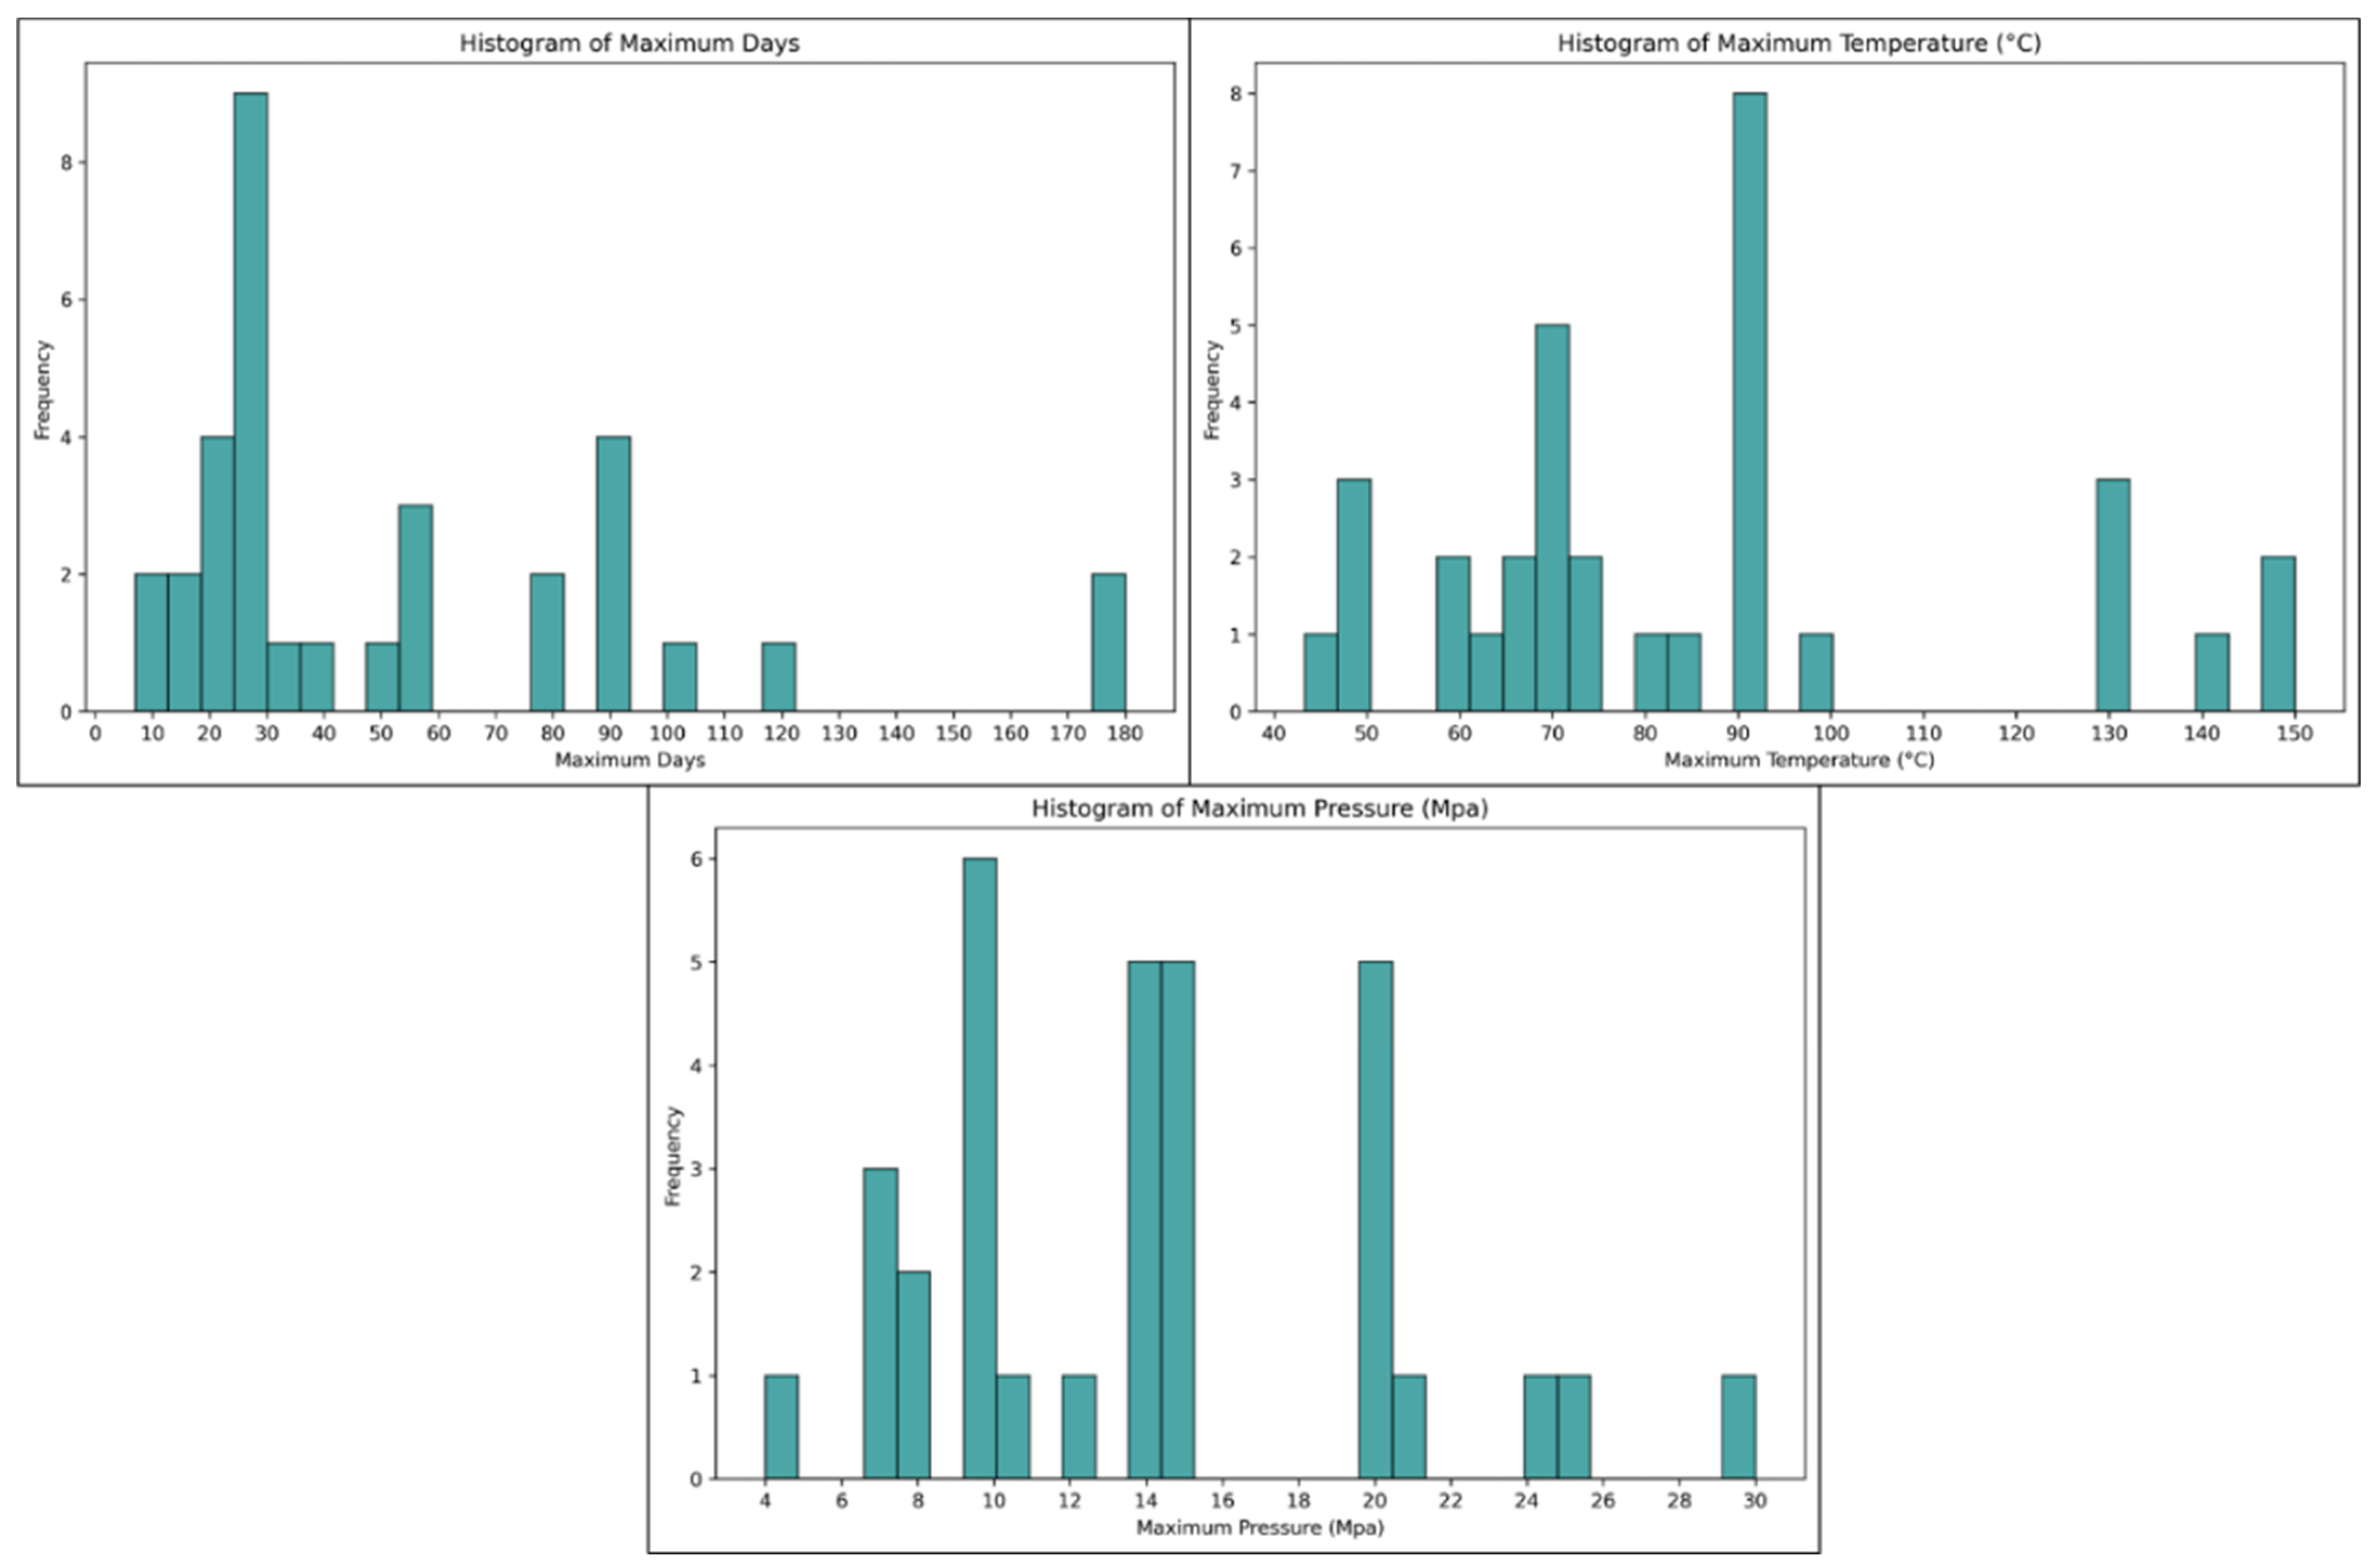
4. Discussions
5. Conclusions
6. Recommendation for Further Research
- A standardized protocol of carbonation testing should be developed as it will help to compare the results of one test with the other, which will assist in developing better well cement for the CCS wells.
- More tests in the dynamic conditions should be conducted to simulate the actual downhole condition of the CCS wells.
- For the integrity of the cement in the CCS well, numerical models should be used and can be verified through the long-term carbonation testing of the cement.
- Different studies should be conducted on various cement additives and formulations so that the cement recipe can be optimized for the carbon storage wells.
- For a better assessment of the morphological properties of the cement, techniques such as SEM and X-ray tomography should be extensively used.
Author Contributions
Funding
Data Availability Statement
Conflicts of Interest
References
- Smith, J.L.; Bryz-Gornia, C.J.; Bhatia, S.K.; Walowsky, D. A comparative study of RECPs: Index properties and field performance. Geotech. Spec. Publ. 2005, 1607–1616. [Google Scholar] [CrossRef]
- Parry, M.; Canziani, O.; Palutikof, J.; van der Linden, P.; Hanson, C. Climate Change 2007: Impacts, Adaptation and Vulnerability; Cambridge University Press: Cambridge, UK, 2007. [Google Scholar]
- Cox, P.M.; Betts, R.A.; Jones, C.D.; Spall, S.A.; Totterdell, I.J. Acceleration of global warming due to carbon-cycle feedbacks in a coupled climate model. Nature 2000, 408, 184–187. [Google Scholar] [CrossRef] [PubMed]
- Abdullah, M.; Baharak, S. Sustainable conversion of natural gas to hydrogen using transition metal carbides. Int. J. Hydrogen Energy 2024, 90, 61–103. [Google Scholar] [CrossRef]
- Fawzy, S.; Osman, A.I.; Doran, J.; Rooney, D.W. Strategies for mitigation of climate change: A review. Environ. Chem. Lett. 2020, 18, 2069–2094. [Google Scholar] [CrossRef]
- UN. 2023. Emissions Gap Report 2023. UN. Available online: https://www.unep.org/resources/emissions-gap-report-2023 (accessed on 10 August 2024).
- Change, UN Climate. 2024. The Paris Agreement. What Is the Paris Agreement? UN. Available online: https://unfccc.int/process-and-meetings/the-paris-agreement (accessed on 10 August 2024).
- Nationalgrid. What Is Carbon Capture and Storage? 2024. Available online: https://www.nationalgrid.com/stories/energy-explained/what-is-ccs-how-does-it-work (accessed on 23 July 2024).
- Marchetti, C. On geoengineering and the CO2 problem. Clim. Chang. 1977, 1, 59–68. [Google Scholar] [CrossRef]
- Abid, K. Designing a New Cement Composition Using Agricultural Wastes for Underground Gas Storage. Ph.D. Thesis, Curtin University, Perth, Australia, 2018. [Google Scholar]
- Kaldi, J.G.; Gibson-Poole, C.M.; Payenberg, T.H.D. Geological Input to Selection and Evaluation of CO2 Geosequestration Sites. In Carbon Dioxide Sequestration in Geological Media; The American Association of Petroleum Geologists: Tulsa, OK, USA, 2009. [Google Scholar]
- Sathsarani, H.B.S.; Sampath, K.H.S.M.; Ranathunga, A.S. Utilization of fly ash-based geopolymer for well cement during CO2 sequestration: A comprehensive review and a meta-analysis. Gas Sci. Eng. 2023, 113, 204974. [Google Scholar] [CrossRef]
- Ghedan, S. Global Laboratory Experience of CO2-EOR Flooding. In SPE/EAGE Reservoir Characterization and Simulation; SPE: Abu Dhabi, UAE, 2009. [Google Scholar]
- Godec, M.; Koperna, G.; Petrusak, R.; Oudinot, A. Assessment of Factors Influencing CO2 Storage Capacity and Injectivity in Eastern U.S. Gas Shales. Energy Procedia 2013, 37, 6644–6655. [Google Scholar] [CrossRef]
- Bachu, S.; Didier, B.; John, B.; Robert, B.; Sam, H.; Niels, P.C.; Odd, M.M. CO2 storage capacity estimation: Methodology and gaps. Int. J. Greenh. Gas Control. 2007, 1, 430–443. [Google Scholar] [CrossRef]
- Raza, A.; Rezaee, R.; Gholami, R.; Rasouli, V.; Bing, C.H.; Nagarajan, R.; Hamid, M.A. Injectivity and quantification of capillary trapping for CO2 storage: A review of influencing parameters. J. Nat. Gas Sci. Eng. 2015, 26, 510–517. [Google Scholar] [CrossRef]
- Kutchko, B.G.; Strazisar, B.R.; Huerta, N.; Lowry, G.V.; Dzombak, D.A.; Thaulow, N. CO2 Reaction with Hydrated Class H Well Cement under Geologic Sequestration Conditions: Effects of Flyash Admixtures. Environ. Sci. Technol. 2009, 43, 3947–3952. [Google Scholar] [CrossRef]
- Sumra, Y.; Payam, S.; Zainah, I. The pH of Cement-based Materials: A Review. Cem. Mater. 2020, 35, 908–924. [Google Scholar] [CrossRef]
- Haghi, R.K.; Chapoy, A.; Pereira, L.M.C.; Yang, J.; Tohidi, B. pH of CO2 saturated water and CO2 saturated brines: Experimental measurements and modelling. Int. J. Greenh. Gas Control. 2017, 66, 190–203. [Google Scholar] [CrossRef]
- Abid, K.; Raoof, G.; Paul, C.; Brabha, H.N. A review on cement degradation under CO2-rich environment of sequestration projects. J. Nat. Gas Sci. Eng. 2015, 27, 1149–1157. [Google Scholar] [CrossRef]
- Kurdowski, W. Cement and Concrete Chemistry; Springer: Berlin/Heidelberg, Germany, 2014. [Google Scholar]
- de Souza, O.A.; Dweck, J.; de Moraes Rego Fairbairno, E.; da Fonseca Martins Gomes, O.V. Crystalline admixture effects on crystal formation phenomenaduring cement pastes’ hydration. J. Therm. Anal. Calorim. 2019, 139, 3361–3375. [Google Scholar] [CrossRef]
- Adams, N.; Tommie, C. Drilling Engineering: A Complete Well Planning Approach; Penn Well Pub. Co.: Red Lion, PA, USA, 1985. [Google Scholar]
- Mamlouk, M.S.; Zaniewski, J.P. Materials for Civil and Construction Engineers; Addison Wesley Longman, Inc.: Saddle River, NJ, USA, 1999. [Google Scholar]
- Kosmatka, S.H.; Wilson, M.L. Design and Control of Concrete Mixtures; Portland Cement Association: Skokie, IL, USA, 1988. [Google Scholar]
- Mindess, S.; Young, J.F.; Darwin, D. Concrete; Prentice-Hall, Inc.: Hoboken, NJ, USA, 1981. [Google Scholar]
- Ge, J.; Xu, F.; Wei, H.; Wang, Q.; Peng, H.; Zhou, J.; Li, H. The Influence Mechanism of Interfacial Characteristics between CSH and Montmorillonite on the Strength Properties of Cement-Stabilized Montmorillonite Soil. Materials 2023, 16, 7141. [Google Scholar] [CrossRef]
- Nelson, E.B. Well Cementing; Schlumberger Educational Service: Adelaide, Australia, 1990. [Google Scholar]
- Peach, J.; Eastoe, J. Supercritical carbon dioxide: A solvent like no other. Beilstein J. Org. Chem. 2014, 10, 1878–1895. [Google Scholar] [CrossRef]
- Kutchko, B.G.; Brian, R.S.; Dzombak, D.A.; Lowry, G.V.; Thaulow, N. Degradation of Well Cement by CO2 under Geologic Sequestration Conditions. Environ. Sci. Technol. 2007, 41, 4787–4792. [Google Scholar] [CrossRef]
- Omosebi, O.; Maheshwari, H.; Ahmed, R.; Shah, S.; Osisanya, S. Experimental study of the effects of CO2 concentration and pressure at elevated temperature on the mechanical integrity of oil and gas well cement. J. Nat. Gas Sci. Eng. 2017, 44, 299–313. [Google Scholar] [CrossRef]
- Nygaard, R. Well Design and Well Integrity; Energy and Environmental System Group: Newburgh, IN, USA, 2010. [Google Scholar]
- Berntsen, A.; Todorovic, J.; Raphaug, M.; Torsæter, M. Salt clogging during supercritical CO2 injection into a downscaled borehole. Int. J. Greenh. Gas Control. 2019, 86, 201–210. [Google Scholar] [CrossRef]
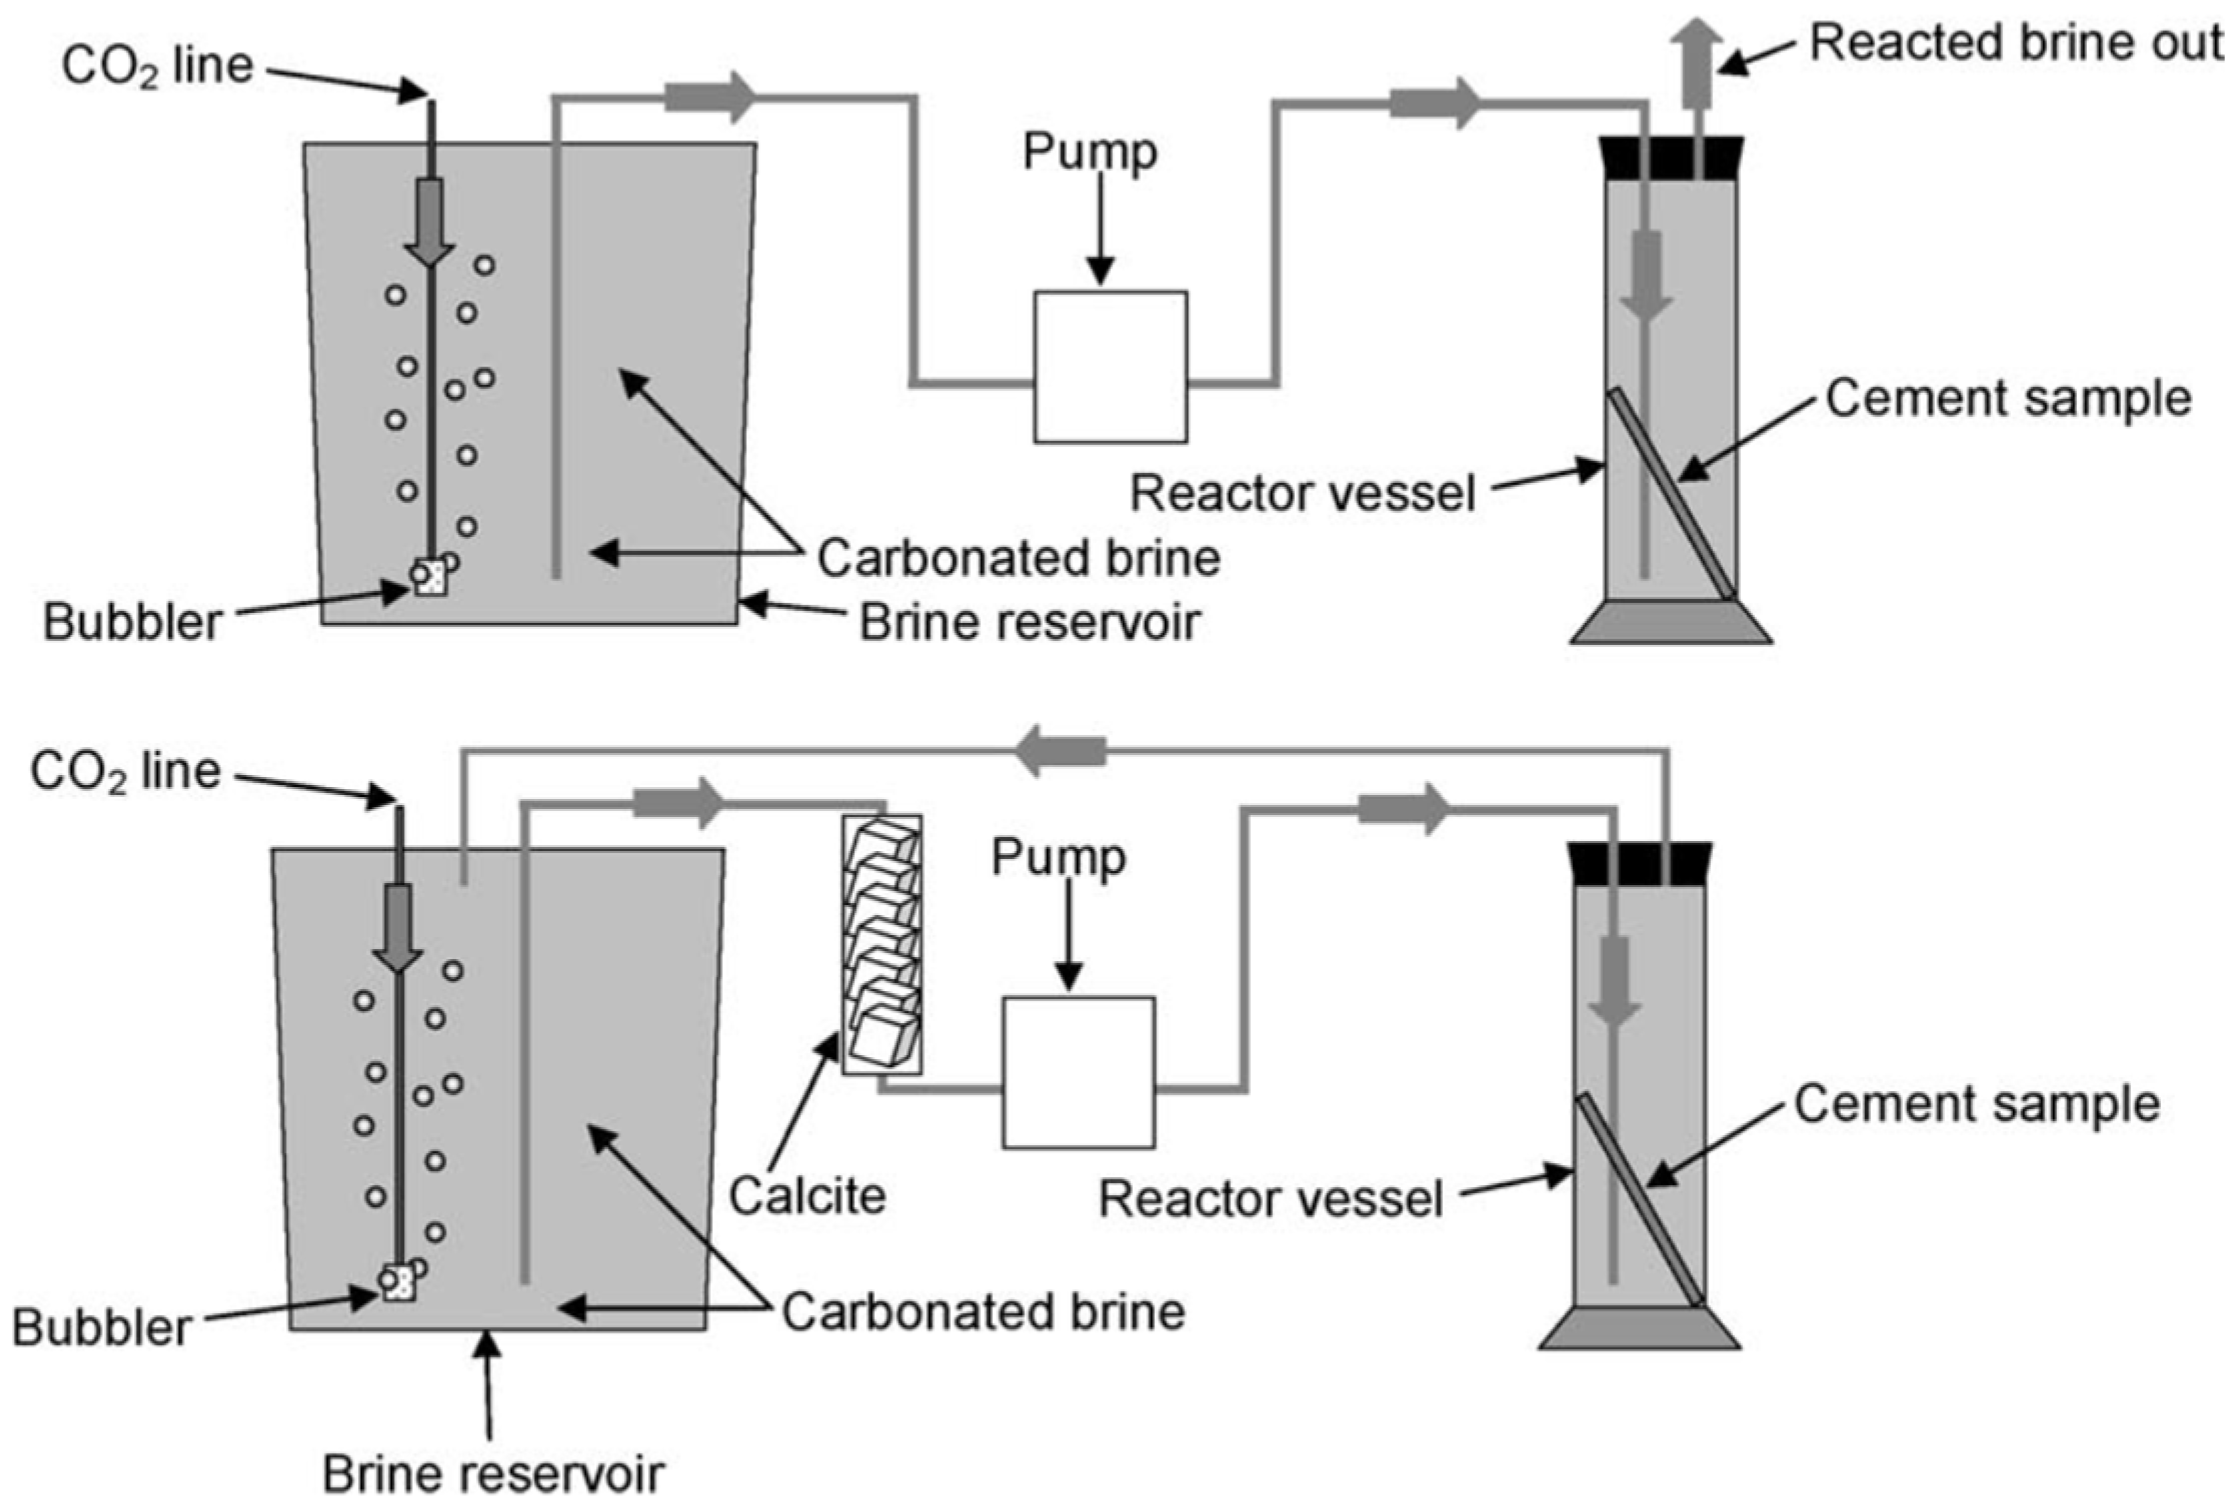
- Duguid, A.; Scherer, G.W. Degradation of oilwell cement due to exposure to carbonated brine. Int. J. Greenh. Gas Control. 2010, 4, 546–560. [Google Scholar] [CrossRef]
- API Recommended Practice 10B-2; Recommended Practice for Testing Well Cements. API: Washington, DC, USA, 2013.
- API Specication 10-A; Specification for Cements and Materials for Well Cementing. API: Washington, DC, USA, 2005.
- Laudet, J.-B.; Garnier, A.; Neuville, N.; Le Guen, Y.; Fourmaintraux, D.; Rafai, N.; Burlion, N.; Shao, J.-F. The behavior of oil well cement at downhole CO2 storage conditions: Static and dynamic laboratory experiments. Energy Procedia 2011, 4, 5251–5258. [Google Scholar] [CrossRef]
- Santra, A.; Sweatman, R. Understanding the long-term chemical and mechanical integrity of cement in a CCS environment. Energy Procedia 2011, 4, 5243–5250. [Google Scholar] [CrossRef]
- Syed, A.; Shi, J.-Q.; Durucan, S.; Korre, A.; Nash, G. Experimental and numerical investigations into CO2 interactions. Energy Procedia 2014, 63, 5707–5714. [Google Scholar] [CrossRef]
- Connell, L.; Down, D.; Lu, M.; Hay, D.; Heryanto, D. An investigation into the integrity of wellbore cement in CO2 storage wells: Core flooding experiments and simulations. Int. J. Greenh. Gas Control. 2015, 37, 424–440. [Google Scholar] [CrossRef]
- Duguid, A.; Radonjic, M.; Scherer, G.W. Degradation of cement at the reservoir/cement interface from exposure to carbonated brine. Int. J. Greenh. Gas Control. 2011, 5, 1413–1428. [Google Scholar] [CrossRef]
- Yang, Y.; Yuan, B.; Wang, Y.; Zhang, S.; Zhu, L. Carbonation resistance cement for CO2 storage and injection wells. J. Pet. Sci. Eng. 2016, 146, 883–889. [Google Scholar] [CrossRef]
- de Sena, C.B.L.; de Oliveira Freitas, J.C.; Santos, P.H.S.; de Araújo Melo, D.M.; de Oliveira, Y.H. Effects of carbon dioxide in Portland cement: A relation between static sedimentation and carbonation. Constr. Build. Mater. 2017, 150, 450–458. [Google Scholar]
- Sena, C.B.L.; de Oliveira Freitas, J.C.; Santos, P.H.S.; de Araújo Melo, D.M.; da Silva Araujo, R.G.; de Oliveira, Y.H. Carbonation in oil well Portland cement: Influence of hydration time prior to contact with CO2. Constr. Build. Mater. 2018, 159, 252–260. [Google Scholar]
- Bruckdorfer, R.A. Carbon Dioxide Corrosion in Oilwell Cements. In Proceedings of the SPE Rocky Mountain Petroleum Technology Conference/Low-Permeability Reservoirs Symposium, Billings, Montana, 19–21 May 1986. [Google Scholar]
- de Sena, C.B.L.; de Oliveira Freitas, J.C.; Santos, P.H.S.; da Silva Araújo, R.G.; Oliveira, J.F.D.S.; de Araújo Melo, D.M. Study of carbonation in a class G Portland cement matrix at supercritical and saturated environments. Constr. Build. Mater. 2018, 180, 308–3019. [Google Scholar] [CrossRef]
- Xu, B.; Yuan, B.; Wang, Y.; Zeng, S.; Yang, Y. Nanosilica-latex reduction carbonation-induced degradation in cement of CO2 geological storage wells. J. Nat. Gas Sci. Eng. 2019, 65, 237–247. [Google Scholar] [CrossRef]
- Abid, K.; Raoof, G.; Henry, E.; Masood, M.; Chua, H.B.; Golam, M. A methodology to improve nanosilica based cements used in CO2 sequestration sites. Petroleum 2018, 4, 198–208. [Google Scholar] [CrossRef]
- Mahmoud, A.A.; Salaheldin, E. Improving class G cement carbonation resistance for applications of geologic carbon sequestration using synthetic polypropylene fiber. J. Nat. Gas Sci. Eng. 2020, 76, 103184. [Google Scholar] [CrossRef]
- Mahmoud, A.A.; Elkatatny, S. The Effect of Silica Content on the Changes in the Mechanical Properties of Class G Cement at High Temperature from Slurry to Set. In Proceedings of the 53rd U.S. Rock Mechanics/Geomechanics Symposium, New York, NY, USA, 23–26 June 2019. [Google Scholar]
- Mahmoud, A.A.; Salaheldin, E. Improved durability of Saudi Class G oil-well cement sheath in CO2 rich environments using olive waste. Constr. Build. Mater. 2020, 262, 120623. [Google Scholar] [CrossRef]
- Alkheder, S.; Yasmeen, T.O.; Madhar, T. Effect of olive waste (Husk) on behavior of cement paste. Case Stud. Constr. Mater. 2016, 5, 19–25. [Google Scholar] [CrossRef]
- Ledesma, R.B.; Lopes, N.F.; Bacca, K.G.; de Moraes, M.K.; Batista, G.D.S.; Pires, M.R.; da Costa, E.M. Zeolite and fly ash in the composition of oil well cement: Evaluation of degradation by CO2 under geological storage condition. J. Pet. Sci. Eng. 2020, 185, 106656. [Google Scholar] [CrossRef]
- Abid, K.; Raoof, G.; Golam, M. A pozzolanic based methodology to reinforce Portland cement used for CO2 storage sites. J. Nat. Gas Sci. Eng. 2020, 73, 103062. [Google Scholar] [CrossRef]
- Tiong, M.; Gholami, R.; Abid, K.; Rahman, M.E. Nanomodification: An efficient method to improve cement integrity in CO2 storage sites. J. Nat. Gas Sci. Eng. 2020, 84, 103612. [Google Scholar] [CrossRef]
- Santos, B.G.D.; Schemmer, L.B.; de Abreu Siqueira, T.; da Costa, E.M. Chemical resistance and mechanical properties of nanosilica addition in oil well cement. J. Pet. Sci. Eng. 2021, 196, 107742. [Google Scholar]
- Ponzi, G.G.D.; Santos, V.H.J.M.D.; Martel, R.B.; Pontin, D.; de Guimarães e Stepanha, A.S.; Schütz, M.K.; Menezes, S.C.; Einloft, S.M.O.; Vecchia, F.D. Basalt powder as a supplementary cementitious material in cement paste for CCS wells: Chemical and mechanical resistance of cement formulations for CO2 geological storage sites. Int. J. Greenh. Gas Control. 2021, 109, 103337. [Google Scholar] [CrossRef]
- Jani, P.; Imqam, A. Class C fly ash-based alkali activated cement as a potential alternative cement for CO2 storage applications. J. Pet. Sci. Eng. 2021, 201, 108408. [Google Scholar] [CrossRef]
- Ahdaya, M.; Abdulmohsin, I. Fly ash Class C based geopolymer for oil well cementing. J. Pet. Sci. Eng. 2019, 179, 750–757. [Google Scholar] [CrossRef]
- Spycher, N.; Pruess, K. CO2-H2O mixtures in the geological sequestration of CO2. II. Partitioning in chloride brines at 12–100 °C and up to 600 bar. Geochim. Cosmochim. Acta 2015, 69, 3309–3320. [Google Scholar] [CrossRef]
- Costa, B.L.S.; Freitas, J.C.O.; Araujo, R.G.S.; Oliveira, Y.H.; Santiago, R.C.; Oliveira, F.S. Analysis of different oil well cement slurry formulations exposed to a CO2-rich environment. J. CO2 Util. 2021, 51, 101636. [Google Scholar] [CrossRef]
- Gu, T.; Zheng, Y.; Yue, H.; Zheng, Y. Characterization of the Pore Structure of Well Cement under Carbon Capture and Storage Conditions by an Image-Based Method with a Combination of Metal Intrusion. ACS Omega 2021, 6, 2110–2120. [Google Scholar] [CrossRef]
- Moraes, M.K.; da Costa, E.M. Effect of adding organo-modified montmorillonite nanoclay on the performance of oil-well cement paste in CO2-rich environments. Cem. Concr. Compos. 2022, 127, 104400. [Google Scholar] [CrossRef]
- Mei, K.; Zhang, L.; Wang, Y.; Cheng, X.; Xue, Q.; Gan, M.; Fu, X.; Zhang, C.; Li, X. Structural evolution in micro-calcite bearing Ca-montmorillonite reinforced oilwell cement during CO2 invasion. Constr. Build. Mater. 2022, 315, 125744. [Google Scholar] [CrossRef]
- Barría, J.C.; Bagheri, M.; Manzanal, D.; Shariatipour, S.M.; Pereira, J.-M. Poromechanical analysis of oil well cements in CO2-rich environments. Int. J. Greenh. Gas Control. 2022, 119, 103734. [Google Scholar] [CrossRef]
- Peng, Z.; Lv, F.; Feng, Q.; Zheng, Y. Enhancing the CO2-H2S corrosion resistance of oil well cement with a modified epoxy resin. Constr. Build. Mater. 2022, 326, 126854. [Google Scholar] [CrossRef]
- Mahmoud, A.A.; Elkatatny, S.; Al-Majed, A.; Al Ramadan, M. The Use of Graphite to Improve the Stability of Saudi Class G Oil-Well Cement against the Carbonation Process. ACS Omega 2022, 7, 5764–5773. [Google Scholar] [CrossRef]
- Mahmoud, A.A.; Elkatatny, S.; Ahmed, A.; Gajbhiye, R. Influence of Nanoclay Content on Cement Matrix for Oil Wells Subjected to Cyclic Steam Injection. Materials 2019, 12, 1452. [Google Scholar] [CrossRef]
- Sanjuán, M.A.; Martialay, R.M. Influence of the age on air permeability of concrete. J. Mater. Sci. 1995, 303, 5657–5662. [Google Scholar] [CrossRef]
- Wu, Z.; Song, J.; Xu, M.; Liu, W.; Chen, R.; Pu, L.; Zhou, S. Effect of weighting materials on carbonation of oil well cement-based composites under high temperature and CO2-rich environment. Arab. J. Chem. 2023, 16, 104670. [Google Scholar] [CrossRef]
- Wang, S.Y.; McCaslin, E.; White, C.E. Effects of magnesium content and carbonation on the multiscale pore structure of alkali-activated slags. Cem. Concr. Res. 2020, 130, 105979. [Google Scholar] [CrossRef]
- Zhang, C.; Song, Y.; Wang, W.; Guo, X.; Li, H. The influence of sulfonated asphalt on the mechanical properties and microstructure of oil well cement paste. Constr. Build. Mater. 2017, 132, 438–445. [Google Scholar] [CrossRef]
- Kravanja, G.; Knez, Ž. Carbonization of Class G well cement containing metakaolin under supercritical and saturated environments. Constr. Build. Mater. 2023, 376, 131050. [Google Scholar] [CrossRef]
- Yan, W.; Wei, H.-G.; Muchiri, N.D.; Li, F.-L.; Zhang, J.-R.; Xu, Z.-X. Degradation of chemical and mechanical properties of cements with different formulations in CO2-containing HTHP downhole environment. Pet. Sci. 2023, 20, 1119–1128. [Google Scholar] [CrossRef]
- Zhang, Y.; Xie, J.; Zhao, W.; Dai, J.; Gao, F. Corrosion Characteristics of Polymer-Modified Oil Well Cement-Based Composite Materials in Geological Environment Containing Carbon Dioxide. Polymers 2024, 16, 2187. [Google Scholar] [CrossRef]
- Xu, B.; Yuan, B.; Wang, Y.; Zhu, L. H2S-CO2 mixture corrosion-resistant Fe2O3-amended wellbore cement for sour gas storage and production wells. Constr. Build. Mater. 2018, 188, 161–169. [Google Scholar] [CrossRef]
- Sedić, K.; Ukrainczyk, N.; Mandić, V.; Međimurec, N.G. Carbonation study of new calcium aluminate cement-based CO2 injection well sealants. Constr. Build. Mater. 2024, 419, 135517. [Google Scholar] [CrossRef]
- Sedic, K. Optimization of Cement Slurry Compositions for Cementing Protective; University of Zagreb: Zagreb, Croatia, 2017. [Google Scholar]
- Barría, J.C.; Manzanal, D.; Ghabezloo, S.; Pereira, J.M. Effect of supercritical carbonation on porous structure and mechanical strength of cementitious materials modified with bacterial nanocellulose. Mater. Struct. 2024, 56, 180. [Google Scholar] [CrossRef]
- Cerrutti, P.; Roldán, P.; García, R.M.; Galvagno, M.A.; Vázquez, A.; Foresti, M.L. Production of bacterial nanocellulose from wine industry residues: Importance of fermentation time on pellicle characteristics. J. Appl. Polym. Sci. 2015, 133, 43109. [Google Scholar] [CrossRef]
- Barría, J.C.; Analía, V.; Jean-Michel, P.; Diego, M. Effect of bacterial nanocellulose on the fresh and hardened states of oil well cement. J. Pet. Sci. Eng. 2021, 199, 108259. [Google Scholar] [CrossRef]
- Shine, J.M.; Qasmi, U.; Elhancha, A. Exploring CCUS Well Construction Using Fit-For-Purpose Cement Designs. In Proceedings of the International Petroleum Technology Conference, Dhahran, Saudi Arabia, 14 February 2024. [Google Scholar]
- Lende, G.; Sørensen, E.; Jandhyala, S.R.K.; van Noort, R. State of the art Test Method to Quantify Progression Rate of Carbonation of Wellbore Sealing Materials. In Proceedings of the SPE Europe Energy Conference and Exhibition, Turin, Italy, 26–28 June 2024. [Google Scholar]
- Lende, G.; Clausen, J.A.; Kvassnes, A.J. Evaluation of New Innovative Cement Blend for Enhanced CO2 and H2S Resistance. In Proceedings of the SPE/IADC International Drilling Conference and Exhibition, Virtual, 8–12 March 2021. [Google Scholar]
- Teodoriu, C.; Bello, O. A review of cement testing apparatus and methods under CO2 environment and their impact on well integrity prediction—Where do we stand? J. Pet. Sci. Eng. 2020, 187, 106736. [Google Scholar] [CrossRef]
- Bagheri, M.; Seyed, M.S.; Eshmaiel, G. A review of oil well cement alteration in CO2-rich environments. Constr. Build. Mater. 2018, 186, 946–968. [Google Scholar] [CrossRef]
- Lavrov, A. Stiff cement, soft cement: Nonlinearity, arching effect, hysteresis, and irreversibility in CO2-well integrity and near-well geomechanics. Int. J. Greenh. Gas Control. 2018, 70, 236–242. [Google Scholar] [CrossRef]
- Zou, X.; Zhu, Y.; Lv, J.; Zhou, Y.; Ding, B.; Liu, W.; Xiao, K.; Zhang, Q. Toward Estimating CO2 Solubility in Pure Water and Brine Using Cascade Forward Neural Network and Generalized Regression Neural Network: Application to CO2 Dissolution Trapping in Saline Aquifers. ACS Omega 2024, 9, 4705–4720. [Google Scholar] [CrossRef]
- Lin, Y.; Alengaram, U.J.; Ibrahim, Z. Effect of treated and untreated rice husk ash, palm oil fuel ash, and sugarcane bagasse ash on the mechanical, durability, and microstructure characteristics of blended concrete—A comprehensive review. J. Build. Eng. 2023, 78, 107500. [Google Scholar] [CrossRef]


| Elemental Oxides | Content (%) |
|---|---|
| Cao | 63.5 |
| SiO2 | 20.5 |
| Fe2O3 | 4.3 |
| Al2O3 | 4.0 |
| SO3 | 4.3 |
| MgO | 1.1 |
| K2O | 0.3 |
| Na2O | 0.3 |
| Loss of Ignition (LOI) | 1.2 |
| Carbon | 0.2 |
| Compound | Abbreviation in Cement Chemistry | Content (wt%) | Function |
|---|---|---|---|
| Tricalcium Silicate (CaO)3· SiO2 | C3S | 58 | Responsible for early strength development |
| Dicalcium Silicate (CaO)2· SiO2 | C2S | 19 | The hydration rate is slow, and strength is developed over a period of time |
| Tricalcium Aluminate (CaO)3 · Al2O3 | C3A | 2 | Responsible for the cement’s initial setting and thickening time as this compound hydrates readily |
| Tetracalcium Aluminoferrite (CaO)4. Al2O3 · Fe2O3 | C3AF | 11 | Responsible for slow hydration |
| Tests Conducted | Sample Dimension | Method Used |
|---|---|---|
| Compressive strength | Cube (2 × 2 × 2 inch) | Uniaxial Compression Loading |
| Tensile strength | Cylinder (1.5 × 0.9 inch) | Brazilian tensile strength |
| Permeability measurement | Cylinder (1.5 × 0.6 inch) | Hagen-Poiseuille law |
| Sample | Density (PPG) | Component Concentrations (% e gps) | |||||||
|---|---|---|---|---|---|---|---|---|---|
| Water/Cement Ratio (%) | Class G Cement (%) | Microfine Cement (BWOC%) | Promoter (BWOC%) | Silica Flour (BWOC%) | Dispersant (gps) | Fluid Loss Additive (BWOC%) | Defoamer (gps) | ||
| Formulation A | 15.8 | 46.4 | 65.8 | 5 | 0.5 | N/A | N/A | N/A | 0.01 |
| 16.5 | 39.4 | 69.0 | 5 | 0.5 | N/A | N/A | N/A | 0.01 | |
| 17 | 35.2 | 71.0 | 5 | 0.5 | N/A | N/A | N/A | 0.01 | |
| Formulation B | 15.8 | 15.8 | 56.1 | 5 | 0.5 | 20 | 0.03 | N/A | 0.01 |
| 16.5 | 16.5 | 58.7 | 5 | 0.5 | 20 | 0.06 | N/A | 0.01 | |
| 17 | 17.0 | 60.4 | 5 | 0.5 | 20 | 0.10 | N/A | 0.01 | |
| Formulation C | 15.8 | 15.8 | 56.3 | 5 | 0.5 | 20 | 0.03 | 0.5 | 0.01 |
| 16.5 | 16.5 | 58.9 | 5 | 0.5 | 20 | 0.06 | 0.5 | 0.01 | |
| 17 | 17.0 | 60.7 | 5 | 0.5 | 20 | 0.10 | 0.5 | 0.01 | |
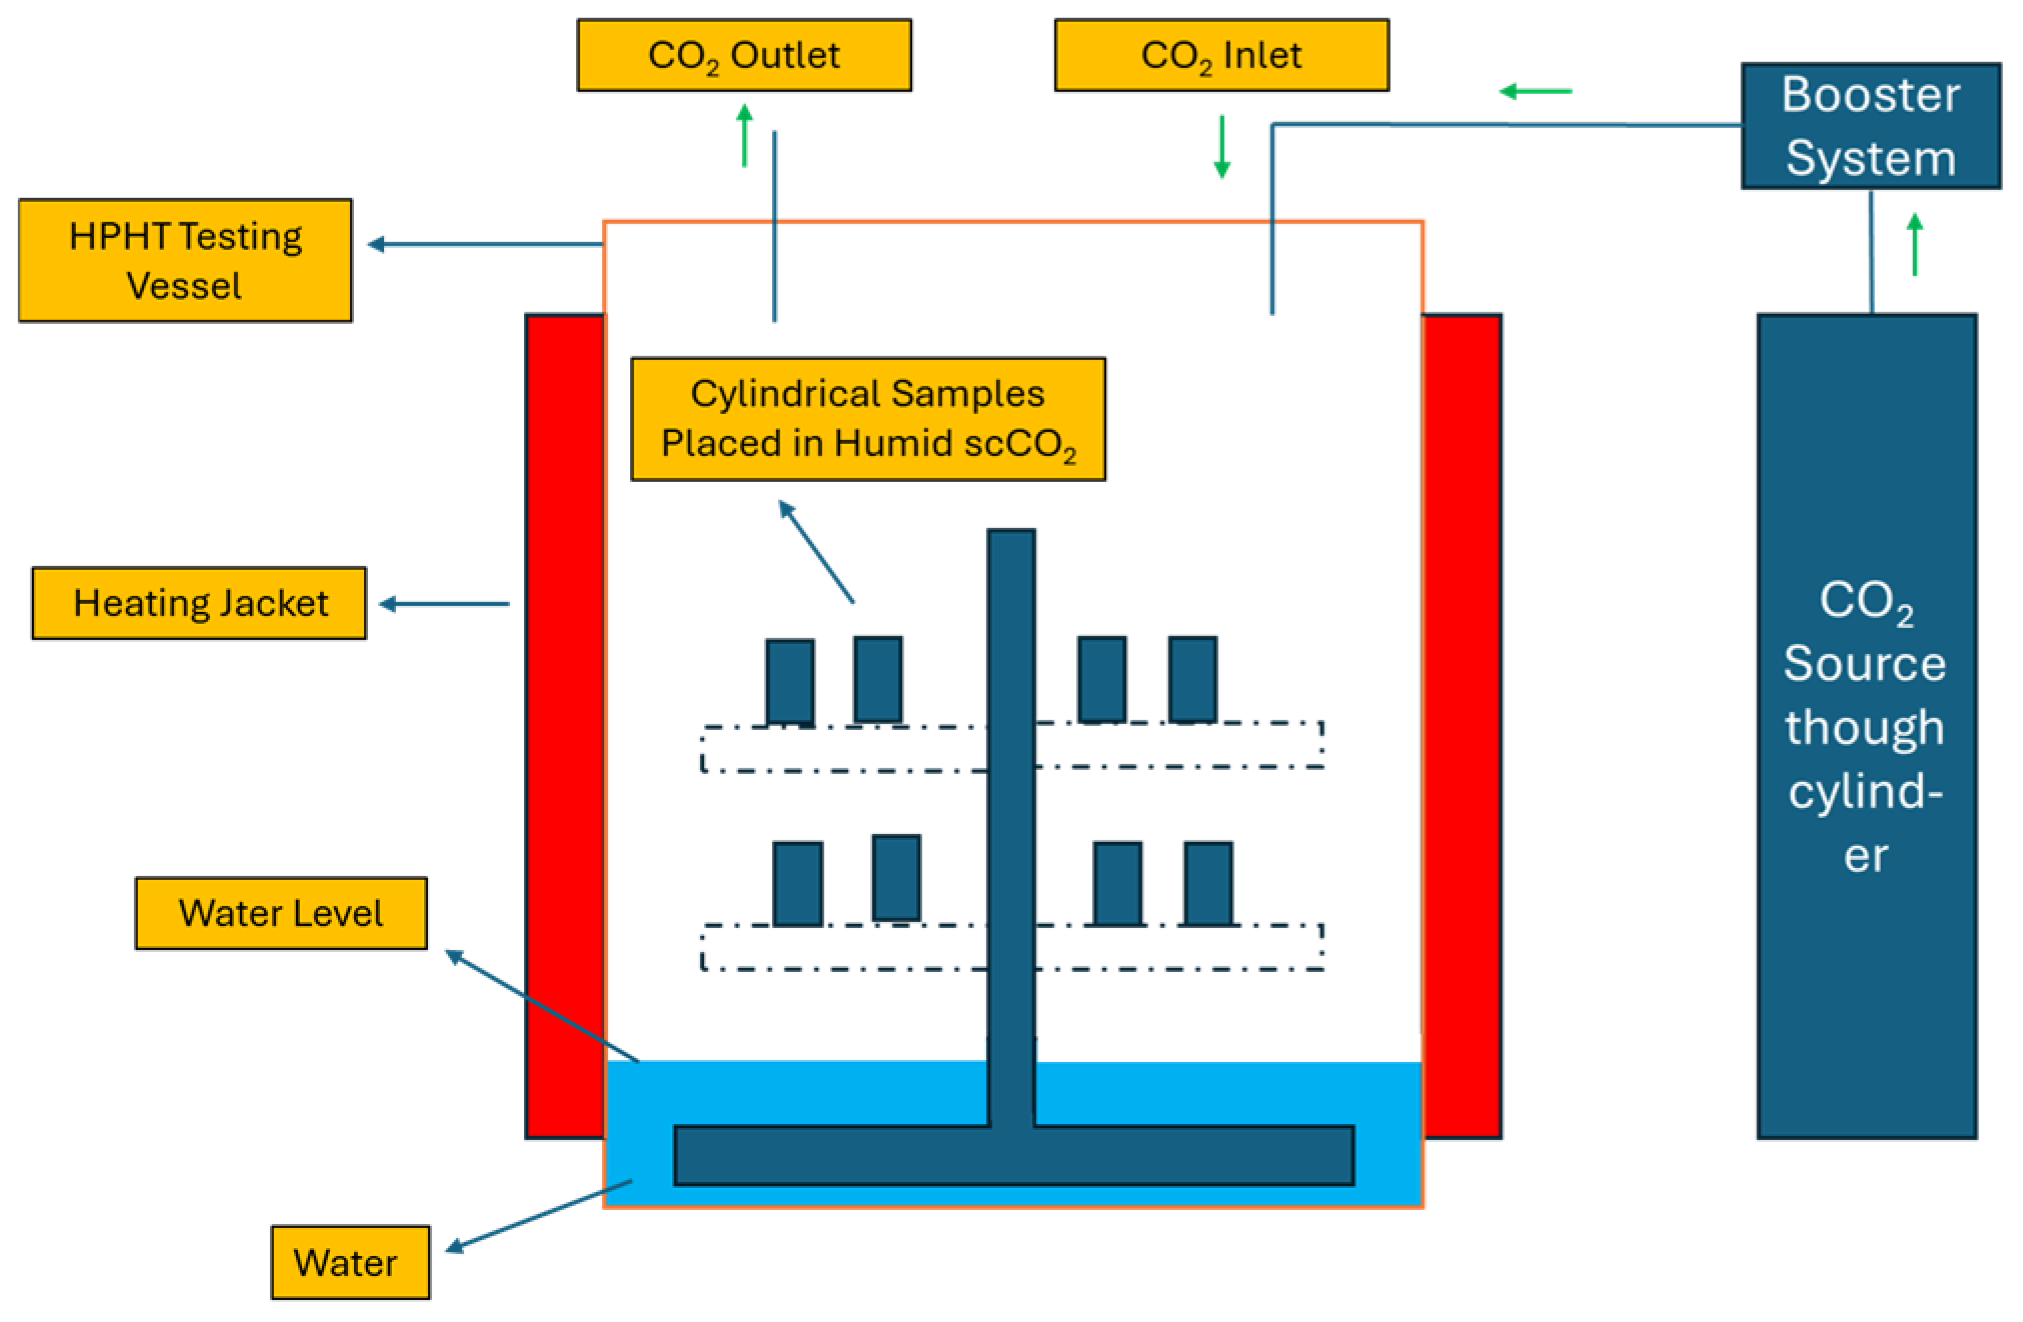
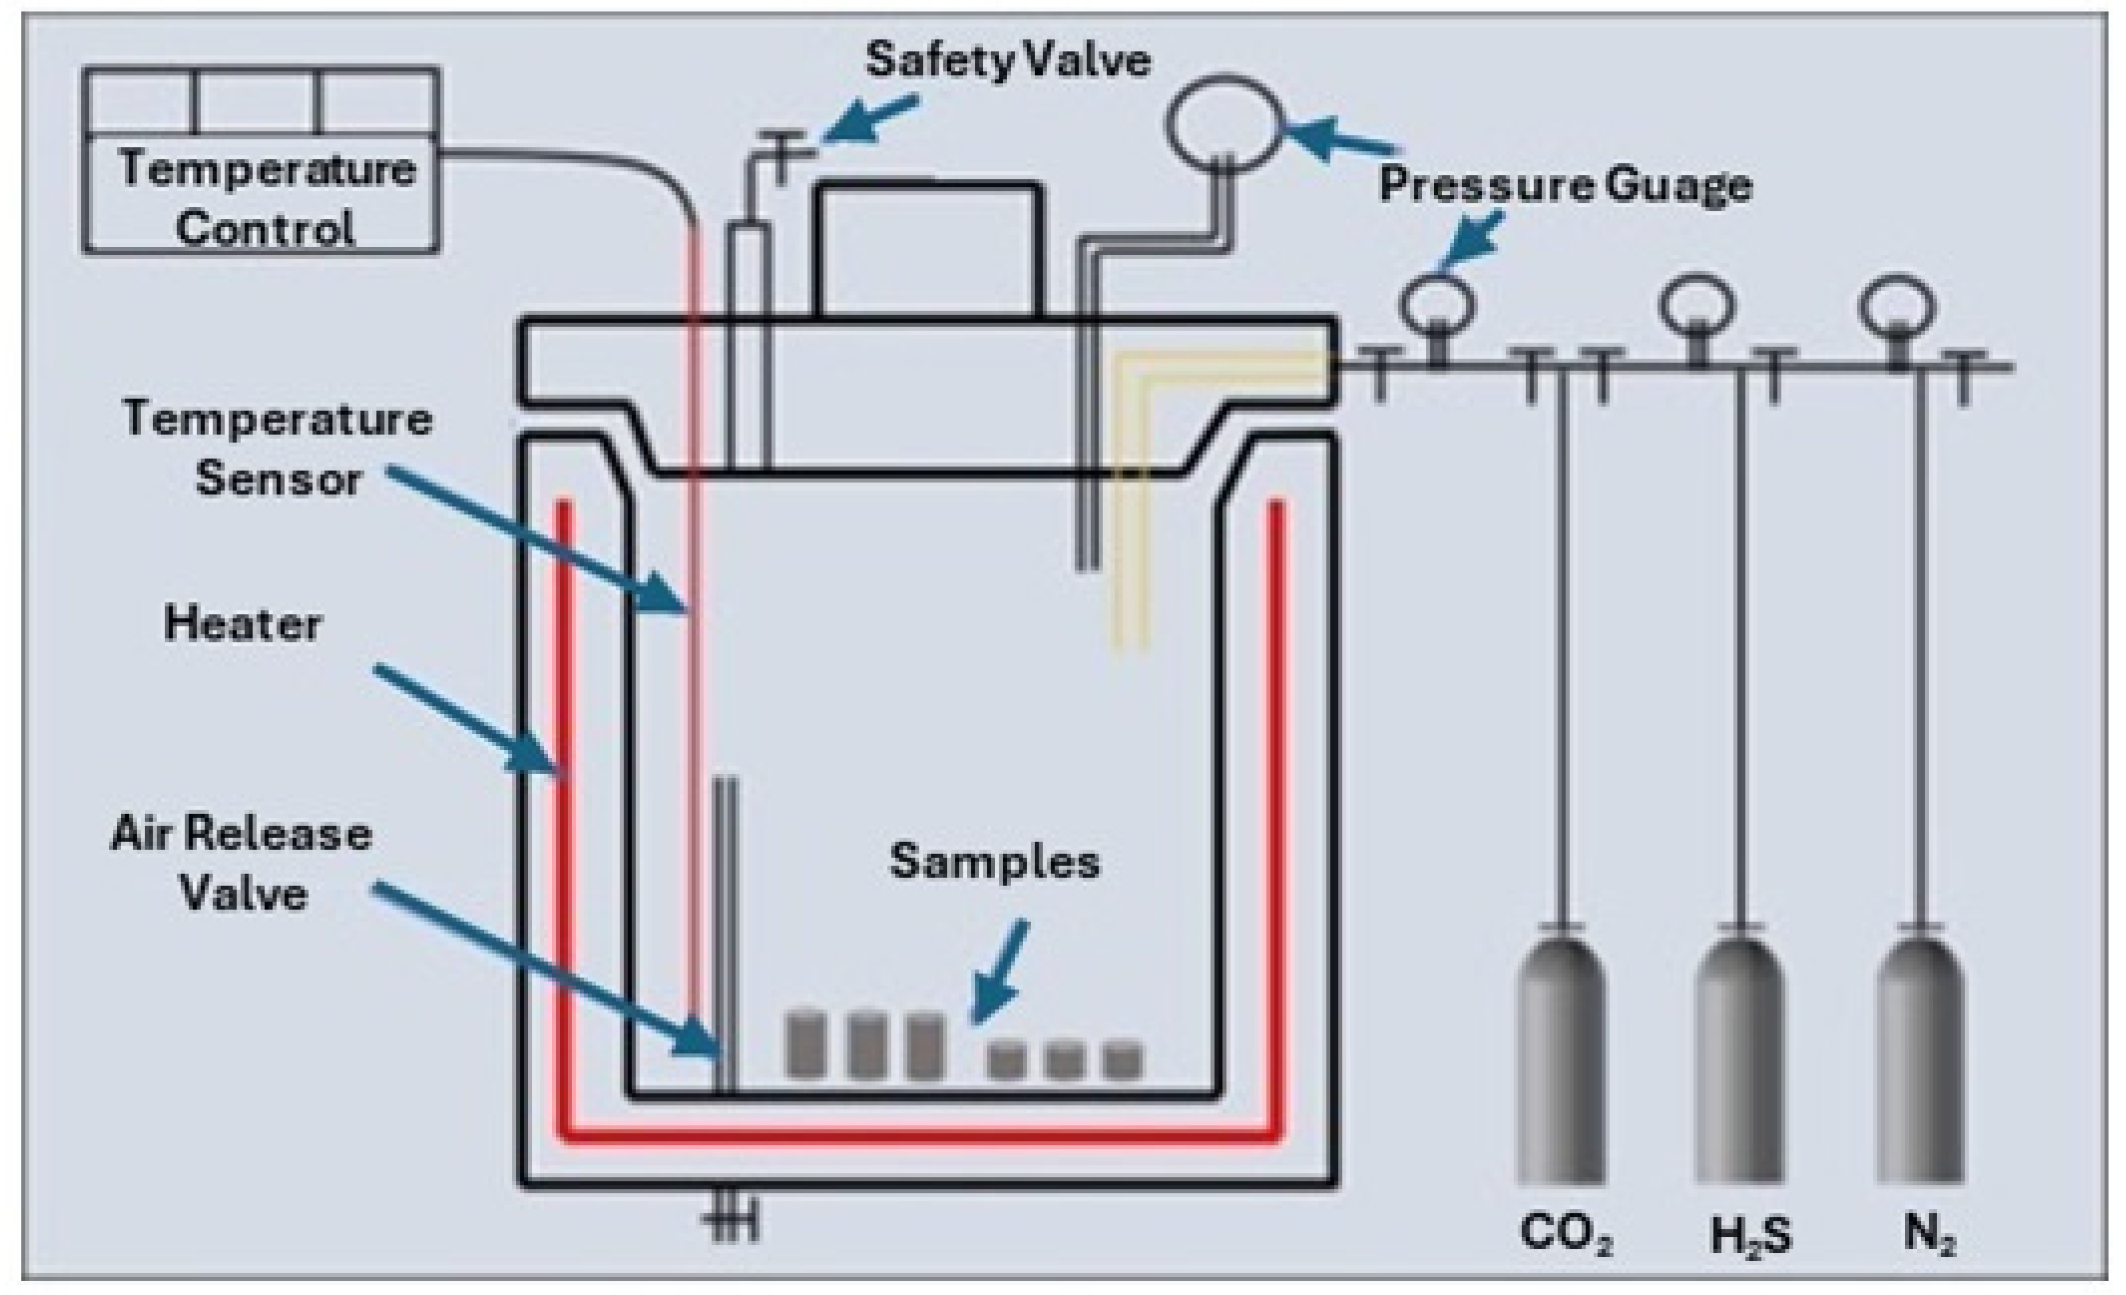
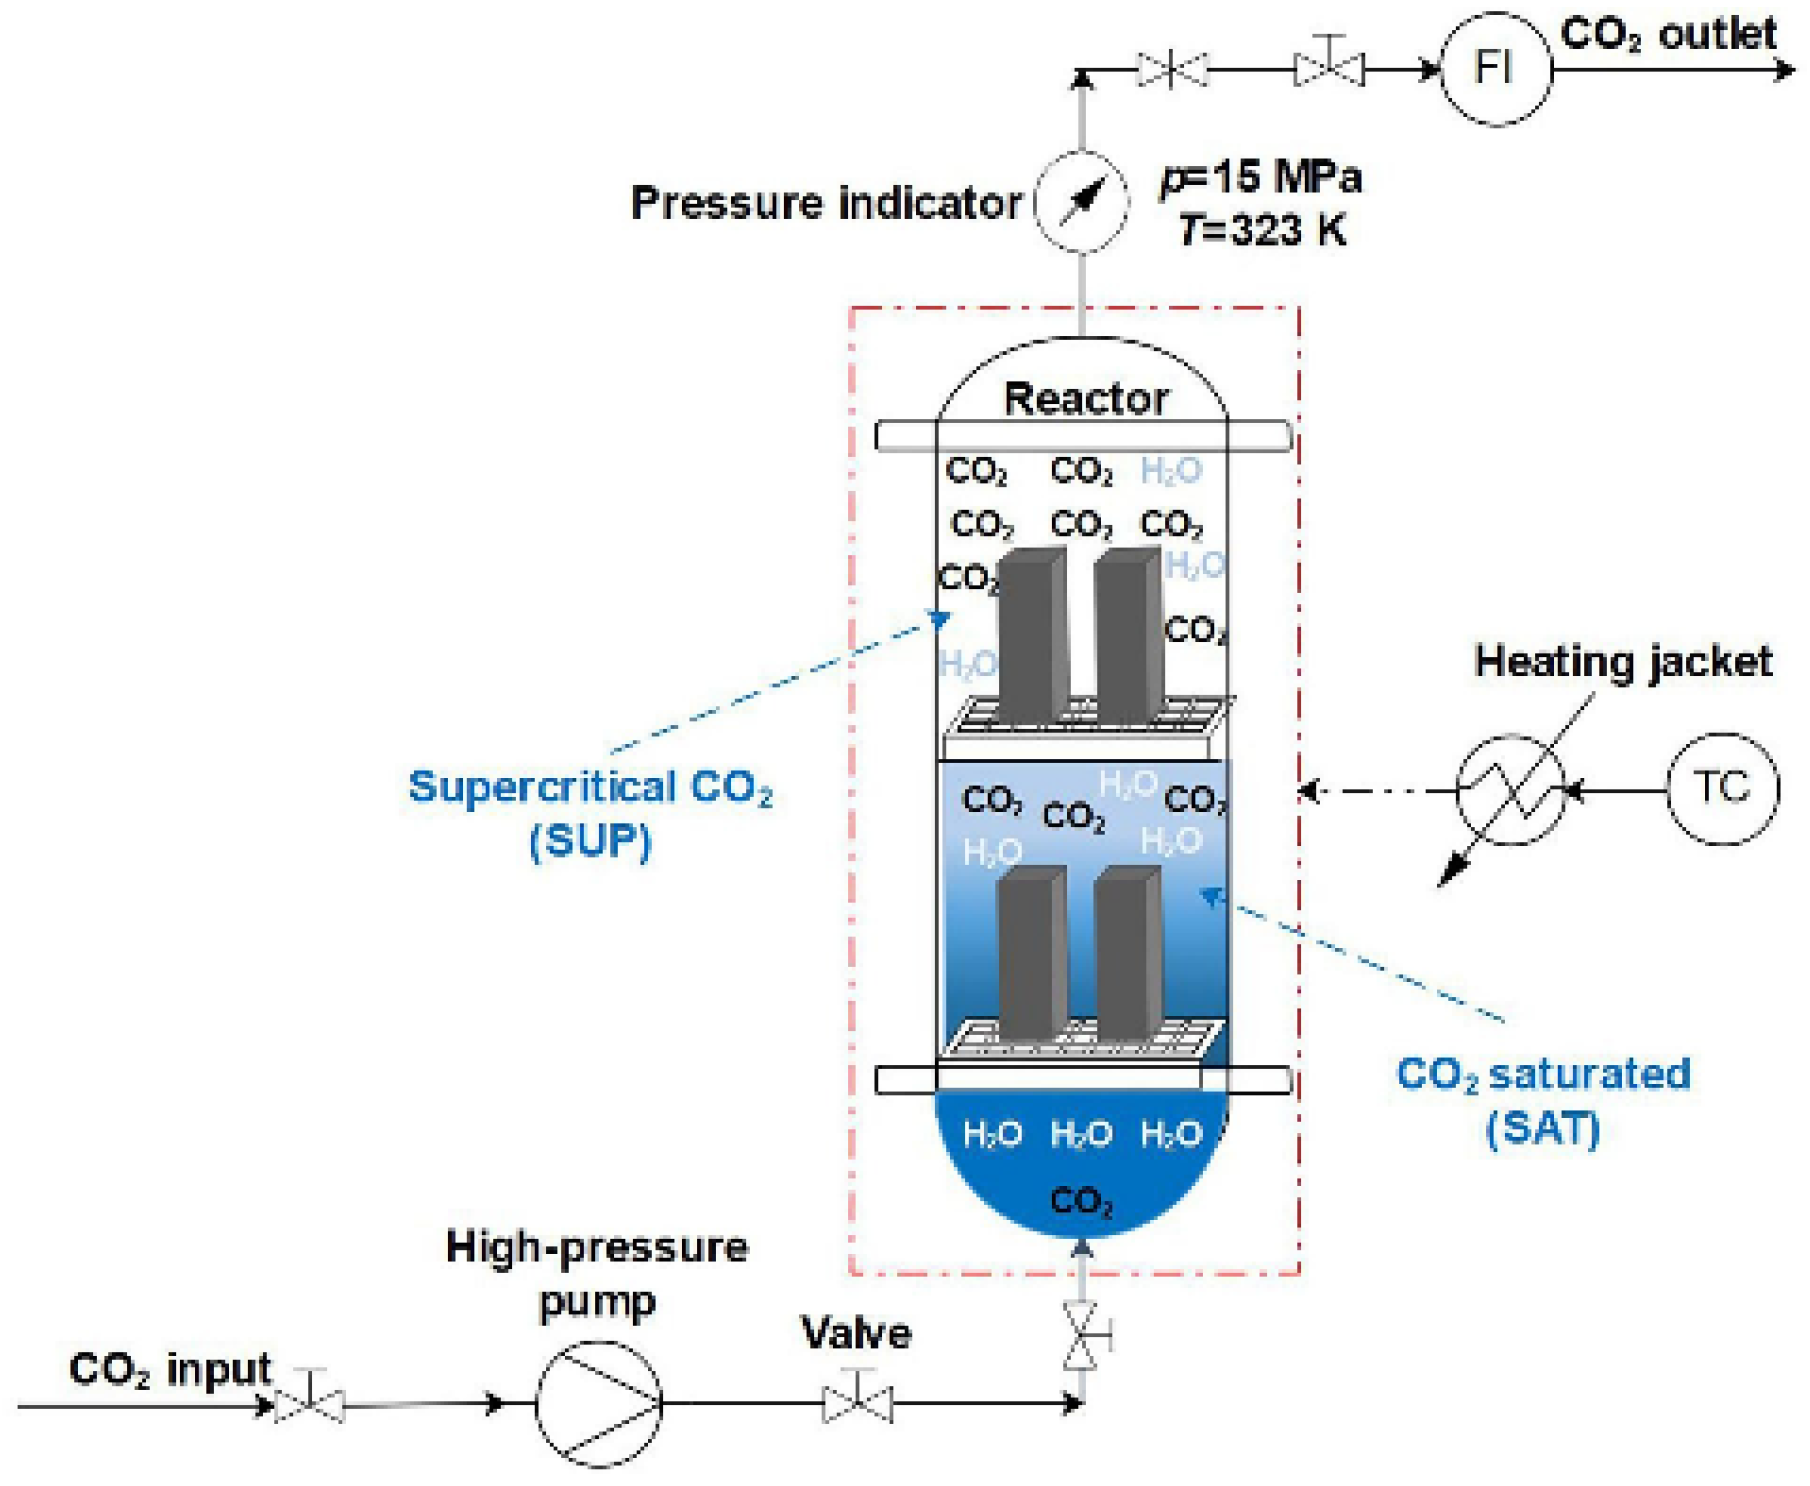
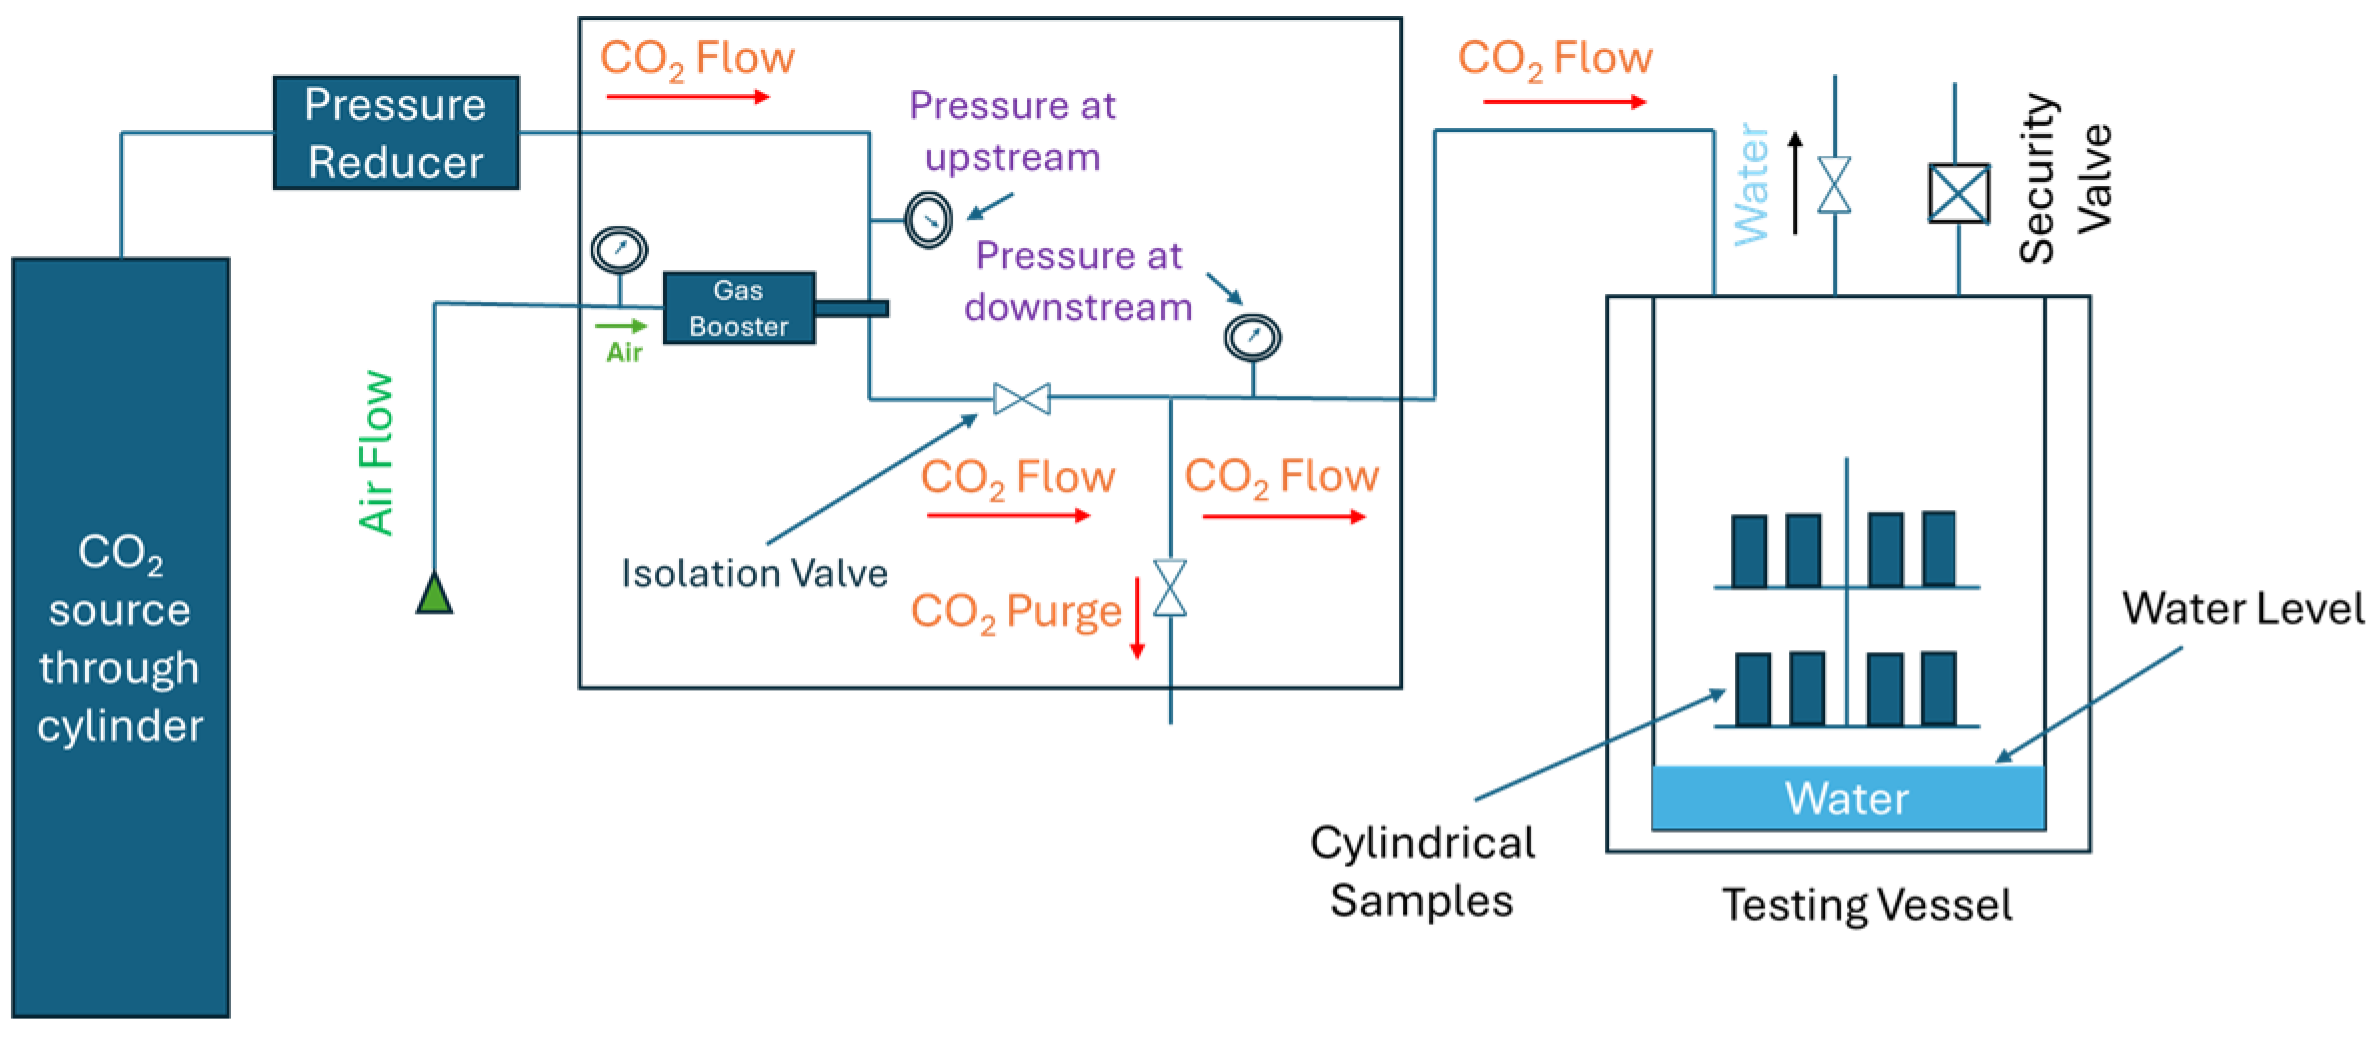
| Sr. No | Author | Cement/Cement Composite | Initial Curing | Sample Shape /Dimensions | Carbonation Testing | Findings | ||||||
|---|---|---|---|---|---|---|---|---|---|---|---|---|
| Environment | Pressure (MPa) | Temperature (°C) | Days | Environment | Maximum Pressure (MPa) | Maximum Temperature (°C) | Maximum Days | |||||
| 1 | Dugid and Scherer, 2010 [34] | Class H Class H + 6% Bentonite | 0.5 M NaCl solution | Atmospheric | 20 and 50 | 365 | Cylinder (Dia × Height) 7.5 mm × 200 mm | scCO2-saturated brine (0.5 M NaCl) | 10 | 50 | 31 | • Temperature increase has a more significant impact on cement carbonation than changes in pH levels. • Samples exposed to limestone conditions were not degraded, whereas samples in sandstone conditions, particularly at 50°C and a pH of 5, were completely degraded. • It was concluded that the degradation of the cement sample is influenced by temperature, pH, and the type of reservoir. |
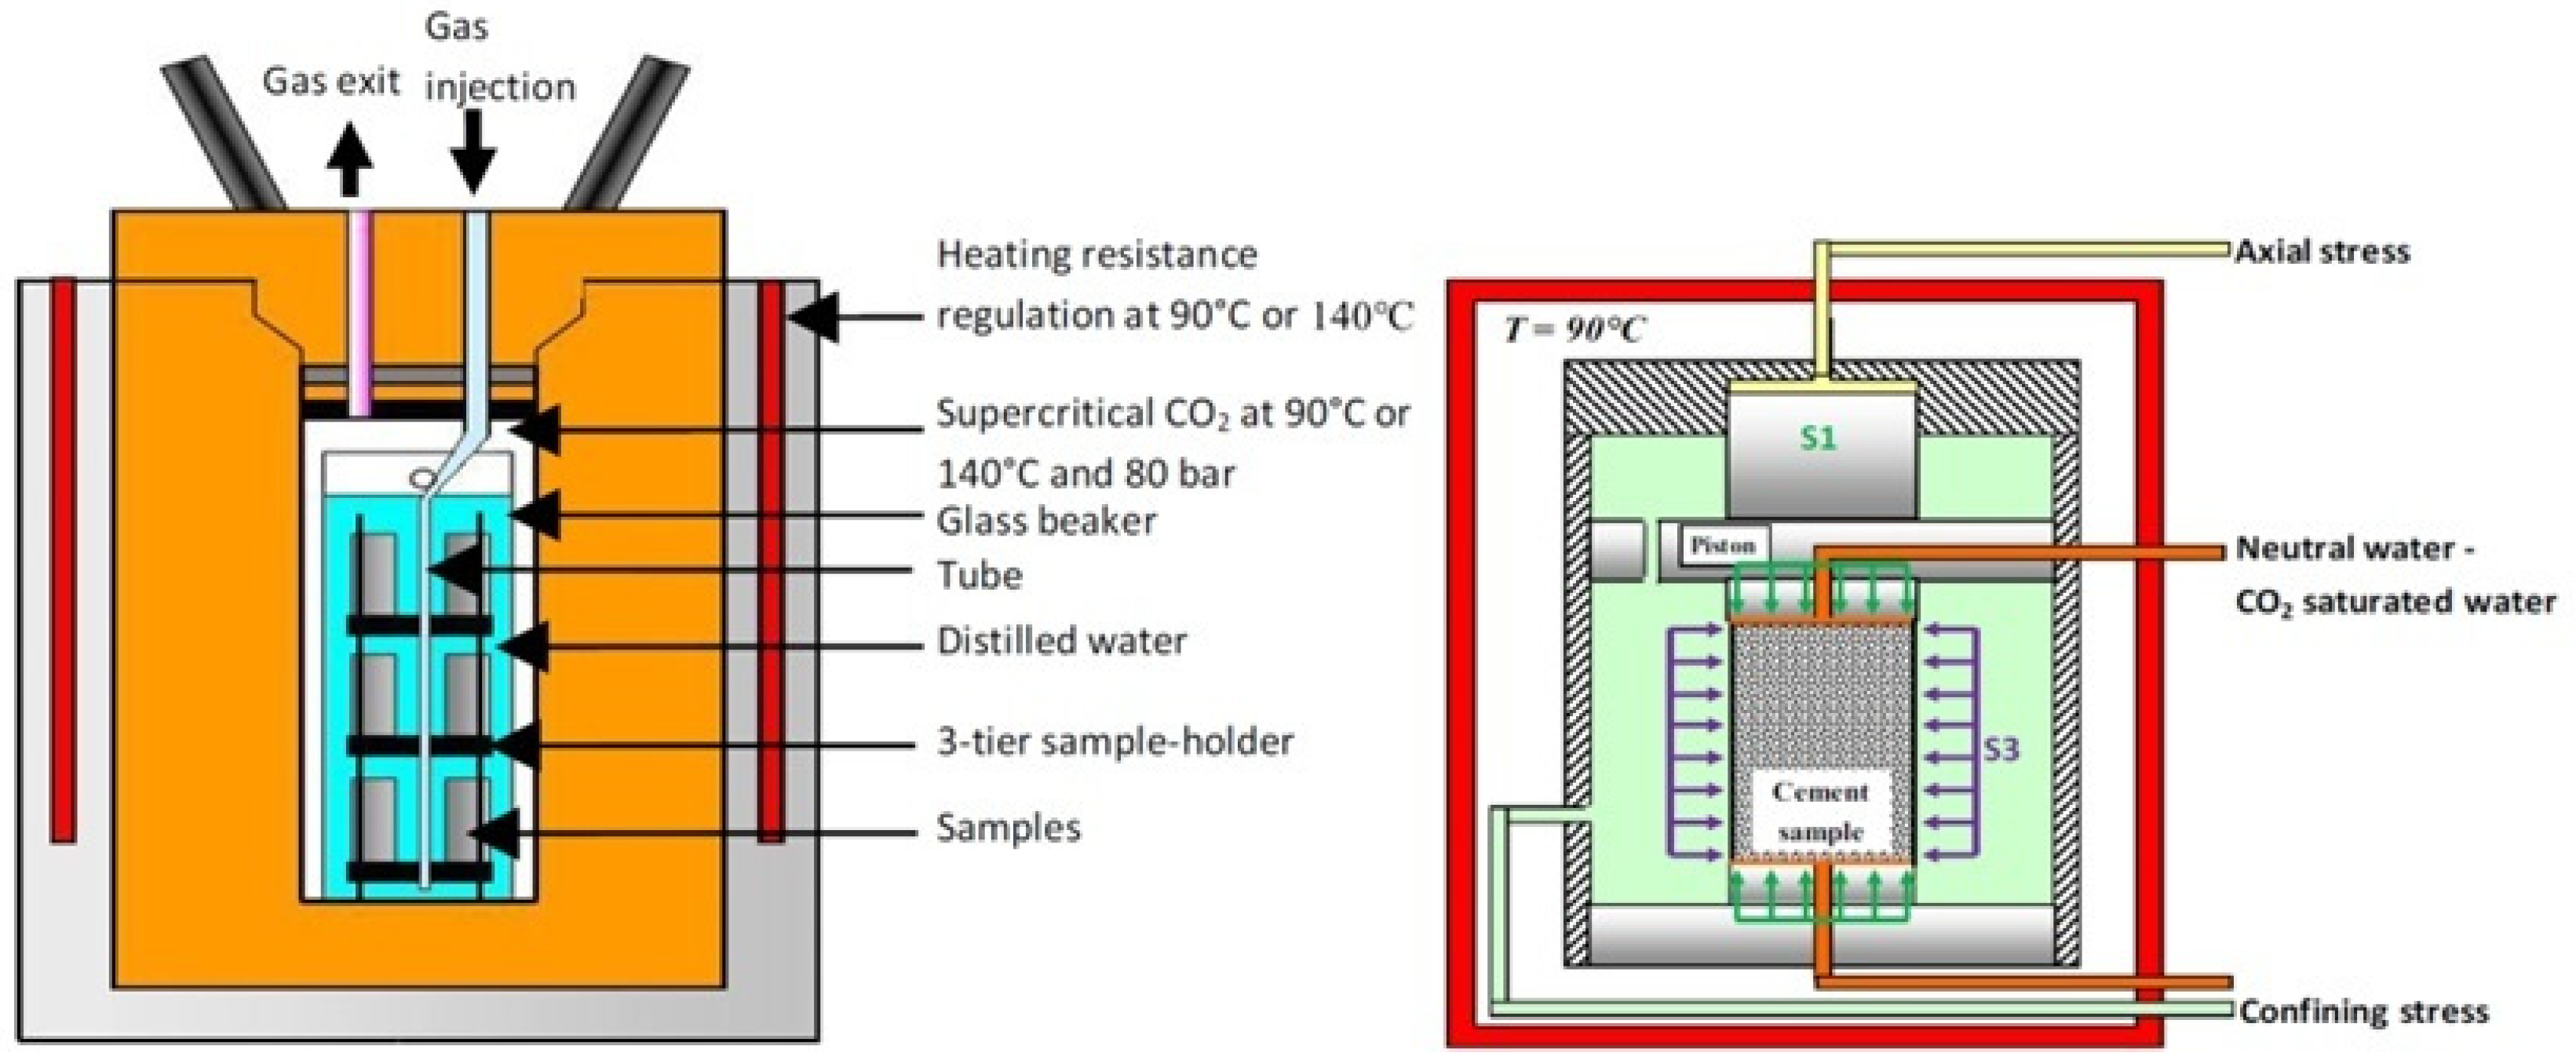
| 2 | Laudet, et al., 2011 [37] | Class G Class G + 30% Silica flour | Water | 20.7 | 90 and 140 | 28 | Cylinder 25 mm × 50 mm | scCO2-saturated water | 8 | 140 | 88 | • The reaction rate for the neat Class G cement was controlled by diffusion, which evolved linearly with the square root of time. • For Class G + 35% silica flour cement, the carbonation front progression evolves linearly with time. • Cement present in the CO2-rich environment might not lose its integrity due to the reaction with the CO2 but will be from brine lixiviation and mechanically induced damage (micro annulus, hydrofrac, etc.). |
| 3 | Santra and Sweatman, 2011 [38] | Class G Classified cement | Water | 13.8 | 60 | 28 | Cylinder 63.5 mm × 25.4 mm | scCO2-saturated water | 13.8 | 60 | 90 | • Classified cement performed better in the simulated CCS (Carbon Capture and Storage) environment. • Addition of pozzolanic materials can reduce the transfer properties of cement. • Ionic content of formation fluid can increase the pH of carbonic acid, reducing its corrosiveness toward the well cement sheath. •Use of non-Portland cements (e.g., resin-based cement, high alumina phosphate) can avoid carbonation since they do not contain portlandite. |
| 4 | Syed, et al., 2014 [39] | Class G | Water | Atmospheric | Atmospheric | 28 | N/A | Pure CO2 Or scCO2-saturated brine | 12.5 | 92 | 80 | • In shallow reservoir conditions, the CO2 flux through the micro annulus gradually decreases permeability due to the cement’s self-healing ability, thereby lowering the long-term risk of CO2 leakage. • For deep well conditions, high temperature and pressure prevent the self-healing process from being initiated due to the complete hydration of the cement. |
| 5 | Connell, et al., 2015 [40] | Sandstone Class G cement composite (Core flooding technique) | Brine solution | N/A | N/A | N/A | N/A | scCO2-saturated water | 10 | 50 | 105 (Core flooding technique) | • If formation water is saturated with calcium and carbonate ions, CaCO3 dissolution from the cement is difficult and cement integrity can be maintained • If the formation of water is undersaturated with calcium and carbonate ions and there is continuous water flow, cement degradation can occur. • Thus, it can be said that carbonate formations pose a lower risk to cement integrity in CO2-rich environments compared to cement samples in sandstone formations. |
| 6 | Yang, et al., 2016 [42] | Cass G Class G + 5 and 8% ACA (mixture of non- crystalline SiO2, latex, super fine pitch,) | N/A | 20 | 85 | 7 | Cubical (L × W × H) 50 × 50 × 50 mm Cylindrical (25 mm × 40 mm) | scCO2-saturated brine (0.4 M NaCl) | 20 | 85 | 30 | • The addition of the ACA in the cement reduced the transfer properties and maintained its compressive strength after the carbonation period • ACA mitigated dissolution and leaching effects by consuming high C/S hydration products and CH • Both the ACA cement composite performed better than the control sample. However, 8% ACA performed better than 5% ACA in CO2 rich environment |
| 7 | Costa, et al., 2017 [43] | Class G | Water | Atmospheric | 70 | 1 | Cylinder (25mm × 50mm) | scCO2-saturated water | 13.8 | 70 | 30 | • It was noted that the carbonation of the cement behaves in a certain pattern when sedimentation of the particle occured • A fluid mechanics-based model was proposed to describe the sedimentation and carbonation behavior of unstable slurry. • Author emphasized that that the stability of the sedimentation in the slurry should be a prerequisite for the carbonate cement studies |
| 8 | Costa, et al., 2018 [44] | Class G | Water | Atmospheric | 70 | 8 hours, 7 and 28 days | Cylinder (25 mm × 50 mm) | scCO2-saturated water | 13.8 | 70 | 30 | • 7 days initial cured samples showed higher carbonation depth and transfer properties after the carbonation period of 30 days. • 8-hour and 28-day cured samples performed better and had a lower carbonation depth and lesser carbonation products in their matrix. |
| 9 | Costa, et al., 2018 [46] | Class G | Water | Atmospheric | 70 | 1 | Cylinder (25 mm × 50 mm) | wet scCO2 scCO2-saturated water | 13.8 | 70 | 30 | • The sample exposed to scCO2 saturated water suffered 35% more attack by the CO2 as compared to the sample exposed to scCO2 medium alone • XRD analysis showed that the sample exposed to the saturated medium had about 48.07% CaCO3, while the sample exposed to scCO2 had only 14.08% CaCO3. • Variation in behaviors is due to the availability of water and carbon dioxide molecules, essential for enabling reactions and creating an acidic environment. |
| 10 | Xu, et al., 2019 [47] | Cass G Class G + 2% amorphous nano silica (ANL) Class G + 4% ANL Class G + 6% ANL Class G + 6% ANL | Water | 20 | 90 | 15 | Cylinder (25.44 mm × 30 mm) | scCO2-saturated brine (4 M NaCl) | 20 | 90 | 90 | • The initial permeability of the 6% ANL cement composite was almost 7 times lower than that of the control sample. • After the carbonation period, the permeability and carbonation depth of Class G cement were 14.7 and 15.7 times more than the cement incorporating 6% ANL. •ANL initiated a pozzolanic reaction, converting portlandite into a long chain of C-S-H with a low Ca/Si ratio. |
| 11 | Mahmoud and Elkatatny, 2020 [49] | Class G Class G + 0.125% synthetic polypropylene fiber (PPF) Class G + 0.25% PPF Class G + 0.375% PPF | 0.5 M NaCl solution | Atmospheric | 130 | 1 | Cube (50.8 × 50.8 × 50.8 mm) Cylinder (38.1 mm × 22.86 mm) Cylinder (38.1 mm × 15.24 mm) | scCO2-saturated brine (0.5 M NaCl) | 10 | 130 | 20 | • The carbonation depth of the 0.12% PPF cement composite was almost 45.43% less than that of the control sample. • After 20 days, with the PPF samples showing a 50.6% higher compressive strength than the control cement, a similar trend was observed in tensile strength • The lowest permeability was observed from the PPF 1, and when compared with the control sample, it was about 25 and 35.1% less after 10 and 20 days of exposure to the scCO2 saturate brine solution • These results indicate that including 0.125 wt% PPF has the capability the resist the attack of scCO2 |
| 12 | Mahmoud and Elkatatny, 2020 [51] | Class G Class G + 0.1% Olive Waste (OW) Class G + 0.2% OW Class G + 0.3% OW | Deionized Water | Atmospheric | 75 | 1 | Cube (50.8 × 50.8 × 50.8 mm) Cylinder (38.1 mm × 22.86 mm) Cylinder (38.1 mm × 15.24 mm) Cyclinder (38.1 mm × 101.6 mm) | scCO2-saturated deionized water | 10 | 130 | 20 | • The carbonation depth of the 0.1% OW cement composite was almost 23.47% less than that of the control sample. •The mechanical properties of the OW cement composite after the carbonation test were lower than that of the control sample, which was attributed to the impurities present in the waste and the small quantity of OW used • After 20 days of CO2 exposure, the permeability of the 0.1% OW cement composite was 33.9% lower than that of the control sample. |
| 13 | Ladesma, et al., 2020 [53] | Class G Class G − 5 and 10% of Fly Ash (FA) Class G − 5 and 10% Zeolite | Water | 6 | 60 | 8 hours | Cyclinder (23 mm × 46 mm) | scCO2-saturated deionized water | 15 | 90 | 14 | • The XRD and Sem analysis revealed that the reaction mechanism of the pozzolanic cement was the same as that of the ordinary oil well cement. Control cement had a denser carbonated zone compared to pozzolanic cement • 4A-1 zeolite showed better performance in resisting CO2 attack compared to 4A-2 zeolite. • FA cement composite performed better than zeolite and found that as the number of carbonation days was increased, the more carbonated area appeared on this cement composition • It was recommended that 14 days of carbonation is not enough for a thorough understanding of the cement behavior in the CO2-rich environment |
| 14 | Abid, et al., 2020 [54] | Class G Class G − 5, 10, 15 and 20% Palm Oil Fuel Ash (POFA) Class G − 1, 2, 3, 4 and 5% Rice Husk Ash (RHA) Class G − 0.25, 0.5, 1 and 1% Nano Silica (NS) | Water | Atmospheric | 50 | 28 | Cylinder (25.4 mm × 25.4 mm) | scCO2-saturated water | 20.7 | 65 | 40 | • Replacement of cement with POFA and RHA acts as a retarder and delays the development of the compressive strength but can ultimately improve over the long term. • Agricultural waste cement composite did not perform well when exposed to a scCO2 environment as POFA and RHA cement composite had lower compressive strength after the CO2 exposure, more carbonated area, the lowest amount of portlandite left in its composition due to the carbonation process, and also showed the highest percent increase in mass distribution • Nano Silica (0.5 and 0.75% NS cement + A28:M28 composite) improved the strength of cement upon replacement, had less carbonated area, less percentage increase in mass, and enhanced cement performance in the simulated condition of CCS site. |
| 15 | Tiong, et al., 2020 [55] | Class G Class G − 0.05, 0.25, 0.50, 0.75 and 1% Nano Glass Flakes (NGFs) Class G − 0.025, 0.05, 0.075, 0.1 and 0.25% Multiwall Carbon Nano Tubes (MWCNTs) | Water | Atmospheric | 50 | 1 | Cylinder (25.4 mm × 25.4 mm) | scCO2-saturated water | 24.13 | 70 | 56 | • The phenolphthalein test conducted after 56 days showed that 0.05 wt% MWCNTs and 0.5 wt% NGFs had the least carbonation. • Samples prepared with the dispersion mixing technique showed greater resistance to CO2 ingression compared to those with the conventional mixing technique. • Compressive strength tests indicated higher strength in the pre-carbonation phase than the post-carbonation phase, suggesting minimal carbonation. • Authors noted that NGFs are more cost-effective than MWCNTs, with NGFs priced at 50 USD/kg compared to 700 USD/kg for MWCNTs |
| 16 | Batista, et al., 2021 [56] | Class G Class G + 0.5, 1, 1.5 and 3% Nano Silica (NS) | Water | 6 | 60 | 8 hours | Cylinder (21.6 mm × 43.2 mm) | scCO2-saturated water | 15 | 90 | 56 | • The lowest carbonation front was in the sample that contained 0.5% NS in its composition. • The compressive strength of all NS cement composites after 56 days of exposure was higher than that of the control sample, after the carbonation test. • AFM, microtomography, and SEM images showed less pronounced changes in microstructure, density, and chemical composition from the edge to the core of the NS cement composite compared to the control sample • The improvement in NS cement composite was attributed to its pozzolanic activity. |
| 17 | Ponzi, et al., 2021 [57] | Class G Class G + 0.25, 0.5, 1, 2.5, and 5% Basalt Powder (BP) | Water | Atmospheric | 65 | 14 | Cylinder (22 mm × 44 mm) | scCO2-saturated deionized water | 15 | 65 | 7 | • Testing revealed that cement composites with less than 0.5% Basalt and a higher water-to-solid ratio performed well in a scCO2 environment. • Samples with more than 0.5 wt% BP showed greater degradation due to higher transfer properties, compromising CO2 resistance and reducing compressive strength. • Lower BP content in the cement acted as a filler, reducing transfer properties, restricting CO2 ingression, and delaying carbonation progression. Minimal reduction in the alkaline reserve of portlandite further improved the cement’s resistance to scCO2. |
| 18 | Jani and Imqam, 2021 [58] | Class H Class C fly ash-based alkali-activated cement (Geopolymer) | Water | Atmospheric | 43.3 | 3 | Cylinder (50.8 mm × 50.8 mm) | scCO2-saturated water | 10.35 | 43.3 | 14 | • The compressive strength of Class H cement decreased with prolonged exposure, showing reductions of 27.77% and 41.54% in gaseous (3.45 Mpa) and supercritical states (10.35 MPa), respectively, by the 14th day. • No reduction in the geopolymer was recorded in the gaseous phase, while in the scCO2 phase, the compressive strength was reduced by 12.06% after 14 days of exposure. • Visual inspection revealed millimeter-sized CaCO3 crystals on the surface of Class H cement, while no changes were observed on the geopolymer surface after CO2 exposure. |
| 19 | Costa, et al., 2021 [61] | Three different formulations of cement were created to give different densities. Please refer to Table 2 for the composition detail | Water | Atmospheric | 70 | 1 | Cylinder (25 mm × 50 mm) | wet scCO2 scCO2-saturated water | 13.8 | 70 | 90 | • Formulation A, made with the simplest formulation, performed well in a CO2-rich environment but had low stability against sedimentation. • Formulation B exhibited high sedimentation due to the addition of a dispersant. • Formulation C, which included both a dispersant and a fluid loss additive, demonstrated improved stability. • Formulation C, with its complex additive formulation and high densities (16.5 and 17 ppg), showed stable carbonation depth with minimal variation in the carbonated area over time. |
| 20 | Gu, et al., 2021 [62] | Class G + 10% Silca Fume | N/A | 20 | 60 | 28 | Cylinder (25 mm × 25 mm) | Humid scCO2 | 20 | 60 | 20 | • After 10 days of exposure, the primary altered layers observed from the cement surface to the core were: a) a partially leached layer, b) a carbonated layer, and c) a CH-dissolved layer. • After 20 days of exposure, the key altered layers included a porous leached layer, a partially leached layer, a carbonated layer, and a carbonated transition layer. • The study concluded that corrosion parallel to the flow direction could be effectively blocked, while the porous leached layer could facilitate flow perpendicular to the corrosion direction. |
| 21 | Moares and Costa, 2022 [63] | Class G Class G + 0.5, 1, and 2% organo-modified montmorillonite (OMMT) nanoclay | Distilled Water | 6 | 60 | 8 h | Cylinder (23 mm × 46 mm) | wet scCO2 scCO2-saturated water | 15 | 90 | 56 | • Cement with 1% and 2% OMMT showed a greater depth of carbonation front compared to the control sample, while 0.5% OMMT had the least carbonation depth among all samples. • The OMMT cement composite maintained its compressive strength after exposure to a CO2-rich environment, due to the pozzolanic reaction facilitated by the nanoclay. • Samples placed in scCO2 saturated condition experienced more degradation than those exposed to wet scCO2. • The study suggests that OMMT in the cement composition can prevent excessive CaCO3 precipitation, which affects the diffusion rate of CO2 in the cement matrix. |
| 22 | Mei, et al., 2022 [64] | Class G Class G + 2% treated (MC CA MMT) and non-treated Ca-montmorillonite (CA MMT) | 1% wt NaCl solution | 17 | 60 | 14 | N/A | CO2-saturated brine solution | 8 | 62 | 28 | • CT image analysis using a Probability Distribution Map (PDM) showed that after 28 days of curing, the MC Ca-MMT had a smaller area of dissolution compared to the control and Ca-MMT cement composite • After 28 days of CO2 exposure, the MC sample retained 72.43% of its initial compressive strength, compared to the MT and control samples, which retained 58.75% and 53.59%, respectively. • When CO2 ingresses into the MC-Ca-MMT cement composite, the pre-existing micro-calcite leads to additional calcite deposition, densifying the cement structure and helping prevent CO2 diffusion into the cement matrix. |
| 23 | Barria, et al., 2022 [65] | Class G | lime-saturated water | Atmospheric | Atmospheric | 28 | Cylinder (38 mm × 77 mm) | wet supercritical CO2 | 20 | 90 | 30 | • Contrary to the common belief that CaCO3 presence in the cement matrix reduces transfer properties and enhances compressive strength, the study found that despite reduced porosity, the mechanical properties were compromised. • The authors suggested this could be due to the intrinsic amorphous nature of CaCO3, weak bonding between carbonates and the pore walls, or significant degradation of Calcium Silicate Hydrate (C-S-H). |
| 24 | Peng, et al., 2022 [66] | Class G Class G + 4%water-borne epoxy resin (WER) | N/A | 20.7 | 90 | 2 | Cylinder (25 mm × 50 mm) Cylinder (25 mm × 25 mm) | gas-phase condition (CO2 and H2S) liquid phase condition (CO2 and H2S) | 10 | 90 | 30 | • After 30 days of exposure to gaseous and liquid acidic environments, the WER cement composite showed strength losses of 1.2% and 9.8%, respectively, with corrosion depths of 10.6 mm and 3.1 mm. In contrast, the control sample experienced mechanical strength retrogression of 17.6% in the gaseous phase and 32.1% in the liquid phase, with carbonation depths of 36.6 mm and 16.1 mm. • Permeability increased by 28.8% in the gas phase and 16.7% in the liquid phase for the control sample. For the WER cement composite, permeability increased by 8.4% in the gaseous phase and 21.7% in the liquid phase. • WER’s superior performance is attributed to the resin particles filling the cement’s pore spaces, densifying the cement matrix, and the formation of a 3D network structure after curing |
| 25 | Mahmoud, et al., 2022 [67] | Class G Class G + 01, 0.2 and 0.3% Graphite (Gr) | Water | Atmospheric | 70 | 1 | Cube (50.8 × 50.8 × 50.8 mm) Cylinder (38.1 mm × 22.86 mm) Cylinder (38.1 mm × 15.24 mm) Cyclinder (38.1 mm × 76.2 mm) | scCO2-saturated deionized water | 10 | 130 | 10 | • Gr 2 (0.2 Graphite) had a 29.8% reduction in CO2 ingression compared to the control sample. • The permeability of the Gr 2 sample was 31.4% lower than that of the control after the carbonation period • Gr 2 exhibited a higher compressive strength of 97.4 MPa after CO2 exposure, compared to 83.7 MPa for the control sample. The tensile strength of the Gr 2 sample increased by 13.4% pre-carbonation and 23.8% post-carbonation compared to the control. |
| 26 | Wu, et al., 2023 [70] | Class G Class G + 50% Hematite (Fe2O3) Class G + 50% barite (BaSO4) Class G + 50 Hausmannite (Mn3O4) | Water | 21 | 150 | 3 | Cyclinder (25 mm × 25 mm) | scCO2-saturated water | 30 | 150 | 21 | • Barite cement’s carbonation depth was 50.2% greater than hausmannite and 31.3% greater than hematite. • Carbonation rates were 0.31 mm/day for barite, 0.24 mm/day for hematite, and 0.21 mm/day for hausmannite. • Compressive strength decreased after CO2 exposure, particularly in barite cement, while hausmannite cement had minimal strength loss. • Hausmannite cement showed the best resistance to carbonation, followed by hematite, with barite cement showing the least resistance. |
| 27 | Kravanja and Knez, 2023 [73] | Class G Class G − 15% Metakolin (MK) | Water | Atmospheric | 50 | 1 | Tripple Cubin Mold (40 × 40 × 160 mm) | wet scCO2 scCO2-saturated brine (0.5 M NaCl) | 15 | 50 | 28 | • Mechanical properties (compressive and flexural strength) improved in SUP (wet scCO2) and SAT (scCO2-saturated brine) environments due to carbonation reactions and metakaolin’s pozzolanic nature. • MK cement composites showed poor performance in carbonation depth, with greater depths in both SAT and SUP conditions compared to neat samples. • Carbonation rate was higher in SAT conditions, indicating that scCO2 structured water is more aggressive than scCO2 alone. • MK’s poor performance might be due to its low density, making it more susceptible to vigorous carbonation |
| 28 | Yan, et al., 2023 [74] | Class G + 40% Silcia Fume (Mix 15) Class G + 10% liquid silica (Mix 16) Class G + 16% latex (Mix 20) | N/A | N/A | N/A | N/A | Cylinder (25 mm × 50 mm) | scCO2-saturated brine | 4 | 150 | 28 | • Mix 15 and 16 cement showed significant increases in carbonation depth over time, indicating higher susceptibility to CO2 corrosion compared to latex-blended cement. • Mix 16 cement composite exhibited the most favorable outcome in terms of permeability, showing a decrease in fluid penetration, while Mix 15 experienced a 600% increase in permeability despite reduced porosity. • Carbonation led to reduced compressive strength in all samples, with the highest reduction observed in Mix 16 (26%), followed by Mix 20 (18%), and the least in Mix 15 (13%). • The study highlights the importance of selecting appropriate admixtures to enhance resistance to CO2 corrosion in high-pressure, high-temperature environments. |
| 29 | Zhang. et al., 2024 [75] | Class G Class G + 40% Polymer (water-borne resin emulsion) | Water | Atmospheric | 60 | 1 | Cylinder (25.4 mm × 25.4 mm) | N/A | 25 | 75 | 50 | • The addition of polymer enhanced resistance to CO2 attack, but carbonation still occurred. •Three key factors influencing degradation of polymer-modified cement: • Corrosion depth has a logarithmic relationship with temperature. • A square root relationship exists between corrosion depth and CO2 pressure. • Corrosion depth linearly correlates with exposure time. |
| 30 | Sedic, et al., 2024 [77] | Class G + 7.5% Glass Microsphere (PC-μ) Calcium Aluminate Cement + Glass Microsphere (CAC-μ) Calcium Aluminate Cement + latex Microsphere (CAC-L) | Water | Atmospheric | 80 | 30 | Cylinder (38.1 mm × 40 mm) | scCO2-saturated water | 7 | 100 | 80 | • Calcium Aluminate Cement (CAC) samples exhibited significantly lower porosity levels compared to the micro-silica modified Portland Cement (PC-µ) reference samples. • Carbonation depth analysis using phenolphthalein revealed complete carbonation in the control sample, with no visible purple (uncarbonated) areas, while CAC composites showed a carbonation depth of 1 to 3 mm • Resistance to carbonation ranked as CAC-µ > CAC-L > PC-µ, supported by SEM, TGA, and XRD analysis. |
| 31 | Barria, et al., 2024 [79] | Class G Class G + 0.05, 0.15% bacterial nanocellulose (BNC) | lime-saturated water | Atmospheric | Atmospheric | 28 | Cylinder (38 mm × 76 mm) | wet scCO2 | 20 | 90 | 120 | • The 0.05% BNC cement composite showed a lower carbonation depth (5.6 mm) compared to the control sample (8.7 mm). • After exposure, all samples increased in density, with the 0.05% BNC sample showing the least increase. • The 0.05% BNC composite maintained mechanical strength from 30 to 120 days, while the neat cement exhibited a continuous decline. |
| 32 | Shine, et al., 2024 [82] | Class G 50% Class G + 50% Class F Fly Ash | N/A | N/A | N/A | N/A | N/A | Wet and Dry scCO2 | 6.89 | 74 | 180 | • FFPC demonstrated improved compressive strength and more stable physical properties under both wet and dry conditions. • FFPC had a more stable carbonation front, suggesting a steady-state condition that helps maintain cement integrity • FFPC could lead to more durable and reliable cementing solutions in carbon capture and storage (CCS) applications. • The study recommends customizing cement design for CCS wells based on specific well conditions |
| 33 | Lende et al., 2024 [83] | Ordinary Portland Cement (OPC) with Silica bend | Fresh Water | 31 | 80 | 28 | Cylinder (38 mm × 76 to 80 mm) | wet scCO2 scCO2-saturated water (dynamic condition) | 6.9 | 80 | 180 | • Higher temperatures accelerate the curing process of cement samples. • Forced axial method increases the rate of carbonation in cement samples. • Indentation Test Method: Offers a simple and valuable approach for mapping cement’s response to CO2 exposure. • Indentation tests are more suitable than conventional methods, especially for inhomogeneous samples, providing a better understanding of cement performance under corrosive CO2 conditions. |
| Initial Curing | Carbonation Period | |
|---|---|---|
| Days | 0.33 (8 h) to 1 | 25 to 30 |
| Temperature (°C) | 55 to 60 | 90 to 95 |
| Pressure (MPa) | Atmospheric | 9 to 10 |
Disclaimer/Publisher’s Note: The statements, opinions and data contained in all publications are solely those of the individual author(s) and contributor(s) and not of MDPI and/or the editor(s). MDPI and/or the editor(s) disclaim responsibility for any injury to people or property resulting from any ideas, methods, instructions or products referred to in the content. |
© 2024 by the authors. Licensee MDPI, Basel, Switzerland. This article is an open access article distributed under the terms and conditions of the Creative Commons Attribution (CC BY) license (https://creativecommons.org/licenses/by/4.0/).
Share and Cite
Abid, K.; Baena Velásquez, A.F.; Teodoriu, C. Comprehensive Comparative Review of the Cement Experimental Testing Under CO2 Conditions. Energies 2024, 17, 5968. https://doi.org/10.3390/en17235968
Abid K, Baena Velásquez AF, Teodoriu C. Comprehensive Comparative Review of the Cement Experimental Testing Under CO2 Conditions. Energies. 2024; 17(23):5968. https://doi.org/10.3390/en17235968
Chicago/Turabian StyleAbid, Khizar, Andrés Felipe Baena Velásquez, and Catalin Teodoriu. 2024. "Comprehensive Comparative Review of the Cement Experimental Testing Under CO2 Conditions" Energies 17, no. 23: 5968. https://doi.org/10.3390/en17235968
APA StyleAbid, K., Baena Velásquez, A. F., & Teodoriu, C. (2024). Comprehensive Comparative Review of the Cement Experimental Testing Under CO2 Conditions. Energies, 17(23), 5968. https://doi.org/10.3390/en17235968