Article

Analysis of Factors Influencing Life Cycle Costs of Transformers Based on TOPSIS Method

1
State Grid Ningxia Electric Power Co., Ltd. Material Company, Yinchuan 750001, China
2
School of Energy Power and Mechanical Engineering, North China Electric Power University, Beijing 102206, China
*
Author to whom correspondence should be addressed.
Energies 2024, 17(23), 5912; https://doi.org/10.3390/en17235912
Submission received: 21 October 2024 / Revised: 21 November 2024 / Accepted: 21 November 2024 / Published: 25 November 2024
(This article belongs to the Section F3: Power Electronics)

Abstract

:
The transformer is an essential piece of equipment in a power system, and its selection is directly related to the security, stability, and economics of the power system. This paper presents a comprehensive investigation into the life cycle costs (LCCs) of transformers. Our analysis of multiple samples delves into the composition and influencing factors in transformer life cycle costs. The findings reveal that the voltage level exerts a significant influence on cost, with higher voltage levels typically associated with greater costs. Moreover, the proportion of each cost component within the life cycle cost remains relatively stable. For this paper, we also conducted a weighted assessment of life cycle cost factors utilizing the TOPSIS method and determined that the voltage level and wiring method have the most substantial impact. In addition, the specific effects of the voltage level, wiring method, transformer type, and cooling method on LCCs are investigated using the control variable method. At the same time, the coupling influence of the wiring method, transformer type, and cooling method on transformer programs of different voltage levels is considered, which provides an essential reference for power grid enterprises in making engineering and construction investments.

1. Introduction

The power transformer is the main piece of equipment on the primary side of a power system, undertaking the task of power conversion. Life cycle cost management was introduced into China in the 1980s, and gradually began to be applied in Chinese power grid enterprises in the early 2000s [1]. The theory incorporates all costs incurred during the product’s life cycle into the calculation and develops a projection for cost accounting [2]. It can comprehensively reflect the long-term investment cost of equipment and provide data support for subsequent economic decisions [3,4].
In recent years, with the development of the power system, many pieces of power equipment are facing a number of decision-making problems, such as replacement, maintenance, and scrapping, and are given priority, mainly because of the relatively large cost consumed [5]. At the same time, traditional power transformers fail to be optimized for the actual situation during development and lack life cycle cost models for analysis and management [6]. In recent years, with a series of policies and regulations to promote energy-efficient transformers having been set and implemented, transformer manufacturing enterprises, accordingly, have produced different types of transformers [7,8]. Designers in transformer design selection not only have to follow the relevant standards for transformer energy efficiency level requirements but also need to consider economic efficiency and other factors. Scholars in China and internationally have carried out research work on life cycle cost classification related to electrical equipment. Fan [9] classifies LCC models into two categories, static and dynamic costs, and Cervero and Meyer [10,11] classify LCC models in nearly the same way, which can be summarized as the initial investment cost, operation cost, maintenance cost, failure cost, and disposal cost. For the LCCs of power transformers, based on the above cost classification, Gustavsen [12] mentions the concept of environmental cost, Zhao [7] analyses the impact of the failure rate on various types of cost from the perspective of overhaul, and the literature [13] predicts the failure rate by using the survival state variable that holds the historical information of the equipment in order to optimize the cost calculation.
In modern society, decision makers often face problems with diversity and complexity, which require them to comprehensively evaluate multiple attributes. In this process, weight determination becomes a key link [8]. Weight reflects the relative importance of various attributes in the decision-making process, helping decision makers better grasp the key issues. Through weight determination, the Technique for Order Preference by Similarity to an Ideal Solution (TOPSIS) method makes the decision-making process more scientific and reasonable [14]. The importance of weight determination in the TOPSIS method is reflected in several aspects: firstly, weight allocation can reflect the decision maker’s emphasis on different attributes [15]. In practice, the impact of different attributes on decision results varies, and the rational distribution of weights ensures that decision results are more consistent with reality [16]. Secondly, weight determination helps eliminate subjective judgment bias [17]. In multi-attribute decision-making, decision makers may be affected by personal preferences, experience, and other factors, while weight determination reduces the influence of these factors on decision results [18]. In the TOPSIS method, there are many methods for weight determination, mainly including subjective weighting methods and objective weighting methods [19]. Subjective weighting methods rely mainly on the experience and judgment of decision makers, such as expert scoring methods or analytic hierarchy processes. Objective weighting methods determine weights according to the statistical characteristics of data itself, such as the entropy method or variation coefficient method [20,21]. These two methods have their own advantages and disadvantages, and appropriate weighting methods should be selected according to specific conditions in practical applications [22]. Flexibility is another important feature of weight determination in the TOPSIS method. Since weights can be adjusted according to actual situations, the TOPSIS method can adapt to decision-making needs in different fields [23]. From environmental protection to economic management and social governance, the TOPSIS method can play an important role. Moreover, weight determination can help decision makers discover potential problems, so that they can make targeted adjustments in the decision-making process [24]. In summary, weight determination plays a pivotal role in the TOPSIS method. It not only improves the accuracy and rationality of decision-making, but also makes the decision-making process more transparent and fair [25]. With the wide application of multi-attribute decision analysis in various fields, research and improvements in weight determination methods will continue to progress, providing strong support for China’s economic and social development [26]. In the future, the TOPSIS method and its weight determination technology will continue to play an important role, helping decision makers to make wiser decisions in complex and changeable environments [27].
In summary, the current research landscape focuses on the quantitative study of LCCs for individual transformers [28,29]. In comparison, the innovations of this paper are as follows:
(1) This paper innovatively collects a large amount of actual engineering data on transformer LCCs and combines LCCs with the TOPSIS method. The main influencing factors affecting the LCCs of transformers are extracted, and the weights of each factor are calculated.
(2) According to the results of the weight calculation, the control variable method is utilized to study the impact of critical factors on the cost of transformers at the typical voltage levels of MV, HV, and EHV.
(3) We consider the multi-factor coupling relationship comprehensively, to optimize the scheme of transformers, which will provide an essential reference for the economy of power systems.

2. Methodology

The evaluation system combines the LCC theory with the TOPSIS method. In order to make the evaluation process clearer, the whole evaluation process is shown in Figure 1.

2.1. LCC Theory

A transformer’s LCC is the cost of all expenditures related to the transformer over its entire life cycle [30]. According to the theory of LCC, in order to identify the categories of costs and undertake the quantitative analysis of costs in the life cycle of power equipment and materials, the costs are calculated by dividing them into four stages: initial investment, operation and maintenance costs, failure 0 costs, and disposal costs [16].
LCC = C 1 + C 2 + C 3 + C 4
where C1 is the initial investment cost (the amount of money required to start a business or project at its inception) of the transformer; C2 represents its operation, maintenance and repair costs; C3 represents its failure costs; and C4 represents its disposal costs.

2.1.1. The Initial Investment of the Transformer [31]

The initial investment cost of electrical equipment and materials, C1, includes the construction cost, installation cost, equipment cost, and other costs involved in the initial investment stage, and the formula is as follows [32]:
C 1 = C BCE + C BCI + C BCA + C BCO
where CBCE represents the equipment costs; CBCI represents the construction cost; CBCA represents the installation cost; and CBCO represents the initial investment stage of other costs involved.

2.1.2. Operation and Repair Costs

The operation and repair costs of the transformer, C2, are mainly considered to be the costs of equipment maintenance and daily inspection and repair.
C 2 = C WH + C JX
where CWH represents the maintenance costs of the transformer and CJX represents the overhaul costs of the transformer.

2.1.3. Failure Costs

The failure cost C3 is a set of costs incurred when a failure occurs, resulting in an emergency shutdown that needs to be immediately restored to running condition [33].
C 3 = n = 1 a C nF 1 + C nF 2 ( 1 + i ) n 1
where CnF1 is the cost of equipment failure loss, CnF2 is the cost of repairing the failed equipment, i is the discount rate, and a is the calculation period. The cost of power interruption losses incurred annually in substation projects is calculated using the following formula:
C F 1 = α × W × T
where α is the value of the average economic loss due to power interruption for the associated users, which is influenced by the users’ nature and the regional context; W is the value of the average power during the power interruption for the given year; and T is the value of the total duration of the power interruption for the given year.

2.1.4. Disposal Costs
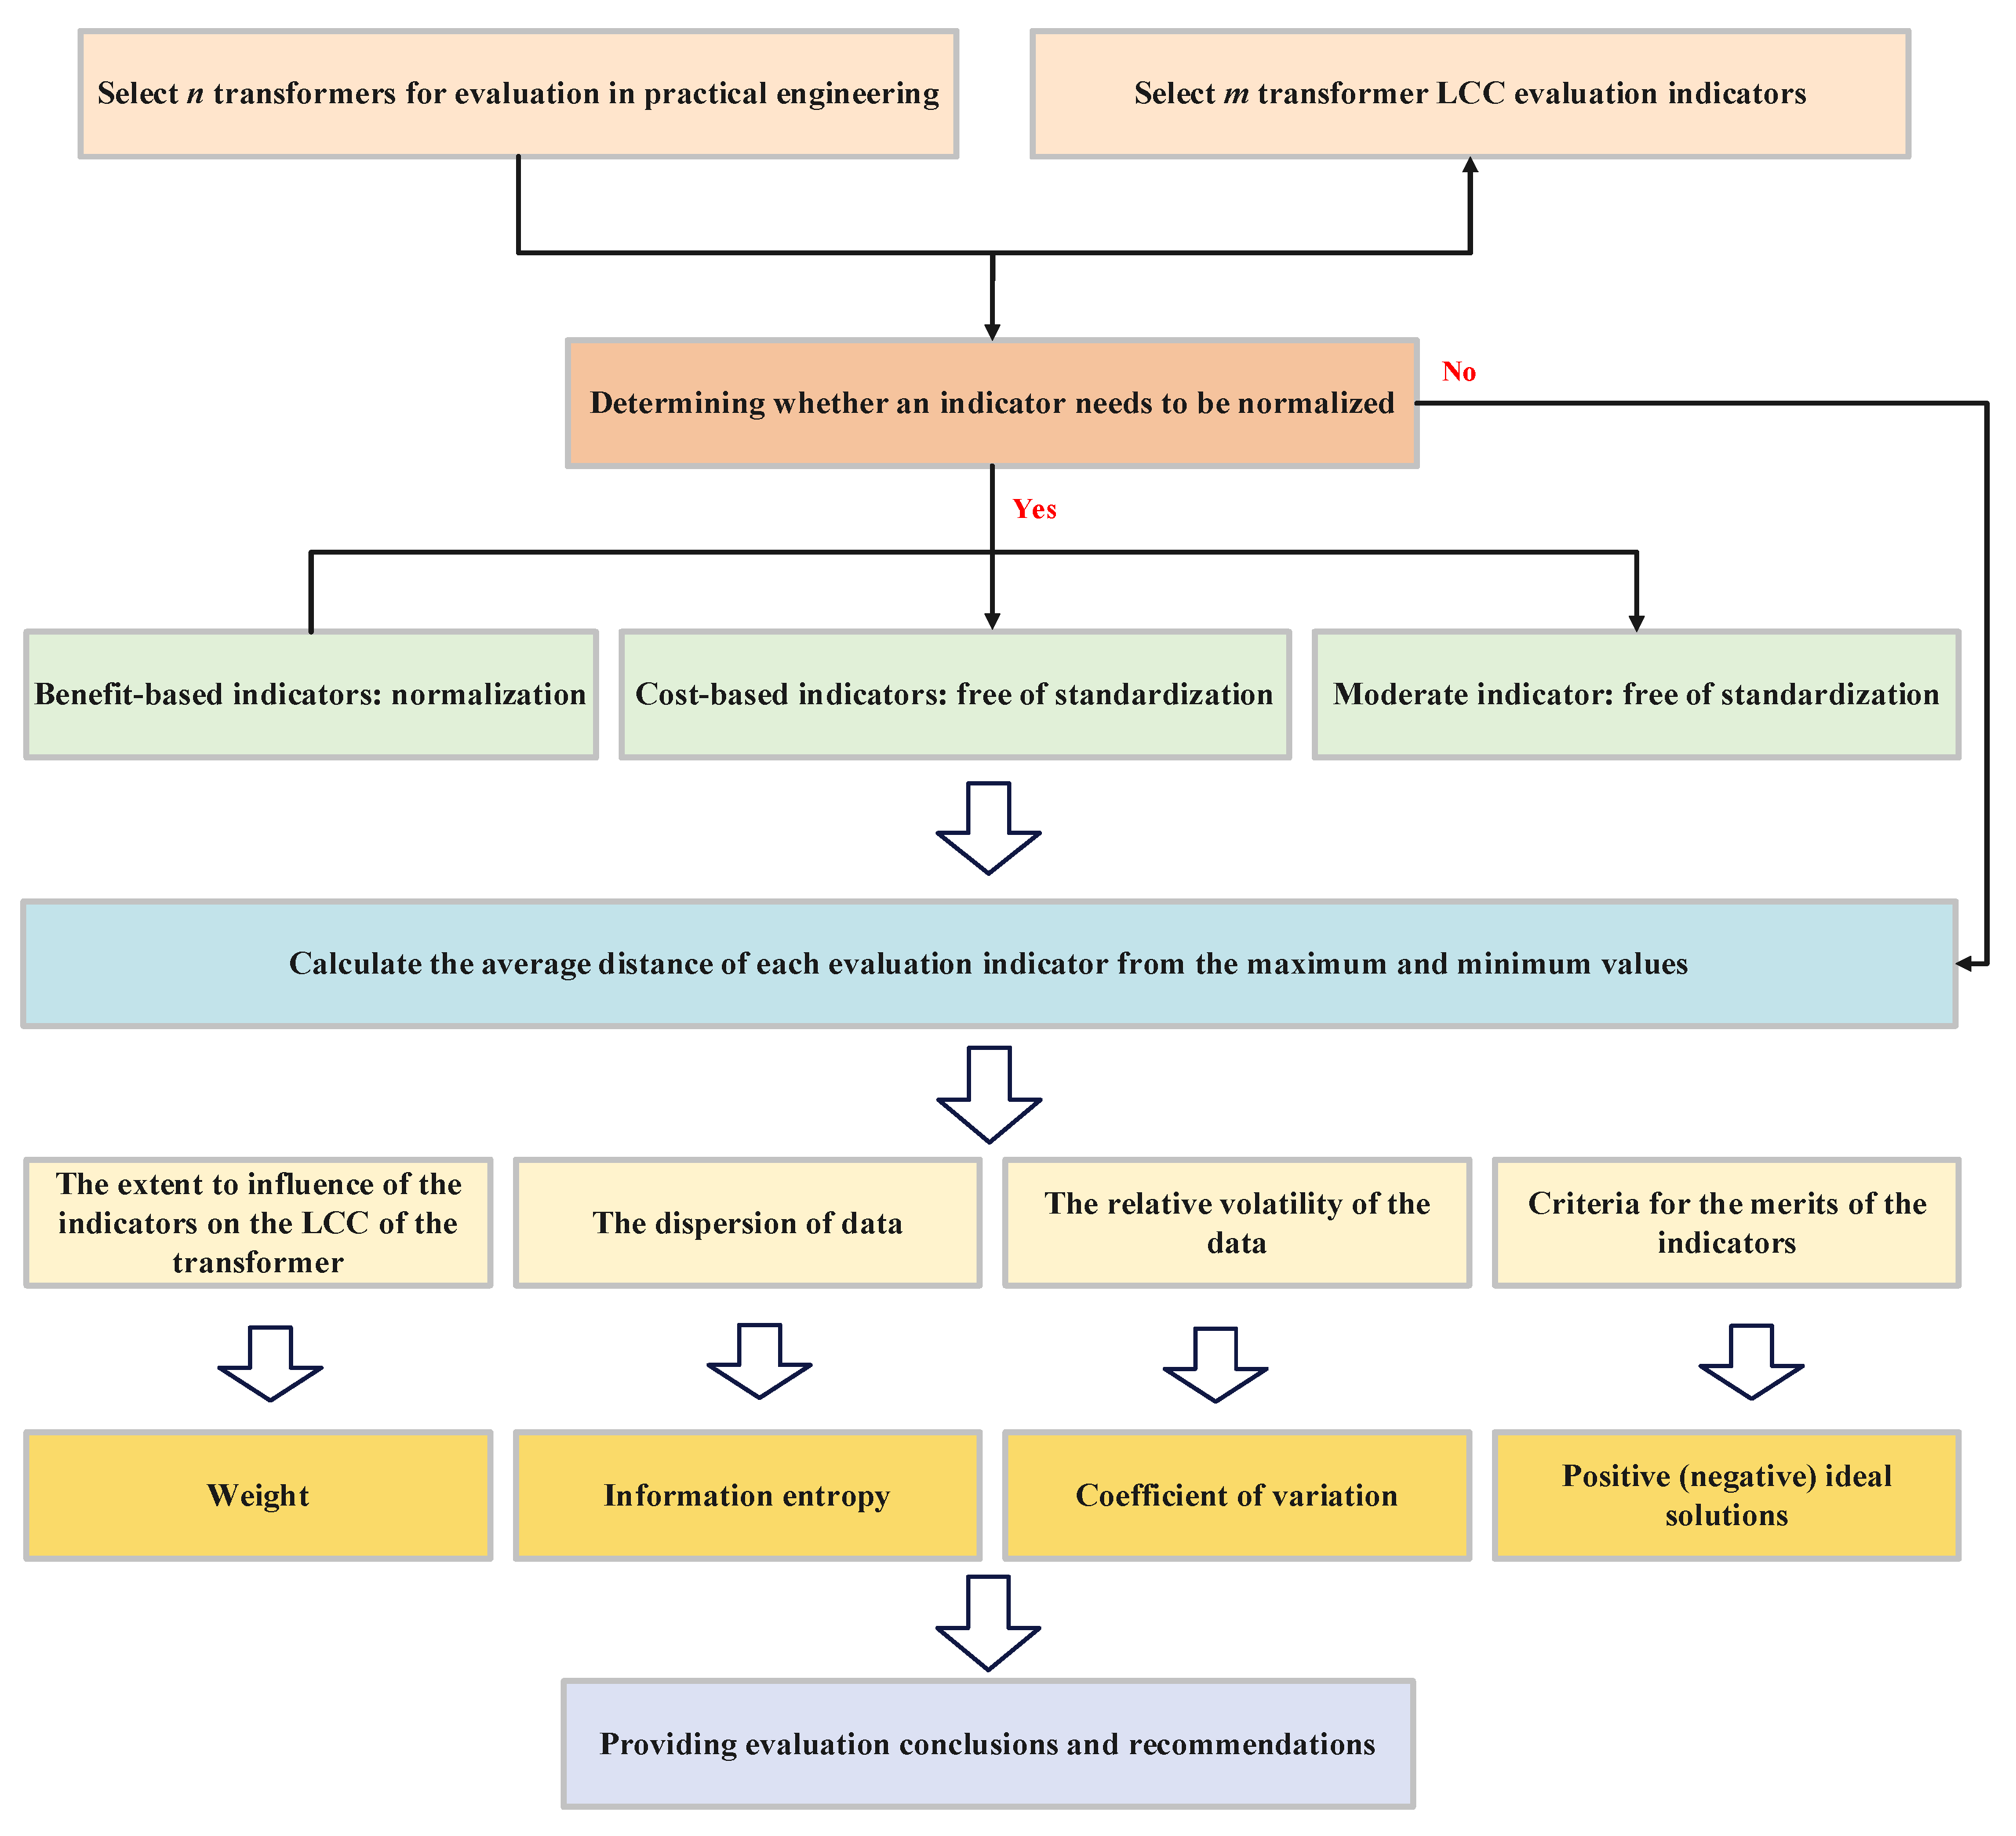
The disposal cost C4 is the cost incurred in the process of decommissioning or scrapping equipment, which mainly consists of two parts: the equipment scrapping cost and equipment salvage value. Normally, the equipment scrapping cost is calculated according to 32% of the installation cost, and the salvage is estimated according to 5% of the acquisition cost [34].
C 4 = C cd × ( 1 + r ) / ( 1 + R ) t 1
C cd = C bf C cz
where Ccd is the value of the cost of decommissioning and disposal before conversion; Cbf is the value of the scrap cost of the equipment; Ccz is the value of the residual value of the equipment at the time of decommissioning; r is the discount rate; and R is the operational life of the transformer at the time of its retirement or scrapping.

2.2. TOPSIS Method

The TOPSIS method, a multi-criteria decision analysis technique, can be adapted to calculate the weight of factors influencing transformer LCCs. The process involves an emphasis on determining the relative importance of each factor based on their variability and information content. We will now present the steps involved [26].

2.2.1. Basic Data Matrix

The indicators to be evaluated are presented in matrix form. Suppose there are m items to be evaluated and n indicators to be evaluated.
X = x 11 x 12 x 1 n x 21 x 22 x 2 n x m 1 x m 2 x m n

2.2.2. Data Standardization

Data standardization is the process of eliminating the dimensional differences between various indicators, allowing all indicators to be compared and analyzed on the same scale. This ensures that in the decision-making process, the importance of certain indicators is not dominated by their larger or smaller numerical values. To eliminate the difference in numbers (numerical range and numerical scale), the decision matrix X is standardized to the matrix R.
r i j = x j x min x max x min
r i j = x max x j x max x min
where xj is the value of the j-th indicator, xmax is the maximum value of the j-th indicator, xmin is the minimum value of the j-th indicator, and rij is the standardized value. If the selection of the larger/smaller indicator value is better, then Formula (9)/(10) is used.
The normalized data matrix is as follows:
R = r 11 r 12 r 1 n r 21 r 22 r 2 n r m 1 r m 2 r m n

2.2.3. Information Entropy Weights for Indicators

The information entropy ej of each metric can be calculated by the following steps:
e j = k i = 1 m p i j ln p i j
k = 1 ln m
where m is the number of items to be evaluated; pij is the probability density (the likelihood of a random variable taking on a specific value within a continuous range) of the j-th index on the i-th project, defined as follows:
p i j = r i j i = 1 m r i j

2.2.4. Coefficient of Variation

The coefficient dj of variation for each indicator can be obtained by following this step:
d j = 1 e j
The coefficient of variation directly influences the size of the weight: the larger the coefficient of variation, the more significant the impact on the evaluation object and the greater the weight.

2.2.5. Weights for Indicators

The weight of the j-th indicator can be presented as follows:
w j = d j j = 1 n d j

3. Results and Discussion
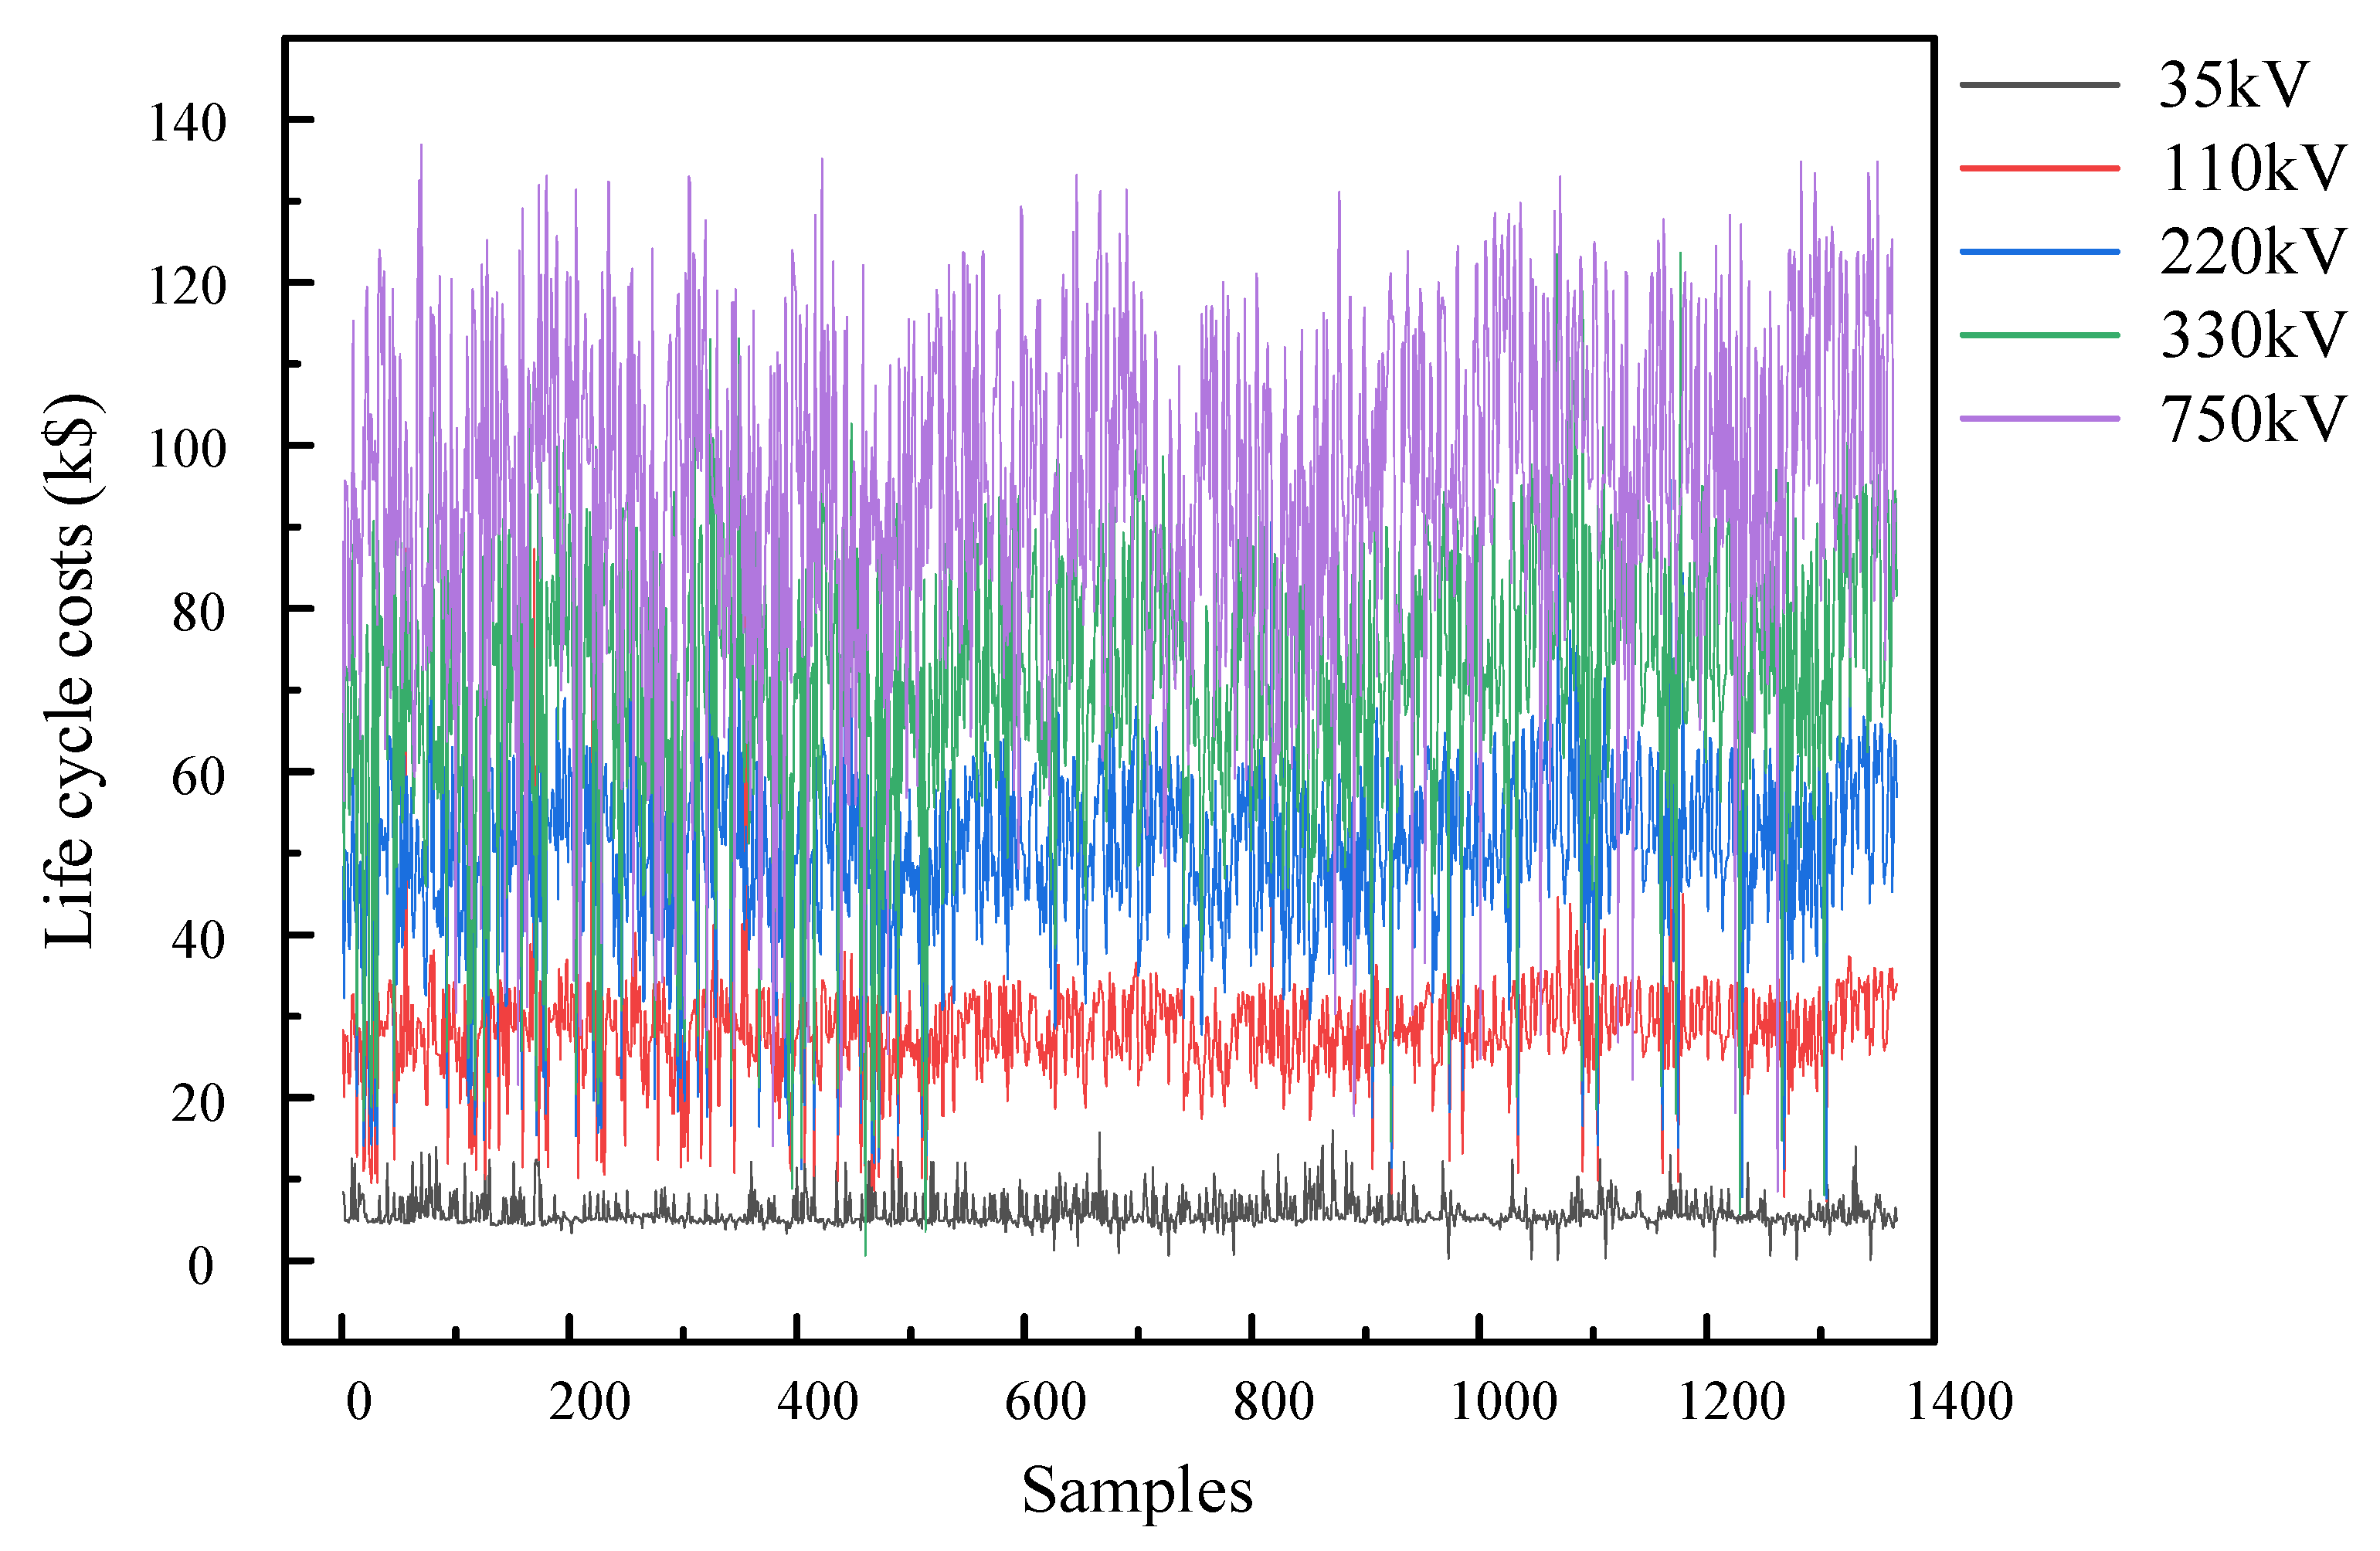
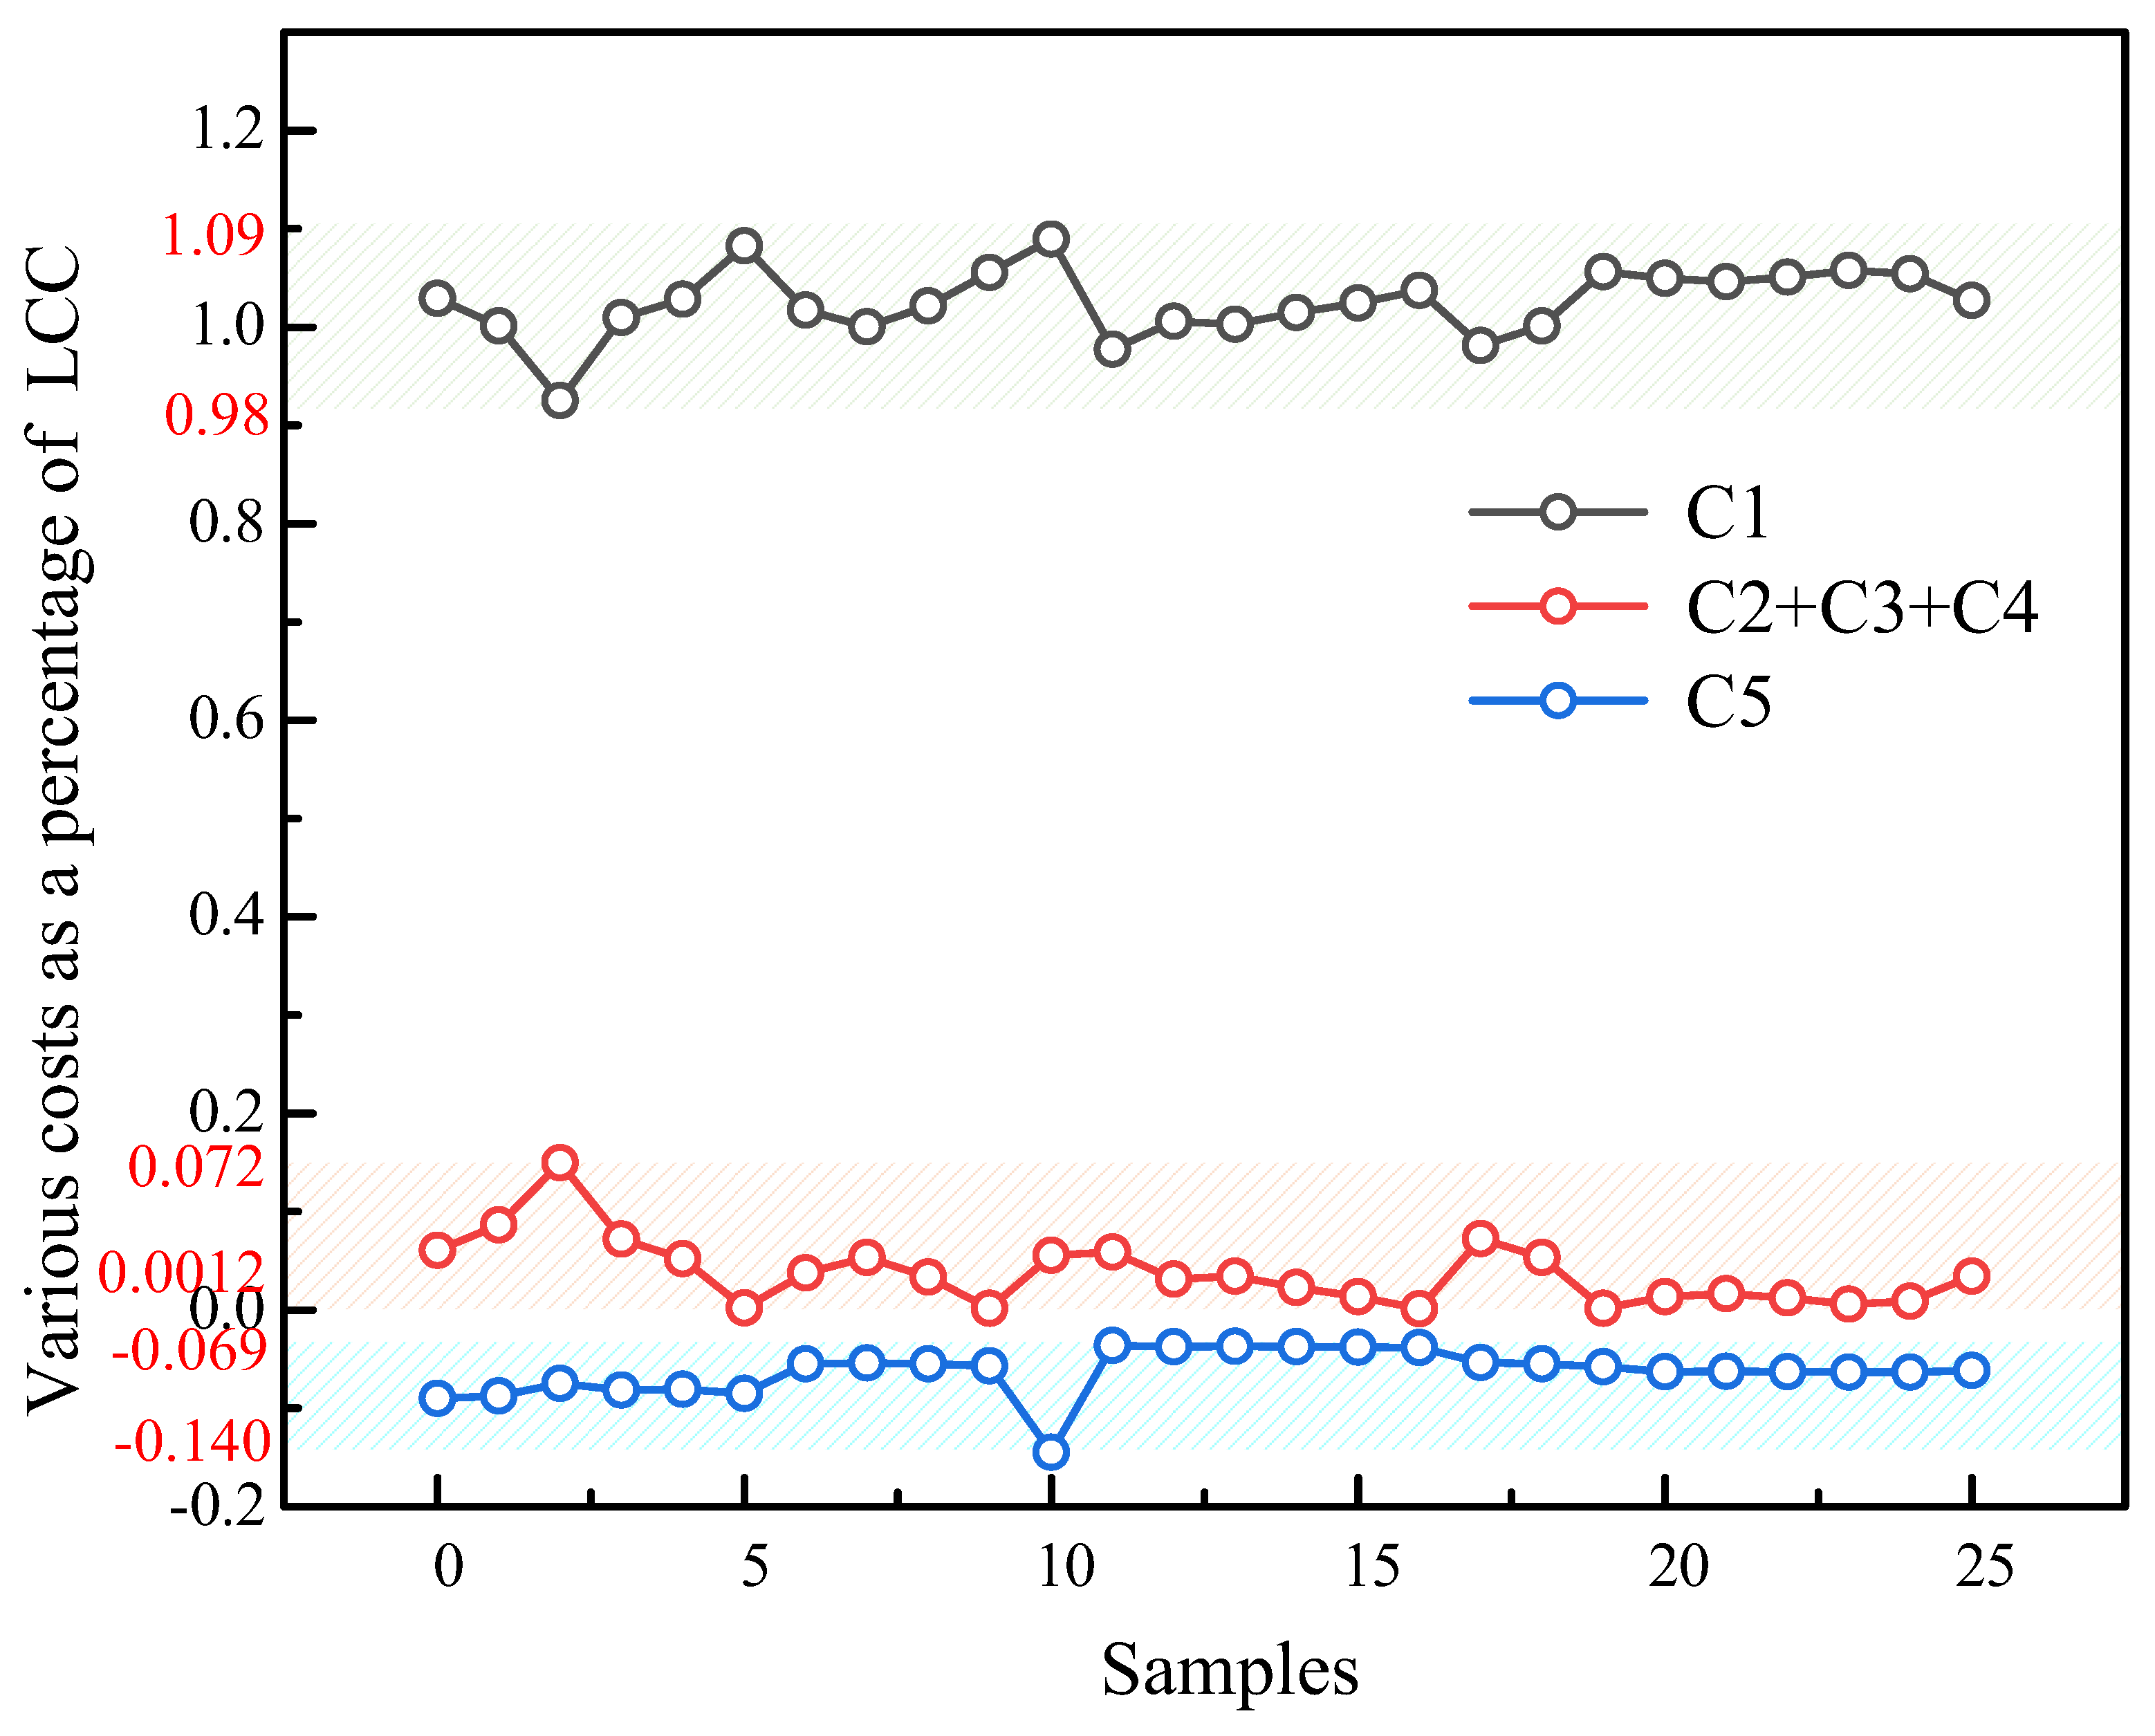
Based on the transformer procurement data from various substation projects provided by a power grid company in a western province of China, we combined LCCs and the TOPSIS method to identify the four factors with the highest influence weights. By employing the control variable method to filter out corresponding data, we conducted quantitative research on the impact of individual and combined factors on transformer costs. This research can provide valuable references for transformer selection in practical engineering projects.

3.1. LCC Results

In order to better explore the composition of the LCCs of transformers and the factors influencing it, several samples were investigated and statistically and analytically analyzed, and the results are plotted in Figure 2 and Figure 3. And the connections between the weights selected and the factors and parameters for parts of cases are shown in Table 1. Partial sample information is shown in Table 1. It is worth noting that in Table 2, the “sample” denotes a carefully selected subset of data from a comprehensive transformer LCC dataset, chosen specifically for the research objectives. The dataset encompasses details such as the statistical year, the affiliated substation, the years in operation, the layout, the switchgear, and the rated capacity. From an extensive collection of 1366 data points, we meticulously extracted 25 sets that fulfill the criteria and show representativeness for in-depth analysis and investigation. However, due to limited space, we only present partial data from 15 of these samples.
As can be seen in Figure 2, although the LCCs of transformers of the same voltage level fluctuate over a wide range, they basically follow the rule that the higher the voltage level, the larger the LCC [35]. For the studied transformers of 35 kV, 110 kV, 220 kV, 330 kV, and 750 kV voltage levels, the LCC of each voltage level fluctuates within a certain range.
From the multi-sample analysis in Figure 3, it can be seen that the proportion of each cost component in the LCC of the transformer is relatively stable. C1 has the highest proportion, which is stably maintained at 98–109%; C2 + C3 are maintained at 0.12–7.2%; and C4 is maintained at −14–−6.9%. It is worth noting that C5 is the cost of the disposal stage [36]. Practical engineering experience indicates that the proceeds from the sale of equipment at this stage are greater than the cost of disposal. Therefore, the cost of this stage for C4 is expressed as a negative number. This is why the percentage of C4 is negative in the figure.
In this section, we conducted preliminary statistics and organization with the collected transformer LCC (life cycle cost) data, outlining the LCC range for different voltage levels and the proportion of various costs within the LCCs. This lays the foundation for subsequent research.

3.2. Weighted Assessment

In order to investigate the impact of different influencing factors on the LCCs of transformers, a large number of samples were quantitatively analyzed using the TOPSIS method [37]. The indicators considered include the wiring scheme, the voltage level, the switchgear, whether it is a smart substation, the layout, topographical conditions, and the cooling method. Based on the TOPSIS theory, a normalization matrix was established and is shown as Table 2. Subsequently, its information entropy, coefficient of variation, optimal distance, and worst distance were calculated, and the results are shown in Figure 4. It is worth noting that “layout” here refers to the specific configuration and positioning of the transformer, which includes both indoor and outdoor arrangements. The indoor layout might involve placing the transformer within a building or a dedicated room, whereas the outdoor layout would involve situating the transformer in an open-air environment, possibly within an enclosure to protect it from the elements. In Table 2 (re-numbered), we use “1” to represent indoor and “0” for outdoor. By the same reasoning, the values 0.25, 0.5, 0.75, and 1 do not represent actual voltage levels but are elements of a matrix derived from the standardization of voltage level data using Equation (9).
In the results obtained, a higher weight indicates a greater influence of the indicator on the LCC of the transformer. The information entropy reflects the scatter of data, and the lower the information entropy, the smaller the range of variation in the indicator [38]. The coefficient of variation is another indicator of the degree of data dispersion, and a large coefficient of variation means that small changes may lead to large fluctuations in costs. In addition, a positive ideal solution represents the best-case performance combination, while a negative ideal solution represents the worst case.
As can be seen in Figure 4, the voltage level has the highest weight, of about 0.30. This is followed by the wiring method, at 0.28, and the cooling method, at 0.22. The weight of whether it is a smart transformer is 0.07. This indicates that the voltage level and the wiring scheme have the greatest impact on the LCC of a transformer. In the actual project, the control of transformers’ costs should focus on these two indicators. If the voltage level cannot be changed, then the wiring scheme and cooling methods can be exchanged. Meanwhile, the results for the information entropy, coefficient of variation, positive ideal solution, and negative ideal solution are also consistent with these conclusions.
In this section, we employed the TOPSIS method to analyze the main influencing factors of LCCs. We calculated the weight, information entropy, and other metrics for each factor, quantitatively determining the relationship between each key factor and LCCs. This provides a direction for optimizing LCCs.

3.3. Single-Factor Impacts

Based on the comprehensive weight calculation analysis results, among the numerous factors that influence the transformer’s LCC [39], factors such as wiring methods, voltage levels, the intelligent characteristics of transformers, and cooling methods have a significant impact on costs. To analyze in depth the specific influence of these factors on the LCC, this study employed the controlled variable method, a scientific and commonly used experimental design approach. This method aims to isolate a single variable to accurately measure its impact on the overall system or process. According to the characteristics of power grid procurement data from a province in northern China, 35 kV, 220 kV, and 330 kV were selected to represent the typical voltage levels for medium, high, and ultra-high voltage, respectively.

3.3.1. Voltage Level

To explore the impact of different voltage levels on costs in greater depth, this study selected 1000 transformer samples for research at various voltage levels: 35 kV, 110 kV, 220 kV, 330 kV, and 750 kV. All selected transformers share common operational characteristics: they utilize double-busbar segmented wiring and adopt Forced Oil Circulation Directed Air Cooling (ODAF), as shown in Figure 5. This standardization is crucial to ensure that any observed variations in cost can be primarily attributed to differences in voltage levels rather than other design or operational factors.
The cost of transformers shows an upward trend as the voltage level increases. This is mainly due to the increased requirements for insulation performance, structural strength, and design and development costs. First of all, the high voltage level leads to higher requirements for the insulation performance of transformers. In order to ensure the safe operation of transformers at high voltages, higher-quality insulation materials and more complex insulation structures are required. The cost of these insulating materials and structures is usually higher, increasing the manufacturing cost of the transformer [40]. Secondly, high voltage levels require transformers to have greater structural strength. As the voltage level increases, the electromagnetic force that the transformer is subjected to during operation also increases, requiring the use of higher-quality materials and more complex manufacturing processes, which will increase the cost of the transformer. Due to the higher voltage level, transformers are more technically complex and more technically challenging, so the design and manufacturing costs are also relatively high.

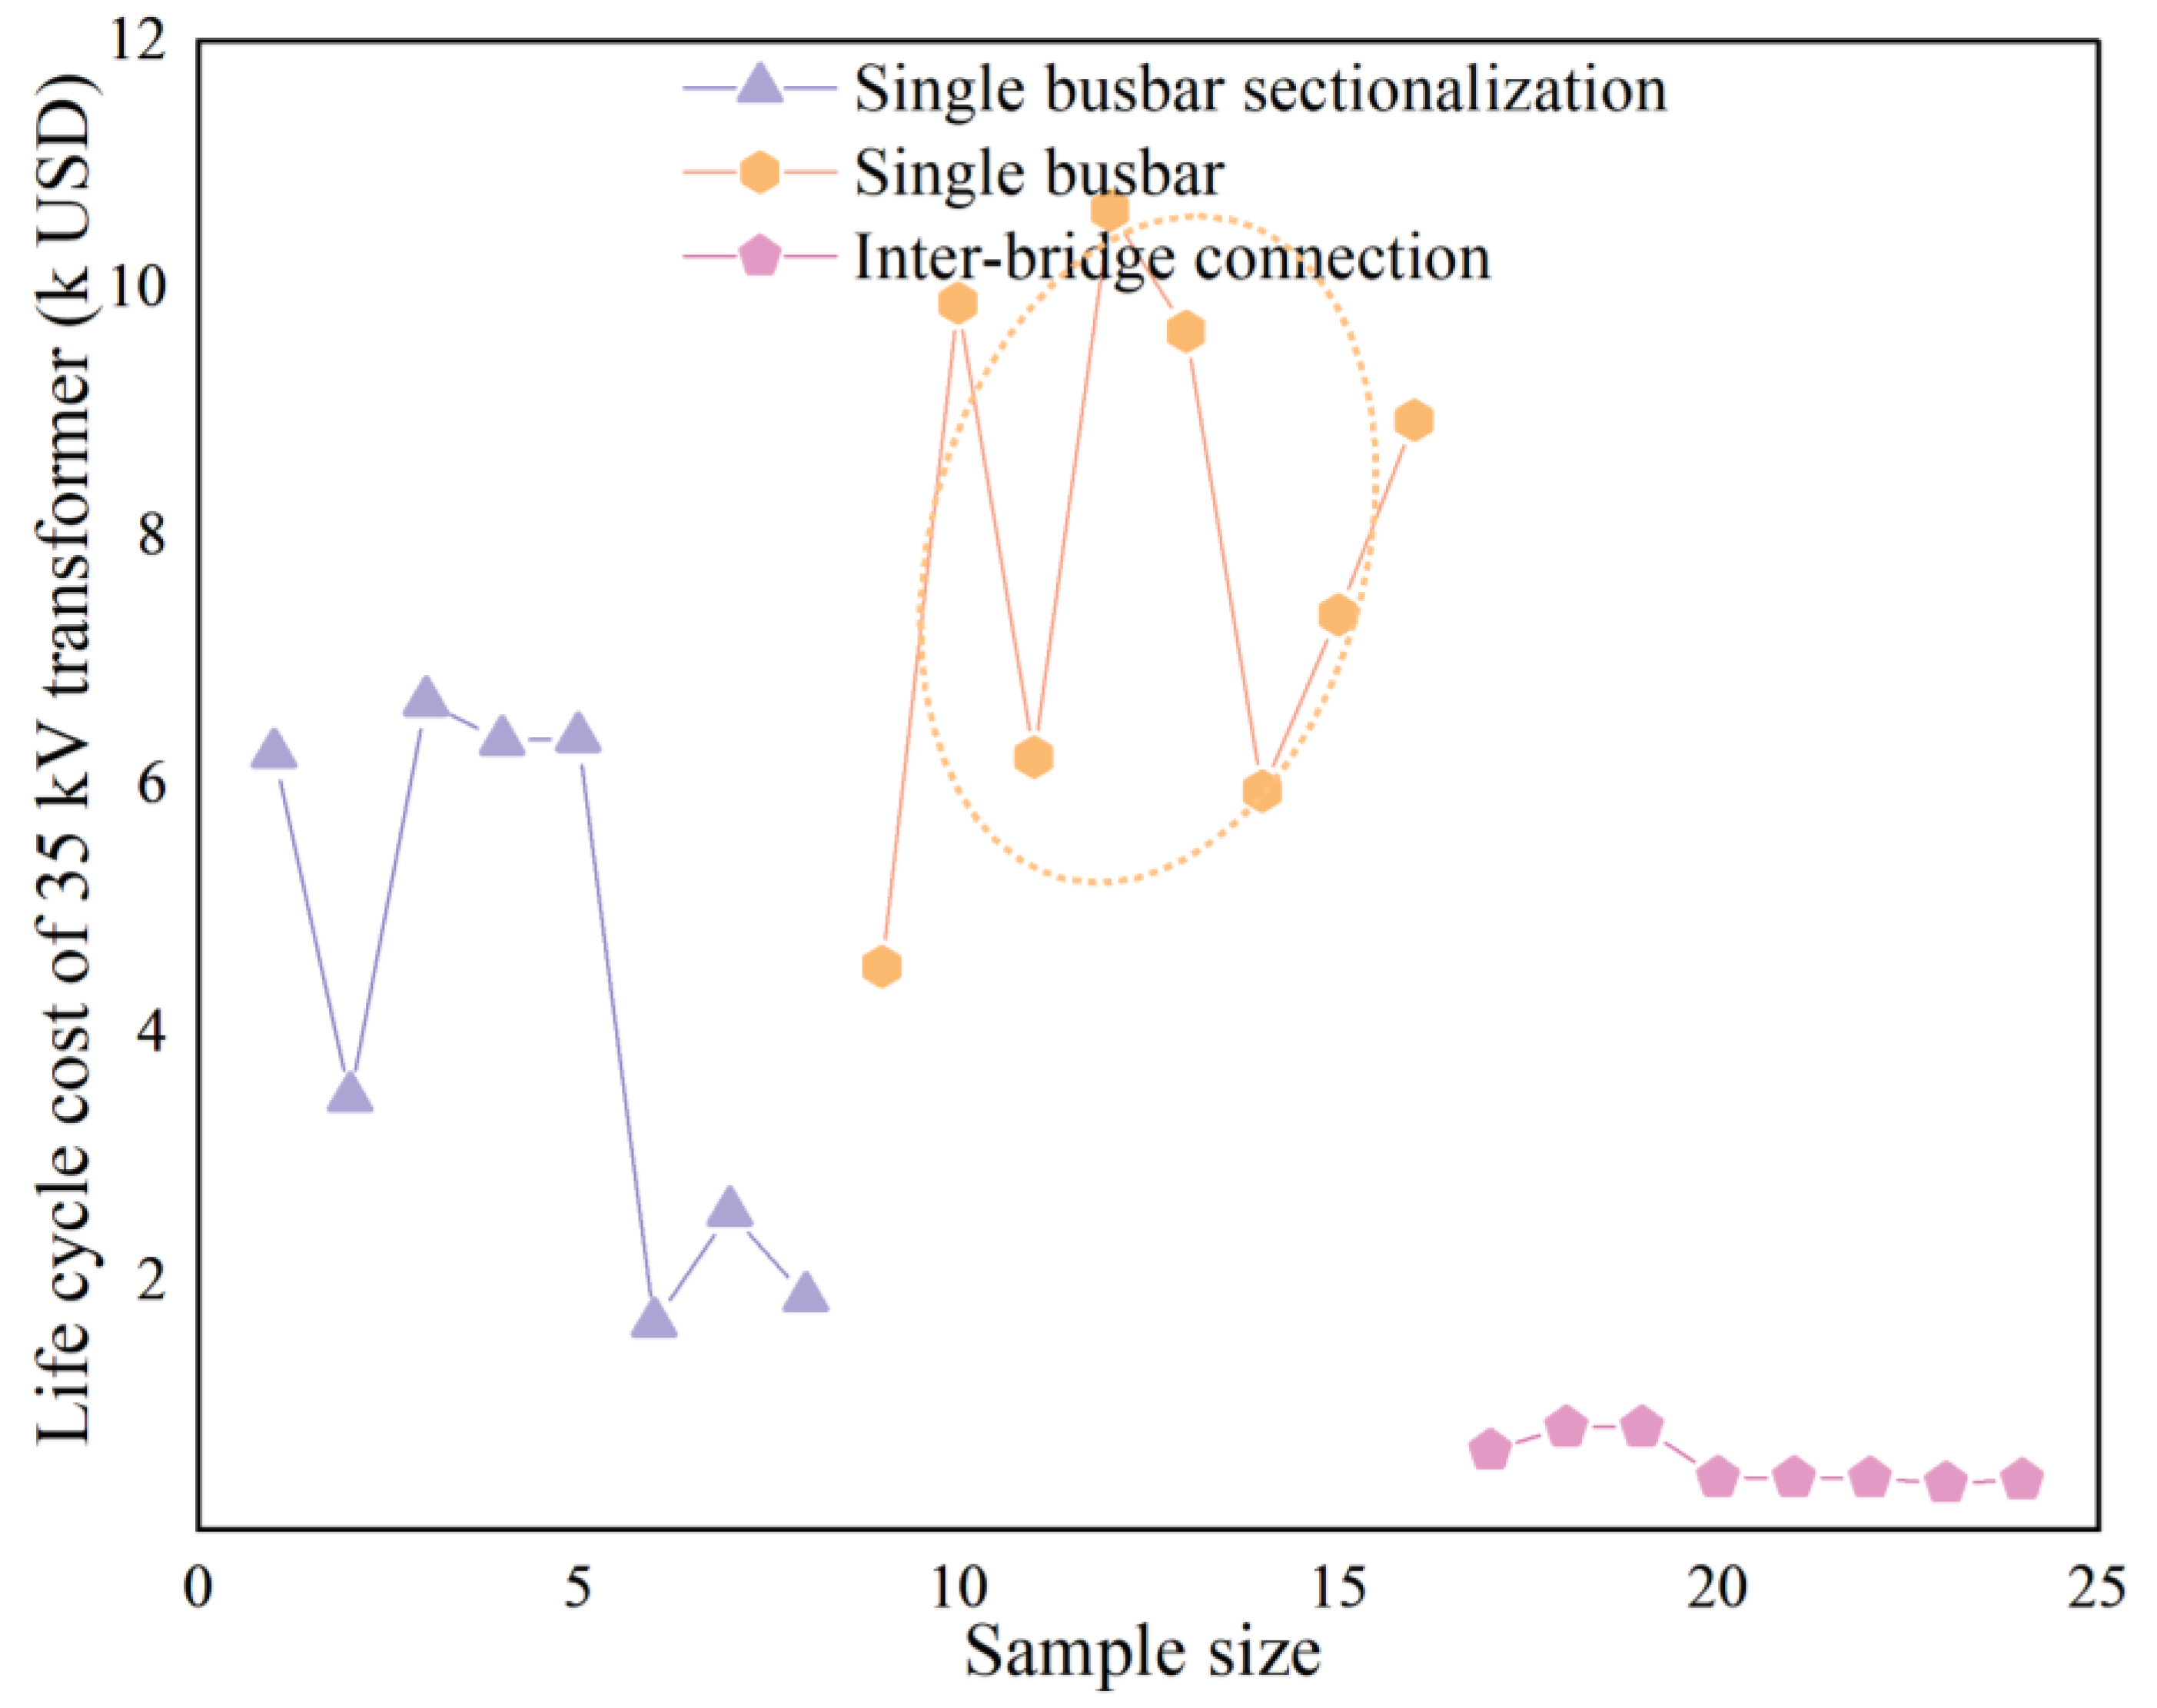
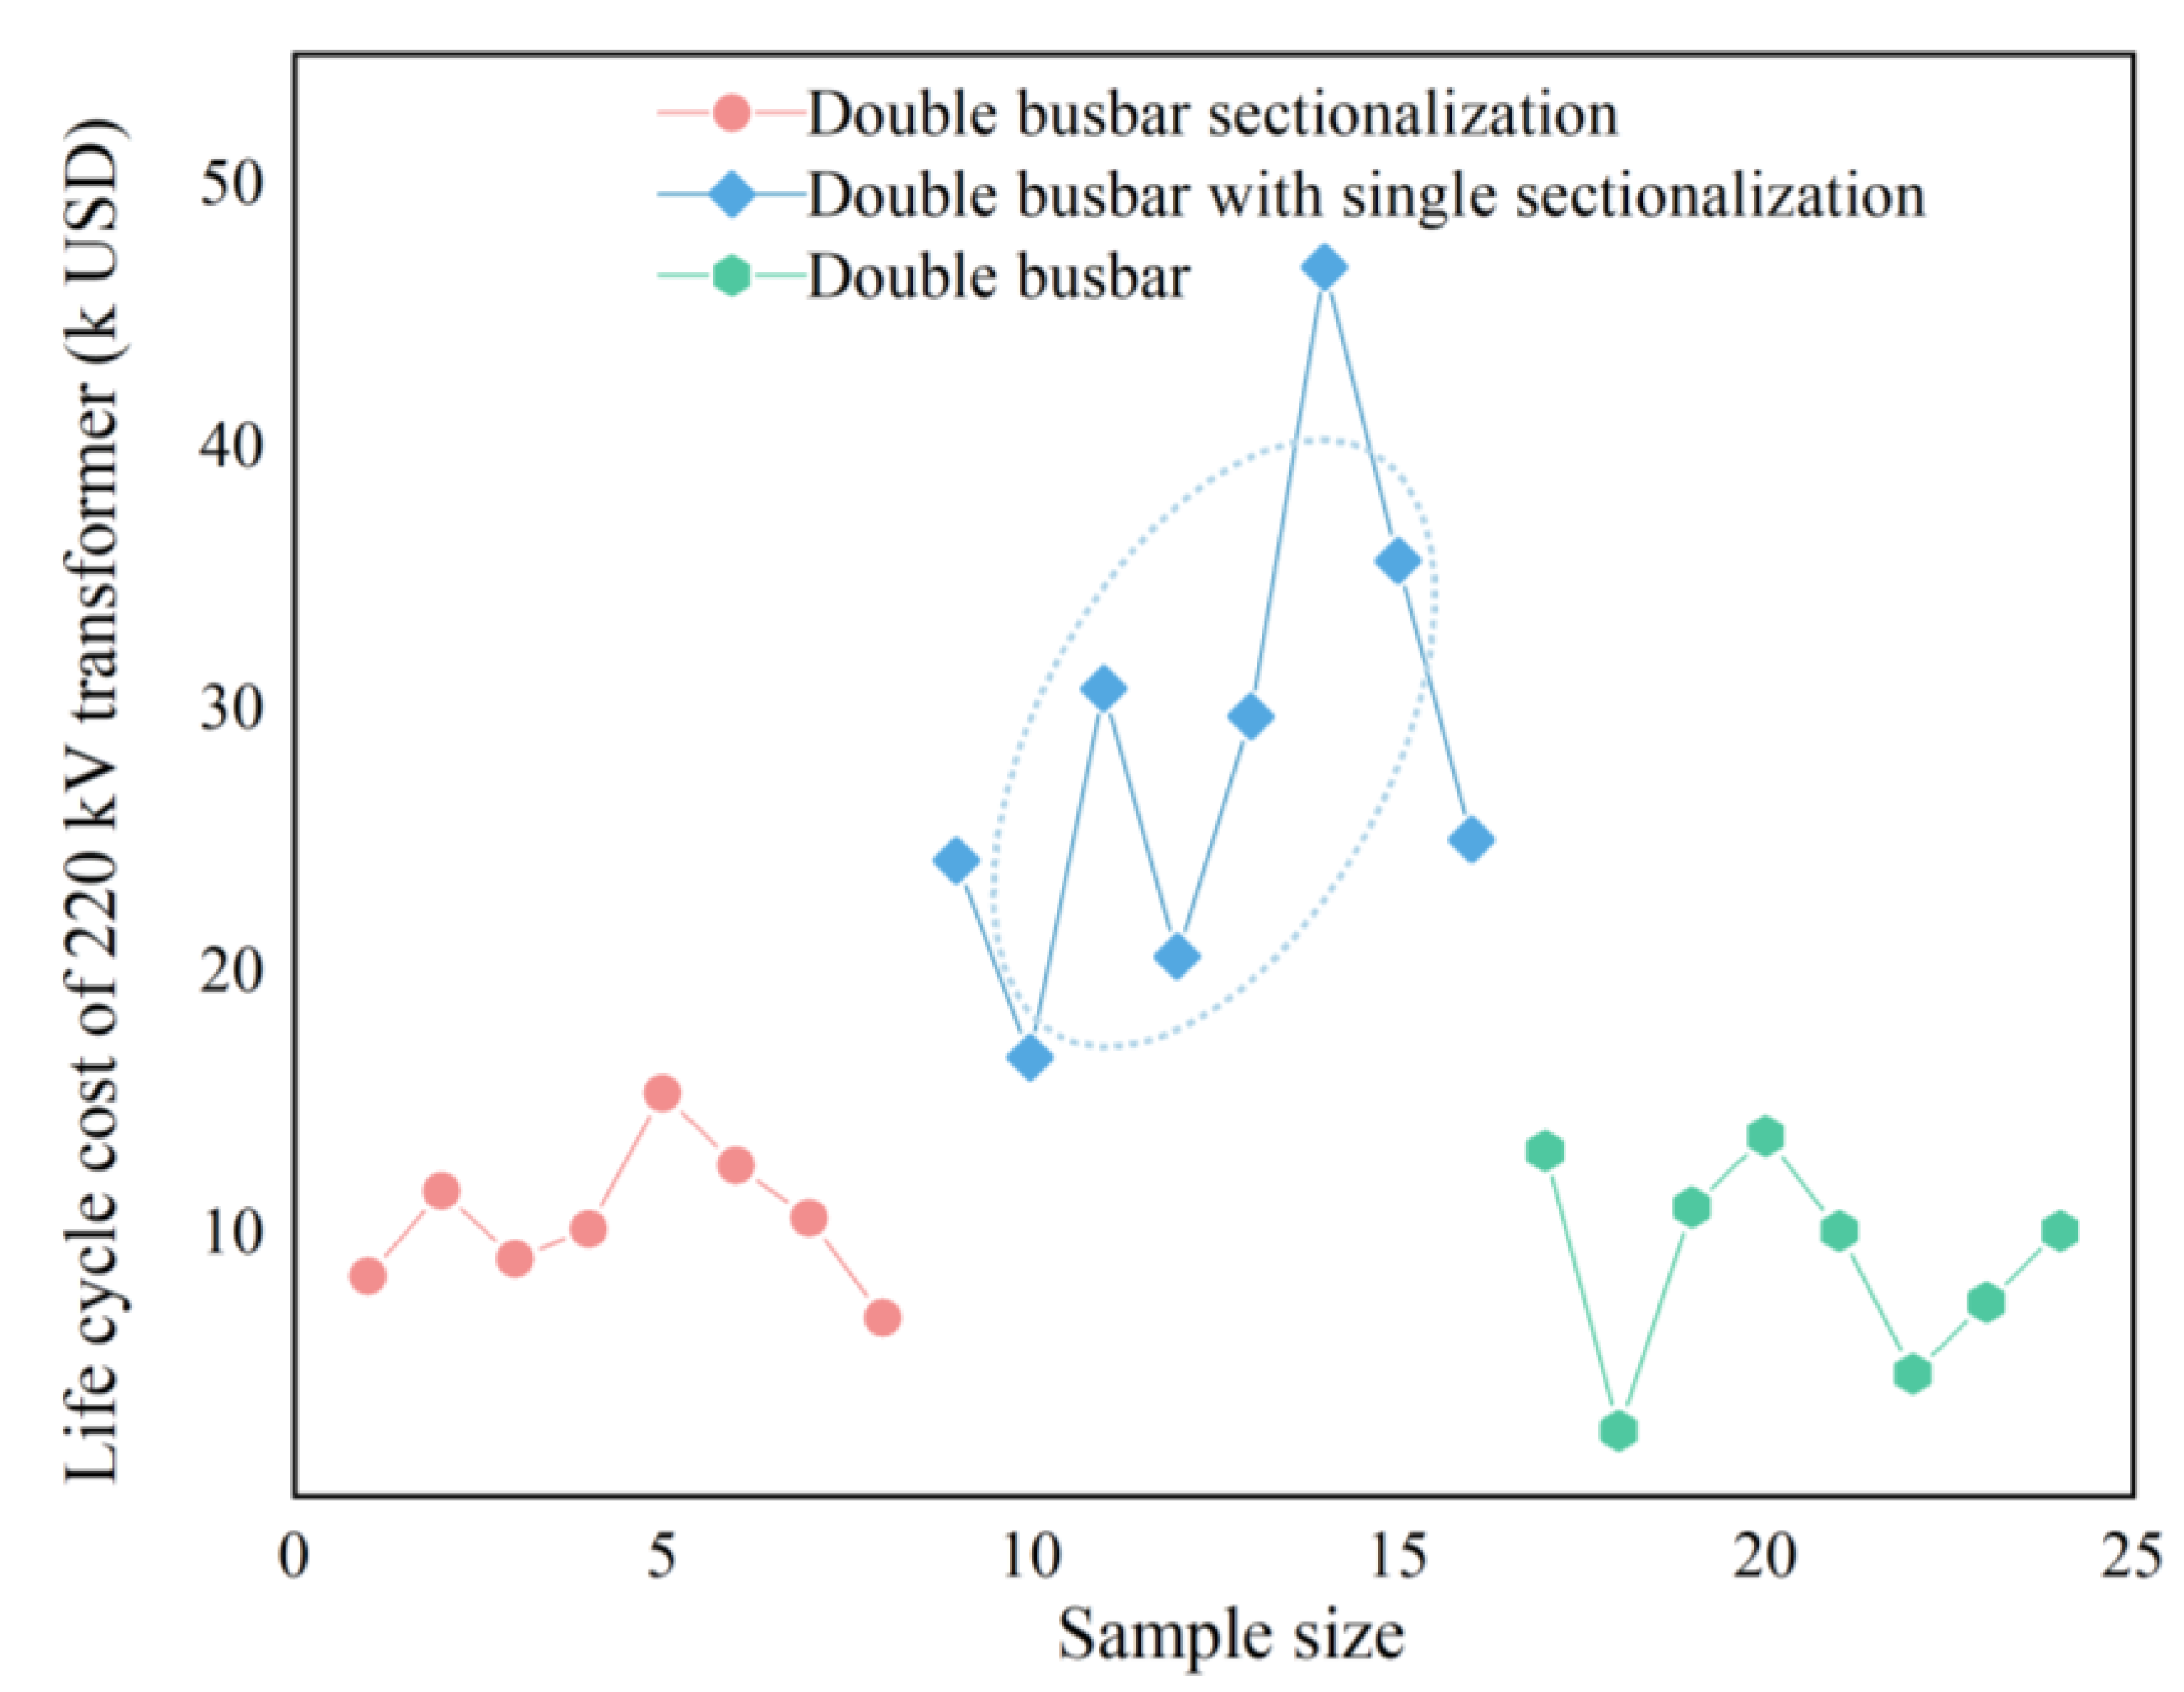
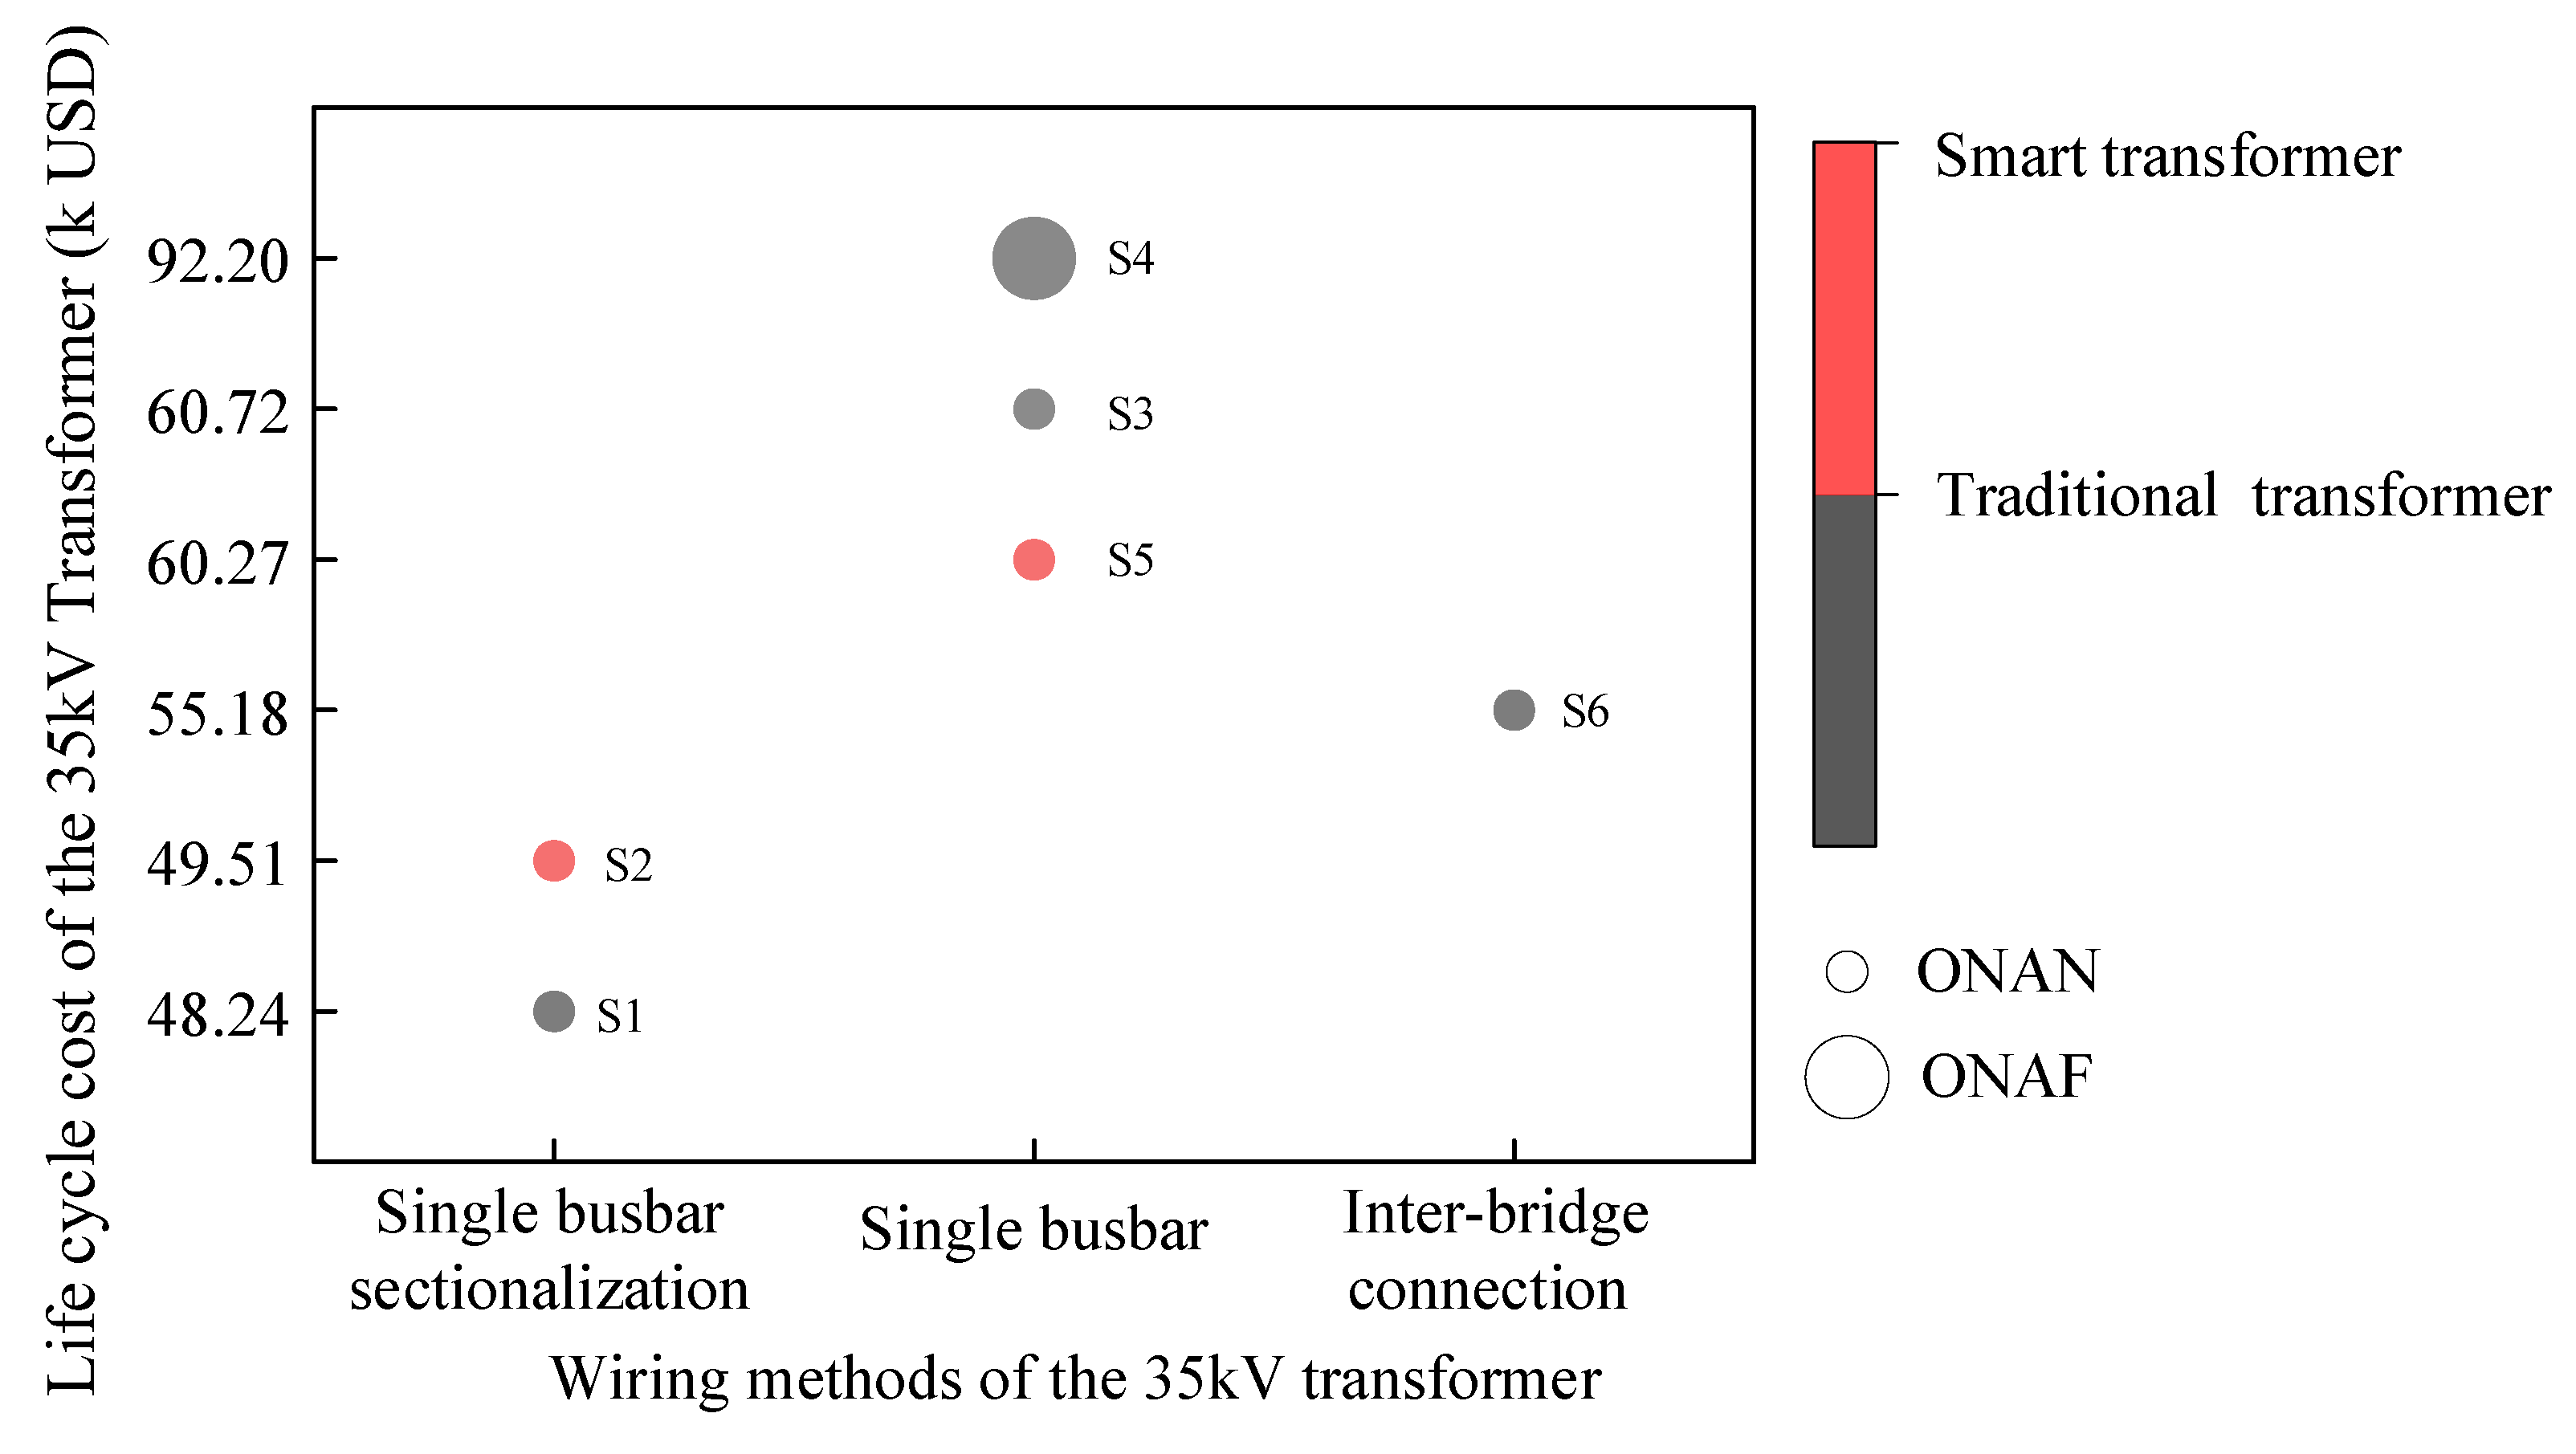
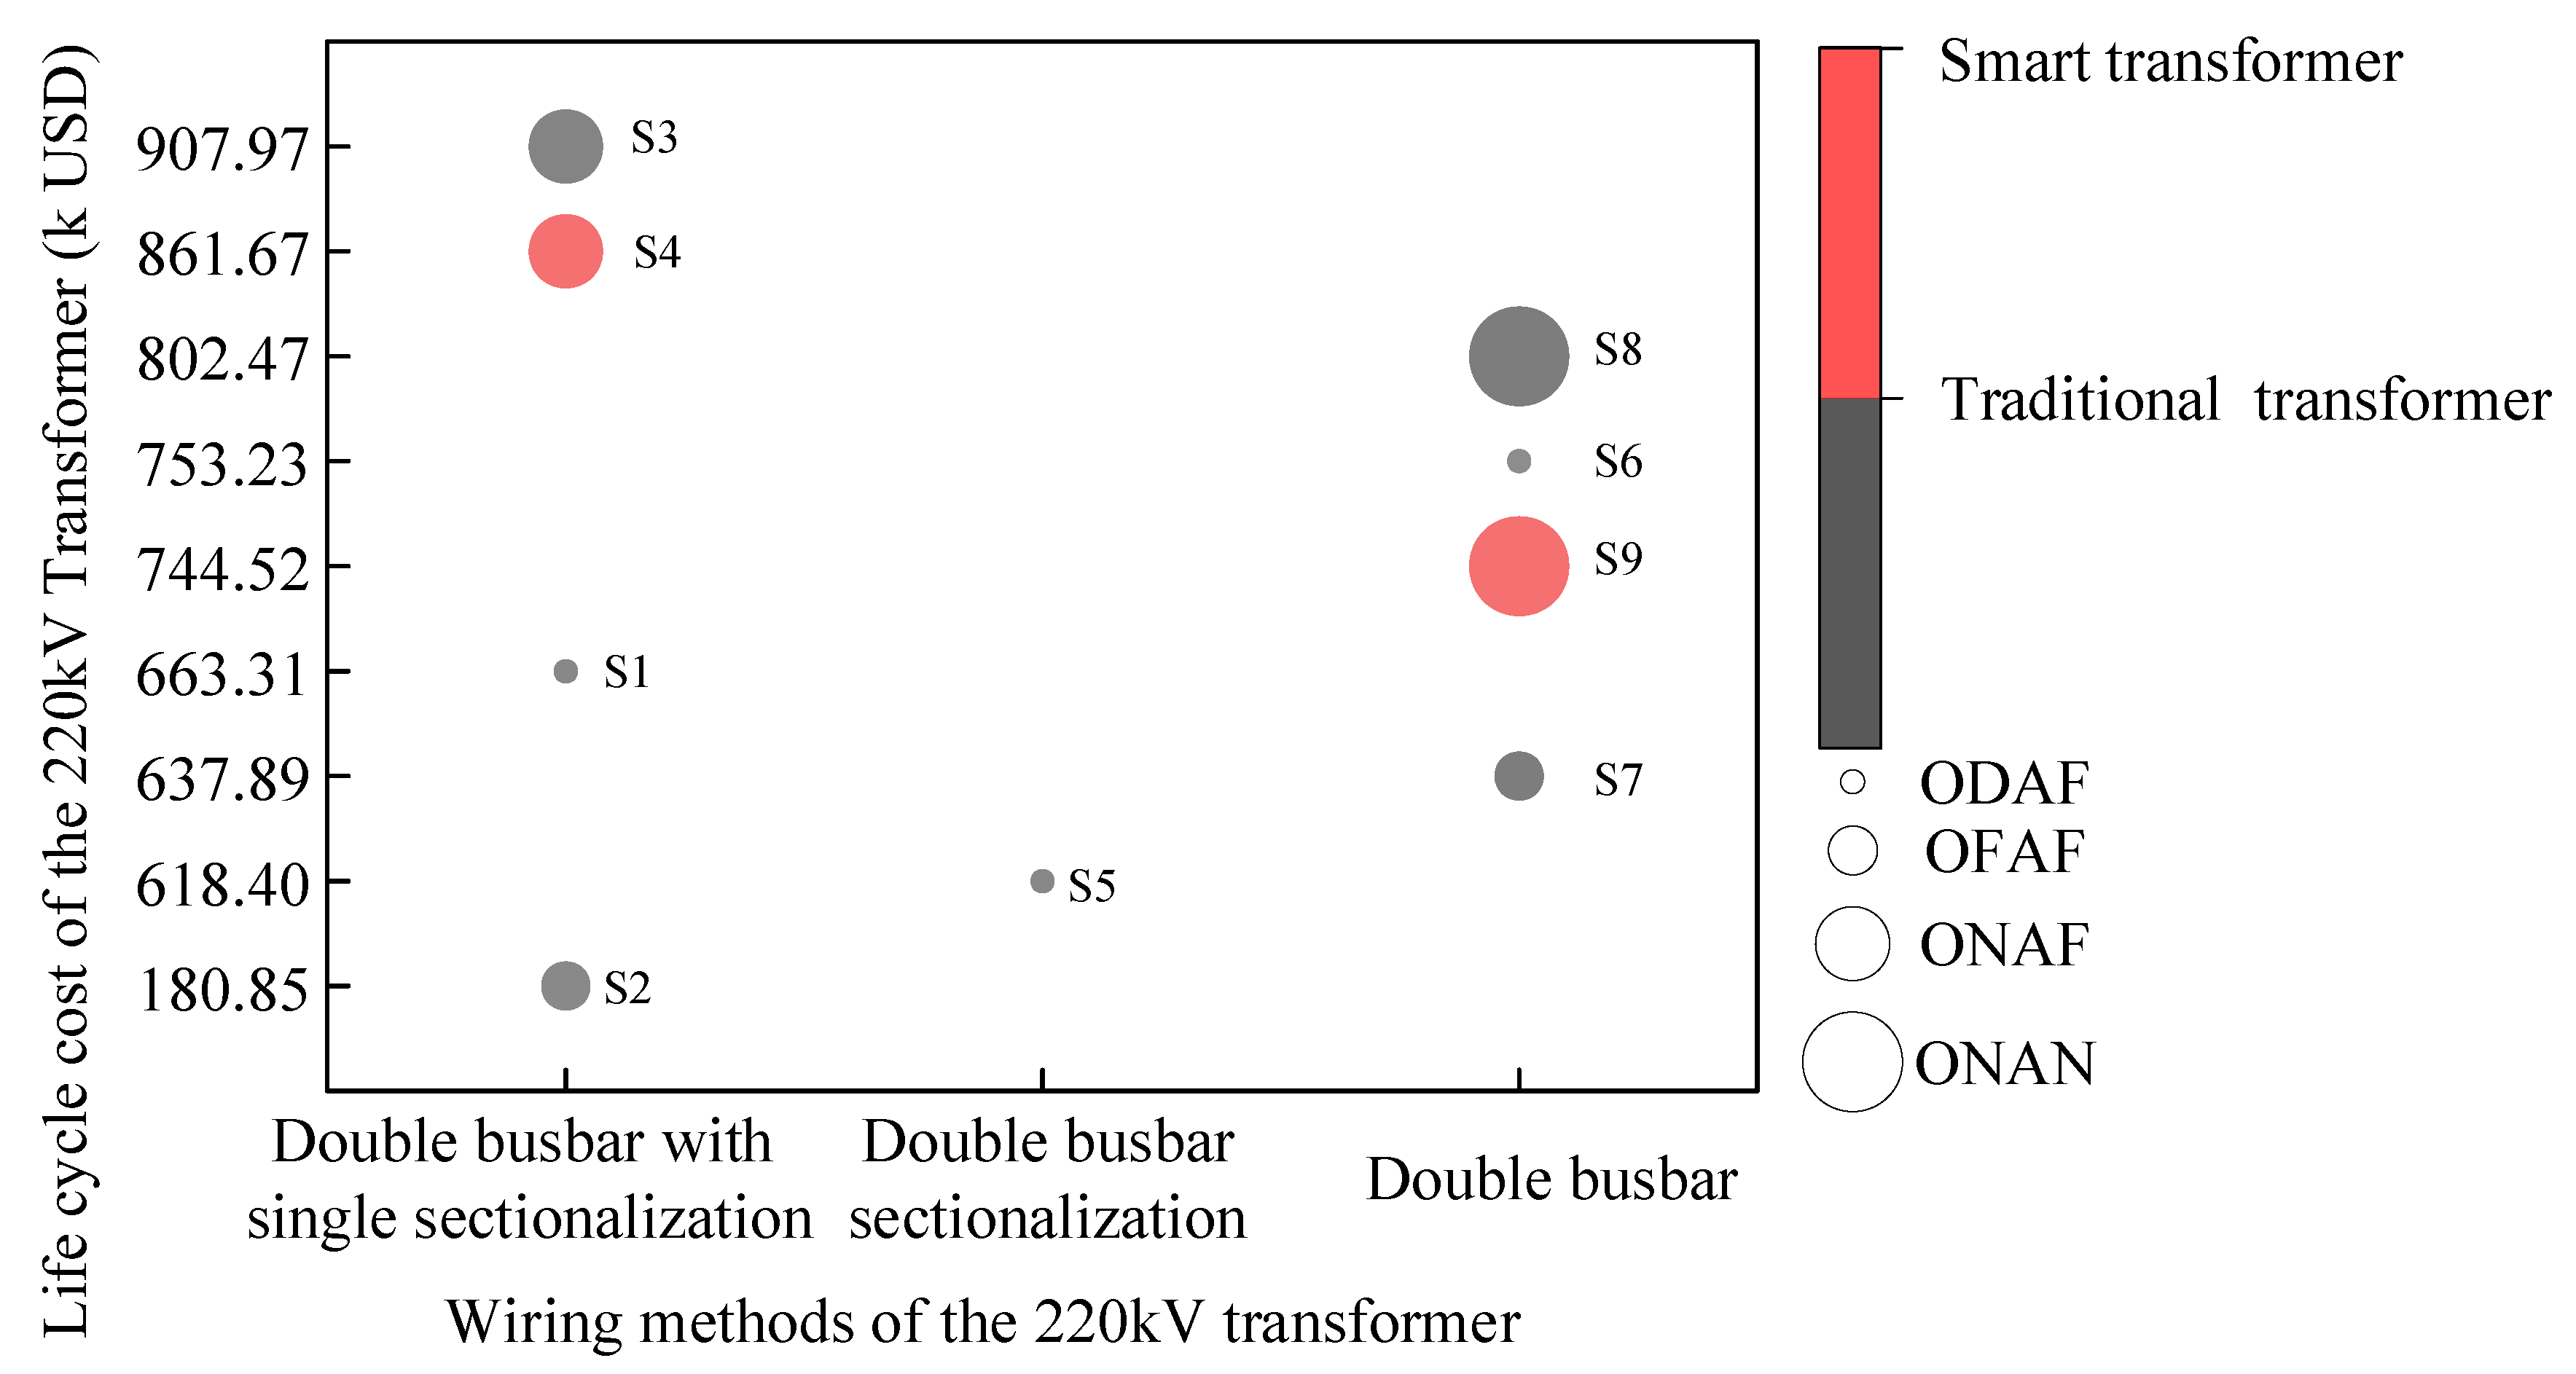
3.3.2. Wiring Methods

The wiring method of transformers has a notable impact on their costs. It influences various aspects, such as the material usage, manufacturing complexity, and operational efficiency, directly contributing to the overall expenditure associated with transformers. Different wiring configurations may require different amounts of copper or aluminum conductors, insulation materials, and terminal connections, all of which have varying costs. Furthermore, the complexity of the wiring setup can affect the labor costs and time required for installation and maintenance. Additionally, the choice of wiring configuration can also impact the transformer’s energy efficiency and reliability, potentially influencing long-term operational costs and downtime. Therefore, carefully considering wiring configuration is crucial in transformer design and selection to optimize cost-effectiveness and performance [41].
By controlling variables such as the cooling method and commissioning time in transformers, typical substation samples were selected for comparison. The cost levels can be intuitively observed by comparing the positions of the confidence ellipses of the samples in the graph, as shown in Figure 6, Figure 7 and Figure 8.
Figure 6 illustrates the LCCs of 35 kV traditional transformers with three wiring configurations under natural cooling/oil-immersed self-cooled (ONAN) conditions, with a commissioning time ranging from 16 to 18 years. The figure shows that in the medium-voltage class, there is a significant difference in the cost of transformers with different wiring methods, with single-busbar wiring being the most costly, ranging from 1.67 k USD to 6.67 k USD; the cost of transformers with single-busbar ranges from 4.54 k USD to 10.52 k USD, while the cost of transformers with inter-bridge connections is the lowest, ranging from 0.37 k USD to 0.83 k USD.
When selecting a wiring method, several aspects need to be considered. Single-busbar wiring may be less expensive regarding equipment acquisition and operation and maintenance costs (O&M costs). However, the overall cost is higher due to the lack of reliability, which may result in higher costs for loss of power due to fault outages. Internal bridge wiring may be more economical in the long run due to higher equipment acquisition costs and O&M costs, but it offers high reliability, low cost of loss due to faulty outages, and the ability to adapt to different modes of operation. At medium voltage levels, there are significant differences in the costs of transformers with different wiring methods. Transformers with single-busbar wiring have the highest cost, followed by those with single-busbar sectionalization, while inter-bridge connection has the lowest cost. When selecting a wiring method, multiple factors need to be considered comprehensively. Single-busbar wiring may have lower equipment acquisition operation and maintenance costs. However, its insufficient reliability may lead to higher failure outage loss costs, resulting in higher overall costs. Although inter-bridge connection has higher equipment acquisition operation and maintenance costs, its high reliability, low failure outage loss costs, and adaptability to different operating modes make it more economical in the long run.
Figure 7 shows the LCC of a 220 kV conventional transformer with (ODAF) using three wiring methods. The commissioning time is 16 to 18 years. As shown in the figure, in the 220 kV high voltage class, the double-busbar single-segment wiring method has a significant increase in transformer cost due to the complexity of the structure and the high material requirements, resulting in a cost range of 17.84 k USD to 48.01 k USD. In contrast, the double-busbar wiring method has a relatively low cost due to the simplicity of the structure and the low cost of the materials, resulting in a relatively low cost for the transformer, with a cost range of 2.64 k USD to 14.02 k USD.
Figure 8 shows the LCC of a 330 kV conventional transformer with two wiring methods under ODAF. The commissioning time is 5 to 8 years. From the figure, it can be seen that in the UHV class, the transformer with 3/2 wiring connection has the highest cost, ranging from 1.77 k USD to 12.49 k USD, and the transformer with a double busbar with double sectionalization has a cost ranging from 10.25 k USD to 45.22 k USD.
The 3/2 wiring connection has relatively high initial investment and operation and maintenance costs due to the equipment’s high cost and the connection’s complexity. However, its high reliability and flexibility strongly support grid operation, lowering the LCC. In contrast, although the double busbar with double sectionalization has slightly lower equipment costs and more straightforward connections, which may reduce the initial investments and operation and maintenance costs, it may be slightly inferior in terms of reliability compared to the 3/2 wiring connection, making it more prone to higher operation and maintenance costs.

3.3.3. Transformer Types

In order to investigate the impact of whether or not a transformer is a smart transformer on the cost, transformer models with the same rated capacity (240 MW) at the 220 kV voltage level are selected to compare the mean, as well as the distribution, of their sample data, as shown in Figure 9.
In a box plot, the range of mean ±1 SD indicates that approximately 68.27% of the data points fall within this range, while the mean ±1.96 SD encompasses approximately 95% of the data points. According to the data presented in the figure, the mean costs of smart transformers and traditional transformers are relatively close. However, the cost variation among traditional transformers is more significant.
Compared with the traditional transformer, the smart transformer significantly improves the intelligence, reliability, and real-time performance of the transformer through its advantages at the technical level, such as high integration, the digitalization of information communication, and robust automatic measurement, control, and monitoring functions [42]. However, this transformation also brings about differences in cost structure: initial investment and smart transformers due to high integration reduce the cost of civil construction, but the increase in intelligent equipment leads to a rise in acquisition costs; although fiber-optic transmission reduces the cost of installation, the overall initial investment is still higher than that of the traditional station. However, with the advancement of technology and the popularization of intelligent equipment, costs are expected to decline gradually. In terms of operation and maintenance, smart transformers significantly reduce labor, maintenance, and energy consumption costs due to a high degree of intelligence and integration. In addition, smart transformers significantly reduce the cost of interruption of power supply losses by improving system reliability and adopting “state maintenance” strategies. Although LCCs are small and vary in the same direction as initial investment costs, the residual value of smart transformers increases due to technological enhancements, making them more economically efficient in the long run.

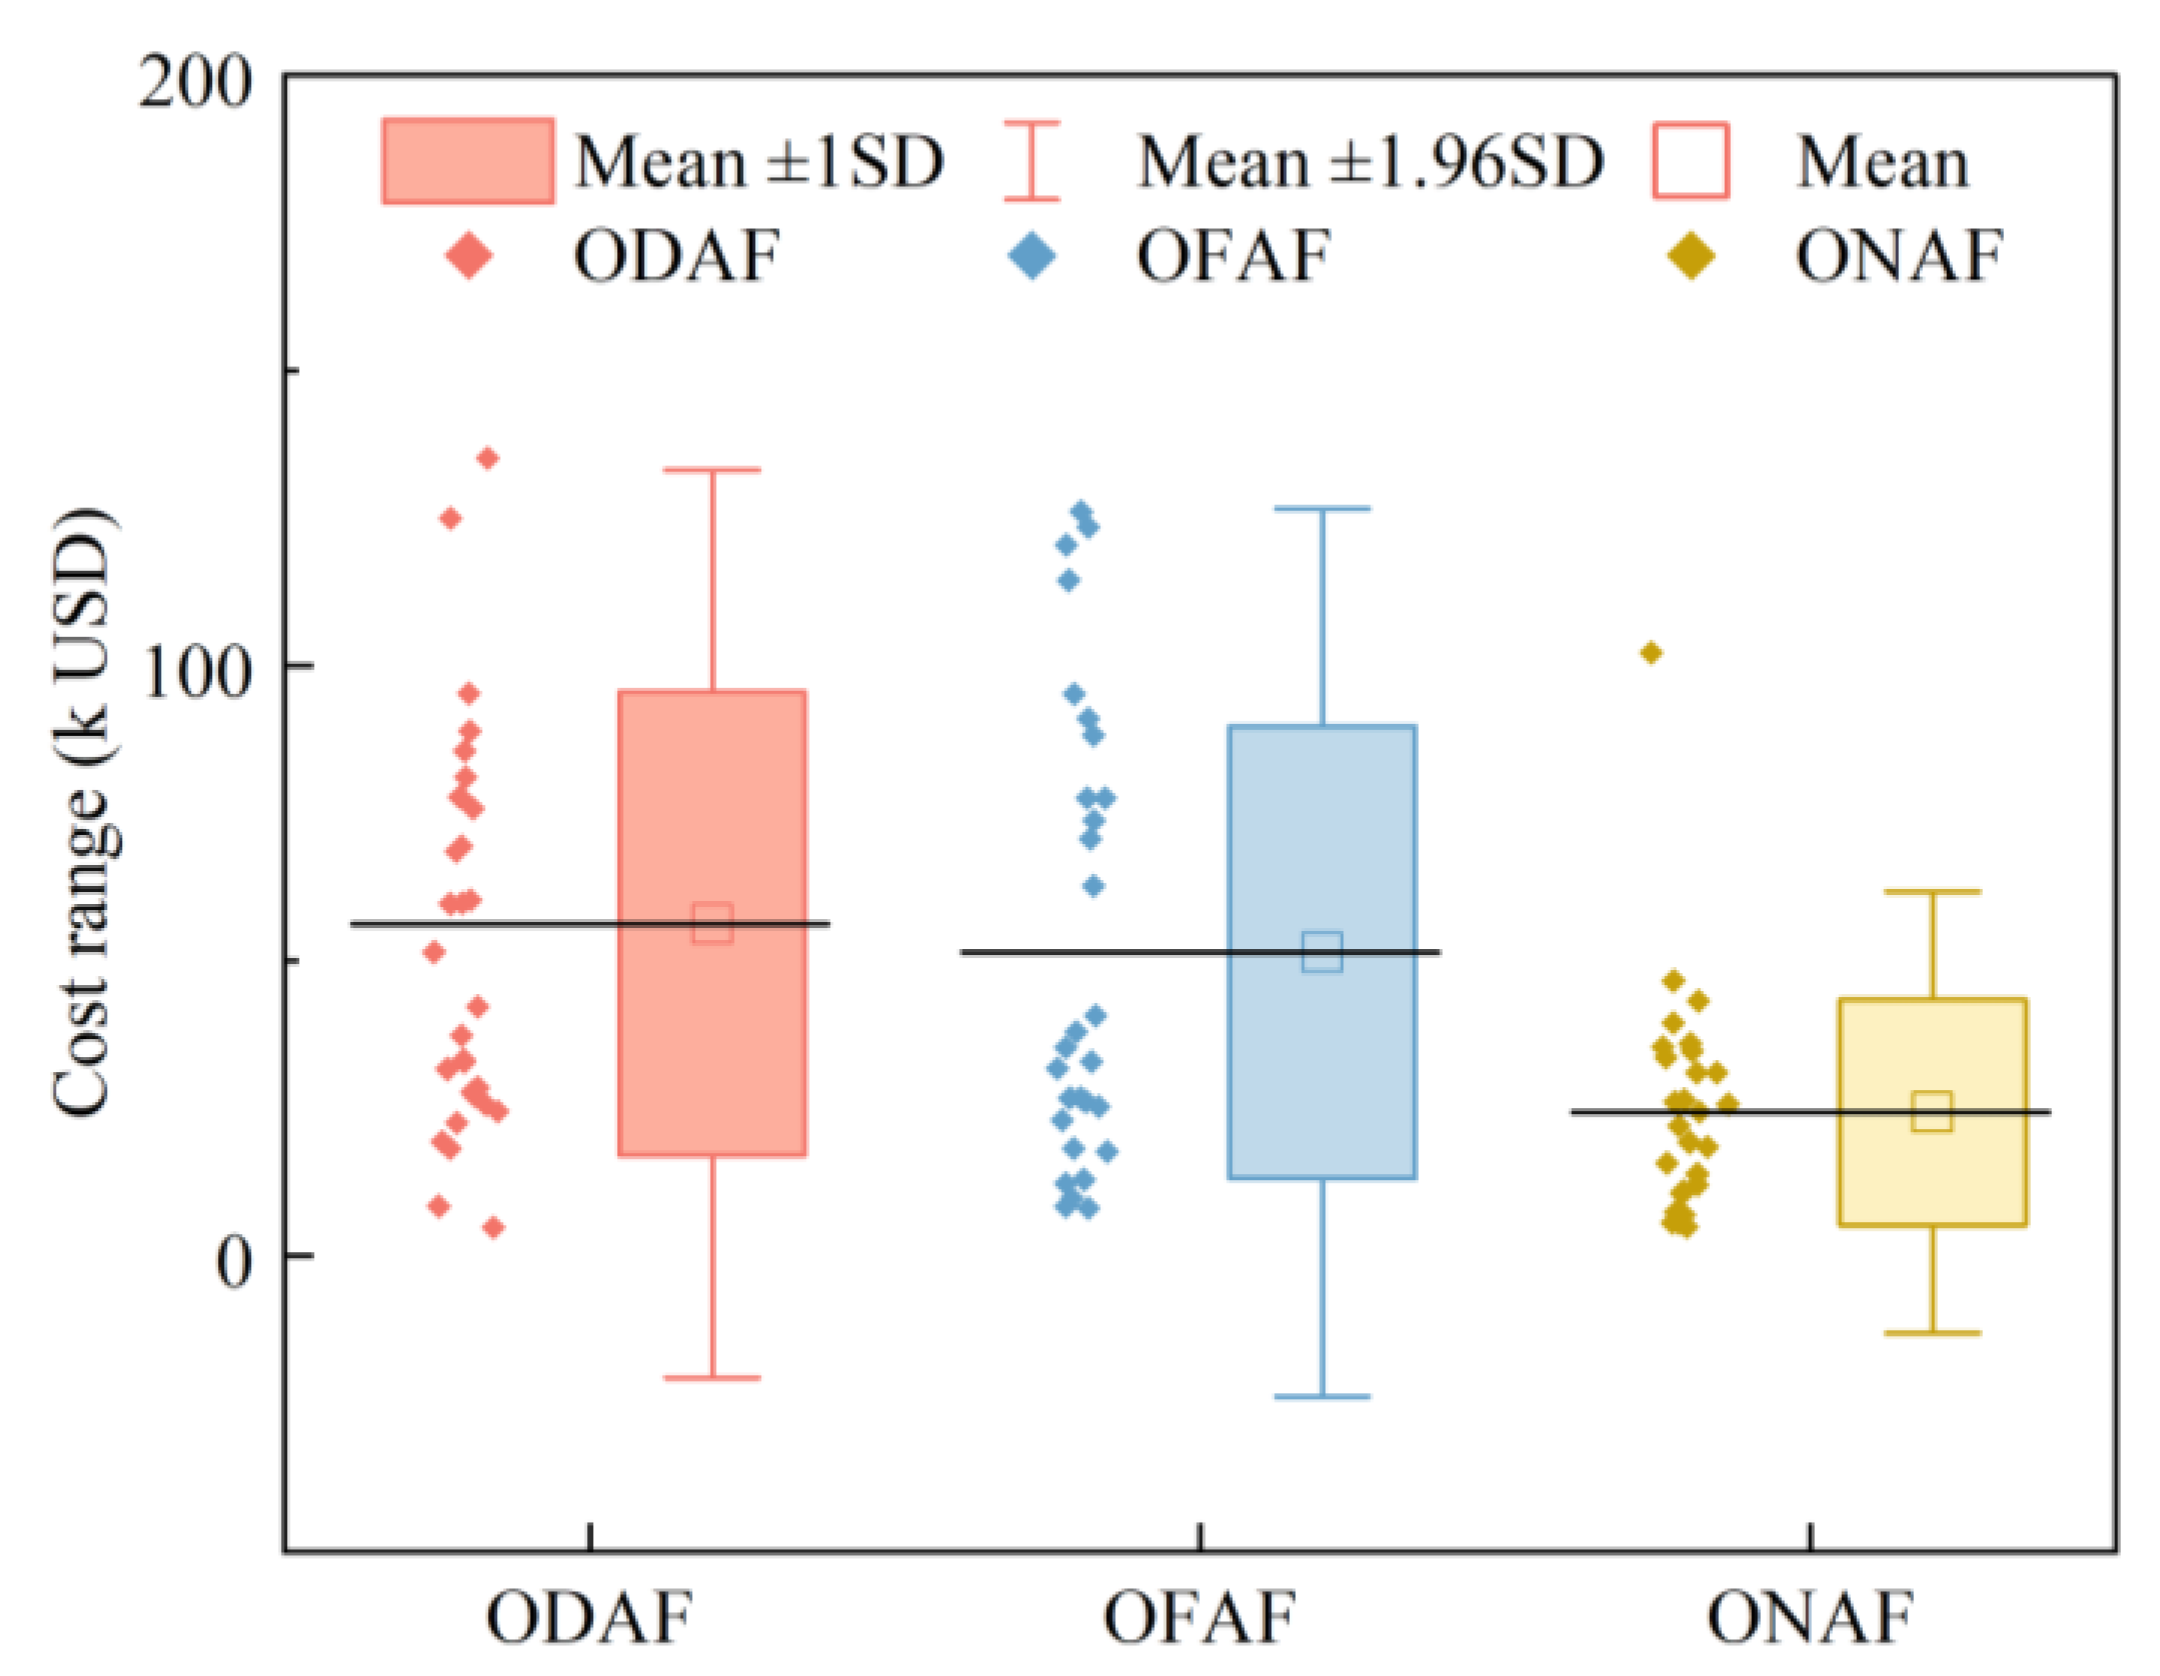
3.3.4. Cooling Methods

The cooling method has a critical effect on the cost-effectiveness of the transformer. Figure 10 visualizes the LCC comparison of a 330 kV, 240 MW transformer with three different cooling methods: ODAF, Forced Oil Circulation Air-Cooled (OFAF) [43], and Oil-Immersed Forced Air-Cooled (ONAF).
By carefully analyzing the mean data in the graph, we can conclude that the transformer with ODAF has the highest LCC, followed closely by OFAF, and ONAF has the lowest cost.
ODAF has the highest cost due to the complexity of its equipment structure, which not only makes the initial investment expensive but also makes the subsequent maintenance cost considerable. In addition, the failure rate of this cooling method is relatively high. Maintenance is difficult and time-consuming once a failure occurs, pushing up its comprehensive cost [44].
In contrast, the OFAF equipment structure is relatively simple. However, the oil pump, fan, and other components still need regular maintenance. However, thanks to these components’ relatively low energy consumption, their operating costs are at a moderate level. Compared with ODAF, OFAF has a lower failure rate, and maintenance work is relatively simple, thus reducing costs to a certain extent.
As for ONAF, it has the simplest equipment structure, which is easy to manufacture and maintain and eliminates the need for complicated cooling devices [45]. Therefore, in terms of initial investment, ONAF has the lowest cost. In addition, due to the low energy consumption of the fan and the long maintenance cycle, its operation and maintenance costs are also relatively low, thus making the comprehensive cost of ONAF the lowest among the three.
In summary, different cooling methods have a great influence on the cost-effectiveness of transformers. When selecting the most suitable cooling method and program, the capacity of the transformer, the environment, and economic costs should be considered.
In this section, we expand on the previous weight analysis and utilize the control variable method to conduct an in-depth examination of four key factors: wiring methods, voltage levels, the intelligent characteristics of transformers, and cooling methods. These factors have a significant impact on costs. By using this approach, we are able to accurately assess their economic influence on the entire system or process.

3.4. Multifactor Coupling Impact

In power systems, the selection of transformers is directly related to the power system’s stability, efficiency, and cost-effectiveness. According to the existing data, transformers with different wiring methods, transformer types, and cooling methods are selected, and the different schemes are compared.
Wiring methods, voltage level, and cooling methods in a power system have a close relationship; they jointly affect the economy, operational efficiency, stability, and security of the power system. In the study of transformer economy, we need to consider the relationship between these three comprehensively [46].
By analyzing the data in Figure 11, Figure 12 and Figure 13, the most economical configuration options at different voltage levels can be visually identified. Specifically, the single-busbar segmented conventional transformer with ONAN cooling exhibits the lowest LCC in a 35 kV substation project, while the single-busbar conventional transformer with ONAF cooling is the most costly. This comparison shows that the combined effect of wiring and cooling methods significantly impacts LCCs in medium-voltage power systems.
Moving to the 220 kV substation project, the OFAF-cooled, two-busbar, single-section conventional transformer exhibits the best economics compared to the ONAF cooling method, which is the most costly. This further indicates that the choice of cooling method dominates the impact on transformer cost in high-voltage power systems.
As for the 330 kV substation project, the 3/2 wired smart transformer with the OFAF cooling method has the lowest overall cost, whereas the dual-busbar dual-sectionalized smart transformer with the ODAF method has a higher cost. This finding shows that the optimal combination of wiring and cooling methods must be prioritized in UHV power systems for effective cost control.
In summary, the economic analysis of transformers at different voltage levels reveals the weights of wiring and cooling methods in their respective systems, providing a significant economic consideration in transformer selection.

4. Discussion

4.1. Conclusions

In this study, we constructed an LCC model for transformers using original data from a Northwestern Chinese province and employed the TOPSIS method to analyze cost-influencing indicators across different voltage levels. The key findings, without altering the original numbering, are as follows:
(1) The LCC model for transformers ranging from 35 kV to 750 kV identifies the voltage level as the most significant factor (weight ~0.32), followed by the wiring method (0.30) and cooling method (0.23), with smart transformer features having the lower weight of 0.07.
(2) The control variable method reveals that higher voltage levels increase transformer costs, while smart features do not significantly impact short-term costs but have long-term economic potential. Wiring and cooling methods significantly affect LCCs.
(3) The analysis of 35 kV, 220 kV, and 330 kV transformers shows that at 35 kV, single-busbar sectionalized conventional transformers with ONAN cooling have the lowest LCC; for 220 kV, OFAF-cooled double-busbar, single-segmented transformers are most economical; and for 330 kV, OFAF-cooled 3/2 wiring smart transformers are recommended for the lowest overall cost.

4.2. Prospects

This paper analyzes the key factors affecting transformer life cycle costs (LCCs) through a comprehensive survey of LCCs. These findings provide a valuable reference for grid companies and users to help them select the most cost-effective transformer based on factors such as the voltage level, wiring method, transformer type, and cooling method. The main prospects include the following:
(1) Provision of a life cycle costing methodology:
This article details the components and influencing factors of transformer life cycle costs, including voltage rating and cost component ratios. This information helps users to understand the costs that will be incurred by a transformer throughout its life cycle and to conduct a cost–benefit analysis accordingly.
(2) Importance of assessing life cycle cost factors:
In this paper, a weighted assessment of life cycle cost factors using the TOPSIS methodology identifies the voltage rating and wiring method as having the most significant impact on the life cycle cost of a transformer. This provides metrics for users to focus on when selecting a transformer.
(3) Analyzing the specific impact of multiple factors on life cycle costs:
Through the control variable approach, this paper delves into the specific impact of the voltage rating, wiring method, transformer type, and cooling method on life cycle costs. These analyses provide users with more detailed information so that they can select the most appropriate transformer for their actual needs.
(4) Consideration of multi-factor coupling effects:
The article also considers the coupled effects of wiring methods, transformer types, and cooling methods on transformer options for different voltage levels. This provides users with a more comprehensive perspective when selecting a transformer, helping them to consider the interactions between various factors and thus make more informed decisions.
(5) It provides a reference for engineering investment and the construction of power grid enterprises.

Author Contributions

Methodology, L.Z.; Software, G.W. and H.C. (Heng Chen); Validation, L.Z., H.C. (Hui Chang), X.Z. (Xiaolu Zhu), X.Z. (Xin Zhao) and Z.C.; Formal analysis, G.W., H.X., X.Z. (Xinyue Zhao) and H.C. (Hui Chang); Investigation, L.Z., X.Z. (Xiaolu Zhu), Z.C. and H.C. (Heng Chen); Resources, H.C. (Hui Chang) and X.Z. (Xin Zhao); Data curation, X.Z. (Xiaolu Zhu), X.Z. (Xin Zhao), G.W., H.X. and X.Z. (Xinyue Zhao); Writing—original draft, L.Z., H.C. (Hui Chang) and Z.C.; Visualization, H.X. and X.Z. (Xinyue Zhao); Supervision, H.C. (Heng Chen); Funding acquisition, L.Z. All authors have read and agreed to the published version of the manuscript.

Funding

This work was supported by the Project of State Grid Ningxia Electric Power Co., Ltd. Material Company (Grant No. SGNXWZ00ZBWT2311979).

Data Availability Statement

The original contributions presented in the study are included in the article, further inquiries can be directed to the corresponding author/s.

Conflicts of Interest

Authors Long Zhan, Hui Chang, Xiaolu Zhu, Xin Zhao, Gang Wei, Ziyu Cai and Haibin Xie were employed by the company State Grid Ningxia Electric Power Co., Ltd. Material Company. The remaining authors declare that the research was conducted in the absence of any commercial or financial relationships that could be construed as a potential conflict of interest. The authors declare that this study received funding from State Grid Ningxia Electric Power Co., Ltd. Material Company. The funder was not involved in the study design, collection, analysis, interpretation of data, the writing of this article or the decision to submit it for publication.

Abbreviations

ACalternating current
LCClife cycle cost
TOPSISTechnique for Order Preference by Similarity to an Ideal Solution
ONANoil-immersed natural air-cooled
ONAFoil-immersed forced air-cooled
OFAFforced oil circulation air-cooled
ODAFforced oil circulation directed air cooling
O&M costsoperation and maintenance costs
UHVultra-high voltage

References

  1. Fan, L.; Chen, H.; Zhao, S.; Wang, Y. Comparative Economic Analysis of Transmission Lines Adopted for Energy-Saving Conductors Considering Life Cycle Cost. Inventions 2024, 9, 75. [Google Scholar] [CrossRef]
  2. Zhou, C.; Che, C.; Wang, P.; Zhang, Q. Diformer: A dynamic self-differential transformer for new energy power autoregressive prediction. Knowl. Based Syst. 2023, 281, 111061. [Google Scholar] [CrossRef]
  3. Marchi, B.; Zanoni, S.; Mazzoldi, L.; Reboldi, R. Energy Efficient EAF Transformer—A Holistic Life Cycle Cost Approach. Procedia CIRP 2016, 48, 319–324. [Google Scholar] [CrossRef]
  4. Liu, Z.; Huang, B.; Li, Y.; Sun, Q.; Pedersen, T.B.; Gao, D.W. Pricing Game and Blockchain for Electricity Data Trading in Low-Carbon Smart Energy Systems. IEEE Trans. Ind. Inform. 2024, 20, 6446–6456. [Google Scholar] [CrossRef]
  5. Soni, R.; Mehta, B. Evaluation of power transformer health analysis by internal fault criticalities to prevent premature failure using statistical data analytics approach. Eng. Fail. Anal. 2022, 136, 106213. [Google Scholar] [CrossRef]
  6. Han, G.; Feng, G.; Tang, C.; Pan, C.; Zhou, W.; Zhu, J. Evaluation of the ventilation mode in an ISO class 6 electronic cleanroom by the AHP-entropy weight method. Energy 2023, 284, 128586. [Google Scholar] [CrossRef]
  7. Zhao, X.; Gui, F.; Chen, H.; Fan, L.; Pan, P. Life Cycle Cost Estimation and Analysis of Transformers Based on Failure Rate. Appl. Sci. 2024, 14, 1210. [Google Scholar] [CrossRef]
  8. Han, H.; Li, X.; Gu, X.; Li, G. Urban rivers health assessment based on the concept of resilience using improved FCM-EWM-MABAC model. Ecol. Indic. 2023, 154, 110833. [Google Scholar] [CrossRef]
  9. Fan, L.; Chen, H.; Zhao, S.; Pan, P.; Xin, C.; Jiang, X. Research on the Impact of Carbon Emission Reduction Technology on the Cost of Transmission and Transformation Project Based on Hierarchical Analysis Method. In Proceedings of the 2023 6th International Conference on Renewable Energy and Power Engineering (REPE), Beijing, China, 15–17 September 2023; pp. 346–351. [Google Scholar]
  10. Cervero, D.; Fotopoulou, M.; Muñoz-Cruzado, J.; Rakopoulos, D.; Stergiopoulos, F.; Nikolopoulos, N.; Voutetakis, S.; Sanz, J.F. Solid State Transformers: A Critical Review of Projects with Relevant Prototypes and Demonstrators. Electronics 2023, 12, 931. [Google Scholar] [CrossRef]
  11. Meyer, C.; De Doncker, R.W. LCC Analysis of Different Resonant Circuits and Solid-State Circuit Breakers for Medium-Voltage Grids. IEEE Trans. Power Deliv. 2006, 21, 1414–1420. [Google Scholar] [CrossRef]
  12. Gustavsen, B.; Portillo, A.; Ronchi, R.; Mjelve, A. Measurements for validation of manufacturer’s white-box transformer models. Procedia Eng. 2017, 202, 240–250. [Google Scholar] [CrossRef]
  13. Safaei, F.; Niasati, M. Calculation of UHV transformer insulation risk by extended Monte Carlo method. Electr. Power Syst. Res. 2023, 218, 109219. [Google Scholar] [CrossRef]
  14. Liu, B.; Yu, X.; Chen, J.; Wang, Q. Air pollution concentration forecasting based on wavelet transform and combined weighting forecasting model. Atmos. Pollut. Res. 2021, 12, 101144. [Google Scholar] [CrossRef]
  15. Wang, Y.; Chen, H.; Zhao, S.; Fan, L.; Xin, C.; Jiang, X.; Yao, F. Benefit Evaluation of Carbon Reduction in Power Transmission and Transformation Projects Based on the Modified TOPSIS-RSR Method. Energies 2024, 17, 2988. [Google Scholar] [CrossRef]
  16. Xin, C.; Zhao, S.; Shi, W.; Huo, H.; Chen, H. Comprehensive Cost and Benefit Evaluation of Carbon Reduction Technologies for Power Transmission and Transformation Projects Based on Hierarchical Analysis and Entropy Power Method. In Proceedings of the 2023 8th International Conference on Power and Renewable Energy (ICPRE), Shanghai, China, 22–25 September 2023; pp. 1541–1545. [Google Scholar]
  17. Wang, Y.; Liu, P.; Yao, Y. BMW-TOPSIS: A generalized TOPSIS model based on three-way decision. Inf. Sci. 2022, 607, 799–818. [Google Scholar] [CrossRef]
  18. Chen, X.; Ou, Y. Carbon emission accounting for power transmission and transformation equipment: An extended life cycle approach. Energy Rep. 2023, 10, 1369–1378. [Google Scholar] [CrossRef]
  19. Liu, S.; Dong, F.; Hao, J.; Qiao, L.; Guo, J.; Wang, S.; Luo, R.; Lv, Y.; Cui, J. Combination of hyperspectral imaging and entropy weight method for the comprehensive assessment of antioxidant enzyme activity in Tan mutton. Spectrochim. Acta Part A Mol. Biomol. Spectrosc. 2023, 291, 122342. [Google Scholar] [CrossRef]
  20. Yu, X.; Qian, L.; Wang, W.; Hu, X.; Dong, J.; Pi, Y.; Fan, K. Comprehensive evaluation of terrestrial evapotranspiration from different models under extreme condition over conterminous United States. Agric. Water Manag. 2023, 289, 108555. [Google Scholar] [CrossRef]
  21. Xu, S.; Xu, D.; Liu, L. Construction of regional informatization ecological environment based on the entropy weight modified AHP hierarchy model. Sustain. Comput. Inform. Syst. 2019, 22, 26–31. [Google Scholar] [CrossRef]
  22. Cao, J.; Xu, F. Entropy-Based Fuzzy TOPSIS Method for Investment Decision Optimization of Large-Scale Projects. Comput. Intell. Neurosci. 2022, 2022, 4381293. [Google Scholar] [CrossRef]
  23. Santiago, L.; Bedregal, B. Multidimensional fuzzy sets: Negations and an algorithm for multi-attribute group decision making. Int. J. Approx. Reason. 2024, 169, 109171. [Google Scholar] [CrossRef]
  24. Ahmad, R.; Gabriel, H.F.; Alam, F.; Zarin, R.; Raziq, A.; Nouman, M.; Young, H.-W.V.; Liou, Y.-A. Remote sensing and GIS based multi-criteria analysis approach with application of AHP and FAHP for structures suitability of rainwater harvesting structures in Lai Nullah, Rawalpindi, Pakistan. Urban Clim. 2024, 53, 101817. [Google Scholar] [CrossRef]
  25. Jin, L.; Kim, D.; Abu-Siada, A. State-of-the-art review on asset management methodologies for oil-immersed power transformers. Electr. Power Syst. Res. 2023, 218, 109194. [Google Scholar] [CrossRef]
  26. Wątróbski, J.; Bączkiewicz, A.; Ziemba, E.; Sałabun, W. Sustainable cities and communities assessment using the DARIA-TOPSIS method. Sustain. Cities Soc. 2022, 83, 103926. [Google Scholar] [CrossRef]
  27. Lei, X.; Xin-gang, Z. The synergistic effect between Renewable Portfolio Standards and carbon emission trading system: A perspective of China. Renew. Energy 2023, 211, 1010–1023. [Google Scholar] [CrossRef]
  28. Guamán, W.; Pesántez, G.; Falcones, S.; Urquizo, J. Optimal dynamic reactive power compensation in power systems: Case study of Ecuador-Perú interconnection. Electr. Power Syst. Res. 2023, 218, 109191. [Google Scholar] [CrossRef]
  29. Awais, M.; Basit, A.; Adnan, R.; Khan, Z.A.; Qasim, U.; Shafique, T.; Javaid, N. Overload Management in Transmission System Using Particle Swarm Optimization. Procedia Comput. Sci. 2015, 52, 858–865. [Google Scholar] [CrossRef]
  30. Shilei, G.; Zhixin, B. The analysis of energy saving transformer with variable energy saving effect evaluation efficiency considering the typical load characteristic. In Proceedings of the 2014 International Conference on Power System Technology, Chengdu, China, 20–22 October 2014; pp. 3078–3083. [Google Scholar]
  31. Zhao, S.; Chen, H.; Fan, L.; Pan, P.; Xin, C.; Jiang, X. Comprehensive Evaluation and Optimal Selection of Carbon Reduction Technologies for Power Transmission and Transformation Projects. In Proceedings of the 2023 6th International Conference on Renewable Energy and Power Engineering (REPE), Beijing, China, 15–17 September 2023; pp. 381–385. [Google Scholar]
  32. Jia, C.; Chen, H.; Zhao, S.; Xin, C.; Jiang, X.; Chen, H. Performance Evaluation of Transformer Substations Based on EWM-GRA. In Proceedings of the 2023 6th International Conference on Renewable Energy and Power Engineering (REPE), Beijing, China, 15–17 September 2023; pp. 122–126. [Google Scholar]
  33. Li, C.; Zhang, H.; Zhou, H.; Sun, D.; Dong, Z.; Li, J. Double-layer optimized configuration of distributed energy storage and transformer capacity in distribution network. Int. J. Electr. Power Energy Syst. 2023, 147, 108834. [Google Scholar] [CrossRef]
  34. Oliyide, R.O.; Cipcigan, L.M. Adaptive thermal model for loading of transformers in low carbon electricity distribution networks. Sci. Afr. 2023, 20, e1683. [Google Scholar] [CrossRef]
  35. Guo, H.; Gao, Y.; Li, J. The greenhouse gas emissions of power transformers based on life cycle analysis. Energy Rep. 2022, 8, 413–419. [Google Scholar] [CrossRef]
  36. Li, Q.; Duan, H.; Xie, M.; Kang, P.; Ma, Y.; Zhong, R.; Gao, T.; Zhong, W.; Wen, B.; Bai, F.; et al. Life cycle assessment and life cycle cost analysis of a 40 MW wind farm with consideration of the infrastructure. Renew. Sustain. Energy Rev. 2021, 138, 110499. [Google Scholar] [CrossRef]
  37. Pei, Z.; Liu, J.; Hao, F.; Zhou, B. FLM-TOPSIS: The fuzzy linguistic multiset TOPSIS method and its application in linguistic decision making. Inf. Fusion 2019, 45, 266–281. [Google Scholar] [CrossRef]
  38. Liang, H.; Lin, D.S. Research on the Transformer Condition Assessment Based on the Entropy Weight Method. Adv. Mater. Res. 2013, 732, 930–935. [Google Scholar] [CrossRef]
  39. Zaharuddin, F.; Thayoob, Y.M.; Verayiah, R.; Ghazali, Y.Y. Life Cycle Cost Estimation of Distribution Transformer Failure from Life Data Exploration. Int. J. Eng. Adv. Technol. 2019, 9, 4025–4029. [Google Scholar] [CrossRef]
  40. Firis, F.A. Determining the optimum medium voltage level by analysis of different voltage levels. World J. Environ. Res. 2020, 10, 37–49. [Google Scholar] [CrossRef]
  41. Noran, M.N.; Shukri, Z. Adaptive breaker failure protection scheme for double busbar substation using IEC 61850 GOOSE message communication. In Proceedings of the 2015 International Symposium on Technology Management and Emerging Technologies (ISTMET), Langkawai Island, Malaysia, 25–27 August 2015. [Google Scholar]
  42. Ma, H.; Saha, T.K.; Ekanayake, C.; Martin, D. Smart Transformer for Smart Grid—Intelligent Framework and Techniques for Power Transformer Asset Management. IEEE Trans. Smart Grid 2015, 6, 1026–1034. [Google Scholar] [CrossRef]
  43. Taghikhani, M.A.; Afshar, M.R. Fans arrangement analysis in oil forced air natural cooling method of power transformer radiator. Proc. Inst. Mech. Eng. Part A: J. Power Energy 2020, 235, 904–913. [Google Scholar] [CrossRef]
  44. Zhan, W.; Goulart, A.E.; Falahi, M.; Rondla, P. Development of a Low-Cost Self-Diagnostic Module for Oil-Immerse Forced-Air Cooling Transformers. IEEE Trans. Power Deliv. 2015, 30, 129–137. [Google Scholar] [CrossRef]
  45. Garg, A.; Velandy, J. Thermal hydraulic network model for prediction of oil and temperature distribution in ester oil transformer under air natural and air forced cooling conditions. In Proceedings of the 2019 IEEE 4th International Conference on Condition Assessment Techniques in Electrical Systems (CATCON), Chennai, India, 21–23 November 2019. [Google Scholar]
  46. Dai, Y.; Zhang, M.; Zhang, F.; Chen, B.; Wang, H.; Li, W.; Dong, X. Practical Scheme of Optical Voltage Transformer in High Voltage Substations. In Proceedings of the 2022 IEEE 5th International Conference on Electronics Technology (ICET), Chengdu, China, 13–16 May 2022. [Google Scholar]
Figure 1. Evaluation process based on LCC theory and TOPSIS.
Energies 17 05912 g001
Figure 2. Multi-sample study of transformer LCCs.
Energies 17 05912 g002
Figure 3. Multi-sample study of the proportions of transformer LCCs.
Energies 17 05912 g003
Figure 4. Quantification of multifactorial influence.
Energies 17 05912 g004
Figure 5. Comparison of LCCs of case transformers at different voltage levels.
Energies 17 05912 g005
Figure 6. Comparison of LCCs of 35 kV case transformers with different wiring methods.
Energies 17 05912 g006
Figure 7. Comparison of LCCs of 220 kV case transformers with various wiring methods.
Energies 17 05912 g007
Figure 8. Comparison of LCCs of 330 kV case transformers with different wiring methods.
Energies 17 05912 g008
Figure 9. Box plot of LCCs between 220 kV smart transformers and traditional transformers.
Energies 17 05912 g009
Figure 10. Box plot of LCCs for 330 kV traditional transformers with different cooling methods.
Energies 17 05912 g010
Figure 11. Scheme selection for the 35 kV transformer.
Energies 17 05912 g011
Figure 12. Scheme selection for the 220 kV transformer.
Energies 17 05912 g012
Figure 13. Scheme selection for the 330 kV transformer.
Energies 17 05912 g013
Table 1. Partial sample information.
CaseSubstationWiring SchemeVoltage LevelSwitchgearIs it a Smart Transformer?LayoutTopographical ConditionsCooling MethodRLA
(Year)
LCC (USD)
Sample 1Qingshan substationSingle-busbar sectionalizationAC-35 kVAISNoIndoorFlatlandONAN716,923.08
Sample 2Yangming substationSingle busbarAC-35 kVAISNoIndoorMountainONAN615,600.77
Sample 3Baimian substationSingle busbarAC-35 kVAISNoIndoorHillsONAN617,443.89
Sample 4Heping substationSingle busbarAC-110 kVAISNoOutdoorFlatlandONAN620,242.09
Sample 5Binhe substationDouble-busbar sectionalizationAC-110 kVAISNoOutdoorFlatlandONAN8.520,148.99
Sample 6Zhonghe SubstationSingle-busbar sectionalizationAC-110 kVGISYesOutdoorMountainONAN619,011.31
Sample 7Pingjibao SubstationDouble busbar with single sectionalizationAC-220 kVAISNoOutdoorFlatlandODAF632,582.86
Sample 8Yuxiang SubstationDouble busbar with single sectionalizationAC-220 kVGISYesOutdoorFlatlandONAN622,209.88
Sample 9Lanshan SubstationDouble busbarAC-220 kVAISNoOutdoorFlatlandODAF634,098.58
Sample 10Yingshuiqiao Substation3/2 wiring connectionAC-330 kVGISNoOutdoorFlatlandOFAF849,018.35
Sample 11Muhe SubstationDouble busbar with double sectionalizationAC-330 kVAISYesOutdoorFlatlandOFAF845,464.63
Sample 12Yanzhou Substation3/2 wiring connectionAC-330 kVAISNoOutdoorMountainODAF640,134.12
Sample 13Yellow River Substation3/2 wiring connectionAC-750 kVAISYesIndoorFlatlandOFAF6226,286.99
Sample 14Helanshan SubstationDouble busbar with double sectionalizationAC-750 kVAISNoOutdoorMountainOFAF661,318.65
Sample 15Helanshan Substation Ⅱ3/2 wiring connectionAC-750 kVGISNoOutdoorMountainOFAF681,319.32
Table 2. Normalized matrix for samples.
ItemWiring SchemeVoltage LevelSwitchgearIs It a Smart Transformer?LayoutTopographical ConditionsCooling MethodRLA
Sample 10.33330001000.4
Sample 200001000
Sample 300001000
Sample 400.25000000
Sample 50.16670.25000001
Sample 60.33330.25110100
Sample 70.66670.500000.50
Sample 80.66670.5110100
Sample 90.50.500000.50
Sample 1000.75100110.8
Sample 1110.75010010.8
Sample 120.83330.7500000.50
Sample 130.83331011010
Sample 140.83331000010
Sample 150.83331000010
Disclaimer/Publisher’s Note: The statements, opinions and data contained in all publications are solely those of the individual author(s) and contributor(s) and not of MDPI and/or the editor(s). MDPI and/or the editor(s) disclaim responsibility for any injury to people or property resulting from any ideas, methods, instructions or products referred to in the content.

