Article

Application of Semiconductor Technology for Piezoelectric Energy Harvester Fabrication

1
Department of Semiconductor and Optoelectronic Devices, Lodz University of Technology, 116 Zeromskiego, 90-924 Lodz, Poland
2
Department of Computer-Aided Design, Lviv Polytechnic National University, 5 Mytropolyta Andreia, 79000 Lviv, Ukraine
*
Author to whom correspondence should be addressed.
Energies 2024, 17(23), 5896; https://doi.org/10.3390/en17235896
Submission received: 3 November 2024 / Revised: 16 November 2024 / Accepted: 22 November 2024 / Published: 24 November 2024
(This article belongs to the Section F: Electrical Engineering)

Abstract

:
In this paper, we propose the application of semiconductor technology processes to fabricate integrated silicon devices that demonstrate the piezoelectric energy harvesting effect. The harvesting structure converts thermal energy into electricity using a piezoelectric transducer, which generates electrical signals owing to the dynamic bending under pressure caused by the explosive boiling of the working fluid within the harvester. The challenges of previous works that included complex manufacturing processing and form limitations were addressed by the use of semiconductor technology based on laser beam processing, which led to simplification of the device’s fabrication. The electrical characterization of the fabricated harvester prototype proved its functionality in energy conversion and potential for integration with a step-up converter or power management integrated circuit (PMIC) generating stable impulses ranging from 0.4 to 1.5 V at a frequency of 7 Hz.

1. Introduction

The phenomenon of piezoelectricity, combining mechanical deformation with the emergence of an electric field, has been known for many years and has formed the basis for various sensor solutions [1,2,3,4,5,6,7] and executive elements used in signal processing [8]. Its principle, involving bidirectional reversible conversion of mechanical energy into electrical energy, allows its utilization in designing energy management devices, such as piezoelectric motors or piezoelectric generators of electrical power. The first application is more mature, and currently, many constructions of piezoelectric linear and rotary motors can be found, and used, among other things, in precision medical [9,10] or optical instruments [11,12]. The second application, often referred to as piezoelectric energy harvesting [2,4,13,14,15,16,17,18,19], is still in the development phase but solutions utilizing the concept of vibrational pendulum are already available in the market [20].
Currently fabricated piezoelectric energy harvesters (PEHs) are typically designed as low-voltage sources intended to power autonomous electronic devices [21,22,23,24], and require a small amount of mechanical energy, usually extracted directly from natural or wasted sources in their environment. They are used as a power source for wearable electronics [5,6,25,26,27,28,29] utilizing human motion [11,30,31,32,33,34,35,36,37], as supplementary sources in any moving or vibrating mechanical structures [38,39,40,41,42], and as power sources for WSNs (Wireless Sensor Networks) harnessing mechanical energy from the surroundings [43,44,45] or as power sources utilizing pressure fluctuations, such as blood pressure in biomedical microsystems [9,10,46] or air pressure in vehicle tire monitoring. In most cases, the piezoelectric transducer takes the form of a vibrating mass or membrane made of flexible material covering a piezoelectric ceramic layer, and the attached mass induces vibrations. Such solutions have been considered in the majority of publications [47,48,49,50,51,52,53,54,55,56,57,58,59].
However, there has been a growing interest in energy harvesting solutions using membranes excited by variable pressure, particularly circular piezoelectric membranes as energy harvesters excited by external pressure pulses. This approach has been the subject of further research presented below.
An interesting idea is to create a small-scale pressure oscillation device utilizing the phenomenon of phase transition of liquid to gas, capable of generating electrical energy from a constant source of heat using a piezoelectric transducer [51,53,54,60]. Phase-transition-driven oscillators offer several advantages over traditional vibration-based systems converting energy via electromagnetic or electrostatic phenomena, which rely on the movement of conductive materials or the separation of charges, particularly in energy efficiency, control, and versatility. They tend to outperform vibration systems in terms of mechanical wear, enhanced stability, tunability, and precision, especially in specialized applications like energy harvesting. Phase-transition-driven oscillators are commonly configured in two types: axial and cantilever. Axial piezoelectric generators are often used in energy-harvesting applications, particularly for autonomous power supplies, while cantilever-type devices are favored in precision applications, such as linear motors and actuators. The efficiency of cantilever-type piezoelectric devices is notably higher when the excitation frequency of the vibrations is close to the resonant frequency of the system, allowing for optimal energy harvesting [61].
The concept proposed in this work envisioned two stages of energy conversion. Initially, thermal energy must be converted into mechanical energy through rapid evaporation and condensation of the working fluid, resulting in localized excess pressure, which is then converted into electrical energy using a piezoelectric element in the second stage. The uniqueness of this concept lies in the fact that the first conversion step is caused by cyclic evaporation and condensation of the working fluid contained within the device.
Such an approach has already been presented in the literature [62,63]. However, the device fabrication was based on a wet alkaline etch of silicon monocrystalline substrates, which has several drawbacks, including the following:
  • Long and complex manufacturing processing, requiring eight stages, mask fabrication, and application of high temperatures for the thermal oxidation of silicon wafers;
  • Form limitations—etching always results in walls inclined at an angle of 54°;
  • Wet etching involving chemical reagents that are harmful to humans and the environment;
  • Chemical reagents that remain on the structure’s walls as contamination.
Our goal was to develop and fabricate a small-scale pressure oscillation device capable of generating electrical energy from a constant heat source using a piezoelectric transducer, utilizing the liquid-to-gas phase transition phenomenon. Laser machining was chosen as an alternative to the wet etching-based processing of the harvester structure. Laser micromachining is particularly suited for the fabrication of piezoelectric energy harvesters due to its precision, ability to handle a variety of materials, non-contact nature, and the flexibility it offers in creating complex geometries. These advantages make laser micromachining an ideal method for producing high-performance, efficient, and customizable piezoelectric devices using design details from numerical simulations. Required depth and configuration of each structure part of the harvester can be controlled by the laser-beam parameters accordingly. Finally, no harmful reagents are required and the need for advanced chemical processing can be avoided.
In this study, we propose the application of semiconductor materials and technology to fabricate fully functional piezoelectric step-up converters that can be integrated with power management integrated circuits (PMICs). The proposed technology allows for the easy scaling and fabrication of relatively small harvesting structures compared to existing solutions [21,22,38,60]. The conversion of thermal energy should proceed in two stages, utilizing the liquid–gas phase transition phenomenon as a method and the piezoelectric effect. The device should feature a simple design and be easy to construct using common equipment and ordinary materials.
The unique design aspect that distinguishes our approach from existing phase change devices is the division of the harvester’s structure into components and their fabrication using laser machining of separate monocrystalline silicon substrates. This innovative approach allows for wide customization of the design while maintaining the low cost of the harvester’s prototype fabrication. However, the fabrication of the device, the concept of which has been proposed in this article, entails a series of technological challenges that need to be considered in the design process. Several factors may influence the occurrence of oscillations and play a significant role in their characteristics. An analysis of potential issues that may arise during the technological stage of the work has been discussed, along with possible ways to address some of them. Parameters identified as impacting the design and manufacturing process include the type of working fluid, surface wetting, channel design, and piezoelectric element type.
This paper focuses on the design and manufacturing aspects of piezoelectric-based energy harvesters. In Section 2, we will present COMSOL-based simulations of the harvester, fabrication of the device using laser machining and experimental setup for prototype characterization. Section 3 will contain results of experiments on energy conversion, analysis of the pulse sequences generated during the harvester’s operation and discussion of prototype performance. Finally, Section 4 will give a conclusion on the survey as well as some insights in this area.

2. Materials and Methods

Many low-power electronic devices can be powered by the readily available kinetic energy around us [64,65,66]. This energy can come from vibrations, airflow, water flow, or human movement. Special devices called transducers capture this energy by converting the movement of an internal element into usable electrical power [67].
A method was proposed for converting thermal energy into electricity. This approach involves two-fold energy transformation. The former step uses wasted heat to evaporate/boil liquid and generate variable pressure in the chamber. The latter transformation occurs in the piezoelectric diaphragm where the strained piezoelectric transducer converts mechanical energy into electrical power through the piezoelectric effect. This two-fold process offers a potentially more alternative way to achieve electrical energy generation (Figure 1).
The described energy harvesting method is attractive due to the ease of collecting and converting mechanical energy. It holds promise for powering ultra-low power (ULP) electronics. PEH offers several advantages, such as durability and reliability, high sensitivity (responds even to small movements), boosted output (generates 3–5 times more power) and voltage compared to other methods, compact design, and small size that allows for easy integration into microelectromechanical systems (MEMSs) [23,24,46,52].
To achieve this compactness, the well-established silicon micromachining technology is employed. This choice opens the possibilities for incorporating harvesters into various microsystems. The fabrication of PEHs includes several stages, from conceptualization to prototyping and testing (Figure 2). The choice of monocrystalline silicon as a building material for the PEH structures was justified by its low cost, excellent mechanical properties, polished surfaces of the wafers as well as low thermal conductivity of silicon (0.2 W/mK), which is particularly important to microfluidic systems.
Step 1—Design the structure of the device. At the beginning of the first step, it is necessary to determine the dimensions of the device, which are highly dependent on the dimensions of the piezoelectric and evaporation chambers.
Step 2—Fabrication of the device. The technology involves laser-cutting, cleaning, and joining. Additionally, this step includes calculating the amount of fluids and selecting the parameters of the piezoelectric element, which will be used for the effective operation of the device.
Step 3—Testing and optimization of the device. The measurement station is involved in this step which includes heat sink 4010 Blue Northridge, heating plate Stuart D160, copper rod, data acquisition system NI USB-6211, and thermal isolation.

2.1. Design of the PEH Structure

In our research, we proposed a prototype of PEHs which is composed of four structural assembly parts: bottom evaporation chamber Si_4, upper condensation chamber Si_2, coupling channel Si_3, and upper cover Si_1 (Figure 3). The size of the complete device is 25.0 mm × 25.0 mm × 1.6 mm.
The maximum diameter chamber of the prototype was 15 mm, and its thickness did not exceed 0.9 mm. The lower part of the device is machined on a silicon plate in the form of a cylindrical chamber (the so-called evaporation chamber) with dimensions 15.0 mm × 0.2 mm. The second part, containing a drilled narrow channel with dimensions 3.0 mm × 0.4 mm is placed on top of the first layer of the construction. The third part is a condensation chamber with dimensions of 13 mm × 0.3 mm. In the upper part of the condensation chamber, a piezoelectric device type 7BB-15-6 with dimensions of 15 mm × 0.22 mm is embedded to a depth of 0.1 mm [15,68]. The upper cover, with dimensions 13.0 mm × 0.39 mm, is intended for mounting the piezoelectric and ensuring the stability of the entire structure.
To precisely understand how the shape of the piezoelectric affects its performance, a mathematical model was created. This model was built using COMSOL Multiphysics 6.0, a software commonly used for scientific simulations. The model specifically focuses on how the piezoelectric material deforms (bends and flexes) under pressure. This pressure is caused by the explosive boiling of the working fluid within the PEH.
The model uses the AC/DC Module, in particular the electrostatics interface, and the Structural Mechanics Module, namely the Solid Mechanics interface using piezoelectric material and piezoelectric effect multiphysics.
Solid Mechanics is represented by the Equation of equilibrium (1):
· S + F v = 0
where S is a second Piola–Kirchhoff stress tensor, and Fv is a body force with components in the current configuration but given with respect to the undeformed volume.
The equations of piezoelectricity combine the momentum of Equation (1) with the charge conservation equation of electrostatics (2):
· D = ρ v
where D is the electric displacement vector and ρv is the electric charge concentration. The electric field E is calculated from the electric potential V (3):
E = V
Both Equation (1) and Equation (2) use the basic relations (4) and (5), which make the resulting system of equations closed:
σ = c E ε e T E
D = e ε + ε 0 ε r S E
where σ is the stress tensor, cE is the elasticity matrix, ε is the strain tensor, e is the matrix for the direct piezoelectric effect, ε0 is the dielectric constant in vacuum, and εrS is the relative dielectric constant. The dependent variables are the structural displacement vector u and the electric potential V. Using their governing equations, it is possible to rewrite in the form of (6) and (7):
ρ 2 u t 2 = · c E : u + V · e
· e : u ε 0 ε r S · V = 0
On all boundaries except the lid, the fixed constraint condition u = 0 is set, where u is the displacement vector. A force per unit area is applied to the lid with the piezoelectric according to Equation (8):
S · n = F A
which in our case, it is pressure (0, 0, p). On the top surface of the piezoelectric, the boundary condition Terminal V = V0 is set, while on the bottom surface of the piezoelectric, the boundary condition Ground V = 0 is set.
By analyzing this deformation, its design can be optimized focusing on the highest efficiency in converting pressure changes into electrical signals.
Under excess pressure, the piezoelectric cover bends (Figure 4a), accompanied by mechanical stress in the material. High stress has been observed in the central part of the cover and around the perimeter where it is attached to the harvester structure.
As a result of the mechanical deformation of the piezoelectric shell, an electric potential arises, which is distributed in the electrode in a gradient manner (Figure 4b). The most significant positive potential is concentrated on the edges of the electrode perimeter, and the smaller negative potential is in the middle of the electrode. The simulation results obtained for the PZT-5J piezo element were compared with the experimental data obtained during the operation of equivalent device 7BB-15-6 and are compared in Table 1.
During the simulation, piezoelectric material from the COMSOL library was selected. Comparison of the simulation results with experimental data showed good agreement—the maximum deviation of the observed pressure is 400 mB, which equals 15.4%. Therefore, the constructed model can be utilized for the optimization of the developed harvester, particularly for the selection of piezoelectric covers.
Experimental results were obtained for a given static pressure in the chamber. Applied pressure under tests was controlled using compressed nitrogen and a pressure sensor. Taking into account the pressure measurements’ accuracy and numerical accuracy, the highest discrepancy did not exceed 3% of pressure reading.
The maximum deviation mentioned in the review [51] refers to the output voltage of the studied piezoelectric diaphragm. The discrepancy between experimental and numerical findings was calculated as the relative error and was referenced each time for measurement. Higher-output piezo voltage obtained from experiments was caused by overlapping reflecting pressure waves in the chamber.
To systematically examine the electrical response of diverse piezoelectric converters to pressure pulses induced by air decompression, a dedicated experimental setup was designed and fabricated. The core component of the setup was a hermetically sealed, cylindrical aluminum chamber measuring 50 mm in height and 35 mm in diameter. Inlet and outlet ports, each 4 mm in diameter, were drilled into the chamber walls to facilitate the controlled introduction and release of compressed gas. Two solenoid valves, P2LBX312, were employed to precisely control gas flow, with opening and closing times of 18 ms and 45 ms, respectively. Control and measurement were based on a USB 4714 data acquisition system.
A high-precision 40PC100G pressure sensor from Honeywell Inc. monitored pressure changes within the chamber, operating within a range of 0 to 7 bar with an ±0.2% full-scale range accuracy. The piezoelectric element was mounted inside the chamber using a cylindrical clamping support fabricated from glass-reinforced epoxy laminate (FR-4). As air decompression occurred within the chamber, the resulting pressure variations exerted force on the piezoelectric element, inducing deformation and subsequent electrical signal generation. Both piezoelectric voltage and pressure changes were meticulously captured using a Dynamic Signal Analyzer (DSA) PCI-4462.
The possible range of pressures caused by water evaporation in the harvester was estimated. The Redlich–Kwong equation for real gases [69,70] was used to calculate the relationship between pressure and the amount of water in the structure. This equation takes into account the specific dimensions of the device and the characteristics of the working substance. Water was selected as the working substance due to its desirable properties.
Calculations have shown that the maximum pressure in the chamber equals 320 mB and is observed at 120°C when the evaporation chamber is filled with water (Figure 5a). Calculations of the pressure–temperature relationship were also carried out (Figure 5b), which allowed for the prediction of the optimal pressure ranges in the structure based on temperature fluctuations. Since the dependencies of pressure on the amount of liquid (water) and pressure on temperature (for a fixed amount of liquid) are linear, their regression equations can be given, respectively, as (9) and (10):
P = 907865428571.43 · v + 55.915
P = 83.316 · T + 4.089
where P is the pressure [Pa], v is the volume of water [m3], and T is the temperature [K].
Soupremanien et al. [62] suggest that channel diameter can influence the internal pressure and oscillation frequency, which are crucial factors in harvester performance. By understanding these manufacturing technologies and their influence on factors like channel diameter, researchers and developers can create high-performance PEHs for a variety of applications, promoting the use of clean and sustainable energy sources.
Following the chosen technological approach, three test harvesters with some structure variations were created to address the specific challenges of silicon surface preparation, including wettability, heat transfer, and condensation. While this article delves into the creation process of a specific piezoelectric energy harvester, the broader technology offers a variety of designs with potential for further exploration.

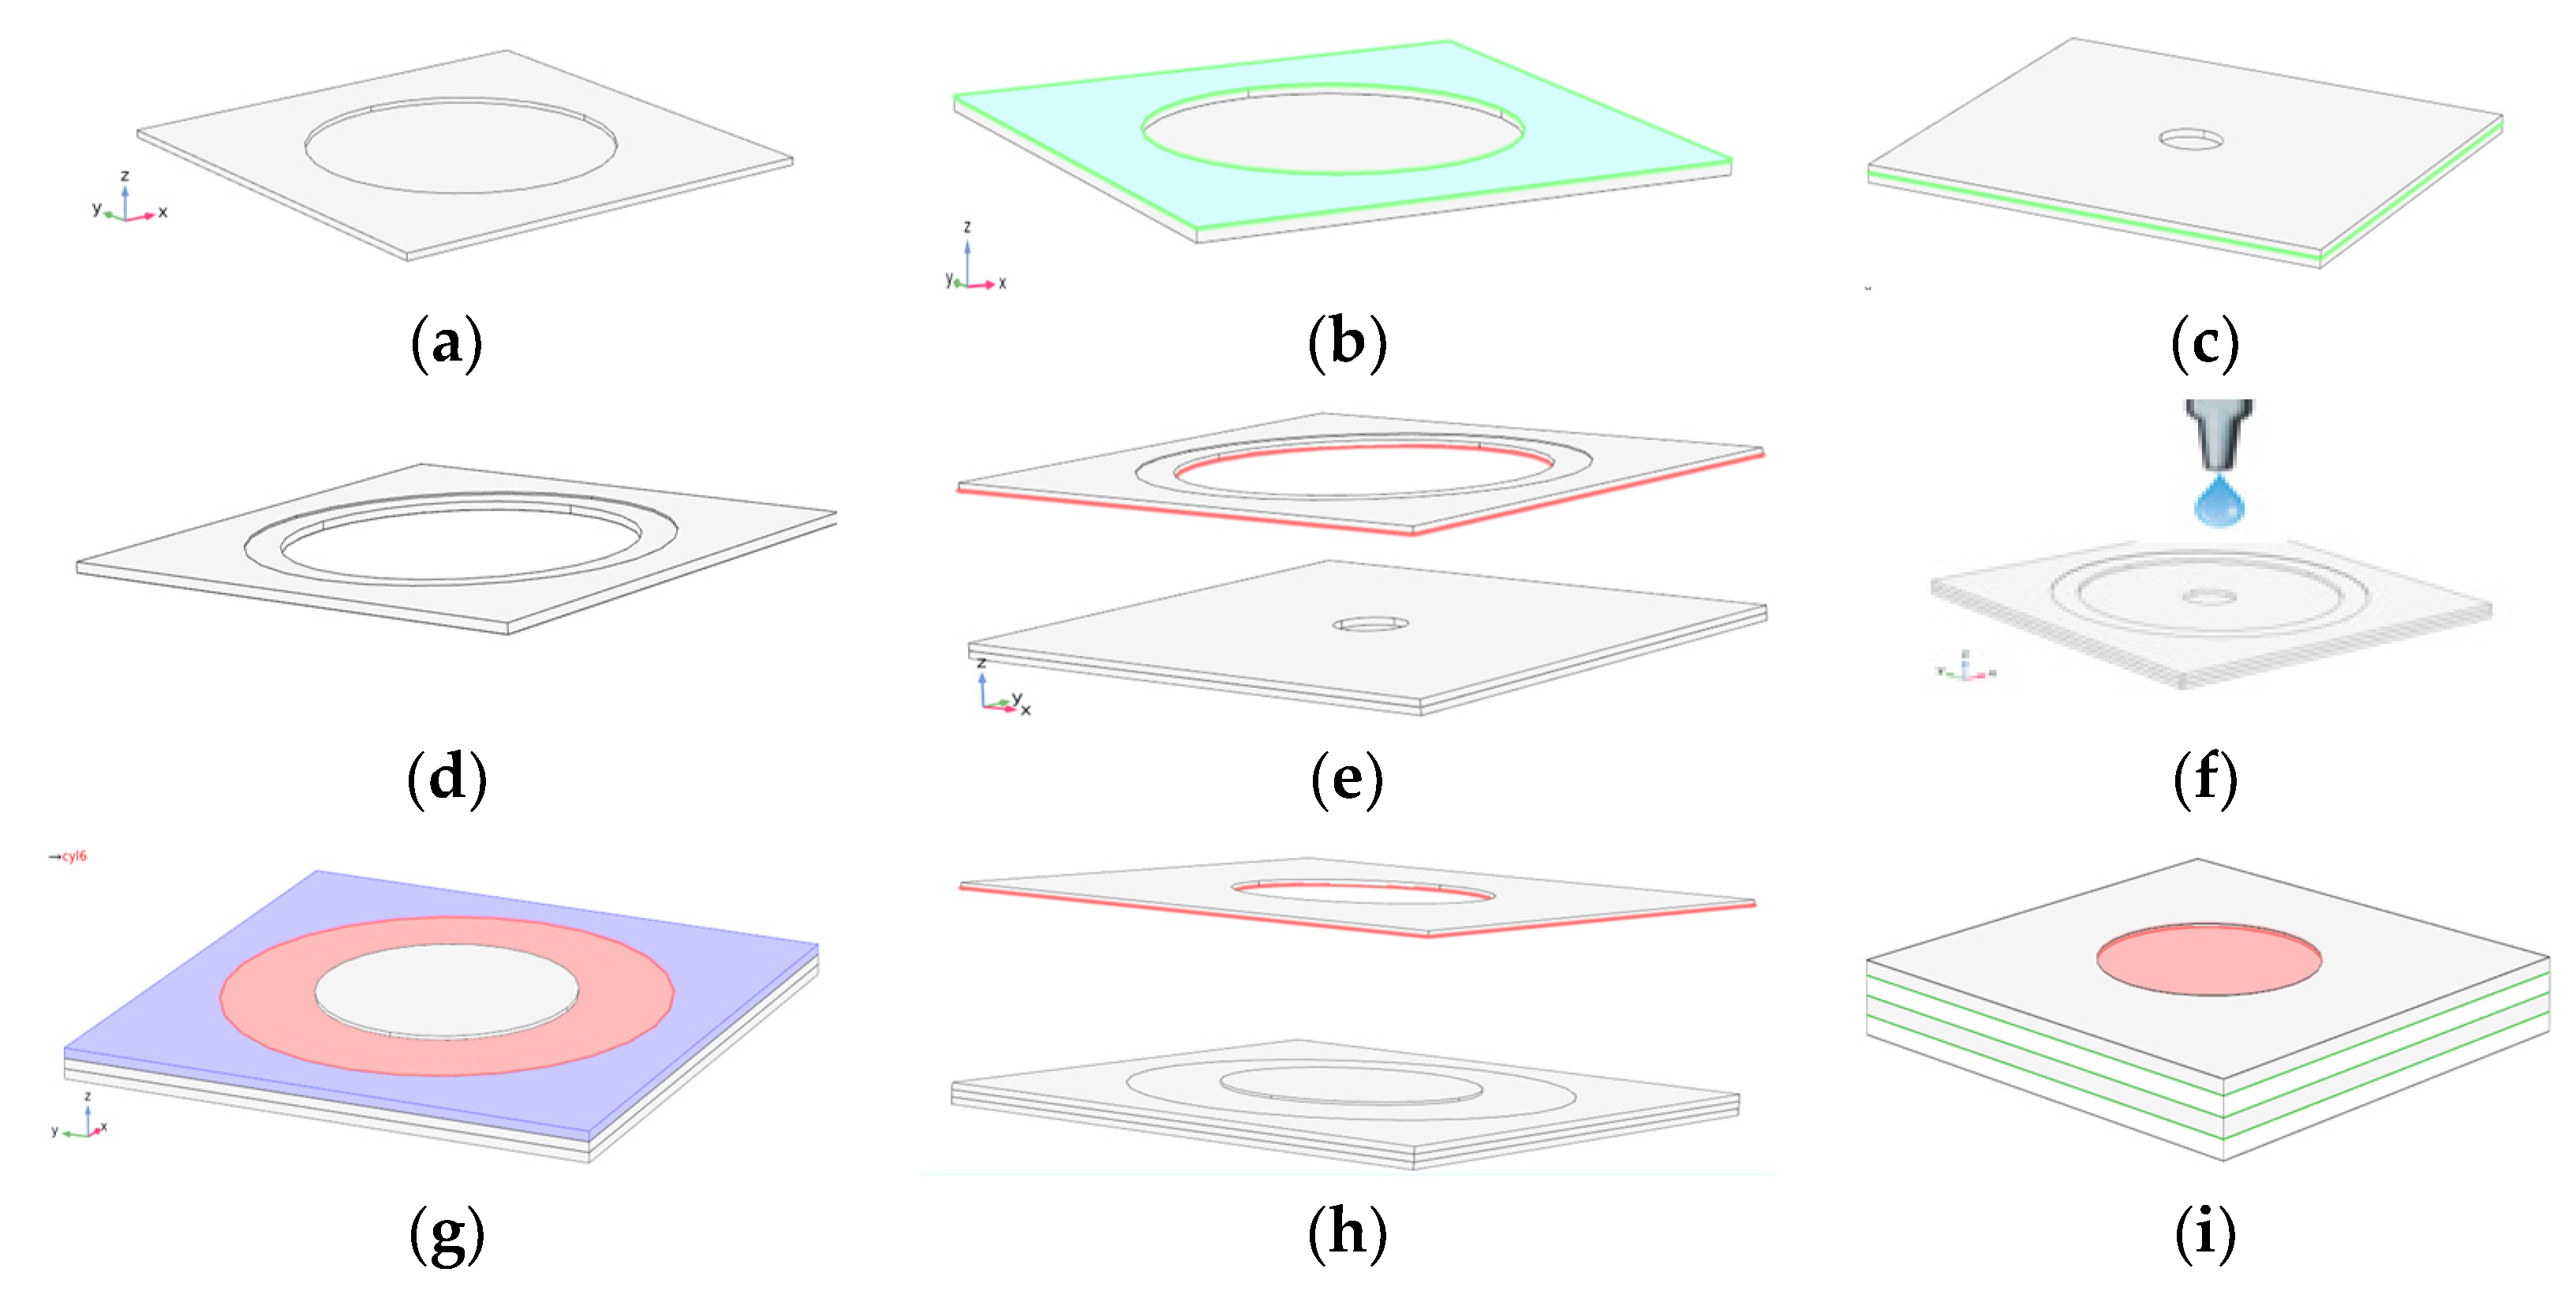
2.2. Fabrication of the Device

To implement the second step, it was necessary to choose the technology for cutting the geometric structure in silicon substrates. In contrast to the previously used technologies [63], namely, testing three etching techniques—reactive ion etching, deep reactive ion etching, and wet etching in a KOH solution—our approach was based on laser-beam machining of the construction, which has the advantage of a small depth of the thermal influence zone, no mechanical contact, fast processing and ease of transferred shape adjustment. For automatic cutting of the material, a CAD file was prepared and used for the laser beam driving over the machined surface.
Using the infra-red laser-beam machining laser located in the Advanced Microelectronics Laboratory at the Lodz University of Technology, several sets of individual structural elements for the harvester were fabricated (Figure 6). The laser station was equipped with a fiber laser beam source from SPI Lasers with a wavelength of λ = 1062 nm. The nominal average output power of the pulse was 20 W, and the maximum pulse power achievable exceeded 10 kW. In the applied system, the pulse repetition frequency varied between 1 and 1000 kHz, the pulse duration ranged from 3 nm to 500 nm, and the optical system allowed for obtaining a radiation beam with a diameter of about 20 µm.
Among the prepared elements forming the structure of the PEH, some needed to be cut out of a silicon substrate, and others required surface recessing. This required adjusting the laser control parameters. Since the laser machining station is routinely used for cutting silicon, it was assumed that the parameters used so far for silicon processing would also prove effective this time. The following parameters were applied: power—100%; repetition number—40; frequency—20 kHz; and laser beam wobbling was switched on. However, recessing of silicon surface to create the evaporation chamber of the harvester required verification of the most favorable parameters of laser processing.
Preliminary trial processes ruled out the use of the wobbler, which is beneficial during the cutting of the substrates due to widening of the kerf, but limits control over the recessing process and leads to severe surface deterioration. Next, efforts were aimed at the selection of proper laser power and the number of repetitions during chamfering. For this purpose, a set of silicon samples was laser processed by scanning the 5 mm wide round area with the laser beam. In the first experiment, the laser power was set to 12, 14, 16, 18, and 20 W, while in the second approach, the number of repetitions equaled 10, 20, 30, 40, and 50. Depths of recessed areas after the laser beam operation, with regard to defined areas of silicon substrate, were determined using the digital thickness measurement tool Mehr ExtraMess 2001. The results of this experiment are presented in Table 2. In the analyzed numerical model, the evaporation chamber was 200 µm deep, so the laser processing parameters chosen for further fabrication of such a structure in silicon substrate were 20 W laser power and 30 repetitions of laser scanning over the recessed area.
All laser-processed components of the PEH structure were bonded using a photoresist. Since every bonding technique requires substrate cleaning, such a procedure was implemented, based on two-stage etching using chemical treatments that selectively remove organic and inorganic contaminants on the substrate’s surface. Additionally, to achieve uniform liquid distribution inside the evaporation chamber, its surface should be close to hydrophilic.
SC-1 Cleaning: This step removes organic residues from the silicon substrate surfaces. The substrates are submerged in a mixture of ammonium hydroxide (NH4OH), hydrogen peroxide (H2O2), and deionized (DI) water (1:1:5 ratio) for 10 min at 80 °C. Following this, substrates are thoroughly rinsed with DI water for 5 min and then dried. Finally, the substrates are spin-coated for 60 s at 3000 rpm.
SC-2 Cleaning: This step removes ionic contaminants, particularly metallic impurities, from the substrate’s surfaces. Silicon parts are submerged in a mixture of hydrochloric acid (HCl), hydrogen peroxide (H2O2), and DI water (1:1:6 ratio) for 10 min at 80 °C. Similar to SC-1, the substrates undergo thorough rinsing and drying afterward.
Research indicated that a bonding technique with an intermediate layer is best suited for connecting the non-standard geometry silicon parts into a single harvester structure. This method offers several advantages: bonding at lower temperatures (below 200 °C), and tolerance to surface roughness, particles, and variations in substrate material and flatness.
SU-8 photoresist was chosen as the intermediate layer material due to its widespread use in silicon wafer bonding applications. It offers excellent bonding performance, flexibility in layer thickness and allows for the application of layers up to several hundred micrometers thick.
Figure 7 shows the process flow of the PEH fabrication. The starting point includes silicon substrate preparation measuring 25 mm × 25 mm × 0.4 mm, being the base for further harvester structure element fabrication. First, the laser produces a circular pocket with a radius of 10 mm and a depth of 0.20 mm to create the evaporation chamber of the harvester (Figure 7a). SU-8 photoresist is applied as a thin layer on the top surface of the silicon substrate (Figure 7b) and a separate element with a 3 mm wide diameter laser-cut channel that is bonded. The channel defines the path the liquid will take within the device (Figure 7c). Another silicon substrate is laser-machined to create two features: a large 13 mm diameter opening forming the condensation area and a smaller recess measuring 15 mm × 0.22 mm designed to hold a piezoelectric element (Figure 7d). In the next step, the upper cover (Figure 7e) of the condensation chamber (Figure 7d) is bonded to the element with the channel (Figure 7c). Before the final bonding of the device parts, the evaporation chamber is filled with liquid (Figure 7f).
A piezo transducer (PZT 7BB-15-6) is carefully placed and secured within the designated recess (Figure 7g). Finally, another layer of SU-8 photoresist is applied to the top cover to attach a 25 × 25 × 0.4 mm silicon wafer with a 10 mm diameter through hole. This cover is specially designed for reliable fixation of the piezo element (Figure 7c).

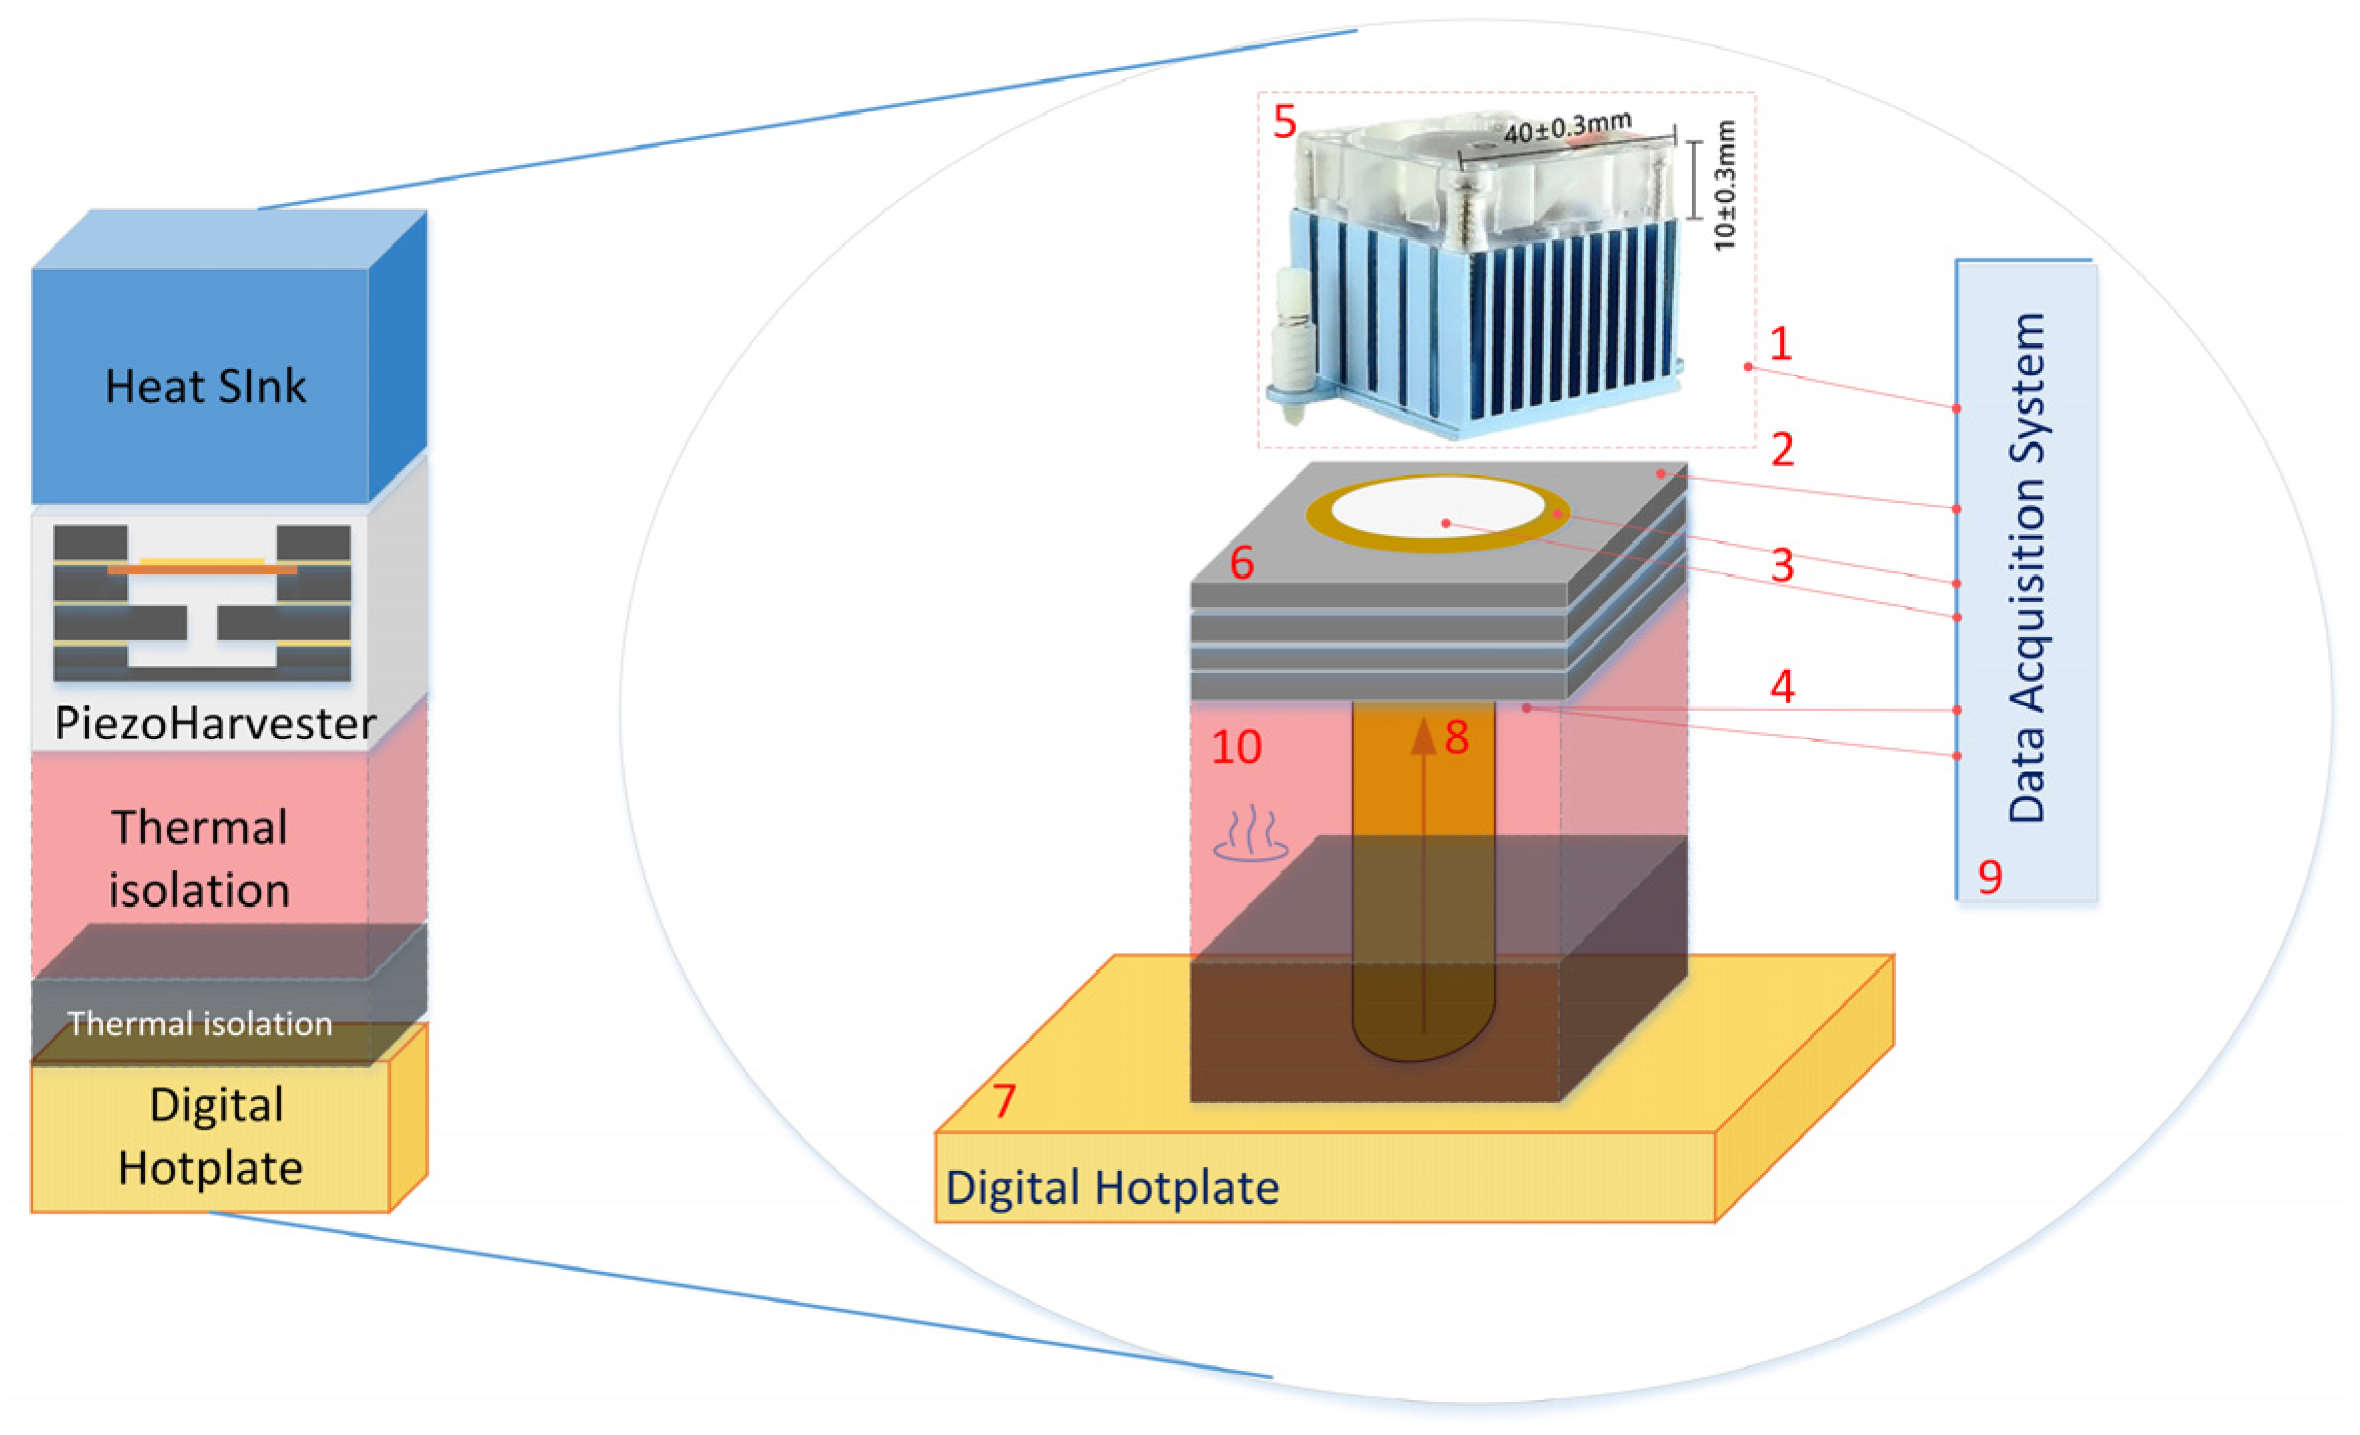
2.3. Experimental Setup

To carry out the tests, a prototype of the PEH was assembled and integrated with the thermal management system (Figure 8). The digital hotplate Stuart D160 operates as a heat source with a controlled temperature. Thermal energy was transferred from the hotplate through the base to the bottom chamber. The cold side of the PEH was thermally coupled with the heatsink and the fan. Therefore, the test bench forced the long-lasting and steady-state heat flux that passes to the PEH. Temperature fluctuations on the plate and uncontrolled air convection may cause thermal instability, which ranges from ±0.5 °C at 37 °C to ±1.5 °C at 150 °C. To facilitate appropriate heating of the PEH, the cooper cylinder with a height of 5 cm and a diameter of 1.5 cm was placed in the insulating base made of a polylactic acid (PLA) 3D-printed structure with 50% filament filling and a polytetrafluoroethylene (PTFE) basement. The energy harvesting device, partially filled with water, was mounted on the cylinder.
Maintaining a specific temperature range is crucial for the efficient operation of the PEH. Excessive heat can negatively impact the device’s performance or even cause damage. Data Acquisition System NI USB-6211 has been used to record temperatures of the hot and cold side, ambient temperature, and instantaneous output voltage. Using this test bench, initial experiments were conducted to determine appropriate settings of the thermal management system and operation conditions of the PEH such as measuring the temperature from the cold side (Figure 8, 2) of the device, as well as from the hot side (Figure 8, 4). In addition, ambient temperature was monitored (Figure 8, 1).
Subsequently, the influence of the hot side temperature (TH) and the filling degree α of the chamber on the output voltage signal was studied. Three filling degree values were determined to induce voltage oscillations under the influence of temperatures ranging from 120 °C to 135 °C and equaled 10%, 20%, and 30% of the chamber volume. For each filling degree coefficient, three independent experiments were conducted under the same conditions. Data analysis and graphing software OriginPro from OriginLab Corporation (Northampton, MA, USA) was used to process the results of experimental studies.
The first series of experiments were performed for α = 10%. Three hydrophilic silicon structures with a diameter of 3 mm, filled with the same amount of water and coated with ceramics based on 7BB-15-6 PZT, were subjected to the same temperature range. The voltage values generated in each experiment were similar, oscillating around 0.4 V ± 25%. In the second series of experiments conducted under the same conditions, the only difference being the value of α = 20%, the voltage amplitudes were generally equal to 1.5 V ± 30%. The third stage of this study, aiming to analyze structures filled with α = 30%, resulted in signal amplitudes of 0.4 V ± 25%.

3. Experimental Results and Discussion

The most interesting cases recorded in the continuous harvester operation mode are illustrated in Figure 9. In each experiment, the harvesters were positioned on a hotplate maintained at the temperature of 140 °C.
From 0 to 2 s, the harvester is heated to the specified temperature, which is the first phase of the process. The thermodynamically unstable state causes a gradual increase in the output voltage forced by the increasing pressure of water vapor in the chamber. In the conditions of increased pressure, a mostly random process is induced, which causes a volatile strain in the piezoelectric structure and thus a variable output voltage, which is visible in the second phase of the process (2–4 s).
Together with the changes of a pulsating nature, the pressure in the chamber decreases, causing the pulsating changes to disappear at the same time. The recorded processes lasted from a few to a dozen or so seconds and the energy transformations taking place had the greatest intensity. As a result, the effective value of the output voltage and the power generated at the output reached maximum values.
During these voltage pulses, the PEH voltage momentarily changes sign, which indicates a short-term drop of pressure in the chamber. A sudden change in value and sign of the voltage can be explained by a change in the direction of the vector of the force acting on the piezo generator. It can be assumed that the pressure increase in the chamber created a transitional state of thermodynamics, which started the condensation of liquids, and some parts of that liquid returned to the lower chamber. In the time interval from 4 to 9 s, the process has a quasi-circulatory character, and the recorded impulses of the voltage have the largest amplitude of changes ranging over 2.5 Vpp. As a result of the falling drops inside the chamber, the intensity of the process is lower, which can be observed as the output voltage decreases after 8 s. To better understand the nature of these processes, a stationary frequency analysis of the voltage waveforms covering the entire excitation process was performed (Figure 10a–c) and a non-stationary STFT analysis was performed to identify the operational modes with specific frequencies (Figure 11a–c).
Depicted digital output signals in (Figure 10a–c) were acquired under steady-state thermal excitation and the same acquisition parameters (sampling rate of 1000 Sa/s, 16-bits of resolution, bipolar analog input ±2.5 V), as seen in Figure 10a–c. Each waveform contains a noticeable quasi-periodic signal component appearing in the falling slope of bias and foreruns the rising slope with strong random peaks.
Figure 10a–c show FFT (Fast Fourier Transform) magnitude spectra corresponding to the time-domain waveforms presented in the previous figures. The FFT analysis was performed for 8192 samples of Vp(n) with a spectral resolution of c.a. 0.12 Hz.
The FFT frequency analysis of the excitation signal (Figure 10) indicates the presence of a DC component and several harmonics with the largest amplitude near 7 Hz. This frequency value is consistent with the analysis of the shape of the time waveforms (Figure 10) in the time interval from 4 to 8 s.
Spectrograms obtained from STFT analysis of Vp(n) waveforms were divided into segments of n = 512 samples with maximum overlapping (Figure 11a–c). The spectrograms show specific behavior of the PEH excitation with low-frequency mode in the vicinity of the harmonic component at c.a. 7 Hz.
The obtained results allow us to distinguish characteristic harvester operating ranges. I. Initialization. In this phase, the pressure in the chamber increases due to the evaporation of water, and the potential increases accordingly. This phase lasts about 2 s. II. Random. In this phase, the first condensation occurs. However, the evaporation–condensation transition is still chaotic, which causes peaks of different amplitudes and durations to appear on the graph. This phase also lasts about 2 s. III. Oscillation. In this phase, evaporation–condensation enters an oscillatory process. This is the most productive phase, which gives the most energy. Its duration varies from 3.5 s (Figure 9a) to 5 s (Figure 9b) IV. Deactivation. In phase III, the pressure slowly decreases, which leads to a significant decrease in the amplitude of voltage fluctuations (Figure 9a,c) or to the cessation of oscillations (Figure 9b). This phase lasts from 3.5 s (Figure 9b) to 2.5 s (Figure 9a).
Frequency analysis helps to find the oscillation operation mode which is the most suitable for piezoelectric energy harvesters. Presented time-dependent voltage waveforms do not show clearly this type of PEH operation. Only spectrograms and spectra reveal weak alternating operations under applied thermal excitation. Analyzing Figure 10, it can be seen that the increase in spectral power is observed around 1 Hz and 7 Hz. If we add Figure 11 to the considerations, it can be seen that at the initial moments of time (up to 2 s), an increase in spectral power is observed around 1 Hz. The increase in spectral power around 7 Hz in Figure 11 is observed for a period of 5–6 s, and in Figure 11, b for a period of 3–8 s. In Figure 11, the Vp values are twice smaller than in the previous figures, and the noise level is much higher; therefore, the increase in spectral power around 7 Hz is the weakest and is observed in the period of 6–8 s. From the combined analysis of Figure 10 and Figure 11, it can be concluded that the oscillation period in the productive phase of the oscillation is about 7 Hz.
The quantitative evaluation of signal parameters was applied for all waveforms depicted in Figure 9, Figure 10 and Figure 11 and are summarized in Table 3. The piezoelectric signals are repeatable in terms of length of time because they last about 10 s. Although each is different in terms of the course, it has the same average power, similar energy accumulated in this fragment of the signal, and tends to oscillate at a frequency of 1 or 7 Hz. Among verified filling degree values α, the structure containing 20% of water in the chamber’s volume was found to induce the highest voltage oscillations under the influence of temperatures, while for both α = 10% and α = 30%, the voltage oscillations generated by the piezo structure are less intensive.
Results collected in Table 3 provide quantitative evaluation of the piezoelectric voltage. Based on time and frequency analysis, one can identify the most effective operation modes and find out why these modes are temporary. Frequency analysis helps to find the oscillation operation mode which is the most suitable for piezoelectric energy harvesters. Presented time-dependent voltage waveforms do not show clearly this type of PEH operation. Only spectrograms and spectra reveal weak alternating operations under applied thermal excitation.

4. Conclusions

Currently, an urgent problem is the development of piezoelectric energy harvesters for powering autonomous electronic microdevices. Such harvesters require a small amount of mechanical energy, which is usually extracted directly from natural or waste sources.
Our goal was to design and manufacture a small pressure oscillation device capable of generating electrical energy from a constant source of heat with the help of a piezoelectric transducer, using the phenomenon of liquid phase transition into gas.
The article develops a model of such a harvester and the technology of its manufacture using a laser. The prototype fabricated in this study effectively demonstrates the potential for laser machining as a main processing step for the fabrication of the test PEH structures and proves the possibility of obtaining the effect of energy generation through a condensation–evaporation cycle. Although excitation from boiling was observed to be unpredictable under similar thermal conditions, the PEH tended to oscillate in a stable harmonic mode at frequencies of 1 or 7 Hz when actuated randomly.
The energy produced by this PEH device is suitable only for ultra-low-power applications, such as powering low-energy Bluetooth modules or microcontrollers in a hibernation state or alternatively storing energy in supercapacitors. To further enhance the viability and efficiency of this energy-harvesting method, future work should focus on refining the chamber design, developing a specialized AC/DC step-up converter, and exploring low-temperature liquids for more consistent operations.

Author Contributions

Conceptualization, A.K. and N.B.; methodology, Ł.R.; software, T.K.; validation, A.K., N.B. and Ł.R.; formal analysis, Ł.B.; investigation, N.B.; resources, A.K.; data curation, Ł.B.; writing—original draft preparation, N.B.; writing—review and editing, A.K. and T.K.; visualization, N.B., T.K., Ł.R. and A.K.; supervision, A.K.; project administration, A.K.; All authors have read and agreed to the published version of the manuscript.

Funding

This research was supported by the Lodz University of Technology.

Data Availability Statement

Data are contained within the article.

Acknowledgments

The authors would like to thank Zbigniew Lisik from the Department of Semiconductor Devices and Optoelectronics at the Lodz University of Technology for presenting a valuable concept (idea) and providing support during the research.

Conflicts of Interest

The authors declare no conflicts of interest.

References

  1. Zhou, H.; Zhang, Y.; Qiu, Y.; Wu, H.; Qin, W.; Liao, Y.; Yu, Q.; Cheng, H. Stretchable piezoelectric energy harvesters and self-powered sensors for wearable and implantable devices. Biosens. Bioelectron. 2020, 168, 112569. [Google Scholar] [CrossRef]
  2. Brusa, E.; Carrera ADelprete, C. A Review of Piezoelectric Energy Harvesting: Materials, Design, and Readout Circuits. Actuators 2023, 12, 457. [Google Scholar] [CrossRef]
  3. Maamer, B.; Boughamoura, A.; Fath El-Bab, A.M.; Francis, L.A.; Tounsi, F. A review on design improvements and techniques for mechanical energy harvesting using piezoelectric and electromagnetic schemes. Energy Convers. Manag. 2019, 199, 111973. [Google Scholar] [CrossRef]
  4. Covaci, C.; Gontean, A. Piezoelectric energy harvesting solutions: A review. Sensors 2020, 20, 3512. [Google Scholar] [CrossRef] [PubMed]
  5. Promphet, N.; Ummartyotin, S.; Ngeontae, W.; Puthongkham, P.; Rodthongkum, N. Non-invasive wearable chemical sensors in real-life applications. Anal. Chim. Acta 2021, 1179, 338643. [Google Scholar] [CrossRef] [PubMed]
  6. Kamišalić, A.; Fister, I.; Turkanović, M.; Karakatič, S. Sensors and Functionalities of Non-Invasive Wrist-Wearable Devices: A Review. Sensors 2018, 18, 1714. [Google Scholar] [CrossRef]
  7. Kanno, I. Piezoelectric Pzt Thin Films: Deposition, Evaluation and Their Applications. In Proceedings of the 2019 20th International Conference on Solid-State Sensors, Actuators and Microsystems & Eurosensors XXXIII (TRANSDUCERS & EUROSENSORS XXXIII), Berlin, Germany, 23–27 June 2019; pp. 785–788. [Google Scholar]
  8. Feenstra, J.; Granstrom, J.; Sodano, H. Energy harvesting through a backpack employing a mechanically amplified piezoelectric stack. Mech. Syst. Signal Process. 2008, 22, 721–734. [Google Scholar] [CrossRef]
  9. Pawar, O.Y.; Patil, S.L.; Redekar, R.S.; Patil, S.B.; Lim, S.; Tarwal, N.L. Strategic Development of Piezoelectric Nanogenerator and Biomedical Applications. Appl. Sci. 2023, 13, 2891. [Google Scholar] [CrossRef]
  10. Khan, N.U.; Khan, F.U. Rf energy harvesting for portable biomedical devices. In Proceedings of the 2019 22nd International Multitopic Conference (INMIC), Islamabad, Pakistan, 29–30 November 2019. [Google Scholar] [CrossRef]
  11. Shabani, E.; Abdekhodaie, S.D.M.J. Laboratory detection methods for the human coronaviruses. Eur. J. Clin. Microbiol. Infect. Dis. 2021, 40, 225–246. [Google Scholar] [CrossRef]
  12. DeVore, A.D.; Wosik, J.; Hernandez, A.F. The Future of Wearables in Heart Failure Patients. JACC Heart Fail. 2019, 7, 922–932. [Google Scholar] [CrossRef]
  13. Sunithamani, S.; Lakshmi, P.; Flora, E.E. PZT length optimization of MEMS piezoelectric energy harvester with a non-traditional cross section: Simulation study. Microsyst. Technol. 2013, 20, 2165–2171. [Google Scholar] [CrossRef]
  14. Amiri, M.H.; Fatscher, R.; Taylor, R.; Rocha, P.R.; Bowen, C.R.; Asadi, K. Piezoelectric energy harvesters: A critical assessment and a standardized reporting of power-producing vibrational harvesters. Nano Energy 2023, 106, 108073. [Google Scholar] [CrossRef]
  15. Bokla, N.; Klymkovych, T.; Shcherbovskykh, S.; Lisik, Z.; Guzowski, B.; Gozdur, R. The Explosive Boiling as a Chaotic Actuator for Piezoelectric Energy Harvesters. In Proceedings of the 2022 IEEE XVIII International Conference on the Perspective Technologies and Methods in MEMS Design (MEMSTECH), Polyana (Zakarpattya), Ukraine, 7–11 September 2022; pp. 101–104. [Google Scholar] [CrossRef]
  16. Kim, J.; Byun, S.; Lee, S.; Ryu, J.; Cho, S.; Oh, C.; Kim, H.; No, K.; Ryu, S.; Lee, Y.M.; et al. Cost-effective and strongly integrated fabric-based wearable piezoelectric energy harvester. Nano Energy 2020, 75, 104992. [Google Scholar] [CrossRef]
  17. Howells, C.A. Piezoelectric energy harvesting. Energy Convers. Manag. 2009, 50, 1847–1850. [Google Scholar] [CrossRef]
  18. Zhao, J.; You, Z. A shoe-embedded piezoelectric energy harvester for wearable sensors. Sensors 2014, 14, 12497–12510. [Google Scholar] [CrossRef] [PubMed]
  19. Jung, W.S.; Lee, M.J.; Kang, M.G.; Moon, H.G.; Yoon, S.J.; Baek, S.H.; Kang, C.Y. Powerful curved piezoelectric generator for wearable applications. Nano Energy 2015, 13, 174–181. [Google Scholar] [CrossRef]
  20. Tao, W. Pendulum-based vibration energy harvesting: Mechanisms, transducer integration, and applications. Energy Convers. Manag. 2023, 276, 116469. [Google Scholar] [CrossRef]
  21. Sun, R.; Zhou, S.; Cheng, L. Ultra-low frequency vibration energy harvesting: Mechanisms, enhancement techniques, and scaling laws. Energy Convers. Manag. 2023, 276, 116585. [Google Scholar] [CrossRef]
  22. Rigo, F.; Migliorini, M.; Pozzebon, A. Piezoelectric Sensors as Energy Harvesters for Ultra Low-Power IoT Applications. Sensors 2024, 24, 2587. [Google Scholar] [CrossRef]
  23. Wang, J.; Zhang, M.; Wang, Z.; Sun, S.; Ning, Y.; Yang, X.; Pang, W. An ultra-low power, small size and high precision indoor localization system based on MEMS ultrasonic transducer chips. IEEE Trans. Ultrason. Ferroelectr. Freq. Control. 2022, 69, 1469–1477. [Google Scholar] [CrossRef]
  24. Muscalu, G.; Firtat, B.; Anghelescu, A.; Moldovan, C.; Dinulescu, S.; Brasoveanu, C.; Tulbure, A. Piezoelectric MEMS Energy Harvester for Low-Power Applications. Electronics 2024, 13, 2087. [Google Scholar] [CrossRef]
  25. Kang, M.; Yeo, W.-H. Advances in Energy Harvesting Technologies for Wearable Devices. Micromachines 2024, 15, 884. [Google Scholar] [CrossRef] [PubMed]
  26. Choi, Y.M.; Lee, M.G.; Jeon, Y. Wearable biomechanical energy harvesting technologies. Energies 2017, 10, 1483. [Google Scholar] [CrossRef]
  27. Zaia, W.; Gordon, M.P.; Yuan, P.; Urban, J.J. Progress and perspective: Soft thermoelectric materials for wearable and internet-of-things applications. Adv. Electron. Mater. 2019, 5, 1800823. [Google Scholar] [CrossRef]
  28. Xiao, N.; Yu, W.; Han, X. Wearable heart rate monitoring intelligent sports bracelet based on Internet of things. Measurement 2020, 164, 108102. [Google Scholar] [CrossRef]
  29. Khan, A.S.; Khan, F.U. A survey of wearable energy harvesting systems. Int. J. Energy Res. 2022, 46, 2277–2329. [Google Scholar] [CrossRef]
  30. Xia, K.; Zhu, Z.; Zhang, H.; Du, C.; Xu, Z.; Wang, R. Painting a high-output triboelectric nanogenerator on paper for harvesting energy from human body motion. Nano Energy 2018, 50, 571–580. [Google Scholar] [CrossRef]
  31. Mondal, S.; Paul, T.; Maiti, S.; Das, B.K.; Chattopadhyay, K.K. Human motion interactive mechanical energy harvester based on all inorganic perovskite-PVDF. Nano Energy 2020, 74, 104870. [Google Scholar] [CrossRef]
  32. Maharjan, P.; Bhatta, T.; Rasel, M.S.; Salauddin, M.; Rahman, M.T.; Park, J.Y. High-performance cycloid inspired wearable electromagnetic energy harvester for scavenging human motion energy. Appl. Energy 2019, 256, 113987. [Google Scholar] [CrossRef]
  33. Bandodkar, A.J.; You, J.M.; Kim, N.H.; Gu, Y.; Kumar, R.; Mohan, A.V.; Kurniawan, J.; Imani, S.; Nakagawa, T.; Parish, B.; et al. Soft, stretchable, high power density electronic skin-based biofuel cells for scavenging energy from human sweat. Energy Environ. Sci. 2017, 10, 1581–1589. [Google Scholar] [CrossRef]
  34. Yang, Y.; Pan, H.; Xie, G.; Jiang, Y.; Chen, C.; Su, Y.; Wang, Y.; Tai, H. Flexible piezoelectric pressure sensor based on polydopamine-modified BaTiO3/PVDF composite film for human motion monitoring. Sens. Actuators A Phys. 2020, 301, 111789. [Google Scholar] [CrossRef]
  35. Khalid, S.; Raouf, I.; Khan, A.; Kim, N.; Kim, H.S. A review of human-powered energy harvesting for smart electronics: Recent progress and challenges. Int. J. Precis. Eng. Manuf. Tech. 2019, 6, 821–851. [Google Scholar] [CrossRef]
  36. Huang, L.; Lin, S.; Xu, Z.; Zhou, H.; Duan, J.; Hu, B.; Zhou, J. Fiber-based energy conversion devices for human-body energy harvesting. Adv. Mater. 2020, 32, 1902034. [Google Scholar] [CrossRef] [PubMed]
  37. Fan, K.; Liu, Z.; Liu, H.; Wang, L.; Zhu, Y.; Yu, B. Scavenging energy from human walking through a shoe-mounted piezoelectric harvester. Appl. Phys. Lett. 2017, 110, 143902. [Google Scholar] [CrossRef]
  38. Zhou, S.; Lallart, M.; Erturk, A. Multistable vibration energy harvesters: Principle, progress, and perspectives. J. Sound Vib. 2022, 528, 116886. [Google Scholar] [CrossRef]
  39. Khan, F.; Sassani, F.; Stoeber, B. Copper foil-type vibration-based electromagnetic energy harvester. J. Micromech. Microeng. 2010, 20, 125006. [Google Scholar] [CrossRef]
  40. Khan, F.U.; Qadir, M.U. State-of-the-art in vibration-based electrostatic energy harvesting. J. Micromech. Microeng. 2016, 26, 103001. [Google Scholar] [CrossRef]
  41. Khan, F.U.; Ali, T. A piezoelectric based energy harvester for simultaneous energy generation and vibration isolation. Int. J. Energy Res. 2019, 43, 5922–5931. [Google Scholar] [CrossRef]
  42. Yang, Z.; Tang, L.; Tao, K.; Aw, K.C. Modelling and validation of electret-based vibration energy harvesters in view of charge migration. Int. J. Precis. Eng. Manuf. Tech. 2019, 8, 113–123. [Google Scholar] [CrossRef]
  43. Meng, K.; Zhao, S.; Zhou, Y.; Wu, Y.; Zhang, S.; He, Q.; Wang, X.; Zhou, Z.; Fan, W.; Tan, X.; et al. A wireless textile-based sensor system for self-powered personalized health care. Matter 2020, 2, 896–907. [Google Scholar] [CrossRef]
  44. Jiang, L.; Yang, Y.; Chen, R.; Lu, G.; Li, R.; Li, D.; Humayun, M.S.; Shung, K.K.; Zhu, J.; Chen, Y.; et al. Flexible piezoelectric ultrasonic energy harvester array for bio-implantable wireless generator. Nano Energy 2019, 56, 216–224. [Google Scholar] [CrossRef] [PubMed]
  45. Kuang, Y.; Zhu, M. Characterisation of a knee-joint energy harvester powering a wireless communication sensing node. Smart Mater. Struct. 2016, 25, 055013. [Google Scholar] [CrossRef]
  46. Lakshmi, G.S.; Karumuri, S.R.; Kondavitee, G.S.; Lay-Ekuakille, A. Design and performance analysis of a microbridge and microcantilever-based MEMS pressure sensor for glucose monitoring. IEEE Sens. J. 2023, 23, 4589–4596. [Google Scholar] [CrossRef]
  47. Xin, Y.; Li, X.; Tian, H.; Guo, C.; Qian, C.; Wang, S.; Wang, C. Shoes-Equipped Piezoelectric Transducer For Energy Harvesting: A Brief Review. Ferroelectrics 2016, 493, 12–24. [Google Scholar] [CrossRef]
  48. Kiran, R.; Kumar, A.; Sharma, S.; Kumar, R.; Vaish, R. Deciphering the importance of graded poling in piezoelectric materials: A numerical study. Eng. Rep. 2020, 2, e12266. [Google Scholar] [CrossRef]
  49. Yang, J.; Li, Z.; Xin, X.; Gao, X.; Yuan, X.; Wang, Z.; Zhou, J.; Dong, S. Designing electromechanical metamaterial with full nonzero piezoelectric coefficients. Sci. Adv. 2019, 5, eaax1782. [Google Scholar] [CrossRef] [PubMed]
  50. Xu, C.; Li, Y.; Yang, T. Optimization of Non-Uniform Deformation on Piezoelectric Circular Diaphragm Energy Harvester with a Ring-Shaped Ceramic Disk. Micromachines 2020, 11, 963. [Google Scholar] [CrossRef]
  51. Likhon, M.M.; Shawan, S.I.; Alam, M.N.S.B.; Siddique, S. Characterizing Piezoelectric Properties of PZT-4, PZT-5A, PZT-5J, PZT-7A and Lithium Tantalate Material-based Transducers. In Proceedings of the International Conference on Green Energy, Computing and Sustainable Technology, GECOST 2021, Miri, Malaysia, 7–9 July 2021. [Google Scholar]
  52. Naduvinamani, S.; Iyer, N.C. Design and simulation of PZT based MEMS piezoelectric accelerometer. In Proceedings of the International Conference on Electrical, Electronics, and Optimization Techniques, ICEEOT 2016, Chennai, India, 3–5 March 2016; pp. 3715–3721. [Google Scholar]
  53. Huang, J.; Yao, M.; Yao, X. A novel approach to improving the electromechanical properties of PZT-based piezoelectric ceramics via a grain coating modification strategy. Ceram. Int. 2021, 47, 16294–16302. [Google Scholar] [CrossRef]
  54. Mengwei, L.; Tianhong, C.; Weijie, D.; Yan, C.; Jing, W.; Liqun, D.; Liding, W. Piezoelectric microcantilevers with Two PZT thin-film elements for microsensors and microactuators. In Proceedings of the 1st IEEE International Conference on Nano Micro Engineered and Molecular Systems, Zhuhai, China, 18–21 January 2006; pp. 775–778. [Google Scholar]
  55. Kuang, Y.; Yang, Z.; Zhu, M. Design and characterisation of a piezoelectric knee-joint energy harvester with frequency up-conversion through magnetic plucking. Smart Mater. Struct. 2016, 25, 085029. [Google Scholar] [CrossRef]
  56. Granstrom, J.; Feenstra, J.; Sodano, H.A.; Farinholt, K. Energy harvesting from a backpack instrumented with piezoelectric shoulderstraps. Smart Mater. Struct. 2007, 16, 1810. [Google Scholar] [CrossRef]
  57. Shenck, N.S.; Paradiso, J.A. Energy scavenging with shoe-mounted piezoelectrics. IEEE Micro 2001, 21, 30–42. [Google Scholar] [CrossRef]
  58. Khan, F.; Izhar. Piezoelectric type acoustic energy harvester with a tapered Helmholtz cavity for improved performance. J. Renew. Sustain. Energy 2016, 8, 054701. [Google Scholar] [CrossRef]
  59. Ferreira, J.C.; Afonso, J.A.; Monteiro, V.; Afonso, J.L. An Energy Management Platform for Public Buildings. Electronics 2018, 7, 294. [Google Scholar] [CrossRef]
  60. Liu, H.; Fu, H.; Sun, L.; Lee, C.; Yeatman, E.M. Hybrid energy harvesting technology: From materials, structural design, system integration to applications. Renew. Sustain. Energy Rev. 2021, 137, 110473. [Google Scholar] [CrossRef]
  61. Iqbal, M.; Nauman, M.M.; Khan, F.U.; Abas, P.E.; Cheok, Q.; Iqbal, A.; Aissa, B. Vibration-based piezoelectric, electromagnetic, and hybrid energy harvesters for microsystems applications: A contributed review. Int. J. Energy Res. 2021, 57, 65–102. [Google Scholar] [CrossRef]
  62. Soupremanien, U.; Ollier, E.; Salamon, N.; Monfray, S.; Skotnicki, T. An experimental device designed to obtain repeatable condensation peaks in a closed system. WIT Trans. Ecol. Environ. 2015, 186, 243–254. [Google Scholar]
  63. Salamon, N. Development of Thermal Energy Harvesting Systems. NNT: 2018GREAI011. Master’s Thesis, Université Grenoble Alpes/Politechnika, Łódzka, Poland, 2018. (In English). [Google Scholar]
  64. Li, L.; Chen, Z.; Hao, M.; Wang, S.; Sun, F.; Zhao, Z.; Zhang, T. Moisture-driven power generation for multifunctional flexible sensing systems. Nano Lett. 2019, 19, 5544–5552. [Google Scholar] [CrossRef]
  65. Rao, J.; Chen, Z.; Zhao, D.; Yin, Y.; Wang, X.; Yi, F. Recent Progress in Self-Powered Skin Sensors. Sensors 2019, 19, 2763. [Google Scholar] [CrossRef]
  66. Singh, N.; Kumar, A.; Srivastava, K.; Yadav, N.; Singh, R.; Verma, A.S.; Gehlot, A.; Yadav, A.K.; Kumar, T.; Pandey, K.; et al. Challenges and Opportunities in Engineering of Next Generation 3D Microelectronic Devices: Improved Performance, Higher Integration Density. Nanoscale Adv. 2024. [Google Scholar] [CrossRef]
  67. Rincón-Mora, G.A.; Yang, S. Tiny piezoelectric harvesters: Principles, constraints, and power conversion. IEEE Trans. Circuits Syst. I Regul. Pap. 2016, 63, 639–649. [Google Scholar] [CrossRef]
  68. Soupremanien, U.; Le Person, S.; Favre-Marinet, M.; Bultel, Y. Influence of the aspect ratio on boiling flows in rectangular mini-channels. Exp. Therm. Fluid Sci. 2011, 35, 797–809. [Google Scholar] [CrossRef]
  69. Atonge, E.A.; Yang, D. Comparative Evaluation of a Functions for the Soave-Redlich-Kwong Equation of State and the Peng-Robinson Equation of State to Predict Saturation Pressures for Gas(es)-Heavy Oil/Bitumen-Water Systems. SPE Reserv. Eval. Eng. 2023, 26, 1323–1343. [Google Scholar] [CrossRef]
  70. Groniewsky, A.; Imre, A.R. Prediction of the ORC working fluid’s temperature-entropy saturation boundary using Redlich-Kwong equation of state. Entropy 2018, 20, 93. [Google Scholar] [CrossRef]
Figure 1. Operational scheme of phase-transition-driven harvester.
Energies 17 05896 g001
Figure 2. Stages in the fabrication of PEHs.
Energies 17 05896 g002
Figure 3. Transverse of the PEHs; red frame indicates the location of the channel enabling the circulation of water between the evaporation chamber and condensing chamber.
Energies 17 05896 g003
Figure 4. Distribution of mechanical stress (a) and electric potential in the piezoelectric shell (b).
Energies 17 05896 g004
Figure 5. The dependence of pressure on the quantity of water (a) and temperature (b).
Energies 17 05896 g005
Figure 6. PEHs components: evaporation chamber (1), channel (2), condensation chamber (3), and upper cover (4); various channel realizations (marked red) included design based on multichannel (A), single-channel (B) and thinned single-channel approach (C).
Energies 17 05896 g006
Figure 7. Fabrication process and fabricated PEH device (a) Si (evaporation chamber) (b) Si + SU-8 (c) Si + SU-8 + channel (d) Si (condensation chamber) (e) Si + SU-8 + channel+ upper cover (f) Si +liquid (g) Si + SU-8 + PZT 7BB-15-6 (h) SU-8 + upper cover (i) final structure.
Energies 17 05896 g007
Figure 8. Diagram of the test bench for PEH validation: (1) temperature of the heatsink Tch; (2) temperature of the cold side Tc; (3) output tH of the harvester Vp; (4) temperature of the hot side Th; (5) temperature hotplate (cooper); (6) piezo harvester; (7) Stuart D160 Digital Hotplate; (8) copper rod; (9) data acquisition system NI USB-6211; (10) thermal isolation.
Energies 17 05896 g008
Figure 9. Digital output signals Vp(t) collected during PEH operation with filling degree α: (a) 10%, (b) 20%, and (c) 30%.
Energies 17 05896 g009
Figure 10. FFT frequency analysis of the excitation signal with filling degree α: (a) 10%, (b) 20%, and (c) 30%.
Energies 17 05896 g010aEnergies 17 05896 g010b
Figure 11. Spectrogram images obtained from STFT analysis of Vp with filling degree α: (a) 10%, (b) 20%, and (c) 30%.
Energies 17 05896 g011
Table 1. Comparison of experimental data and simulation results of voltage generation by piezo element.
Type of
Piezo Transducer
Pressure [mbar]
355575100200300400
Experimental data [V]
7BB-15-6 3.66.78.911.7
Modeled potential [V]
PZT-5J1.181.852.523.366.7310.113.5
Table 2. Influence of laser processing parameters on depth of silicon substrate machining.
Repetitions = Const. = 40×
Laser Beam Power [W]1214161820
Depth of silicon
machining [µm]
180.0211.9227.4242.1254.2
Power = const. = 20 W
Number of laser beam
repetitions
1020304050
Depth of silicon
machining [µm]
69.8174.4199.2259.5323.5
Table 3. Parametric evaluation of the time-domain and frequency-domain waveforms.
ParameterWaveform
Figure 9a, Figure 10a and Figure 11a
Waveform
Figure 9b, Figure 10b and Figure 11b
Waveform
Figure 9c, Figure 10c and Figure 11c
Remarks
Ts, dt, ms1
T, s10,09997039999T = Ts × n
fs, Sa/s1000
n, Samples10,09997039999
VPeak-peak(t), V1.47581817161089Vpp = Vpeak ± Vpeak-
VRMS, V0.3518160.4080.306 V R M S = n 1 n V p 2 ( n ) · R l 1
Vp+/Vp−, V1.322512/
−0.15331
1.375/−0.3410.966/−0.123See Figure 9a–c
Avg. RealPower, µW0.3518160.4080.306 P ¯ = n 1 n V p 2 ( n ) · R l 1
Max power, µW1.74903818910.933 p m a x ( n ) = M A X V p 2 ( n ) · R l 1
Energy, nJ3.55280539593057 E = n V p 2 ( n ) · R l 1
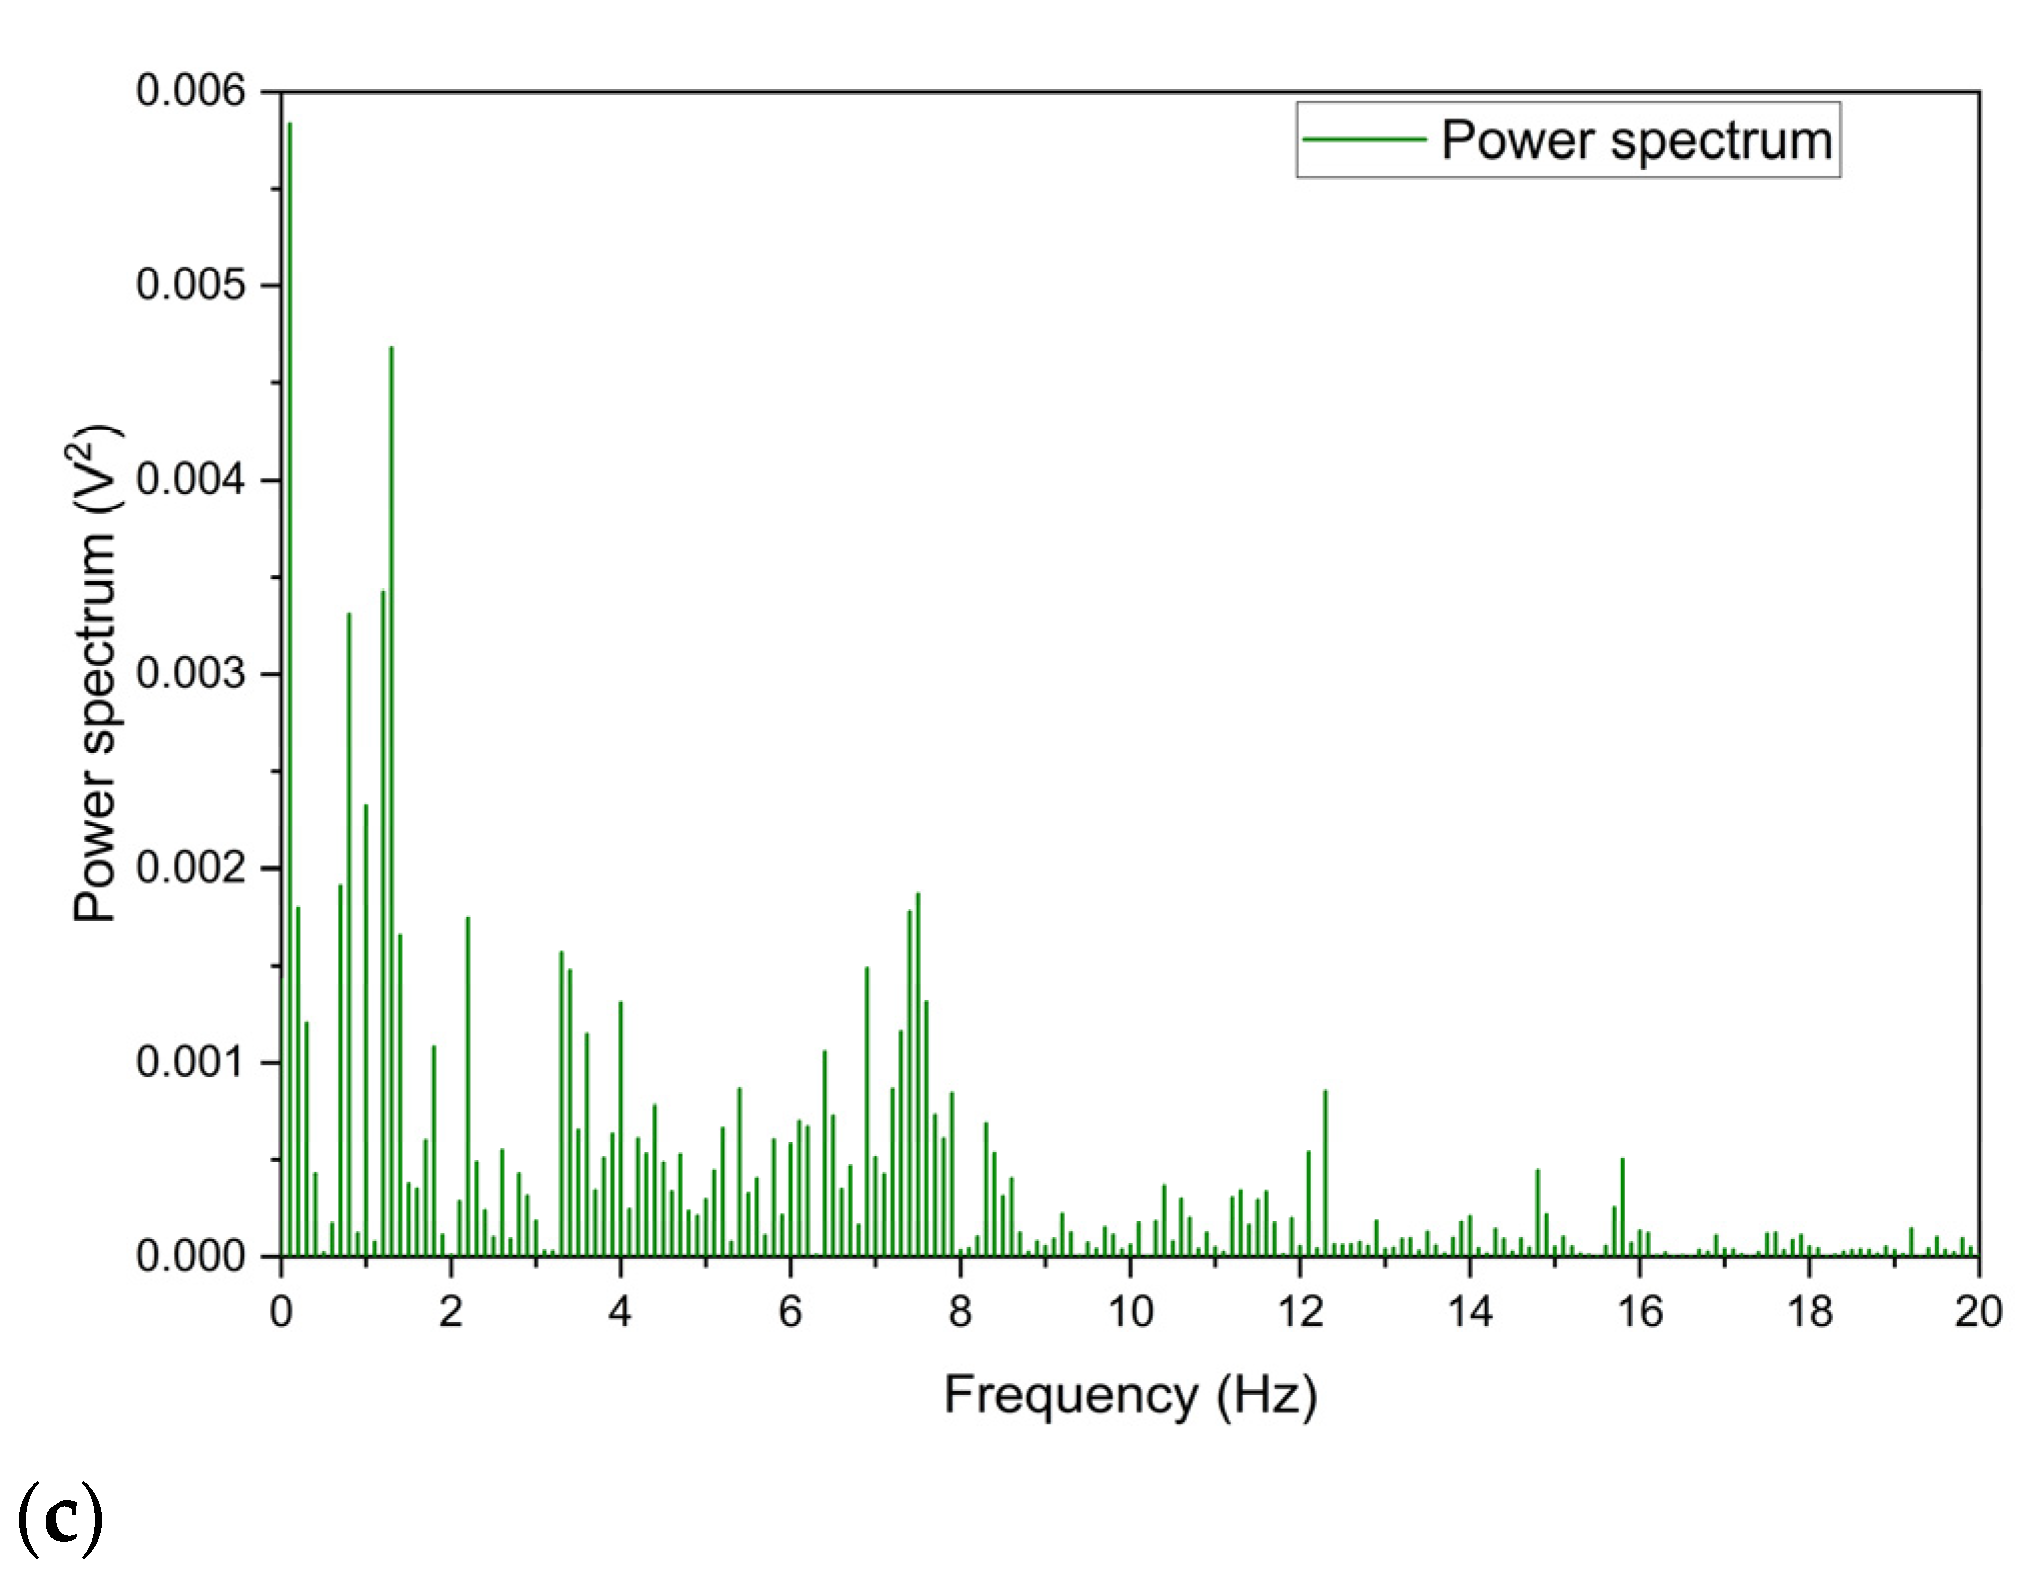
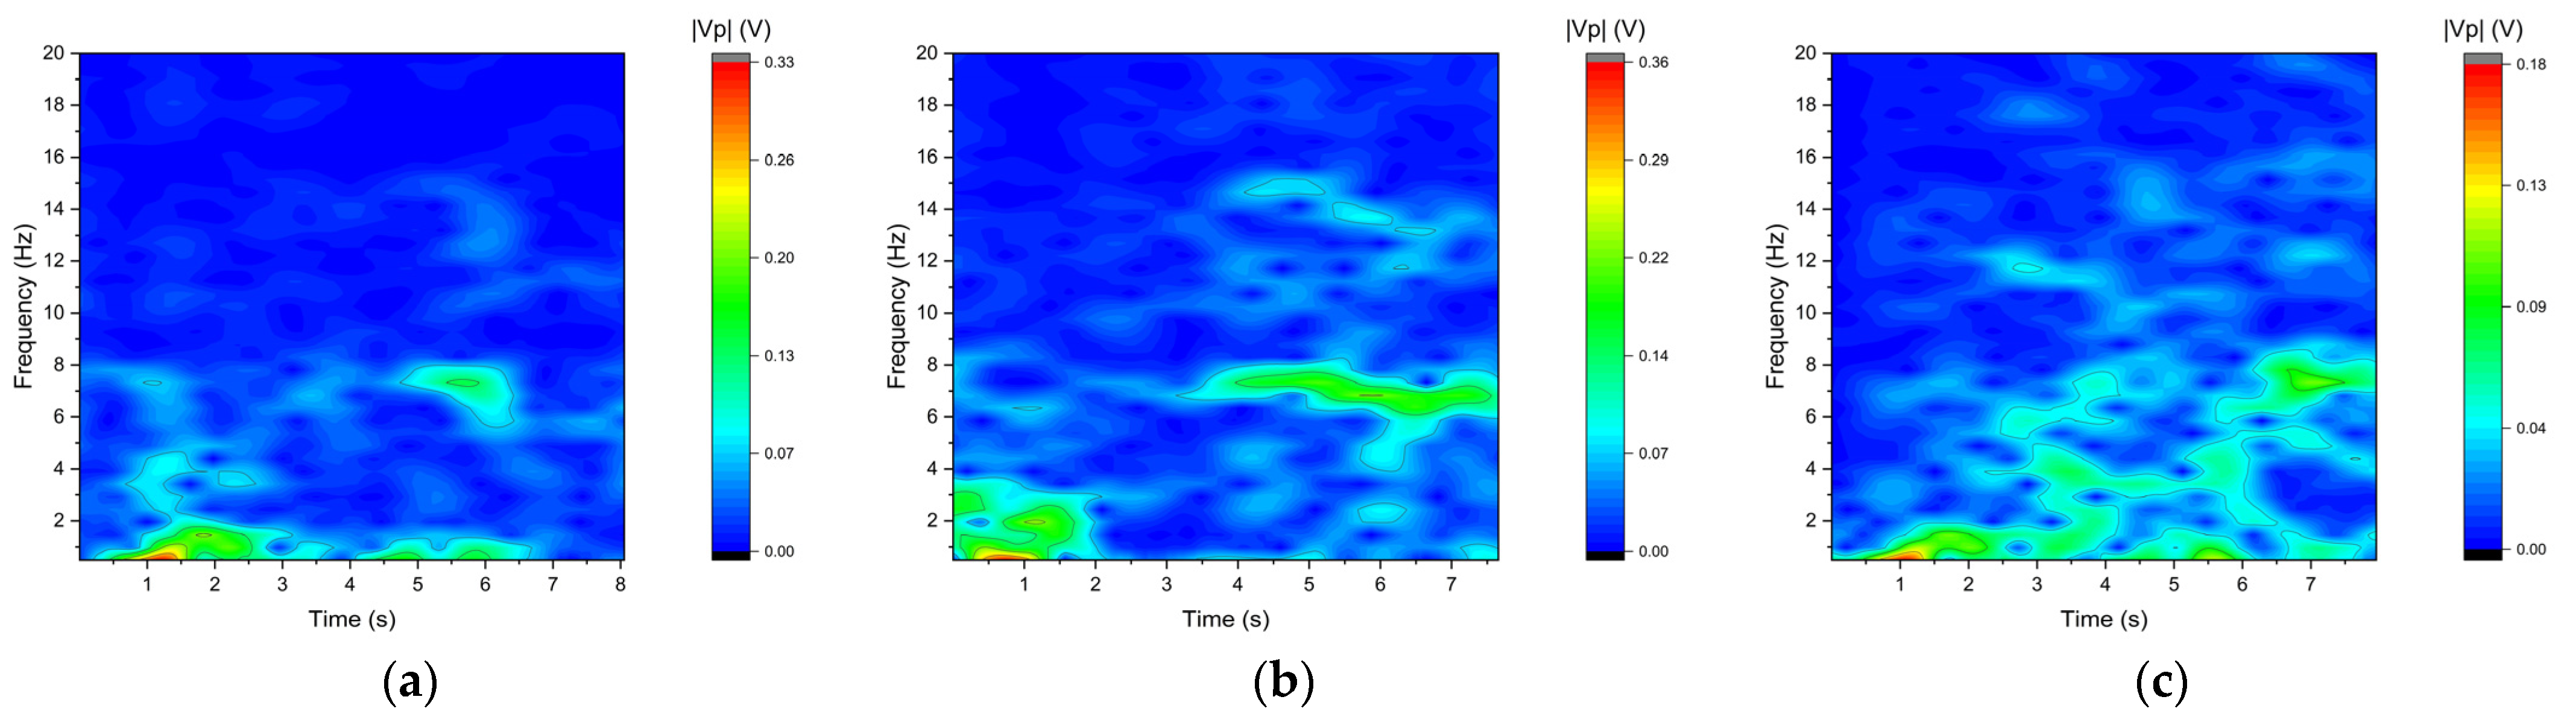
Frequency of the Max harmonic comp., Vamp, Hz0.068 V, 1.26 Hz0.076 V, 7.20 Hz0.049 V, 1.30 HzSee Figure 10a–c
2nd higher harmonics, Vamp, Hz0.056 V, 7.42 Hz0.060 V, 6.79 Hz0.002 V, 3.1 HzSee Figure 10a–c
Spectral THD
(0.12 Hz–20 Hz), V
0.5210050.5710.519PEH is working not regularly
Disclaimer/Publisher’s Note: The statements, opinions and data contained in all publications are solely those of the individual author(s) and contributor(s) and not of MDPI and/or the editor(s). MDPI and/or the editor(s) disclaim responsibility for any injury to people or property resulting from any ideas, methods, instructions or products referred to in the content.

