Article

Degradation Diagnosis and Control Strategy for a Diesel Hybrid Powertrain Considering State of Health

School of Mechanical Engineering, Beijing Institute of Technology, Beijing 100081, China
*
Author to whom correspondence should be addressed.
Energies 2024, 17(21), 5413; https://doi.org/10.3390/en17215413
Submission received: 25 September 2024 / Revised: 14 October 2024 / Accepted: 18 October 2024 / Published: 30 October 2024
(This article belongs to the Special Issue Hybrid Electric Powertrain System Modelling and Control)

Abstract

:
Hybrid electric vehicles (HEV) are a practical choice for energy saving in the transportation field. Degradation diagnosis (DD) is one of the main methods to guarantee system robustness. However, the classical DD methods cannot meet the requirements of HEV due to their system complexity. In this study, a novel Prognostics and Health Management (PHM) study was conducted to face these challenges. Firstly, a physical P2 HEV model with a rule-based controller was built, and its diesel engine sub-model was simplified by a neural network (NN) to ensure real-time performance of the degradation prognostics. Secondly, a degradation prognostics method based on gray relation analysis–principal component analysis (GRA-PCA) was illustrated, which could confirm degradation 2 s after the health index fell below the threshold. Finally, a degradation tolerance strategy based on long short term memory–model predictive control (LSTM-MPC) was performed to optimize vehicle speed tracing with minimal energy consumption and was validated by three cases. The result shows that the energy consumption stayed nearly unchanged for the engine degradation case. For the battery degradation case, the tracing error was reduced by 11.7% with 4.3% more energy consumption. For combined degradation, the strategy achieved a 12.3% tracing error reduction with 3.7% more energy consumption. The suggested PHM method guaranteed vehicle power performance under degradation situations.

1. Introduction

As energy and environmental issues become increasingly severe, electric vehicles have become an inevitable trend. However, due to limitations such as range, battery costs, the shortage of charging infrastructure, and the disruptive nature of entirely new powertrain systems, HEVs are needed as a transitional solution toward fully electric vehicles [1], offering the advantages of reduced fuel consumption and emissions. They alleviate range anxiety associated with electric vehicles, reduce battery cost pressures, and adapt to the current limitations of charging infrastructure [2]. Additionally, HEV facilitates a smoother transition to full electric driving, increasing market acceptance and accelerating the adoption of electric vehicles [3]. Although HEVs are gaining attention for their low emissions and energy consumption compared to vehicles with the same engine displacement [4,5], compared to conventional fuel vehicles, hybrid systems are more complex [6], incorporating an engine, motor, and battery, which increases the variety of potential types of degradation. For example, battery performance is significantly affected by temperature, and when degradation occurs, the battery may exceed its optimal operating temperature range. This can lead to rapid performance degradation, negatively impacting the hybrid system’s overall performance and potentially causing safety issues [7]. For the engine, degradations such as an intake or exhaust system failure can reduce both power performance and fuel efficiency. Additionally, they may lead to worsened emissions, increased exhaust temperatures, and higher thermal loads, which can damage the engine [8]. Currently, the method used in actual vehicles to detect degradation, based on whether sensor signals exceed warning thresholds, is simple and effective [9]. However, relying on a single signal often fails to accurately diagnose degradation. Certain degradation types, such as battery thermal runaway leading to “spontaneous combustion”, can cause significant damage once they occur. To meet the diagnostic needs of hybrid vehicles, traditional engine degradation diagnosis techniques can be adapted for diagnosing degradation in hybrid systems [10,11]. For battery degradation diagnosis, L. Yao et al. [12] proposed a novel method using voltage difference as a feature signal input, achieving an accuracy of 98.96%. Additionally, X. Zhang et al. [13] developed a real-time degradation diagnosis method based on an extended finite state machine for detecting sensor degradation in hybrid vehicle drive motors, which improved Hall sensor degradation identification speed by 6.7 ms compared to previous methods. While these methods accurately diagnose degradation in hybrid systems, they often focus on individual components. However, multiple components in the hybrid system are interrelated and coupled, making single-component diagnosis insufficient. Moreover, due to the advantage of multiple power sources in hybrid systems, where each source can operate independently or in combination, there is potential to find alternative solutions that allow the system to continue functioning under degradation conditions while still meeting necessary constraints [14].
PHM is a maintenance approach for systems or equipment that aims to detect potential degradation or health issues early through monitoring, diagnostics, and predictive methods [15]. By taking appropriate maintenance actions, PHM helps reduce downtime, improve equipment reliability, and lower maintenance costs. Initially applied in aerospace and military equipment [16], the development of sensor and AI technologies has made monitoring and predicting system states easier and more accurate, enabling proactive measures to prevent severe incidents [17]. Today, PHM is a key technology for reducing the lifecycle costs of modern weaponry and has been applied in other sectors [18,19]. For example, C. Che et al. [20] proposed a PHM model combining Long Short-Term Memory (LSTM) and Deep Belief Networks (DBN) to guide preventive maintenance of aircraft engines within a reasonable time frame. Y. Sun et al. [21] developed a digital twin-based dual time-scale modeling PHM method, enhancing the real-time performance and reliability of health diagnostics in large cranes used in the steel industry. Stefan Milićević et al. presented a dynamic programming algorithm and custom drive cycle that are utilized to determine optimal hybridization factors and assess parameter sensitivities, optimizing hybridization in speed-coupled parallel hybrid electric powertrains for tracked vehicles [22]. Therefore, this study adopts the PHM framework, which includes data collection, data processing, health assessment, predictive evaluation, and decision-making [23]. This approach allows for real-time health status evaluation of the system during operation to detect and confirm degradation before sensor alarms are triggered. After confirming degradation, the future state of the system is predicted, and predictive maintenance is conducted based on these predictions. The goal is to identify health management strategies that satisfy constraints and reduce the likelihood of accidents.
This study investigates PHM of a parallel P2 diesel–electric hybrid bus from a system-level perspective, using a GRA-PCA-based degradation prognostics method and a LSTM-MPC-based degradation tolerance strategy to evaluate and manage system health, improve vehicle speed tracking, and ensure that the battery and diesel engine operate within their optimal ranges, with validation through the diesel engine intake system and battery internal resistance degradation.

2. P2 HEV Modelling with NN Engine Model Simplification

This section aims to illustrate the modeling approach for the parallel P2 diesel–electric hybrid system in an urban bus—Yutong ZK6120CHEVPG52 (diesel/electric hybrid, China V emission standard, 10–40) and the corresponding rule-based control strategy adopted.

2.1. Vehicle Model

A schematic diagram of a parallel P2 diesel–electric hybrid urban bus is illustrated in Figure 1, and its parameters are listed in Table 1. The engine selected is the YC6J200-33 from Guangxi Yuchai Machinery Group Co., Ltd., Yulin, China. The battery is a lithium iron phosphate battery from Wanxiang A123 Systems, Hangzhou, China, and the supercapacitor is manufactured by Maxwell Technologies in San Diego, CA, USA. The hybrid system switches between different modes according to the different working states of the power source and the clutch.
The driving force and resistance of the vehicle act together, and the balance relationship of the force can be obtained using Equation (1):
δ m v ˙ = F d F w F f F i F f = m g f cos a F w = C D A v 2 21.15 F i = m g sin a
where δ is the mass conversion coefficient; v is the velocity; F d is the driving force; F w is the air resistance; F f is the rolling resistance; F i is the ramp resistance; m is the vehicle mass; A is the windward area; C D is the air resistance coefficient; f is the rolling resistance coefficient; a is the road shape.

2.2. Traction Motor Model

Based on the research, only motor power was considered. The required power of the driving motor can be expressed by Equation (2):
p m = T m n m 9550 η m T m 0 T m n m η m 9550 T m 0
where p m is the required motor power; T m is the motor torque; n m is the motor speed; η m is the motor efficiency, where the motor efficiency is a function of its speed and torque, which can be obtained by referencing Table 1.
The motor efficiency diagram was measured by experiment, as shown in Figure 2.

2.3. Battery Model

The battery model includes three main parts: calculated output power, SOC and battery temperature. Therefore, an equivalent circuit model was used. The open circuit voltage and internal resistance were measured by experiment. The heat generated by the equivalent internal resistance for the battery temperature was calculated through heat exchange with the external environment.
The battery output power, SOC and temperature are obtained using Equation (3):
P r e q = I V O C + I 2 R i n t P m = I m a x V = V O C 2 4 R i n t S O C ( t ) = S O C i n t 0 t I d t Q b T b = T 0 + q 1 q r A c · m b
where I is the loop current; V O C is the open circuit voltage; R i n t is the battery equivalent internal resistance; P r e q is the external required power. If the required motor power exceeds the available battery power, the real root of the circuit current cannot be determined. At this point, P m is the actual power supplied to the motor; S O C ( t ) is the SOC at time t; S O C i n t is the initial SOC; Q b is the battery capacity; T b is the battery temperature; q 1 is the convective heat transfer; q r is the battery heat generation; T 0 is the ambient temperature; A is the heat transfer area; c is the battery specific heat capacity; m b is the battery mass.

2.4. Diesel Engine Model

2.4.1. Model Building

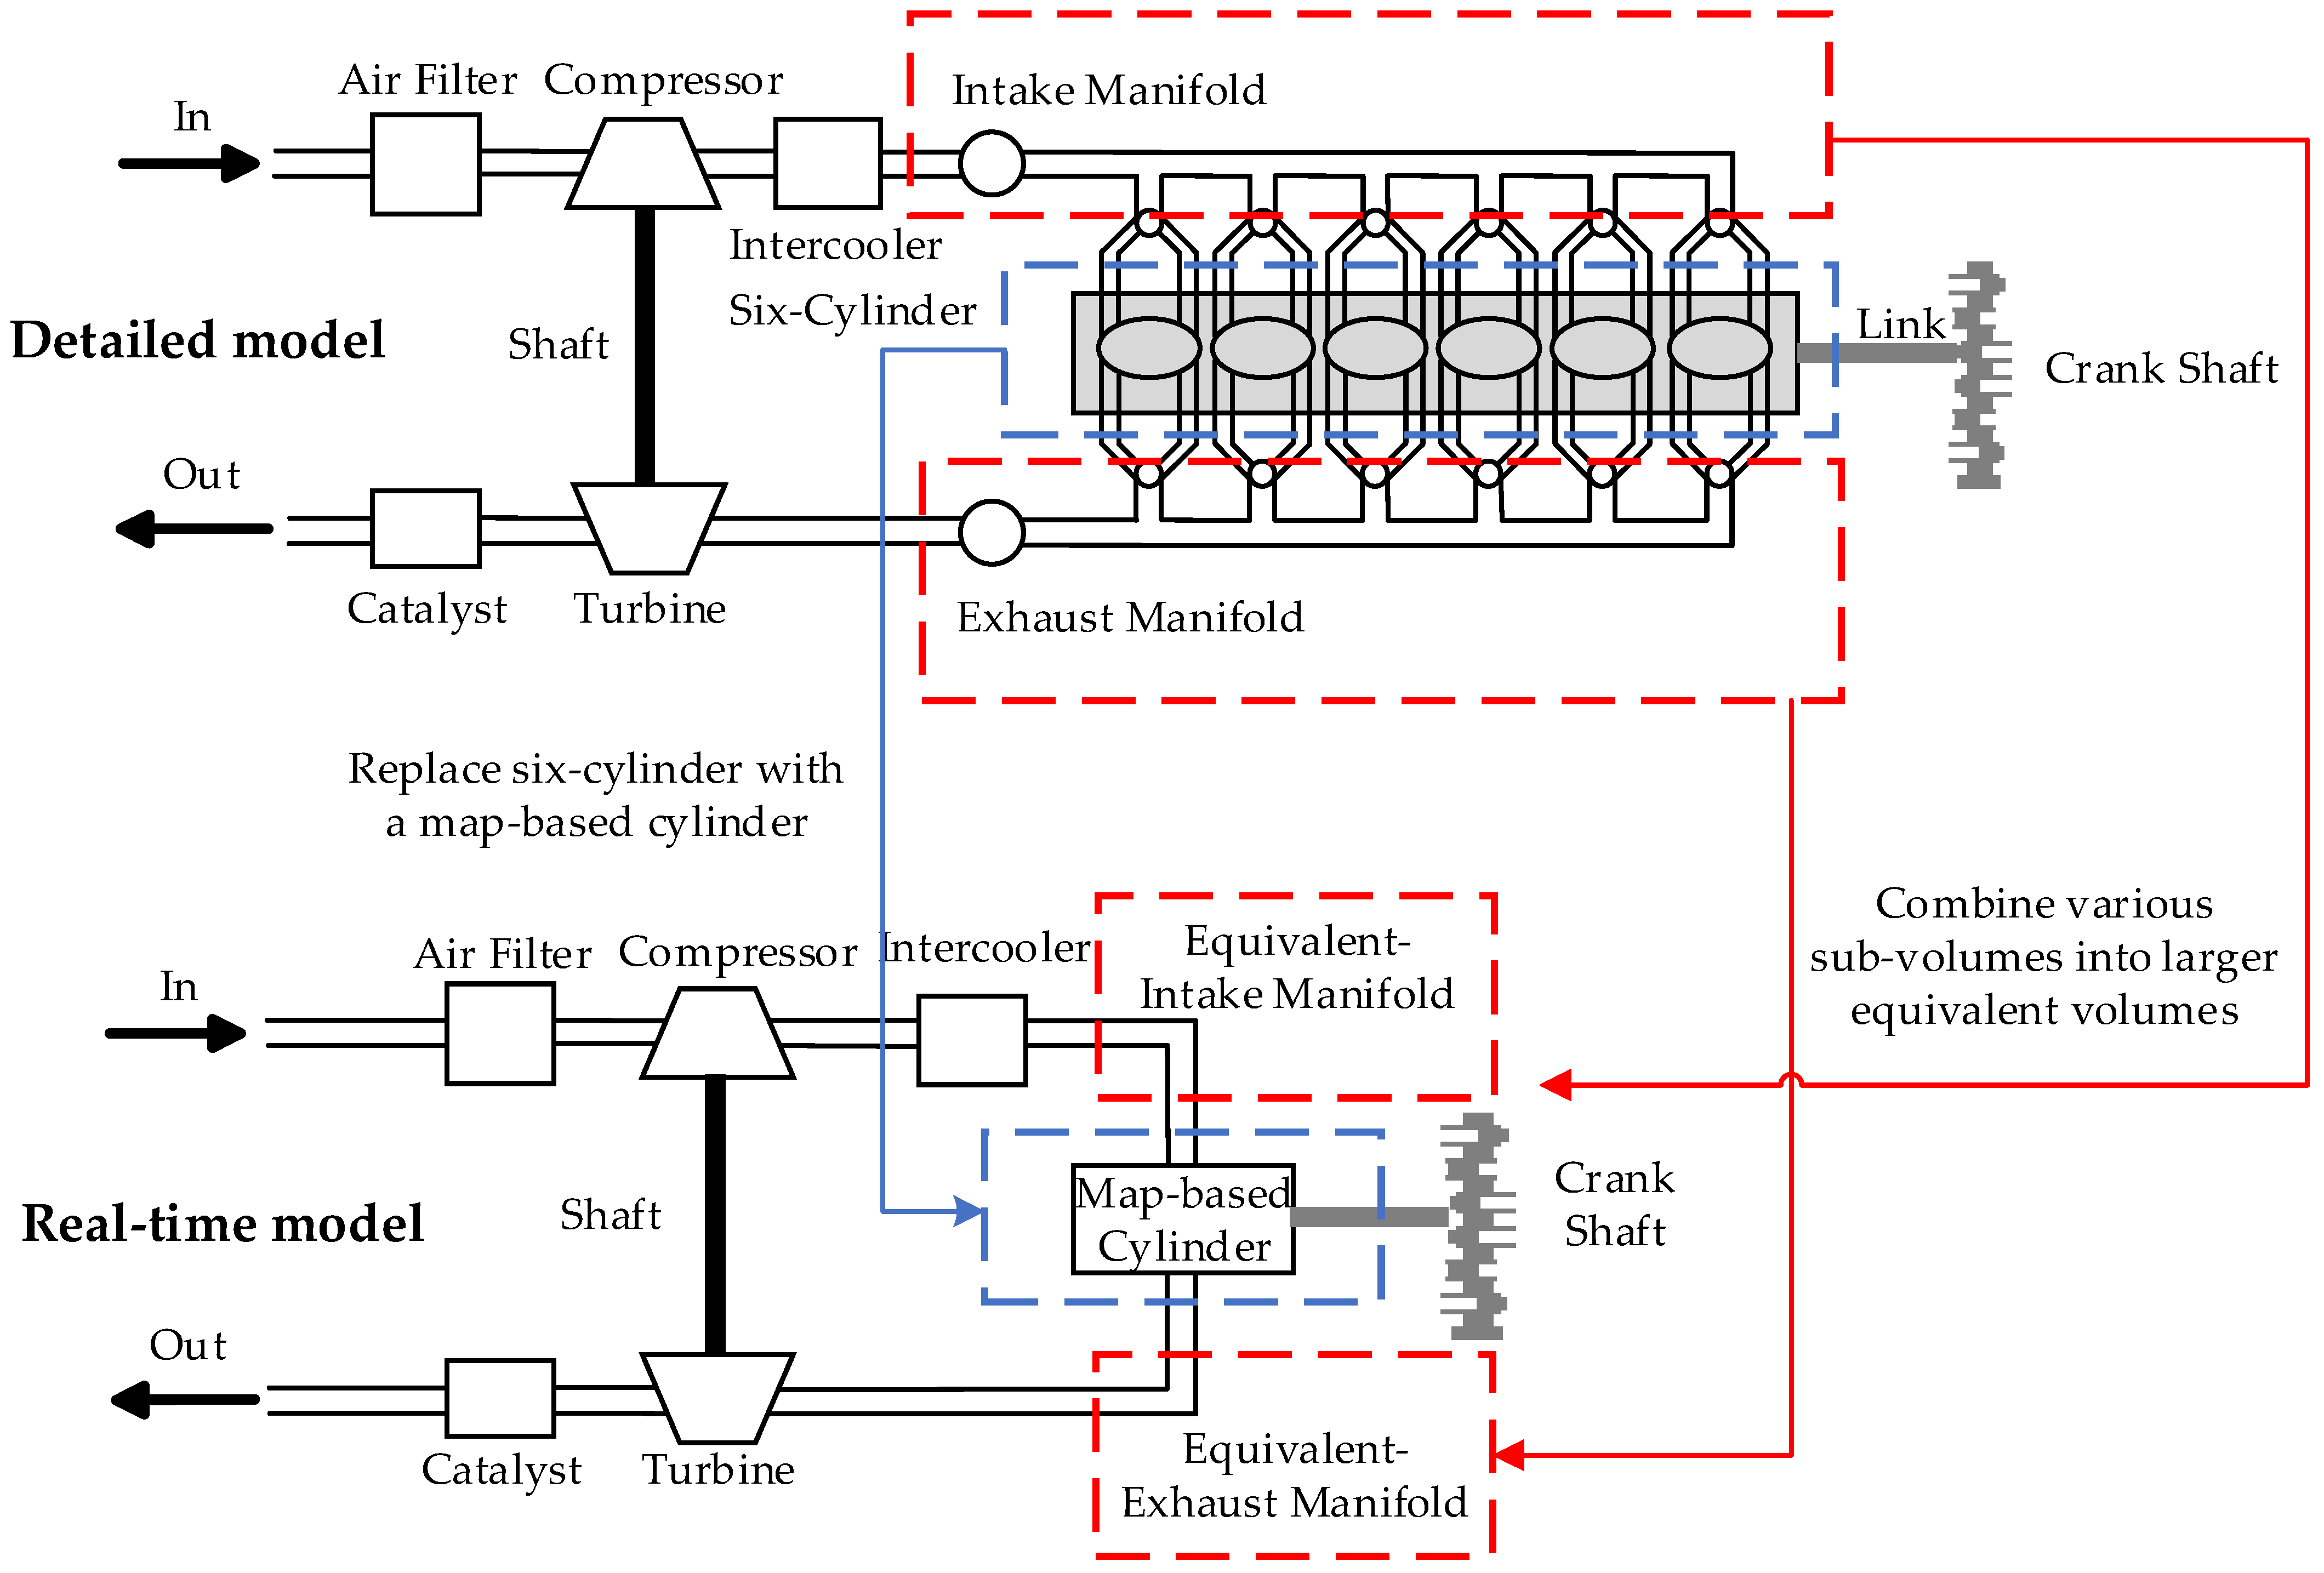
Although the detailed diesel engine model retains the transient process, it does not have a real-time property and cannot be used for transient applications such as degradation diagnosis and control system design [24]. Therefore, this study simplified the detailed model and improved its real-time performance while retaining some dynamic properties; the obtained model is shown in Figure 3.
The calculation speed is primarily slowed down by the complex computations involved in combustion, heat transfer, and fluid flow within pipelines [25]. Simplifying these can enhance real-time performance. For the intake and exhaust system, each sub-volume was combined into a larger equivalent volume. For cylinders, a single cylinder based on MAP was constructed by training a 6-input-3-output NN to replace the physics-based multi-cylinder model. The single cylinder characteristics were overall characterized by three variables: cylinder volumetric efficiency, indicator efficiency and waste energy fraction. Combined with the application scenario, the input variables were determined to be diesel engine speed, fuel injection volume, exhaust manifold pressure, intake manifold pressure, intake manifold temperature and fuel injection advance angle. The indicated efficiency can be calculated using the indicated average effective pressure and the waste energy fraction can be calculated using the exhaust temperature. Thus, the output variables were cylinder volume efficiency, indicated average effective pressure and exhaust temperature. The training and test datasets for NN training were generated from the physics-based detailed model through design of experiments (DOE), and a mapping relationship between the input and the output was obtained through NN training. The model effect was measured by mean absolute percentage error (MAPE), where the exhaust temperature was 5.8%, the indicated average effective pressure was 0.9% and the exhaust temperature was 3.8%. The NN fit well and could accurately represent the mapping relationships.

2.4.2. Model Verification

To ensure accuracy, the steady state, transient state and real-time performance of the real-time diesel engine were verified.
For the steady state, the load was set to 100%, and then torque at different speeds was recorded to obtain the external characteristic curve, effective fuel consumption rate and exhaust temperature. Compared with experimental data, the maximum relative errors were about 3%, less than the engineering error limit value of 5%. Therefore, the real-time model can accurately reflect the steady-state characteristics of the diesel engine.
For transient conditions, this was verified by comparing the step response of the torque. The engine rotated at 1500 r/min, and the fuel injection was increased from 30 mg to 70 mg in the second second. Compared to the detailed model, it had a shorter increase time, smaller overshoot amount and faster response speed. Meanwhile, it could converge to the same target value as the detailed model, with a steady-state error of less than 3%.
For real time, the running speed of the simulation, that is, real time, can be evaluated using the real-time factor α r e a l - t i m e [26], which is defined as Equation (4):
α r e a l - t i m e = t c a l c u l a t e d t r e a l
where t r e a l is the physical time of the engine cycle; t c a l c u l a t e d is the calculated time under the same engine cycle.
Only when the real-time factor is less than 1, that is, the calculation time is less than the real physical time, can the model be simulated in real time. The smaller the real-time factor, the shorter the time for the simulation model to converge to the target value under the same working conditions, the better the real-time performance.
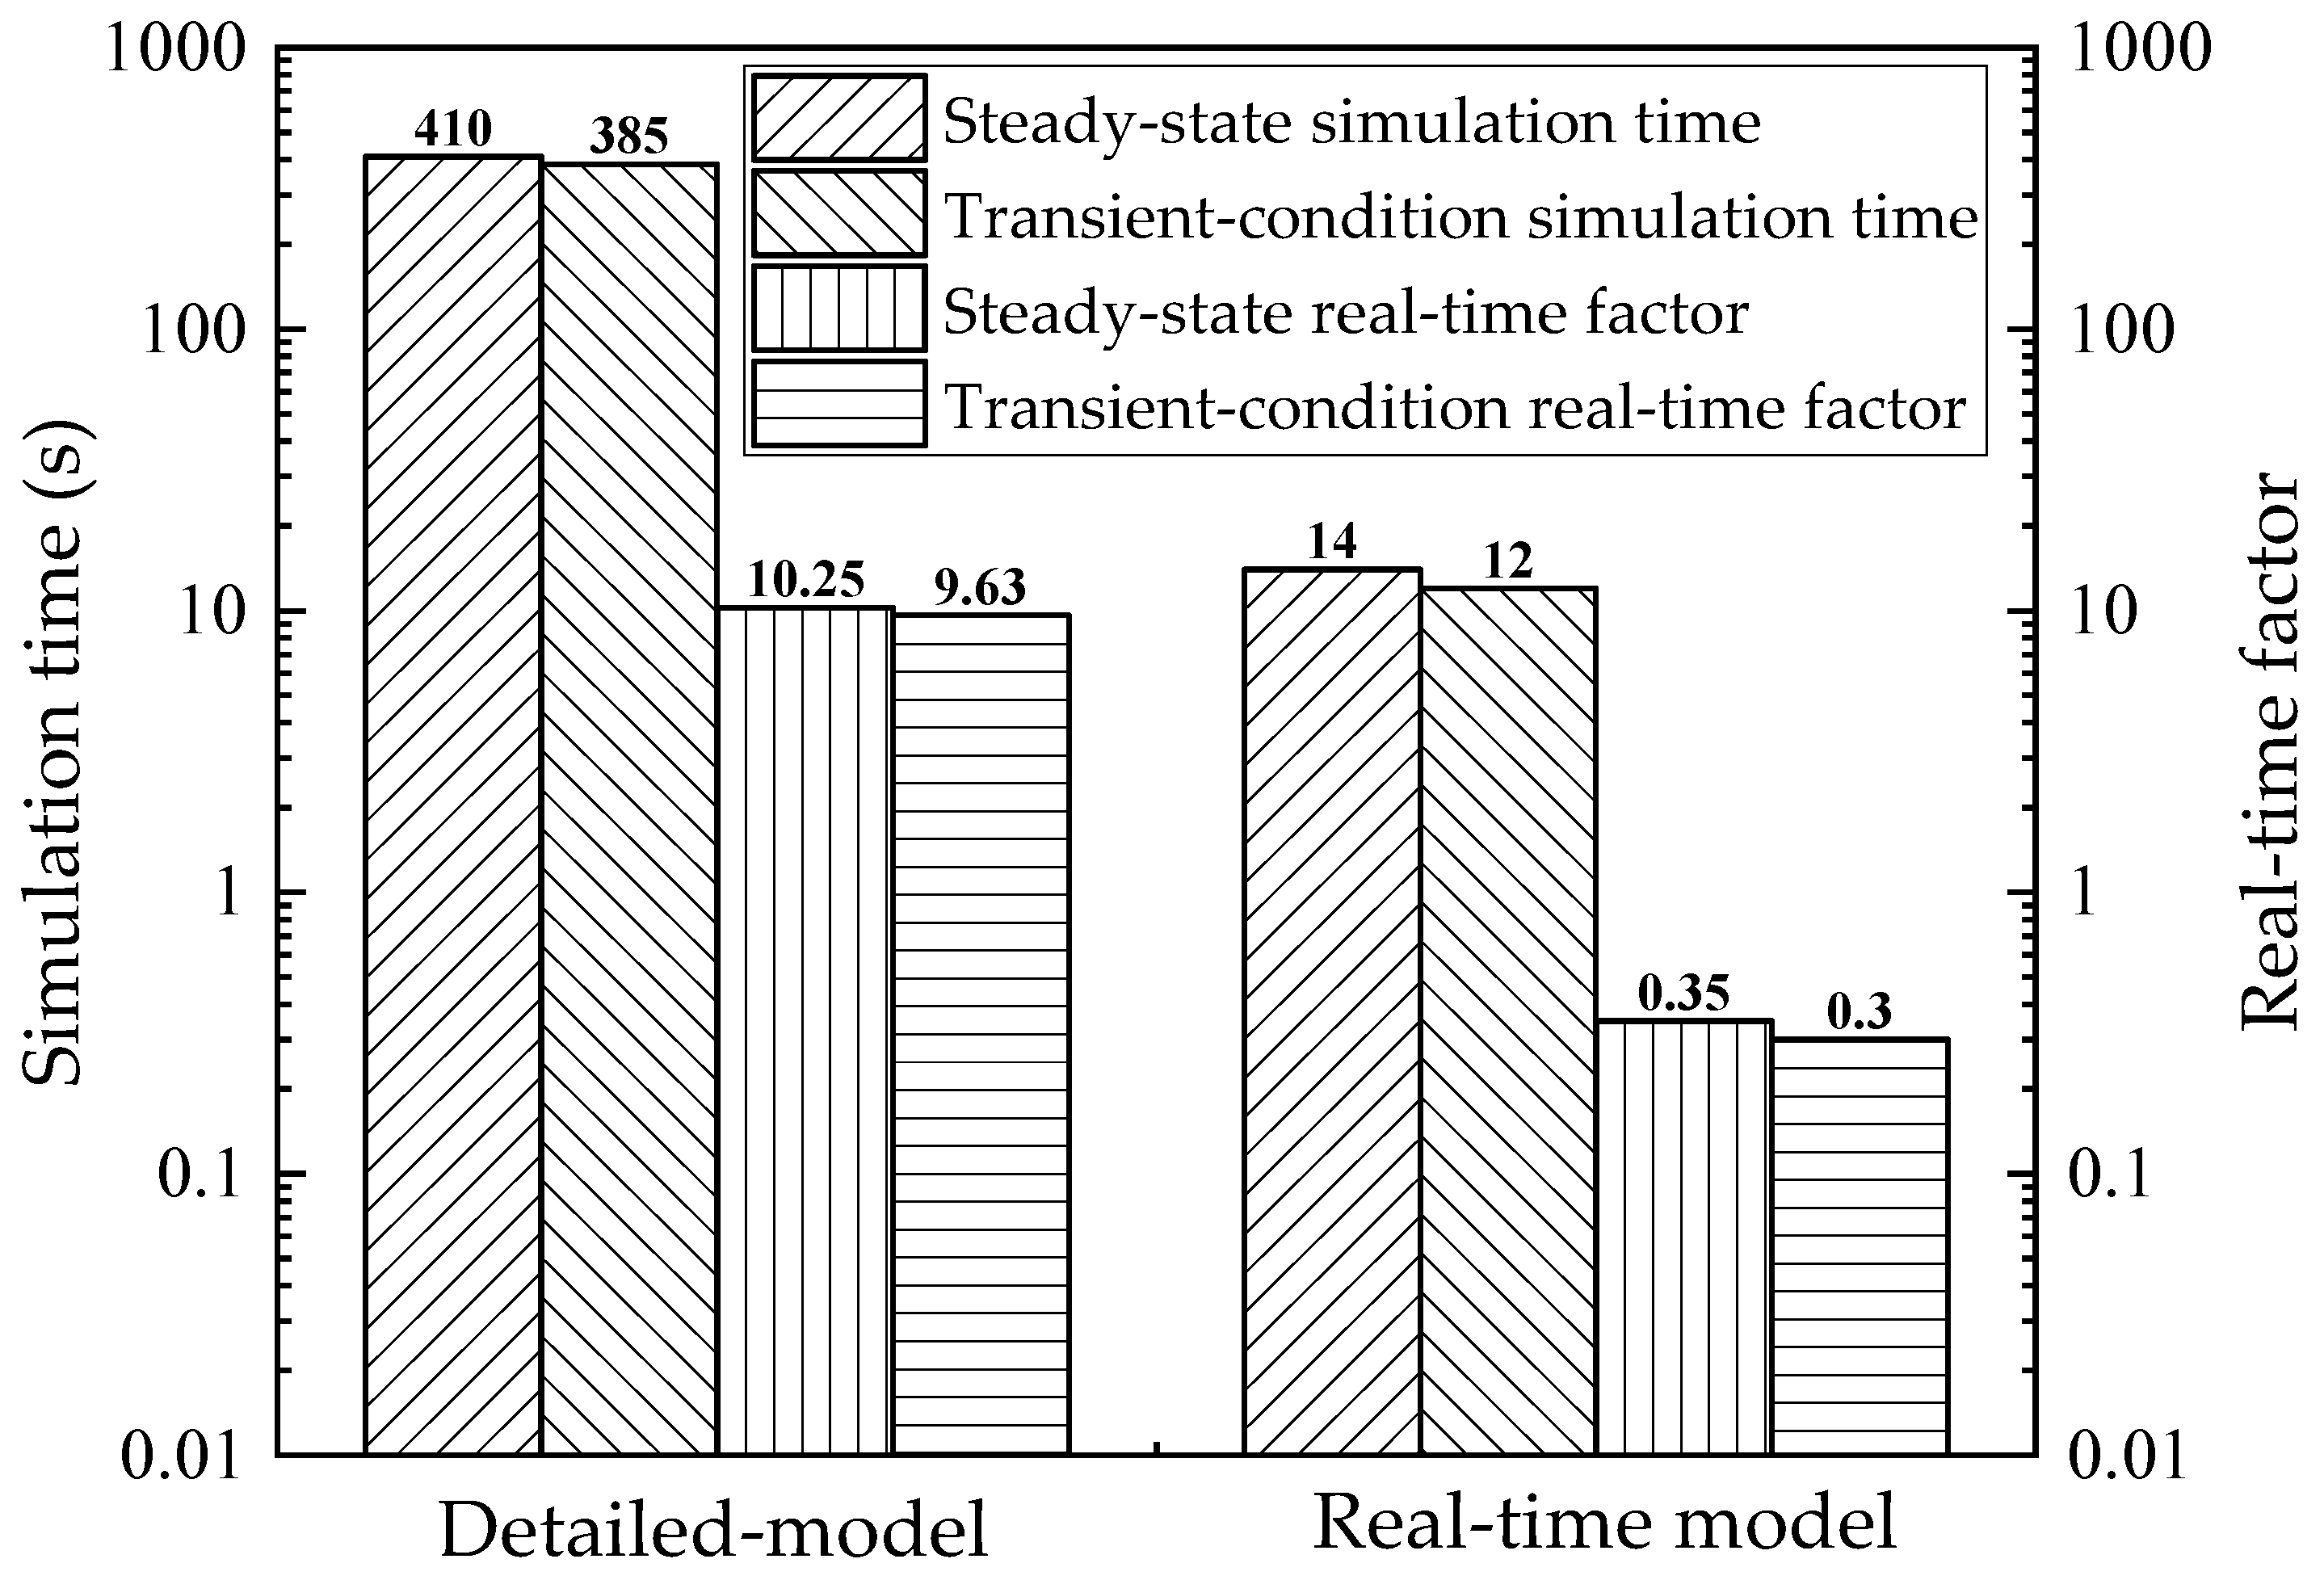
The steady-state and transient conditions of engines over 40 s were constructed. The engine speed is fixed under steady-state conditions and changes under transient conditions, as shown in Figure 4. The real-time factor and simulation time of the diesel engine model under the 40 s steady state/transient condition are shown in Figure 5.
The detailed model has no real-time performance because its real-time factor is greater than 1. The real-time model of the same system runs for only 12 s (real-time factor = 0.3). Its operating results under stable conditions were similar to those under transient conditions.
Based on the above performance verification and real-time verification of diesel engine under steady and transient conditions, it can be concluded that compared with the detailed model, the real-time diesel engine model has better real-time performance, and retains some of the dynamic characteristics of the diesel engine.

2.5. Rule-Based Hybrid System Operation Mode

The rule-based operation mode was designed to optimize power performance and fuel economy while preventing excessive battery discharge and overcharge. This rule-based control strategy will serve as a reference for evaluating the effectiveness of the power redistribution health management strategy under hybrid system degradation, discussed later. Specific rule-based settings are shown in Table 2.
Above, P r e q , P e _ m i n   a n d   P e _ m a x denote the required power and the minimum and maximum output power of the diesel engine in the high-efficiency range. S O C m i n , S O C m a x and S O C l o w denote the minimum SOC discharge value, maximum SOC charge value and SOC threshold for charging. v e is the speed threshold for non-electric-only modes; speeds beyond this will no longer operate in electric-only mode.

3. HEV Degradation Prognostic Method

This section details a method based on gray relation analysis (GRA) to evaluate the health status of the diesel–electric hybrid system in real time and detects degradation in advance before the sensor alarm. The signals that can be collected by the sensor from the actual vehicle are selected as feature signals. Given that different feature signals have varying sensitivities to degradation, the method of principal component analysis (PCA) is used to determine the weight of the feature signals. Finally, a count-based degradation confirmation method is employed to avoid false positives and missed detections.

3.1. GRA

It is crucial to apply statistical methods in the analysis of measurement results. GRA is a multifactor analysis method that evaluates the correlation between different sequences based on similarity of the sequence curve geometry [27]. The closer the geometry, the greater the gray correlation between them; contrariwise, the gray correlation decreases. GRA can be effectively applied to problems with multiple criteria [28], especially those whose relationships are complex. Balu Mahandiran S used Taguchi grey relational analysis to estimate multiple highly coupled optimal process parameters, significantly reducing the complexity of multi-parameter estimation while improving accuracy [29]. The diesel–electric hybrid system exhibits high coupling, non-linearity, and multiple power sources, making it suitable for gray relational analysis to assess the correlation between the operating state and the health status (normal condition) of the hybrid system. The correlation degree reflects the deviation between the operating state and the health status of the hybrid system; the smaller the correlation degree, the greater the deviation.
The steps of GRA include:
  • Set up a matrix of m × n data series to construct the evaluation index system, where n represents the number of samples and m represents the number of features;
  • Use the sequence from normal operation as the reference sequence and comparison standard;
  • Different feature signals often have different dimensions. Use normalization to scale the data to a uniform range, enabling easier comparison and processing across different features.
  • Calculate gray correlation coefficients one by one using Equation (5):
ξ i ( k ) = m i n i m i n k x 0 k x i k + ρ m a x i m a x k x 0 k x i k x 0 k x i k + ρ m a x i m a x k x 0 k x i k
where k = 1,2 , 3 , , m ; i = 1,2 , 3 , , n ; x 0 k x i k is the difference between the normalized reference coefficient and the corresponding actual coefficient; ρ is the differentiation coefficient, ρ ϵ 0,1 ; the smaller the value of ρ , the greater the difference in correlation coefficients, resulting in stronger discriminative ability. It is generally set to 0.5.
5.
Calculate the correlation degree one by one using Equation (6):
γ i = ω i 1 , ω i 2 , ω i m ξ i 1 ξ i 2 ξ i m
where ω i k represents the weight coefficient of the feature signal, which will be determined later by PCA.

3.2. Feature Signals Selection

As inputs for the health status assessment of the diesel–electric hybrid system, the selected feature signals must be those that can be collected by sensors on the actual vehicle, so that no additional signal sensors need to be added, which is more efficient and convenient. Based on common degradation types, the selected feature signals are listed in Table 3.

3.3. Weight Determination Based on PCA

PCA is a statistical technique used to examine, organize and classify datasets composed of numerous relevant variables to reduce data dimensionality while retaining most trends and patterns [30]. Through this process, the original variables are converted into a set of unrelated variables, called the principal component (PC). The PC can also be represented as a linear combination of the original variables. As mentioned in the previous section, health status assessment of the hybrid system based on GRA requires calculating correlation degrees. In most studies, all association coefficients were averaged to obtain the final correlation degree. However, since different feature signals in the hybrid system have varying sensitivities to degradation, directly averaging these values may lead to inaccurate correlation calculations. Therefore, this paper employed PCA to determine the weight values of feature signals in different dimensions.
The steps of PCA include:
  • Form a matrix from the raw data using Equation (7):
X = x 11 x 12 x 1 n x 21 x 22 x 2 n x m 1 x m 2 x m n = X 1 , X 2 , , X n
where X j = X 1 j X 2 j X m j , ( j = 1,2 , n ) , n represents the number of samples and m represents the number of features.
2.
Normalize the original data matrix to obtained a new data matrix A using Equation (8):
a i j = ( x i j x j ¯ ) h i j x j ¯ = i = 1 n x i j n h j = i = 1 n x i j x j ¯ 2 n 1
3.
Then, the correlation coefficient matrix C of the original data is calculated, which is the covariance matrix of the normalized data, as shown in Equation (9):
C = A T A m 1
4.
Compute the eigenvalues λj using Equation (10):
C λ j I = 0
5.
The cumulative contribution rate M is calculated by Equation (11) and the number of principal components k will be determined by it, such that the cumulative contribution M reaches the predetermined value
M = j = 1 k λ j j = 1 n λ j
6.
Sort the eigenvalues in descending order, and select the eigenvector corresponding to the largest eigenvalue as the weight.

3.4. Count-Based Degradation Confirmation

Feature signals are collected by sensors in the actual vehicle, but abrupt changes, errors, and noise in the feature signals and signal acquisition devices can affect degradation diagnosis results. A count-based degradation confirmation method monitors the degradation state and accumulates counts. When the count reaches a set threshold, degradation is confirmed. This method takes into account both the duration and interval of degradation [31], excluding short-lived, potentially false-positive, transient degradation and thereby improving the accuracy of degradation diagnosis. The schematic of the count-based degradation confirmation method is shown in Figure 6.
According to the automotive functional safety standard ISO 26262 [32], the upper limit (UL) of the counter was set to 127, and the lower limit (LL) was set to −128. The rules are as follows: the counter increments by 1 when the current degradation state is 1 (indicating a degradation) and decrements by 1 when the degradation state is 0 (indicating no degradation). The counter stops accumulating once the limits are reached. Degradation confirmation is based on the relationship between the counter value and the set threshold.

4. PHM Strategy Study

This section investigates a degradation tolerance strategy for power redistribution under system degradation based on LSTM-MPC. After degradation is identified, the strategy predicts system state changes and implements predictive maintenance. Specifically, once a system degradation is confirmed, the strategy enhances target vehicle speed tracking. This comes at the cost of some overall energy consumption. It also ensures the battery operates within its optimal temperature range. Additionally, the diesel engine is kept within its emission temperature limits. This allows the hybrid system to continue operating with degradation within the controlled range.

4.1. MPC

4.1.1. Principle

Model Predictive Control (MPC) is a predictive control method that calculates control inputs by repeatedly solving an online optimization problem [33]. By predicting future responses, it optimizes real-time control inputs, enabling the control system to act proactively. The MPC process can be divided into four steps: reference trajectory, predictive model, rolling optimization, and feedback correction [34]. The online control flow of MPC is shown in Figure 7.
  • Reference trajectory: The desired output value of the controlled object, that is, the target value;
  • Predictive model: Changes in the system in a relatively short time domain can be predicted, making the control system prospective. The dynamic characteristics of the controlled object can be retained to reduce sharp changes in the output of the controlled object in the control process, reduce overshoot, and ensure the subsequent effect of the target.
  • Rolling optimization: Within a limited prediction horizon, the optimal control sequence is obtained that minimizes the objective function while satisfying constraints. Only the first step is applied, then the horizon shifts forward by one step, repeating the process for rolling optimization.
  • Feedback correction: To reduce the impact of prediction errors and other disturbances, corrections are made by comparing the actual values with the predicted values, improving the system’s robustness.
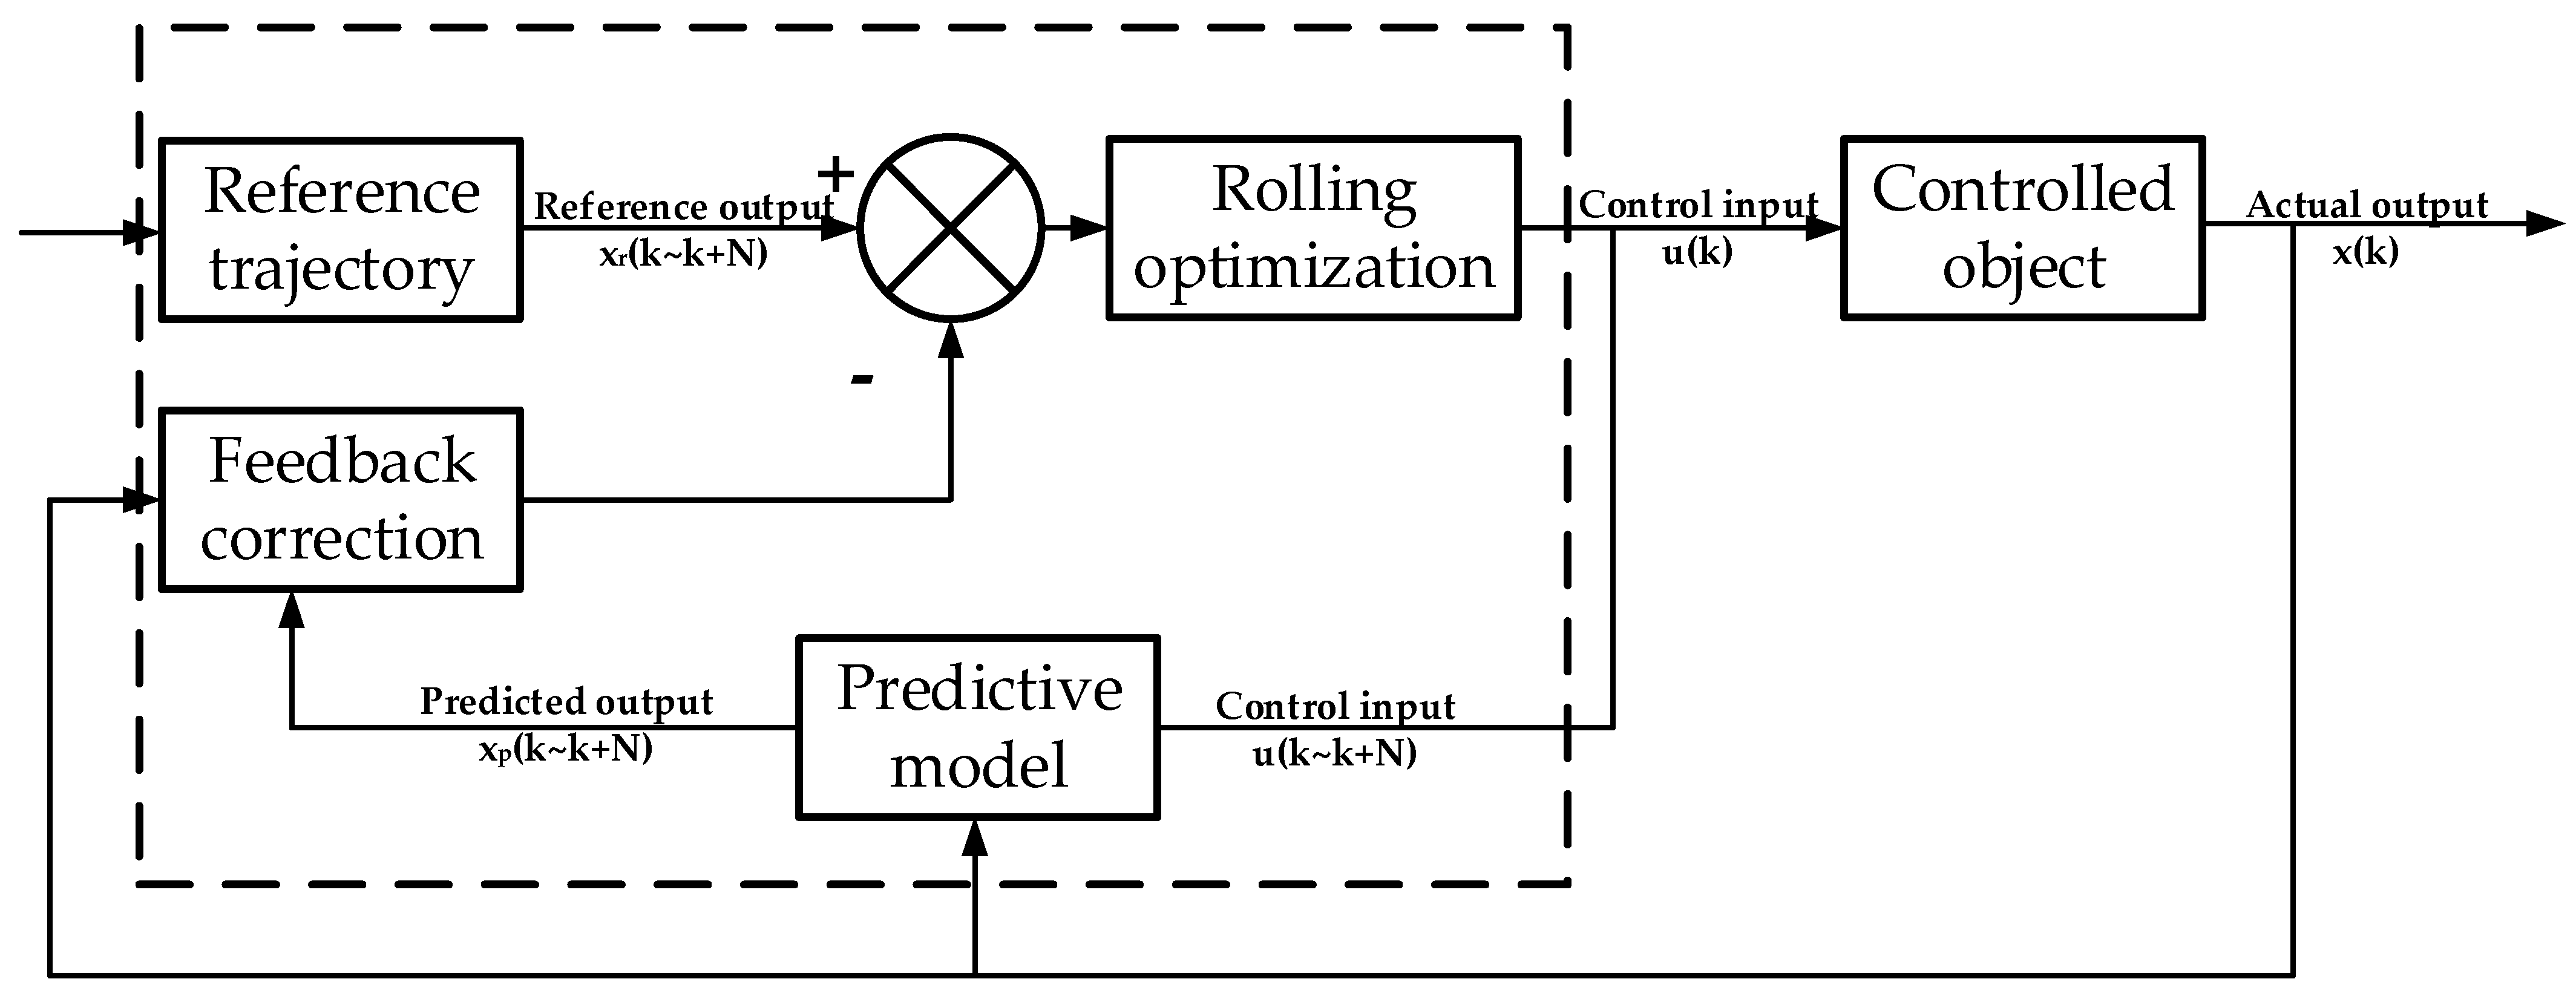
Figure 7. Online control flow of MPC.
Energies 17 05413 g007
The schematic diagram of MPC is shown in Figure 8 [35].
Assuming the current time is k , the predictive model uses the current input at time k and historical data to obtain the optimal control sequence for the future time horizon k + t p . Only the first control input u p ( k + 1 ) from the optimal sequence is applied to the controlled object, while the remaining inputs are discarded. The optimization process is then repeated at the next sampling time. At time k , the system’s optimization objective is represented by Equation (12):
m i n J k = t = k k + t p L ( x ( t ) , u ( t ) )
where J k is the cost function, t p is the prediction horizon, x ( t ) is the state variable at time t, and u ( t ) is the control input at time t.
The constraints can be expressed by Equation (13):
x m i n ( t ) x ( t ) x m a x ( t ) u m i n ( t ) u ( t ) u m a x ( t ) k t t p
where x m i n ( t ) and x m a x ( t ) are the lower and upper limits of the state variable at time t , respectively, and u m i n ( t ) and u m a x ( t ) are the lower and upper limits of the control input at time t, respectively.

4.1.2. Problem Construction

This section sets the optimization objectives and constraints for the hybrid system’s MPC-based optimization problem, with the predictive model discussed in the next section.
If the system continues with a rule-based control strategy after a degradation, it may fail to follow the target vehicle speed, increase overall energy consumption, exceed diesel engine exhaust temperature limits, or cause the battery to operate outside its optimal temperature range. To address these issues, the objectives are minimizing speed tracking error (improving performance) and minimizing energy consumption (enhancing efficiency). Constraints include diesel exhaust temperature, battery temperature (thermal load), and other physical limits like battery SOC. At time k, the system’s cost function within the prediction horizon is given by Equation (14):
J k = t = k k + t p ( k p ( v a ( u ( t ) , t ) v t ( t ) ) 2 + k e m f , e q u ( u ( t ) , t ) ) ˙
where t p is the prediction horizon; k p is the weight coefficient for vehicle speed deviation; k e is the weight coefficient for overall energy consumption; u ( t ) is the control input, which is the accelerator pedal position correction factor; v a ( u ( t ) , t ) and v t ( t ) are the actual vehicle speed and target vehicle speed, km/h; m f , e q u ( u ( t ) , t ) is the overall energy consumption in g/s.
The energy consumption includes both diesel fuel consumption and battery energy consumption. When calculating the actual total energy consumption, the battery energy consumption can be converted to fuel consumption using Equation (15), thereby obtaining the overall energy consumption:
m f , e q u ( u ( t ) , t ) = P b ( u ( t ) , t ) Q L η e η m η t ρ f + m f ˙ ( u ( t ) , t ) 10 3 · ρ f
where P b is the battery power in kW; Q L is the lower heating value of the fuel, 4.3 × 10⁴ kJ/kg; η e is the average efficiency of the diesel engine during power generation; η m is the average efficiency of the motor during power generation; η t is the mechanical transmission efficiency; ρ f is the fuel density, 850 kg/m3; m f ˙ is the fuel mass flow rate in g/s.
The constraints can be expressed by Equation (16):
T e T e _ m a x T b _ s m i n T b T b _ s m a x S O C m i n S O C S O C m a x P d e m = P e + P m
where T e and T e _ m a x are the exhaust temperature of the diesel engine and its limit, respectively; the limit is based on the specifications provided by the manufacturer; T b is the battery temperature, and T b _ s m i n , T b _ s m a x is the optimal operating temperature range, set to [15,35]; S O C m i n and S O C m a x are the upper and lower thresholds of the SOC of the battery, set to 0.36% and 0.6%, respectively; P d e m , P e and P m are the total demanded power, diesel engine power, and motor power, respectively.

4.2. Prediction Model Based on LSTM

Due to the high coupling, nonlinearity, and multiple power sources in the diesel–electric hybrid system, the physical model cannot meet real-time performance requirements. Therefore, the data-driven model was used for certain parameters to balance the accuracy and real-time performance of the predictive model. The predictive model was pre-trained using offline data and then applied using MPC.
The control objective is the tracking of the target vehicle speed, making a time series model the most suitable choice. Time series models predict future changes within a limited time using current inputs and historical data. Recurrent Neural Networks (RNN) are commonly used in time series prediction, but issues such as gradient vanishing and exploding have been encountered [36]. These issues are effectively mitigated by Long Short-Term Memory (LSTM) networks through the use of gating mechanisms, which improves the accuracy of speed or power predictions [37]. Therefore, LSTM was employed to develop the predictive model for certain parameters.
To avoid overly complex prediction models, the LSTM-based prediction model was established using only vehicle speed, diesel engine exhaust temperature, and battery temperature as outputs. For other battery parameters, such as main voltage, main current, and SOC, the established equivalent internal resistance model was used. This model, with its simple structure, is the most idealized equivalent circuit model. For other diesel engine performance parameters, the detailed physical model provided the full characteristics across all conditions. Parameters for normal or degraded conditions were obtained from these characteristic tables. Vehicle parameters were calculated using the established vehicle dynamics model. The inputs for the LSTM model were determined based on the study’s application scenario, in which an MPC-based power redistribution strategy is employed after a system degradation is confirmed. Considering the characteristics of the hybrid system, the inputs included health status evaluation results, vehicle mode, accelerator pedal position, battery power, actual speed, battery temperature, and diesel exhaust temperature. The future outputs were predicted in a rolling manner using historical and current input data. The model was trained for normal operation, battery degradation, diesel engine degradation, and combined degradation. The first 85% of the vehicle cycle was used as the training set, and the remaining 15% as the test set.
The mean absolute error (MAE) was chosen as the loss function [38], as shown in Equation (17). It was used to optimize the parameters of the prediction model and assess its accuracy. MAE considers the error for each sample and maintains consistent sensitivity across different ranges of output.
L ( Y , f ( x ) ) = 1 n i = 1 n f ( x ) Y
where Y denotes the true value; f ( x ) denotes the predicted value; n denotes the number of samples.
The NN structure of the LSTM is shown in Figure 9. The input layer consists of a 7-dimensional feature vector, with a time window of 20 steps for rolling predictions. The input layer is followed by an LSTM layer, which is then connected to a dense layer with 30 neurons. Finally, an output layer with 9 neurons is connected, enabling multi-step outputs for the three feature vectors.
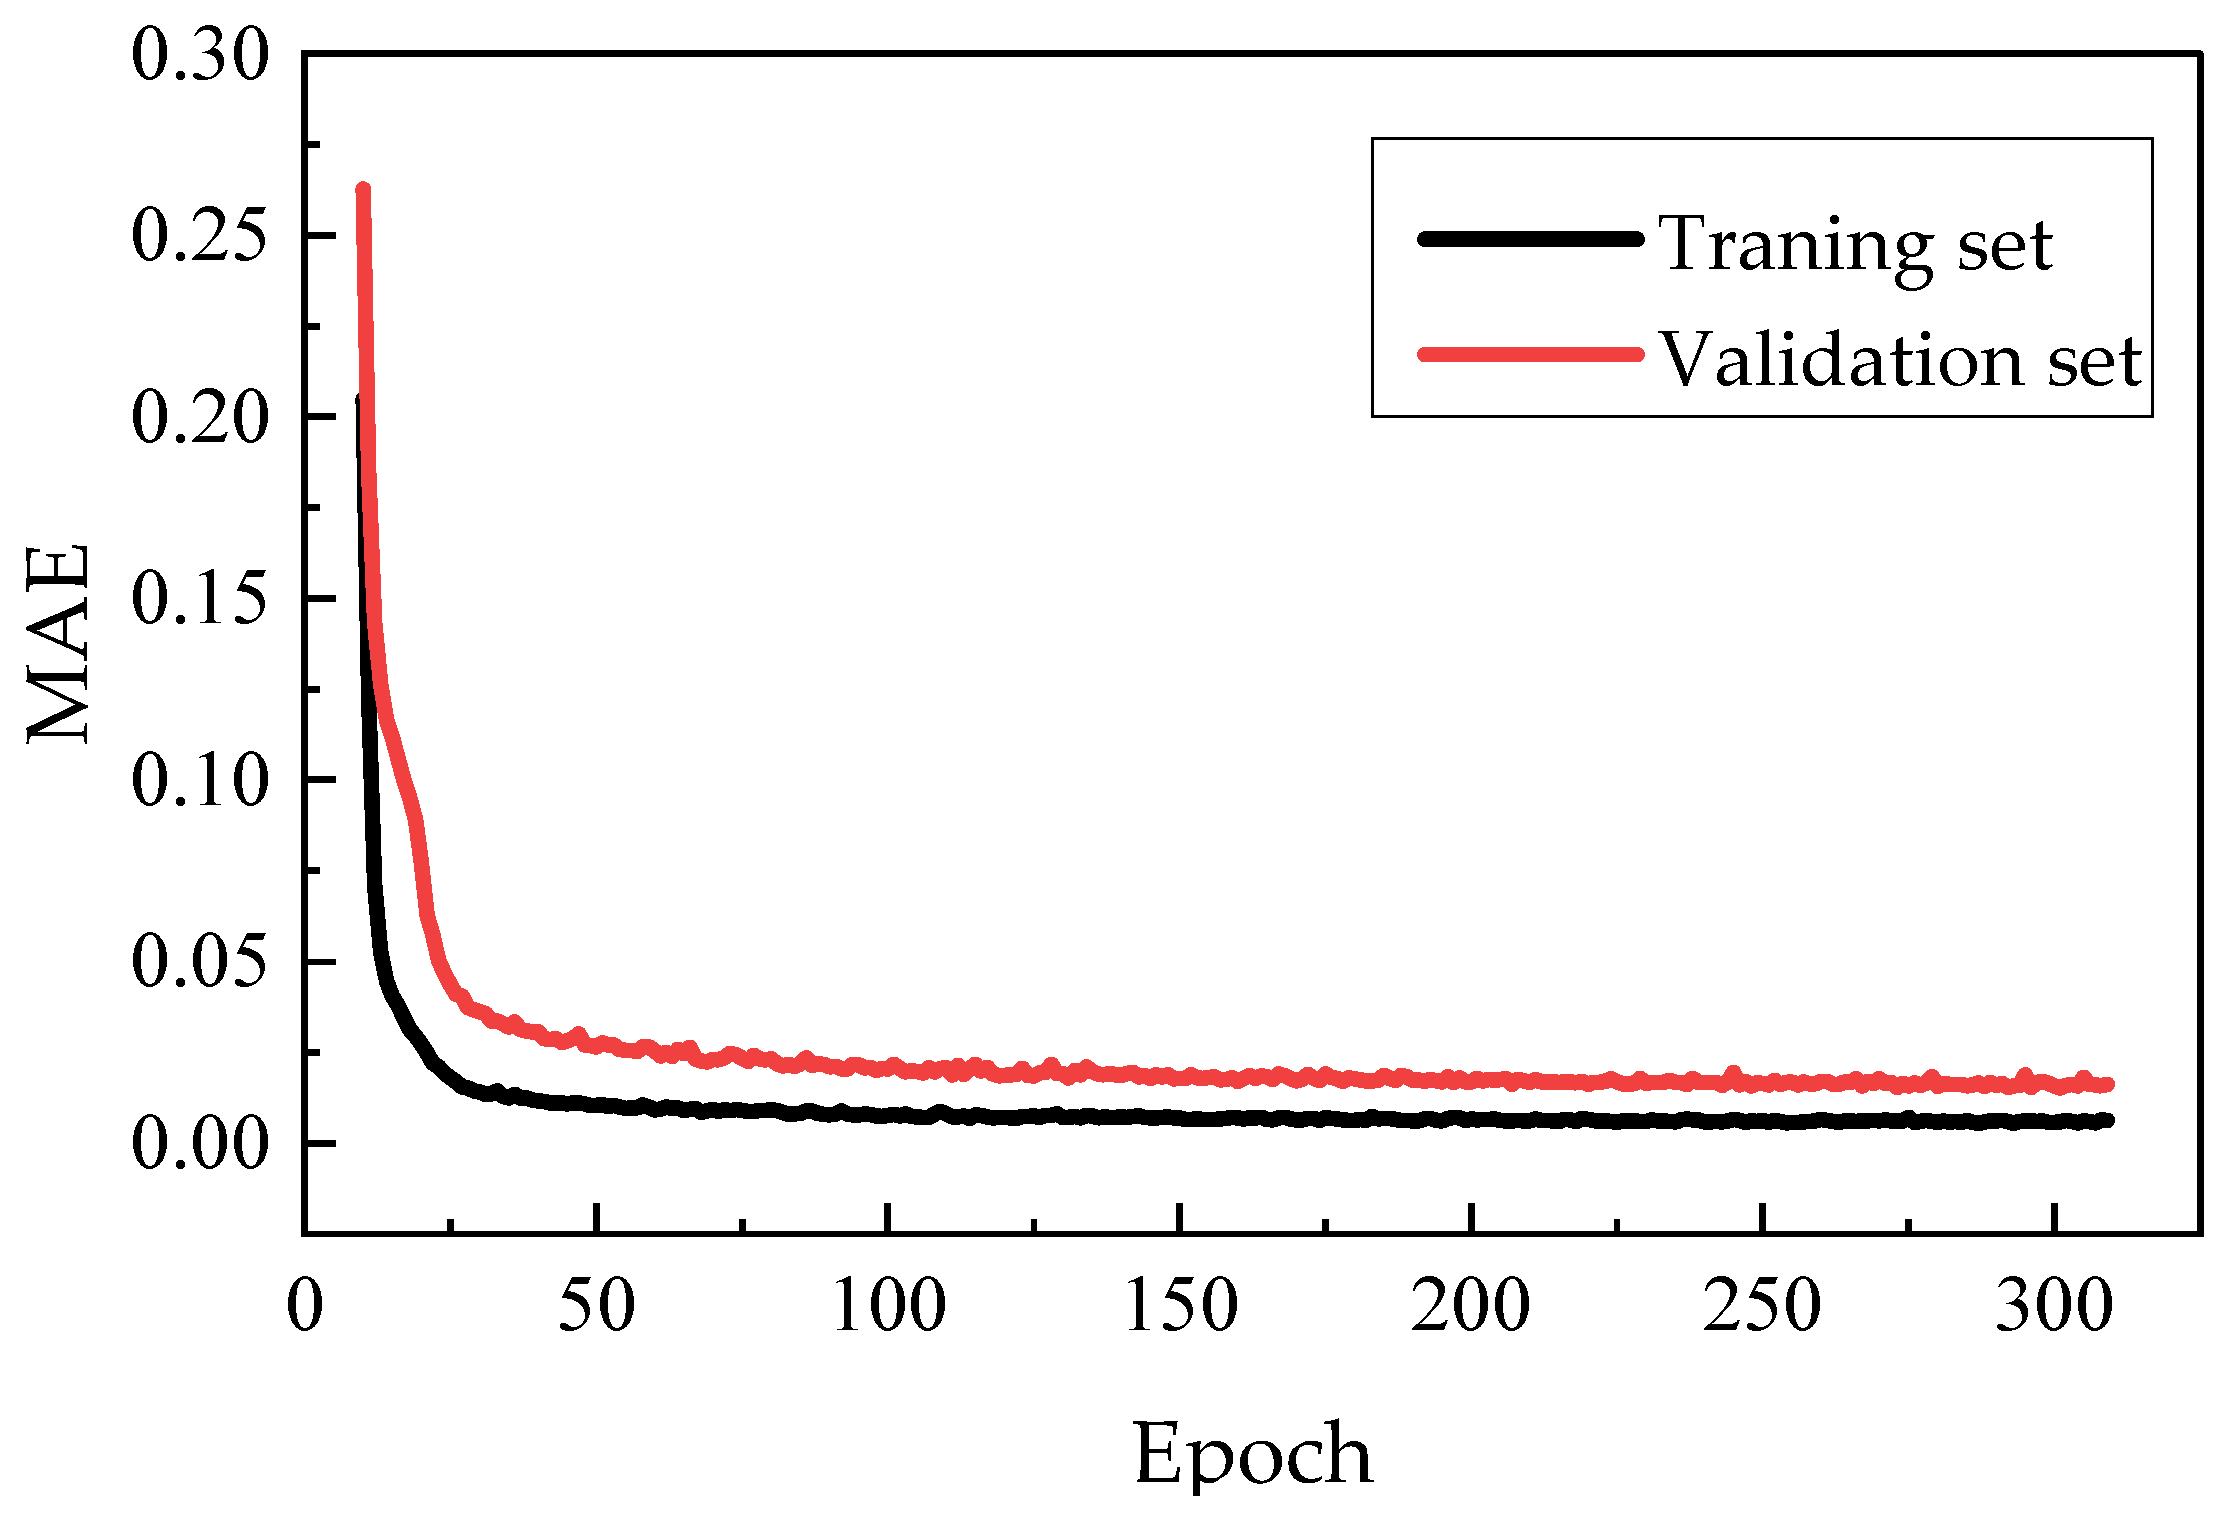
The model was trained for 500 epochs, and the loss function trend are shown in Figure 10. The figure shows that after 70 epochs, both curves start to converge, with the final MAE for both being less than 0.016, indicating accurate predictions. The validation data, which were not used in training, reflect the model’s generalization capability.

4.3. Simulation of PHM

To reduce testing costs and validate the effectiveness of PHM, simulations were conducted. The simulation model follows the target driving cycle to mimic actual vehicle operation, with the China Typical Urban Driving Cycle (CTUDC) cycle chosen as the test work condition. Degradation signals are injected at a certain point in the cycle to simulate real-world degradation. Given the complexity of the hybrid system and the variety of potential degradation, the focus was on common degradation in the main power sources—the battery and diesel engine—to validate the PHM framework.

Simulation Process

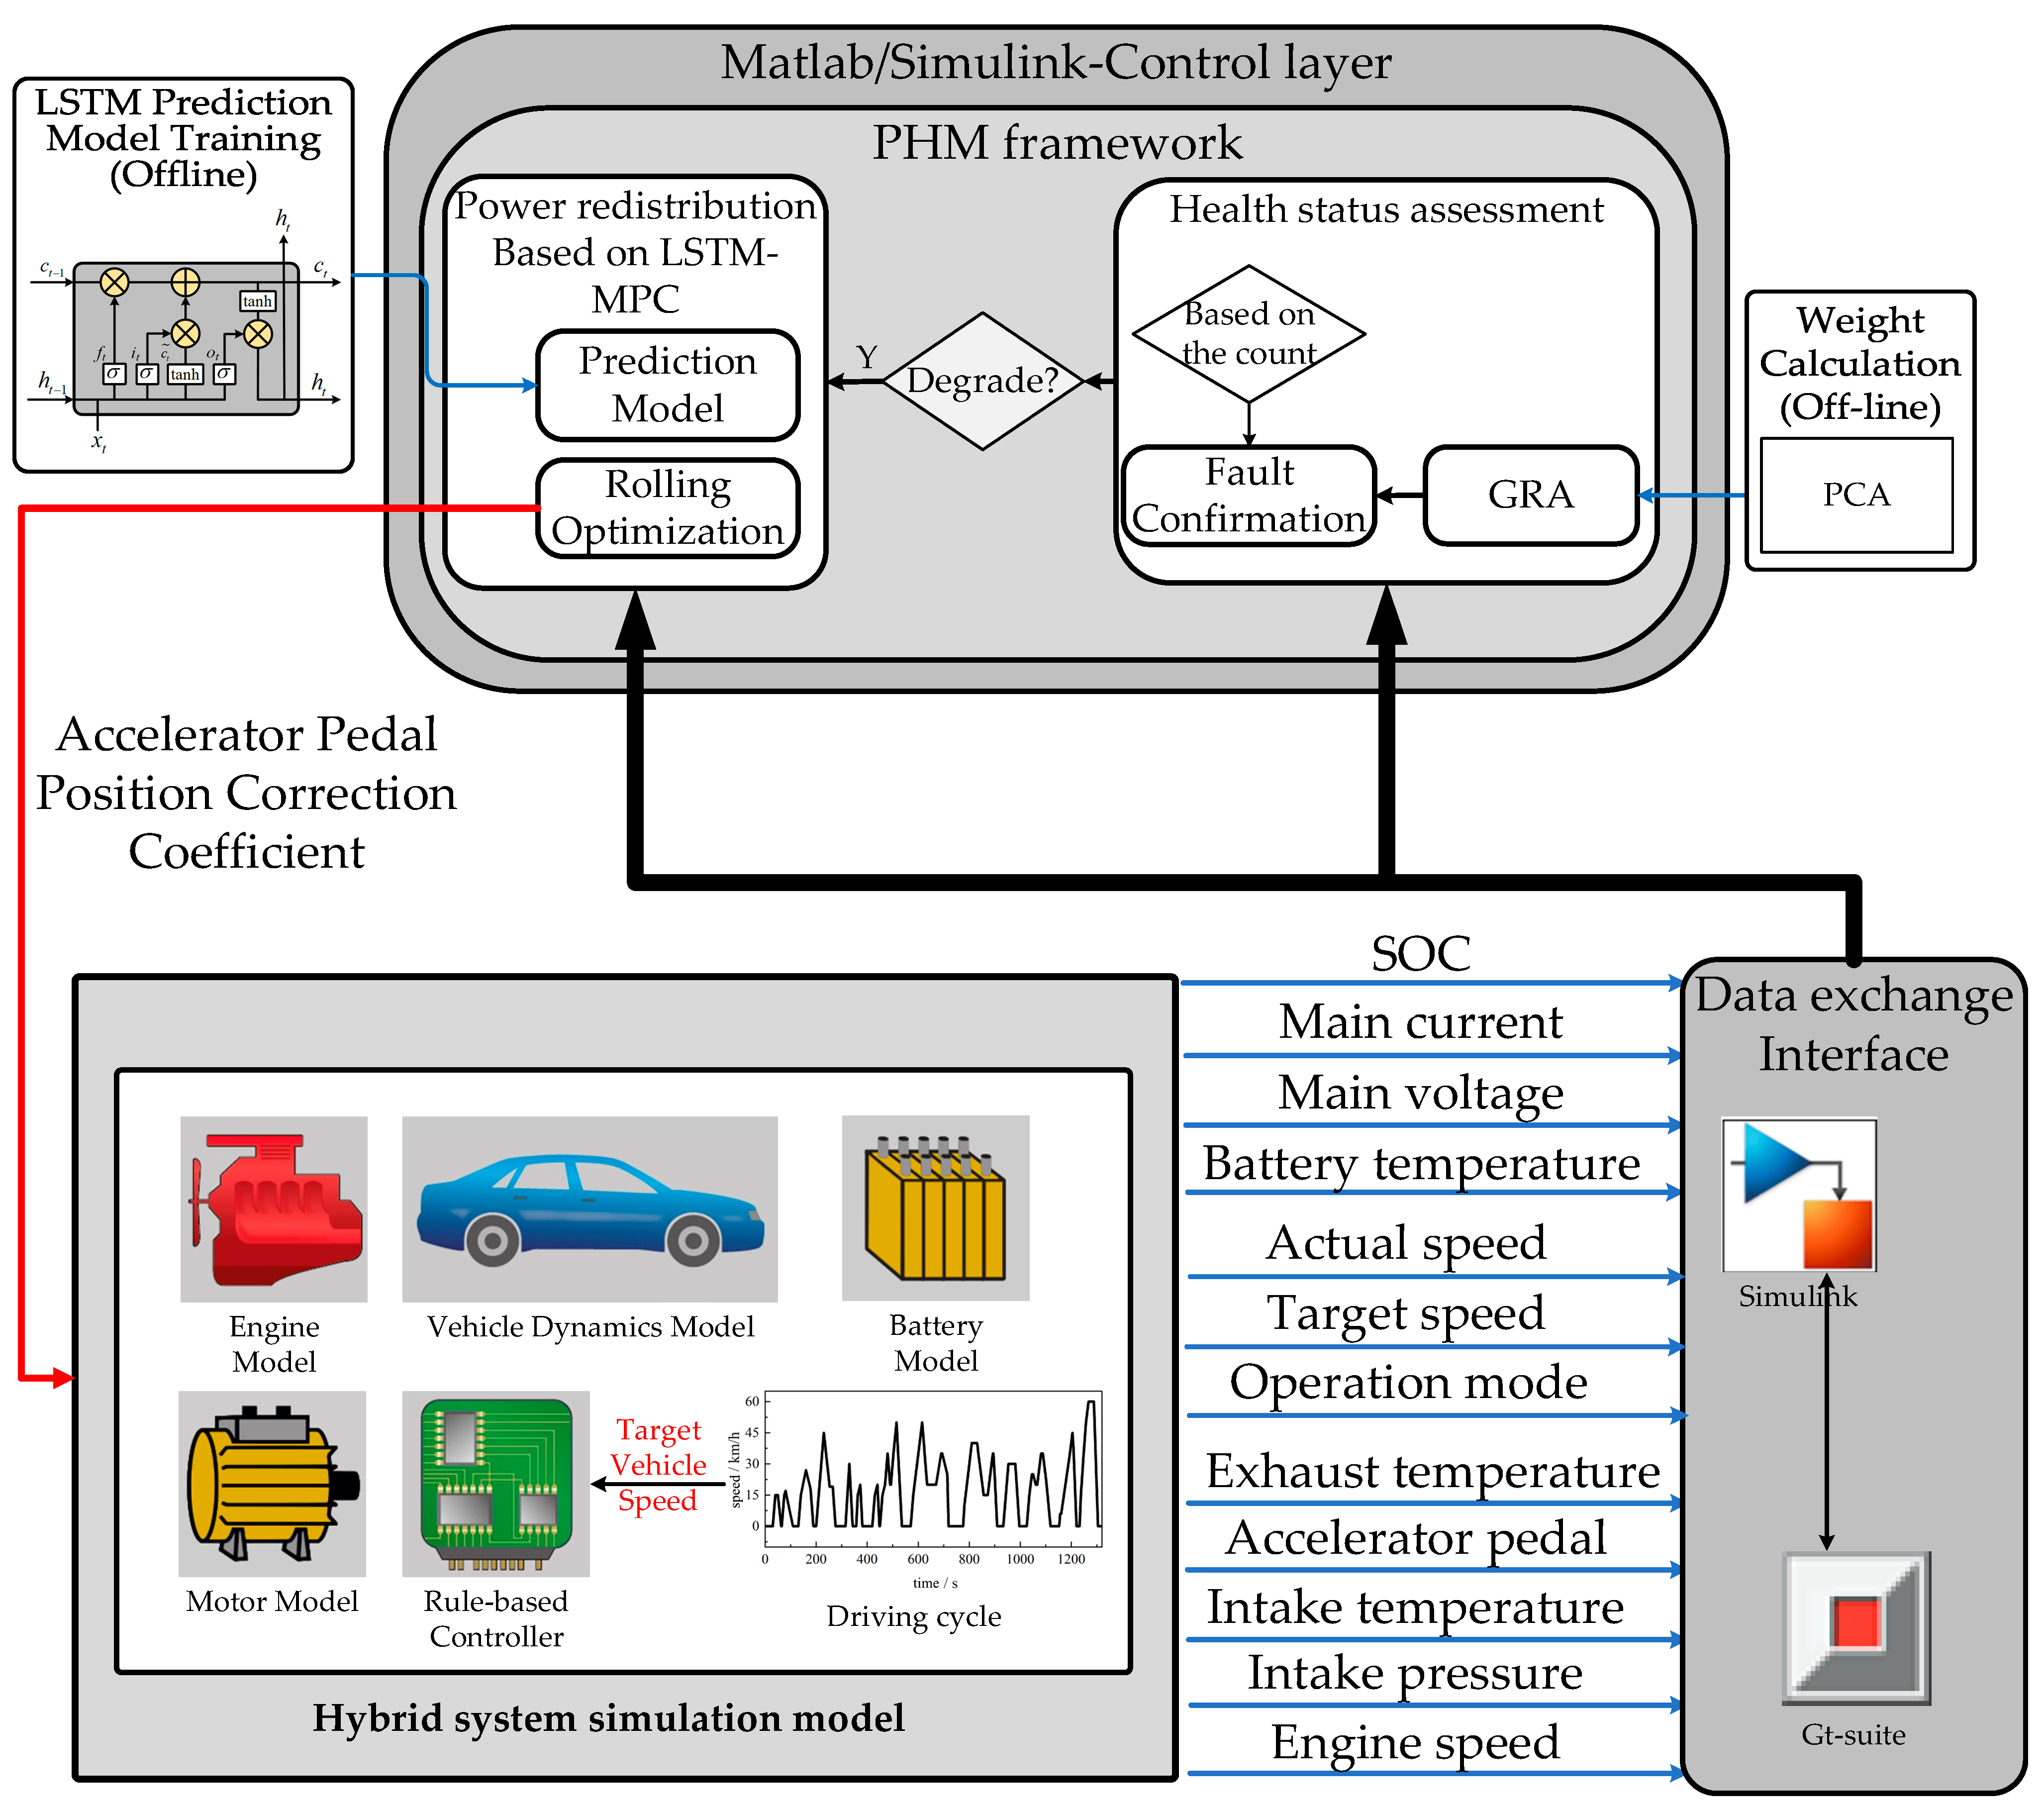
The framework for the simulation process is illustrated in Figure 11. It consisted of three components: the hybrid system simulation model built in GT-SUITE, the data exchange interface, and the PHM framework deployed in MATLAB/Simulink. The hybrid system simulation model, which is the controlled object, represents the P2 diesel–electric hybrid system developed in this study. This model includes the diesel engine, battery, motor, vehicle dynamics, driving cycle, and rule-based vehicle controller models. During normal operation, the rule-based vehicle controller adjusts the system to follow the target vehicle speed. The data exchange interface handles receiving, sending, and storing feature signals from both historical and current moments during the co-simulation. These feature signals include diesel engine parameters such as intake temperature, intake pressure, exhaust temperature, engine speed, and accelerator pedal position; battery parameters like SOC, main voltage, main current, and battery temperature; and vehicle parameters such as target speed, actual speed, and operating mode. The PHM framework in MATLAB/Simulink includes system health status assessment using GRA-PCA and LSTM-MPC for power redistribution. If a degradation occurs, the control strategy is adjusted, modifying the accelerator pedal position to redistribute power, allowing the system to function within its limits despite the degradation. Weights for health assessment are set using PCA, and the predictive model for power redistribution is a pre-trained and tested LSTM model.
The workflow is as follows:
  • The control layer first receives feature signals from the model. It continuously calculates the system’s health index to assess the system state. Degradation is identified using a counting-based method, where a degradation label is generated: 0 indicates no degradation, and 1 indicates a degradation;
  • When the system health index starts to decline, the LSTM-MPC-based power redistribution strategy kicks in. It receives feature signals and pre-calculates the accelerator pedal position correction coefficient. Upon degradation confirmation, this correction coefficient is used to adjust the accelerator pedal position, allowing the system to operate with the degradation;
  • If no degradation is detected, the system continues to operate using the rule-based control strategy.

5. Result and Discussion

This section sets up three cases to verify the PHM framework.

5.1. Degradation Case Setup

Diesel engine degradation includes issues with the fuel system, cooling system, lubrication system, and intake/exhaust systems [39]. Among these, blockages in the air intake system and the intercooler can affect air intake volume and temperature. Since air intake is crucial for engine power and sufficient combustion, an intake system degradation was chosen. In the established simulation model, this degradation was simulated by increasing the friction coefficient in the intake duct and reducing both the intercooler duct diameter and heat exchange efficiency.
Power battery degradation includes short circuits, module issues, charge/discharge problems, and battery management system failures [40,41]. Individual cell degradation is often caused by extreme conditions like overheating, overcharging or puncturing, leading to increased resistance, excess heat, and capacity loss. In this study, an increase in internal resistance was used to simulate power battery degradation.

5.2. Weight Calculation (Off-Line)

The simulation model ran under the CTUDC cycle. Feature signal data were collected from both normal and degraded hybrid system cycles to create sample sets. PCA was then used to obtain the feature signal weights for different modes, as shown in Figure 12. To ensure accurate health assessment, only the correlation coefficients of relevant feature signals should be weighted and summed for each mode, avoiding the influence of normal feature signals on the overall health evaluation. For electric-only mode, only select the feature signals related to the battery and those that directly reflect system dynamics: main voltage, main current, battery temperature, and the speed difference between actual and target vehicle speeds. This principle can be similarly applied to diesel-only mode and hybrid mode.

5.3. Performance Under Different Degradation Cases

The 1228 s to 1332 s segment in the CTUDC cycle was selected as the target work condition. This period covers various operating modes, as shown in Figure 13. The vehicle starts from a stop, then the battery gradually increases the speed. The diesel engine and battery together raise the speed to 60 km/h. The diesel engine then maintains this speed, and finally, the vehicle slows down to a stop for regenerative braking.

5.3.1. Battery Degradation

At 1234 s, a battery degradation was simulated by increasing the battery’s internal resistance, as shown in Figure 14. Figure 14a illustrates that after the degradation was introduced at 1234 s, the battery’s internal resistance increased, leading to a drop in output power and a rise in battery temperature. This caused the vehicle’s speed difference to increase. As the target speed continued to rise, the battery’s condition deviated further from normal, and the speed difference continued to grow. At 1245 s, the degradation label was set to 1, confirming the degradation. At this point, the hybrid system switched control strategies, applying the LSTM-MPC-based power redistribution strategy. As mentioned earlier, this method aims to minimize speed differences and overall energy consumption while meeting constraints such as keeping the battery temperature within its optimal range, limiting the exhaust temperature of the diesel engine, and maintaining the battery SOC within a normal range. With the LSTM-MPC-based power redistribution strategy, the hybrid system switched to hybrid mode 5 s earlier compared to when the degradation occurred. Figure 14b shows that after the system switched to hybrid mode, the vehicle was still in a rapid acceleration phase, demanding high power. To prevent the battery from exceeding its optimal operating temperature, the battery kept running at lower power output. Meanwhile, the engine increased its power output to compensate for the battery’s reduced power, gradually reducing the speed difference until the vehicle could follow the target speed. After 1270 s, the vehicle maintained a steady speed of 60 km/h, with the engine driving the vehicle alone as the power demand decreased compared to the acceleration phase. Figure 14c illustrates the constrained signals during the optimization process, including battery temperature, SOC, and engine exhaust temperature. In the case of battery degradation, the LSTM-MPC-based power redistribution strategy kept the battery temperature within its optimal range, unlike the rule-based control strategy. The engine also remained within its exhaust temperature limits. Since the engine took on more power output due to the battery degradation, the battery energy consumption decreased, resulting in a higher SOC compared to the degradation condition, which helped prevent excessive battery discharge during the degradation.
The optimization targets include both speed tracking and overall vehicle energy consumption. To clearly illustrate the engine’s operating points and fuel consumption under battery degradation conditions, the engine’s operating points were plotted on its universal characteristic curve, as shown in Figure 15. The figure shows that under battery degradation, when the rule-based control strategy was maintained (degradation operating points), the hybrid system remained in the high-efficiency zone. However, due to the increased battery internal resistance, the power output became insufficient, leading to issues with speed tracking. Under the LSTM-MPC-based power redistribution strategy (MPC operating points), the engine increased power output to compensate for the battery degradation, operating near the engine’s maximum efficiency line, which addressed the speed tracking issue.
To better evaluate the effectiveness of the health assessment and management methods for the hybrid system in terms of power performance, evaluation was conducted by calculating the average speed tracking error under degradation conditions, as shown in Equation (18):
δ v s ¯ = 1 n V a c t u a l V t a r g e t
where V a c t u a l is the actual vehicle speed; V t a r g e t is the target vehicle speed.
In terms of fuel efficiency, as previously described, the battery energy consumption was converted into equivalent fuel consumption based on the relationship between energy consumption and fuel usage, allowing for the calculation of the overall energy consumption, as shown in Table 4.
Overall, under battery degradation, compared to the rule-based control strategy, the LSTM-MPC-based power redistribution strategy reduced the speed following error by 11.7% during the test cycle, at the cost of a 4.3% increase in overall energy consumption. This approach effectively ensured the vehicle speed closely followed the target, while also keeping the battery within its optimal operating temperature range.

5.3.2. Engine Degradation

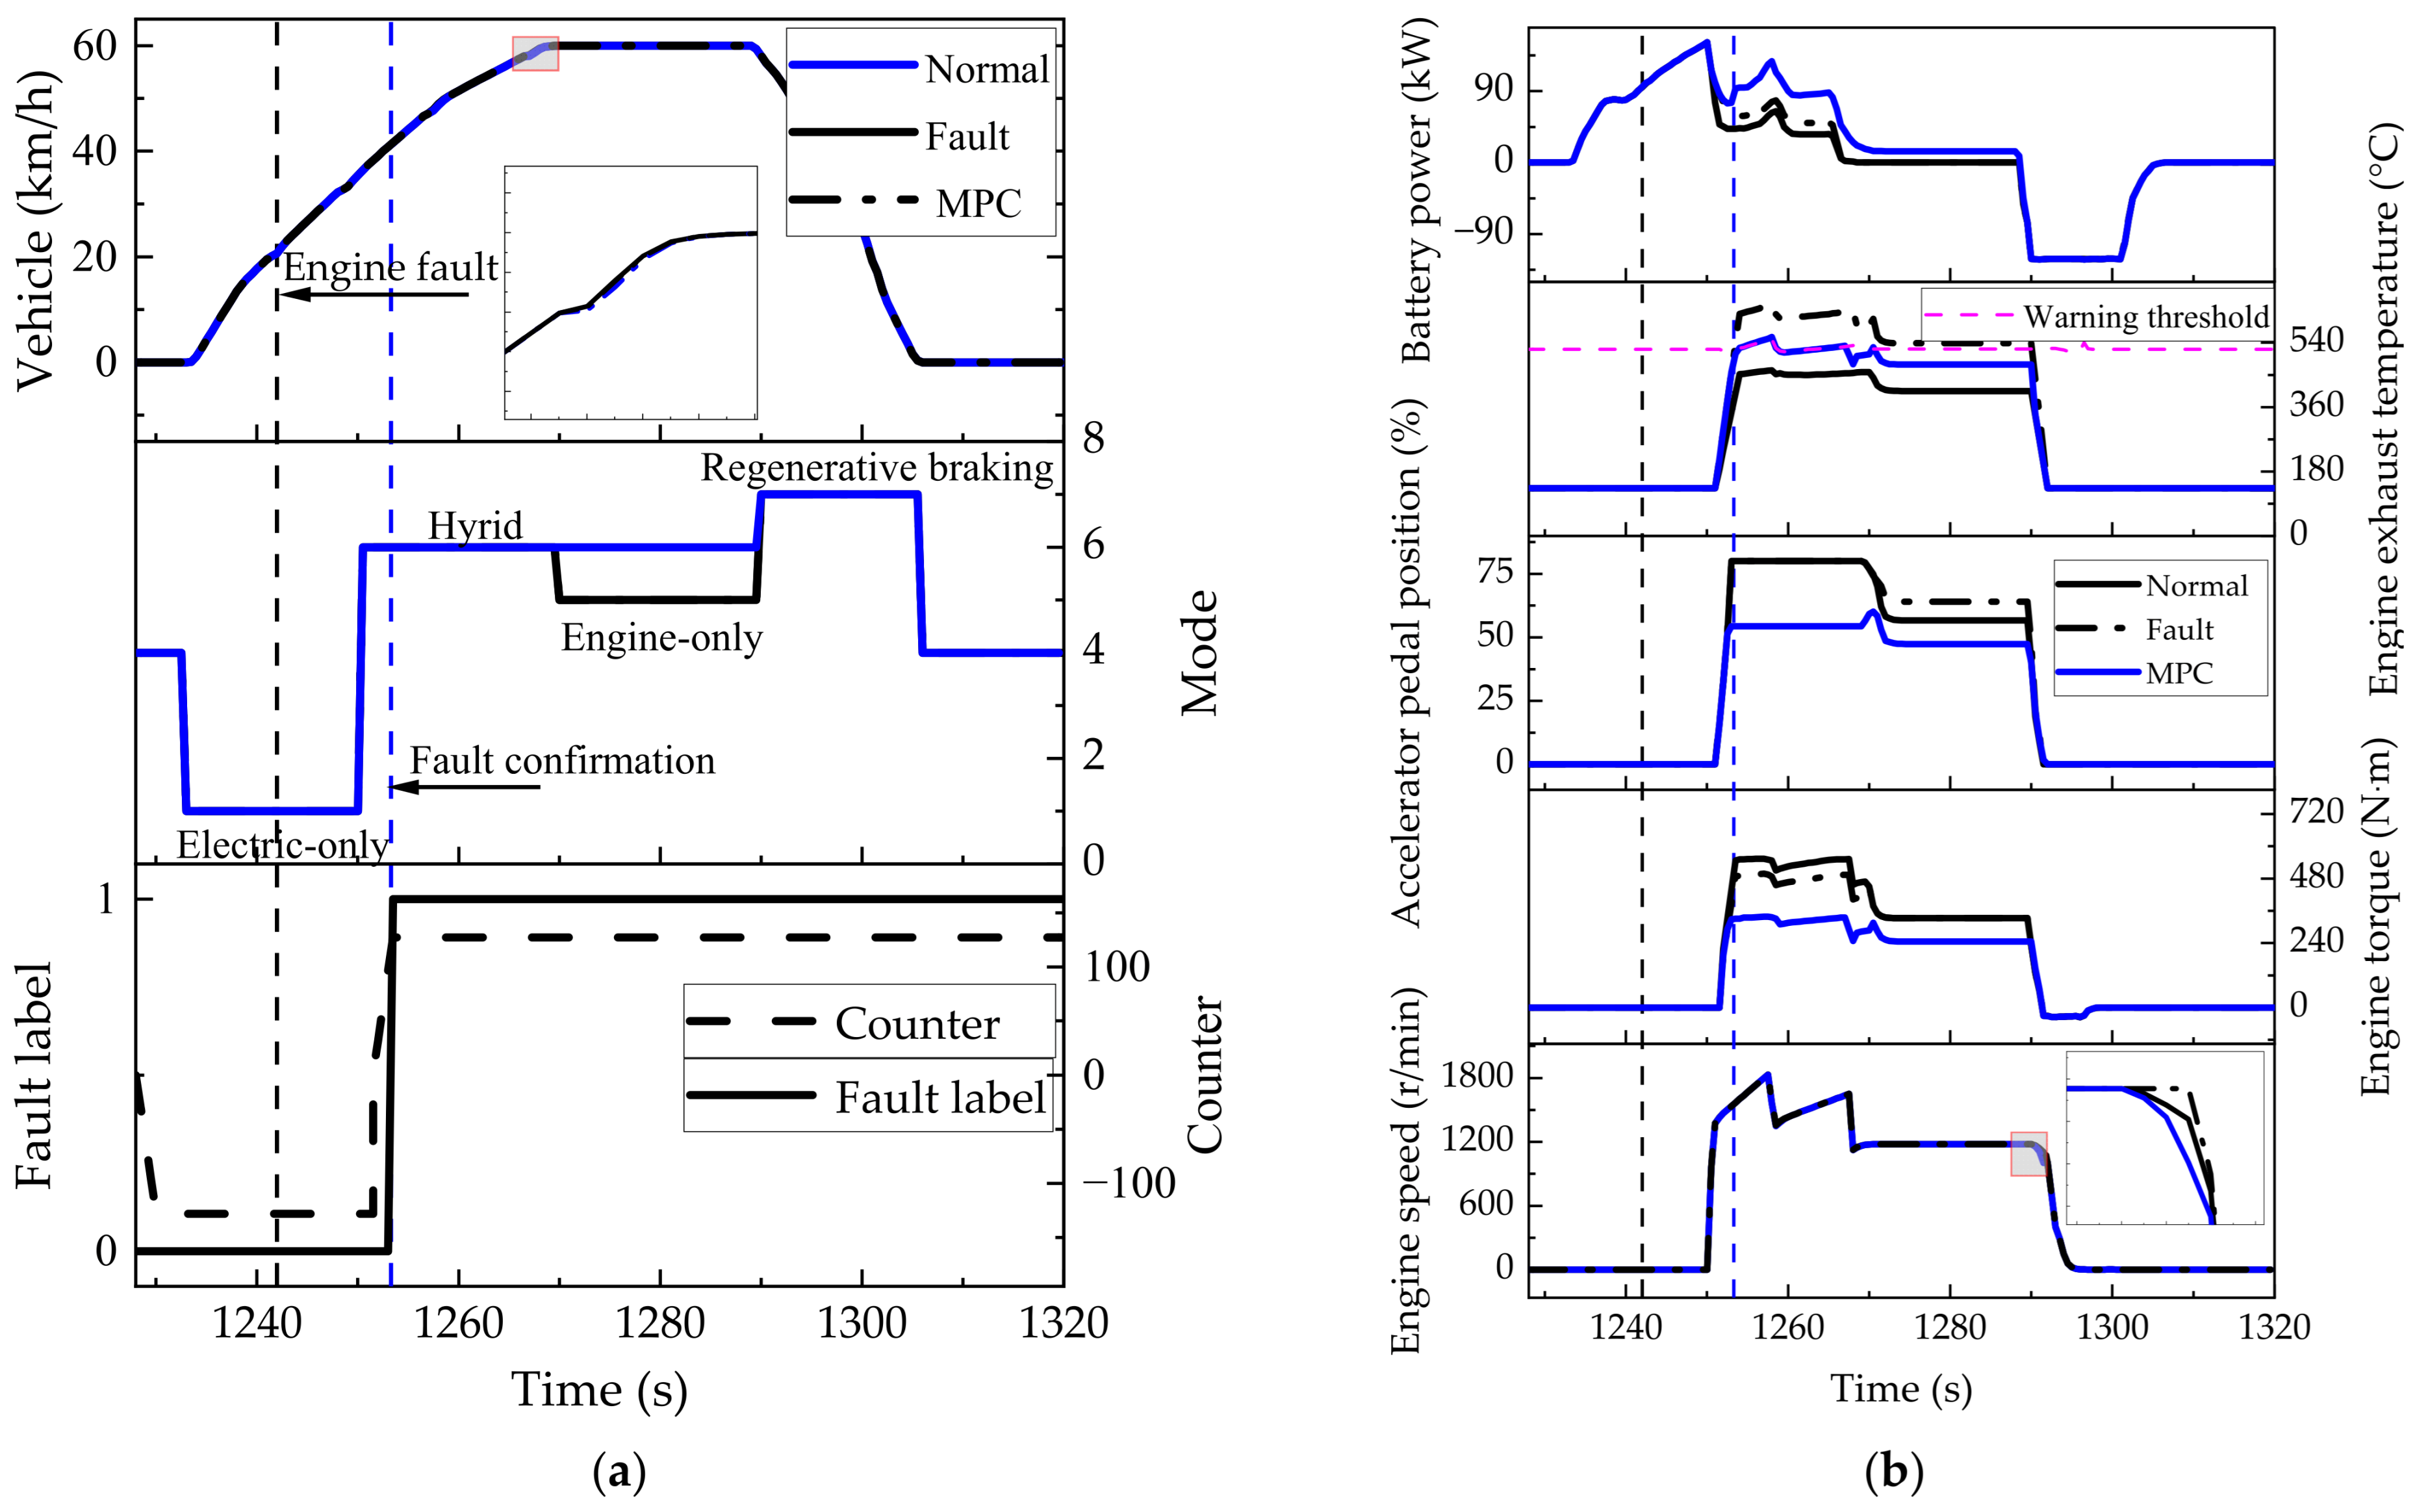
At 1242 s, an engine degradation was introduced by setting an engine intake system degradation, as shown in Figure 16. As shown in Figure 16a, after the engine degradation occurred, the vehicle was still able to follow the target speed. This was because the power deficit caused by the degradation could be fully compensated by the battery. Consequently, the mode shifted from engine-only to hybrid, allowing the target speed to be maintained. At 1255 s, the degradation label output 1, confirming the degradation, and the control strategy switched to the LSTM-MPC-based power redistribution strategy. As shown in Figure 16b, under a rule-based control strategy, the engine degradation led to reduced intake air and increased intake temperature, resulting in a lower air/fuel ratio and causing the exhaust temperature to exceed safe limits. The LSTM-MPC-based power redistribution strategy reduced the engine’s acceleration pedal position, decreasing its output torque and load to prevent the exhaust temperature from exceeding its limit. The battery compensated for the power deficit caused by the engine degradation. Additionally, with reduced engine load, the exhaust temperature remained within safe limits. After 1270 s, the vehicle cruised at a steady 60 km/h, requiring less power, further reducing the output from both the engine and the battery.
The operating point, fuel consumption, and exhaust temperature of the engine are shown in Figure 17, illustrating the engine’s performance on its universal characteristic curve under degradation conditions. The engine shifted from a medium-high load to a medium load, ensuring that the exhaust temperature stayed within safe limits. While the specific fuel consumption increased slightly, the engine continued to operate in a relatively optimal efficiency zone.
The overall energy consumption under engine degradation is shown in Table 5.
Overall, under engine degradation, compared to the rule-based control strategy, the LSTM-MPC-based power redistribution strategy reduced the overall energy consumption by 4.4%. However, it was still 2.8% higher than the energy consumption during normal operation. This strategy also ensured that the engine remained within its temperature limits and operated in a relatively optimal efficiency range.

5.3.3. Combined Case

At 1234 s, a battery degradation was injected, followed by an engine degradation at 1255 s. The simulation results are shown in Figure 18.
Figure 18a shows that after the battery degradation was introduced at 1234 s, the increased internal resistance led to reduced battery power output and a rise in battery temperature, causing the speed difference to increase. As the target speed continue to rise, the battery’s state deviated further from normal, further widening the speed difference. At 1245 s, the degradation was confirmed. The hybrid system then switched control strategies, adopting the MPC-based power redistribution strategy, which allowed the system to enter hybrid mode 5 s earlier than it would have in the degradation condition. As shown in Figure 18b, in hybrid mode, to ensure that the battery did not exceed its optimal temperature range and to avoid danger, the battery continued to operate at a lower power output. The engine compensated for the power shortfall caused by the battery degradation, reducing the speed difference and maintaining target speed. After injecting an engine intake system degradation at 1255 s, reduced intake volume led to a lower air/fuel ratio, decreased engine torque, increased exhaust temperature, and worsened fuel economy. To prevent exceeding the exhaust temperature limit, the diesel engine’s power output was reduced by decreasing the accelerator pedal position. Since the battery remained degraded, its output power was slightly increased. As shown in Figure 18a, due to the combined battery and engine degradation, the total output power constrained by the operating conditions was still insufficient to meet the power demand during acceleration. Consequently, the speed difference remained, although it was smaller than that observed under the rule-based control strategy. After 1272 s, the vehicle maintained a steady speed of 60 km/h. Compared to the acceleration phase, the power demand was reduced, and under the LSTM-MPC-based power redistribution control, the hybrid system could follow the target speed during the steady-speed phase. Figure 18c shows the constrained signals during the optimization process. As seen in the figure, under combined battery and engine degradation, compared to the rule-based strategy, the LSTM-MPC-based power redistribution strategy kept the battery temperature within its optimal range and prevented the engine from exceeding its exhaust temperature limit. Due to the combined degradation, the engine took on a larger share of the power output, reducing the battery’s energy consumption. As a result, the SOC increased compared to the normal state, avoiding the issue of excessive battery discharge.
The operating points, specific fuel consumption, and exhaust temperature of the engine are shown in Figure 19. As seen in the figure, similar to the scenario with engine-only degradation, to ensure the diesel engine did not exceed its exhaust temperature limit, the engine load shifted from medium-high to medium. This resulted in a slight increase in specific fuel consumption, but the engine continued to operate within a relatively optimal efficiency range.
The overall energy consumption under combined battery and engine degradation is shown in Table 6.
Overall, under combined battery and engine degradation, the LSTM-MPC-based power redistribution strategy reduced the speed tracking error by 12.3% during the test cycle at the cost of a 3.7% increase in overall energy consumption. This approach also ensured that the battery temperature remained within its optimal operating range and that the engine did not exceed its exhaust temperature limits while continuing to operate in a relatively efficient zone.

6. Conclusions

A PHM method for a P2 diesel HEV was tested in this study. By utilizing a simplified model, real-time HEV performance prediction was satisfied. Following real-world sensor data, degradation prognostics were conducted using a GRA-PCA method with a health index. Finally, PHM case studies were investigated to illustrate good degradation tolerance performance when using a LSTM-MPC strategy. The main conclusions are as follows:
  • A physical P2 HEV model with a rule-based controller was built. The diesel engine sub-model was simplified by using NN to meet the requirement of real-time performance for degradation prognostics.
  • Considering real-world HEV sensor data, the GRA-PCA-based algorithm for degradation prognostics was used. The method showed good anti-noise ability and fast responsibility with 2s triggered by the health index.
  • PHM case studies were performed and LSTM-MPC-based degradation tolerance strategies were validated. The optimization targets were the best vehicle speed tracing with less degradation in energy consumption.
  • The result shows that the energy consumption remained nearly unchanged for the engine degradation case. For the battery degradation case, the tracing error was reduced by 11.7% with 4.3% more energy consumption. For combined degradation, the strategy achieved a 12.3% tracing error reduction with 3.7% more energy consumption. The suggested PHM method guaranteed vehicle power performance under degradation situations.

Author Contributions

Writing—original draft preparation, J.T.; funding acquisition, B.L.; writing—review and editing, B.L. and W.F.; supervision, B.L., D.Z. and L.L. All authors have read and agreed to the published version of the manuscript.

Funding

This research received no external funding.

Data Availability Statement

The raw data supporting the conclusions of this article will be made available by the authors on request.

Conflicts of Interest

The authors declare no conflict of interest.

List of Abbreviations and Symbols

AbbreviationsMeaningSymbolsMeaning
HEVHybrid electric vehicles T e x h Exhaust temperature
DDDegradation diagnosis P a c c Accelerator pedal position
PHMPrognostics and Health Management T i n Intake temperature
NNNeural network P i n Intake pressure
GRAGray relation analysis V m a i n Main Voltage
PCAPrincipal component analysis I m a i n Main Current
LSTMLong short-term memory T b a t t e r y Battery temperature
MPCModel predictive control v Vehicle speed
SOCState of charge

References

  1. Eikenberry, S.E. Hybrids are an effective transitional technology for limiting US passenger fleet carbon emissions. AIMS Environ. Sci. 2020, 7, 117–139. [Google Scholar] [CrossRef]
  2. Qadir, S.A.; Ahmad, F.; Al-Wahedi, A.M.A.B.; Iqbal, A.; Ali, A. Navigating the complex realities of electric vehicle adoption: A comprehensive study of government strategies, policies, and incentives. Energy Strategy Rev. 2024, 53, 101379. [Google Scholar] [CrossRef]
  3. Zaino, R.; Ahmed, V.; Alhammadi, A.M.; Alghoush, M. Electric vehicle adoption: A comprehensive systematic review of technological, environmental, organizational and policy impacts. World Electr. Veh. J. 2024, 15, 375. [Google Scholar] [CrossRef]
  4. Lü, X.; Li, S.; He, X.; Xie, C.; He, S.; Xu, Y.; Fang, J.; Zhang, M.; Yang, X. Hybrid electric vehicles: A review of energy management strategies based on model predictive control. J. Energy Storage 2022, 56, 106112. [Google Scholar] [CrossRef]
  5. Milojević, S.; Glišović, J.; Savić, S.; Bošković, G.; Bukvić, M.; Stojanović, B. Analysis of Urban Air Quality Based on Remote Sensing and Machine Learning. Atmosphere 2024, 15, 184. [Google Scholar] [CrossRef]
  6. Ehsani, M. Conventional fuel/hybrid electric vehicles. In Alternative Fuels and Advanced Vehicle Technologies for Improved Environmental Performance; Woodhead Publishing: Sawston, UK, 2014; pp. 632–654. [Google Scholar]
  7. Ma, S.; Jiang, M.; Tao, P.; Song, C.; Wu, J.; Wang, J.; Deng, T.; Shang, W. Temperature effect and thermal impact in lithium-ion batteries: A review. Prog. Nat. Sci. Mater. Int. 2018, 28, 653–666. [Google Scholar] [CrossRef]
  8. Wei, Z.; Goehring, T.; Mioduszewski, M.; Luo, L.; Kotrba, A.; Rybarz, M.; Ellinghaus, K.; Pieszkalla, M. Failure mechanisms and modes analysis of vehicle exhaust components and systems. In Handbook of Materials Failure Analysis with Case Studies from the Aerospace and Automotive Industries; Butterworth–Heinemann: Oxford, UK, 2016; pp. 393–432. [Google Scholar]
  9. Huang, T.; Pan, H.; Sun, W. A sensor fault detection, isolation, and estimation method for intelligent vehicles. Control Eng. Pract. 2023, 139, 105620. [Google Scholar] [CrossRef]
  10. Rimpas, D.; Papadakis, A.; Samarakou, M. OBD-II sensor diagnostics for monitoring vehicle operation and consumption. Energy Rep. 2020, 6, 55–63. [Google Scholar] [CrossRef]
  11. Li, Y.; Duan, X.; Fu, J.; Liu, J.; Wang, S.; Dong, H.; Xie, Y. Development of a method for on board measurement of instant engine torque and fuel consumption rate based on direct signal measurement and RGF modelling under vehicle transient operating conditions. Energy 2019, 189, 116218. [Google Scholar] [CrossRef]
  12. Yao, L.; Xiao, Y.; Gong, X.; Hou, J.; Chen, X. A novel intelligent method for fault diagnosis of electric vehicle battery system based on wavelet neural network. J. Power Sources 2020, 453, 227870. [Google Scholar] [CrossRef]
  13. Zhang, X.; Zhao, Y.; Lin, H.; Riaz, S.; Elahi, H. Real-time fault diagnosis and fault-tolerant control strategy for Hall sensors in permanent magnet brushless DC motor drives. Electronics 2021, 10, 1268. [Google Scholar] [CrossRef]
  14. Krishna, K.S.; Kumar, K.S. A review on hybrid renewable energy systems. Renew. Sustain. Energy Rev. 2015, 52, 907–916. [Google Scholar] [CrossRef]
  15. Zio, E. Prognostics and Health Management (PHM): Where are we and where do we (need to) go in theory and practice. Reliab. Eng. Syst. Saf. 2022, 218, 108119. [Google Scholar] [CrossRef]
  16. Meng, H.; Li, Y. A review on prognostics and health management (PHM) methods of lithium-ion batteries. Renew. Sustain. Energy Rev. 2019, 116, 109405. [Google Scholar] [CrossRef]
  17. Khan, S.; Tsutsumi, S.; Yairi, T.; Nakasuka, S. Robustness of AI-based prognostic and systems health management. Annu. Rev. Control 2021, 51, 130–152. [Google Scholar] [CrossRef]
  18. Tao, F.; Zhang, M.; Liu, Y.; Nee, A.Y. Digital twin driven prognostics and health management for complex equipment. CIRP Ann. 2018, 67, 169–172. [Google Scholar] [CrossRef]
  19. Nor, A.K.; Pedapati, S.R.; Muhammad, M. Reliability engineering applications in electronic, software, nuclear and aerospace industries: A 20 year review (2000–2020). Ain Shams Eng. J. 2021, 12, 3009–3019. [Google Scholar] [CrossRef]
  20. Che, C.; Wang, H.; Fu, Q.; Ni, X. Combining multiple deep learning algorithms for prognostic and health management of aircraft. Aerosp. Sci. Technol. 2019, 94, 105423. [Google Scholar] [CrossRef]
  21. Sun, Y.; Lu, Y.; Bao, J.; Tao, F. Prognostics and health management via long short-term digital twins. J. Manuf. Syst. 2023, 68, 560–575. [Google Scholar] [CrossRef]
  22. Milićević, S.; Blagojević, I.; Milojević, S.; Bukvić, M.; Stojanović, B. Numerical Analysis of Optimal Hybridization in Parallel Hybrid Electric Powertrains for Tracked Vehicles. Energies 2024, 17, 3531. [Google Scholar] [CrossRef]
  23. Wang, L.; Li, X.; Guo, P.; Guo, S.; Yang, Z.; Pei, P. Bibliometric analysis of prognostics and health management (PHM) in hydrogen fuel cell engines. Int. J. Hydrogen Energy 2022, 47, 34216–34243. [Google Scholar] [CrossRef]
  24. Sujesh, G.; Ramesh, S. Modeling and control of diesel engines: A systematic review. Alex. Eng. J. 2018, 57, 4033–4048. [Google Scholar] [CrossRef]
  25. Banta, N.J.I.; Njionou, P.; Offole, F.; Mouangue, R. Machine learning models for the prediction of turbulent combustion speed for hydrogen-natural gas spark ignition engines. Heliyon 2024, 10, e30497. [Google Scholar] [CrossRef] [PubMed]
  26. Chen, H.; Zhang, K.; Deng, K.; Cui, Y. Real-time engine model development based on time complexity analysis. Int. J. Engine Res. 2022, 23, 2094–2104. [Google Scholar] [CrossRef]
  27. Lu, N.; Liu, S.; Du, J.; Fang, Z.; Dong, W.; Tao, L.; Yang, Y. Grey relational analysis model with cross-sequences and its application in evaluating air quality index. Expert Syst. Appl. 2023, 233, 120910. [Google Scholar] [CrossRef]
  28. Geum, Y.; Cho, Y.; Park, Y. A systematic approach for diagnosing service failure: Service-specific FMEA and grey relational analysis approach. Math. Comput. Model. 2011, 54, 3126–3142. [Google Scholar] [CrossRef]
  29. Balu Mahandiran, S.; Sekar, P. Multi-objective optimization of process parameters in dry sliding wear characteristics of Al/sic composites using Taguchi grey relation analysis. Mater. Today Proc. 2021, 45, 1882–1886. [Google Scholar]
  30. Sarwar, U.; Muhammad, M.; Mokhtar, A.A.; Khan, R.; Behrani, P.; Kaka, S. Hybrid intelligence for enhanced fault detection and diagnosis for industrial gas turbine engine. Results Eng. 2024, 21, 101841. [Google Scholar] [CrossRef]
  31. Peng, Y. Research on Fault Diagnosis Algorithms for Hybrid Power Systems. Ph.D. Dissertation, Jilin University, Changchun, China, 2015. [Google Scholar]
  32. ISO 26262; Road Vehicles—Functional Safety. International Organization for Standardization: Geneva, Switzerland, 2018.
  33. Liu, Z.; Chang, G.; Yuan, H.; Tang, W.; Xie, J.; Wei, X.; Dai, H. Adaptive look-ahead model predictive control strategy of vehicular PEMFC thermal management. Energy 2023, 285, 129176. [Google Scholar] [CrossRef]
  34. Yan, F.J.; Wang, J.M.; Huang, K.S. Hybrid electric vehicle model predictive control torque-split strategy incorporating engine transient characteristics. IEEE Trans. Veh. Technol. 2012, 61, 2458–2467. [Google Scholar] [CrossRef]
  35. Morari, M.; Garcia, C.E.; Prett, D.M. Model predictive control: Theory and practice. Automatica 1989, 25, 335–348. [Google Scholar] [CrossRef]
  36. Wang, J.; Li, X.; Li, J.; Sun, Q.; Wang, H. NGCU: A new RNN model for time-series data prediction. Big Data Res. 2022, 27, 100296. [Google Scholar] [CrossRef]
  37. Sundermeyer, M.; Hermann, N.; Schluter, R. From feedforward to recurrent LSTM neural networks for language modeling. IEEE/ACM Trans. Audio Speech Lang. Process. 2015, 23, 517–529. [Google Scholar] [CrossRef]
  38. Xu, D.; Yao, C.; Ma, C.; Song, E. Comprehensive performance prediction and optimization of marine dual-fuel engines. J. Intern. Combust. Engine 2022, 40, 403–411. [Google Scholar]
  39. Lv, Y.; Yang, X.; Li, Y.; Liu, J.; Li, S. Fault detection and diagnosis of marine diesel engines: A systematic review. Ocean Eng. 2024, 294, 116798. [Google Scholar] [CrossRef]
  40. Xiong, R.; Pan, Y.; Shen, W.; Li, H.; Sun, F. Lithium-ion battery aging mechanisms and diagnosis method for automotive applications: Recent advances and perspectives. Renew. Sustain. Energy Rev. 2020, 131, 110048. [Google Scholar] [CrossRef]
  41. Machlev, R. EV battery fault diagnostics and prognostics using deep learning: Review, challenges & opportunities. J. Energy Storage 2024, 83, 110614. [Google Scholar]
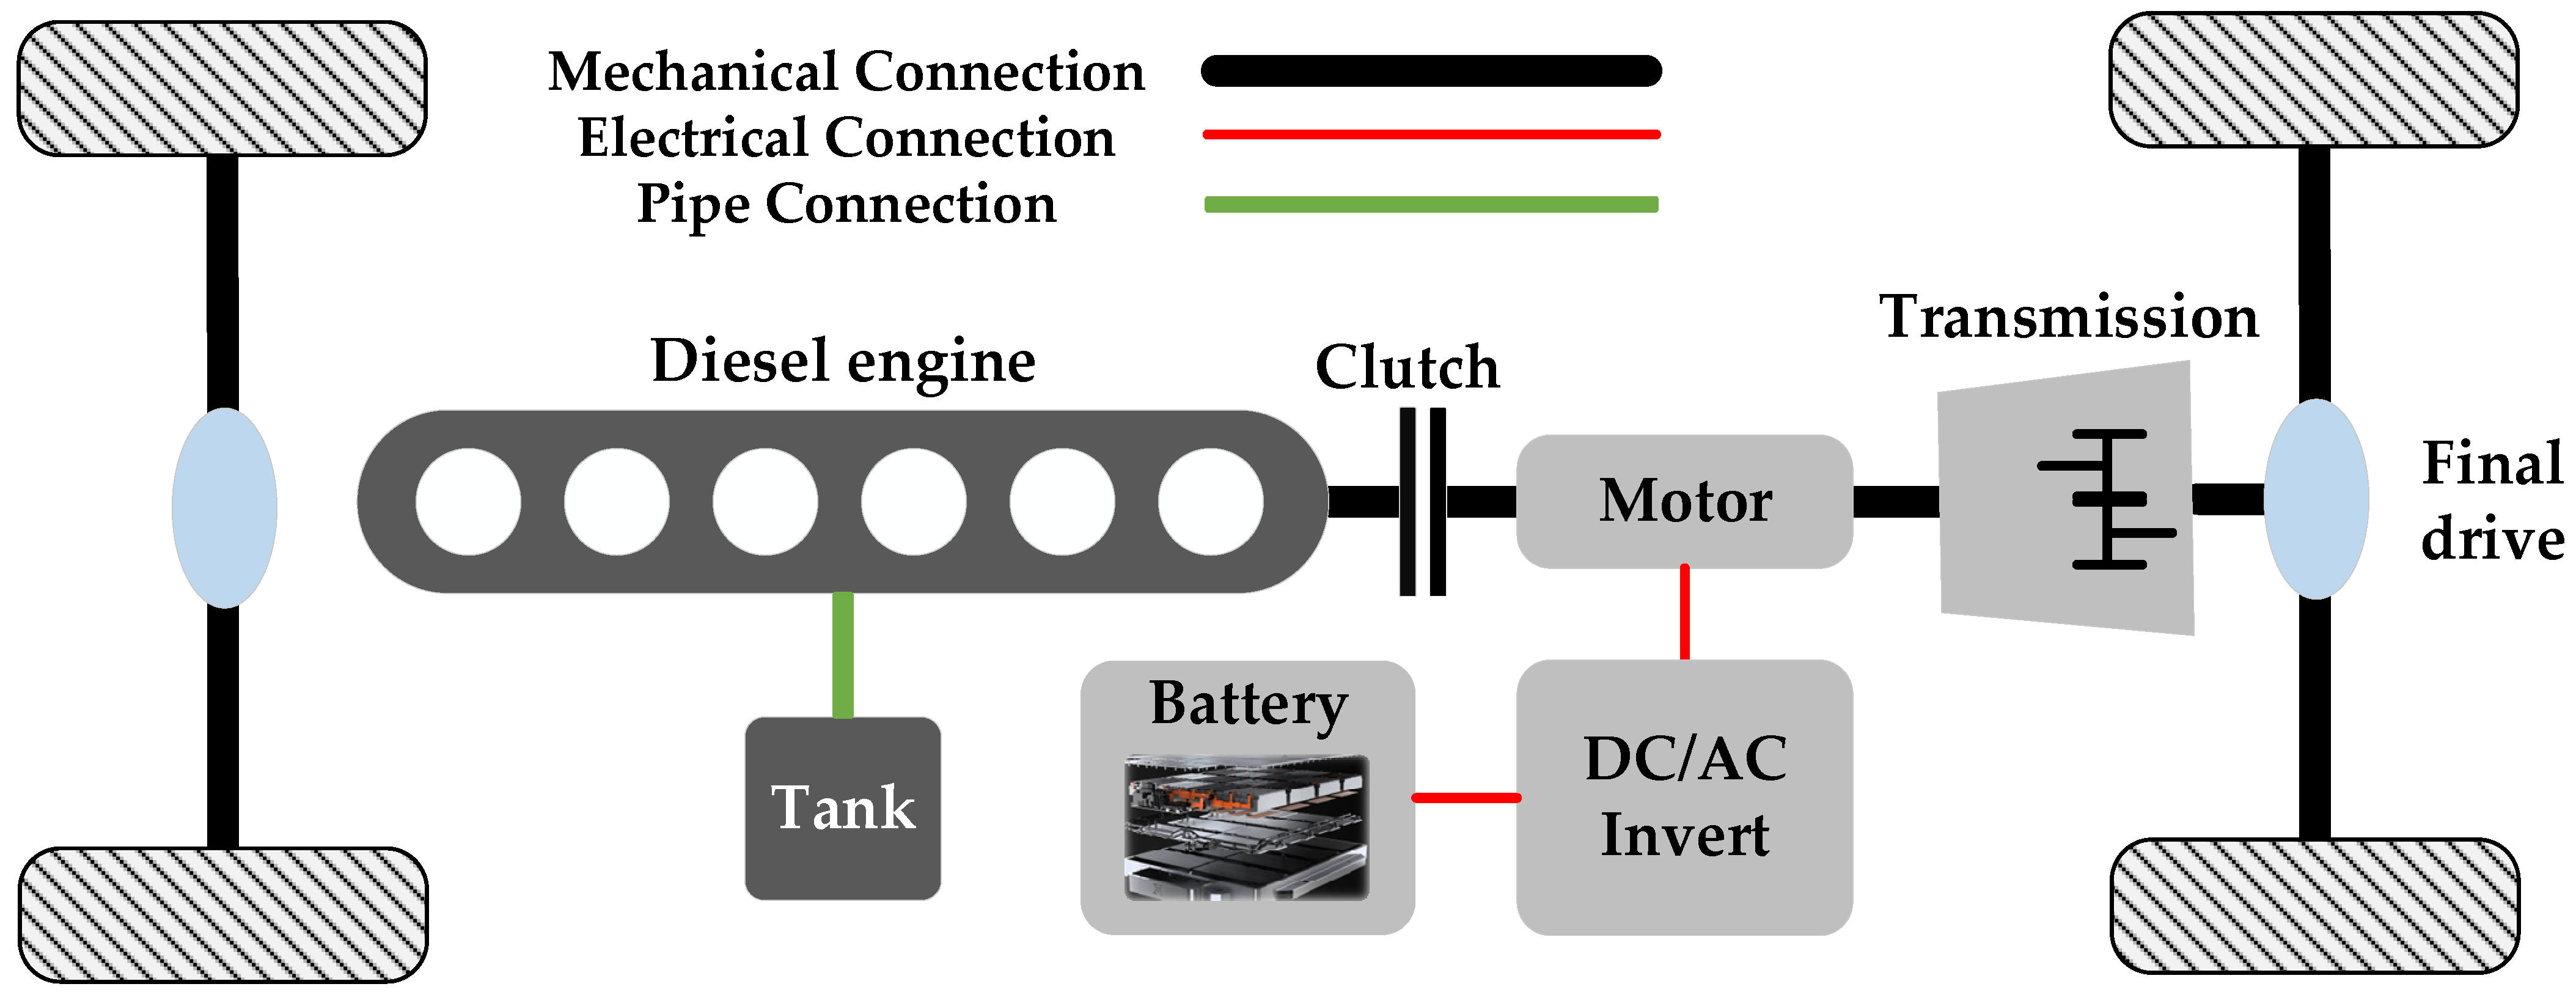
Figure 1. Schematic diagram of the parallel P2 diesel–electric hybrid power system.
Energies 17 05413 g001
Figure 2. Motor efficiency diagram.
Energies 17 05413 g002
Figure 3. Diesel engine real-time model.
Energies 17 05413 g003
Figure 4. 40 s transient condition.
Energies 17 05413 g004
Figure 5. Diesel engine real-time factor and simulation time.
Energies 17 05413 g005
Figure 6. Count-based degradation confirmation method.
Energies 17 05413 g006
Figure 8. Schematic diagram of MPC.
Energies 17 05413 g008
Figure 9. NN structure of the LSTM.
Energies 17 05413 g009
Figure 10. Loss function trend.
Energies 17 05413 g010
Figure 11. Framework for the simulation process.
Energies 17 05413 g011
Figure 12. Weight values of the feature signal in different modes: (a) Electric-only; (b) Diesel-only; (c) Hybrid.
Energies 17 05413 g012
Figure 13. 1228 s to 1332 s segment in CTUDC cycle.
Energies 17 05413 g013
Figure 14. Simulation result under battery degradation. (a) Vehicle speed and mode, (b) Power performance, (c) Constrained signal.
Energies 17 05413 g014
Figure 15. Engine operating point under battery degradation.
Energies 17 05413 g015
Figure 16. Simulation result under engine degradation. (a) Vehicle speed and mode; (b) Power performance.
Energies 17 05413 g016
Figure 17. Engine operating point under engine degradation.
Energies 17 05413 g017
Figure 18. Simulation result under combined battery and engine degradation. (a) Vehicle speed and mode, (b) Power performance, (c) Constrained signal.
Energies 17 05413 g018
Figure 19. Engine operating point under combined battery and engine degradation.
Energies 17 05413 g019
Table 1. Specifications of vehicle and components.
ParameterValue
Curb weight (kg)18,000
Drag coefficient (-)0.55
Rolling resistance coefficient (-)0.0095
Windward area (m2)6.6
Tire radius (m) 0.473
Final drive ratio7.5
Maximum engine speed (r/min)2500
Motor rated power (kW)60
Motor peak power (kW)168
Motor maximum torque (N·m)2000
Battery rated voltage (V)400
Battery rated capacity (Ah)60
Diesel engine maximum power (kW)147
Diesel engine maximum torque (N·m)692
Table 2. Rule-based operation mode.
ModeBatteryICESwitching Condition
Electric-onlydischargeOff ( 0 < P r e q < P e _ m i n & S O C > S O C l o w & v < v e )
Diesel-onlyOffOn ( P r e q P e _ m a x & v v e )
HybriddischargeOn ( P r e q > P e _ m a x & S O C > S O C m i n & v v e )
In-motion chargingchargeOn ( 0 < P r e q P e _ m a x & S O C S O C l o w & v v e )
Regenerative brakingchargeOff ( P r e q < 0 & S O C < S O C m a x )
Table 3. Feature signals.
ComponentFeature SignalUnit
Diesel engineExhaust temperature T e x h °C
Accelerator pedal position P a c c %
Intake temperature T i n °C
Intake pressure P i n kPa
BatteryMain voltage V m a i n V
Main current I m a i n A
Battery temperature T b a t t e r y °C
VehicleVehicle speed v Km/h
Table 4. Overall energy consumption under battery degradation.
NormalBattery Degradation
Rule-BasedLSTM-MPC
Battery energy consumption (kW·h)0.590.590.28
Fuel consumption (g)138.80142.30191.30
Overall energy consumption (L/100 km)27.5129.5530.81
Table 5. Overall energy consumption under engine degradation.
NormalBattery Degradation
Rule-BasedLSTM-MPC
Battery energy consumption (kW·h)0.590.681.00
Fuel consumption (g)138.80144.40103.97
Overall energy consumption (L/100 km)27.5129.5628.27
Table 6. Overall energy consumption under combined battery and engine degradation.
NormalBattery Degradation
Rule-BasedLSTM-MPC
Battery energy consumption (kW·h)0.590.650.52
Fuel consumption (g)138.80150.13172.88
Overall energy consumption (L/100 km)27.5131.7332.90
Disclaimer/Publisher’s Note: The statements, opinions and data contained in all publications are solely those of the individual author(s) and contributor(s) and not of MDPI and/or the editor(s). MDPI and/or the editor(s) disclaim responsibility for any injury to people or property resulting from any ideas, methods, instructions or products referred to in the content.