
Dynamic Simulation of Carbon Emission Peak in City-Scale Building Sector: A Life-Cycle Approach Based on LEAP-SD Model


Abstract
1. Introduction
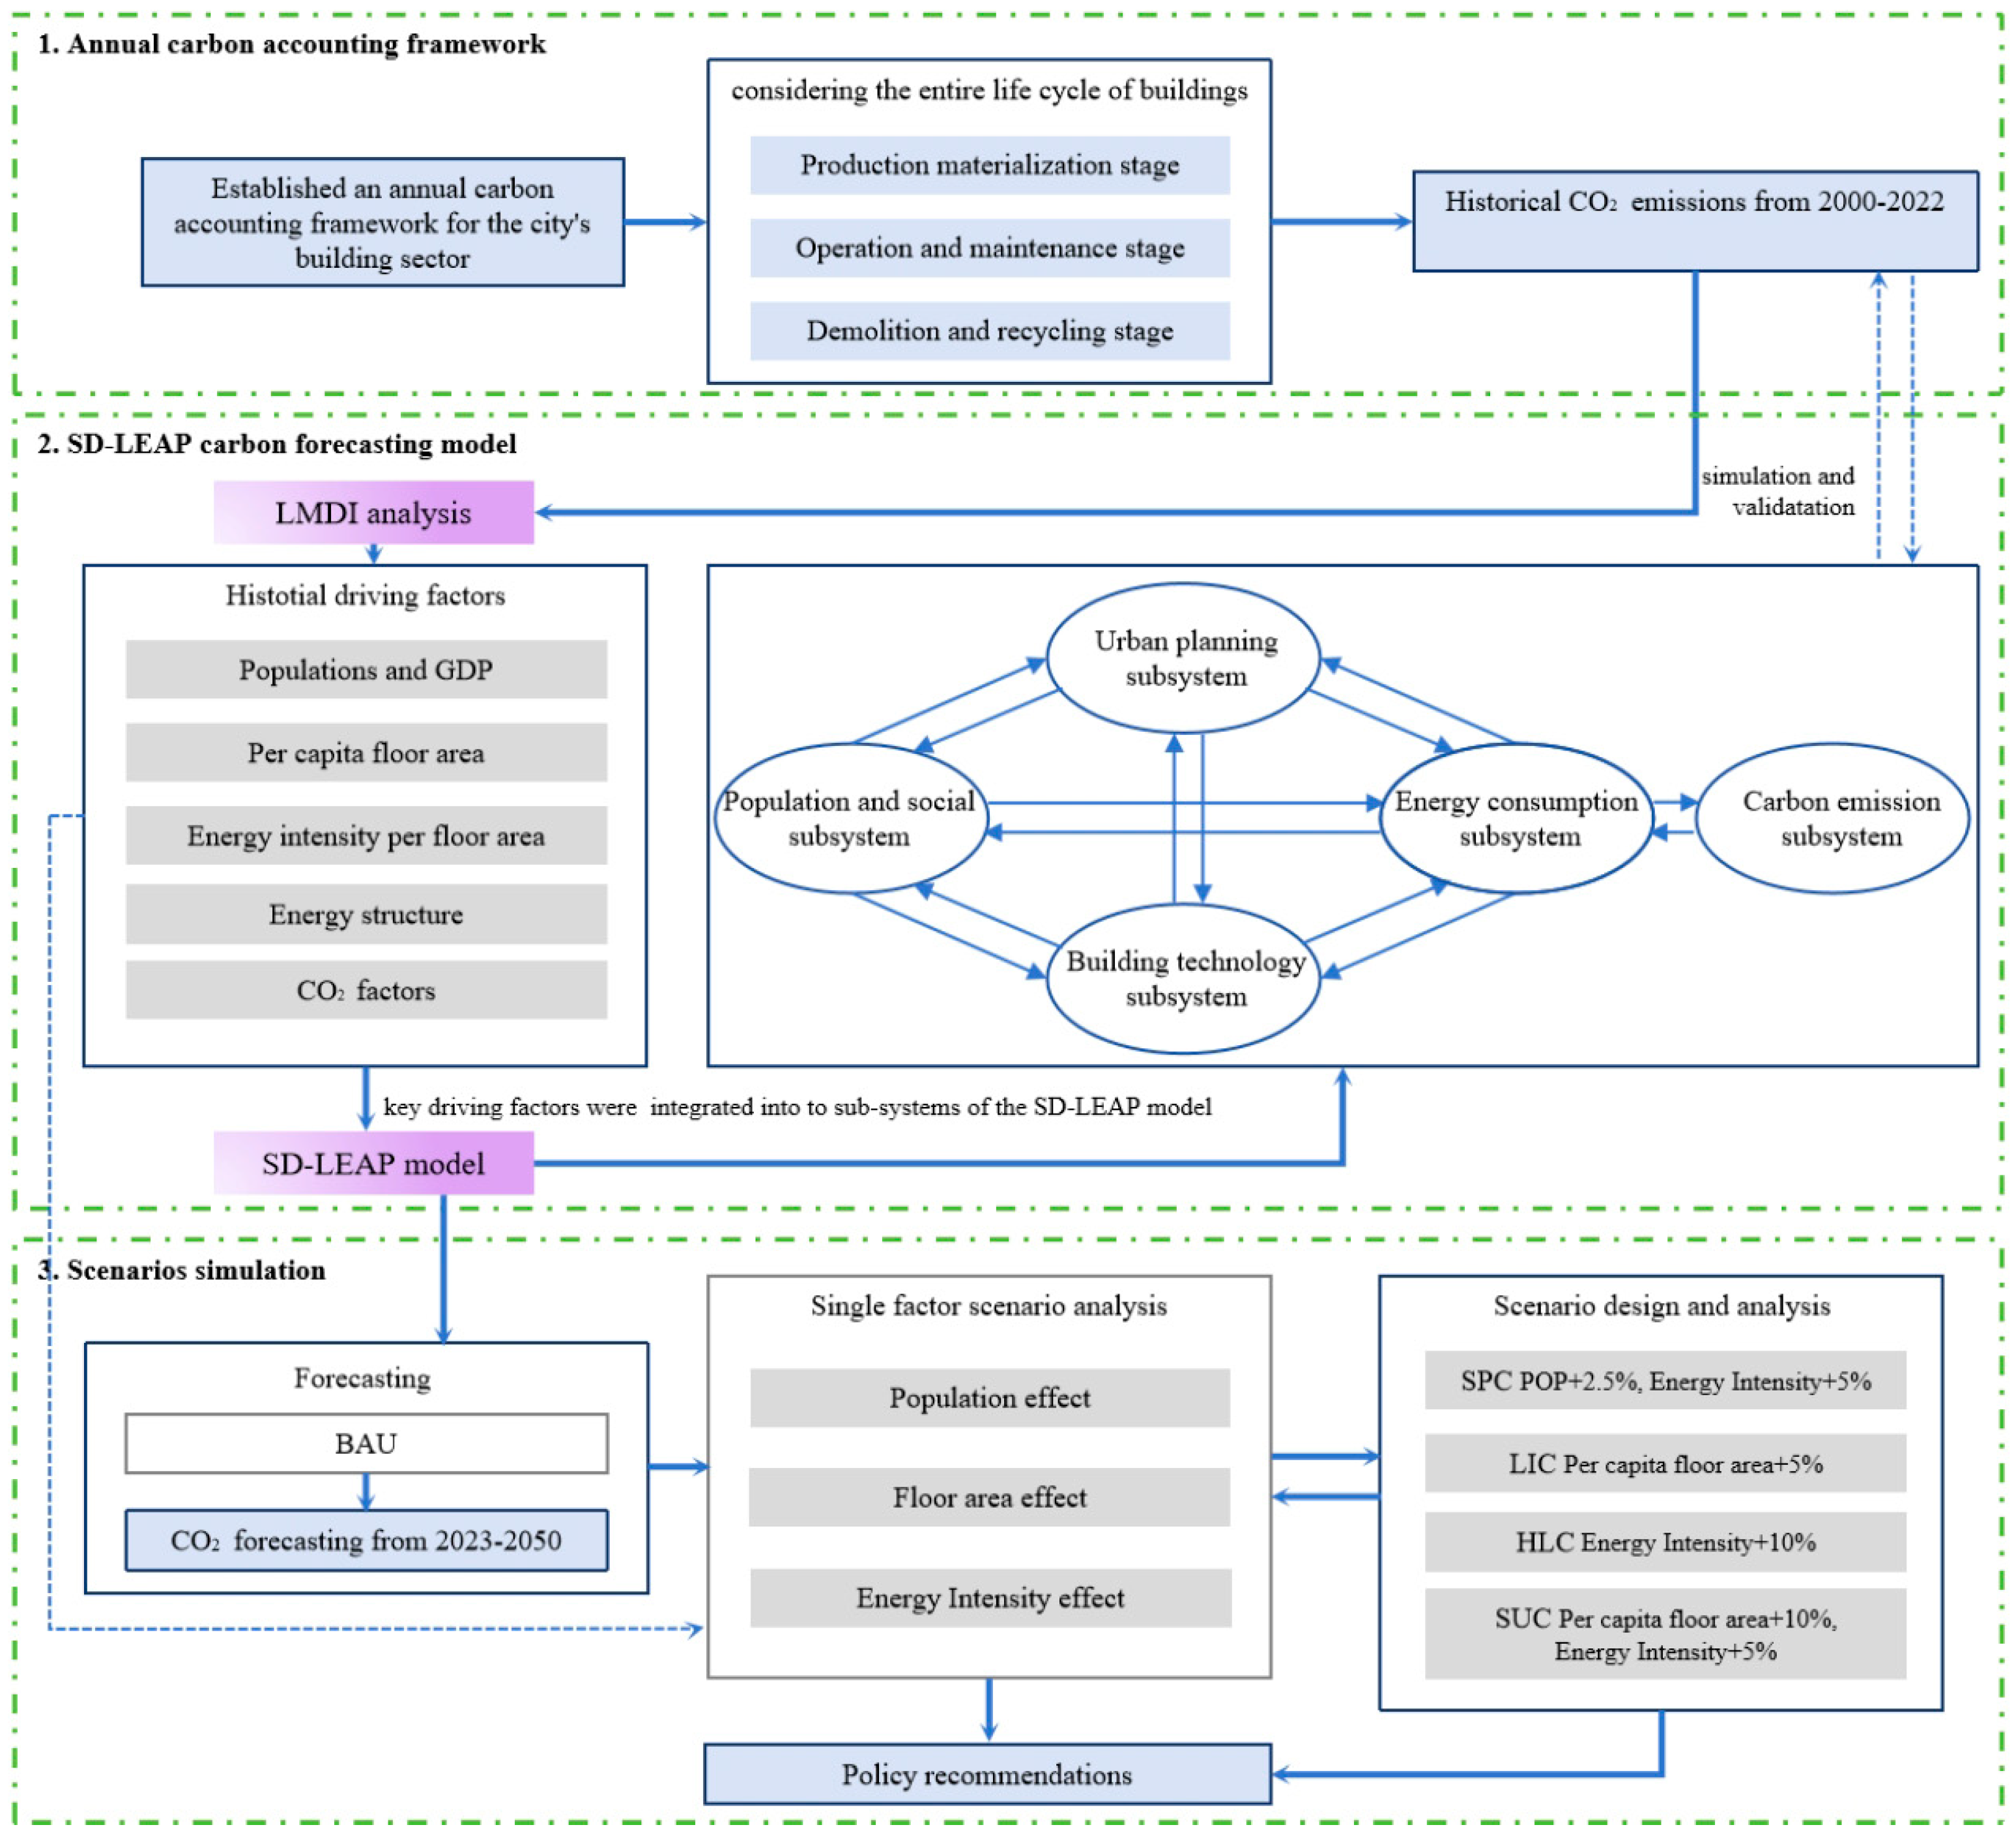
2. Methodology
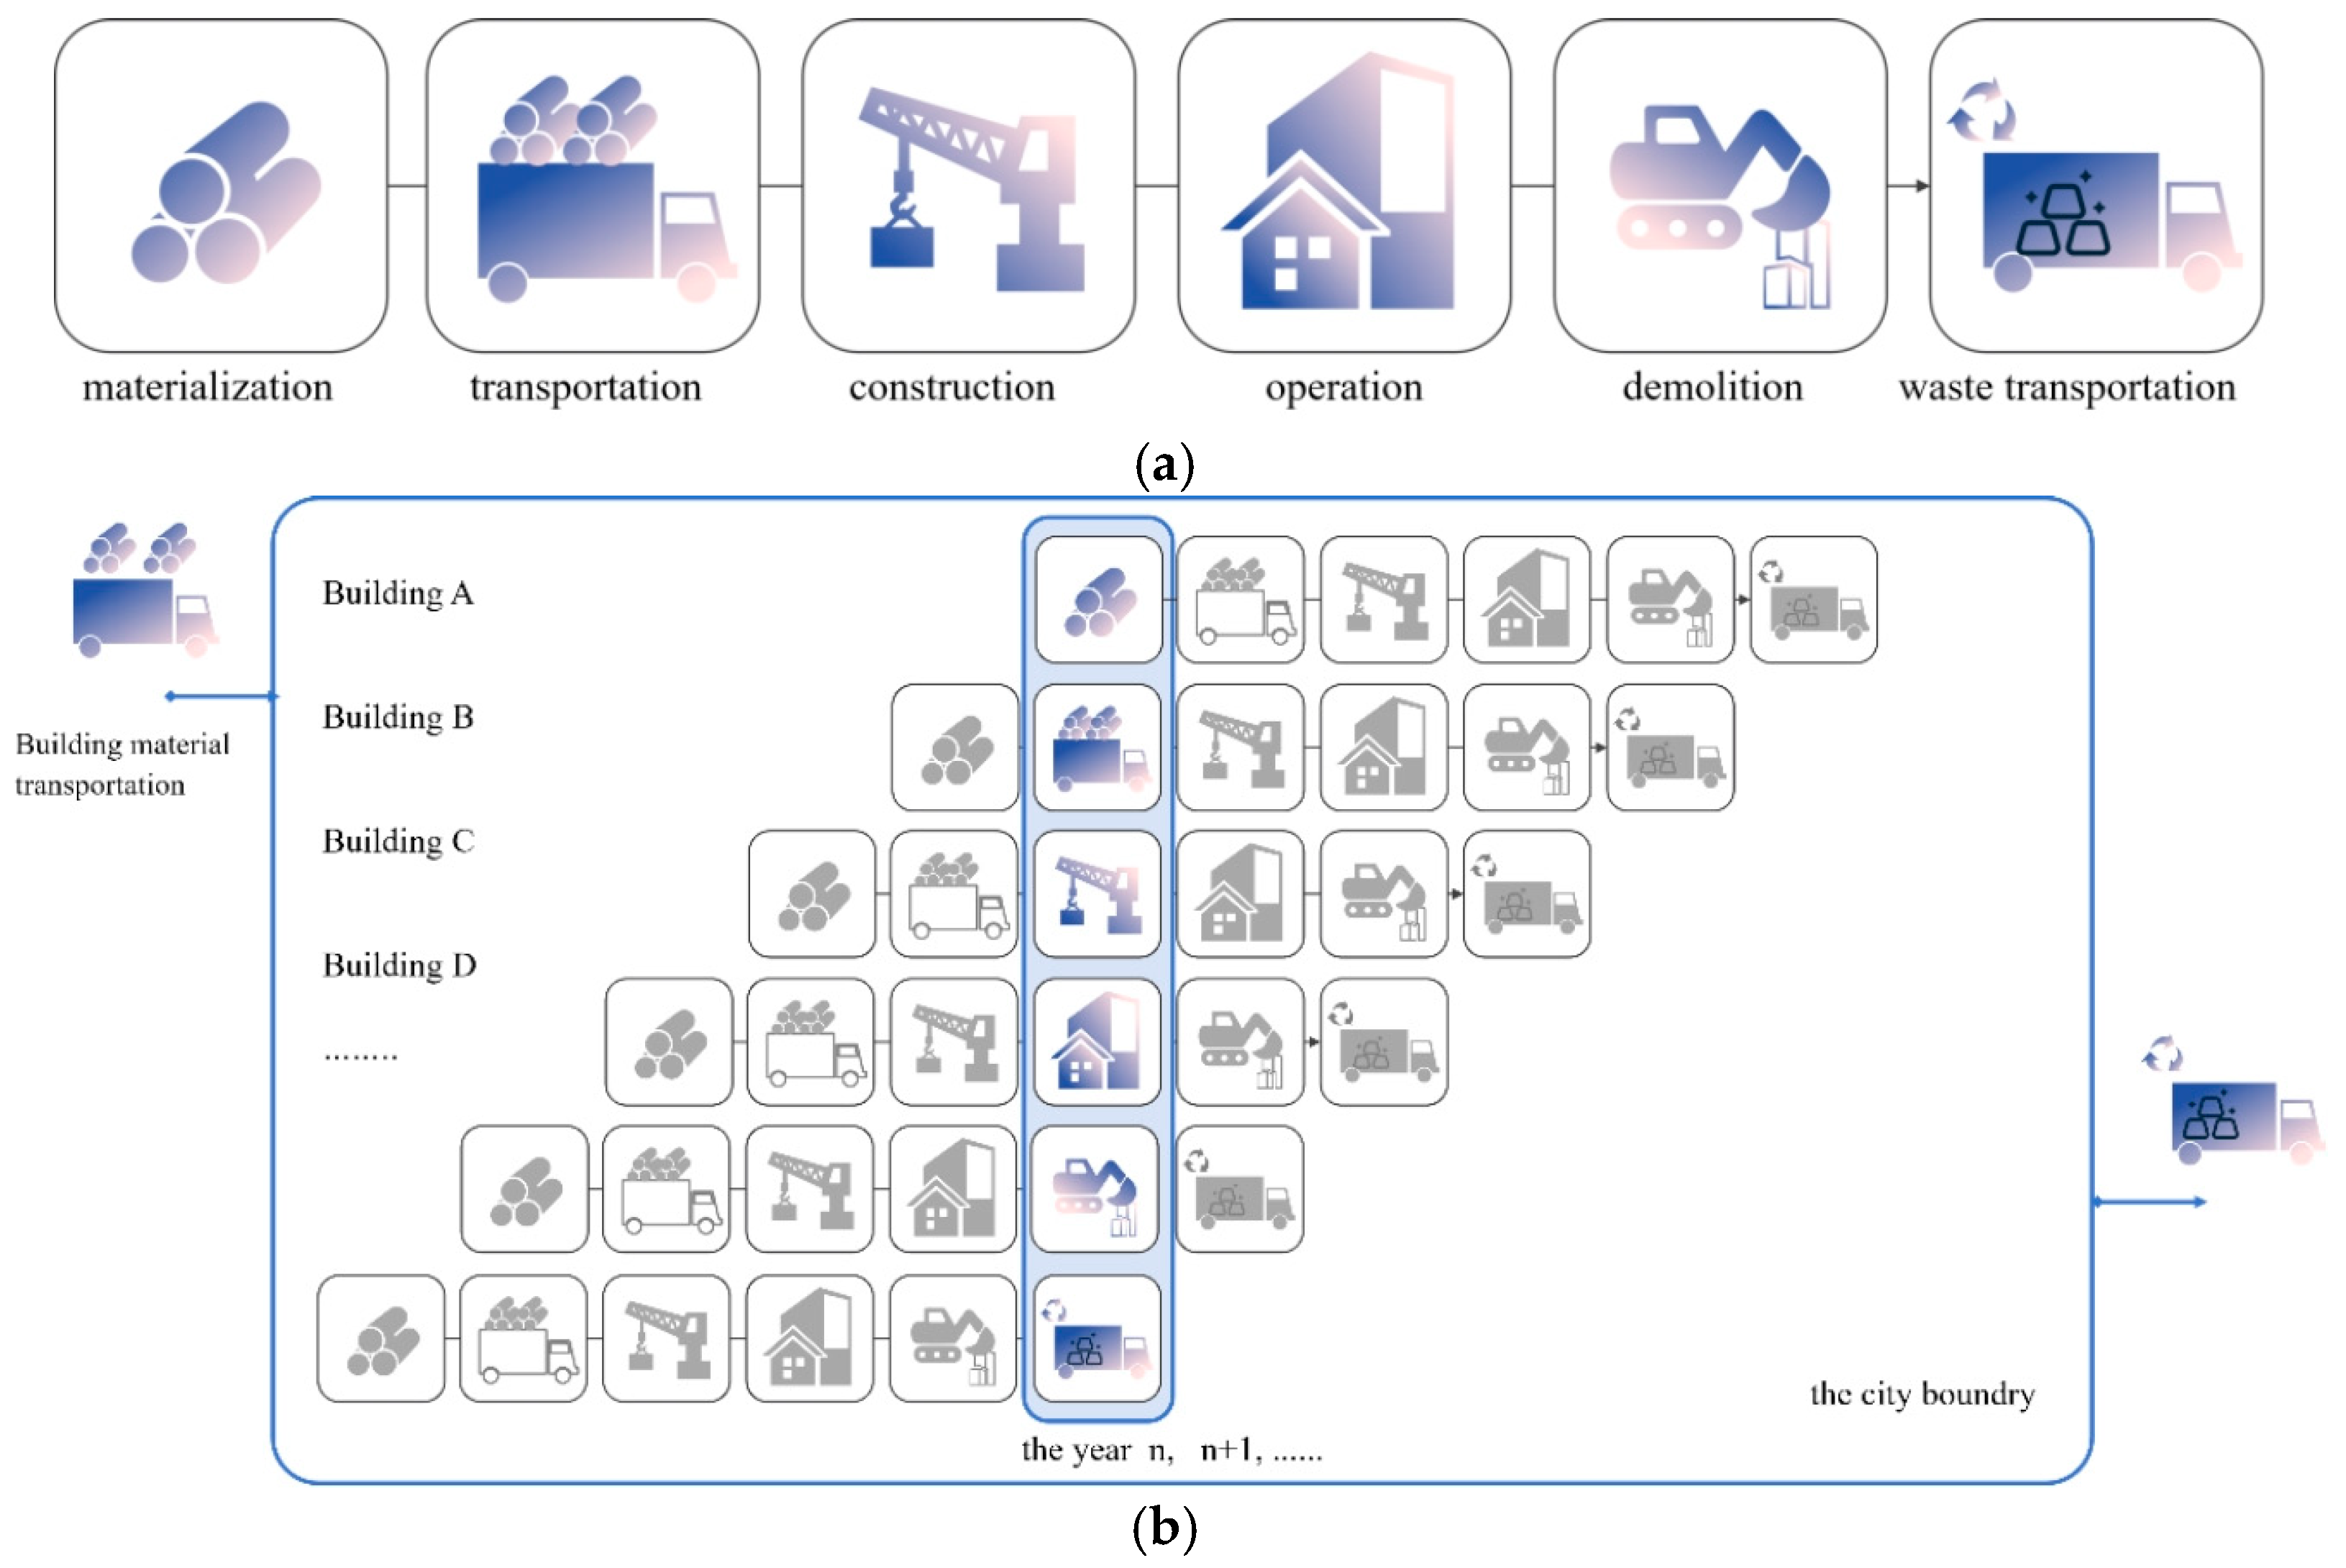
2.1. The Annual Carbon Emissions Accounting Framework
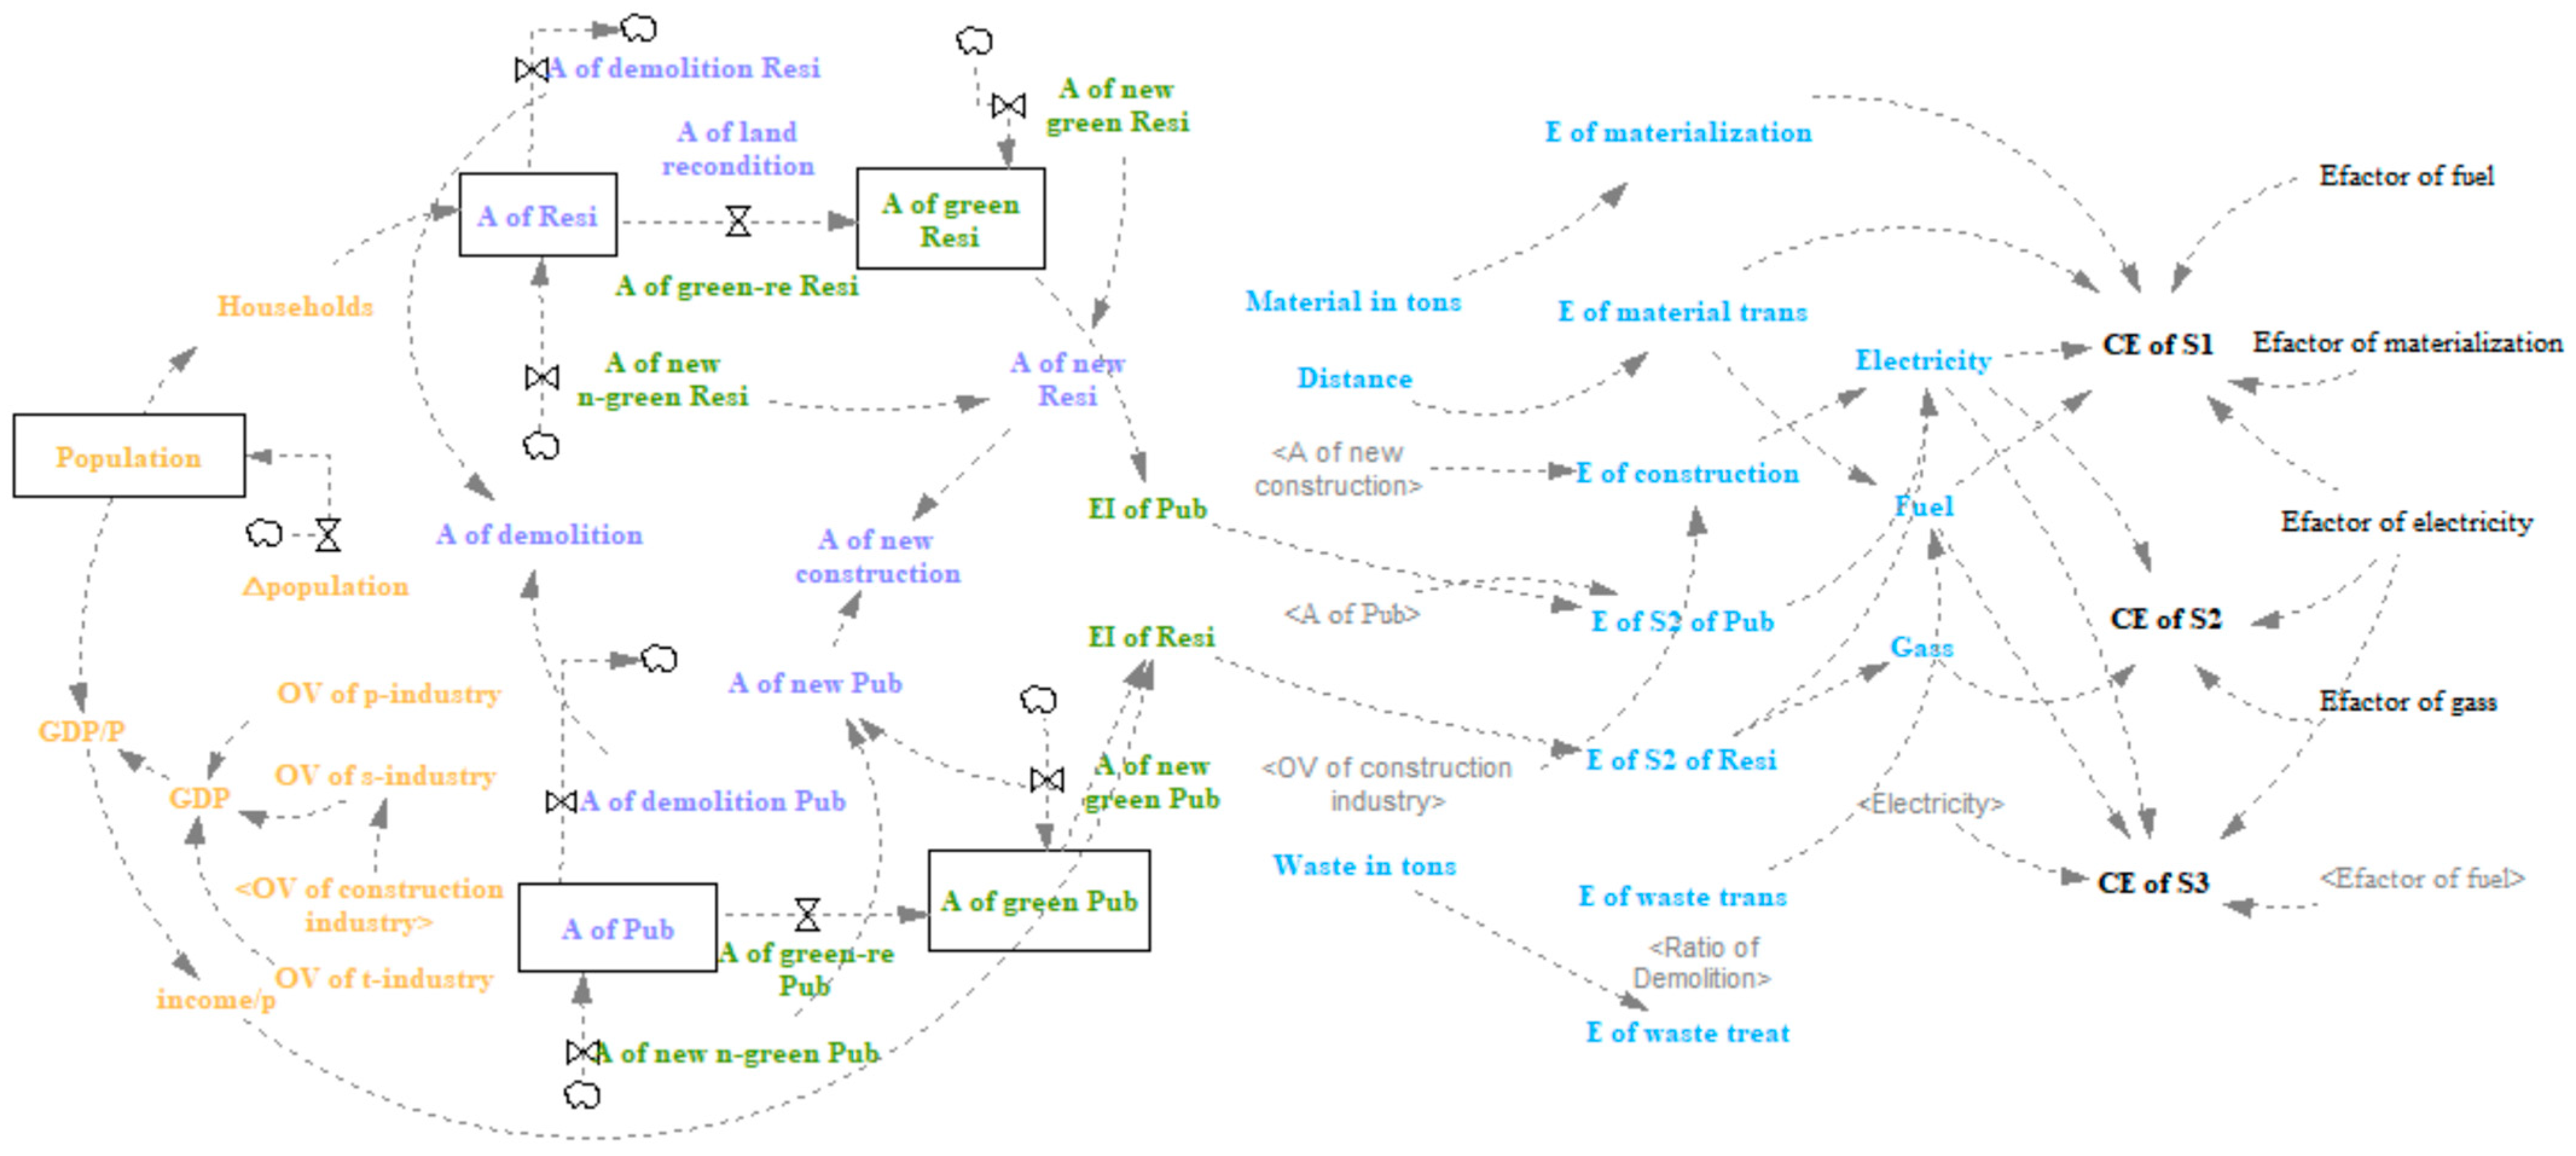
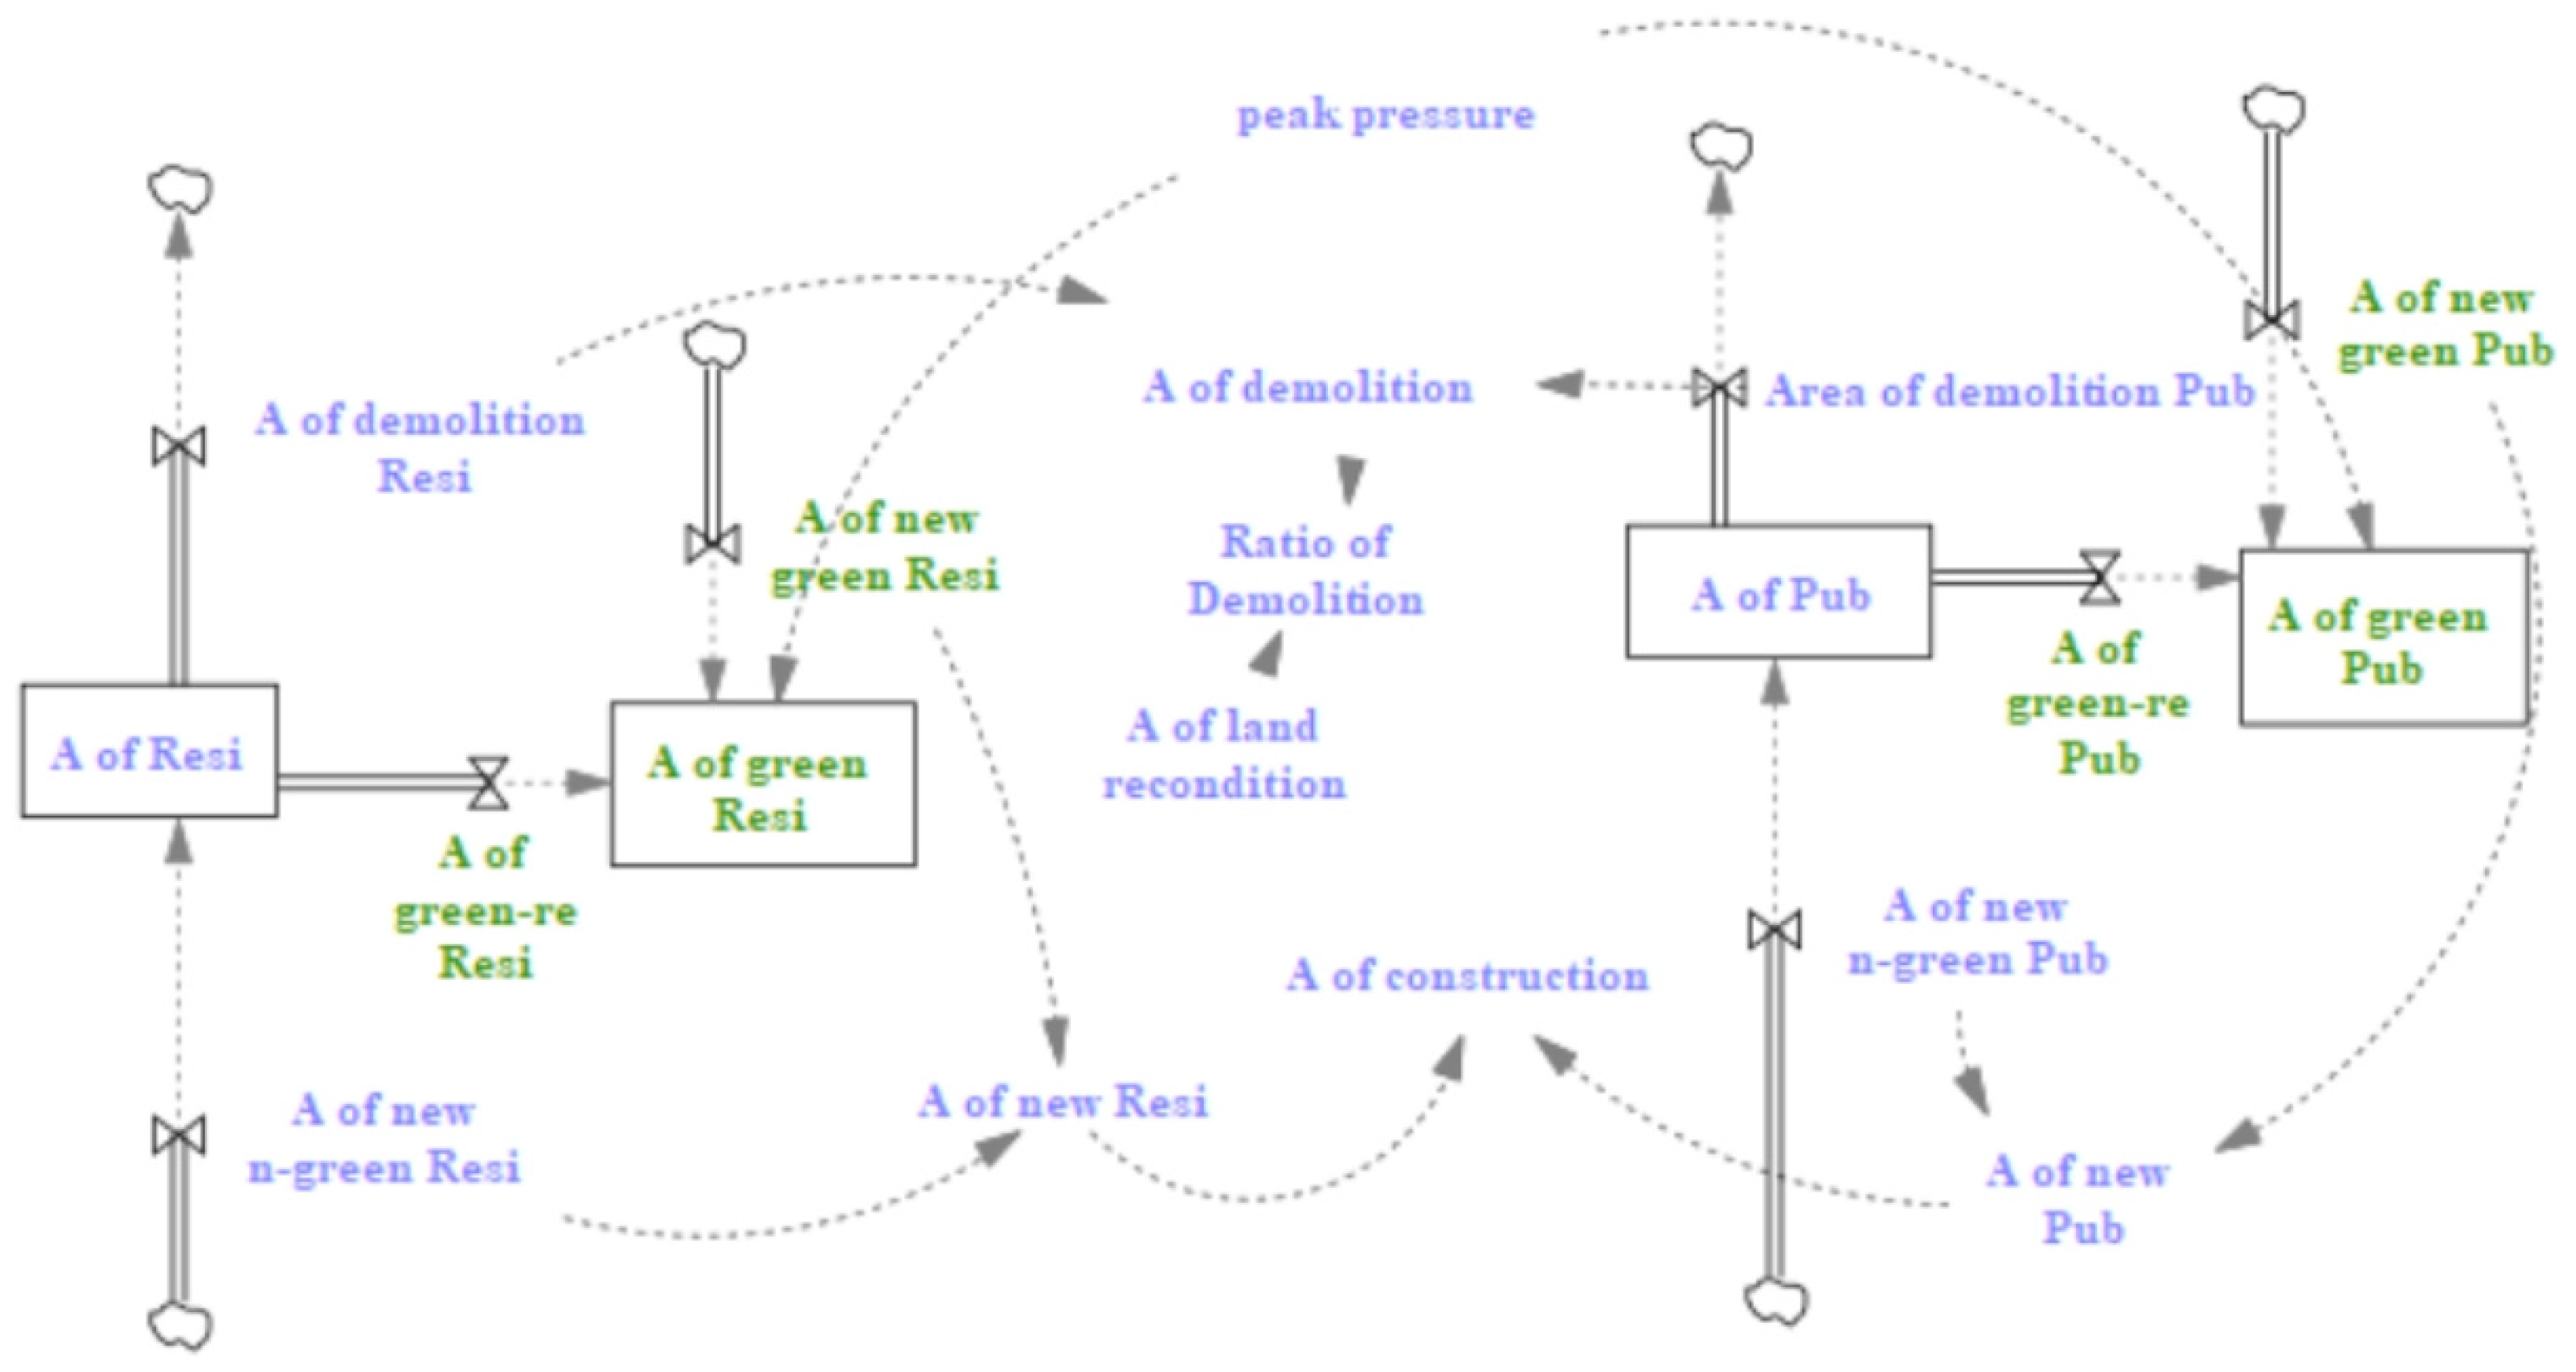
2.2. The LEAP-SD Carbon Emission Simulation Model
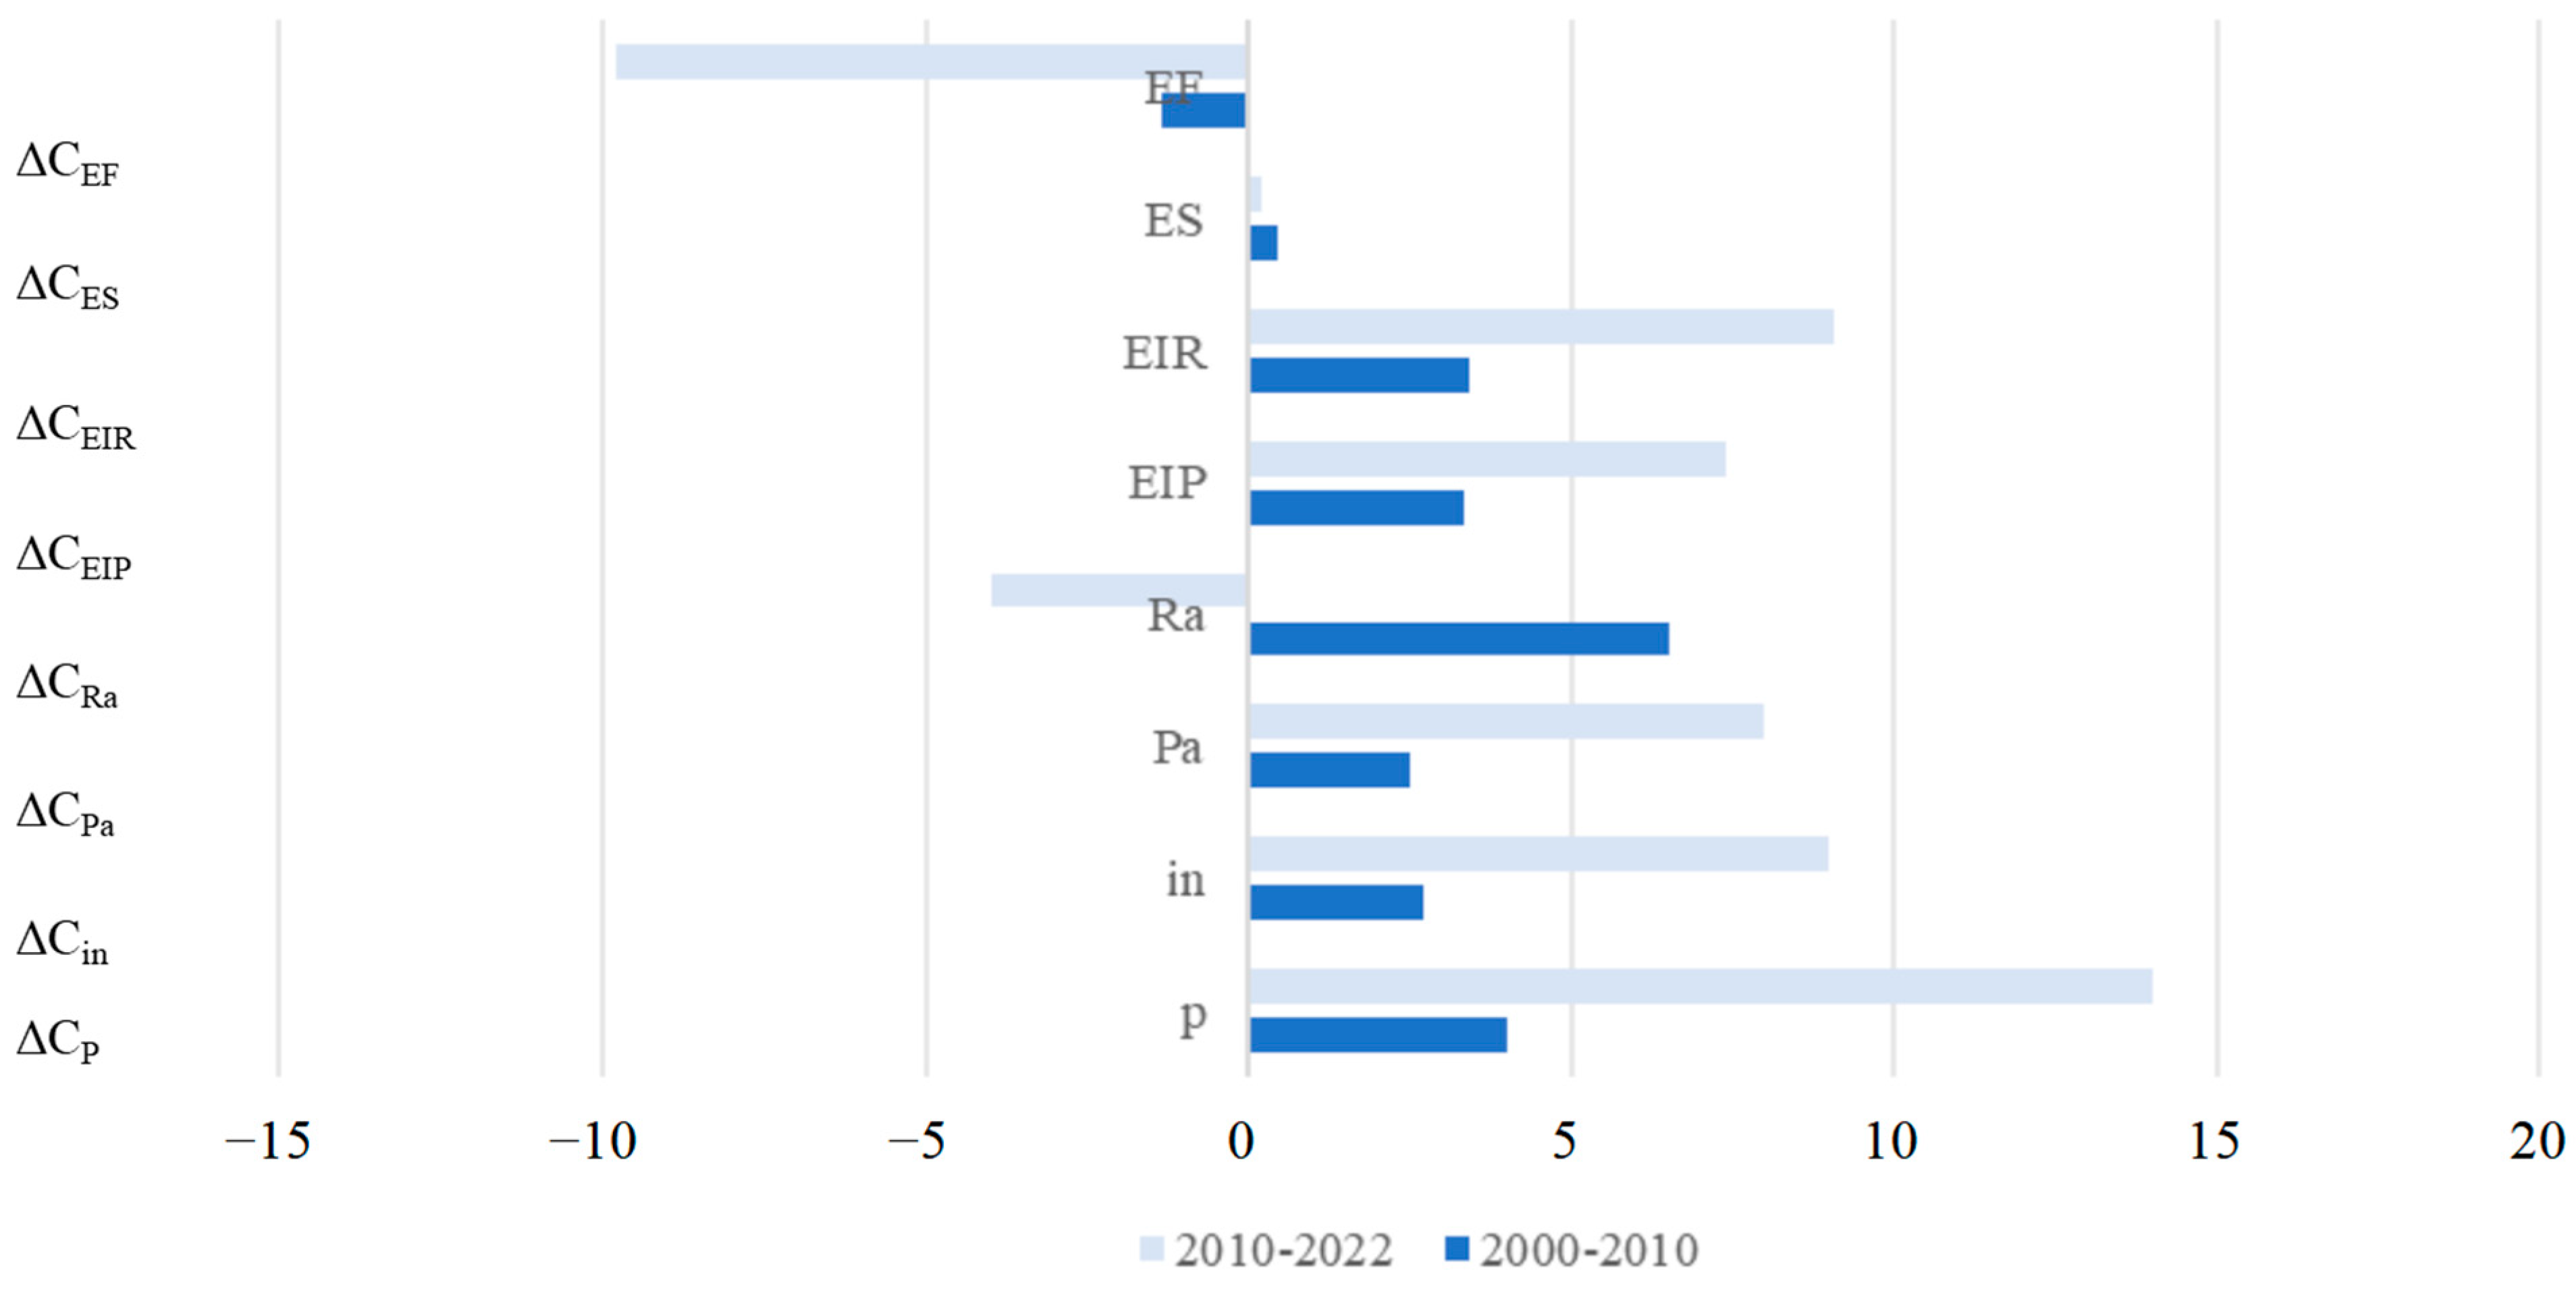
2.2.1. LMDI Driving Factors Analysis
2.2.2. LEAP-SD Model
2.2.3. Model Validation
2.3. Scenarios Simulation Design
3. The Annual Life-Cycle Carbon Emissions Calculation
3.1. Data Preprocessing Method
3.2. Data Preprocessing and Carbon Emission Calculation
3.2.1. Building Production and Materialization Stage (S1)
- (1)
- Building materialization (E1MA1)
- (2)
- Building construction (E1CO)
3.2.2. Building Operation and Maintenance Stage (S2)
3.2.3. Building Demolition and Recycling Stage (S3)
4. Simulation Results of the Leap-SD Model
4.1. Historical Carbon Emission
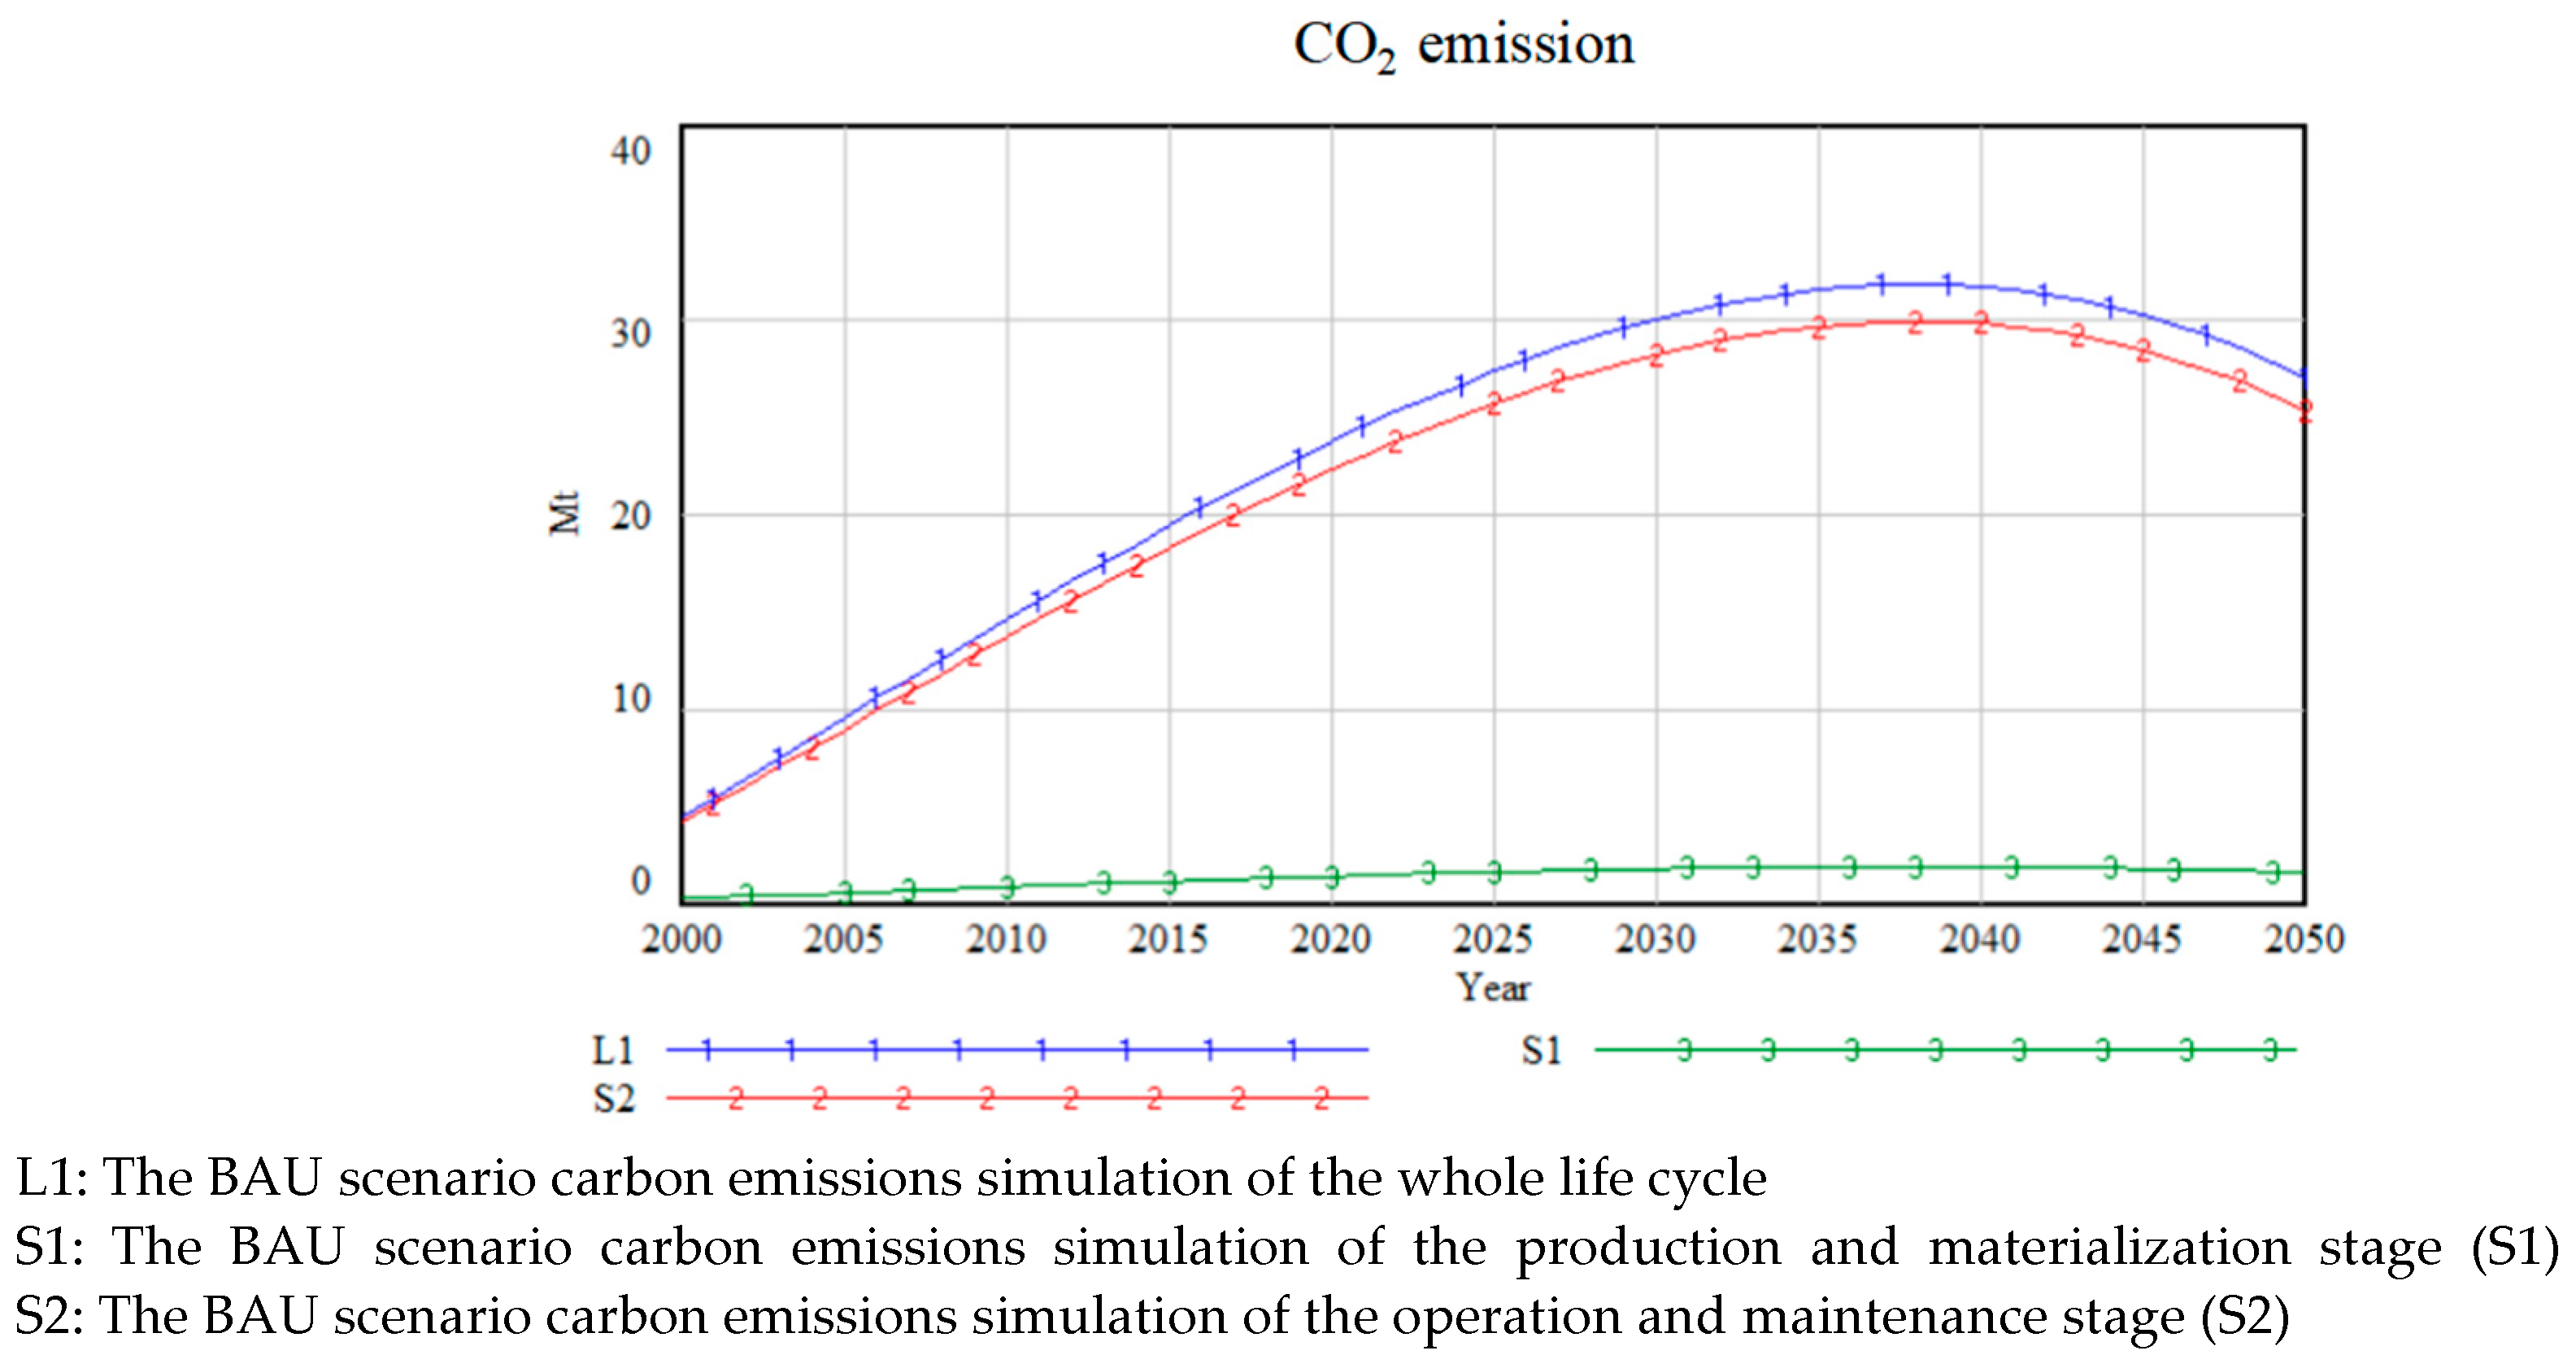
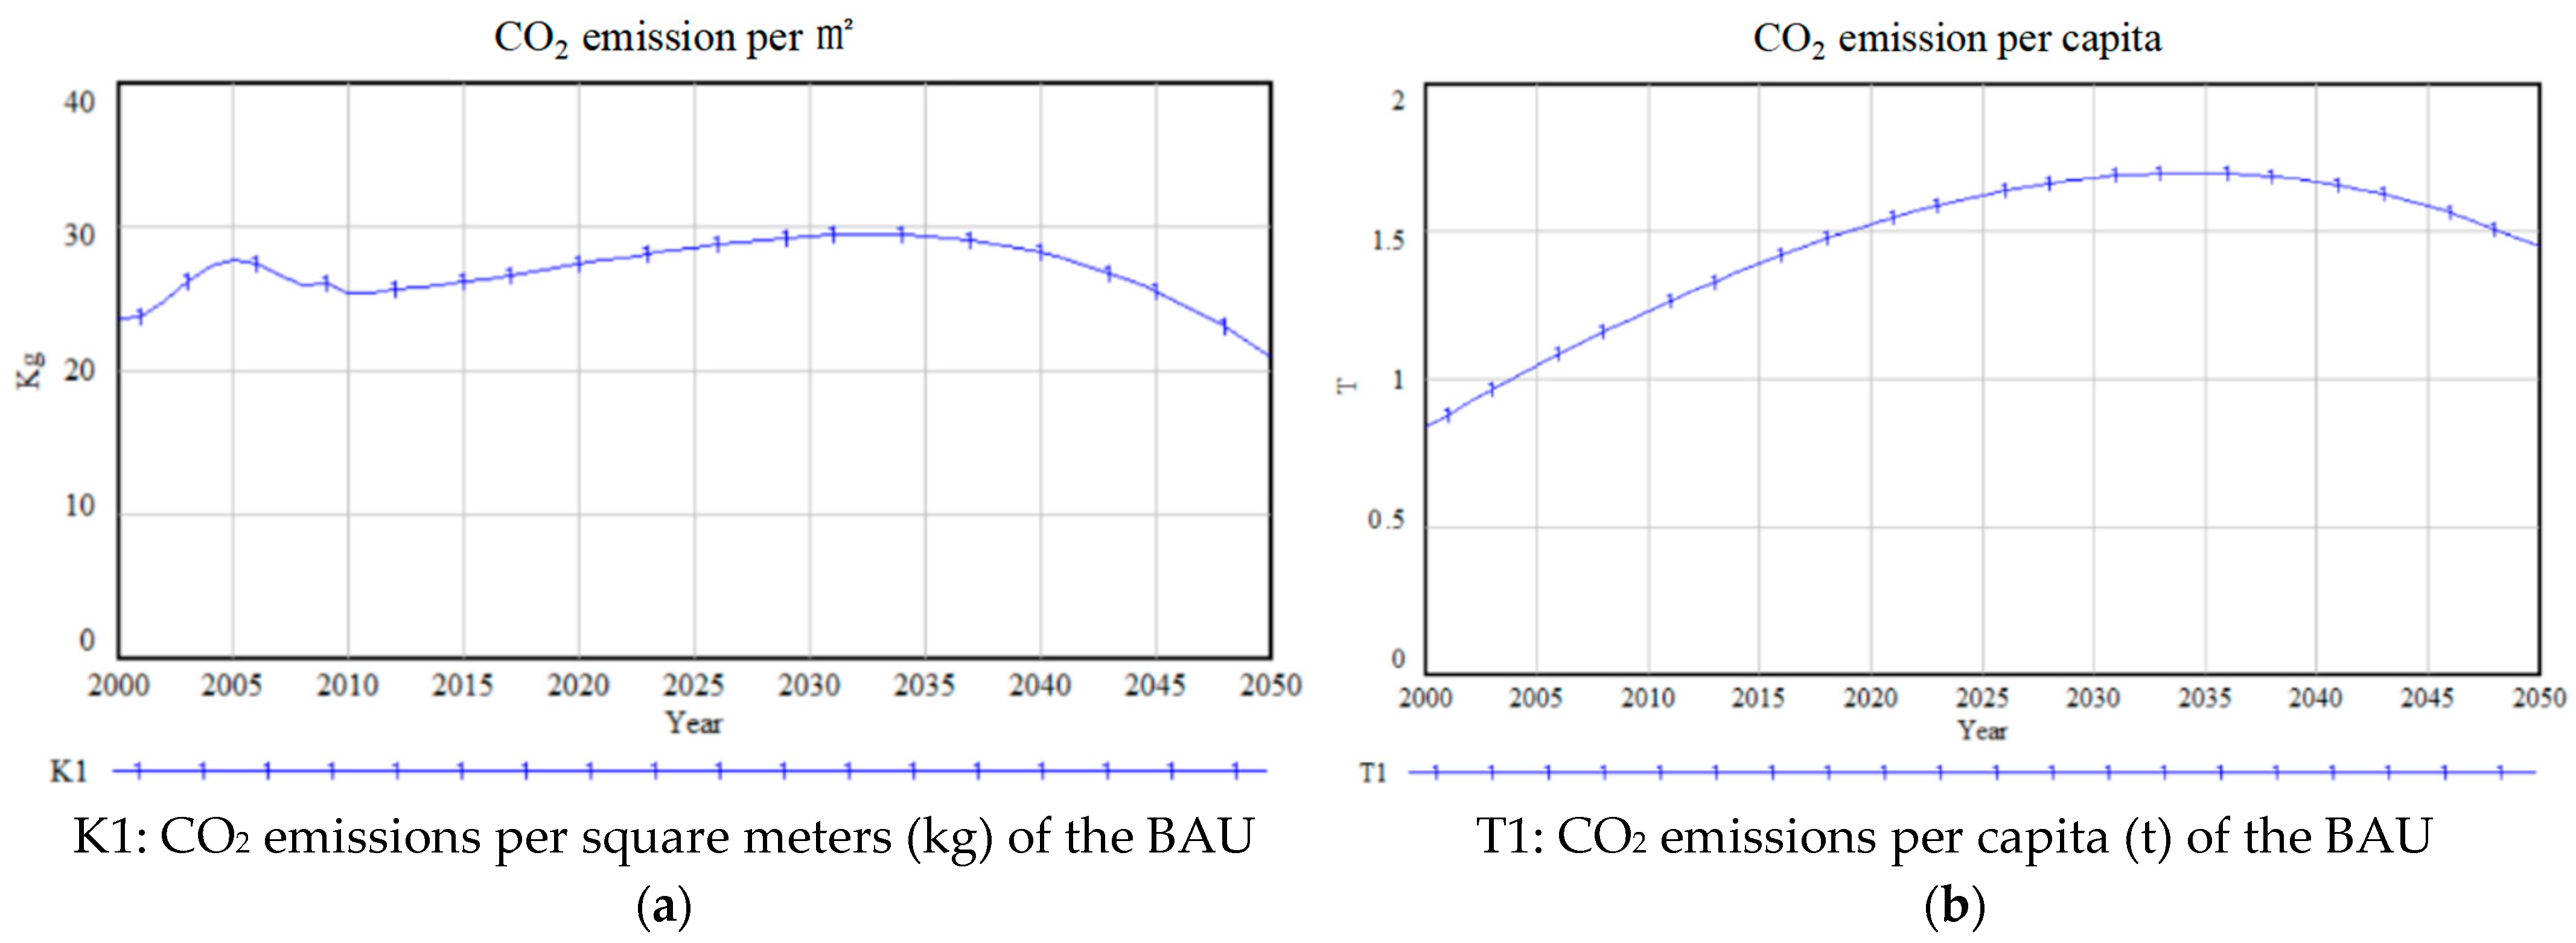
4.2. BAU Scenario
- Parameters settings
- 2.
- BAU result
4.3. Single Factor Scenario Analysis
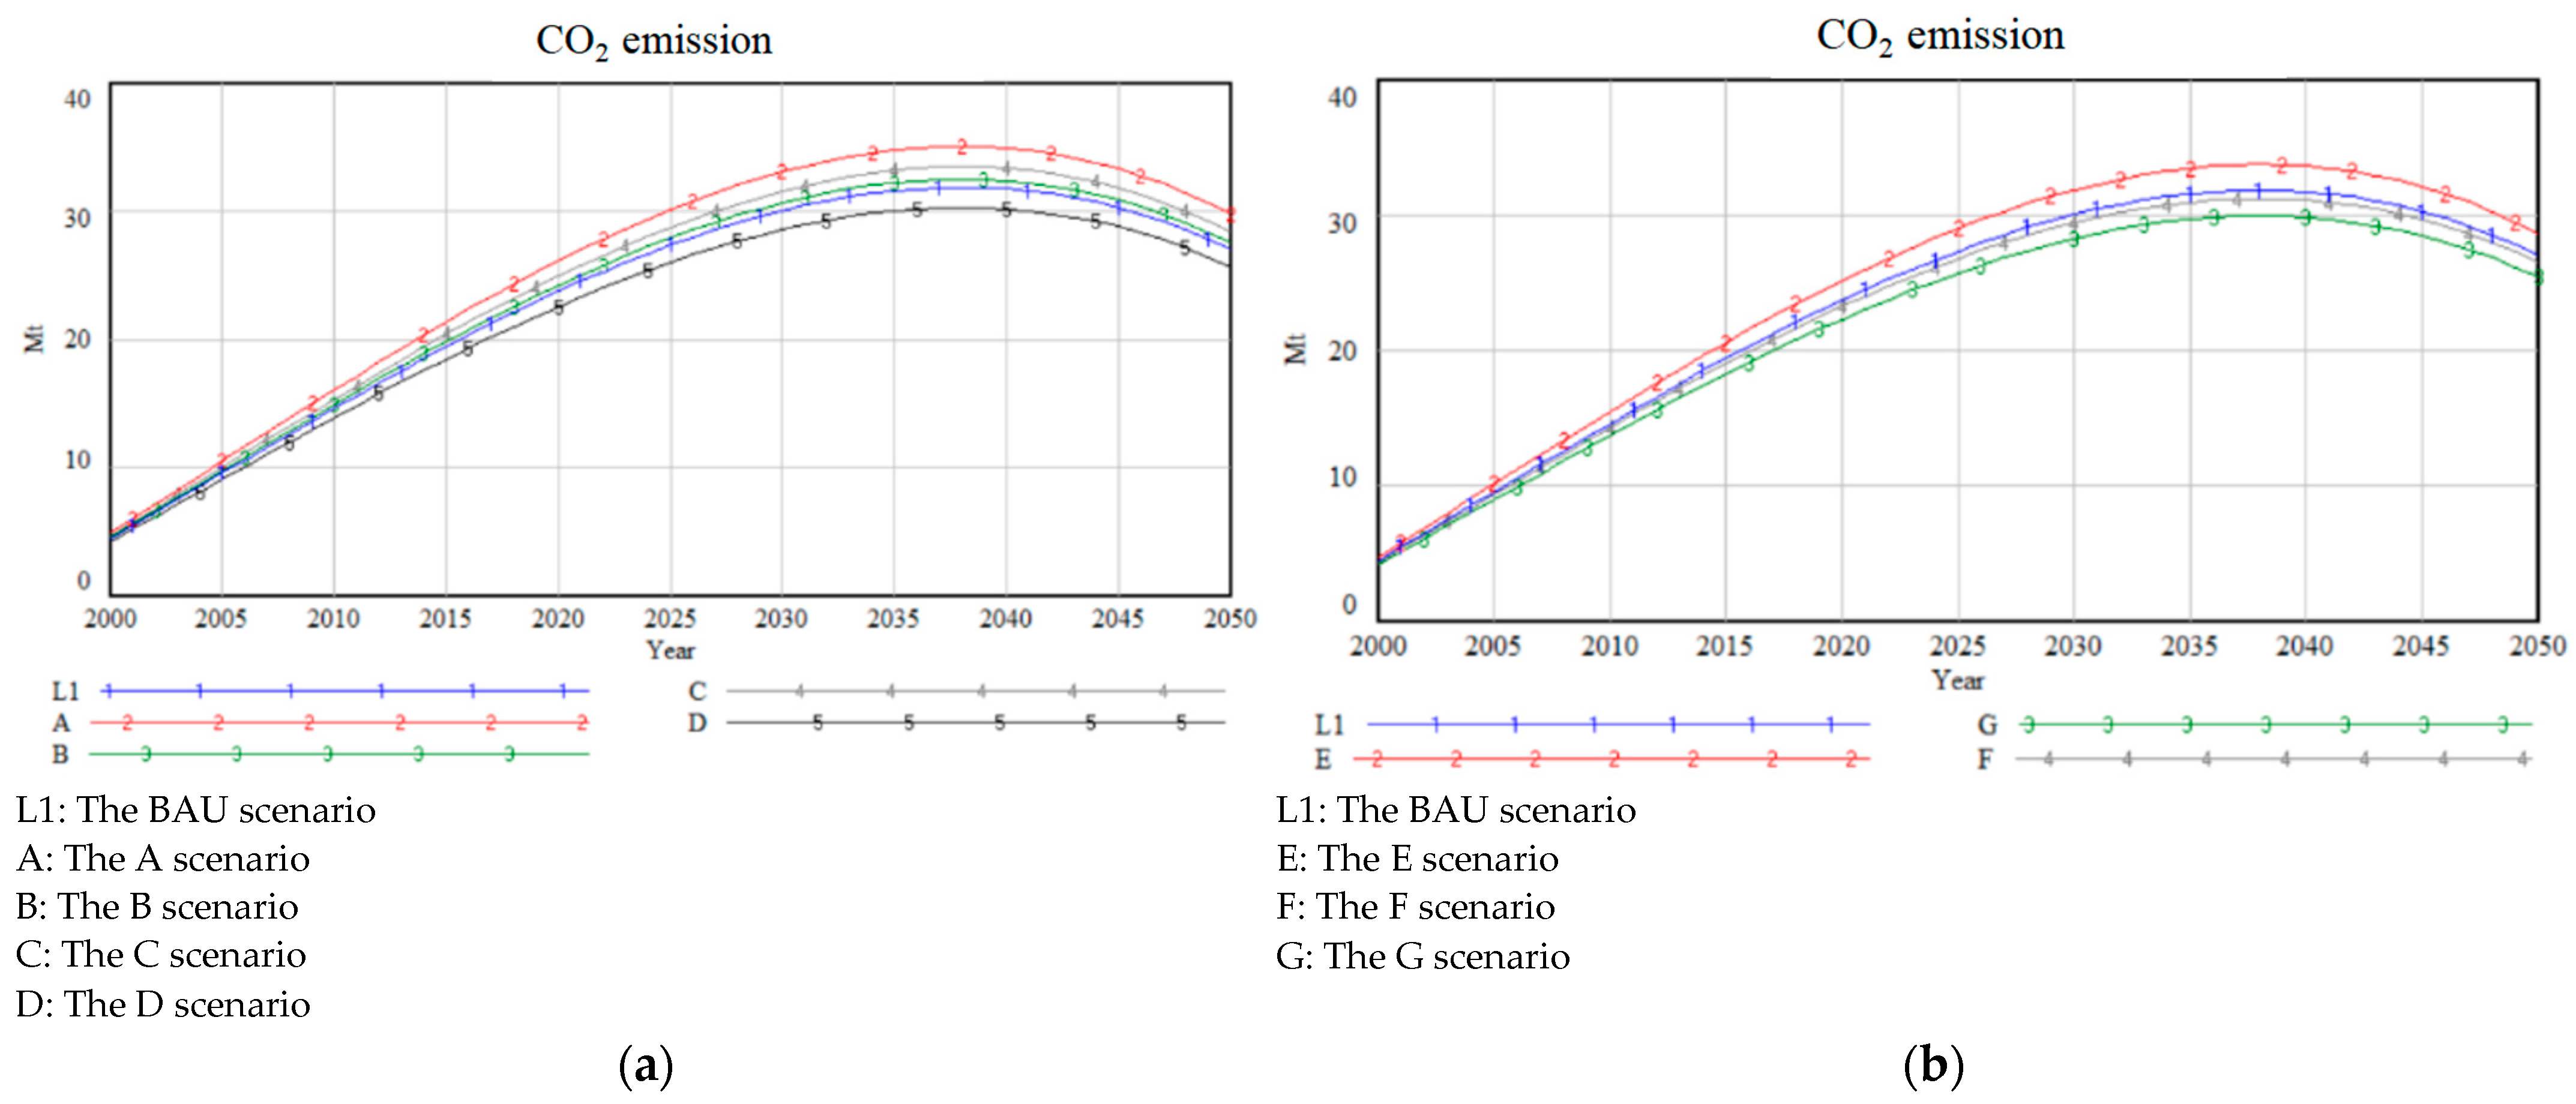
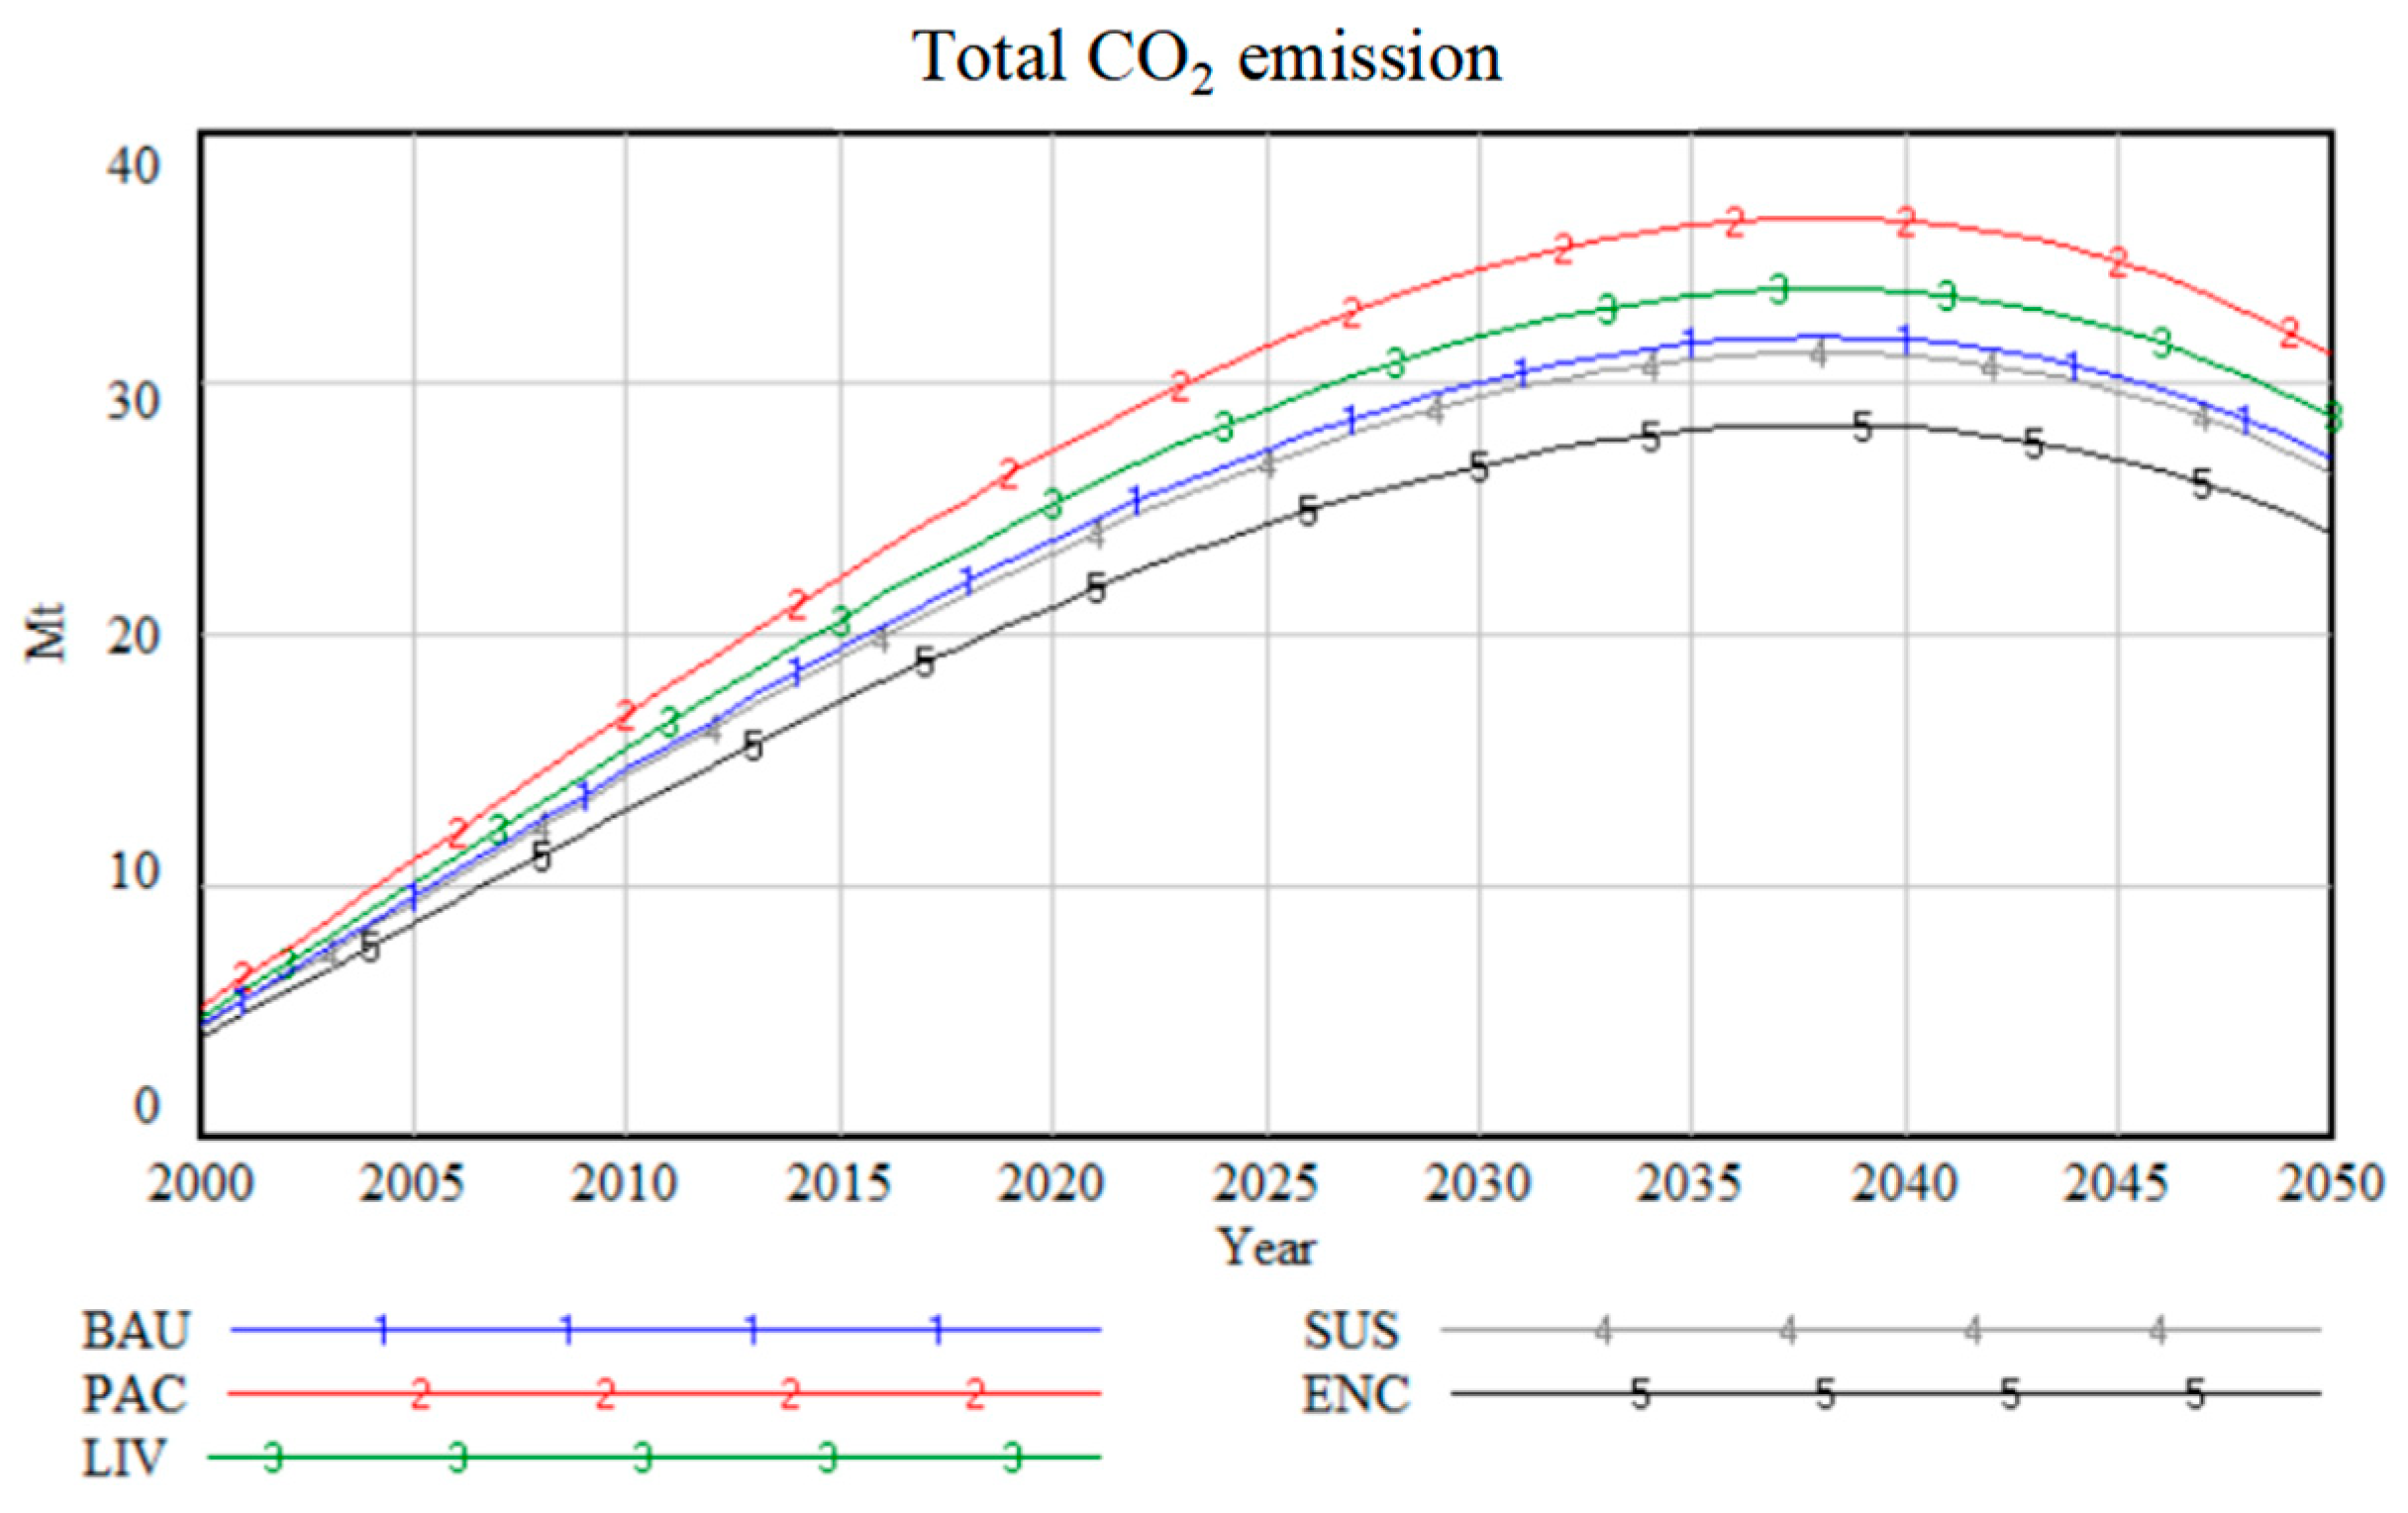
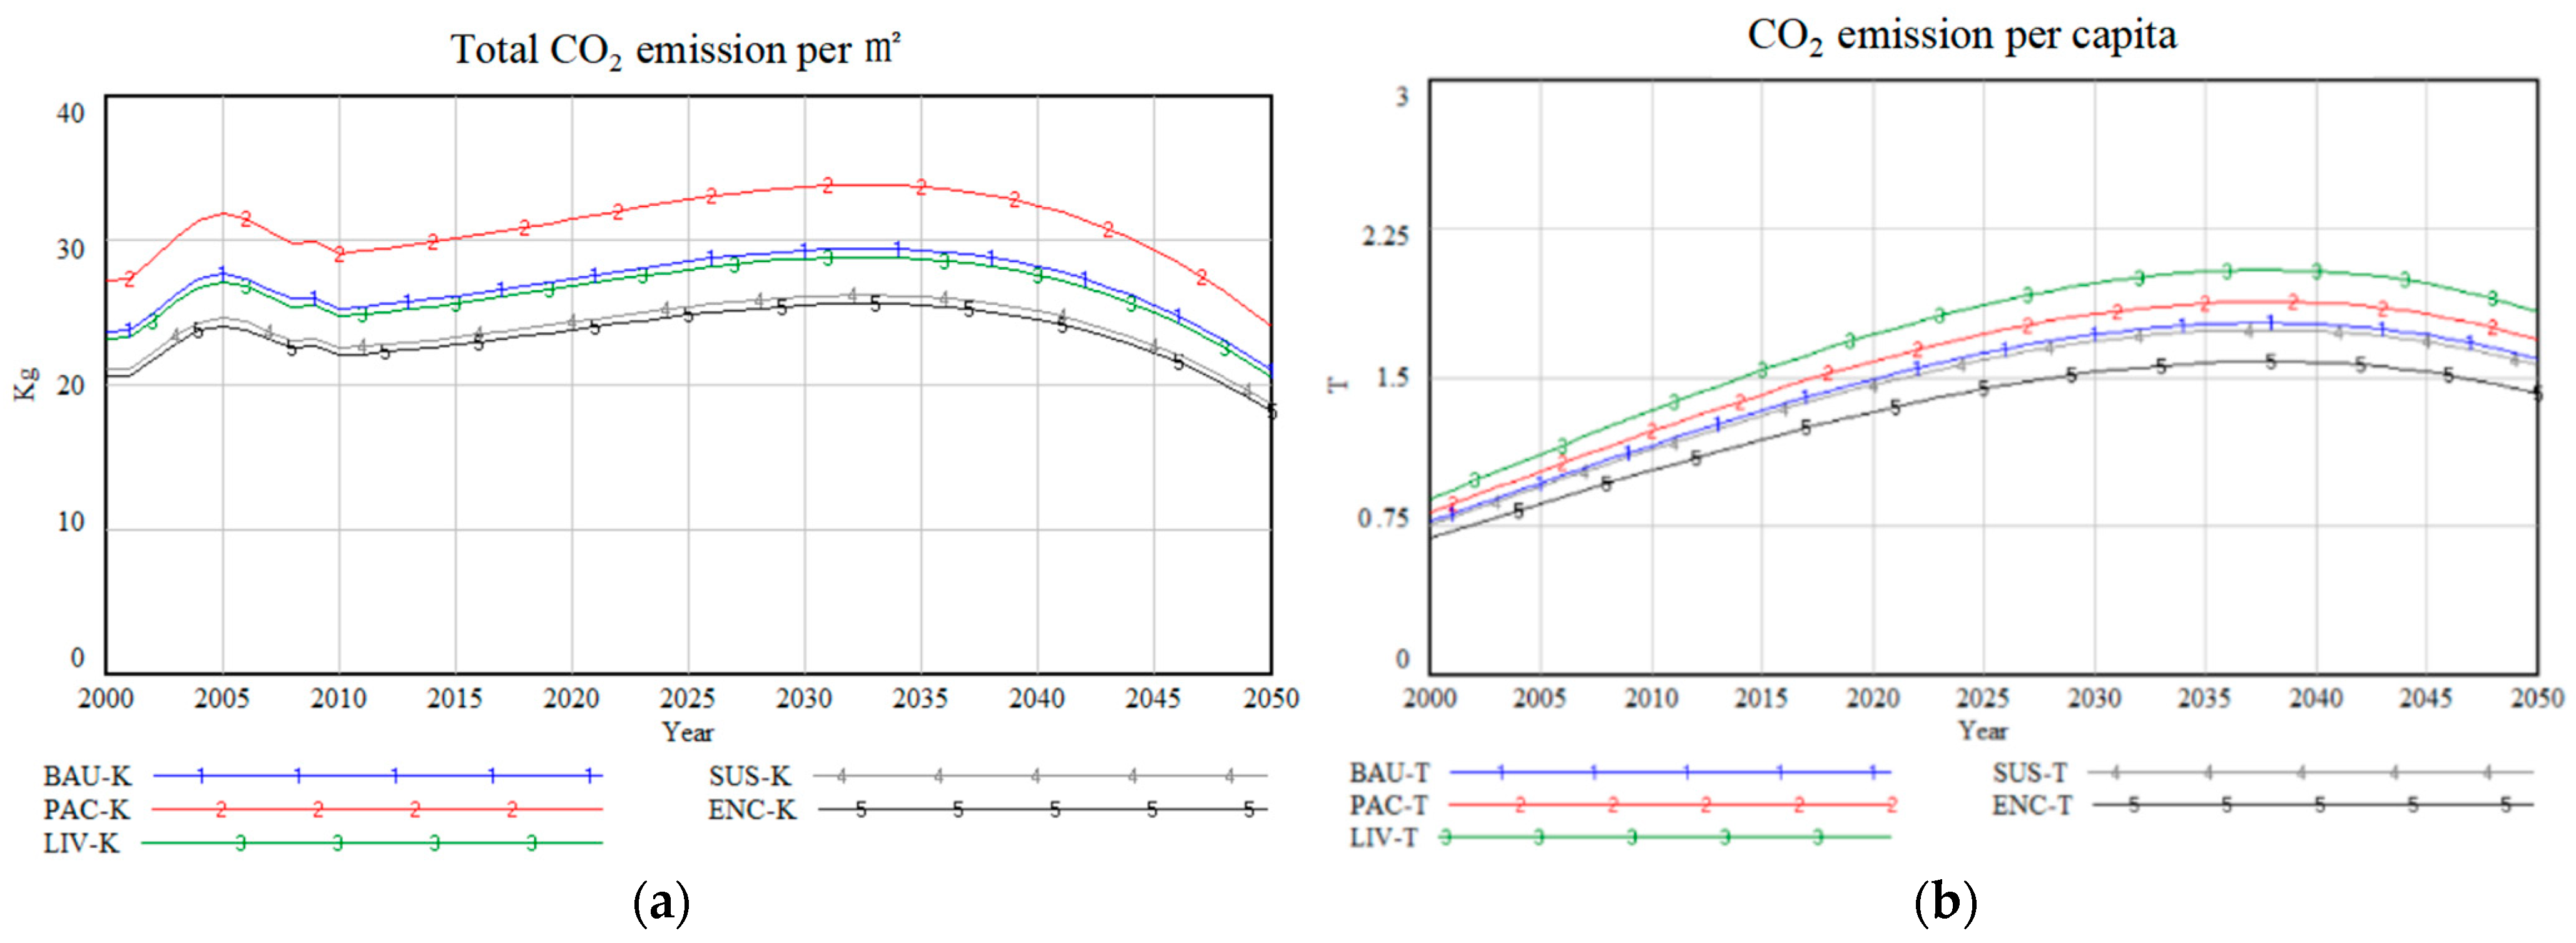
4.4. Scenarios Simulation
4.4.1. Urban Population Accelerated (PAC)
4.4.2. Urban Livable (LIV)
4.4.3. Energy Controlled (ENC)
4.4.4. Sustainable Development (SUS)
5. Discussions
6. Conclusions and Policy Recommendations
Author Contributions
Funding
Data Availability Statement
Acknowledgments
Conflicts of Interest
Appendix A

| Indicators | True Value | Predicted Value | |||||
|---|---|---|---|---|---|---|---|
| 2020 | 2025 | 2030 | 2035 | 2040 | 2045 | 2050 | |
| Public building area (10,000 square meters) | 30,547.0 | 31,285.0 | 35,301.7 | 44,893.9 | 46,906.2 | 49,736.7 | 52,952.9 |
| Per capita public floor area (square meter) | 17.3 | 17.11 | 19.1 | 24.1 | 23.9 | 23.9 | 24.1 |
| Residential building area (10,000 square meters) | 60,908.0 | 62,226.1 | 65,307.3 | 69,347.9 | 74,506.1 | 80,517.9 | 87,487.3 |
| Per capita residential floor area (square meter) | 34.5 | 34.0 | 35.4 | 37.3 | 38.0 | 38.8 | 39.8 |
| Demolition area (10,000 square meters) | 3000 | 4200 | 2700 | 2707.5 | 2256 | 2106 | 1804 |
| Indicators | True Value | Predicted Value | |||||
|---|---|---|---|---|---|---|---|
| 2020 | 2025 | 2030 | 2035 | 2040 | 2045 | 2050 | |
| Energy saving area of public buildings (10,000 square meters) | 6203.5 | 10,619.8 | 12,622.2 | 15,141.6 | 18,254.9 | 22,464.7 | 27,480.9 |
| Proportion of energy-saving area in public buildings | 21% | 34% | 36% | 34% | 39% | 45% | 52% |
| Proportion of energy saving area in residential buildings | 12% | 20% | 24% | 30% | 35% | 42% | 48% |
| Indicators | True Value | Predicted Value | |||||
|---|---|---|---|---|---|---|---|
| 2020 | 2025 | 2030 | 2020 | 2025 | 2045 | 2020 | |
| Electricity carbon emissions factor (tCO2/MWh) | 0.39 | 0.39 | 0.39 | 0.39 | 0.35 | 0.35 | 0.32 |
References
- UN. 2021 Global Status Report for Buildings and Construction; UN: New York, NY, USA, 2022. [Google Scholar]
- CABEE. Annual Research Report on China’s Building Energy Consumption 2021; China Association of Building Energy Efficiency: Beijing, China, 2021. [Google Scholar]
- UN. UN Chief Promotes “Enormous” Benefits of Greener Cities; UN: New York, NY, USA, 2021. [Google Scholar]
- Xing, P.; Wang, Y.; Ye, T.; Sun, Y.; Li, Q.; Li, X.; Li, M.; Chen, W. Carbon Emission Efficiency of 284 Cities in China Based on Machine Learning Approach: Driving Factors and Regional Heterogeneity. Energy Econ. 2024, 129, 107222. [Google Scholar] [CrossRef]
- Guo, S.; Jiang, Y.; Hu, S. The Pathways toward Carbon Peak and Carbon Neutrality in China’s Building Sector. Chin. J. Urban Environ. Stud. 2022, 10, 2250011. [Google Scholar] [CrossRef]
- Jiang, J.-J.; Ye, B.; Zeng, Z.-Z.; Liu, J.-G.; Yang, X. Potential and Roadmap of CO2 Emission Reduction in Urban Buildings: Case Study of Shenzhen. Adv. Clim. Chang. Res. 2022, 13, 587–599. [Google Scholar] [CrossRef]
- Xin, L.; Li, S.; Rene, E.R.; Lun, X.; Zhang, P.; Ma, W. Prediction of Carbon Emissions Peak and Carbon Neutrality Based on Life Cycle CO2 Emissions in Megacity Building Sector: Dynamic Scenario Simulations of Beijing. Environ. Res. 2023, 238, 117160. [Google Scholar] [CrossRef] [PubMed]
- You, X.; Li, Q.; Monahan, K.M.; Fan, F.; Ke, H.; Hong, N. Can Collaborative Innovation Constrain Ecological Footprint? Empirical Evidence from Guangdong-Hong Kong-Macao Greater Bay Area, China. Environ. Sci. Pollut. Res. 2022, 29, 54476–54491. [Google Scholar] [CrossRef]
- Berrill, P.; Wilson, E.J.H.; Reyna, J.L.; Fontanini, A.D.; Hertwich, E.G. Decarbonization Pathways for the Residential Sector in the United States. Nat. Clim. Chang. 2022, 12, 712–718. [Google Scholar] [CrossRef]
- Yu, Y.; You, K.; Cai, W.; Feng, W.; Li, R.; Liu, Q.; Chen, L.; Liu, Y. City-Level Building Operation and End-Use Carbon Emissions Dataset from China for 2015–2020. Sci. Data 2024, 11, 138. [Google Scholar] [CrossRef]
- Xu, G.; Wang, W. China’s Energy Consumption in Construction and Building Sectors: An Outlook to 2100. Energy 2020, 195, 117045. [Google Scholar] [CrossRef]
- Xiang, X.; Zhou, N.; Ma, M.; Feng, W.; Yan, R. Global Transition of Operational Carbon in Residential Buildings since the Millennium. Adv. Appl. Energy 2023, 11, 100145. [Google Scholar] [CrossRef]
- Zhong, X.; Hu, M.; Deetman, S.; Steubing, B.; Lin, H.X.; Hernandez, G.A.; Harpprecht, C.; Zhang, C.; Tukker, A.; Behrens, P. Global Greenhouse Gas Emissions from Residential and Commercial Building Materials and Mitigation Strategies to 2060. Nat. Commun. 2021, 12, 6126. [Google Scholar] [CrossRef]
- Ürge-Vorsatz, D.; Khosla, R.; Bernhardt, R.; Chan, Y.C.; Vérez, D.; Hu, S.; Cabeza, L.F. Advances Toward a Net-Zero Global Building Sector. Annu. Rev. Environ. Resour. 2020, 45, 227–269. [Google Scholar] [CrossRef]
- Sun, X.; Mi, Z.; Zhang, J.; Li, J. Driving Factors of Carbon Emissions from Household Energy Combustion in China. Energy Policy 2024, 186, 114013. [Google Scholar] [CrossRef]
- Ma, M.; Ma, X.; Cai, W.; Cai, W. Carbon-Dioxide Mitigation in the Residential Building Sector: A Household Scale-Based Assessment. Energy Convers. Manag. 2019, 198, 111915. [Google Scholar] [CrossRef]
- Ma, M.; Cai, W. Do Commercial Building Sector-Derived Carbon Emissions Decouple from the Economic Growth in Tertiary Industry? A Case Study of Four Municipalities in China. Sci. Total Environ. 2019, 650, 822–834. [Google Scholar] [CrossRef]
- Huang, Z.; Zhou, H.; Miao, Z.; Tang, H.; Lin, B.; Zhuang, W. Life-Cycle Carbon Emissions (LCCE) of Buildings: Implications, Calculations, and Reductions. Engineering 2024, 35, 115–139. [Google Scholar] [CrossRef]
- Huo, T.; Xu, L.; Liu, B.; Cai, W.; Feng, W. China’s Commercial Building Carbon Emissions toward 2060: An Integrated Dynamic Emission Assessment Model. Appl. Energy 2022, 325, 119828. [Google Scholar] [CrossRef]
- Zhang, Y.; Yan, D.; Hu, S.; Guo, S. Modelling of Energy Consumption and Carbon Emission from the Building Construction Sector in China, a Process-Based LCA Approach. Energy Policy 2019, 134, 110949. [Google Scholar] [CrossRef]
- Falana, J.; Osei-Kyei, R.; Tam, V.W. Towards Achieving a Net Zero Carbon Building: A Review of Key Stakeholders and Their Roles in Net Zero Carbon Building Whole Life Cycle. J. Build. Eng. 2024, 82, 108223. [Google Scholar] [CrossRef]
- Zhu, C.; Li, X.; Zhu, W.; Gong, W. Embodied Carbon Emissions and Mitigation Potential in China’s Building Sector: An Outlook to 2060. Energy Policy 2022, 170, 113222. [Google Scholar] [CrossRef]
- Zhang, J.; Hou, Y.; Liu, S.; Gong, L. Can the Energy Internet Promote China’s Energy System to Achieve Carbon Emission Peak Goal? J. Clean. Prod. 2023, 417, 138014. [Google Scholar] [CrossRef]
- Zhang, C.; Zhou, Y.; Li, Z. Low-Carbon Innovation, Economic Growth, and CO2 Emissions: Evidence from a Dynamic Spatial Panel Approach in China. Environ. Sci. Pollut. Res. 2023, 30, 25792–25816. [Google Scholar] [CrossRef] [PubMed]
- Shuai, C.; Chen, X.; Shen, L.; Jiao, L.; Wu, Y.; Tan, Y. The Turning Points of Carbon Kuznets Curve: Evidences from Panel and Time-Series Data of 164 Countries. J. Clean. Prod. 2017, 162, 1031–1047. [Google Scholar] [CrossRef]
- Chen, X.; Shuai, C.; Wu, Y.; Zhang, Y. Analysis on the Carbon Emission Peaks of China’s Industrial, Building, Transport, and Agricultural Sectors. Sci. Total Environ. 2020, 709, 135768. [Google Scholar] [CrossRef] [PubMed]
- Nakano, S.; Washizu, A. A Study on Energy Tax Reform for Carbon Pricing Using an Input-Output Table for the Analysis of a Next-Generation Energy System. Energies 2022, 15, 2162. [Google Scholar] [CrossRef]
- Liu, H.; Yan, F.; Tian, H. Towards Low-Carbon Cities: Patch-Based Multi-Objective Optimization of Land Use Allocation Using an Improved Non-Dominated Sorting Genetic Algorithm-II. Ecol. Indic. 2022, 134, 108455. [Google Scholar] [CrossRef]
- Ang, B.W.; Liu, N. Handling Zero Values in the Logarithmic Mean Divisia Index Decomposition Approach. Energy Policy 2007, 35, 238–246. [Google Scholar] [CrossRef]
- Huo, T.; Du, Q.; Xu, L.; Shi, Q.; Cong, X.; Cai, W. Timetable and Roadmap for Achieving Carbon Peak and Carbon Neutrality of China’s Building Sector. Energy 2023, 274, 127330. [Google Scholar] [CrossRef]
- Zhou, N.; Khanna, N.; Feng, W.; Ke, J.; Levine, M. Scenarios of Energy Efficiency and CO2 Emissions Reduction Potential in the Buildings Sector in China to Year 2050. Nat. Energy 2018, 3, 978–984. [Google Scholar] [CrossRef]
- Gu, S.; Fu, B.; Thriveni, T.; Fujita, T.; Ahn, J.W. Coupled LMDI and System Dynamics Model for Estimating Urban CO2 Emission Mitigation Potential in Shanghai, China. J. Clean. Prod. 2019, 240, 118034. [Google Scholar] [CrossRef]
- Liu, D.; Xiao, B. Can China Achieve Its Carbon Emission Peaking? A Scenario Analysis Based on STIRPAT and System Dynamics Model. Ecol. Indic. 2018, 93, 647–657. [Google Scholar] [CrossRef]
- Li, F.; Zhang, D.; Zhang, J.; Kou, G. Measuring the Energy Production and Utilization Efficiency of Chinese Thermal Power Industry with the Fixed-Sum Carbon Emission Constraint. Int. J. Prod. Econ. 2022, 252, 108571. [Google Scholar] [CrossRef]
- Lin, G.; Jiang, D.; Yin, Y.; Fu, J. A Carbon-Neutral Scenario Simulation of an Urban Land–Energy–Water Coupling System: A Case Study of Shenzhen, China. J. Clean. Prod. 2023, 383, 135534. [Google Scholar] [CrossRef]
- Zhao, F.; Hu, Z.; Zhao, X. Multi-Scenario Prediction and Path Optimization of Industrial Carbon Unlocking in China. J. Clean. Prod. 2023, 421, 138534. [Google Scholar] [CrossRef]
- Huo, T.; Ma, Y.; Xu, L.; Feng, W.; Cai, W. Carbon Emissions in China’s Urban Residential Building Sector through 2060: A Dynamic Scenario Simulation. Energy 2022, 254, 124395. [Google Scholar] [CrossRef]
- Zhu, W.; Huang, B.; Zhao, J.; Chen, X.; Sun, C. Impacts on the Embodied Carbon Emissions in China’s Building Sector and Its Related Energy-Intensive Industries from Energy-Saving Technologies Perspective: A Dynamic CGE Analysis. Energy Build. 2023, 287, 112926. [Google Scholar] [CrossRef]
- Li, X.; Lin, C.; Lin, M.; Jim, C.Y. Drivers, Scenario Prediction and Policy Simulation of the Carbon Emission System in Fujian Province (China). J. Clean. Prod. 2024, 434, 140375. [Google Scholar] [CrossRef]
- Zhao, G.; Yu, B.; An, R.; Wu, Y.; Zhao, Z. Energy System Transformations and Carbon Emission Mitigation for China to Achieve Global 2 °C Climate Target. J. Environ. Manag. 2021, 292, 112721. [Google Scholar] [CrossRef] [PubMed]
- Luo, X.; Liu, C.; Zhao, H. Driving Factors and Emission Reduction Scenarios Analysis of CO2 Emissions in Guangdong-Hong Kong-Macao Greater Bay Area and Surrounding Cities Based on LMDI and System Dynamics. Sci. Total Environ. 2023, 870, 161966. [Google Scholar] [CrossRef] [PubMed]
- Du, Q.; Yang, M.; Wang, Y.; Wang, X.; Dong, Y. Dynamic Simulation for Carbon Emission Reduction Effects of the Prefabricated Building Supply Chain under Environmental Policies. Sustain. Cities Soc. 2024, 100, 105027. [Google Scholar] [CrossRef]
- Cao, Y.; Zhao, Y.; Wen, L.; Li, Y.; Li, H.; Wang, S.; Liu, Y.; Shi, Q.; Weng, J. System Dynamics Simulation for CO2 Emission Mitigation in Green Electric-Coal Supply Chain. J. Clean. Prod. 2019, 232, 759–773. [Google Scholar] [CrossRef]
- Chi, Y.; Zhao, H.; Hu, Y.; Yuan, Y.; Pang, Y. The Impact of Allocation Methods on Carbon Emission Trading under Electricity Marketization Reform in China: A System Dynamics Analysis. Energy 2022, 259, 125034. [Google Scholar] [CrossRef]
- Shenzhen Bureau of Statistics. Statistical Bulletin of Shenzhen’s National Economic and Social Development in 2022; Shenzhen Bureau of Statistics: Shenzhen, China, 2023. [Google Scholar]
- Cheng, J.; Chen, M.; Tang, S. Shenzhen—A Typical Benchmark of Chinese Rapid Urbanization Miracle. Cities 2023, 140, 104421. [Google Scholar] [CrossRef]
- SJG21-2011; Construction Waste Emission Reduction Technical Code. Shenzhen Municipal Housing and Construction Bureau: Shenzhen, China, 2011.
- Zhu, C.; Chang, Y.; Li, X.; Shan, M. Factors Influencing Embodied Carbon Emissions of China’s Building Sector: An Analysis Based on Extended STIRPAT Modeling. Energy Build. 2022, 255, 111607. [Google Scholar] [CrossRef]
- Liu, L.; Tam, V.W.Y.; Almeida, L.; Le, K.N. Dynamically Assessing Life Cycle Energy Consumption of Buildings at a National Scale by 2020: An Empirical Study in China. Energy Build. 2023, 296, 113354. [Google Scholar] [CrossRef]
- Heaps, C.G. LEAP: The Low Emissions Analysis Platform, version 36; Stockholm Environment Institute: Stockholm, Sweden, 2022. [Google Scholar]
- Lin, L.; Jiang, Y.; Yan, D.; Peng, C. Analysis of Generalized Construction Energy Consumption and CO2 Emission in Chinese Construction Industry. Energy China 2015, 37, 5–9. [Google Scholar]
- Shenzhen Municipal People’s Government. Shenzhen Municipality’s Fourteenth Five-Year Plan for National Economic and Social Development and Outline of Long-Term Goals for 2035; Shenzhen Municipal People’s Government: Shenzhen, China, 2021. [Google Scholar]
- Shenzhen Municipal Planning and Natural Resources Bureau. Shenzhen Land and Space Master Plan (2020–2035); Shenzhen Municipal Planning and Natural Resources Bureau: Shenzhen, China, 2021. [Google Scholar]
- Li, R.; Chen, L.; Cai, W.; You, K.; Li, Z.; Ran, L. Historical Peak Situation of Building Carbon Emissions in Different Climate Regions in China: Causes of Differences and Peak Challenges. Sci. Total Environ. 2023, 903, 166621. [Google Scholar] [CrossRef]
- China Building Energy Efficiency Association Building Energy Consumption; Carbon Emission Committee. 2022 China Building Energy Consumption and Carbon Emissions Research Report; China Building Energy Efficiency Association: Beijing, China, 2022. [Google Scholar]
- Shenzhen Institute of Building Research. Pathways of Building Electrification and Urban Energy Transform Summary Report; Shenzhen Institute of Building Research: Shenzhen, China, 2021. [Google Scholar]
- Hussain, M.; Zheng, B.; Chi, H.-L.; Hsu, S.-C.; Chen, J.-H. Automated and Continuous BIM-Based Life Cycle Carbon Assessment for Infrastructure Design Projects. Resour. Conserv. Recycl. 2023, 190, 106848. [Google Scholar] [CrossRef]
- Peking University HSBC Business School. Industrial Structure of Shenzhen in 2021; Peking University HSBC Business School: Shenzhen, China, 2021. [Google Scholar]
- Liu, J.; Wang, Z.; Duan, Y.; Li, X.; Zhang, M.; Liu, H.; Xue, P.; Gong, H.; Wang, X.; Chen, Y.; et al. Effects of Land Use Patterns on the Interannual Variations of Carbon Sinks of Terrestrial Ecosystems in China. Ecol. Indic. 2023, 146, 109914. [Google Scholar] [CrossRef]
- Xu, L.; He, N.; Li, M.; Cai, W.; Yu, G. Spatiotemporal Dynamics of Carbon Sinks in China’s Terrestrial Ecosystems from 2010 to 2060. Resour. Conserv. Recycl. 2024, 203, 107457. [Google Scholar] [CrossRef]
- Zhu, W.; Feng, W.; Li, X.; Zhang, Z. Analysis of the Embodied Carbon Dioxide in the Building Sector: A Case of China. J. Clean. Prod. 2020, 269, 122438. [Google Scholar] [CrossRef]
- Watari, T.; Cao, Z.; Hata, S.; Nansai, K. Efficient Use of Cement and Concrete to Reduce Reliance on Supply-Side Technologies for Net-Zero Emissions. Nat. Commun. 2022, 13, 4158. [Google Scholar] [CrossRef] [PubMed]
- Lu, H.; You, K.; Feng, W.; Zhou, N.; Fridley, D.; Price, L.; de la Rue du Can, S. Reducing China’s Building Material Embodied Emissions: Opportunities and Challenges to Achieve Carbon Neutrality in Building Materials. iScience 2024, 27, 109028. [Google Scholar] [CrossRef] [PubMed]
- Jalaei, F.; Masoudi, R.; Guest, G. A Framework for Specifying Low-Carbon Construction Materials in Government Procurement: A Case Study for Concrete in a New Building Investment. J. Clean. Prod. 2022, 345, 131056. [Google Scholar] [CrossRef]
- Wang, H.; Wang, Y.; Zhao, L.; Wang, W.; Luo, Z.; Wang, Z.; Luo, J.; Lv, Y. Integrating BIM and Machine Learning to Predict Carbon Emissions under Foundation Materialization Stage: Case Study of China’s 35 Public Buildings. Front. Archit. Res. 2024, 13, 876–894. [Google Scholar] [CrossRef]
- Cheng, Y.; Xu, Z. Do Model Cities Play a Leading Role? Evaluating the Carbon Abatement Effects of Energy Saving and Emission Reduction Demonstration Cities in China. Environ. Impact Assess. Rev. 2024, 105, 107457. [Google Scholar] [CrossRef]
- Wang, J.; Wu, H.; Duan, H.; Zillante, G.; Zuo, J.; Yuan, H. Combining Life Cycle Assessment and Building Information Modelling to Account for Carbon Emission of Building Demolition Waste: A Case Study. J. Clean. Prod. 2018, 172, 3154–3166. [Google Scholar] [CrossRef]
- Hao, J.L.; Ma, W. Evaluating Carbon Emissions of Construction and Demolition Waste in Building Energy Retrofit Projects. Energy 2023, 281, 128201. [Google Scholar] [CrossRef]


| Stages | Formula | Key Indicators |
|---|---|---|
| Production materialization stage (S1) | Building materialization (E1MA1) E1MA1 = | The production of major building materials (within the accounting city boundaries); Consumption of each fuel type; CO2 coefficient of each fuel type |
| Building material transportation (E1MA2) E1MA2 = | The consumption of main building materials, the average transport distance of main building materials; CO2 factor per unit weight distance transported | |
| Building construction (E1CO) E1CO = | The total amount of energy used in the construction phase; CO2 factors of each energy sources | |
| Operation and maintenance stage (S2) | Building operation (E2OP) E2OP = | The total consumption of various energy sources at the use stage; CO2 factors of each energy sources |
| Building maintenance (E2RE) Included in (E1CO) | — | |
| Demolition and recycling stage (S3) | Building demolition (E3DE) E3DE = | The total consumption of various energy sources in the demolition stage; CO2 factors of each energy sources |
| Building waste disposal (E3WA1) E3WA1 = | The amount of waste to be treated, the number of various forms of energy consumed by waste treatment; CO2 factors of each energy sources | |
| Building waste transportation (E3WA2) E3WA2 = | Quantity and method of disposal of waste, average transport distance |
| No | Indicator | Abbreviation |
|---|---|---|
| 1 | population | P |
| 2 | disposable income | in |
| 3 | per capita public building area | Pa |
| 4 | per capita residential building area | Ra |
| 5 | energy intensity per public building unit area | EIP |
| 6 | energy intensity per residential building unit area | EIR |
| 7 | energy structure | ES |
| 8 | electricity carbon emission factor | EF |
| No | Scenarios | Abbreviation | Population Effect | Floor Area Effect | Energy Intensity Effect |
|---|---|---|---|---|---|
| 1 | Business as usual | BAU | Middle | Middle | Middle |
| 2 | Urban population accelerated | PAC | High +3% | Middle | High +5% |
| 3 | Urban livable | LIV | Middle | High +15% | Middle |
| 4 | Energy controlled | ENC | Middle | Middle | Low −10% |
| 5 | Sustainable development | SUS | Middle | High +10% | Low −5% |
| Building Material | Production of Guangdong Province Industrial Distribution of Guangdong | Industrial Distribution of Guangdong Province | Production of Shenzhen |
|---|---|---|---|
| steel | Large consumer, insufficient production supply, is the finished steel and billet outsourcing province | Mainly distributed in Shaoguan, Zhanjiang, Yunfu cities | Can be ignored |
| cement | Cement production province, output first in the country | Mainly distributed in Guangzhou, Shenzhen only 3 enterprises (accounting for 0.5% of the total number of enterprises) | Estimated at 0.5% of total provincial production |
| glass | Construction glass deep processing province, sufficient production supply, the number of enterprises ranked first in the country | Mainly distributed in Dongguan, Foshan, and Zhongshan | Can be ignored |
| aluminum | Aluminum production province, the national output ranks third, the number of enterprises is first in the country | Mainly concentrated in Dongguan, Guangzhou | Can be ignored |
| Indicators | True Value | Predicted Value | |||||
|---|---|---|---|---|---|---|---|
| 2020 | 2025 | 2030 | 2035 | 2040 | 2045 | 2050 | |
| GDP (100 million yuan) | 26,992.3 | 374,927.8 | 449,892.8 | 53,984.7 | 688,996.2 | 879,353.1 | 11,223.0 |
| GDP growth rate | 14% | 5% | 5% | 5% | 5% | 5% | 5% |
| Resident population (10,000) | 1763.4 | 1828.2 | 1844.1 | 1860.0 | 1958.1 | 2075.6 | 2200.0 |
| No | Abbreviations | Peak Time | Peak Value (MtCO2) |
|---|---|---|---|
| 1 | BAU | 2038 (±2) | 32.30 (±15%) |
| 2 | PAC | 2042 (±2) | 35.25 (±15%) |
| 3 | LIV | 2040 (±2) | 33.10 (±15%) |
| 4 | ENC | 2033 (±2) | 28.50 (±15%) |
| 5 | SUS | 2036 (±2) | 31.50 (±15%) |
Disclaimer/Publisher’s Note: The statements, opinions and data contained in all publications are solely those of the individual author(s) and contributor(s) and not of MDPI and/or the editor(s). MDPI and/or the editor(s) disclaim responsibility for any injury to people or property resulting from any ideas, methods, instructions or products referred to in the content. |
© 2024 by the authors. Licensee MDPI, Basel, Switzerland. This article is an open access article distributed under the terms and conditions of the Creative Commons Attribution (CC BY) license (https://creativecommons.org/licenses/by/4.0/).
Share and Cite
Du, Y.; Liu, H.; Du, T.; Liu, J.; Yin, L.; Yang, Y. Dynamic Simulation of Carbon Emission Peak in City-Scale Building Sector: A Life-Cycle Approach Based on LEAP-SD Model. Energies 2024, 17, 5334. https://doi.org/10.3390/en17215334
Du Y, Liu H, Du T, Liu J, Yin L, Yang Y. Dynamic Simulation of Carbon Emission Peak in City-Scale Building Sector: A Life-Cycle Approach Based on LEAP-SD Model. Energies. 2024; 17(21):5334. https://doi.org/10.3390/en17215334
Chicago/Turabian StyleDu, Yawei, Hongjiang Liu, Tiantian Du, Junyue Liu, Ling Yin, and Yang Yang. 2024. "Dynamic Simulation of Carbon Emission Peak in City-Scale Building Sector: A Life-Cycle Approach Based on LEAP-SD Model" Energies 17, no. 21: 5334. https://doi.org/10.3390/en17215334
APA StyleDu, Y., Liu, H., Du, T., Liu, J., Yin, L., & Yang, Y. (2024). Dynamic Simulation of Carbon Emission Peak in City-Scale Building Sector: A Life-Cycle Approach Based on LEAP-SD Model. Energies, 17(21), 5334. https://doi.org/10.3390/en17215334