Article

The Coefficient of Reactivity and Activation Energy as the Criteria of Assessment of the Influence of Sustainable Aviation Fuels on Combustion Process in a Rapid Compression Combustion Machine and a Turbine Engine

by
Andrzej Kulczycki
1,
Tomasz Białecki
1,
Anna Łęgowik
1,
Jerzy Merkisz
2,* and
Ireneusz Pielecha
2
1
Air Force Institute of Technology, ul. Księcia Bolesława 6, 01-494 Warsaw, Poland
2
Faculty of Civil and Transport Engineering, Poznan University of Technology, ul. Piotrowo 3, 60-965 Poznan, Poland
*
Author to whom correspondence should be addressed.
Energies 2024, 17(20), 5232; https://doi.org/10.3390/en17205232
Submission received: 19 September 2024 / Revised: 15 October 2024 / Accepted: 18 October 2024 / Published: 21 October 2024
(This article belongs to the Special Issue Sustainable Technologies for Decarbonising the Energy Sector)

Abstract

:
Aviation in Europe is required to use fuels containing up to 2 wt. % of sustainable aviation fuels (SAFs). A better understanding of the impact of SAFs on the combustion process will be helpful in solving problems that may arise from the widespread use of these kinds of fuels. It was assumed that the reactivity coefficient α i and the activation energy could be a criteria for assessing the impact of SAFs on the combustion process. Based on DGEN engine tests, the following activation energy values of C O 2 and C O formation reactions were obtained—Jet A-1: E a C O 2 / R = 3480 and E a C O / R = 982 ; A30: E a C O 2 / R = 3705 and E a C O / R = 2903 ; and H30: E a C O 2 / R = 3637 and E a C O / R = 2843 . These results indicate differences in the structure of combustion reaction chains involved by the SAF addition to Jet A-1 fuel. The same conclusion has been formulated on the basis of the reactivity coefficient αi. The values of maximum cylinder pressure (Pmax) obtained during indicator RCCM (rapid compression combustion machine) tests correlated with both the activation energy and coefficients of reactivity. This suggests that the influence of SAF addition to Jet A-1 fuel on the structure of chemical reactions chain during RCCM tests is similar to the influence during DGEN 380 tests. The assumption stated above was confirmed. This indicates the possibility of the preliminary forecasting of C O 2 and C O emissions from the DGEN 380 engine based on the test at the RCCM stand.

1. Introduction

The increasing pressure on the aviation sector to reduce greenhouse gas emissions means that the chemical composition of fuels for turbine aircraft engines will change as a result of the introduction of various sustainable aviation fuels (SAFs) [1,2]. This may affect the operation of engines and their durability and reliability. As a result, adding SAFs to fuels should be assessed in terms of the effects on flight safety. Gan et al. [3] emphasized that safety is the most important condition for using the new fuel. Fuel quality is known to have a direct impact on flight safety. The quality of aviation fuel is determined through production, storage, transport and distribution. Fuel quality affects ignition and re-ignition, flame extinguishment, combustion efficiency and the life of hot tip components, which under the worst conditions can result in dangerous accidents. All these accidents may occur as a result of changes in the fuel structure related to the chemical composition of Jet A-1 fuel and, consequently, as a result of changes in combustion chemistry. There have been differences between the SAF safety requirements and the ASTM standards due to differences in the goal of each of the standards. Airworthiness standards focused on aircraft engines. However, ASTM standards covered fuel properties, and the physicochemical properties requirements for SAF were limited to those previously specified for Jet-A or Jet-A1.
The testing algorithm for the approval of the new SAF fuel developed by ASTM assumed a number of testing stages, including engine testing [4,5,6]. These tests are long-lasting and expensive and require the consumption of a relatively large amount of tested fuel [7]. This situation generated interest in new tests and research methods that would allow for the selection of new SAFs obtained from new raw materials or using new technologies.
Typical Jet A-1 is a diverse mixture of normal paraffins, isoparaffins, aromatic compounds and cycloparaffins with carbon numbers ranging from C7 to C18. Most computational models for aviation fuels have relied on simpler surrogates and chemical mechanisms developed from experimental data or fit-for-purpose relationships for specific operating points [7,8,9,10,11,12]. Yu et al. [12] used the thermophysical model of a real fluid, which was based on the equation of state, as a way to departure from the ideal gas state in order to obtain thermodynamic properties and the phase boundary and in general. The aim of their work was to establish a framework applicable to SAFs in order to assess their performances and discuss limitations and necessary improvements. Tyliszczak et al. [13] proposed the use of a real fluid modeling framework built on thermodynamic principles and generalized correlations to characterize sustainable aviation fuels over a wide range of jet engine operating conditions. They took into account fuel atomization and its evaporation, but they did not take into account the impact of SAFs on the fuel oxidation reaction in a complex chain of chemical reactions.
Smooke et al. [14] dealt with the combustion process in gas turbine simulations. The simulations were performed using a steady flamelet model with chemical mechanisms with 16 species and 25 elementary reactions [15] and for the GRI-2.11 mechanisms with 49 species and 277 elementary reactions [16]. In their conclusion, the authors noted that the kinetics of chemical reactions have a large impact on the combustion process and its proper consideration can bring the modeling results closer to experimental data.
Fuel consumption was the subject of the research of Białecki [17]. Using statistical methods, the authors determined the relationship between various physicochemical properties of fuels and fuel consumption. Their model did not take into account the complexity of the chemical reaction chains and interactions between fuels/blends components, which influence fuel consumption. In this context, the technical readiness of aircraft refueling vehicles was also analyzed [18].
Similar research has been conducted by Mehl et al. [19]. A mathematical model of the combustion process was developed using regression analysis. The model described the relationship between the physicochemical properties of fuels and selected parameters characterizing the operation of a miniature jet engine. This model enabled predicting engine operating parameters and the emissions characteristics due to the correlation between the properties of chosen fuels and the operating parameters of a miniature turbine engine.
Gan et al. [3] focused on methodological aspects related to defining general models aimed at capturing the basic aspects of fuel chemistry. The methodology adopted by the authors assumed that the research began with an experimental assessment of the oxidation of the tested fuels in well-characterized conditions. The combustion process was carried out in a high-temperature flow reactor coupled with a molecular beam mass spectrometer. This configuration allowed for an in-depth study of the relevant features of combustion chemistry by simultaneously identifying many intermediates and thus paths in the reaction chain that determine the course of the process. The proposed kinetic models require the identification of all important reaction paths controlling fuel combustion and, for each elementary step, the determination of the temperature- and pressure-dependent reaction rate. In this way, reaction rate constants, including reverse reactions, could be defined for reversible elementary steps. To achieve this, it was necessary to:
  • Identify the appropriate reaction intermediates (the number of which determines the number of equations required to calculate the composition of the system);
  • Determine the reaction rate for the thousands of parameters it contains, along with the thermodynamic properties of each species.
Gan et al. [3] pointed to significant discrepancies in modeling and experimental results, which were caused by the high complexity of the combustion process, even when measured under controlled reactor conditions.
To summarize the short review of modeling methods presented above, it can be concluded that work on the development of tools for predicting the impact of SAF on the operation and reliability of aircraft turbine engines is indeed much needed. The review showed that these methods were based on the study of the combustion reactions of surrogate fuels (single hydrocarbons), the identification of several dozen/several hundred elementary reactions and an attempt to assemble them into a combustion model using numerical tools. These models were therefore created for relatively low-complex fuels, burned in controlled and stable conditions.
It should be emphasized that the subjects of research usually included mixtures of Jet A-1 fuel with SAFs, i.e., fuels containing over a thousand chemical compounds. The question that the models should help answer is as follows: To what extent does SAFs change the fuel combustion process under specific engine operating conditions? To make this possible, the model should take into account, on the one hand, data on the chemical composition and properties of the fuel, and on the other, critical engine operating parameters. The research methods used so far to assess the possibility of using fuel for use in aviation assume a gradual complexity of the research system range from laboratory tests to stand modeling the operation of individual engine components, ending with engine tests in a dynamometer.
The main idea of models described above was to take into account as many elementary reactions as possible and numerically integrate them into one combustion reaction chain. These elementary reactions were defined for individual reagents (hydrocarbons) and were selected based on similarity to the chemical composition of the tested fuel. This approach made it possible to create a model describing the combustion process that was highly consistent with the experimental data, but inconsistencies always appear. These inconsistencies were due to two reasons:
  • Arbitrary selection of elementary reactions;
  • The model constructed in this way does not take into account the interactions between fuel components, which in some cases may change the structure of the reaction chain and the rate relations of individual elementary reactions.
Another weakness of these models was the poor connection between the fuel combustion reaction and the design and operating conditions of the engine.
Kulczycki et al. [20] previously described the reactivity model α i when applied to combustion processes.
Chemical reactivity refers to the ability of a chemical substance to undergo various reactions. Chemical reactivity is either treated as a qualitative feature of a substance or element or as a quantitative feature whose description was derived from the density functional theory. In the latter case, reactivity was related to the electronic structure of a specific reagent. The application of this concept was recently observed by Elshakre et al. [21].
The model described by Kulczycki et al. [20] introduced the coefficient of reactivity α i . This parameter is characteristic of any given fuel and is defined as the ratio of the engine operating parameters (e.g., thrust) to the parameters describing the fuel combustion kinetics. The basic difference between the models presented above is the assumption that the entire chain of fuel combustion reactions is treated as one elementary reaction. With this assumption, measurable quantities such as fuel consumption, temperature in the combustion chamber and the chemical composition of exhaust gases could be treated as quantities characterizing an elementary reaction with all its consequences. Thanks to this assumption, the activation energy can be determined using the Arrhenius equation. According to this equation, for a given elementary reaction, activation energy is a characteristic quantity with a constant value. It was assumed that if changes in engine operating parameters only caused changes in the reaction rates that made up the combustion process, then it is the same elementary reaction. In the αi reactivity model, the assumed activation energy was treated as a criterion for the invariability of the fuel combustion reaction chain. This seemed to be the most important element of the α i model—it was possible to change the engine’s operating parameters, e.g., fuel mass flow rate, and define a range of values for this parameter that would not cause changes in the combustion reaction chain, i.e., would not cause a change in the activation energy value.
Another important consequence was the ability to determine how changing the concentration of a selected fuel component would affect changes in the structure of the combustion reaction chain.
Activation energy is a quantity strongly assigned to the conditions in which the combustion process takes place. Therefore, it cannot be assigned to any given fuel and treated as a feature characterizing the fuel itself in various combustion conditions. The reactivity coefficient α i that was introduced into the reactivity model is a quantity that determines the relationship between engine operating parameters, the value of which results from fuel combustion (e.g., thrust) and the kinetic characteristics of the combustion reaction chain. The mathematical assumptions of the reactivity model introduced a limitation: both the engine operating parameters and the quantities describing the kinetics of the combustion reaction must be functions of one and the same independent variable (e.g., fuel mass flow rate). Thanks to this, the reactivity coefficient αi could be assigned to a specific fuel burned in different conditions (different engines and different engine operating conditions) as long as the structure of the combustion reaction chain remained the same in these different conditions.
Significance needs to be given to the phrase “the same combustion reactions chain”. In this application, it was assumed that the same chain meant that the changes in the combustion process conditions or/and fuel chemical structure did not introduce new elementary reactions but only changed the relations between the rate of elemental reactions. In this situation, the coefficient of reactivity αi described the property of the fuel, determining how the change in the rate (kinetic parameters) of combustion reactions caused changes in the operating parameters of the turbine engine.
The aim of this article was to verify the thesis that the reactivity coefficient α i and the activation energy (resultant for the entire combustion reactions chain), as described by Kulczycki et al. [
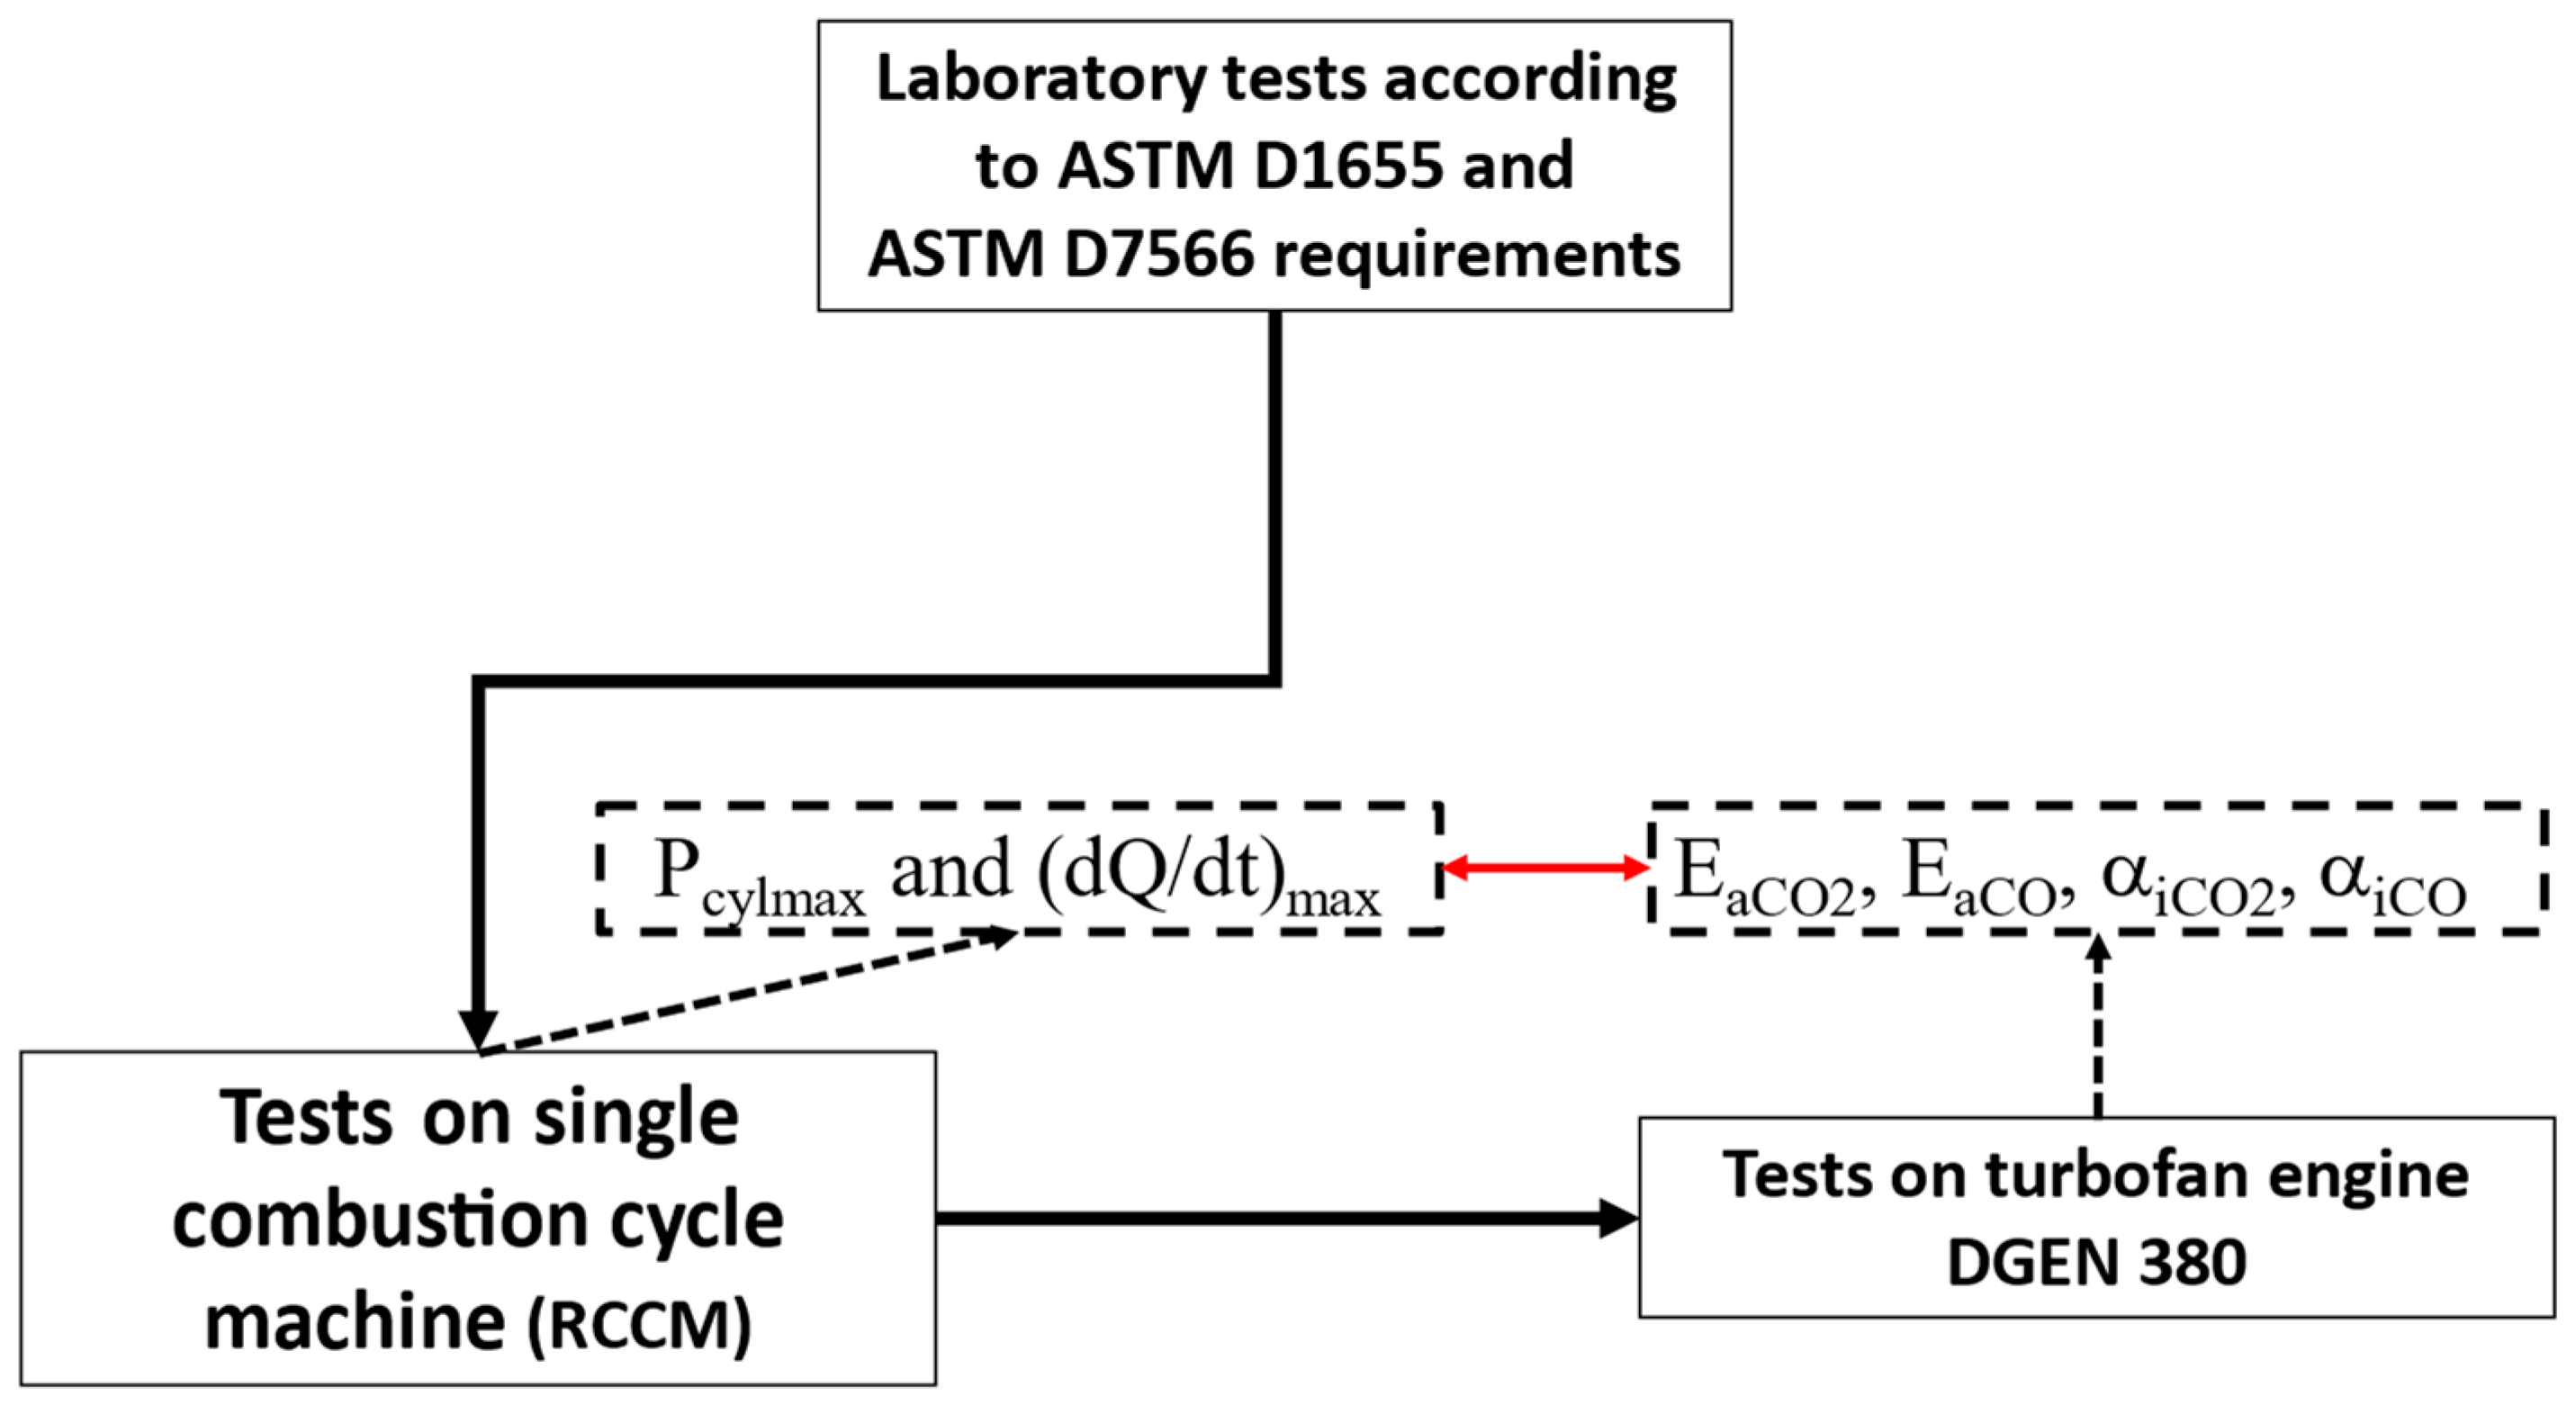
20], can be criteria for assessing the impact of SAFs (of different types and concentrations) on the combustion process in a RCCM (rapid compression combustion machine) [22,23] and turbine engine. The thesis was formulated as the α i reactivity model application enabled the use of the RCCM test results to predict the behavior of the tested fuel during combustion in turbine engine DGEN 380.

2. Materials and Methods

2.1. Materials

The tested fuels comprised Jet A-1 fossil jet fuels from different batches and blends with synthetic blending components (SBCs) A and H. These SBCs were approved by ASTM D7566 [6] to be used in aviation turbine engines. The physicochemical properties of tested fuels and their requirements according to ASTM D1655 [4] (fossil jet fuel) and ASTM D7566 (fuel blend) are shown in Table 1. All SBCs were approved as all fuel blends met appropriate standards. The prepared blends consisted of Jet A-1 and 5, 20 and 30 wt. % of two different SBCs, which are as follows:
  • Fossil jet fuel from batch No. 1—JetA-1 (A);
  • Fossil jet fuel from batch No. 2—JetA-1 (H);
  • Blend of Jet A-1 (A) with synthetic component A (95:5)—A5;
  • Blend of Jet A-1 (A) with synthetic component A (80:20)—A20;
  • Blend of Jet A-1 (A) with synthetic component A (70:30)—A30;
  • Blend of Jet A-1 (H) with synthetic component H (95:5)—H5;
  • Blend of Jet A-1 (A) with synthetic component H (80:20)—H20;
  • Blend of Jet A-1 (A) with synthetic component H (70:30)—H30.

2.2. Methodology

Regarding the main goal of this research, the following research methodology was adopted:
  • Each blend was tested in laboratory to determine its physicochemical properties and confirm that it met standard ASTM D7566 [6] requirements;
  • Two kinds of tests were carried out:
    • Single combustion cycle machine (RCCM);
    • Turbofan engine DGEN 380.
  • Tests conducted on an RCCM used maximum cylinder pressure, P m a x , and maximum heat release rate, d Q / d t m a x , as the criteria characterizing fuels behavior during combustion;
  • Tests on the DGEN 380 engine (manufacturer: Price Induction, Anglet, France) used activations energies E a C O 2 and α i C O 2 and additionally E a C O and α i C O as the criteria that characterized the complete and incomplete combustion of tested fuels;
  • The relationships between the quantities obtained using the above tests were determined.
  • The algorithm is shown in Figure 1.
In general, the reactivity coefficient α i can be presented as:
α i = L L 0 / k · D ,
where L is the work carried out by the system (e.g., by engine proportional to thrust F); L0 is the reference point, constant for the specific system and group of fuels; k is the constant rate of reaction that takes place in the system (the chain of reactions are treated as one elemental reaction); and D is the change in the internal energy of the system, caused by a chemical reaction proceeding at a rate appropriate to the unit value of k.
Kulczycki et al. [20] presented a relationship that allowed them, based on the measured operating parameters of the DGEN 380 engine, to determine the values of the activation energy of C O 2 and C O formation and the appropriate reactivity coefficients α i C O 2 and α i C O . The fuel flow rate mf was used as the independent variable, which influenced the values of other parameters treated as dependent variables. The relationships used in this paper are presented below.
It can be assumed that L was proportional to the thrust, F, which was linearly dependent on fuel flow:
F = a · m f + F 0 ,
where m f is the fuel consumption; F 0 is the reference thrust value, constant in a given engine and fuel set; and a is the empirically determined proportionality coefficient.
The work carried out by the system, L, was proportional to the thrust, F, so assuming that L is related to the unit distance, the a 1 · m f obtained from Equation (8) is equal to L L 0 .
L L 0 = a 1 · m f .
Then:
α i C O 2 = a 1 · m f / ( k C O 2 · D ) .
According to the Arrhenius equation
k C O 2 = A · e E a C O 2 / R · T ,
and
( α i C O 2 · D / a 1 ) · A · e E a C O 2 / R · T = m f .
The rate of C O 2 formation was proportional to fuel flow rate m f (corresponding to the substrate concentration CxHy), as expressed by the following kinetic equation:
d C O 2 / d t = k C O 2 · m f p O 2 q .
After integration in the limits <0, t>, the following relationship was obtained:
C O 2 = k C O 2 · m f p O 2 q · t .
Equation (4) can be used to determine the k C O 2 value as the function of the α i C O 2 coefficient, which, when introduced into Equation (8), gives Equation (9):
C O 2 = a 1 · m f / α i C O 2 · D · m f p O 2 q · t .
In cases where Equation (5) is used, the following equation, describing the relationship between C O 2 and E a C O 2 , is obtained:
C O 2 = A · e E a C O 2 / R · T · m f p O 2 q · t .
The C O is the final product of the reaction simultaneously to C O 2 formation or it is a by-product for follow-up Reactions (7) and (8):
C x H y + x 2 + y 4 O 2 x C O + y 2 H 2 O ,
C O + 1 2 O 2 C O 2 .
Then:
C O = c 2 k C O · 1 + e t / e t · c 5 k C O 2 · m f n ,
where c 2 is the coefficient determining the participation of O 2 n p x 2 + y 2 in the reaction rate (11) and c 5 is the coefficient determining the participation of O 2 n p x 2 + y 2 in the reaction rate (12).
When C O is the intermediate product of fuel oxidation to C O 2 , Equation (13) can be expressed as follows:
l n C O = ln c C O + 1 / T 4 E a C O R + E a C O 2 R + n · l n m f ,
where c C O = c 2 1 + e t / e t · c 5 . The E a C O = E a C O c h + E a C O 2 / R values were determined based on the experimentally determined relationship of [ C O ] vs. 1/T4, and E a C O c h was calculated as E a C O c h + E a C O 2 / R . The values of E a C O c h / R T 4 were used to determine the values of α i C O · D C O · A C O .
E a C O c h R T 4 = ln α i C O · D C O · A C O n 1 · l n a · m f .
It has been assumed that the reaction chains, which occur during combustion processes in the RCCM and the DGEN 380 engine, were similar. This assumption allowed for the establishment of relationships between the parameters quantitatively characterizing the combustion processes of the fuels tested in the RCCM and the DGEN 380 engine. Consequently, the relationship between RCCM criteria P m a x and d Q / d t m a x and the variables characterizing the combustion process for different fuels in DGEN engine should be determined. Ultimately, in this case, where the relationships between P m a x and d Q / d t m a x on the one hand and E a C O 2 , α i C O 2 , E a C O and α i C O on the other hand can be determined, the RCCM tests can be used to predict the influence of SAFs on the combustion process, including C O 2 and C O emissions from a turbine engine based on Equations (9), (10), (14) and (15).

2.3. Experimental Methods

In this research, two kinds of test setups were used:
  • Rapid compression combustion machine;
  • DGEN 380 turbofan.
Indicator tests were performed using a rapid compression combustion machine. This singe-cycle machine was used to analyze the injection [30,31] and combustion processes [32,33,34,35,36], because it allows a reduction in costs and an increase in the intensity of research work compared to the use of transparent engines. Tests using a single-cycle machine were performed with a view to adapting the obtained results to combustion engine use.
Studies using the RCCM system were used for the initial verification of the combustion process. They only indicated the directions of changes in the pre-flame processes and the combustion process and the differences in fuel combustion. Such studies were not possible on a turbojet engine. For this reason, a RCCM was used to analyze the so-called basic aspects of the combustion process. Not only were the results analyzed but also the whole combustion process.
The RCCM (Table 2, Figure 2a) was fitted with the measurement-actuation equipment. The components of the equipment were coupled together through the HSD Sequencer C711 with a pre-programmed sequence of actions (activation of electromagnetic valves) in the controlling computer. The measurement signals from two AVL IndiModul 621 (Figure 2b) modules were subject to acquisition using the AVL IndiCom ver. 2.3 software (Concerto 5 by AVL).
The tracking of the fast-varying quantities was performed, and they were stored using the AVL IndiModul 621 (by AVL, Graz, Austria) at an acquisition frequency of 1 kHz (cylinder pressure—20 kHz). The TTL controlling signals were connected to the 12 V or 24 V transformers (direct or alternating voltage). The device allowed the controlling of the electromagnetic valve manually or by using the TTL signals. Manual control enabled the RCCM to be reset to its initial settings in order to ensure the maximum piston displacement and to fill the combustion chamber with fresh air.
Engine tests were carried out using a DGEN 380 engine manufactured by Price Induction [37]. It was a turbofan engine that produced 255 daN thrust while maintaining low emissions and fuel consumption. The tests were carried out in a wide range of rotational speeds, which were regulated by adjusting the fuel mass flow (mf). During the tests, the measurement of thrust (F) and the temperature in the combustion chamber (T4) was carried out as well as the measurement of the concentrations of C O 2 and C O in the exhaust gases.
The concentration of C O 2 and C O in exhaust gases was measured using the Semtech DS analyzer (the accuracies of C O 2 and C O were ≤2% during the reading and ≤0.3% at the full scale) through a probe which maintained a temperature of 191 °C. The test procedure and emission measurements are presented in detail in [38].

3. Results

3.1. Assessment of Combustion Process Based on Indicator Tests

The combustion process assessment began with the pressure change analysis in the cylinder. Despite the previous demonstration of similarities in pressure patterns, all combustion processes of various fuels were compared (overlaid) (Figure 3). The analysis of the curves revealed differences in the processes that occurred during the combustion of different fuels. The conditions of the compression process similarities were maintained because this curve was close to repeatable. Small fluctuations resulted from the starting conditions of the piston movement (the same value of the beginning of forcing the piston movement was maintained at a pressure of 27 ± 0.1 bar). In Figure 3, the horizontal axis indicates the process duration. The duration of a single combustion cycle itself can be determined based on the difference between the final and initial times. In the RCCM system, there was no typical crank system and the reference basis was time, not the angle of rotation of the crankshaft.
The maximum pressure P m a x was chosen as the criteria for the influence of a given type of SAF on the combustion process. The values of P m a x are presented in Table 3.
The fuel combustion process led to specific changes in heat release (heat release rate—dQ/dt), which was determined based on the simplified relationship [39,40]:
d Q d t = k k 1 P n + 1 + P n 2 V n + 1 V n + 1 k 1 V n + 1 + V n 2 P n + 1 P n ,
in which the average value of the polytropic exponent κ = 1.32 was assumed, and the indices n and n + 1 denote the current and next value of pressure in the cylinder (P) or the corresponding cylinder volume (V).
Due to the low fuel dose value injected into the cylinder, the changes in the heat release were close to the changes observed for the pressure in the maximum range (Figure 4). Similarly to the changes in the in-cylinder pressure, early heat release was observed when burning the reference fuel. The value of 440 J/ms was obtained, which was the highest value for the combustion of the investigated fuels. The combustion of other fuels resulted in an increased delay of the autoignition, and thus in a delayed heat release. The maximum values of dQ/dt were approximately 400 J/ms and occurred approximately 6.8 ms later.
In the tests using RCCM, the quality of combustion was determined instead of the combustion time. The combustion time can be defined as the difference in the time when 90% of heat was released and when 10% of heat was released (Q90–Q10). To achieve this, it would be necessary to integrate the functions from Figure 4. As can be noted from the figure, these times were very similar. However, the quality of combustion (maximum heat release rate) was determined previously, as shown in Table 2. The heat release rate was the highest when burning A30 fuel, which was also confirmed by the maximum value of the cylinder pressure. It follows that the combustion of A30 fuel was thus the fastest. This is of great importance in high-speed piston and turbine engines.
Identifying the start of combustion based on Figure 4 was difficult. It is usually defined as the point when 10% of the total amount of released heat is reached. It can be seen that the combustion rate of the tested fuels was slower than that of the reference fuels. If the beginning of combustion is assumed to occur at t = 6840 ms, then for 20 ms of the process, the combustion time was completely similar. In the next part of the process, there were changes in combustion; however, a full analysis is only possible using optical tests, for instance, by using a camera. Such tests were not conducted in the scope of this article.

3.2. DGEN 380 Tests Results

The blends containing SBCs A and H were tested on the stand equipped with a DGEN 380 engine. The following parameters were measured during each test:
  • Thrust;
  • Fuel flow;
  • Temperature in the combustion chamber;
  • Carbon oxide concentration in exhaust gases.
The results obtained during engine tests were presented in detail in a previous article [38]. This paper focuses on the data useful for the calculations of activation energy Ea and the coefficient of reactivity αi as well as for the determination of the relationships between C O 2 and C O and Pmax.
The relationships between thrust and fuel flow are presented in Figure 5.
As shown in Figure 5, the thrust force had a linear relationship with the fuel mass flow rate m f . The parameters of the empirically obtained relationships were different for the individual mixtures tested. Table 4 presents the empirically obtained parameters that were further used to determine the activation energy values of E a C O 2 / R , E a C O / R , α i C O 2 and α i C O .
Figure 6 presents the relationships described by Equation (6), which were used to determine the E a C O 2 / R and α i C O 2 · A C O 2 · D values related to combustion process in the DGEN 380 engine.
The relationships presented in Figure 6 allowed us to determine the exponential functions of the fuel mass flow rate on the inverse of the temperature in the combustion chamber of the DGEN 380 engine. It was assumed that the empirical relationships in Figure 6 could be described by Equation (6) and on this basis, the E a C O 2 / R and ( α i C O 2 · A C O 2 · D / a ) values were determined for the tested mixtures. The obtained values are summarized in Table 5.
Table 5 also presents the values of ( α i C O 2 · A C O 2 · D ) and α i O 2 S A F / α i O 2 J E T (it was assumed that the Ak and D values were the same for the tested mixtures) as well as E a C O 2 S A F / E a C O 2 J E T . All quantities presented are used in the discussion of the results.
Similar measurements were carried out for C O emissions. Assuming that C O is an intermediate product in the chain of fuel oxidation to C O 2 the following dependence could be used to describe the relationship between C O and ( E a C O + E a C O 2 c h ) / R .
The empirical, exponential relationships presented in Figure 7 can be described by Equation (14). The values ( E a C O + E a C O 2 c h ) / R determined in this way were used to calculate the E a C O / R value for each of the tested fuels.
The parameter values of functions shown in Figure 8 and E a C O 2 are shown in Table 6.
Table 6 additionally included the R 2 value for the empirically obtained relationships presented in Figure 7. As can be seen, the R 2 value was lower than that obtained for the relationships of the complete combustion process (to C O 2 ). This resulted from a more complex mechanism of C O formation and was consistent with the assumption that C O was an intermediate product in the C O 2 formation chain. The calculated E a C O / R values presented in Table 6 were used to determine the relationship between E a C O / R T 4 and l n a · m f . These relationships are shown in Figure 9.
The α i C O · D C O · A C O values for the A0, A30, H0 and H30 blends were determined based on Equation (11). The results are shown in Figure 8 and in Table 6.
For the tested fuels, linear relationships between E a C O / R T 4 and l n a · m f were obtained, and the impact of the fuel mass flow rate m f on the E a C O / R T 4 value was different for each of the tested fuels. This indicated that the chemical structure of the fuel had a much greater impact on the combustion chemistry than on the final energetic effect in the form of engine thrust (the relationships between thrust and m f were very similar for all fuels tested). The empirical relationships presented in Figure 8 made it possible to determine the values of l n ( α i C O · D C O · A C O ) for the tested fuels using Equation (15). The obtained results are presented in Table 7.
The results presented in Table 6 indicate a significant impact of SBCs on the reactivity coefficient of fuels related to the formation of C O . This effect was similar for mixtures containing components A and H—the l n ( α i C O · D C O · A C O ) values for both mixtures were similar and significantly different from the values obtained for A-1 jet fuels.

4. Discussion

4.1. The Relationships Between Parameters Determined During DGEN Engine Tests ( E a C O 2 , E a C O , α i C O 2 and α i C O ) and the P m a x and d Q / d t m a x Determined During RCCM Tests

Defining the influence of SAF on the combustion process in a turbine engine required a reliance on simpler preliminary tests. This made it possible to select various new fuel candidates for future, more complex research.
The results presented above were used to tentatively answer the following questions:
  • Are the activation energy E a and coefficient of reactivity α i parameters quantitatively describing the influence of SAF on the combustion process in various engines, including RCCM tests?
  • Is the quantitative relationship between E a and α i determined in fuels containing SAFs burned in different engines?
  • Can the RCCM be used to predict E a and α i for given fuels containing SAFs in various turbine engines?
To solve the problem of how the SAFs of a given chemical structure change the combustion process in relation to conventional Jet A-1 fuel, the ratios of E a to α i 
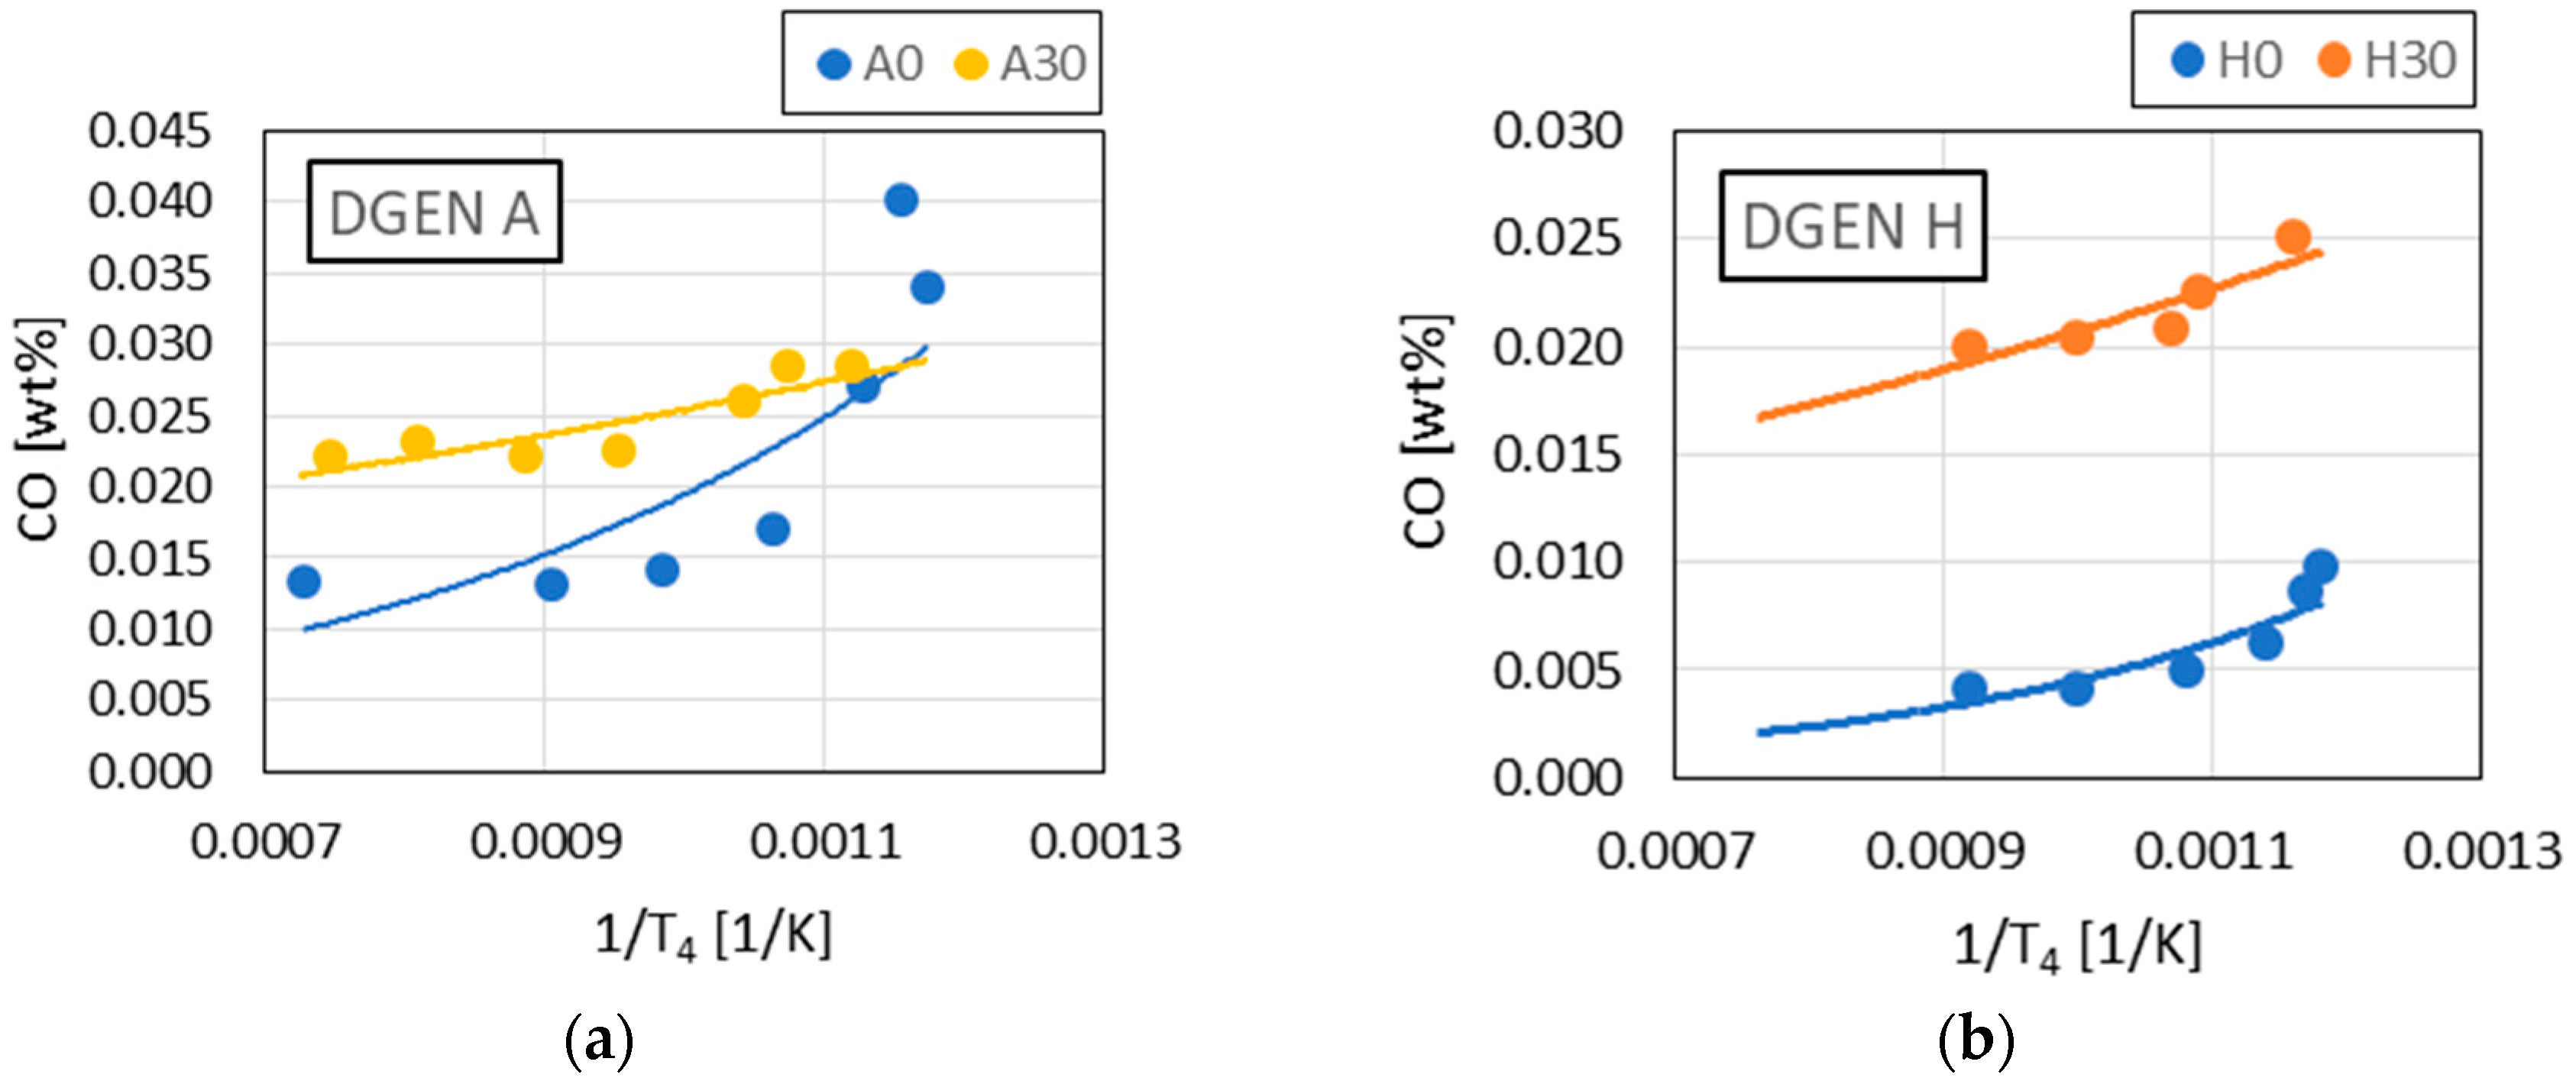
determined for both blends containing SAFs and for fossil Jet A-1 fuel were analyzed. Below (in Figure 9, Figure 10, Figure 11 and 
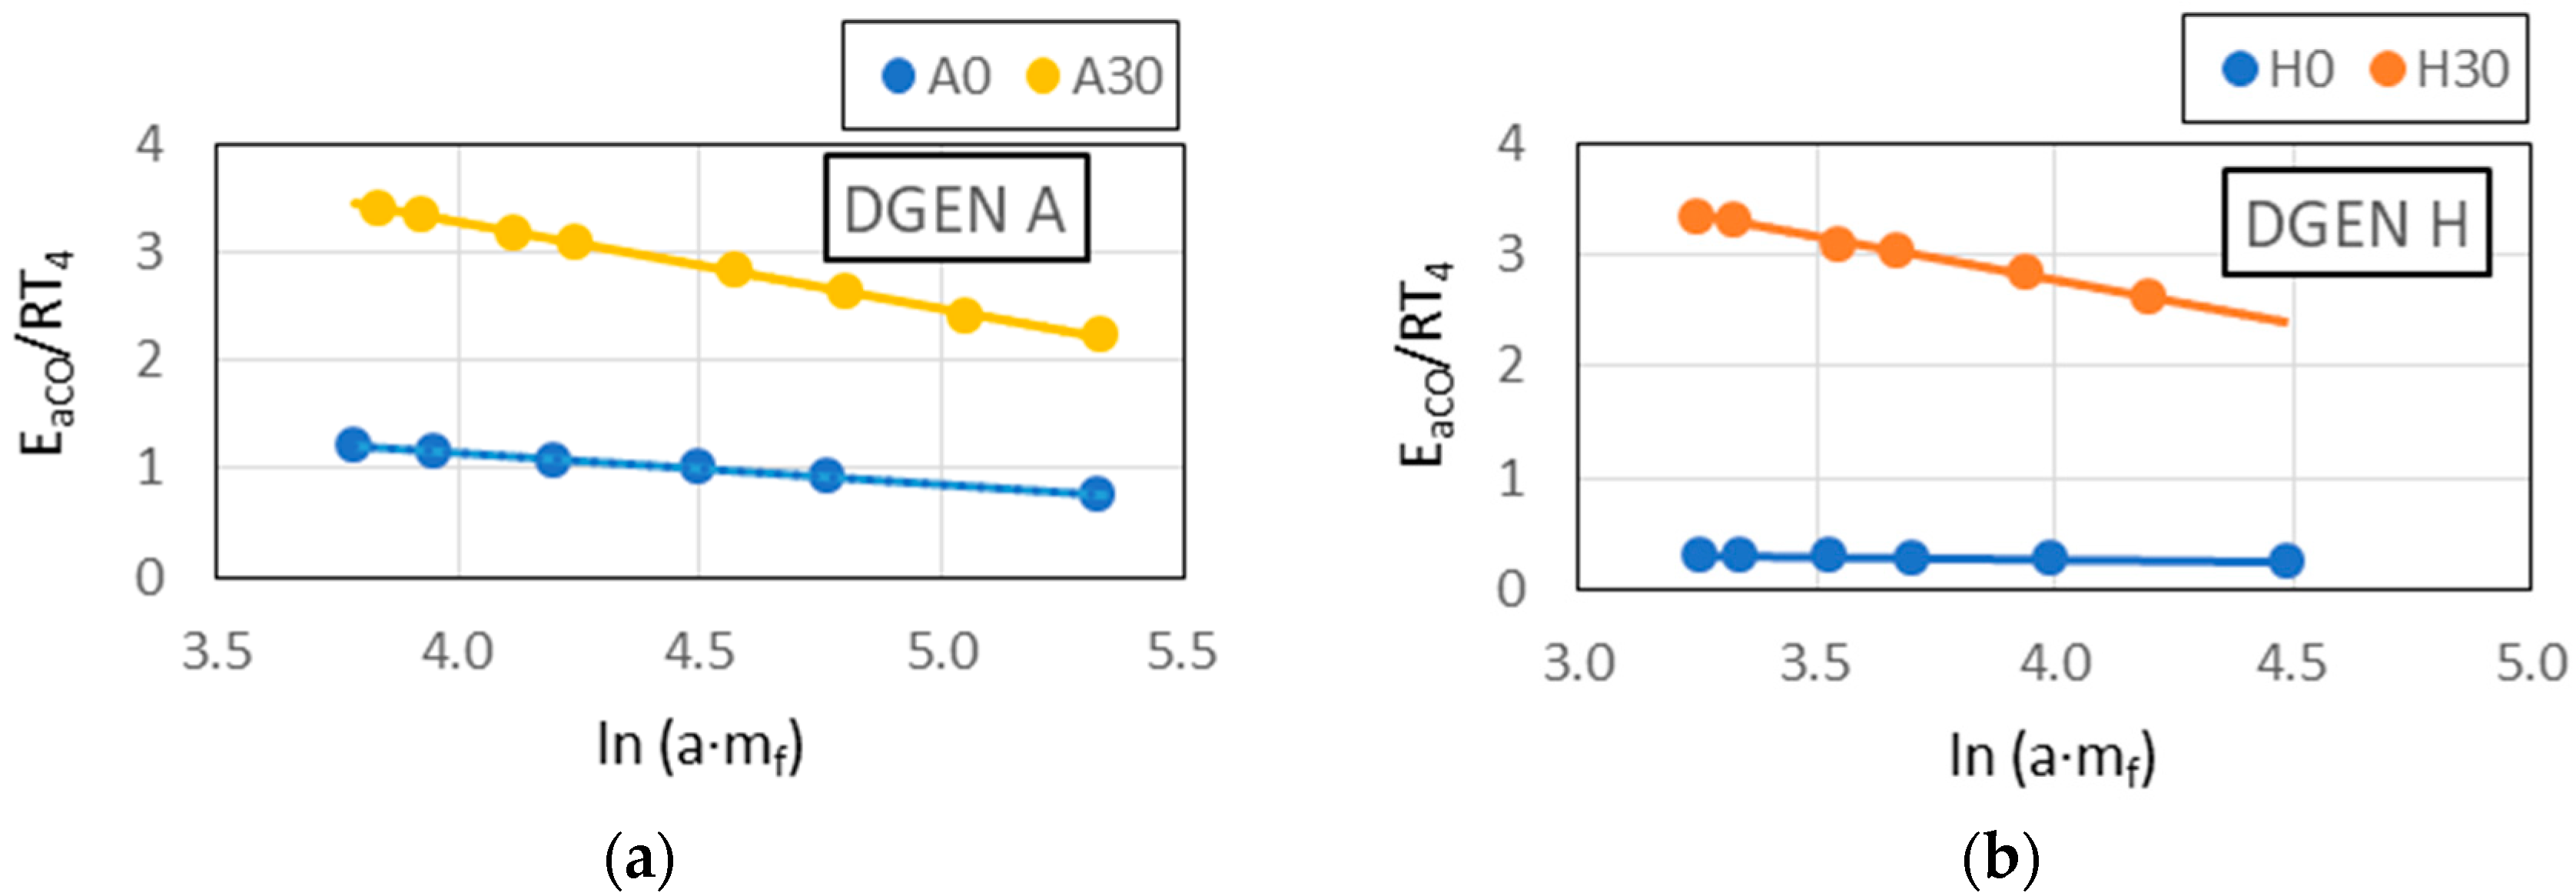
Figure 12) the influence of SAFs of different chemical structures on the value of E a C O 2 (activation energy determined for the chemical chain of complete combustion to C O 2 ) and reactivity coefficients in a chain of reactions ending in the production of C O and C O 2 was shown.
The observed linear relationships between E a C O 2 ,   α i C O 2 S A F / α i O 2 J E T and ln α i C O · D C O · A C O D G E N with Pmax in the results indicated the similarity of the combustion reaction chains in the DGEN 380 engine and in the RCCM stand.
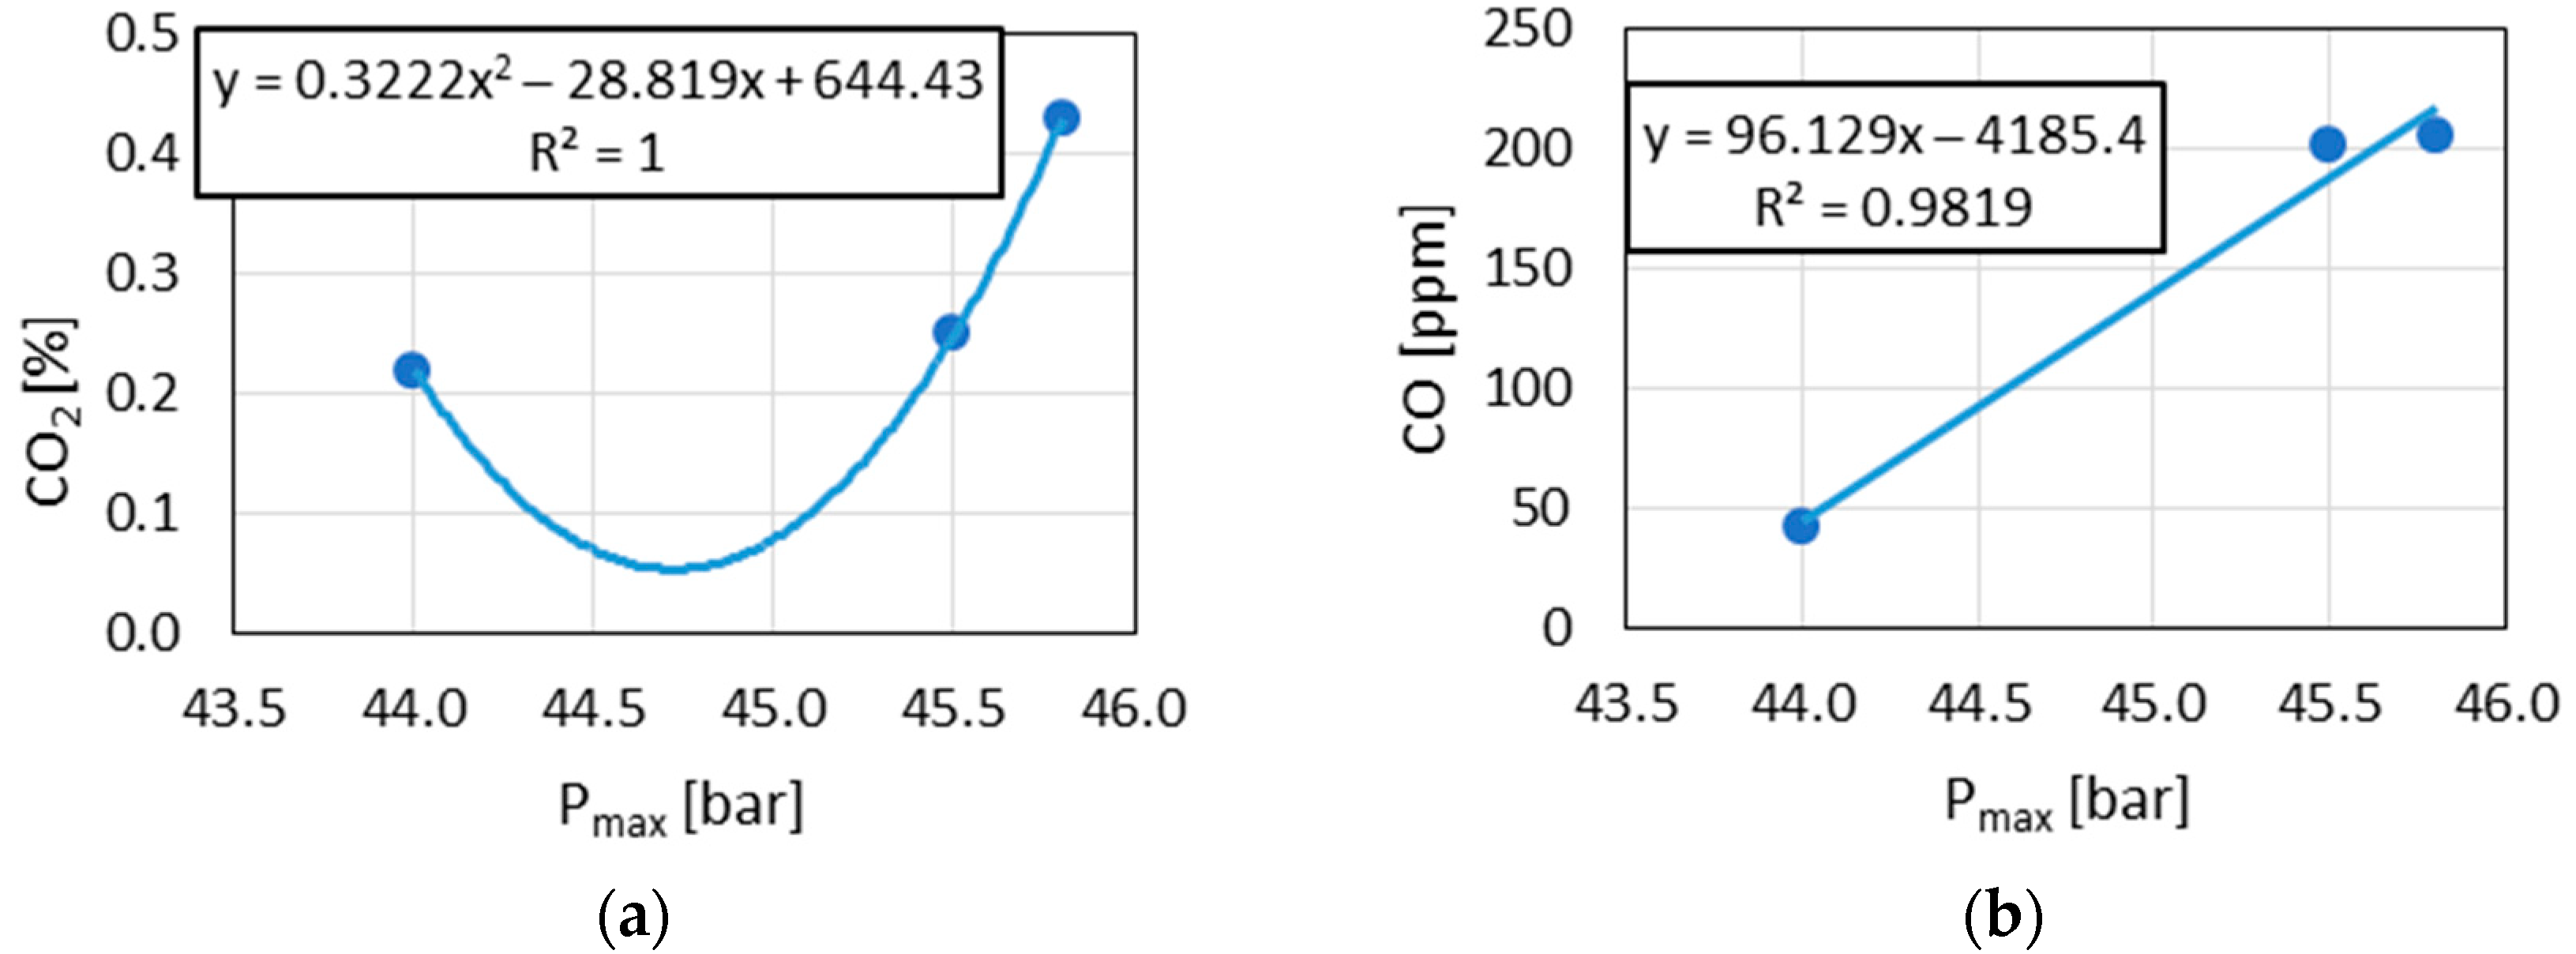
4.2. The Possibility of Predicting the C O 2 and C O Concentration in Exhaust Gases Using RCCM Test Results
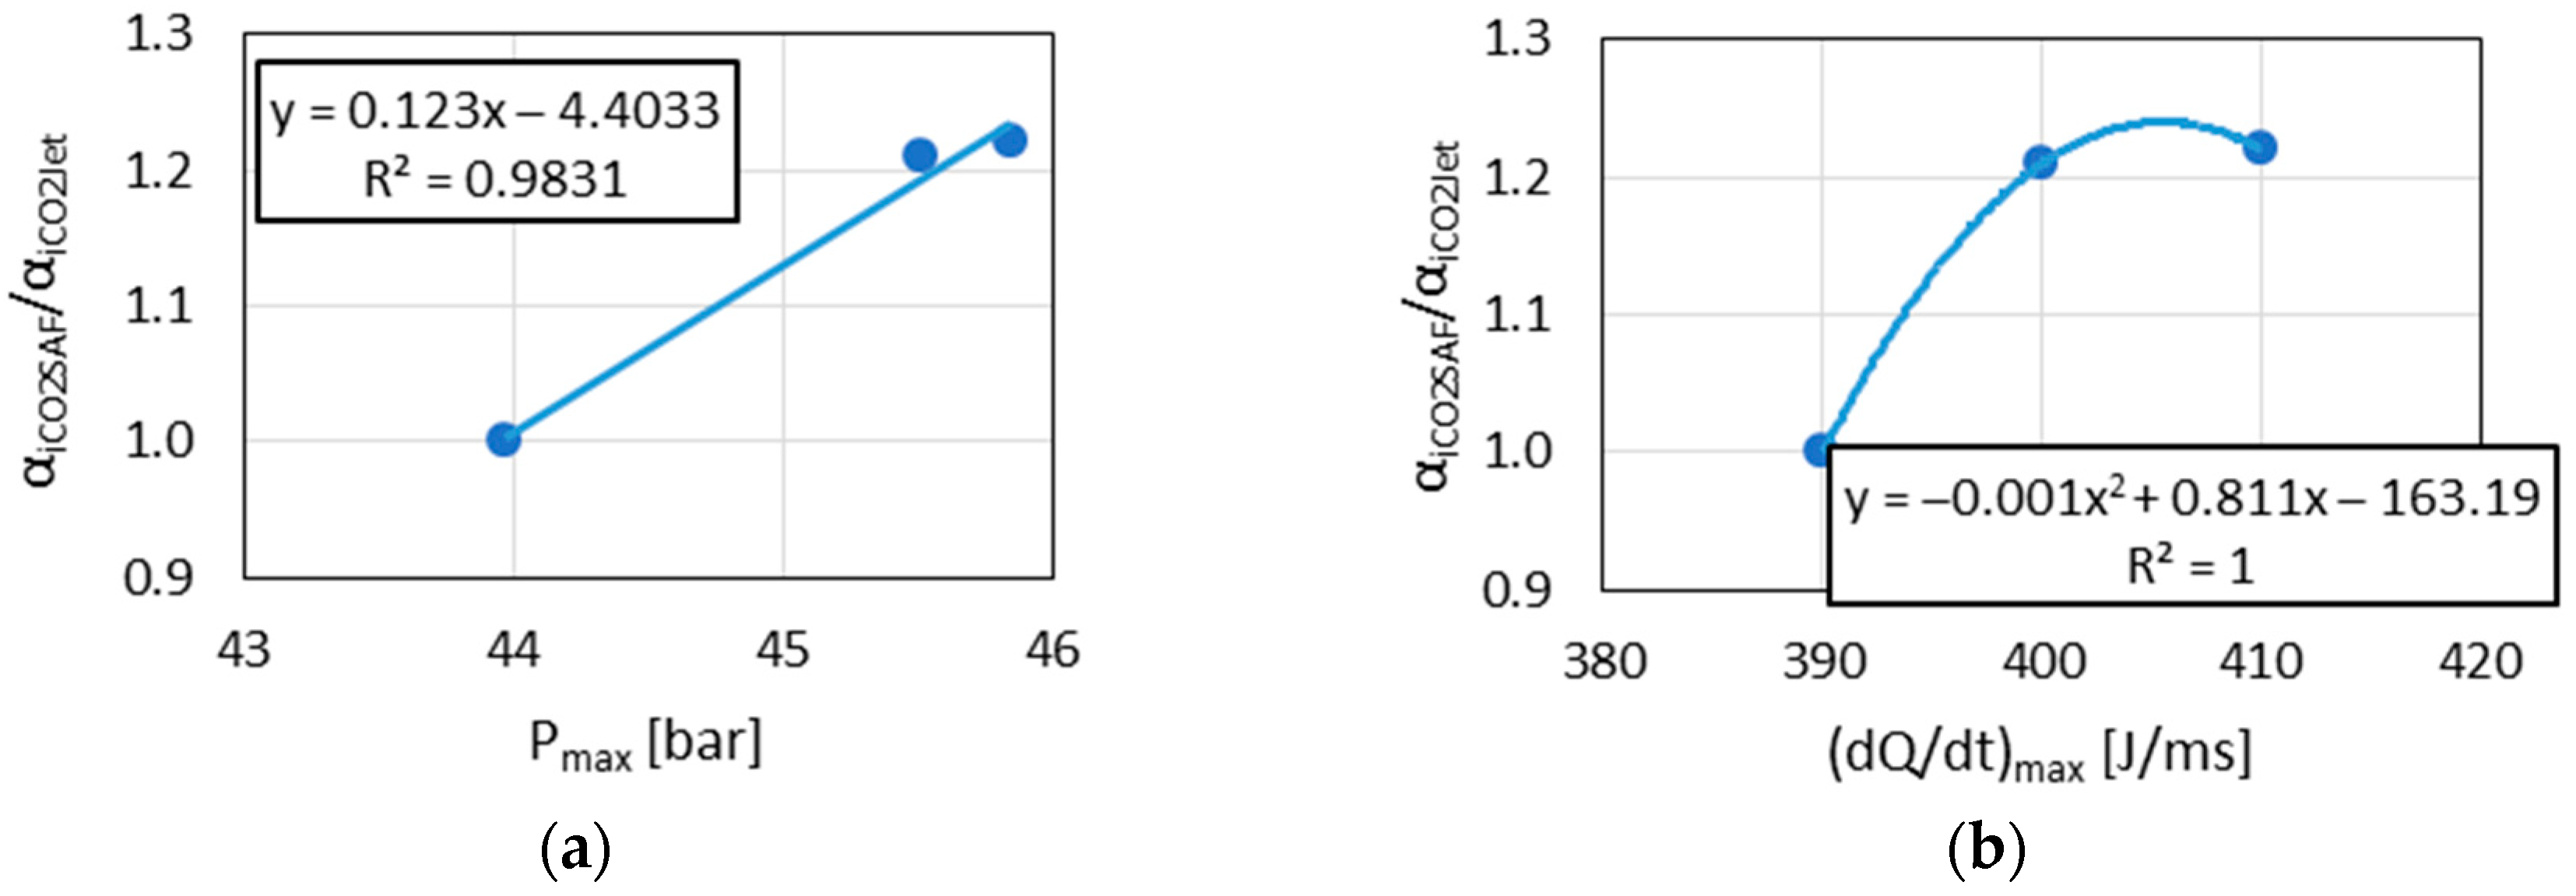
The above results (Figure 9, Figure 10 and Figure 12) indicated the linear relationships in the cases where P m a x was used as the result of RCCM tests. These were the reasons that P m a x was chosen to predict C O 2 and C O concentration in exhaust gases emitted during DGEN engine tests.
Equations (9), (10), (14) and (15) use the fuel flow rate m f as the independent variable. This variable, like reactivity coefficient α i and activation energy E a , was not dependent on m f . On the other hand, the concentrations of C O 2 and C O in exhaust gases did depend on m f . The prediction of C O 2 and C O concentrations in exhaust gases based on RCCM test results would be possible for assumed values of m f . To verify this claim, the m f = 50 , 90 and 150 dm3/h values were chosen. The obtained results are shown in Figure 12, Figure 13, Figure 14 and Figure 15.
The demonstrated correlations between C O and C O 2 in relation to combustion pressure did not indicate typical trends in the changes in these components. However, this article only made an attempt to create analytical procedures in this aspect. Increasing the number of data points would make it possible to obtain a more typical trend of these two exhaust components (i.e., inversely proportional C O 2 concentration to C O concentration in exhaust gases).
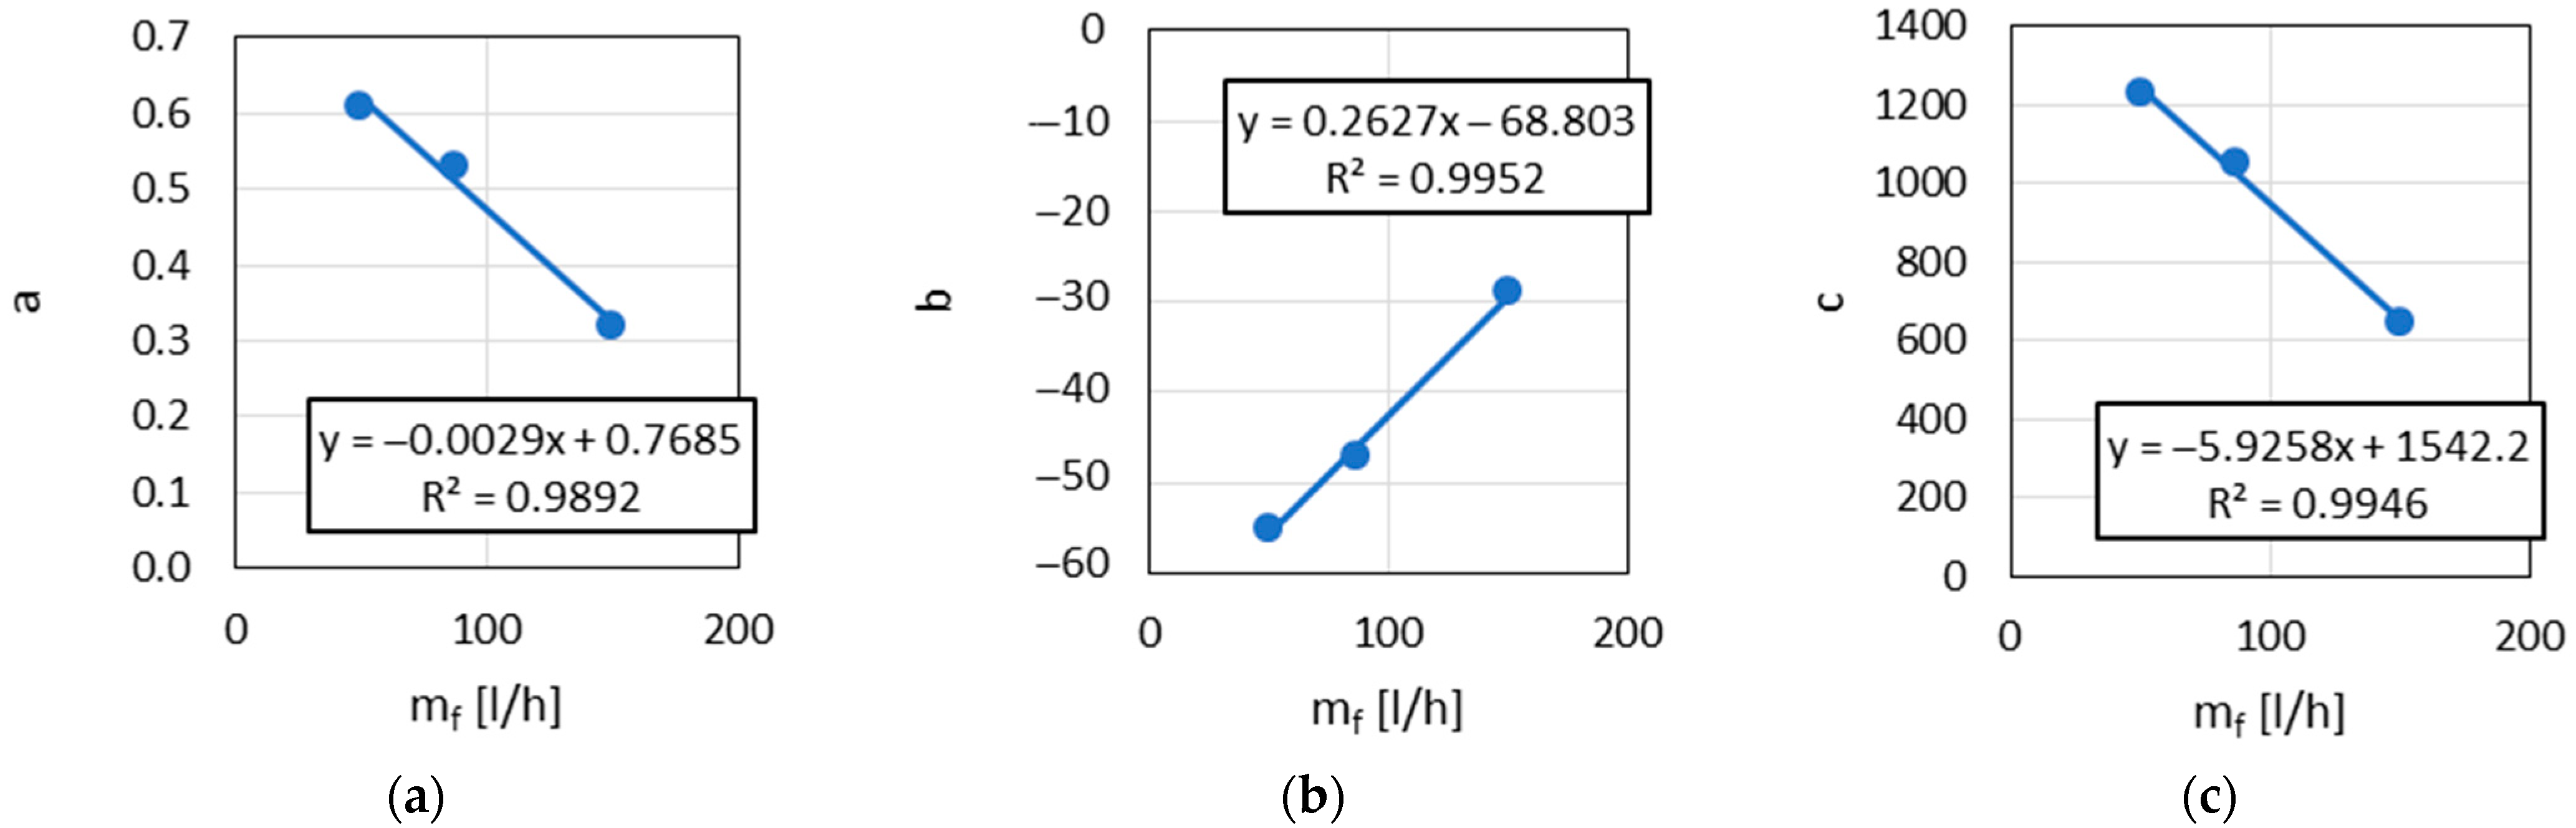
The following empirical relationships were found:
C O 2 = a · P m a x 2 + b · P m a x + c ,
C O = a 1 · P m a x + b 1 .
The parameters a, b, c, a 1 and b 1 (Figure 16) were found to be functions of m f .
Consequently Equation (17) could be expressed as a function of P m a x and m f .
C O 2 = 0.0029 · m f + 0.7685 · P m a x 2 + 0.2627 · m f 68.803 · P m a x + 5.9258 · m f + 1542.2 .
a 1 = 0.0032 · m f 2 0.7647 · m f + 138.16 b 1 = 0.1397 · m f 2 33.103 · m f + 6008
Equation (18) can also be expressed as:
C O = 0.0032 · m f 2 0.7647 · m f + 138.16 · P m a x + 0.1397 · m f 2 33.103 · m f + 6008 .
The empirically obtained relationships indicate that parameters of Equations (17) and (18) are functions of the fuel flow rate m f . These functions were obtained for the mineral Jet A-1 fuel and its blends with the SAF components A and H.

4.3. The Accuracy of the Obtained Model

Modeling the fuel combustion process in turbine engines is a tool for predicting the changes in this process under various engine operating conditions, as well as when powered by different fuels. The recent introduction of SAFs into aviation has generated particular interest in modeling the effect of the chemical composition and properties of fuels on the combustion process. Two directions of such investigations were observed:
  • Statistical (correlation) models;
  • Models based on basic functions describing the chemical reactions that make up the combustion process.
The first group—statistical models—require a large database, and their accuracy can be increased by using, for example, neural networks. However, the parameters of the relationships obtained in this way cannot be physically interpreted, and their values will change with the growth of the database. An example is also the relationships presented in Section 4.2. The accuracy of statistical models applied to the composition of exhaust gases emitted by turbine engines was typically not sufficient. The main reason for this was because of the relatively low repeatability, and even less reproducibility, of exhaust gas composition measurements. The causes were not precisely determined, but many studies show that the causes could due to the inhomogeneity of the exhaust gas stream and the variability of the properties of the air drawn in by the engine. It should be noted, however, that regardless of the indicated disadvantages of statistical models, they are very useful for predicting the fuel combustion process in aircraft turbine engines. They allow for the prediction of the effects of physicochemical properties of fuels during the combustion process in turbine engines [17] as well as for the prediction of the effects of fuel quality on the emissions of exhaust components.
The second group consists of models based on the fundamental principles of the structure of matter. An example of this is neural network-based molecular dynamics simulation [41]. These models use several databases and describe a chain of reactions consisting of several hundred elementary reactions. For a chemically simple fuel, such as methane, 798 elementary reactions were identified. This clearly indicates significant limitations in the use of this group of models in relation to the combustion of chemically complex fuels, such as the mineral fuel Jet A-1 (consisting of about 1000 chemical compounds) and its mixtures with SAF components.
As was shown in the introduction, the reactivity model αi assumed that the combustion process consisted of one elemental reaction: fuel → exhaust gases. Due to this assumption, the operating parameters of the engine, such as fuel flow mf, temperature in combustion chamber and the concentration of the combustion products in exhaust gases, can be applied to a kinetic equation, and the activation energy Ea, related to this assumed elemental reaction can thus be determined. When another operating parameter—thrust F—is used, the reactivity coefficient αi can be determined. Both the activation energy Ea and the coefficient of reactivity αi characterize the behavior of fuel during combustion. When approaching the problem of how SAF components influence the combustion process, the fuels containing various SAFs are treated as various substrates—i.e., the “fuel” in the assumed elemental reaction. For each fuel, the Ea and αi can be determined and assigned to the given fuel. The comparison of the values of these parameters obtained for Jet A-1 fuel and mixtures containing BSCs makes it possible to assess the impact of BSCs on the combustion process and minimize the effect of low measurement repeatability.
If the structure of a fuel combustion chemical reaction chain is similar in different devices (as assumed for the αi reactivity model), then the Ea and αi values determined for one device (e.g., DGEN 380 engine) can be correlated with the values which characterize the combustion process in the second device (e.g., RCCM).
Based on the assumption of the reactivity model, the reactivity coefficient αi and the activation energy assigned to the entire combustion reaction chain are treated as features of the fuel. These features characterize the fuel undergoing combustion reactions. If the combustion reaction chains in different devices are similar or the same, then αi and Ea determined for one device characterize the fuel’s behavior during combustion in the second device. Consequently, the fuel combustion model built on the basis of test results in one device can be used to describe the combustion process in another device. Model verification, consisting of checking the consistency of the measured values with the predicted ones, allows conclusions to be drawn regarding the similarity of the combustion chemical reaction chains. The procedure does not allow for determining of individual chain reactions, but it does allow for the assessment of the behavior of the new fuel (SAF) in turbine engines, and the similarity of the reaction chains, e.g., in relation to Jet A-1 fuel, allows for the assessment of the extent to which the addition of the SAF component changes/disturbs the combustion reaction chain.
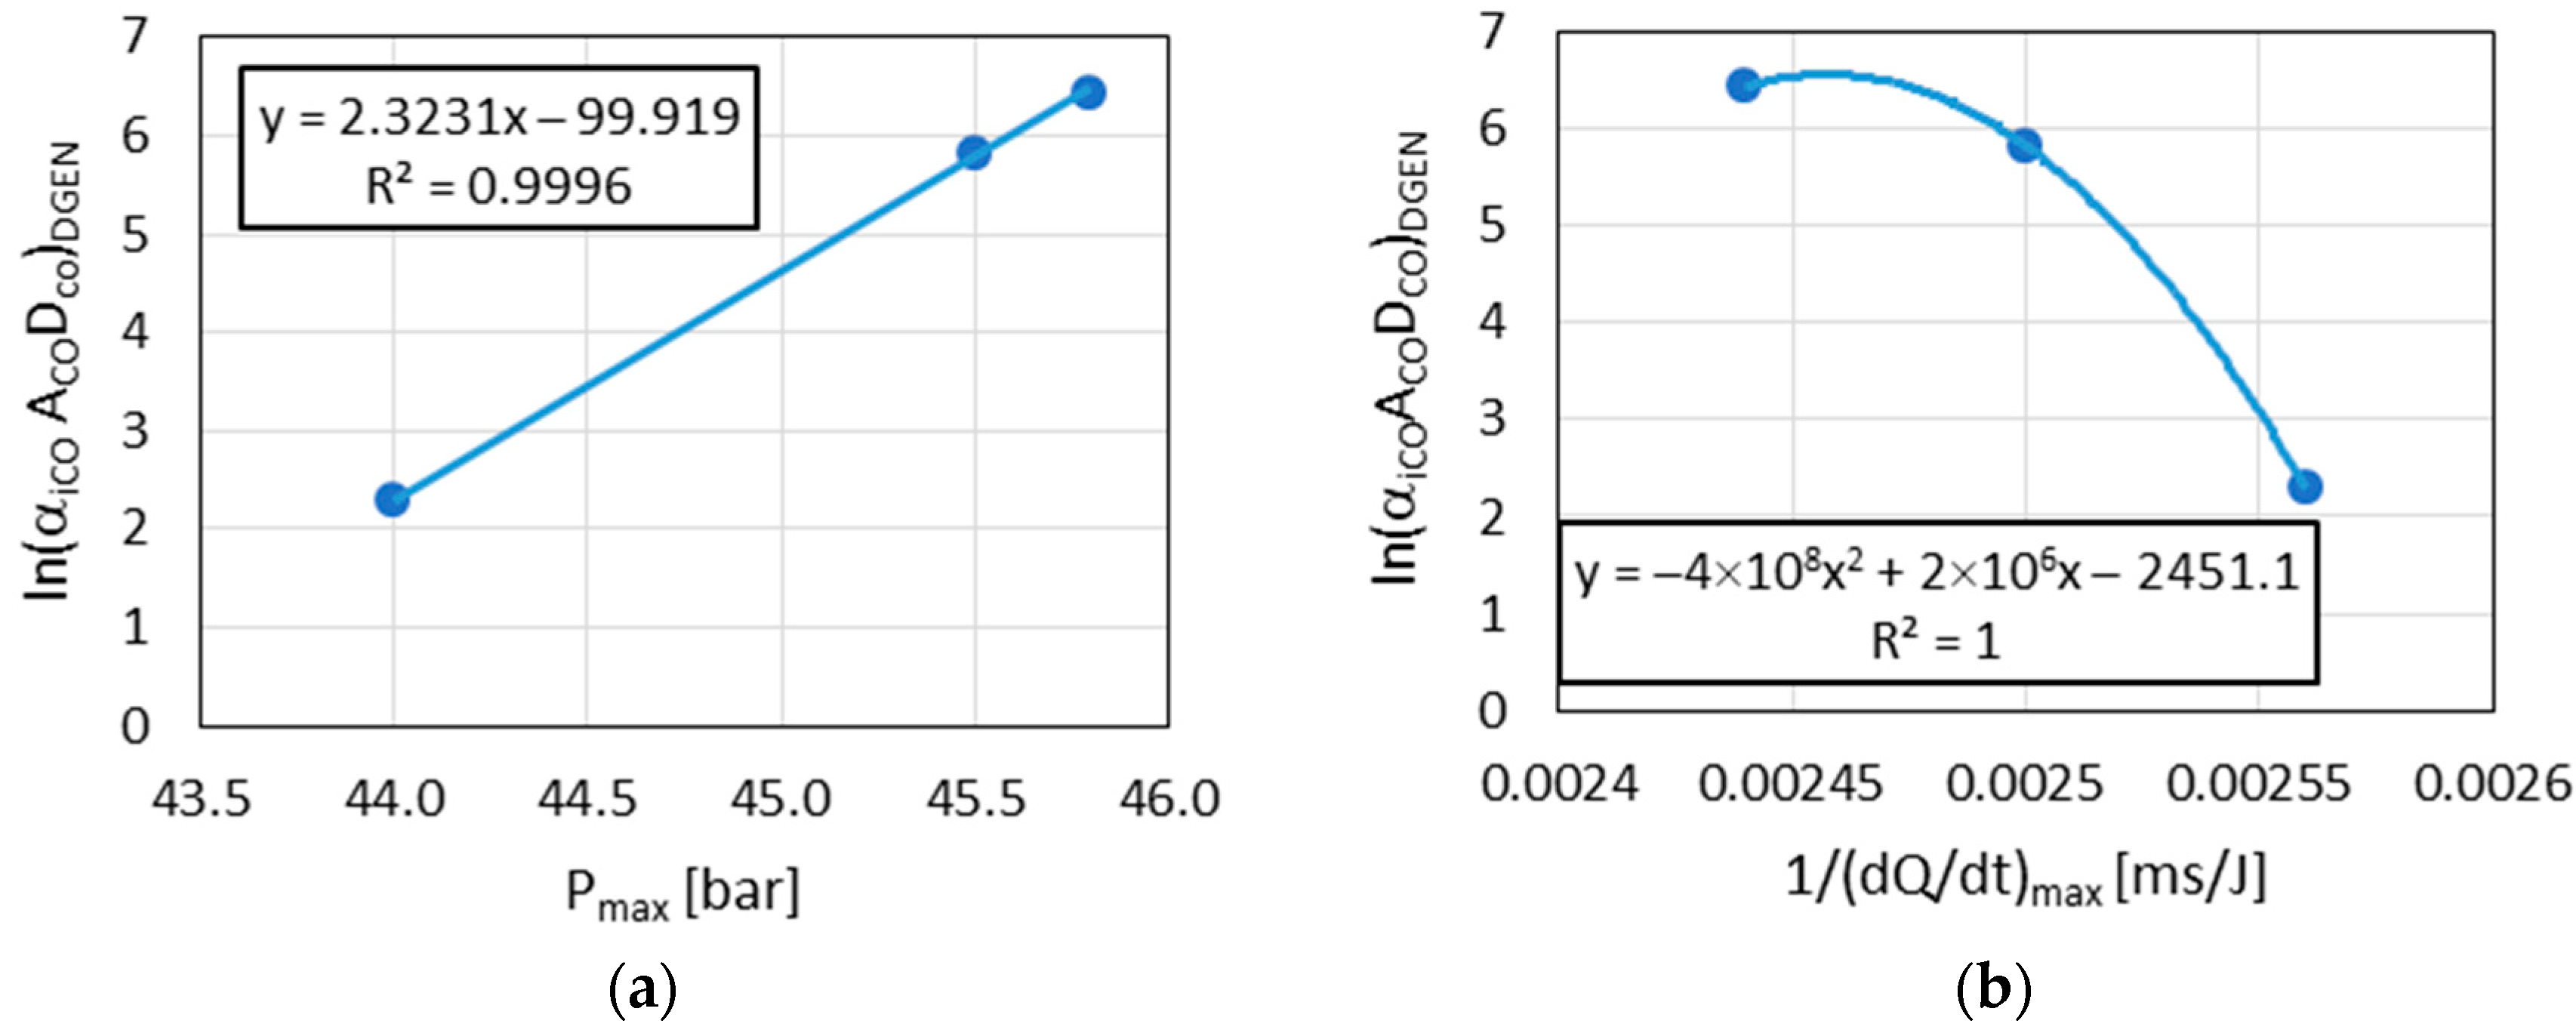
Hence, based on Figure 10, Figure 11 and Figure 12, through Pmax determined on RCCM, it becomes possible to predict the values of Ea and αi for DGEN. This in turn allows for the prediction of the SAF influence on the combustion process, including on C O 2 and C O concentrations in exhaust gases. Of course, the relationships presented in this article require verification using a much larger database.

5. Conclusions

The results shown in this article indicate that SAFs added to the jet fuel change the combustion process, i.e., they change the relationships between the rates of elemental reactions in the chemical reaction chain. These changes depend on the chemical structure of the SAF component and its concentration in the mixture with Jet A-1 fuel.
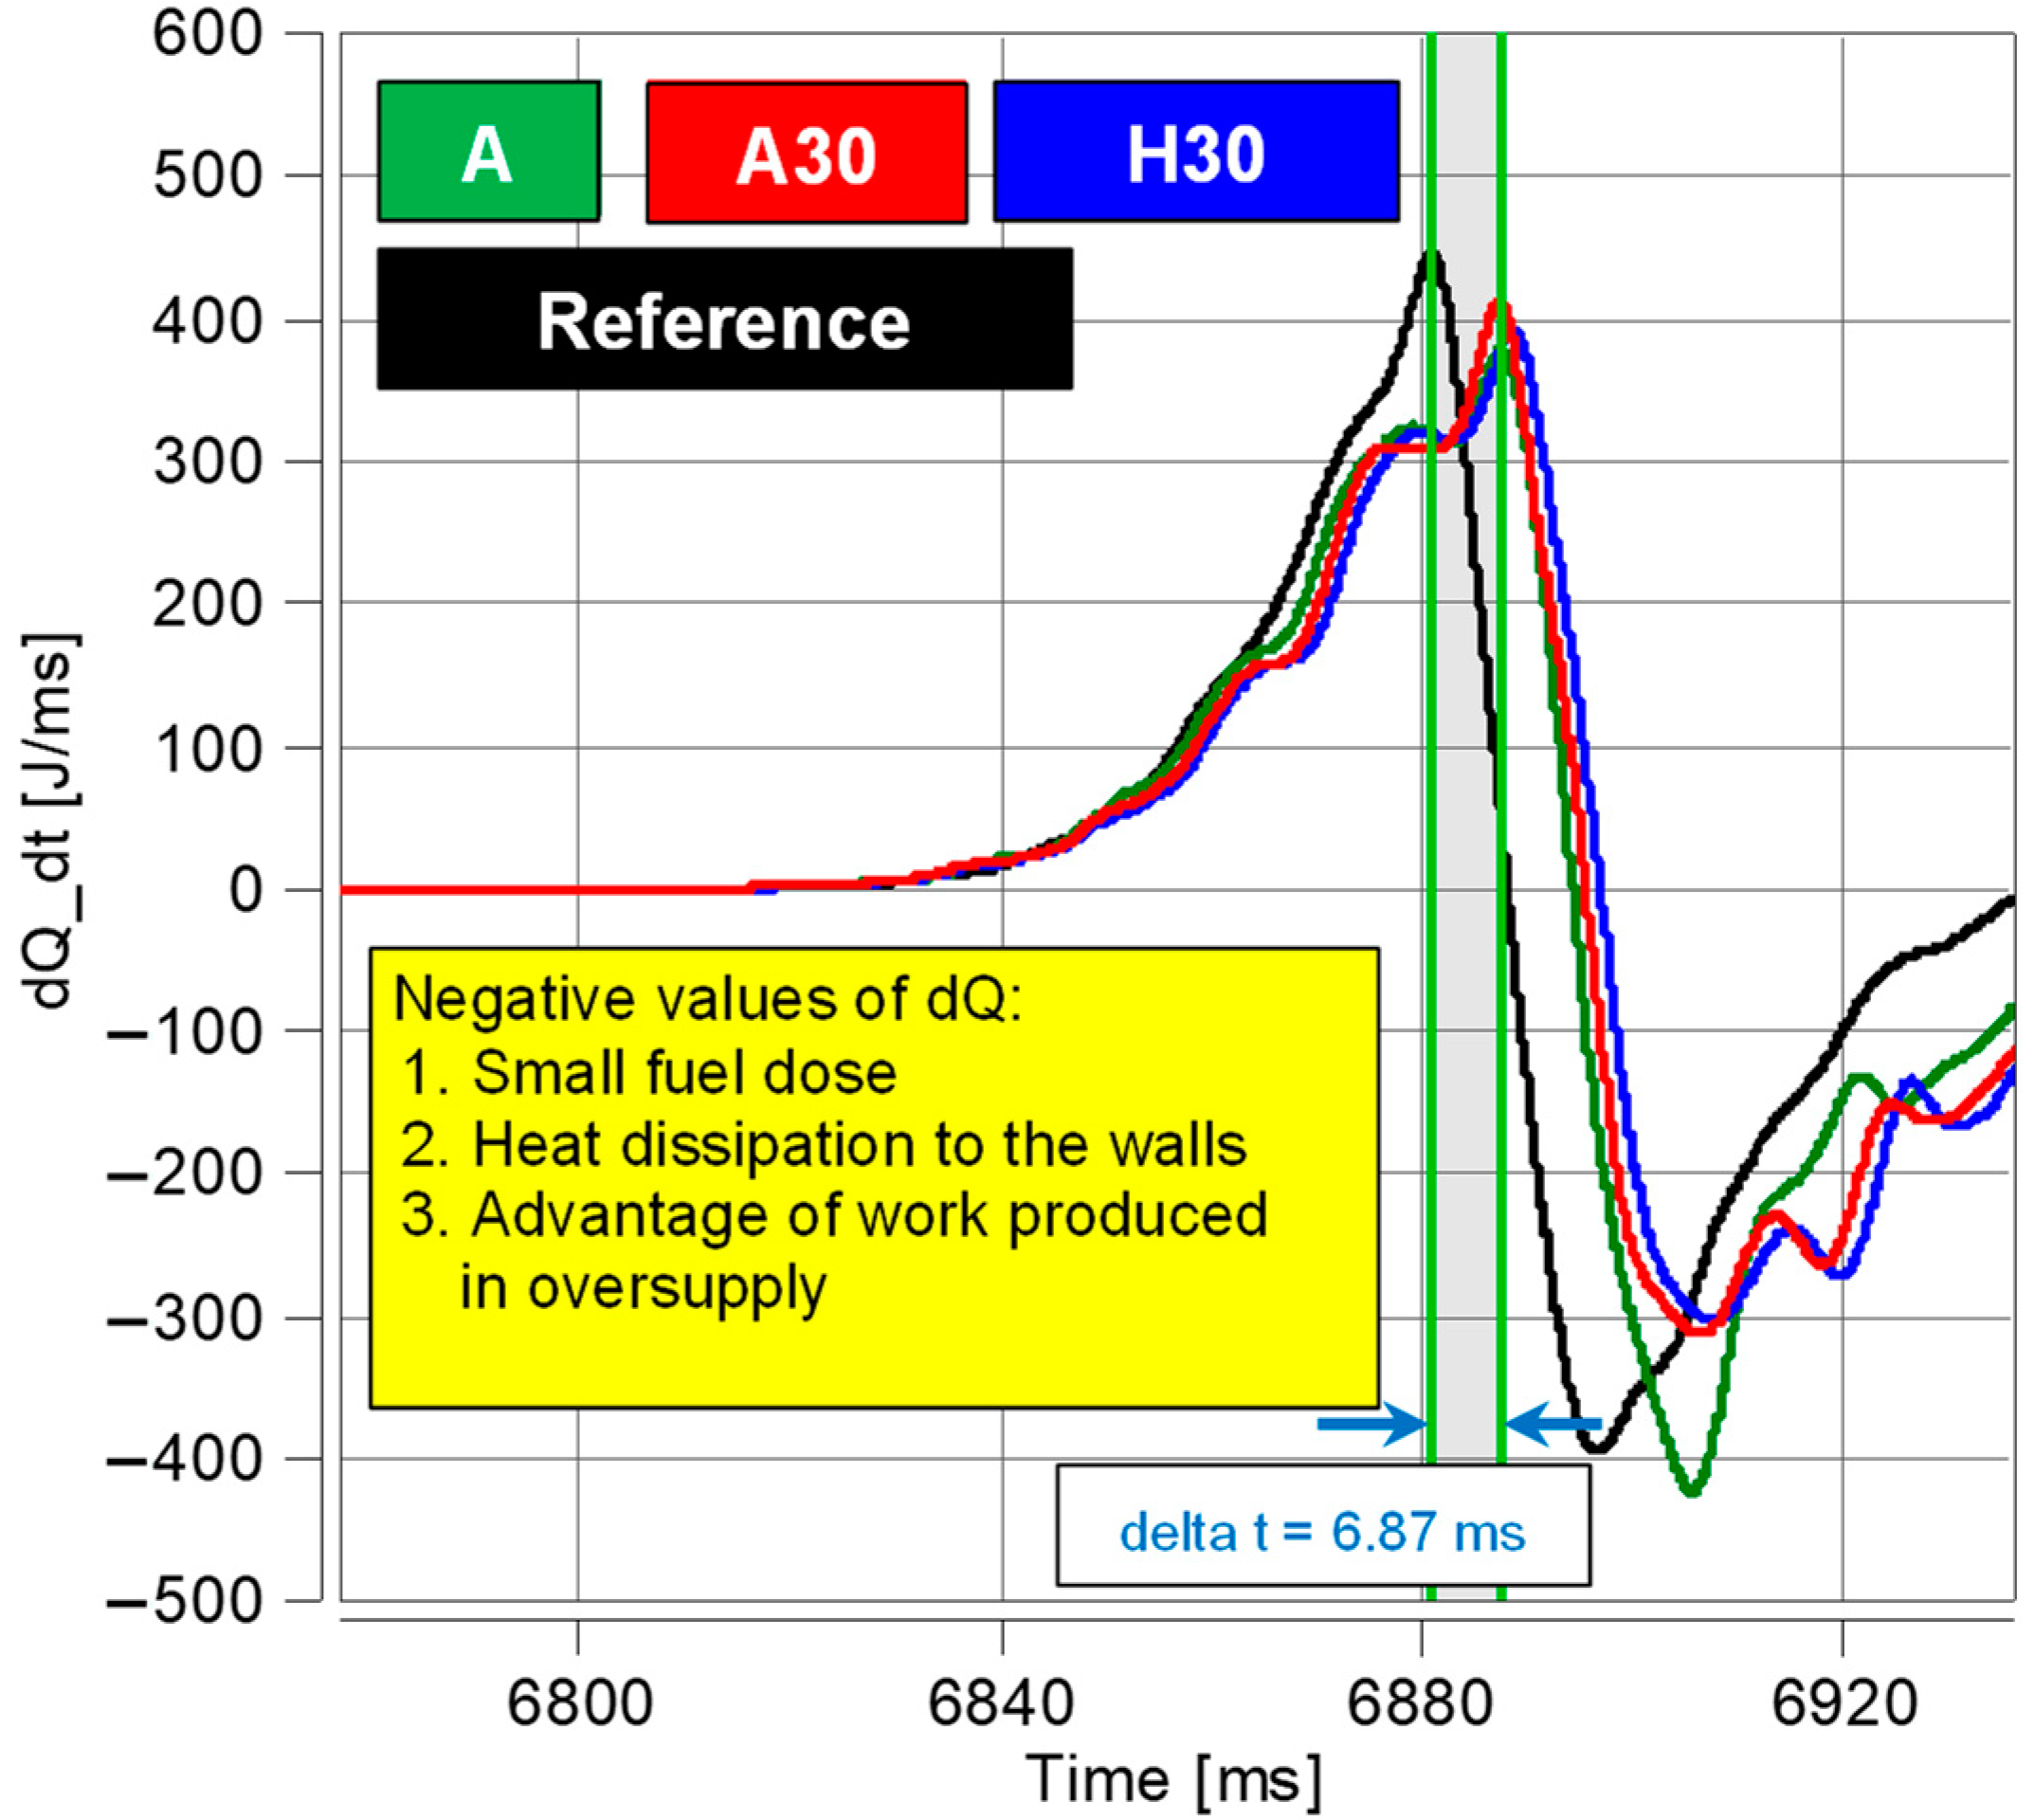
The tests using RCCM indicated differences in the combustion of the analyzed fuels and their additives. The results of the analyses from both stand tests confirm that the highest efficiency was observed for the A30 fuel.
The obtained results of the DGEN 380 tests made it possible to determine the activation energy E a assigned to the combustion reaction chain of C O 2 and C O . The values of activation energy E a C O 2 / R determined for Jet A-1 and blends containing A and H components in concentrations of 5, 20 and 30 wt. % are shown in Table 4. The activation energy values assigned to the reactions chain leading to C O formation E a C O were determined for Jet A-1, A30 and H30 blends. The following values were obtained:
  • Jet A-1: E a C O 2 / R = 3480 ; E a C O / R = 982 ;
  • A30: E a C O 2 / R = 3705 ; E a C O / R = 2903 ;
  • H30: E a C O 2 / R = 3637 ; E a C O / R = 2843 .
The significantly different values obtained for each blend indicate differences in the structure of combustion reaction chains due to SAF addition to Jet A-1 fuel.
The same conclusions could be formulated by comparing values of the fuel reactivity coefficient α i determined in the tested blends.
  • Jet A-1: α i C O 2 · A C O 2 · D = 1535 ; l n ( α i C O · D C O · A C O ) = 2.29 ;
  • A30: α i C O 2 · A C O 2 · D = 1878 ; l n ( α i C O · D C O · A C O ) = 6.44 ;
  • H30: α i C O 2 · A C O 2 · D = 3249 ; l n ( α i C O · D C O · A C O ) = 5.83 .
The values of P m a x obtained during indicator RCCM tests for Jet A-1, A30 and H30 blends correlated with both the activation energy and coefficients of reactivity. This suggests that the influence of SAF addition to Jet A-1 fuel on the structures of chemical reaction chains during RCCM tests was similar to that seen in DGEN 380 tests.
Based on these results, it was possible to determine the relationships between C O 2 and C O concentrations in exhaust gases emitted by the DGEN 380 engine and the P m a x determined during RCCM tests. This indicated the possibility of the preliminary prediction of C O 2 and C O emissions from the DGEN 380 engine based on the test performed at the RCCM stand. The parameters of these relationships were dependent on fuel flow rate m f . As the result, the Equations (19) and (20) were formulated, which can be used to predict the C O 2 and C O concentrations in exhaust gases emitted during DGEN tests using the P m a x determined from the RCCM tests.
The thesis that the application of the α i reactivity model to the combustion process description enables the RCCM tests results to be used to predict the behavior of the tested fuel during combustion in the turbine engine DGEN 380 was thus confirmed. The relationships described in this paper should be confirmed for other components approved for aviation and for other turbine engines. In addition, the test results presented here should be confirmed by testing a larger number of SAFs and testing should be extended to turbine engines other than the DEGN 380.

Author Contributions

Conceptualization, A.K., T.B., A.Ł., J.M. and I.P.; methodology, A.K., T.B., J.M. and I.P.; software, A.K., T.B., A.Ł., J.M. and I.P.; validation, A.K., T.B., J.M. and I.P.; formal analysis, A.K., T.B., J.M. and I.P.; investigation, A.K., T.B., A.Ł., J.M. and I.P.; resources, A.K., T.B., A.Ł., J.M. and I.P.; data curation, A.K., T.B., J.M. and I.P.; writing—original draft preparation, A.K., T.B., J.M. and I.P.; writing—review and editing, A.K., T.B., J.M. and I.P.; visualization, A.K., T.B., J.M. and I.P.; supervision, A.K., T.B., J.M. and I.P.; project administration, A.K., T.B., A.Ł., J.M. and I.P.; funding acquisition, A.K., T.B., A.Ł., J.M. and I.P. All authors have read and agreed to the published version of the manuscript.

Funding

This research received no external funding.

Data Availability Statement

The original contributions presented in the study are included in the article, further inquiries can be directed to the corresponding author.

Conflicts of Interest

The authors declare no conflicts of interest.

Abbreviations

The following symbols and abbreviations are used in this manuscript:
α i reactivity coefficient
Eaactivation energy
BSCblending synthetic component
COcarbon monoxide
CO2carbon dioxide
Fthrust
mffuel flow
Pmaxmaximum cylinder pressure obtained in RCCM during tests
RCCMrapid compression combustion machine
SAFsustainable aviation fuel
T4temperature in combustion chamber

References

  1. Lau, J.I.C.; Wang, Y.S.; Ang, T.; Seo, J.C.F.; Khadaroo, S.N.B.A.; Chew, J.J.; Lup, A.N.K.; Sunarso, J. Emerging technologies, policies and challenges toward implementing sustainable aviation fuel (SAF). Biomass Bioenergy 2024, 186, 107277. [Google Scholar] [CrossRef]
  2. Rojas-Michaga, M.F.; Michailos, S.; Cardozo, E.; Akram, M.; Hughes, K.J.; Ingham, D.; Pourkashanian, M. Sustainable aviation fuel (SAF) production through power-to-liquid (PtL): A combined techno-economic and life cycle assessment. Energy Convers. Manag. 2023, 292, 117427. [Google Scholar] [CrossRef]
  3. Gan, C.; Ma, Q.; Bao, S.; Wang, X.; Qiu, T.; Ding, S. Discussion of the standards system for sustainable aviation fuels: An aero-engine safety perspective. Sustainability 2023, 15, 16905. [Google Scholar] [CrossRef]
  4. ASTM D1655-22; Standard Specification for Aviation Turbine Fuels. ASTM International: West Conshohocken, PA, USA, 2022. [CrossRef]
  5. ASTM D7223-21; Standard Specification for Aviation Certification Turbine Fuel. ASTM International: West Conshohocken, PA, USA, 2022. [CrossRef]
  6. ASTM D7566-22a; Standard Specification for Aviation Turbine Fuel Containing Synthesized Hydrocarbons. ASTM International: West Conshohocken, PA, USA, 2023. [CrossRef]
  7. Dooley, S.; Won, S.H.; Chaos, M.; Heyne, J.; Ju, Y.; Dryer, F.L.; Kumar, K.; Sung, C.-J.; Wang, H.; Oehlschlaeger, M.A.; et al. A jet fuel surrogate formulated by real fuel properties. Combust. Flame 2010, 157, 2333–2339. [Google Scholar] [CrossRef]
  8. Edwards, T.; Colket, M.; Cernansky, N.; Dryer, F.; Egolfopoulos, F.; Friend, D.; Law, E.; Lenhert, D.; Lindstedt, P.; Pitsch, H.; et al. Development of an experimental database and kinetic models for surrogate jet fuels. In 45th AIAA Aerospace Sciences Meeting and Exhibit; American Institute of Aeronautics and Astronautics: Reno, NV, USA, 2007. [Google Scholar] [CrossRef]
  9. Huber, M.L.; Lemmon, E.W.; Bruno, T.J. Surrogate mixture models for the thermophysical properties of aviation fuel Jet-A. Energy Fuels 2010, 24, 3565–3571. [Google Scholar] [CrossRef]
  10. Jones, W.P.; Marquis, A.J.; Vogiatzaki, K. Large-eddy simulation of spray combustion in a gas turbine combustor. Combust. Flame 2014, 161, 222–239. [Google Scholar] [CrossRef]
  11. Poblador-Ibanez, J.; Nocivelli, L. Toward a real-fluid modeling framework for sustainable aviation fuels. Fuel Commun. 2024, 18, 100100. [Google Scholar] [CrossRef]
  12. Yu, J.; Wang, Z.; Zhuo, X.; Wang, W.; Gou, X. Surrogate definition and chemical kinetic modeling for two different jet aviation fuels. Energy Fuels 2016, 30, 1375–1382. [Google Scholar] [CrossRef]
  13. Tyliszczak, A.; Boguslawski, A.; Nowak, D. Numerical simulations of combustion process in a gas turbine with a single and multi-point fuel injection system. Appl. Energy 2016, 174, 153–165. [Google Scholar] [CrossRef]
  14. Smooke, M.D. Reduced Kinetic Mechanisms and Asymptotic Approximations for Methane-Air Flames: A Topical Volume [Internet]; Lecture Notes in Physics; Araki, H., Ehlers, J., Hepp, K., Jaffe, R.L., Kippenhahn, R., Ruelle, D., Weidenműller, H.A., Wess, J., Zittartz, J., Eds.; Springer: Berlin/Heidelberg, Germany, 1991; Volume 384. [Google Scholar] [CrossRef]
  15. Bowman, C.T.; Hanson, R.K.; Davidson, D.F.; Gardiner, W.C.; Lissianski, V.; Smith, G.P.; Golden, D.M.; Frenklach, M.; Goldenberg, M. GRI-MECH 2.11; University of California at Berkeley: Berkeley, CA, USA, 1995. [Google Scholar]
  16. Kroyan, Y.; Wojcieszyk, M.; Kaario, O.; Larmi, M. Modeling the impact of sustainable aviation fuel properties on end-use performance and emissions in aircraft jet engines. Energy 2022, 255, 124470. [Google Scholar] [CrossRef]
  17. Białecki, T. Mathematical model of the combustion process for turbojet engine based on fuel properties. Int. J. Energy Environ. Eng. 2022, 13, 1309–1316. [Google Scholar] [CrossRef]
  18. Ziółkowski, J.; Oszczypała, M.; Lęgas, A.; Konwerski, J.; Małachowski, J. A method for calculating the technical readiness of aviation refuelling vehicles. Eksploat. Niezawodn. 2024, 26. [Google Scholar] [CrossRef]
  19. Mehl, M.; Pelucchi, M.; Osswald, P. Understanding the compositional effects of SAFs on combustion intermediates. Front. Energy Res. 2022, 10, 830236. [Google Scholar] [CrossRef]
  20. Kulczycki, A.; Przysowa, R.; Białecki, T.; Gawron, B.; Jasiński, R.; Merkisz, J.; Pielecha, I. Empirical modeling of synthetic fuel combustion in a small turbofan. Energies 2024, 17, 2622. [Google Scholar] [CrossRef]
  21. Elshakre, M.E.; Noamaan, M.A.; Moustafa, H.; Butt, H. Density functional theory, chemical reactivity, pharmacological potential and molecular docking of dihydrothiouracil-indenopyridopyrimidines with human-DNA topoisomerase II. Int. J. Mol. Sci. 2020, 21, 1253. [Google Scholar] [CrossRef]
  22. Wang, W.C.; Faruq Alhikami, A.; Yao, C.E. The study of combustion characteristics for conventional and renewable jet fuels at low-to-intermediate temperatures in a rapid compression machine. Fuel 2022, 324, 124733. [Google Scholar] [CrossRef]
  23. Yelugoti, S.R.; Wang, W.C. The combustion performance of sustainable aviation fuel with hydrogen addition. Int. J. Hydrogen Energy 2023, 48, 6130–6145. [Google Scholar] [CrossRef]
  24. ASTM D4052; Standard Test Method for Density, Relative Density, and API Gravity of Liquids by Digital Density Meter. ASTM International: West Conshohocken, PA, USA, 2022. [CrossRef]
  25. ASTM D2386; Standard Test Method for Freezing Point of Aviation Fuels. ASTM International: West Conshohocken, PA, USA, 2019. [CrossRef]
  26. ASTM D3338; Standard Test Method for Estimation of Net Heat of Combustion of Aviation Fuels. ASTM International: West Conshohocken, PA, USA, 2020. [CrossRef]
  27. ASTM D1319; Standard Test Method for Hydrocarbon Types in Liquid Petroleum Products by Fluorescent Indicator Adsorption. ASTM International: West Conshohocken, PA, USA, 2020. [CrossRef]
  28. ASTM D1840; Standard Test Method for Naphthalene Hydrocarbons in Aviation Turbine Fuels by Ultraviolet Spectrophotometry. ASTM International: West Conshohocken, PA, USA, 2024. [CrossRef]
  29. ASTM D56; Standard Test Method for Flash Point by Tag Closed Cup Tester. ASTM International: West Conshohocken, PA, USA, 2022. [CrossRef]
  30. Grochowalska, J.; Jaworski, P.; Kapusta, Ł.J. Analysis of the structure of the atomized fuel spray with marine diesel engine injector in the early stage of injection. Combust. Engines 2023, 195, 97–103. [Google Scholar] [CrossRef]
  31. Lewińska, J.; Kapusta, Ł. Analysis of the microstructure of the fuel spray atomized by marine injector. Combust. Engines 2017, 169, 120–124. [Google Scholar] [CrossRef]
  32. Curto-Risso, P.L.; Medina, A.; Calvo Hernández, A.; Guzmán-Vargas, L.; Angulo-Brown, F. On cycle-to-cycle heat release variations in a simulated spark ignition heat engine. Appl. Energy 2011, 88, 1557–1567. [Google Scholar] [CrossRef]
  33. Fan, C.; Keiya, N.; Liu, Y.; Zheng, T.; Sun, Y. Experimental study on diesel spray combustion and heat transfer characteristics with multiple injection strategies by means of rapid compression and expansion machine. J. Energy Inst. 2023, 108, 101232. [Google Scholar] [CrossRef]
  34. Glewen, W.J.; Wagner, R.M.; Edwards, K.D.; Daw, C.S. Analysis of cyclic variability in spark-assisted HCCI combustion using a double Wiebe function. Proc. Combust. Inst. 2009, 32, 2885–2892. [Google Scholar] [CrossRef]
  35. Villenave, N.; Dayma, G.; Brequigny, P.; Foucher, F. Experimental investigation of NOx impact on ignition delay times for lean H2/air mixtures using a rapid compression machine under internal combustion engine conditions. Fuel 2024, 374, 132482. [Google Scholar] [CrossRef]
  36. Zhang, R.; Liu, W.; Zhang, Q.; Qi, Y.; Wang, Z. Auto-ignition and knocking combustion characteristics of iso-octane-ammonia fuel blends in a rapid compression machine. Fuel 2023, 352, 129088. [Google Scholar] [CrossRef]
  37. DGEN 380 BR Training. DSF-000008-A01 (Unpublished); Price Induction: Anglet, France, 2017. [Google Scholar]
  38. Przysowa, R.; Gawron, B.; Białecki, T.; Łęgowik, A.; Merkisz, J.; Jasiński, R. Performance and emissions of a microturbine and turbofan powered by alternative fuels. Aerospace 2021, 8, 25. [Google Scholar] [CrossRef]
  39. Olanrewaju, F.O.; Li, H.; Andrews, G.E.; Phylaktou, H.N. Improved model for the analysis of the heat release rate (HRR) in compression ignition (CI) engines. J. Energy Inst. 2020, 93, 1901–1913. [Google Scholar] [CrossRef]
  40. Olanrewaju, F.O.; Li, H.; Aslam, Z.; Hammerton, J.; Lovett, J.C. Analysis of the effect of syngas substitution of diesel on the heat release rate and combustion behaviour of diesel-syngas dual fuel engine. Fuel 2022, 312, 122842. [Google Scholar] [CrossRef]
  41. Zeng, J.; Cao, L.; Xu, M.; Zhu, T.; Zhang, J.Z.H. Complex reaction processes in combustion unraveled by neural network-based molecular dynamics simulation. Nat. Commun. 2020, 11, 5713. [Google Scholar] [CrossRef]
Figure 1. Schematic diagram of the four-stage methodology for assessing the impact of SAFs on the operation of turbine aircraft engines [4,6].
Energies 17 05232 g001
Figure 2. Rapid compression combustion machine: (a) stand view; (b) diagram of the complete RCCM system (arrows indicate the direction of information flow).
Energies 17 05232 g002
Figure 3. Assessment of changes in the pressure course in the cylinder in terms of comparisons of the combustion processes.
Energies 17 05232 g003
Figure 4. Analysis of the course of heat release during the combustion of the tested fuels.
Energies 17 05232 g004
Figure 5. The relationships between thrust F and fuel flow mf for blends containing SBC H (a) and SBC A (b)—tests on the DGEN 380 engine.
Energies 17 05232 g005
Figure 6. The relationships between fuel flow m f and 1/T4 for blends containing: (a) SBCa H; (b) SBCa A (tests on the DGEN 380 engine).
Energies 17 05232 g006
Figure 7. The relationships between C O concentration in exhaust gases and inverted temperature in the combustion chamber of the DGEN 380 engine: (a) for SBCa H; (b) for SBCa A.
Energies 17 05232 g007
Figure 8. The relationships between E a C O / R T 4 and l n a · m f for fuels A0, A30, H0 and H30 tested on the DGEN 380 engine: (a) for SBCa H; (b) for SBCa A.
Energies 17 05232 g008
Figure 9. The relationships between E a C O 2 / R determined for the DGEN tests results: (a) P m a x and (b) d Q / d t m a x in RCCM single combustion cycle machine.
Energies 17 05232 g009
Figure 10. The relationship between α i C O 2 S A F / α i C O 2 J E T determined for the DGEN tests results: (a) P m a x and (b) d Q / d t m a x during RCCM tests.
Energies 17 05232 g010
Figure 11. The relationship between α i C O S A F / α i C O J E T determined for the DGEN tests results: (a) P m a x and (b) 1 / d Q / d t m a x during RCCM tests.
Energies 17 05232 g011
Figure 12. The relationship between (a) C O 2 (red color—no physical value) and (b) C O concentration in exhaust gases during DGEN test— m f = 50 dm3/h.
Energies 17 05232 g012
Figure 13. The relationship between (a) C O 2 (red color—no physical value) and (b) C O concentration in exhaust gases during the DGEN test— m f = 90 dm3/h.
Energies 17 05232 g013
Figure 14. The relationship between (a) C O 2 and (b) C O concentration in exhaust gases during DGEN test— m f = 150 dm3/h.
Energies 17 05232 g014
Figure 15. The relationship between parameters: (a) a; (b) b and (c) c and the fuel flow rate m f .
Energies 17 05232 g015
Figure 16. The relationship between parameter (a) a 1 and fuel flow rate m f and (b) b 1 and fuel flow rate m f .
Energies 17 05232 g016
Table 1. Properties of prepared blends.
PropertyUnitTest MethodRequirement JetA-1 (A)A5A20A30JetA-1 (H)H5H20H30
Density at 15 °C kg/m3ASTM D4052 [24]775–840798796790786796791787783
Viscosity at −20 °Cmm2/sASTM D2386 [25]max. 8.03.403.453.573.663.253.293.403.47
Calorific valueMJ/kgASTM D3338 [26] min. 42.843.243.343.443.443.343.343.543.6
Content of aromatics % (v/v)ASTM D1319 [27] max. 2516.715.713.011.315.114.312.110.6
Naphthalene content% (v/v)ASTM D1840 [28] max. 30.580.550.460.400.550.520.440.39
Flashpoint°CASTM D56 [29]min. 385049494949484646
Table 2. Technical specifications of the RCCM.
QuantityValue
Cylinder displacement89 mm
Cylinder bore80 mm
Cylinder volume444 cm3
Combustion chamber volume55 cm3
Air feedElectromagnetic valves
Outlet Electromagnetic valves
Piston drivePneumatic
Compression ratio14
Type of combustion chamberSemi-spherical chamber inside the cylinder head + in-cylinder chamber
Piston deceleration methodPneumatic
Piston velocity1–3 m/s, depending on the air pressure under the piston
Piston sealingPiston rings, PTFE sealing
Optical accessQuartz glass ϕ48 × 50 mm, located below the piston combustion chamber
Fuel injectionDirect, multiple
Table 3. The results of the RCCM test.
Fuel P m a x [bar] d Q / d t m a x [J/ms]
Jet A-1 (A)43.97390
A3045.85410
H3045.51400
Table 4. The parameters of Equation (7) in the DGEN 380 engine.
FuelaL0Equation
H03.6113.28F = 3.61 mf − 13.28
H53.6613.68F = 3.66 mf − 13.68
H203.6213.22F = 3.62 mf − 13.22
H303.5613.27F = 3.56 mf − 13.27
A03.4012.02F = 3.40 mf − 12.02
A53.4312.77F = 3.43 mf − 12.77
A203.4112.63F = 3.41 mf − 12.63
A303.5214.33F = 3.52 mf − 14.33
Table 5. The values of the coefficient of reactivity α i and the energy of activation E a C O 2 obtained for the DGEN 380 engine tests.
Fuel α i C O 2 · A C O 2 · D / a α i C O 2 · A C O 2 · D α i C O 2 S A F / α i C O 2 J E T E a C O 2 / R E a C O 2 S A F / E a C O 2 J E T
A0450.4615351.0034801.00
A5583.9415601.0235251.01
A20498.1615040.9835561.01
A30532.2318781.2237051.07
H0451.4226841.0034411.00
H5454.9528111.0536981.07
H20441.1628511.0635531.03
H30533.4432491.2136371.06
Table 6. Empirically obtained values of the parameters of function for the tested fuel blends.
Fuel R 2 ( E a C O + E a C O 2 c h ) / R E a C O / R c 2 · 1 + e t / e t · c 5 · m f n
A00.741124599820.0017
A300.806473429030.0122
H00.824432592580.0002
H300.799290528430.0084
Table 7. The values of l n ( α i C O · D C O · A C O ) for tested fuels.
Fuel l n ( α i C O · D C O · A C O ) n
A02.290.29
A306.440.79
H00.490.06
H305.830.76
Disclaimer/Publisher’s Note: The statements, opinions and data contained in all publications are solely those of the individual author(s) and contributor(s) and not of MDPI and/or the editor(s). MDPI and/or the editor(s) disclaim responsibility for any injury to people or property resulting from any ideas, methods, instructions or products referred to in the content.

