Article

Clamping Pressure and Catalyst Distribution Analyses on PEMFC Performance Improvement

1
College of Mechanical and Vehicle Engineering, Hunan University, Changsha 410082, China
2
Jiangxi Copper Technology Research Institute Co., Ltd., Nanchang 330096, China
*
Author to whom correspondence should be addressed.
Energies 2024, 17(20), 5223; https://doi.org/10.3390/en17205223
Submission received: 15 September 2024 / Revised: 6 October 2024 / Accepted: 15 October 2024 / Published: 20 October 2024
(This article belongs to the Section F1: Electrical Power System)

Abstract

:
The coupling effects of clamping pressure and catalyst distribution are comprehensively considered to improve proton exchange membrane fuel cell (PEMFC) performance. Numerical models were constructed to study the performance changes and the corresponding internal states of PEMFC under different clamping pressures. Since the increased clamping pressure reduces the uniformity of current density, non-uniform designs with decreased catalyst loading under channel and increased catalyst loading under rib are proposed for performance improvement. A weighted objective function considering current density magnitude and uniformity was constructed, and the performances of different catalyst loading distributions were analyzed. Compared to the uniform distribution, the optimized distribution with a variation of −15% and 15% under channel and rib had the maximum objective function value of 17.24%. The deformation analysis of the gas diffusion layer and optimization of catalyst loading distribution based on deformation analysis provided a reference for the assembly of PEMFC and the production of MEA.

1. Introduction

Proton exchange membrane fuel cell (PEMFC) is a new power generation technology that converts hydrogen energy into electrical energy. It has the advantages of high efficiency, high power density, and cleanliness. The gas diffusion layer (GDL), cathode catalyst layer (CCL), and anode catalyst layer (ACL) are important components of a proton exchange membrane fuel cell [1]. After being compressed by the bipolar plate, the transport properties of electrons, heat, and reactants in GDL will be changed [2,3]. Moreover, the mass transfer behavior between GDL and CL will also be affected [4]. The electrochemical reaction in CL becomes more uneven under clamping pressure [5].
Many studies have been carried out on GDL deformation and its impacts on fuel cell performance. Xiao et al. [6] reconstructed the fiber structures of GDL to reveal the three-dimensional displacement of carbon fibers during compression. The results showed that the displacement of carbon fiber located in the top region was the largest, followed by the middle region. Zhang et al. [7] found that the contact pair and the pore space of the fibers were two key factors determining the compression curve of GDL. Moreover, the equivalent Young’s modulus increased with decreased porosity and carbon fiber diameter, but was not sensitive to the thickness of the carbon paper. Aldakheel et al. [8] simulated the impacts of cyclic loading on fuel cells and found that the first compression was the main cause of GDL deformation. The GDL deformation affected the reactants’ transportation, internal resistance, and current distribution. Zhang et al. [9] recognized the impact of mechanical compression on transport properties and cell performance. The results showed that a 20% compression ratio was the optimal point to balance gas diffusion and thermoelectric conduction. Chen et al. [10] found that the GDL diffusion under the rib decreased with increased compression ratio, but the GDL diffusion under the flow channel remained unchanged. Li et al. [5] studied the deformation effects on fuel cell performance with a serpentine flow field. The results showed that the uneven deformation could lead to uneven diffusion ability and current density distributions. From the above literature, it was found that the GDL property changes after deformation obviously impact fuel cell performance.
Furthermore, in order to adjust the GDL deformation, reduce the assembly stress, and even improve the power output, the clamping pressure range and structure parameters of rib and GDL can be optimized. Jing et al. [11] found that the optimal clamping force for PEMFC varied across different operating voltage ranges. Movahedi et al. [12] found that the optimized clamping pressure range was related to the thickness of the GDL. The fuel cell power density and temperature distribution improved after optimization. Liu et al. [13] proposed a new parabolic rib that significantly reduces the maximum stress in GDL. Compared to a circular rib, the maximum normal and shear stress was reduced by more than 30% and 60%, respectively. Zhang et al. [14] found that the draft angle of a metal bipolar plate has a significant impact on the stress distribution and the contact resistance in GDL. Zheng et al. [15] optimized the porosity and permeability of the GDL in different regions to enhance its mass transport capabilities.
Additionally, some researchers found that matching the structures of GDL and CL can achieve better gas transport in the fuel cell. Yu et al. [16] matched the gradient of GDL porosity and the catalyst loading gradient in CL, which improved fuel cell performance. Yu et al. [17] investigated the heat and mass transfer at the interface between GDL and CL; the results showed that more catalyst loadings in the CL could improve the transport. By adapting to the uneven reactant distribution under clamping pressure, the current density uniformity of PEMFC can be improved with an optimized CL. Huang et al. [18] employed ionomers with varying equivalent weight (EW) values to create a gradient CCL to enhance mass transport and improve water management capability within PEMFC. Li et al. [19] optimized the pore gradient in CCL, which improved the proton transfer and mass transfer in the fuel cell. Shin et al. [20] designed multi-layered CLs with different catalyst loadings and Nafion ionomers to improve its electrochemical surface area. Yang et al. [21] increased the catalyst loadings near the cathode outlet to improve cold-start performance. Sassin et al. [22] studied the performance of CLs with different thicknesses. The mass and charge transfer resistance were subsequently considered for thickness optimization.
The GDL deforms under clamping pressure. The GDL deformation will affect the transport of reactants entering the CL, and the liquid water produced in CL will further affect the reactants’ distribution in GDL. Therefore, the mass transport between GDL and CL is coupled with each other under clamping pressure. However, the above structure optimization of GDL and CL ignores the coupling relationship. The mismatch may occur between the optimized one and another. This research analyzes the material properties and gas diffusion characteristics under different clamping pressures to investigate the influences of clamping pressure on PEMFC internal states. The catalyst loading distribution can be optimized with the aim of power density and current density uniformity improvement.

2. Mathematical Model

2.1. Model Assumptions

In order to study the effects of clamping pressure on PEMFC performance, this research uses solid mechanic and electrochemical theories to solve the stress and reactants’ distribution in PEMFC.
Assumptions that are utilized in this study can be categorized as follows [23,24]:
  • The PEMFC is assumed to operate in steady state.
  • Both the thermal and cyclic stress are ignored.
  • The clamping pressure applied to the bipolar plate is uniform and equal everywhere.
  • Only the elastic deformation of GDL is considered.
  • Flows inside the PEMFC are assumed to be incompressible and laminar.

2.2. Solid Equations

The solution to the GDL deformation is considered as a plane strain problem in this research, which is governed by equilibrium equations, geometric equations, and constitutive equations [7]:
{ σ x x + τ y x y + τ z x z + F x = 0 σ y y + τ z y z + τ x y x + F y = 0 σ z z + τ x z x + τ y z y + F z = 0
{ ε x = u x ,   ε y = v y ,   ε z = w z γ x y = u y + v x ,   γ y z = w y + v z ,   γ z x = w x + u z
{ ε x = 1 E [ σ x μ ( σ y + σ z ) ] ,   γ x y = τ x y G ε y = 1 E [ σ y μ ( σ x + σ z ) ] ,   γ y z = τ y z G ε z = 1 E [ σ z μ ( σ x + σ y ) ] ,   γ z x = τ z x G
where σi represents the normal stress along three directions such as x, y, and z; τij represents the shear stress; Fi represents the externally applied force; u, v, and w represent the displacement; εi represents the positive strain; γij represents the shear strain; μ represents Poisson’s ratio; G represents the shear elastic modulus; and E represents the elastic modulus.

2.3. Governing Equations

The electrochemical reaction and energy conversion process in PEMFC can be represented by a series of governing equations. Some variables in these equations are modified to couple the deformation impacts.
The following conservation equation is used to calculate the reactants’ mass distribution [23]:
( ε ρ U ) = S m ( ε ρ U U ) = ε P + ( ε μ μ ) + S u ( ε U c ) = ( D g e f f c ) + S m
where ε is the porosity of the porous medium, U is the gas velocity, μ is the viscosity, P is the pressure, Su is the momentum source term, c represents the components concentration, Sm is the source term of the components, and Dgeff represents the gas diffusion coefficient, which can be written as follows:
D g e f f = ε 1.5 ( 1 s ) r s D g 0 ( P 0 P ) γ p ( T T 0 ) γ t
where ε is the porosity; s represents the liquid water saturation; γs, γp, and γt are user-defined exponents; D g 0 is the mass diffusivity of species at reference temperature and pressure (P0, T0); P and T are the pressure and temperature, respectively; and ε represents the porosity, which can be calculated by the following correlation [25]:
ε = 1 ( 1 ε 0 ) δ 0 δ y
where δy stands for the GDL deformation after compression, and ε0 and δ0 represent the initial porosity and thickness, respectively.
The equations that govern the liquid water distribution in GDL after deformation are shown below [23]:
( ρ K e f f K r μ ( p c + p ) ) = S l d S g l
where ρ is the density of liquid water, μ is the dynamic viscosity, Kr is the relative permeability, pc is the capillary pressure, Sgl is the conversion rate of water between liquid and gas phases, Sld is the conversion rate of water between liquid and dissolved phases, and Keff is the effective permeability corrected by porosity [26]:
K e f f = ε ( ε 0.037 ) 2.661 d f 2 8 ( I n ε ) 2 0.975 ( 1.661 ε 0.0037 ) 2
where df is the carbon fiber diameter, and ε is the porosity.
The following charge conservation equations reflect the transport of electrons and protons [23]:
( σ s o l e f f ϕ s o l ) + R s o l = 0 R s o l = ( ζ s o l j s o l ( T ) ) × ( [ A ] [ A ] r e f ) γ s o l × ( e α a n s o l F η a n R T e α c a t s o l F η c a t R T )
where ϕsol is the solid phase potential, Rsol is the volumetric transfer current in solid phase, ζsol is the active surface area, jsol is the reference exchange current density, [A]ref represents the reference molar concentrations of the components, [A] is the molar concentration, γsol is the user-defined exponent, α is the transmission coefficient, η is the electrochemical overpotential, and σ s o l e f f is the effective electrical conductivity corrected by porosity [14]:
σ s o l e f f = σ 0 ( 1 ε ) 1.5
where σ0 is the initial electrical conductivity, and ε is the porosity.
The energy conservation equation that reflects the temperature change can be written as follows [23]:
( ρ c p U T ) = ( k e f f T ) + S r e a c t + S p h a s e
where cp is the constant pressure specific heat; T is the temperature; keff is the thermal conductivity; Sreact and Sphase are the reaction heat and phase transition heat, respectively; and keff represents the thermal conductivity corrected by porosity [27]:
k e f f = k 0 ( 1 3 ε 3 ( 1 ε ) )
where k0 is the initial thermal conductivity, and ε is the porosity.
To solve the above governing equations, a three-dimensional PEMFC mesh model was established, as shown in Figure 1. The differential equations are discretized, and the iterative calculations are performed using the finite volume method in Fluent. Table 1 shows the geometric parameters implemented in the present PEMFC model.

2.4. Boundary Condition

The inlet mass flow boundary condition for the above PEMFC model is defined as follows:
m ˙ h 2 , a i r = S i n F A MEA 1 x R T P ρ
where S represents the stoichiometric ratio, i represents the reference current density, n represents the electron number of the reactants, F represents the Faraday constant, AMEA represents the active area, x represents the mole fraction of the reactants, P represents the inlet pressure, ρ represents the density of the reactants, R represents the Avogadro constant, and T represents the inlet temperature.

2.5. Numerical Simulation of Deformation

During the operation of a PEMFC, hydrogen and oxygen undergo an electrochemical reaction at the anode and cathode, respectively. The electrical energy is subsequently output to external loads. To maintain strong sealing performance and reduce the conduction resistance of electrons, it is necessary to apply clamping force to the BP using connectors. Referring to Zhang et al. [14], this research assumes that the clamping force applied to the BP is uniformly distributed, and the relevant physical parameters of each component are shown in Table 2. To calculate the GDL deformation under different clamping pressures, the parameters such as Young’s modulus, Poisson’s ratio, and density are inputted into the finite element analysis module of SolidWorks. By fixing the right-end face of PEM and applying uniform pressure to the left-end face of BP, the finite element method is used to solve the components’ deformation. The displacement result (URES) at 1 MPa is shown in Figure 2. It can be seen that the GDL deformation is greater than that of other components. Therefore, this research only considers the GDL deformation.

2.6. Model Validation

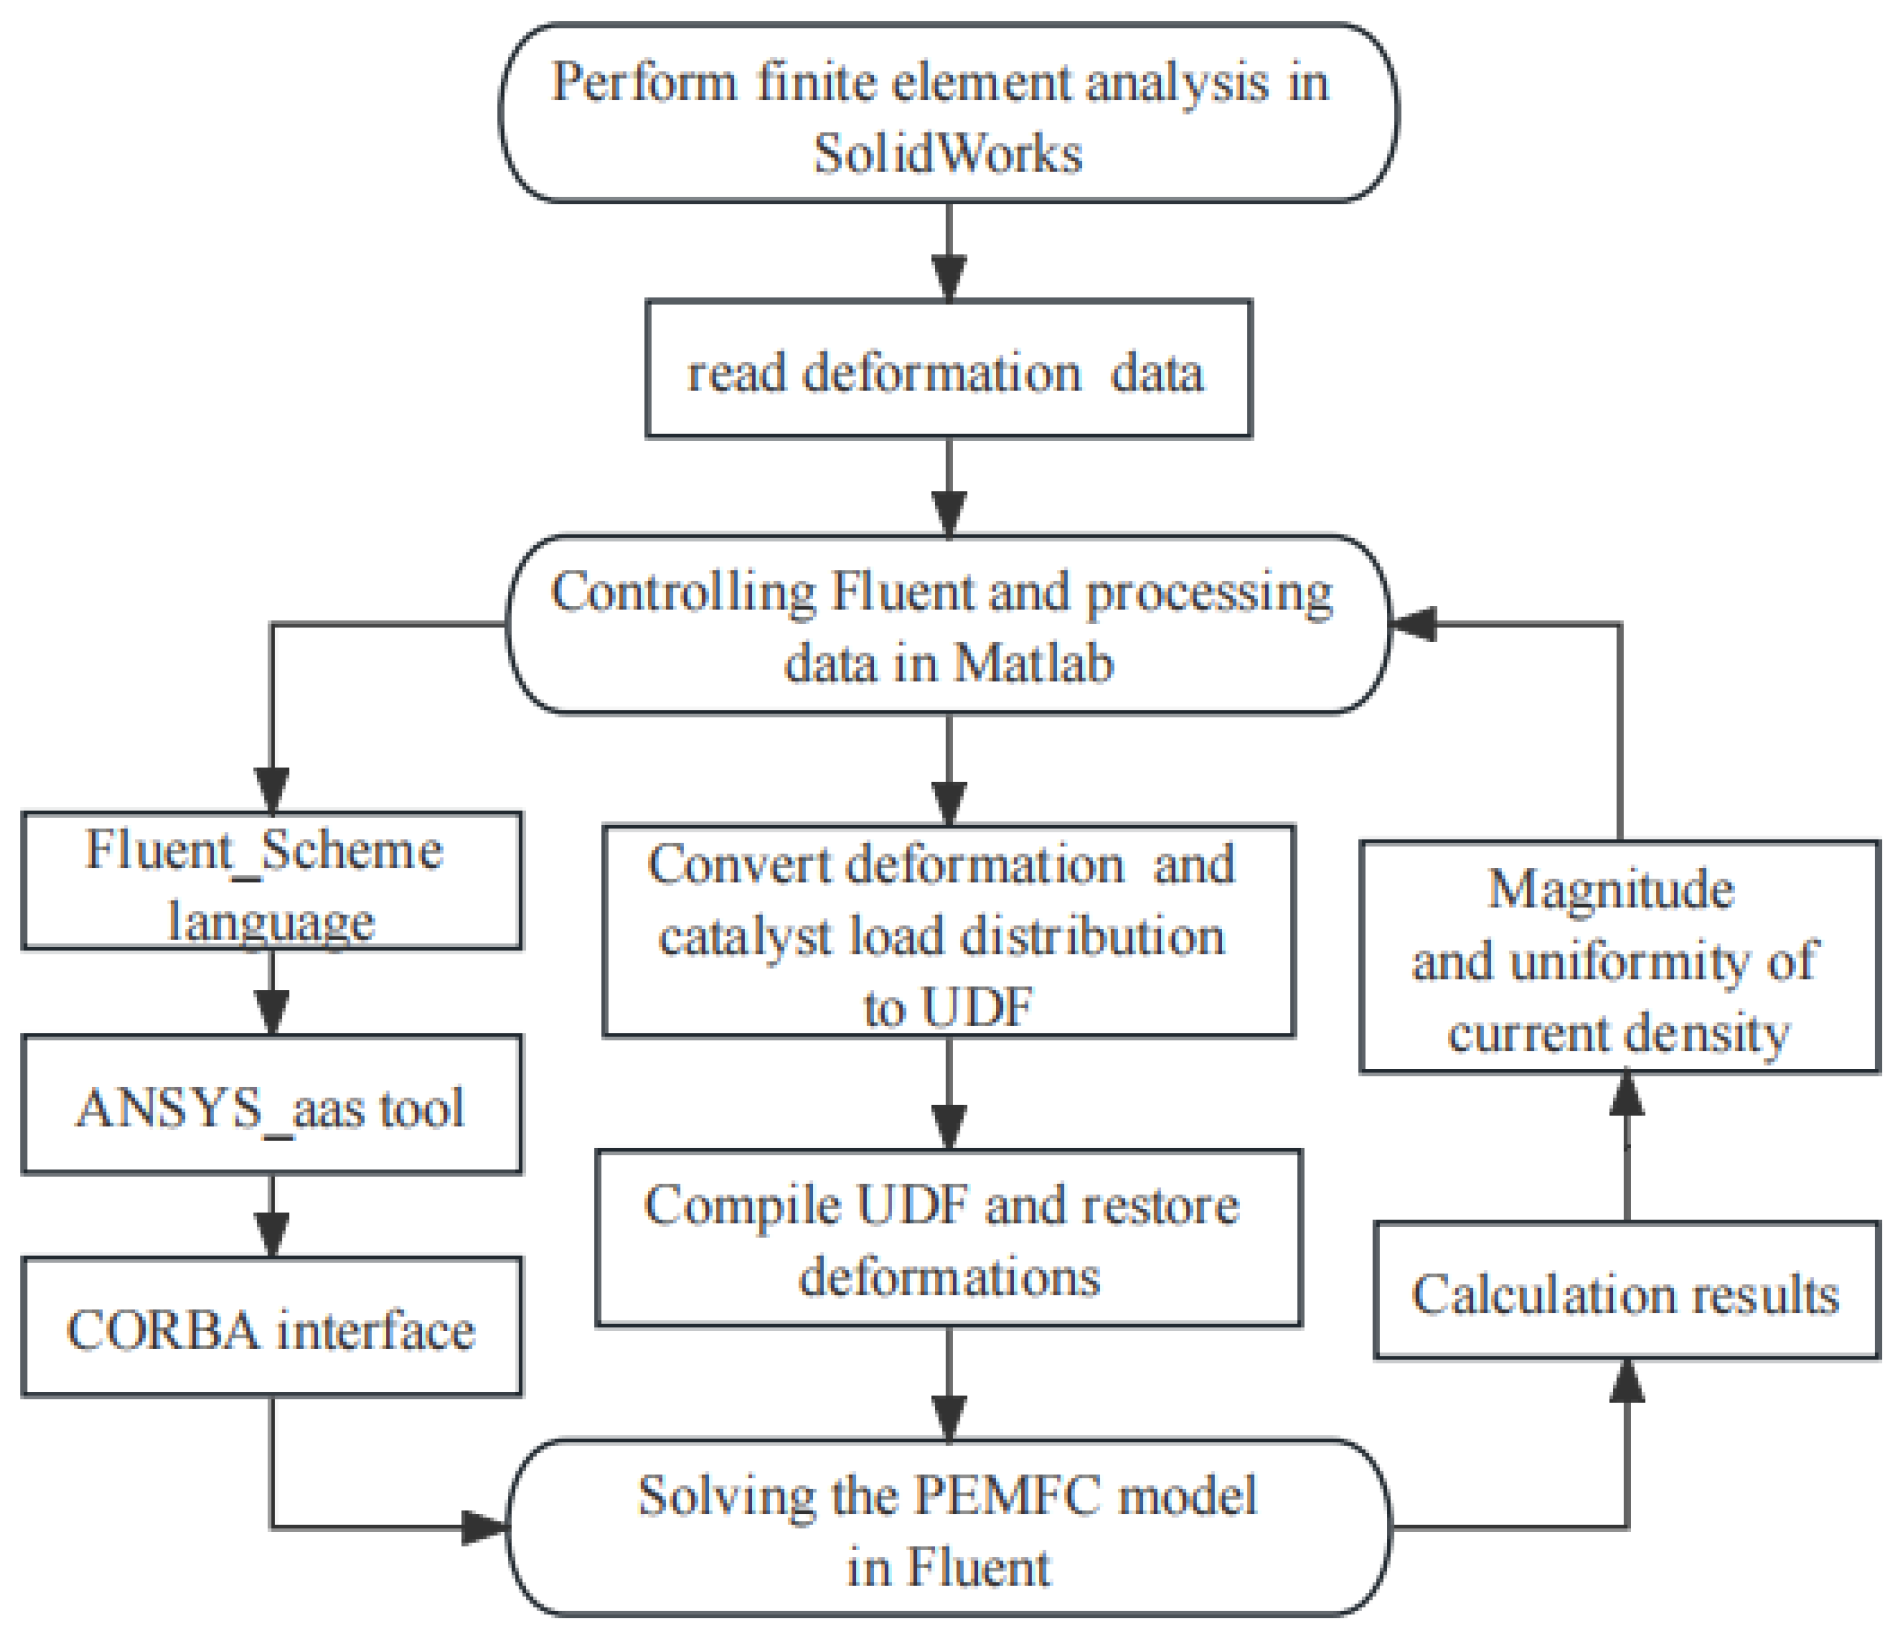
As shown in Figure 3, the GDL deformation exports from SolidWorks were processed by Matlab. The user-defined function (UDF) was subsequently used to pass the deformation into Fluent. The deformation analysis result was stored in the central node of each grid, which can be used to calculate porosity and permeability after deformation using Equation (6). The mesh center position can be changed via dynamic grid function to restore deformation in Fluent. The G60 test bench produced by GREENLIGHT Corporation was employed for the polarization performance experiment and data collection. An MEA with a reaction area of 25 cm2 was used for testing. The CL was composed of Pt/C and an ionomer had a catalyst loading of 0.1 mg cm−2 in ACL and a catalyst loading of 0.4 mg cm−2 in CCL. The other geometric parameters of PEMFC were the same as the values in Table 1. The clamping pressure was kept at 1 MPa, and the operating conditions are shown in Table 3. Finally, the PEMFC module in Fluent was used to compute the polarization curve, and the simulation result was compared with experimental data under 1 MPa in Figure 4. The simulation data and experimental data agreed reasonably, with an average error of 1.646%.

3. Results and Discussion

3.1. Deformation Analysis of Gas Diffusion Layer

The deformation characteristics of GDL under 0.5, 1, and 1.5 MPa are shown in Figure 5. Due to the difference in clamping force applied to GDL under the flow channel and rib, the deformation amount under the rib was significantly greater than that under the flow channel. The GDL deformation near the CL was relatively smaller, which is 1/200 of the amount near the BP, and the transitional zone between the rib and channel also changed more continuously. Therefore, the GDL deformation between BP and CL was non-uniform. The GDL will generate different local deformations after applying clamping pressure, which may affect the mass transfer characteristics at various locations in GDL.

3.2. Effects of Deformation on PEMFC Performance

The effects of deformation on PEMFC performance are analyzed in this section. As shown in Figure 6, this research created three planes along the Z-axis at 0.075 m, 0.1 m, and 0.125 m, respectively. The current density, temperature, and reactants’ concentration distributions at each plane were solved in Fluent 2021 R2 software.
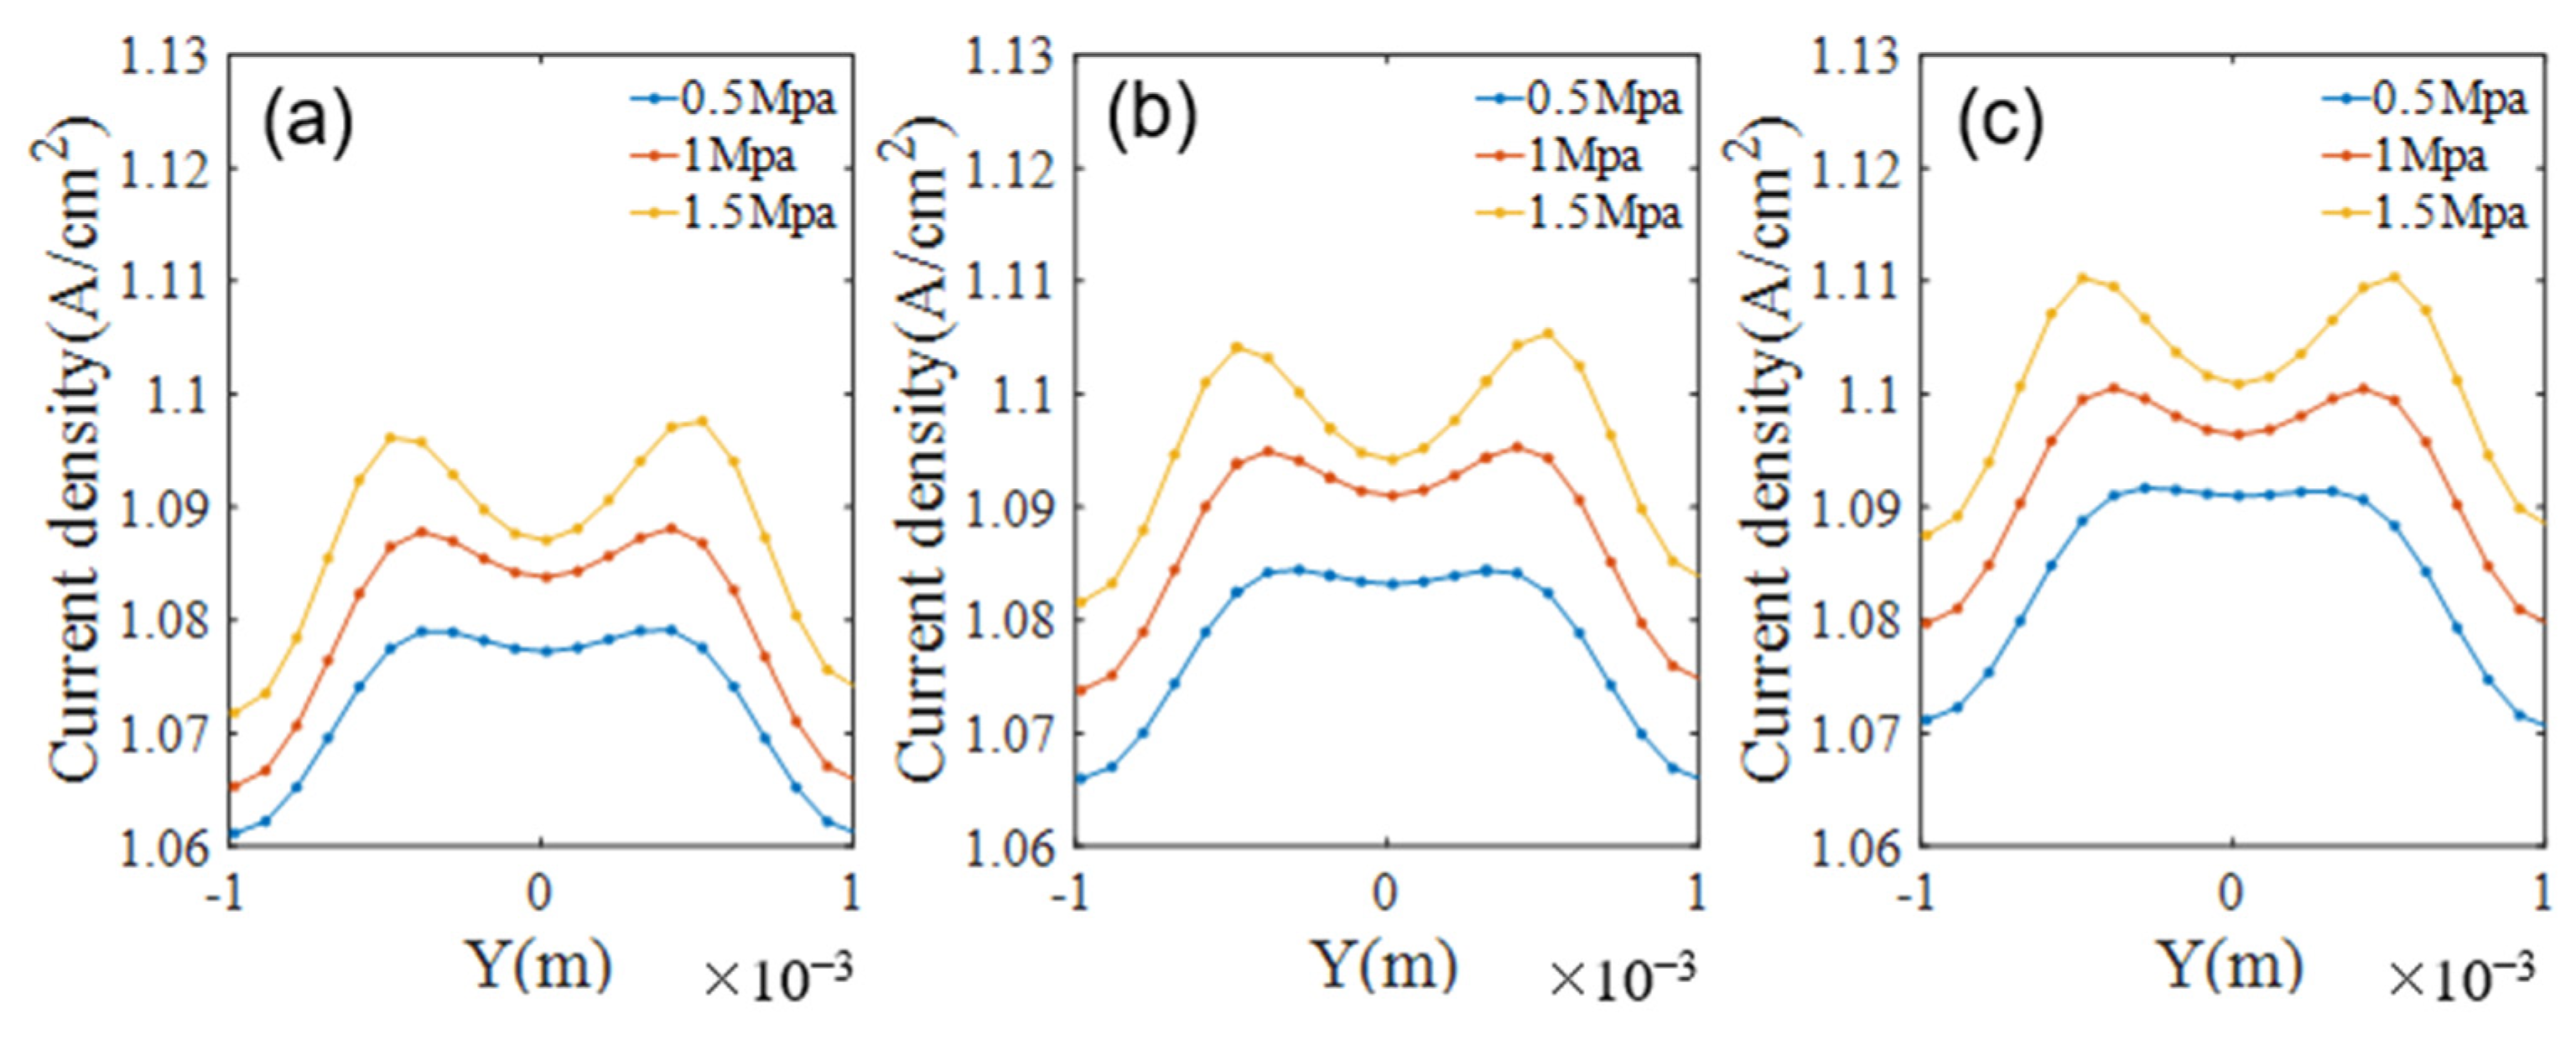
The current density at the center line of different planes is shown in Figure 7, which increased as the clamping pressure changed from 0.5 to 1.5 MPa. Since the ohmic loss plays an important role in the total voltage loss, the increased clamping pressure reduced the ohmic loss and improved the PEMFC performance. Moreover, due to the smaller GDL deformation under the flow channel, the gas transport resistance was less, and the gas was able to more easily enter CL from the channel. The current density under the flow channel was also significantly higher than that under the rib. However, as the clamping pressure increased, the current density uniformity decreased.
The uneven current density distribution indicates that the chemical reaction rate is non-uniform, which will affect the heat accumulation in various regions. As shown in Figure 8, the temperature difference under the channel and rib became more pronounced as the clamping pressure increased. The increased clamping pressure led to a higher current density and chemical reaction rate under the channel. Therefore, the temperature under the channel was higher than that under the rib. The temperature distribution uniformity will also be exacerbated as the clamping pressure is increased.
The liquid water contents under different clamping pressures are shown in Figure 9. Due to the low GDL diffusion under the rib, the transfer resistance of liquid water at this location was greater. Therefore, as the clamping pressure increases, more water will accumulate under the rib.
The liquid water aggregation and porosity decrease under the rib may hinder the oxygen entering CL from GDL. After applying clamping pressure, the porosities under the rib decreased sharply while the porosities under the channel changed slightly. The GDL thickness also decreased. Therefore, the increased clamping pressure made it easier for the reaction gas to enter the CL from the channel. As shown in Figure 10, the mass fraction of oxygen under the rib is less than that under the channel, and the difference becomes more pronounced as the clamping pressure increases.
The above research reveals the current density, temperature, and reactants’ concentration distributions in MEA. It is shown that the increased clamping pressure improved the current density magnitude of PEMFC, but it also intensified the uneven distributions of chemical reaction rate, reactant concentrations, liquid water, and heat. Therefore, based on the above analysis, optimization measures were implemented in this research to improve the current density magnitude and uniformity simultaneously.

3.3. Optimization of Cathode Catalytic Layer

The clamping pressure should be applied to reduce ohmic polarization and prevent gas leakage. As discussed in Section 3.2, due to the difference of GDL deformation under the rib and channel, the transfer characteristics of reactants are uneven, which ultimately reduces the current density uniformity. Furthermore, the CCL remains a major restriction on performance due to sluggish reaction kinetics [28]. The optimization of the CCL is more urgent than that of the ACL. Therefore, by balancing the electrochemical reaction rates of MEA under the rib and the flow channel, a non-uniform cathode catalyst loading distribution is proposed to improve current density uniformity.
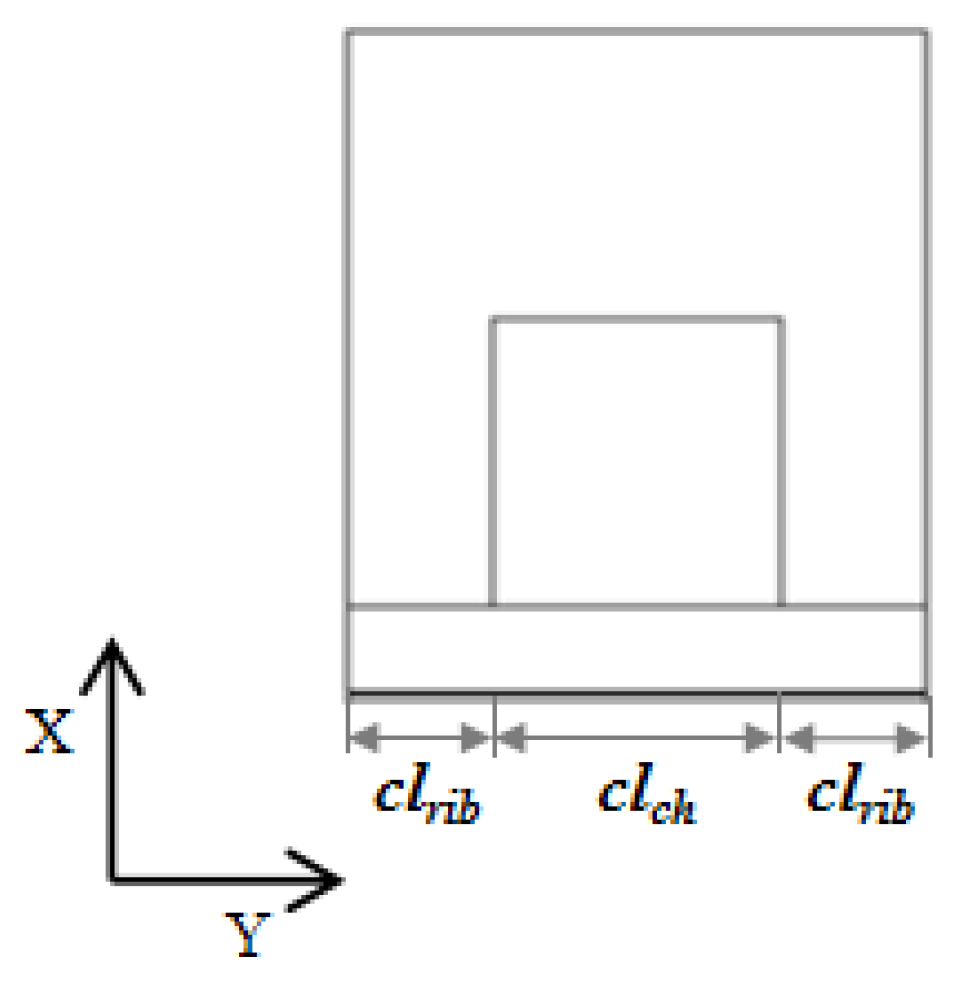
For comparison, the total cathode catalyst loading is the same as uniform distribution. Considering the non-uniform current density distribution under the rib and channel, the catalyst loadings under them are designed to be different. As shown in Figure 11, the catalyst loadings under the channel and rib can be represented by clch and clrib, respectively. By keeping the total cathode catalyst loading unchanged, the catalyst loading under the rib is designed to be greater than that under the channel. Therefore, the effects of deformation difference under the rib and channel are compensated, and the current density uniformity can be improved. The values of clch and clrib are optimized by analyzing the variation of PEMFC performance. Since the areas of the channel and the ribs are similar, the catalyst loadings under the rib and channel are equal for a uniform distribution. The clch and clrib can be calculated by the following function:
{ c l c h = c l c h _ 0 × ( 1 + x ) c l r i b = c l r i b _ 0 × ( 1 + y )
where x and y represent the change rate of clch and clrib, respectively, and clch_0 and clrib_0 represent the catalyst loading under the rib and channel for a uniform distribution. Because the total amount of catalyst loading remains unchanged, x and y have the following relationship:
x + y = 0
Fluent software is used in this research to calculate the polarization performance and current density standard deviation of the PEMFC with different cathode catalyst loading distributions. First, the catalyst loading change relative to uniform distribution can be assumed to vary within [−37.5%, 0%]. Then, the domain is roughly discretized into four points ( x = 0%, x = −12.5%, x = −25%, x = −37.5%) to study how catalyst loading distribution affects the current density magnitude and uniformity. According to Equation (15), the corresponding values of y are 0%, 12.5%, 25%, and 37.5%, respectively. The catalyst loading distribution with x = 0% and y = 0% is named Uniform, and the other three distributions mentioned above are named Distribution 1, Distribution 2, and Distribution 3, respectively.
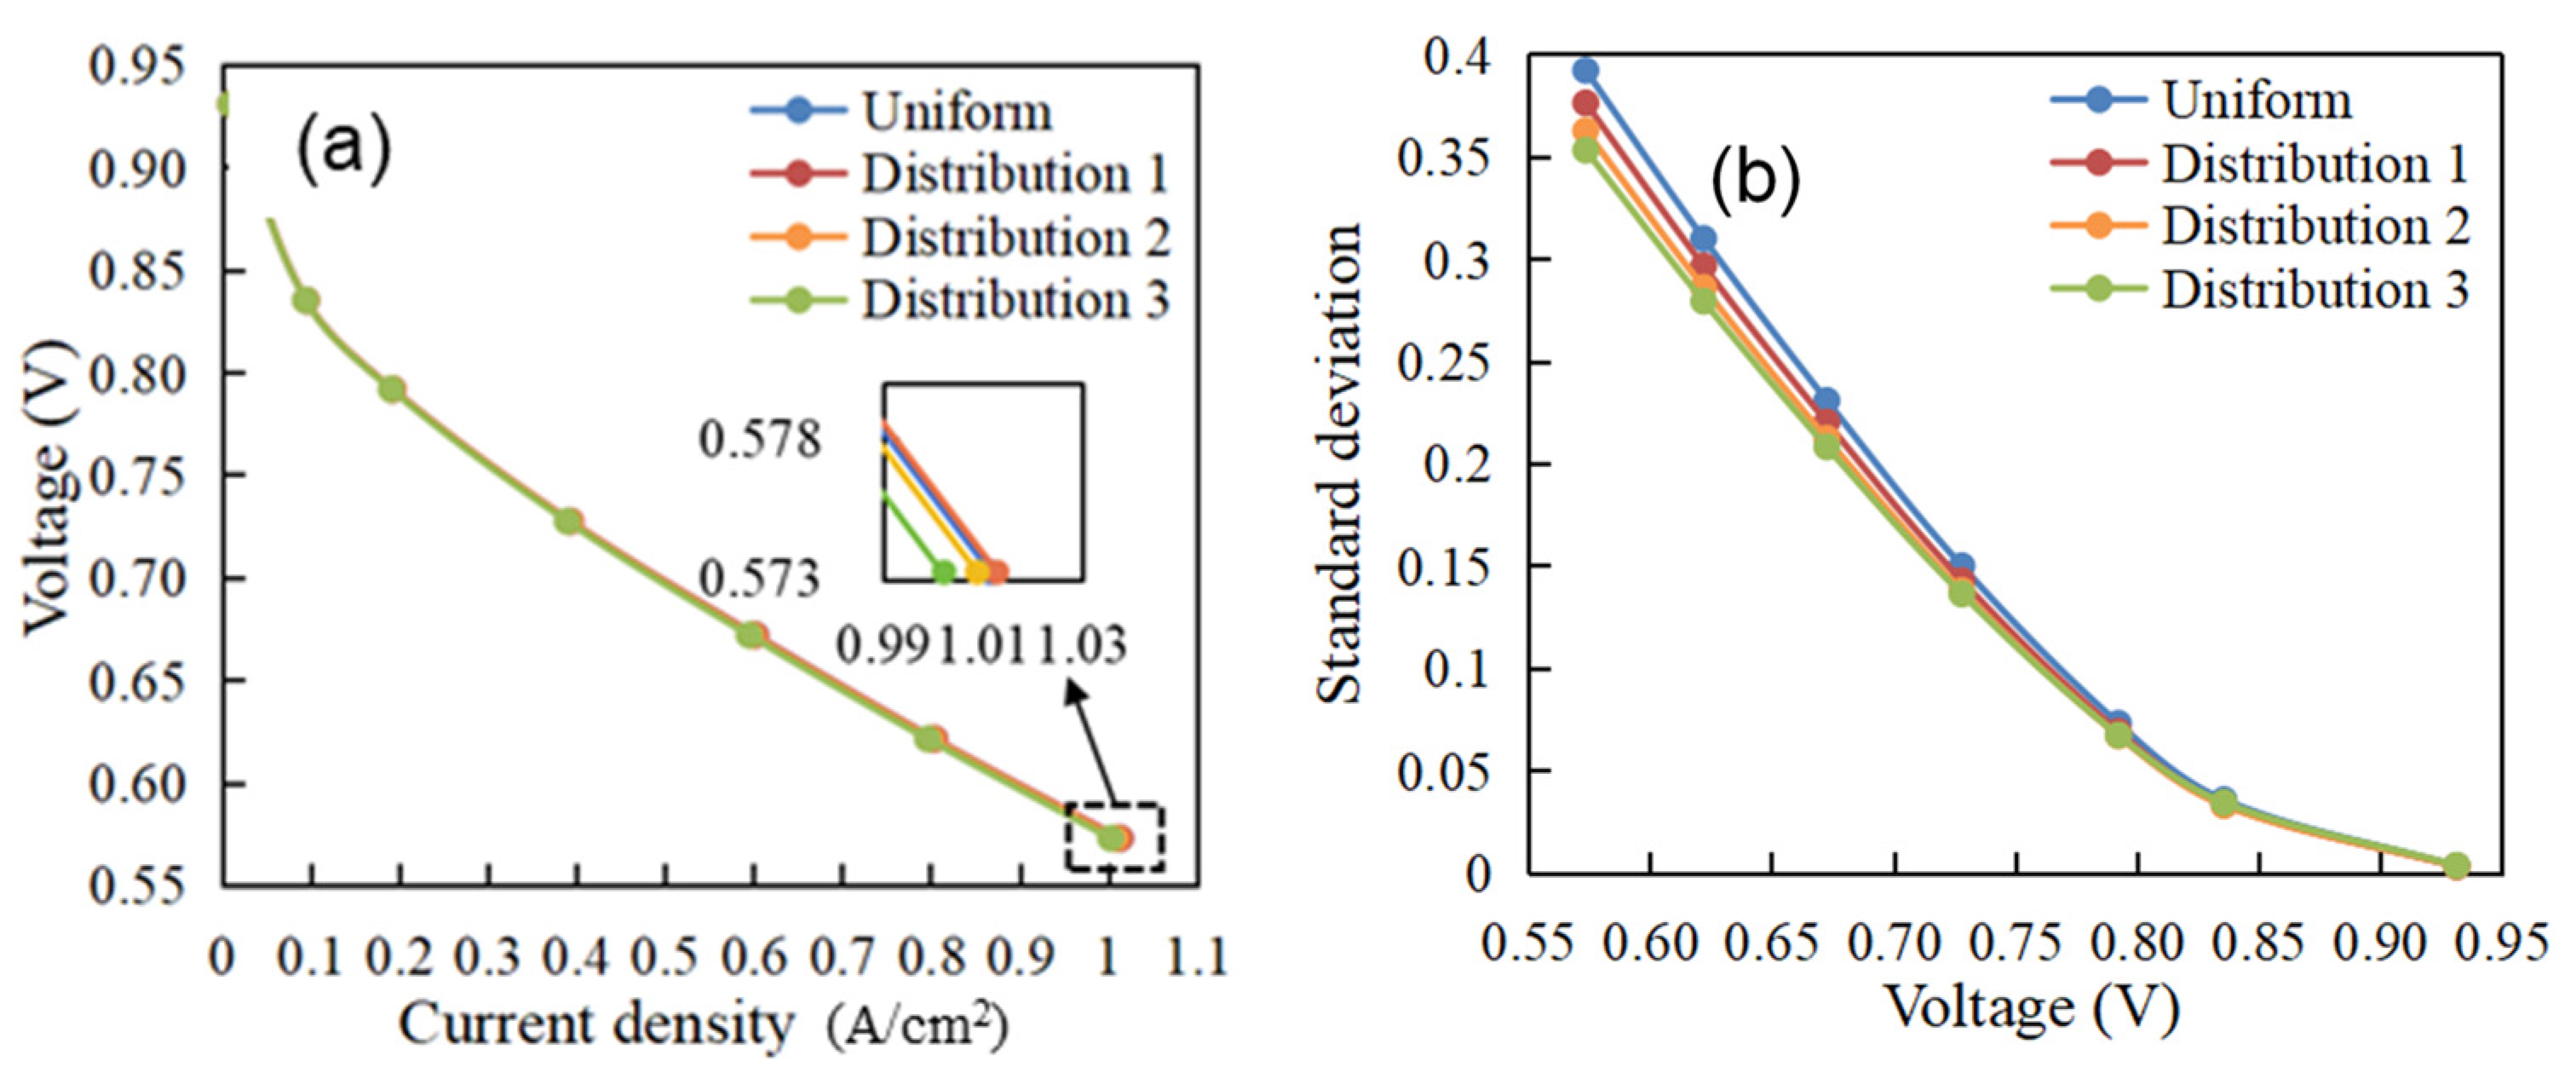
The results are shown in Figure 12. It can be seen that the current density magnitude of Distribution 1 is the highest, followed by the Uniform, and the smallest is Distribution 3. For the current density standard deviation, it is Uniform, Distribution 1, Distribution 2, and Distribution 3 in descending order. The smaller the standard deviation, the higher the current density uniformity. Therefore, Distribution 3 has the most uniform current density. More detailed changes in current density magnitude and uniformity of the three non-uniform catalyst distributions relative to the Uniform are shown in Figure 13. During the operation of PEMFC, the voltage is usually restricted below 0.85 V. Within this range, the current density magnitude of Distribution 1 is the best, which improves by about 0.15% compared to the Uniform at most of the voltage points. Next is Distribution 2, which has a decrease of about −0.3%. Distribution 3 is the worst, with a decrease of about −1% in current density magnitude compared to the Uniform. The electrons produced at CCL can be better conducted to BP as the catalyst loading under the rib increased. However, it will also result in more liquid water accumulating under the ribs, and the reactants’ diffusion resistance from GDL to CCL is increased. Therefore, the current density increases first, and then decreases when the catalyst loading in the flow channel decreases. As for the current density uniformity, Distribution 1 and Distribution 3 improved by about 5% and 9%, respectively, compared to the Uniform at medium- and high-power output points. For low-power output points, the liquid water accumulated under the rib decreased, and the catalyst under the rib can be effectively utilized. The catalyst distributions with excessive reduced catalyst loading under the channel and increased catalyst loading under the rib may lead to higher current density magnitude under the rib than that under the channel, and the current density difference between them increases. Therefore, Distribution 3 has poor improvement on current density uniformity at low-power output points.
In summary, the distributions with reduced catalyst loading under the flow channel and increased catalyst loading under the rib can effectively improve the current density uniformity, yet they may also reduce the current density magnitude. In Figure 13, Distribution 1 has higher current density magnitude and uniformity than Uniform. The current density magnitude of Distribution 2 is lower than that of Uniform, but has better performance in current density uniformity. Therefore, the distributions between Uniform and Distribution 2 are further explored for current density magnitude and uniformity improvement. By solving the value of catalyst loading change rate x, the optimal distributions can be obtained. For the simultaneous improvement of current density magnitude and uniformity, this research narrows the range of x to (−25%, 0%) and discretizes it into 7 points (−5%, −7.5%, −10%, −12.5%, −15%, −17.5%, −20%), which have been named Distribution 1, Distribution 2, Distribution 3, Distribution 4, Distribution 5, Distribution 6, and Distribution 7, respectively.
As shown in Figure 14, compared with Uniform, non-uniform Distributions 1 to 7 can improve both the current density magnitude and uniformity. The improvement effect of Distribution 4 is the most stable overall. Only Distribution 4 has an increase of about 0.05% in current density magnitude when the voltage is around 0.68 V, and the others decrease by about 0.1% to 0.3%. However, the current density uniformity improvement of Distribution 4 is common in these non-uniform distributions. The optimal catalyst loading distribution must be obtained by considering the improvement on both current density magnitude and uniformity. The enhancement effects of the two objectives are normalized, which can be represented by GMag,Distribution_j and GUni,Distribution_j, respectively. Therefore, the weighted objective function GDistribution_j is proposed as follows:
G D i s t r i b u t i o n _ j = W M a g × G M a g , D i s t r i b u t i o n _ j + W U n i × G U n i , D i s t r i b u t i o n _ j , ( j = 1 , 2 , 3 , 7 )
where WMag and WUni represent the weight of current density magnitude and uniformity, respectively; j represents the catalyst loading distribution number; so GMag,Distribution_j and GUni,Distribution_j can be written as follows:
{ G M a g , D i s t r i b u t i o n _ j = H M a g , D i s t r i b u t i o n _ j j = 1 7 H M a g , D i s t r i b u t i o n _ j H M a g , D i s t r i b u t i o n _ j = i = 1 6 H M a g , V o l _ i , D i s t r i b u t i o n _ j 6 G U n i , D i s t r i b u t i o n _ j = H U n i , D i s t r i b u t i o n _ j j = 1 7 H U n i , D i s t r i b u t i o n _ j H U n i , D i s t r i b u t i o n _ j = i = 1 6 H U n i , V o l _ i , D i s t r i b u t i o n _ j 6
where i represents the voltage point number; HMag,Distribution_j and HUni,Distribution_j represent the average improvements of magnitude and uniformity at all voltage points, respectively; and HMag,Vol_i,Distribution_j and HUni,Vol_i,Distribution_j represent the improvements of magnitude and uniformity at every voltage point, respectively.
Since the current density magnitude and uniformity are both important for PEMFC, the values of WMag and WUni are set to 0.5 in this research. The weighted objective function values of Distributions 1 to 7 are shown in Figure 15. It can be seen that Distribution 5 with a maximum value of 17.24% has the best performance, followed by Distribution 4, and Distribution 2 is the worst. Therefore, Distribution 5 is considered as the optimal catalyst loading distribution.

4. Conclusions

PEMFC performance and internal states under clamping pressure were studied with a 3D numerical model. The non-uniform design of catalyst loading was subsequently optimized to improve the magnitude and uniformity of current density. The results showed that:
  • The GDL deformation is mainly caused by the clamping force from the rib, and the GDL deformation magnitude under the rib is much greater than that under the flow channel. Along the direction from BP to CL, the GDL deformation gradually decreases. Furthermore, the CL and PEM deformations are relatively smaller than GDL deformations.
  • The power output improved with increased clamping pressure. However, the distribution uniformities of reactants’ concentration, liquid water, heat, and current density deteriorated as the clamping pressure increased.
  • Compared with uniform distribution under the premise of constant total cathode catalyst loading, the non-uniform distributions with reduced catalyst loading under the channel, along with increased catalyst loading under the rib, effectively improved the current density uniformity. A weighted objective function was constructed to evaluate the performance of different catalyst loading distributions. Compared with the uniform distribution, the optimal catalyst loadings under the channel and rib showed a change of −15% and 15%, respectively. The objective function of the above optimal distribution had a maximum value of 17.24%.

Author Contributions

Conceptualization, Q.Y.; methodology, Q.Y.; software, Q.Y. and X.W.; validation, G.X.; investigation, X.W.; data curation, X.W.; writing—original draft preparation, Q.Y. and X.W.; writing—review and editing, G.X.; visualization, G.X.; funding acquisition, G.X. All authors have read and agreed to the published version of the manuscript.

Funding

This research was funded by the National Natural Science Foundation of China (No. 52075159), the Natural Science Foundation of Jiangxi Province (No. 20224ACB218002), the High Level and High Skill Leading Talent Training Project of Jiangxi Province, and the Open Foundation of State Key Laboratory of Featured Metal Materials and Life-cycle Safety for Composite Structures, Guangxi University (No. 2022GXYSOF24).

Data Availability Statement

The original contributions presented in the study are included in the article, further inquiries can be directed to the corresponding author.

Conflicts of Interest

Author Gang Xiao was employed by the company Jiangxi Copper Technology Research Institute Co., Ltd. The remaining authors declare that the research was conducted in the absence of any commercial or financial relationships that could be construed as a potential conflict of interest.

References

  1. Yang, Q.; Zhang, Z.; Xiao, G.; Xue, D. Hydrophobicity gradient optimization of fuel cell gas diffusion media for its application in vehicles. Fundam. Res. 2024, 4, 1036–1046. [Google Scholar] [CrossRef]
  2. Xiong, Z.; Meng, K.; Chen, K.; Chen, W.; Deng, Q.; Luo, Z.; He, D.; Zou, G.; Chen, B. Investigation of transport properties of gas diffusion layer of PEMFC with metallic bipolar plates based on mechanical compression. Int. J. Heat Mass Transf. 2024, 232, 125922. [Google Scholar] [CrossRef]
  3. Zhang, H.; Rahman, M.A.; Mojica, F.; Sui, P.C.; Chuang, P.Y.A. A comprehensive two-phase proton exchange membrane fuel cell model coupled with anisotropic properties and mechanical deformation of the gas diffusion layer. Electrochim. Acta 2021, 382, 138273. [Google Scholar] [CrossRef]
  4. Shi, Q.; Feng, C.; Ming, P.; Tang, F.; Zhang, C. Compressive stress and its impact on the gas diffusion layer: A review. Int. J. Hydrogen Energy 2022, 47, 3994–4009. [Google Scholar] [CrossRef]
  5. Li, W.Z.; Yang, W.W.; Zhang, W.Y.; Qu, Z.G.; He, Y.L. Three-dimensional modeling of a PEMFC with serpentine flow field incorporating the impacts of electrode inhomogeneous compression deformation. Int. J. Hydrogen Energy 2019, 44, 22194–22209. [Google Scholar] [CrossRef]
  6. Xiao, L.; Zhu, L.; Clökler, C.; Grünzweig, A.; Wilhelm, F.; Scholta, J.; Zeis, R.; Shen, Z.G.; Luo, M.; Sui, P.C. Experimental validation of pore-scale models for gas diffusion layers. J. Power Sources 2022, 536, 231515. [Google Scholar] [CrossRef]
  7. Zhang, Z.; He, P.; Dai, Y.J.; Jin, P.H.; Tao, W.Q. Study of the mechanical behavior of paper-type GDL in PEMFC based on microstructure morphology. Int. J. Hydrogen Energy 2020, 45, 29379–29394. [Google Scholar] [CrossRef]
  8. Aldakheel, F.; Ismail, M.S.; Hughes, K.J.; Ingham, D.B.; Ma, L.; Pourkashanian, M.; Cumming, D.; Smith, R. Gas permeability, wettability and morphology of gas diffusion layers before and after performing a realistic ex-situ compression test. Renew. Energy 2020, 151, 1082–1091. [Google Scholar] [CrossRef]
  9. Zhang, H.; Hu, H.; Shao, X.; Zhan, Z.; Chen, B. A comparative numerical investigation of effect of mechanical compression on the transport properties of gas diffusion layer fabricated by wet and dry laid methods. Int. J. Heat Mass Transf. 2024, 234, 126064. [Google Scholar] [CrossRef]
  10. Chen, G.; Xu, Q.; Xuan, J.; Liu, J.; Fu, Q.; Shi, W.; Su, H.; Xing, L. Numerical study of inhomogeneous deformation of gas diffusion layers on proton exchange membrane fuel cells performance. J. Energy Storage 2021, 44, 103486. [Google Scholar] [CrossRef]
  11. Jing, G.; Hu, C.; Qin, Y.; Sun, X.; Ma, T. Complex mechanisms of PEMFC performance variations influenced by both structural deformation and contact resistance under the clamping force. Int. J. Hydrogen Energy 2024, 58, 137–148. [Google Scholar] [CrossRef]
  12. Movahedi, M.; Ramiar, A.; Ranjber, A.A. 3D numerical investigation of clamping pressure effect on the performance of proton exchange membrane fuel cell with interdigitated flow field. Energy 2018, 142, 617–632. [Google Scholar] [CrossRef]
  13. Liu, Y.; Kohrn, M.; Wick, M.; Pischinger, S. Optimization of the bipolar plate rib structure in proton exchange membrane fuel cells with an analytical method. Int. J. Hydrogen Energy 2022, 47, 17683–17698. [Google Scholar] [CrossRef]
  14. Zhang, H.; Xiao, L.; Chuang, P.Y.A.; Djilali, N.; Sui, P.C. Coupled stress–strain and transport in proton exchange membrane fuel cell with metallic bipolar plates. Appl. Energy 2019, 251, 113316. [Google Scholar] [CrossRef]
  15. Zheng, M.; Liang, H.; Bu, W.; Qu, C.; Hu, X.; Zhang, Z. Porosity and permeability optimization of PEMFC cathode gas diffusion layer based on topology algorithm. Int. J. Electrochem. Sci. 2024, 19, 100803. [Google Scholar] [CrossRef]
  16. Yu, R.; Guo, H.; Chen, H.; Ye, F. Segmented distribution of gas diffusion layer porosity and catalyst layer ionomer content in a polymer electrolyte membrane fuel cell. Chem. Eng. Res. Des. 2024, 209, 412–424. [Google Scholar] [CrossRef]
  17. Yu, R.J.; Guo, H.; Chen, H.; Ye, F. Heat and mass transfer at the interface between cathode catalyst layer and gas diffusion layer of a proton exchange membrane fuel cell. Int. Commun. Heat Mass Transf. 2023, 140, 106548. [Google Scholar] [CrossRef]
  18. Huang, X.; He, Y.; Sun, Y.; Sun, L.; Wang, T.; Zhang, X. Gradient ionomer designed cathode catalyst layer for proton exchange membrane fuel cells with enhanced performance. J. Power Sources 2024, 603, 234488. [Google Scholar] [CrossRef]
  19. Li, G.; Deng, C.; Ji, F.; Zheng, B.; Wang, X.; Wang, T. Balancing proton and mass transfers in cathode catalyst layer of high-temperature proton exchange membrane fuel cell via gradient porous structure design. J. Power Sources 2024, 593, 233807. [Google Scholar] [CrossRef]
  20. Shin, J.; Son, M.; Kim, S.I.; Song, S.A.; Lee, D.H. Design of multi-layered gradient catalysts for efficient proton exchange membrane fuel cells. J. Power Sources 2023, 582, 233546. [Google Scholar] [CrossRef]
  21. Yang, L.; Fu, K.; Jin, X.; Wang, S.; Gan, Q.; Zhang, Q.; Li, P.; Cao, C. Catalyst layer design with inhomogeneous distribution of platinum and ionomer optimal for proton exchange membrane fuel cell cold start. Chem. Eng. Sci. 2022, 263, 118132. [Google Scholar] [CrossRef]
  22. Sassin, M.B.; Garsany, Y.; Atkinson Iii, R.W.; Hjelm, R.M.E.; Swider-Lyons, K.E. Understanding the interplay between cathode catalyst layer porosity and thickness on transport limitations en route to high-performance PEMFCs. Int. J. Hydrogen Energy 2019, 44, 16944–16955. [Google Scholar] [CrossRef]
  23. Ansys Fluent Theory Guide. 2024. Available online: https://ansyshelp.ansys.com/Views/Secured/corp/v241/en/pdf/Ansys_Fluent_Theory_Guide.pdf (accessed on 15 August 2024).
  24. Giuseppe, C.; Stefano, F.; Alessandro, D. Methodology for PEMFC CFD Simulation Including the Effect of Porous Parts Compression. Int. J. Hydrogen Energy 2022, 47, 14658–14673. [Google Scholar]
  25. Zhou, Y.; Jiao, K.; Du, Q.; Yin, Y.; Li, X. Gas diffusion layer deformation and its effect on the transport characteristics and performance of proton exchange membrane fuel cell. Int. J. Hydrogen Energy 2013, 38, 12891–12903. [Google Scholar] [CrossRef]
  26. Li, S.; Sundén, B. Effects of gas diffusion layer deformation on the transport phenomena and performance of PEM fuel cells with interdigitated flow fields. Int. J. Hydrogen Energy 2018, 43, 16279–16292. [Google Scholar] [CrossRef]
  27. Yablecki, J.; Bazylak, A. Determining the effective thermal conductivity of compressed PEMFC GDLs through thermal resistance modelling. J. Power Sources 2012, 217, 470–478. [Google Scholar] [CrossRef]
  28. Fan, R.; Chang, G.; Xu, Y.; Xu, J. Investigating and quantifying the effects of catalyst layer gradients, operating conditions, and their interactions on PEMFC performance through global sensitivity analysis. Energy 2024, 290, 130128. [Google Scholar] [CrossRef]
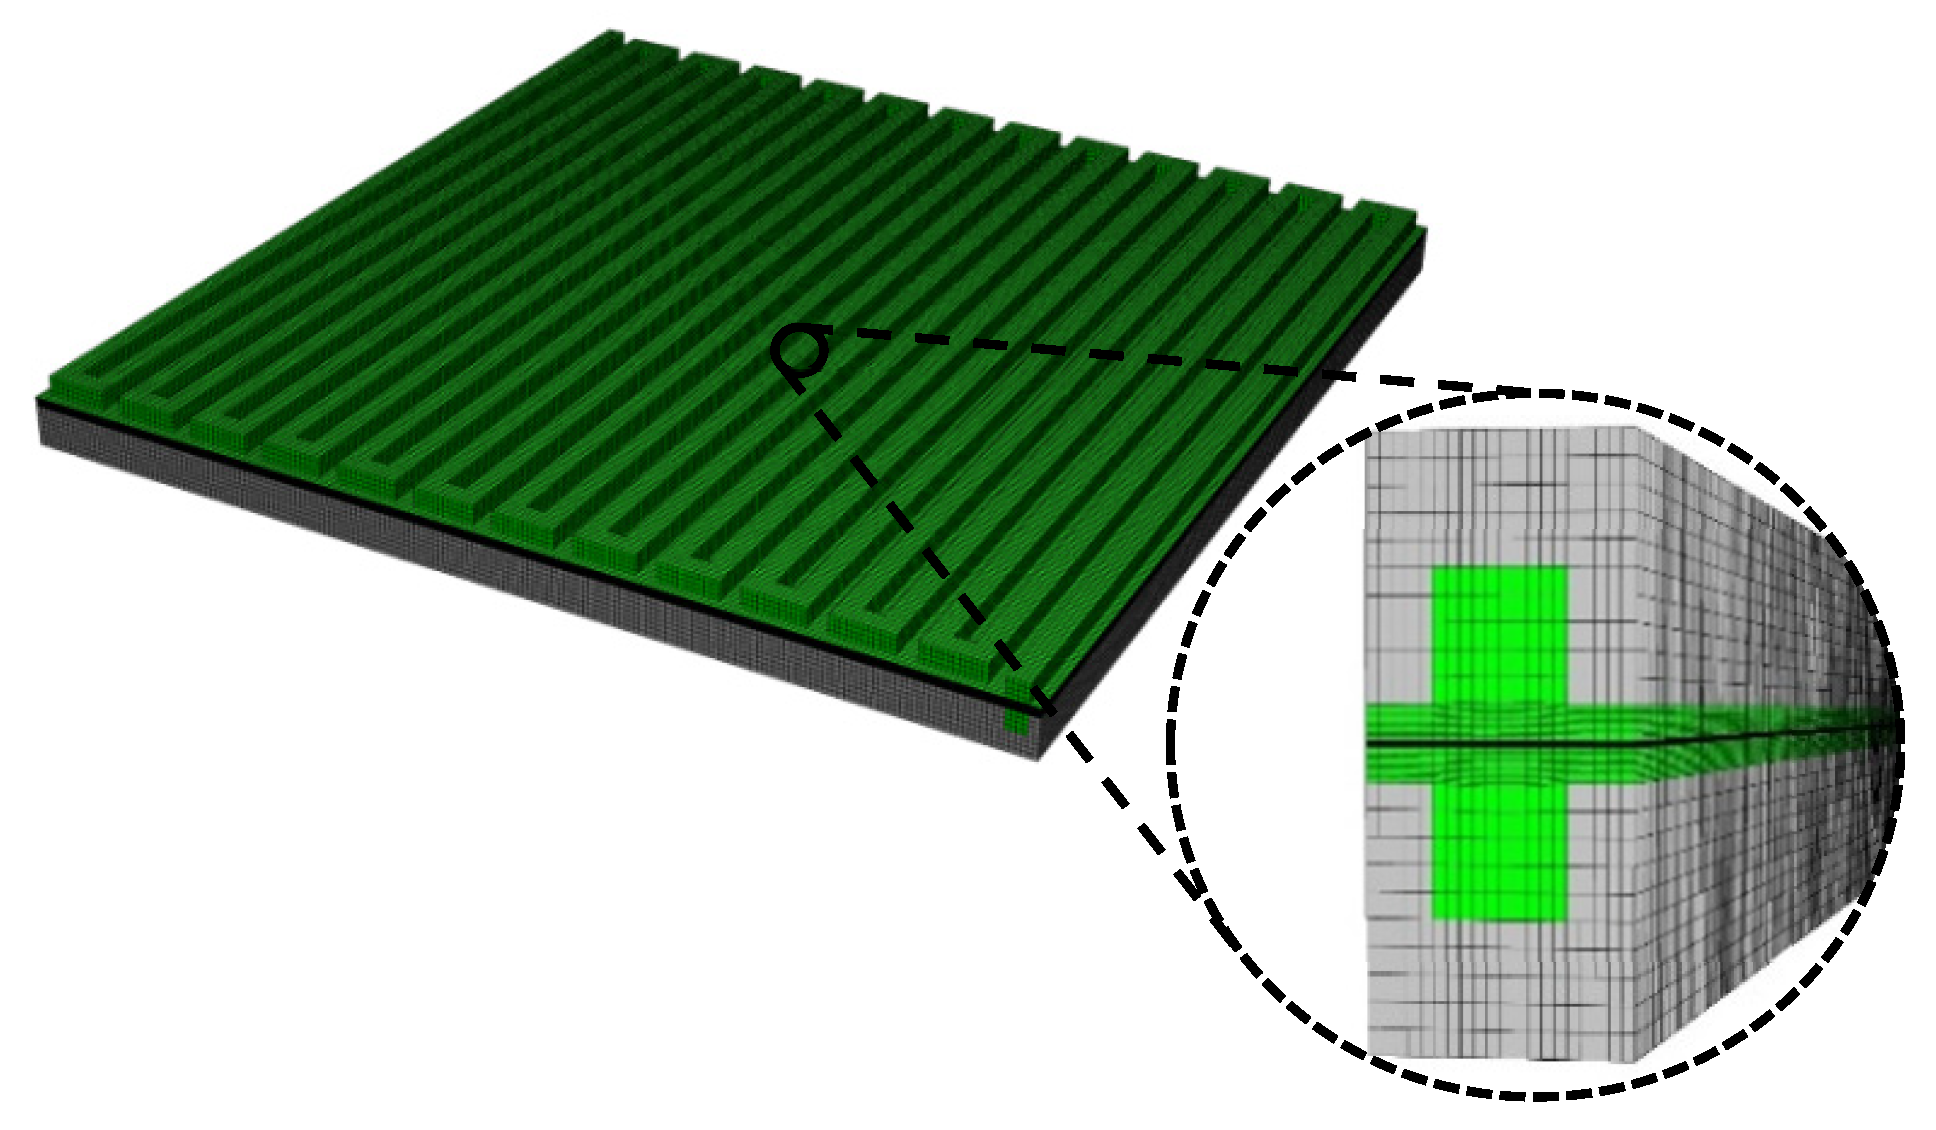
Figure 1. PEMFC mesh and computation domain.
Energies 17 05223 g001
Figure 2. URES at 1 MPa (unit: mm).
Energies 17 05223 g002
Figure 3. Simulation flowchart.
Energies 17 05223 g003
Figure 4. Polarization curve with a clamping pressure of 1 MPa.
Energies 17 05223 g004
Figure 5. GDL deformation near BP and CL: (a) 0.5 MPa; (b) 1 MPa; (c) 1.5 MPa.
Energies 17 05223 g005
Figure 6. The position of three planes along the Z-axis.
Energies 17 05223 g006
Figure 7. Distribution of current density along the Y-axis: (a) Z = 0.075 m; (b) Z = 0.1 m; (c) Z = 0.125 m.
Energies 17 05223 g007
Figure 8. Distribution of temperature along the Y-axis: (a) Z = 0.075 m; (b) Z = 0.1 m; (c) Z = 0.125 m.
Energies 17 05223 g008
Figure 9. Liquid water content in GDL (Z = 0.1 m): (a) 0.5 MPa; (b) 1 MPa; (c) 1.5 MPa.
Energies 17 05223 g009
Figure 10. Oxygen mass fraction in CL: (a) Z = 0.075 m; (b) Z = 0.1 m; (c) Z = 0.125 m.
Energies 17 05223 g010
Figure 11. Cathode catalyst distribution under channel and rib.
Energies 17 05223 g011
Figure 12. Performance of PEMFC: (a) polarization curve; (b) standard deviation of current density.
Energies 17 05223 g012
Figure 13. Performance improvement (x ∈ [−37.5%, 0%]): (a) current density; (b) current density uniformity.
Energies 17 05223 g013
Figure 14. Performance improvement (x ∈ (−25%, 0%)): (a) current density; (b) current density uniformity.
Energies 17 05223 g014
Figure 15. The weighted objective function values of Distributions 1 to 7.
Energies 17 05223 g015
Table 1. Geometric parameters of the PEMFC model.
NameValueUnit
Channel width0.001m
Channel height0.001m
Rib width0.001m
GDL thickness0.0003m
CL thickness0.00001m
PEM Thickness0.00003m
GDL porosity0.6-
CL porosity0.2-
Reaction area0.0002m2
Table 2. Physical parameters of components [14].
Physical ParametersBPGDLPEMCL
Young’s modulus (MPa)197,0006.1232249
Poisson’s ratio0.30.10.2530.3
Initial porosity00.6-0.2
Density (kg/m3)780044019802059
Specific heat capacity (J/kg K)15805688333300
Thermal conductivity (W/m K)201.00.951.0
Conductivity coefficient (S/m)20,000300-300
Table 3. Test operating condition.
Current (A)Stoichiometry for AnodeStoichiometry for CathodeGas Outlet Pressure (KPa)Gas Relative HumidityGas Inlet Temperature (°C)
014.3412.0360100%80
543.0236.1160100%80
1021.5118.0560100%80
1514.3412.0360100%80
2010.759.0360100%80
22.59.568.0260100%80
258.67.2260100%80
27.57.826.5660100%80
307.176.0260100%80
356.155.1660100%80
405.384.5160100%80
454.784.0160100%80
504.33.6160100%80
Disclaimer/Publisher’s Note: The statements, opinions and data contained in all publications are solely those of the individual author(s) and contributor(s) and not of MDPI and/or the editor(s). MDPI and/or the editor(s) disclaim responsibility for any injury to people or property resulting from any ideas, methods, instructions or products referred to in the content.