
Envelope Deficiencies and Thermo-Hygrometric Challenges in Warehouse-Type Buildings in Subtropical Climates: A Case Study of a Nori Distribution Center


Abstract
1. Introduction
2. Materials and Methods
2.1. Study Case
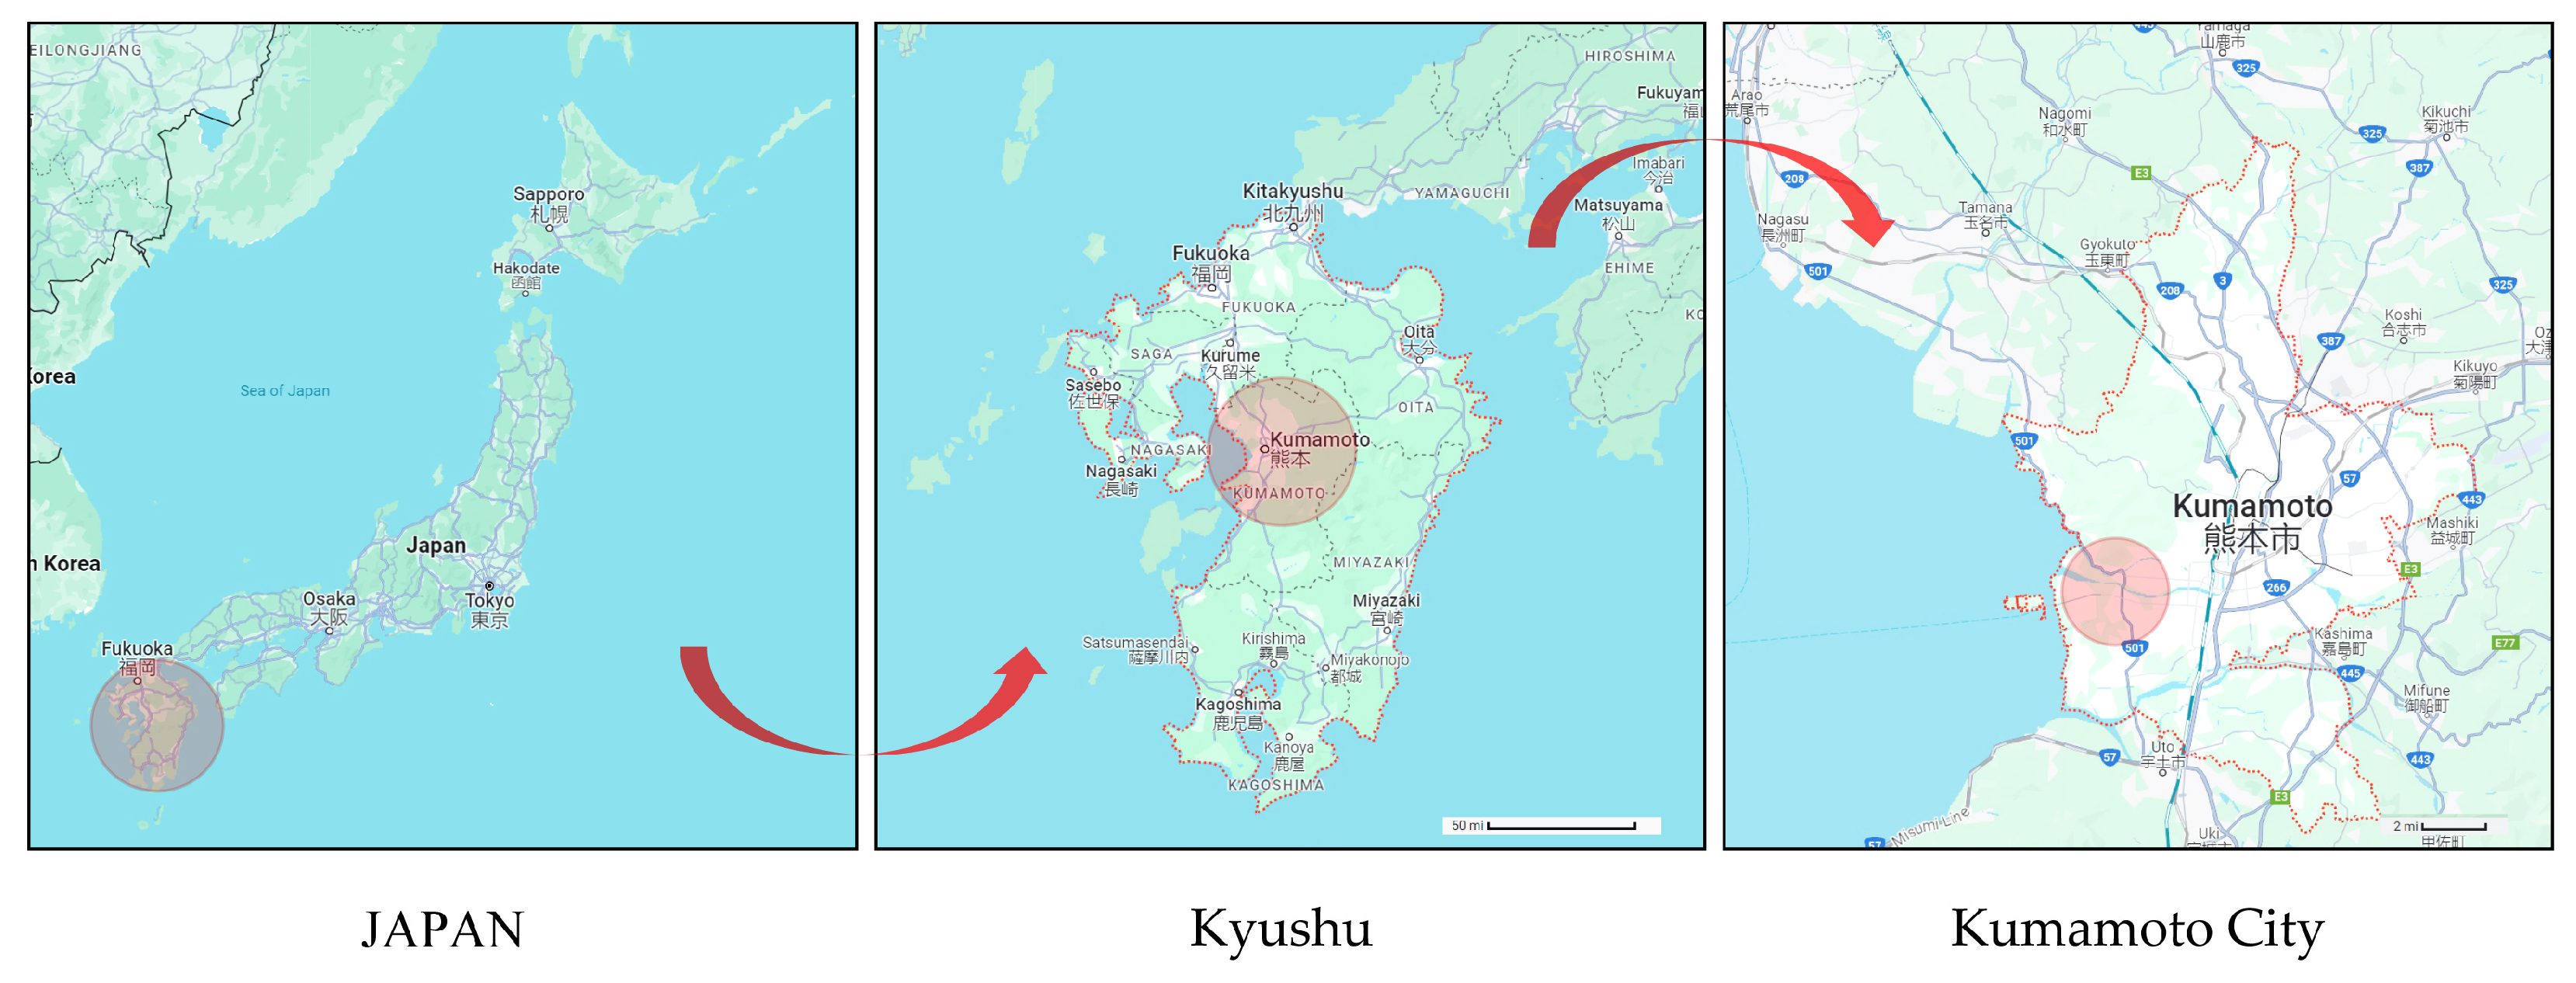
2.2. Study Area and Climate Condition
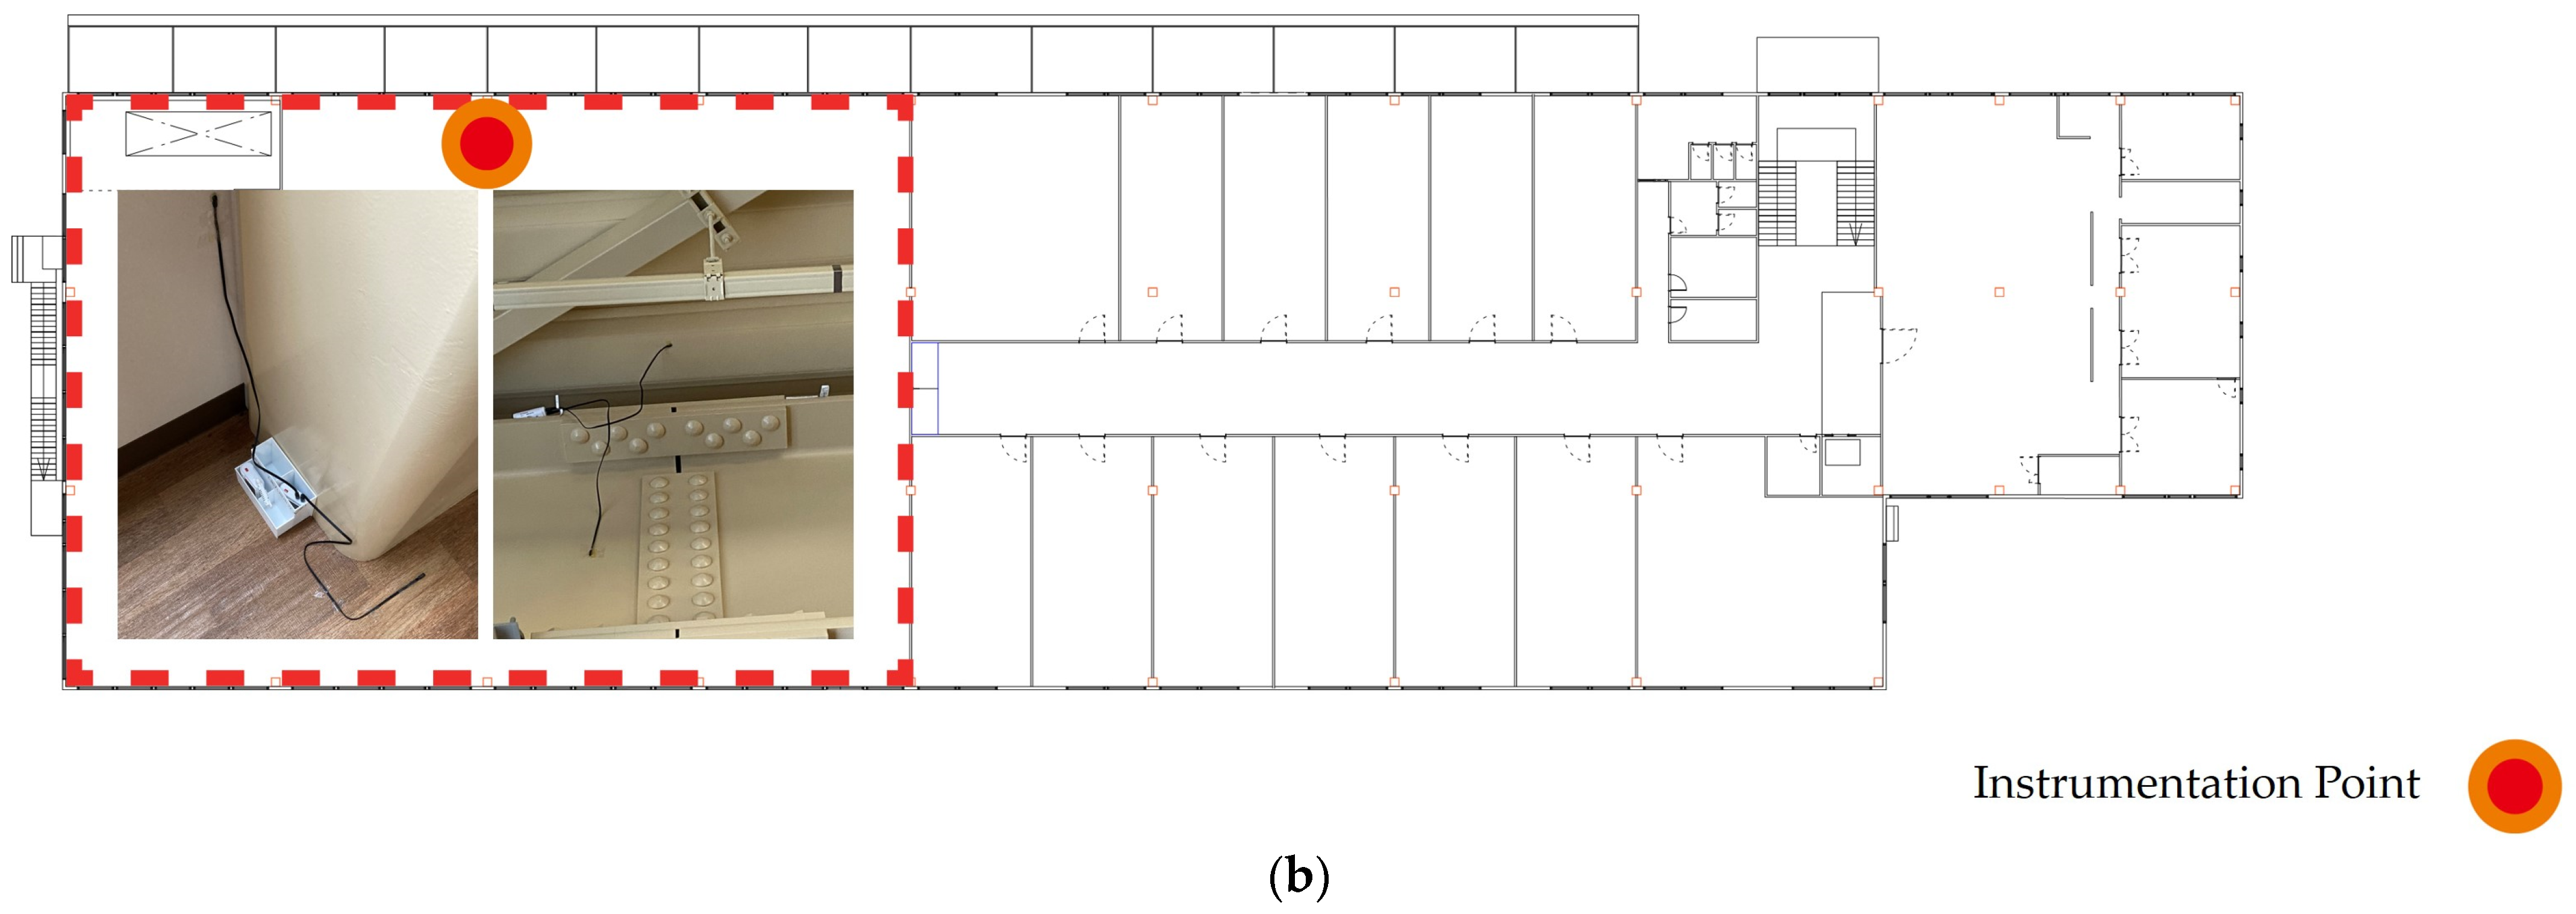
2.3. Data Collection
2.4. Data Processing and Analysis
2.4.1. Calculation Methodology for Air Dew Point Temperature and Humidity Variables
2.4.2. Assessment of Hygrothermal Stability Using Monthly Average Diurnal Range
2.4.3. Analysis of Condensation Risk via Vapor Pressure Ratios
- Category I, where ratios between 95% and 100% indicate a high likelihood of condensation;
- Category II, with ratios up to 95% suggesting potential condensation;
- Category III, ratios from 85% to 90% denoting probable condensation in the event of significant environmental changes;
- Category IV, where ratios at or below 85% present a low risk of condensation.
3. Results and Discussion
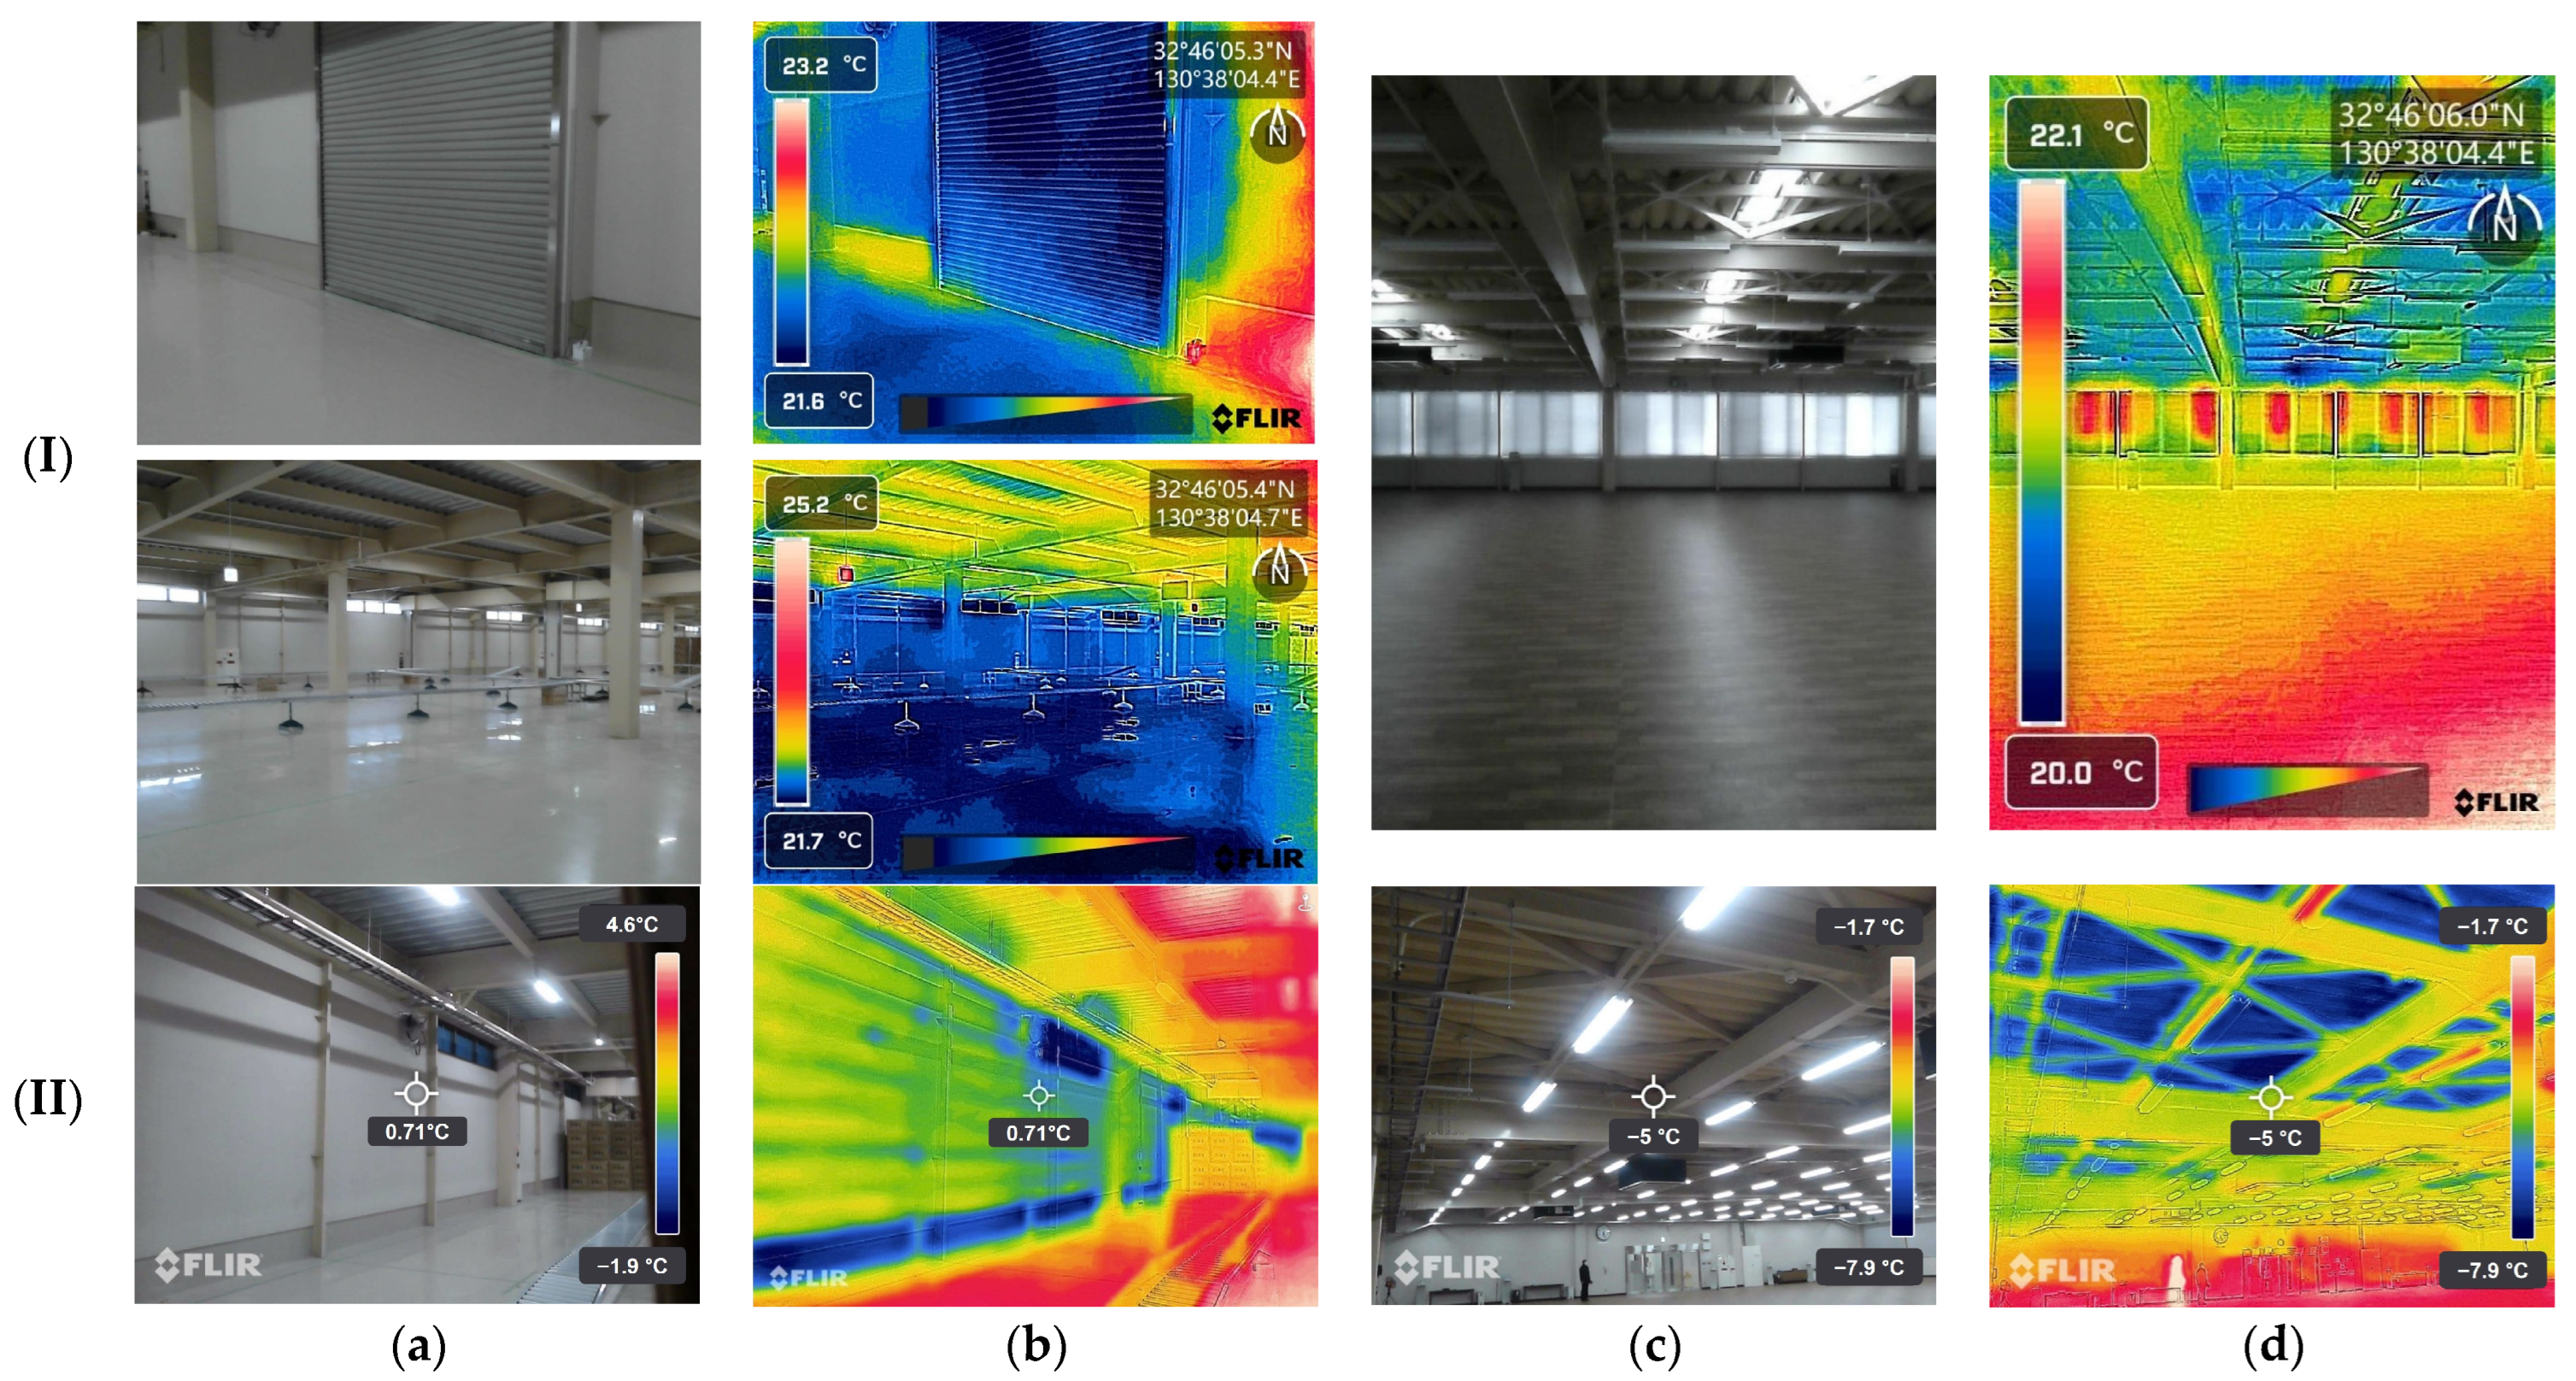
3.1. Qualitative Analysis
3.2. Indoor and Outdoor Air Temperature and Humidity
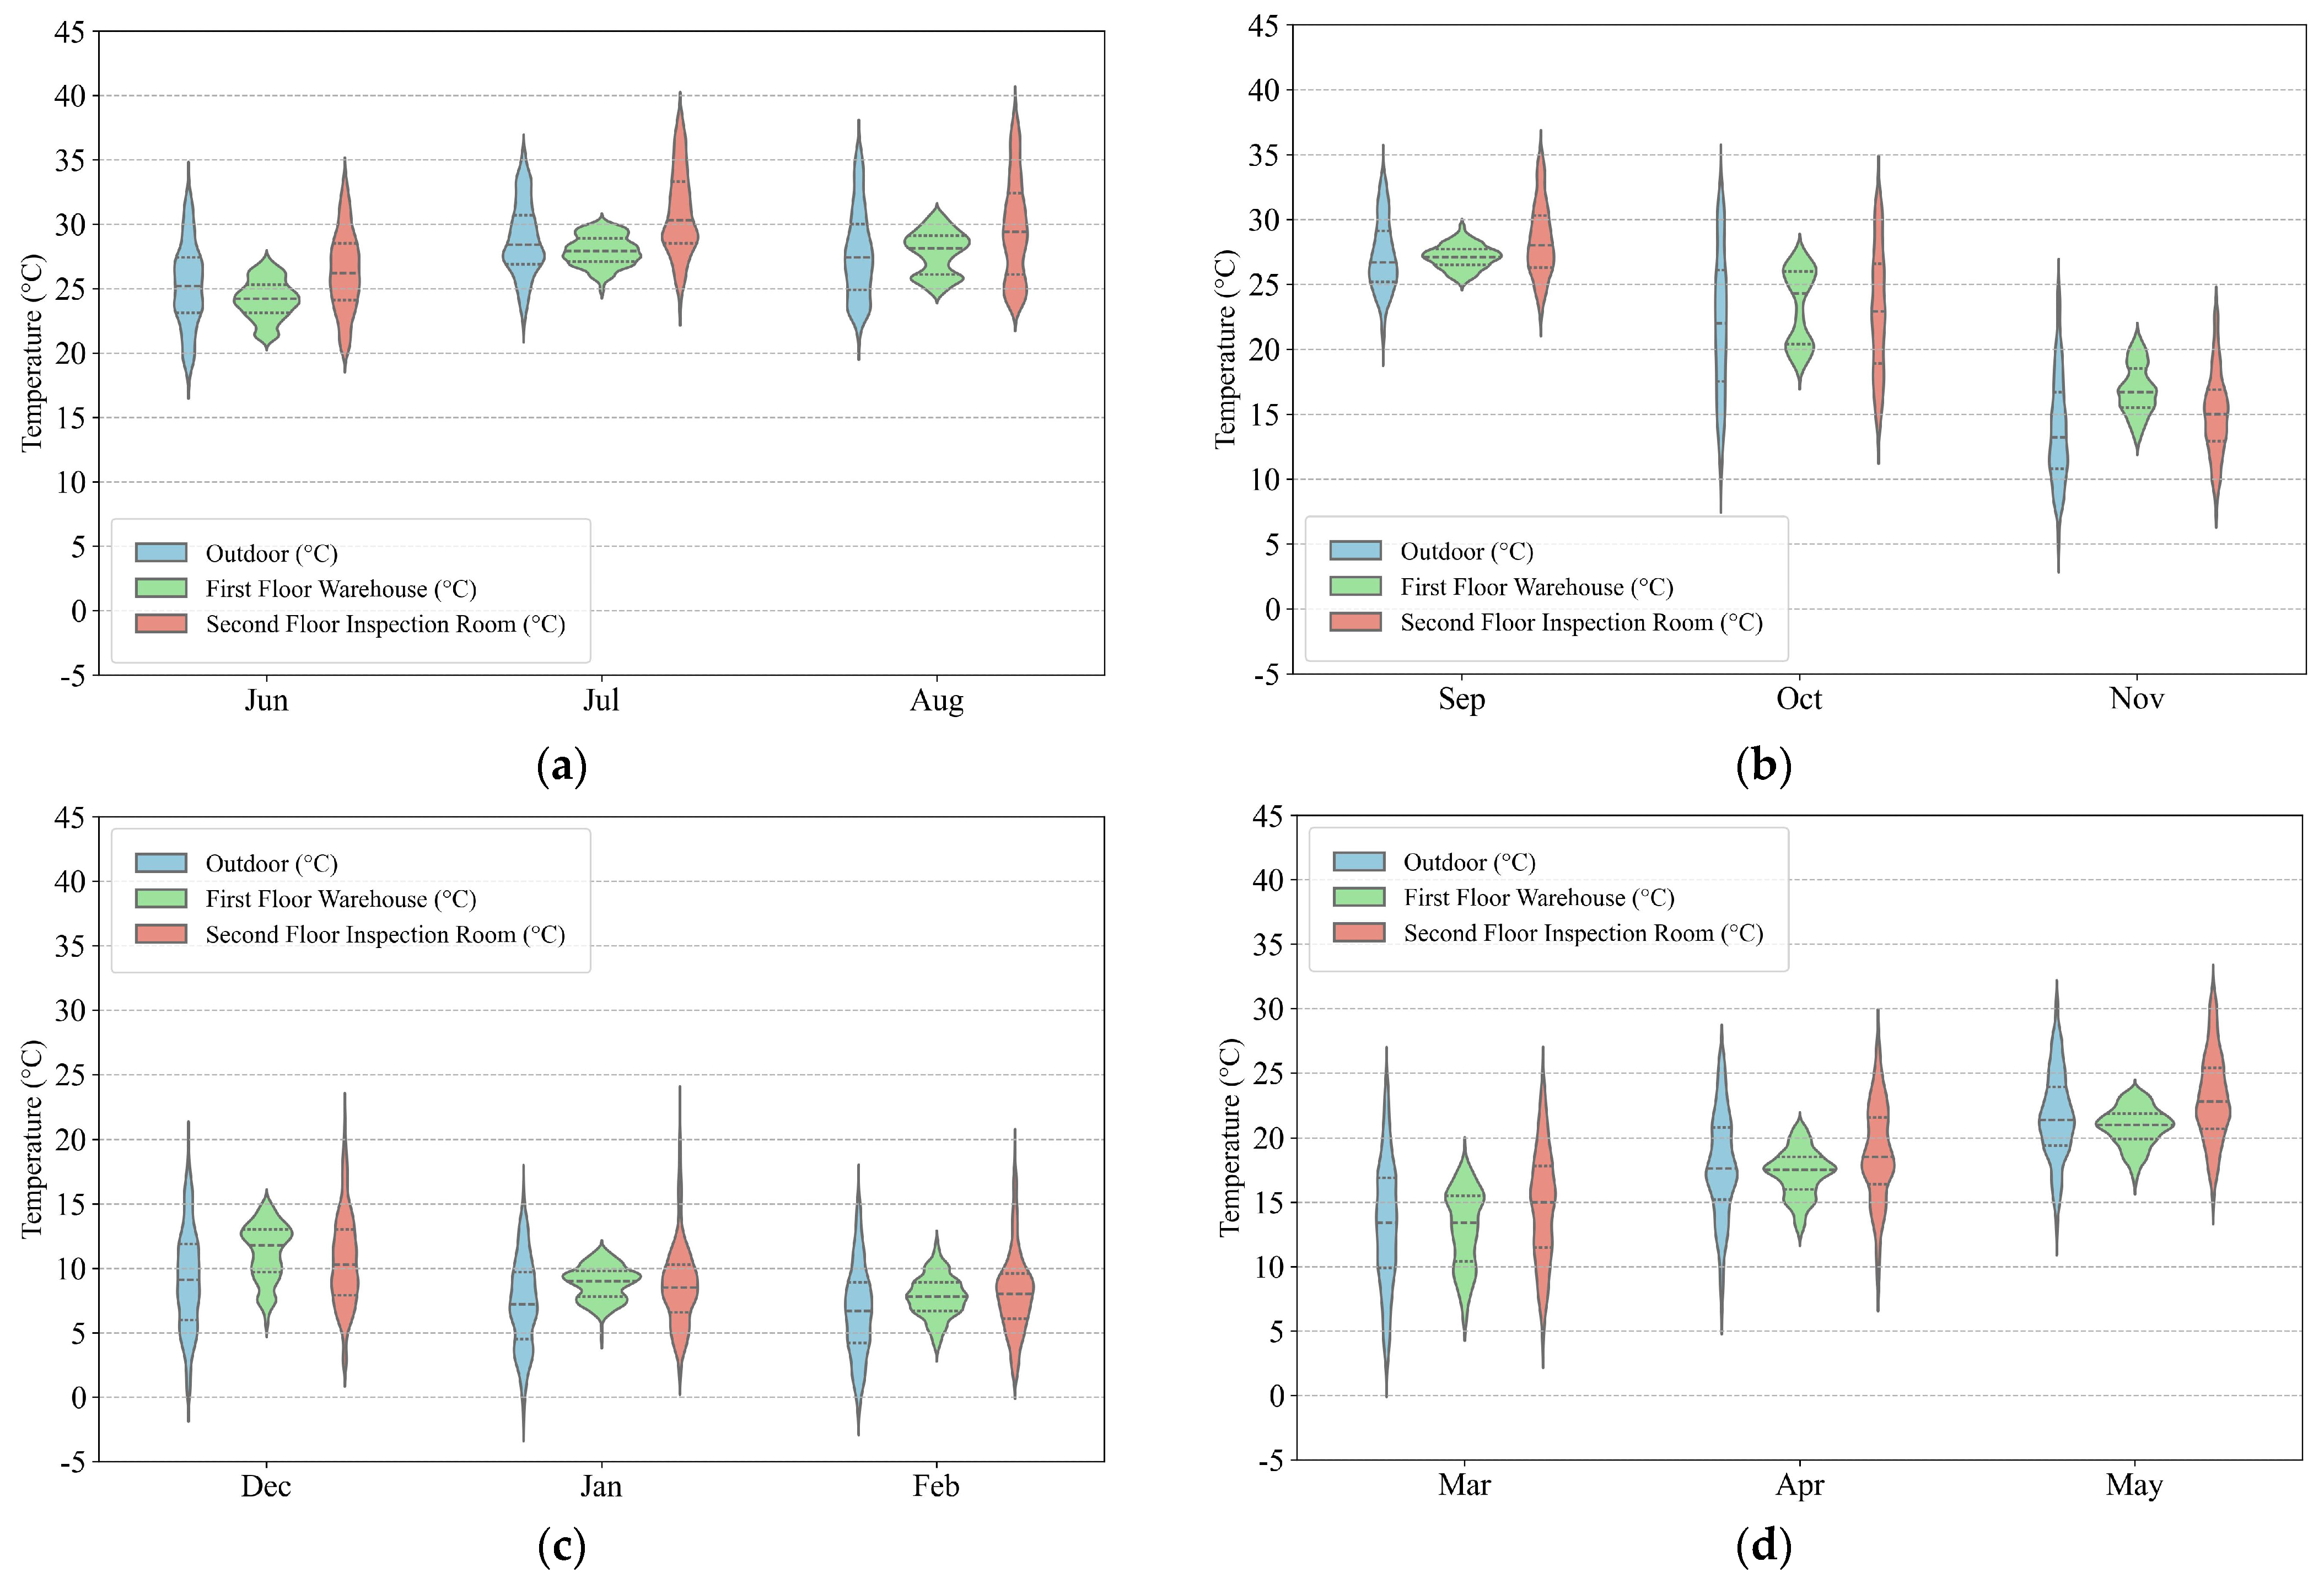
3.2.1. Air Temperature
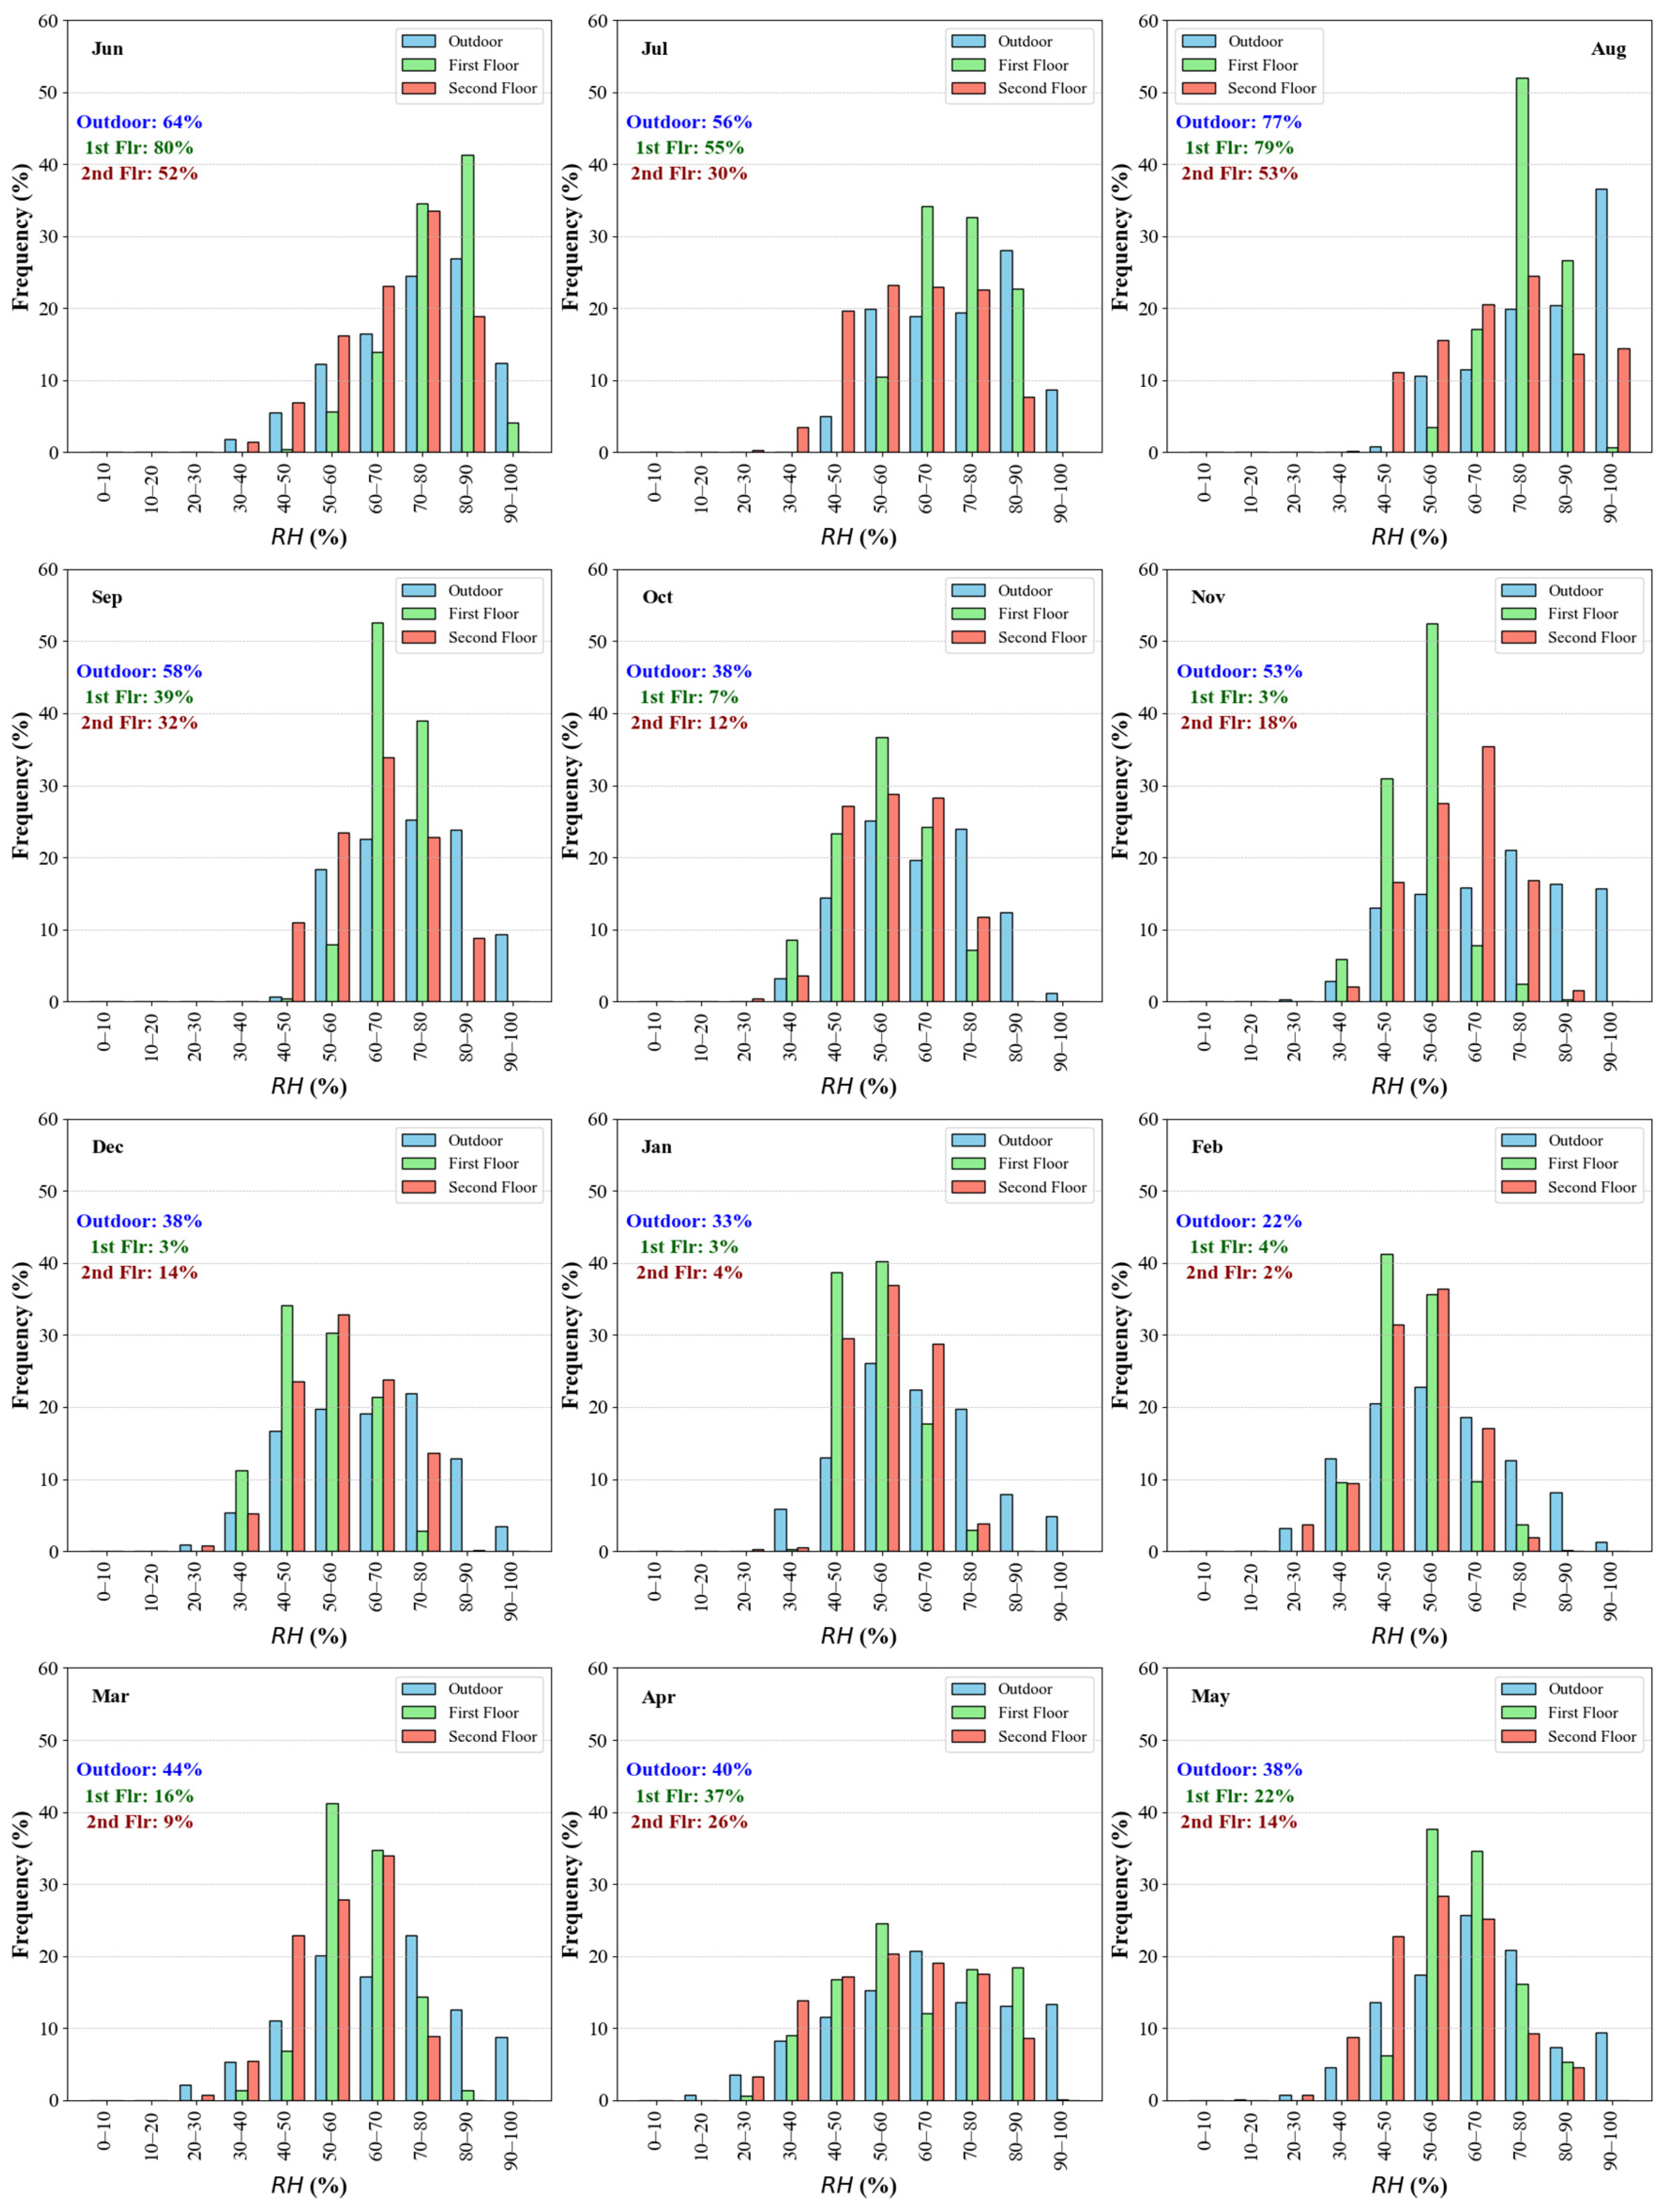
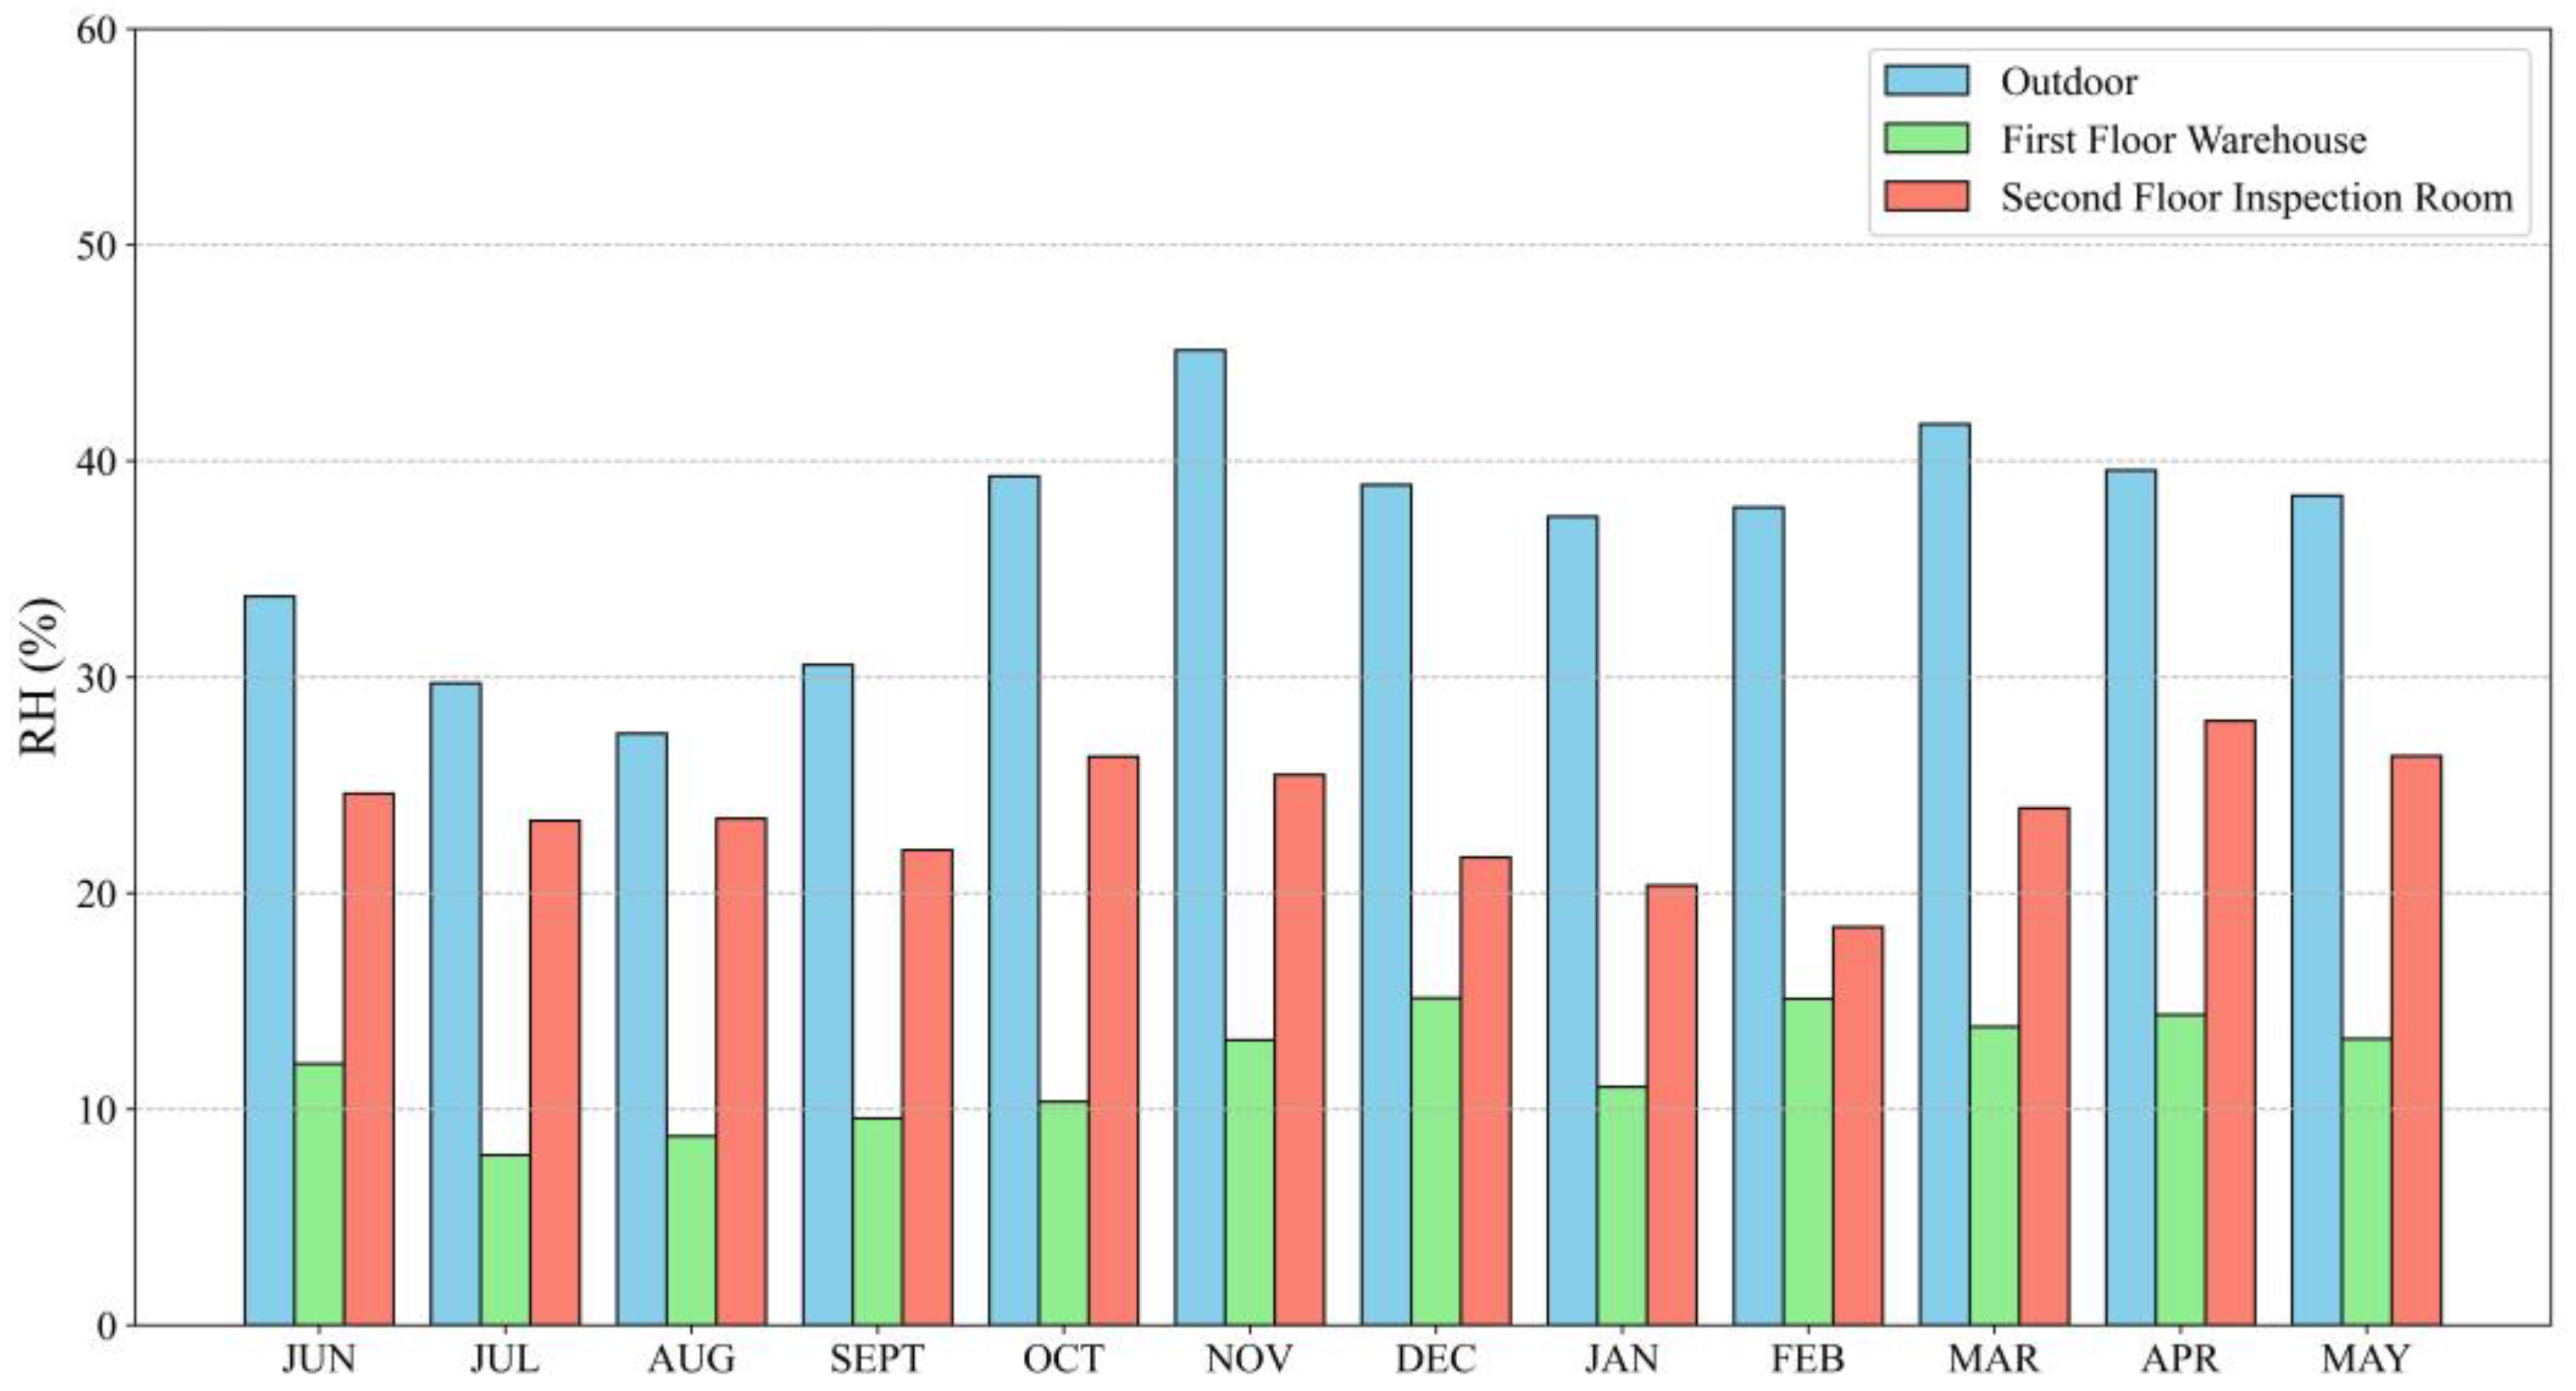
3.2.2. Relative Humidity
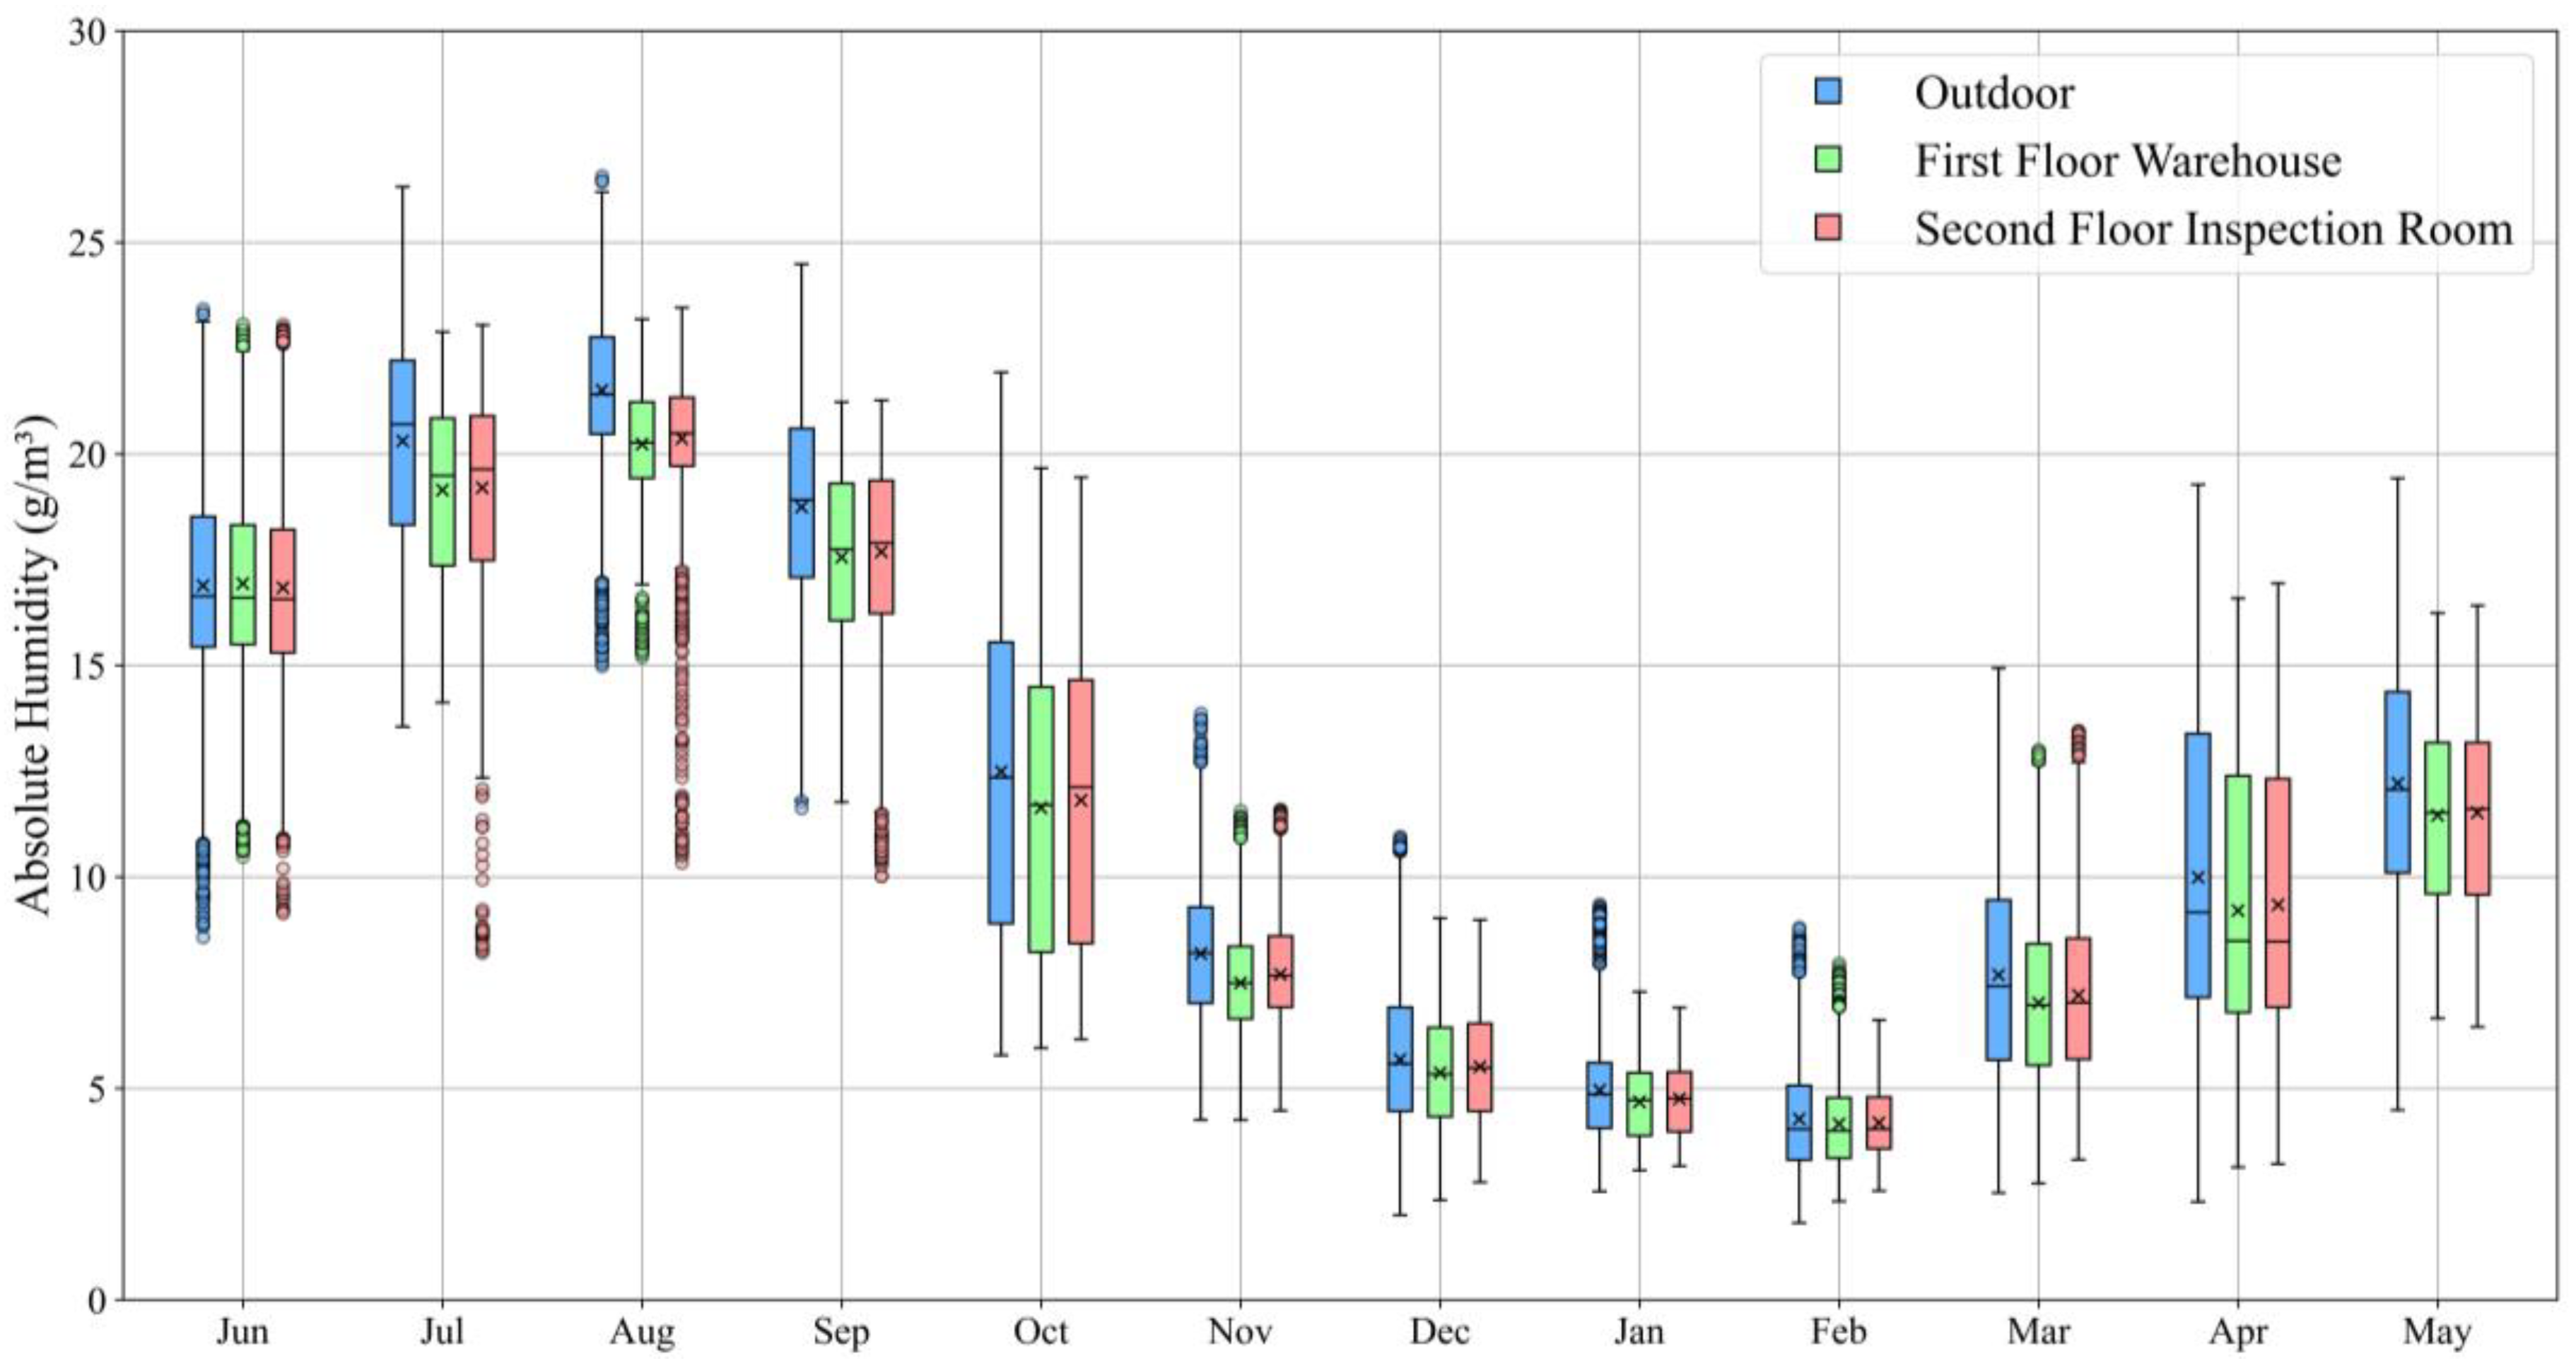
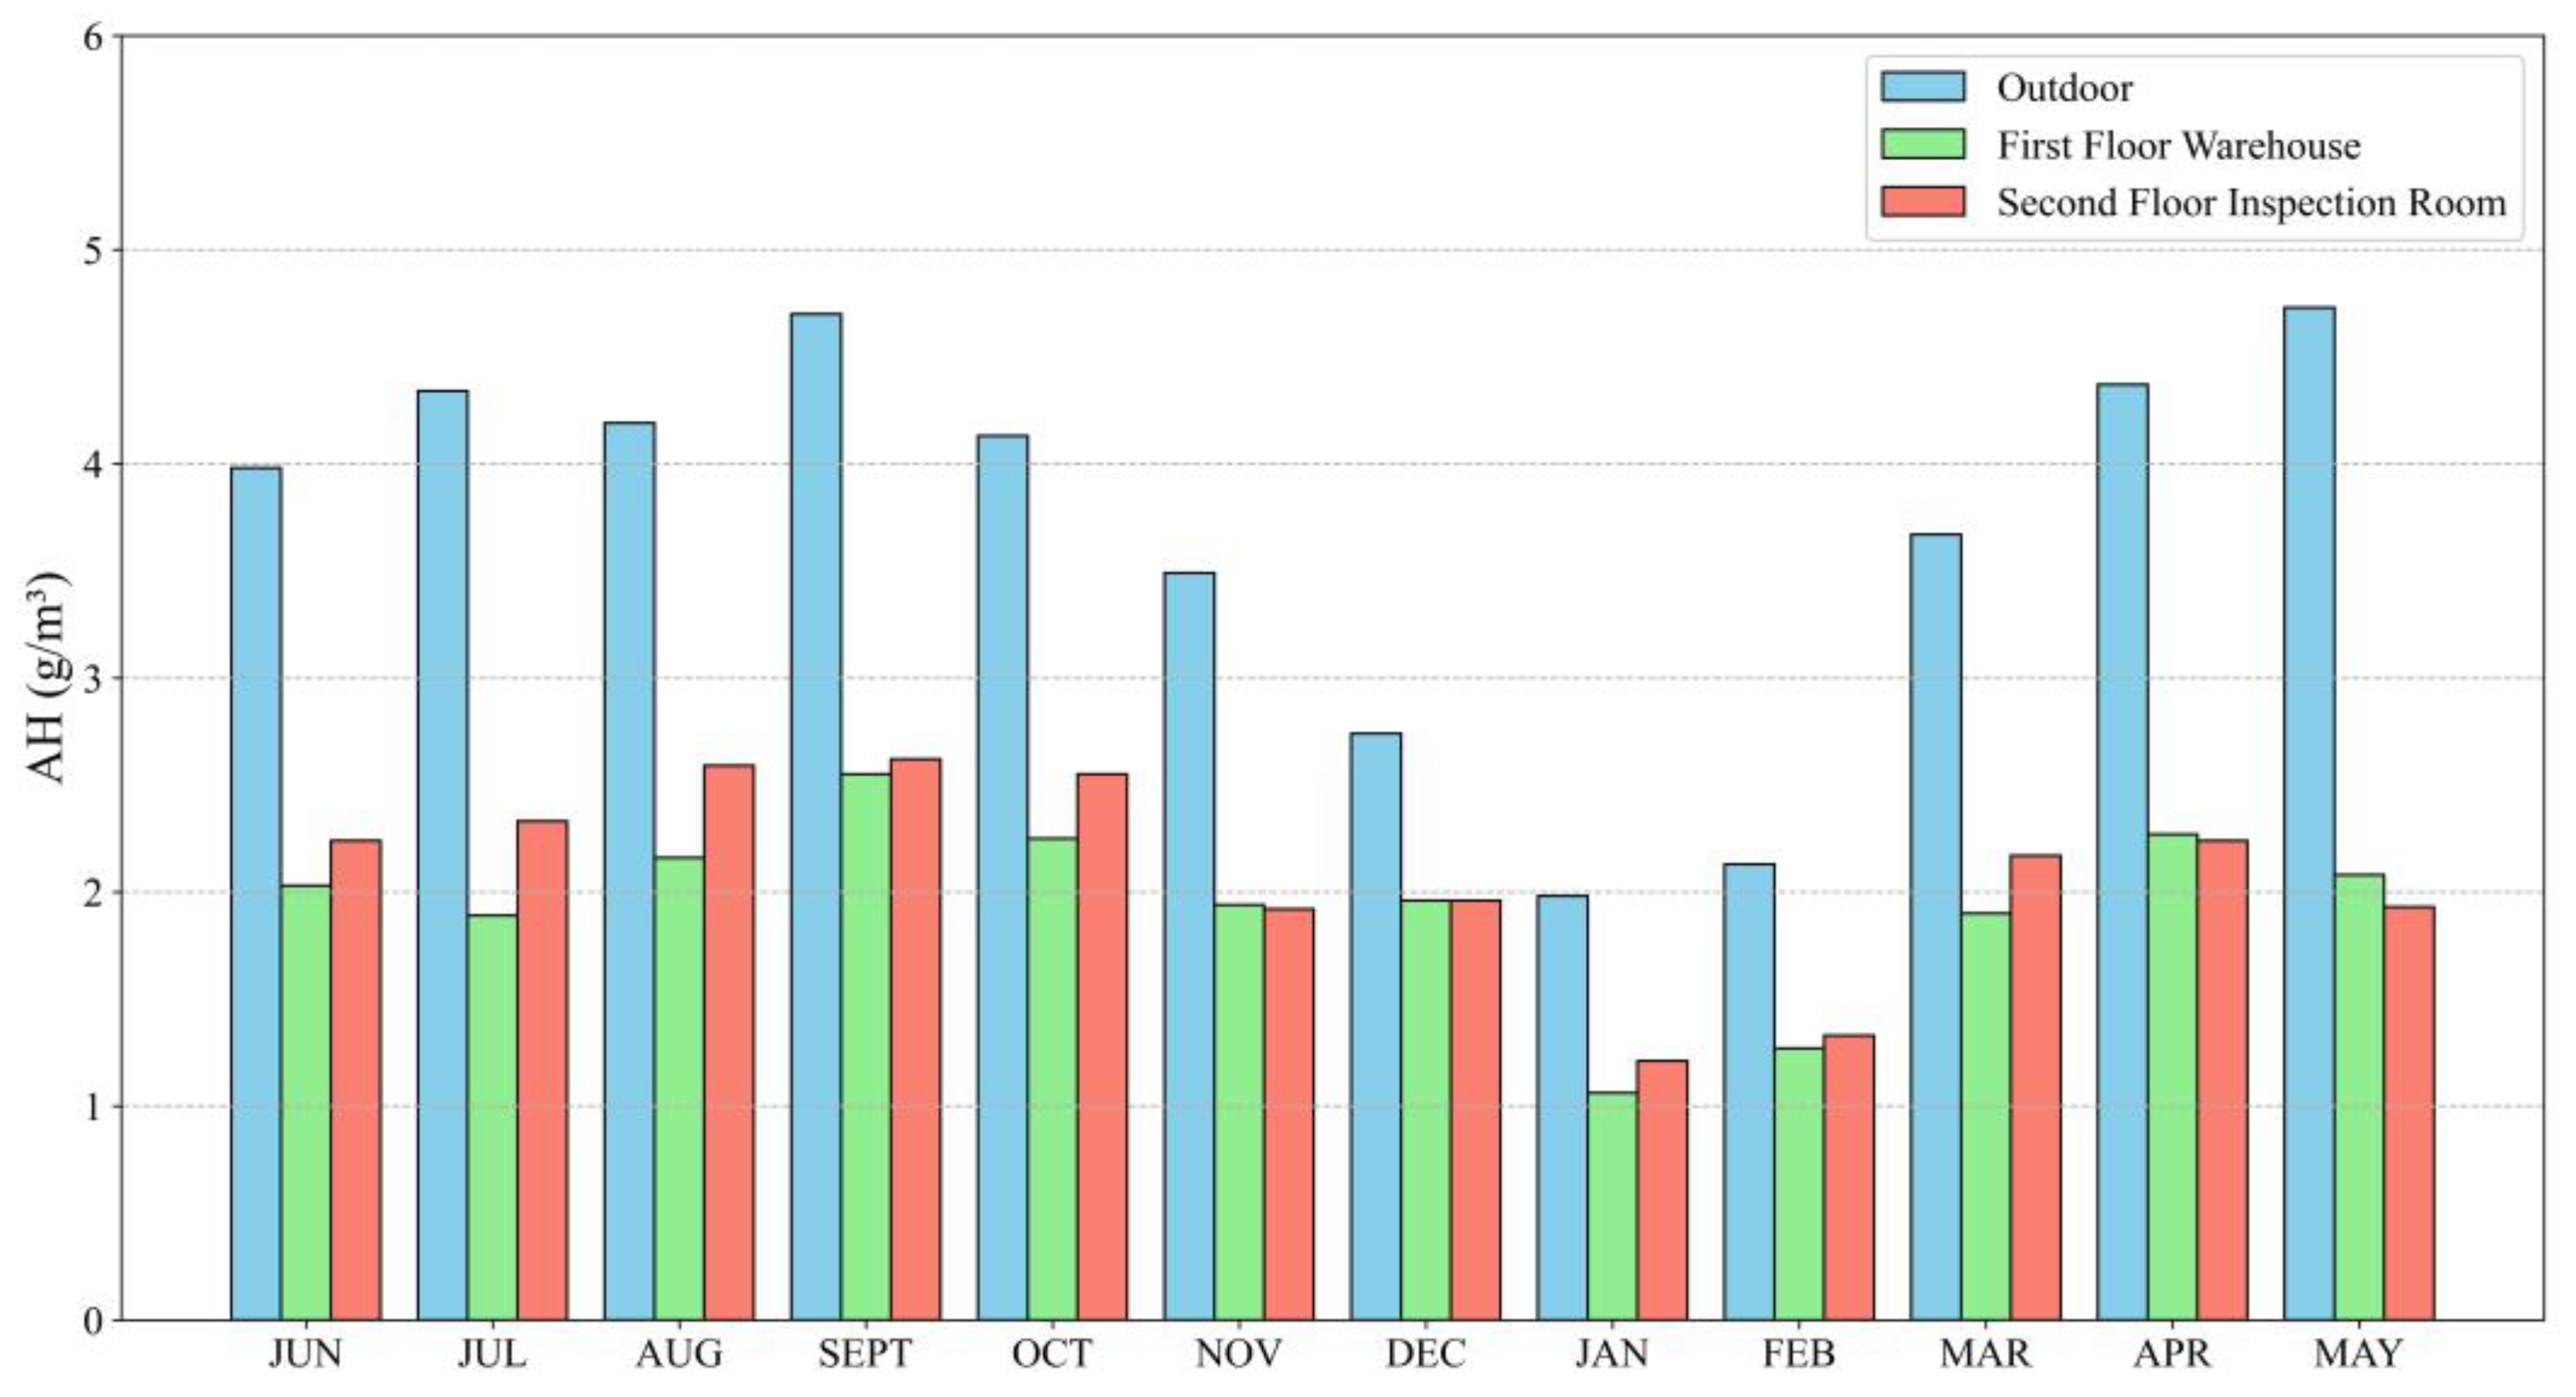
3.2.3. Absolute Humidity
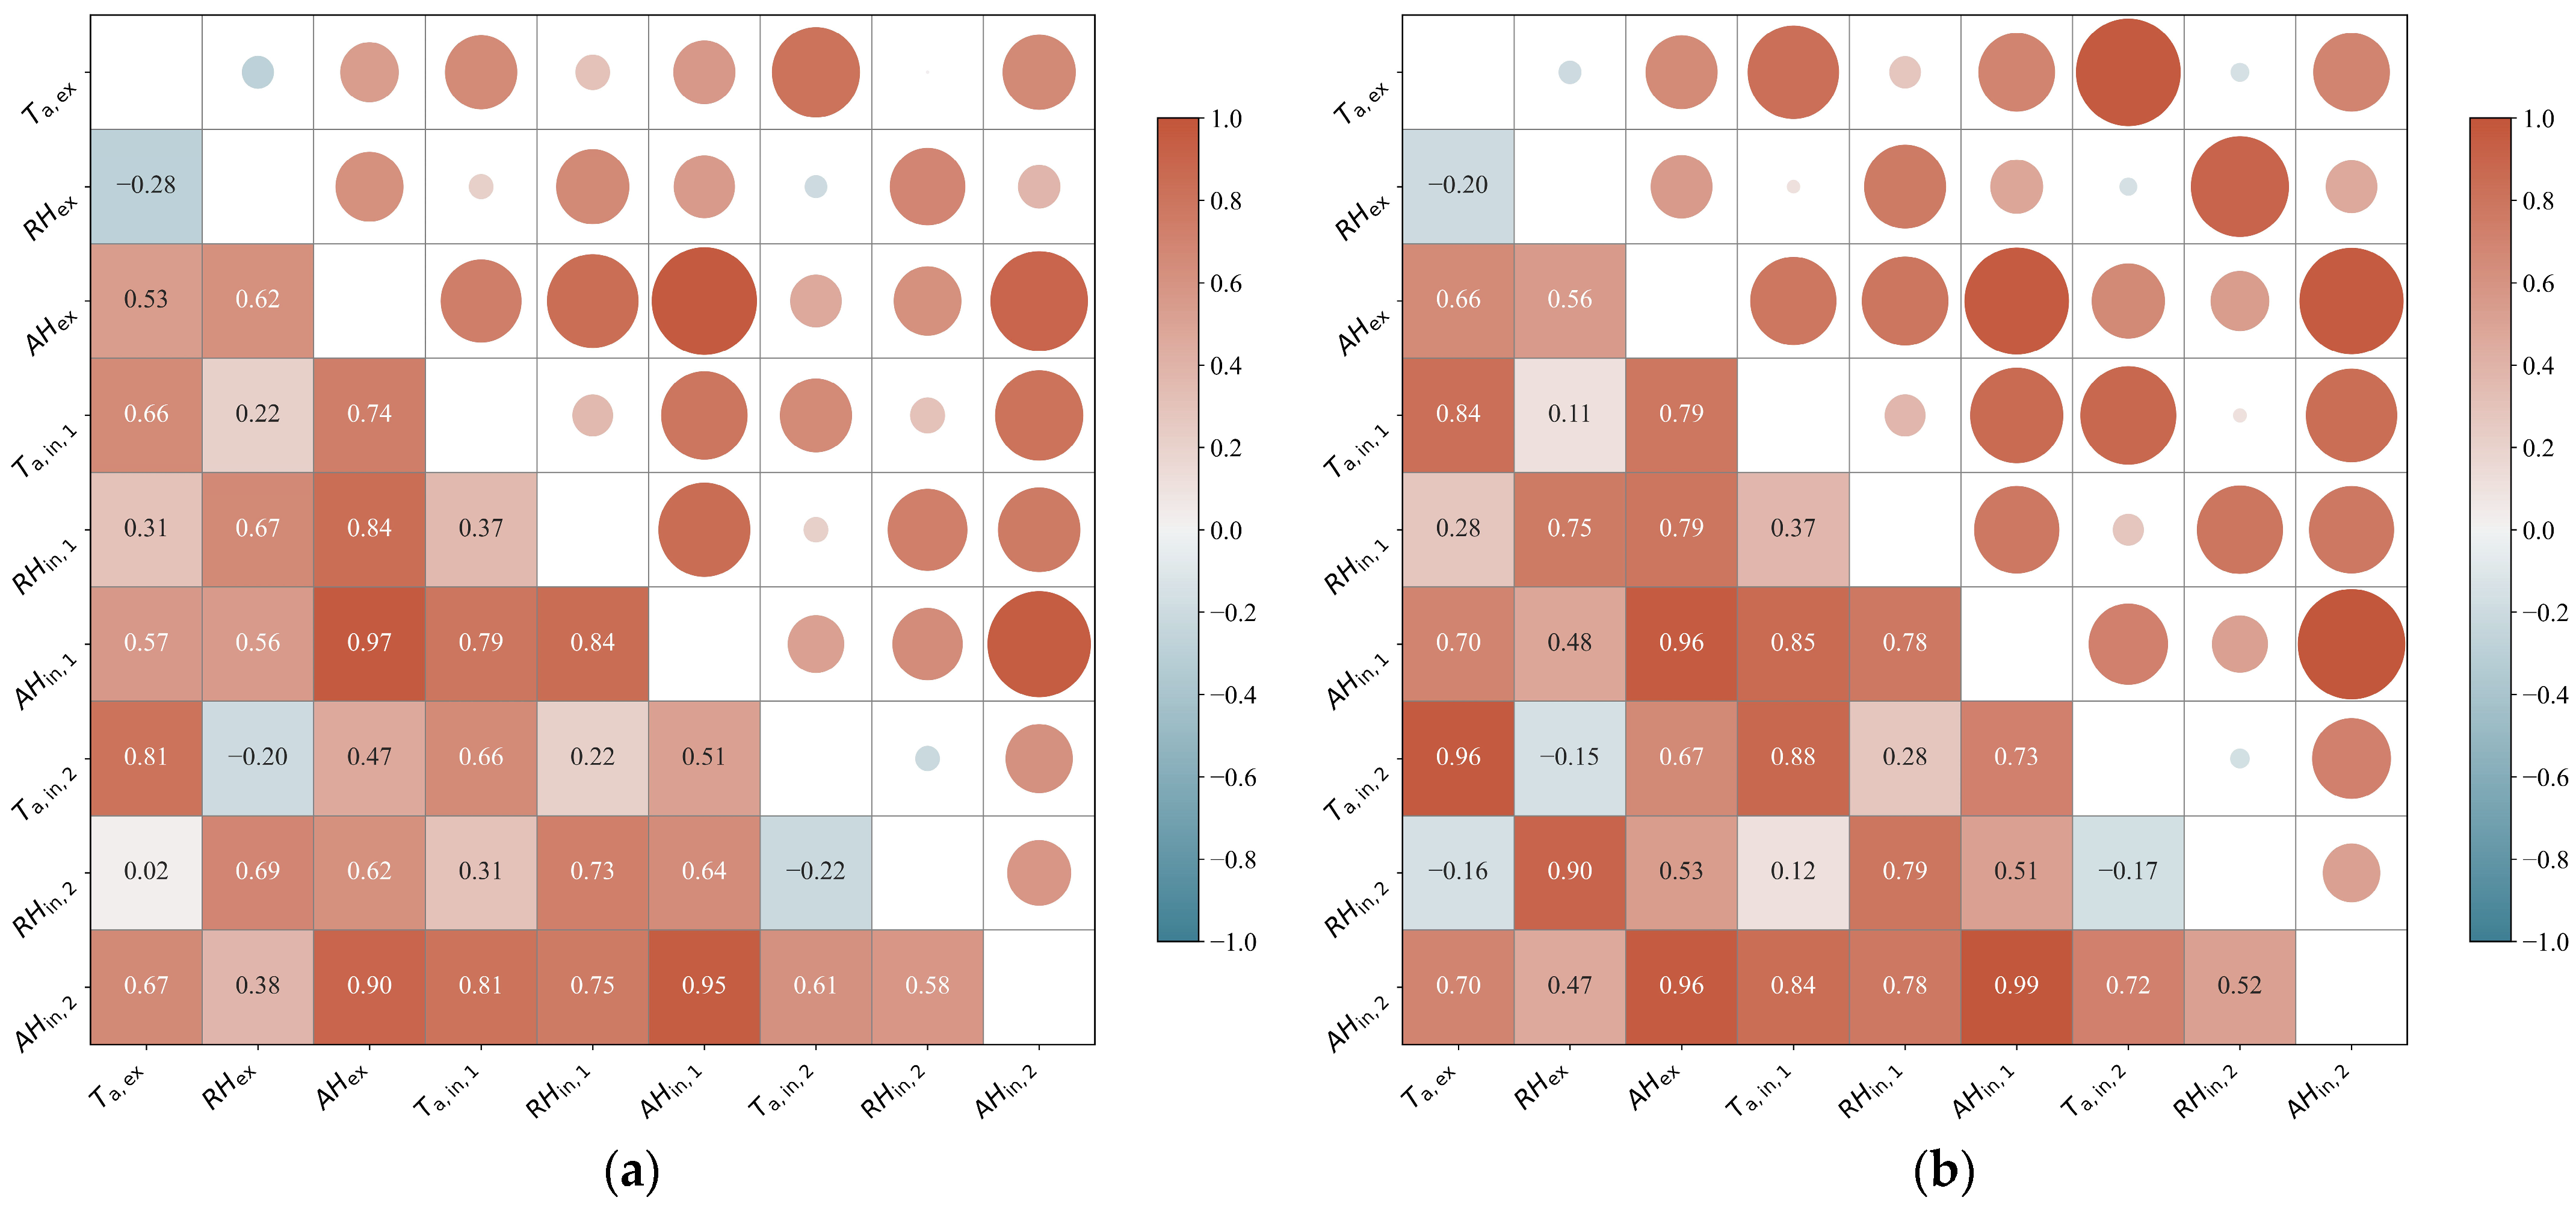
3.2.4. Correlation Analysis
3.2.5. Stability Analysis
3.3. Analysis of Indoor Condensation
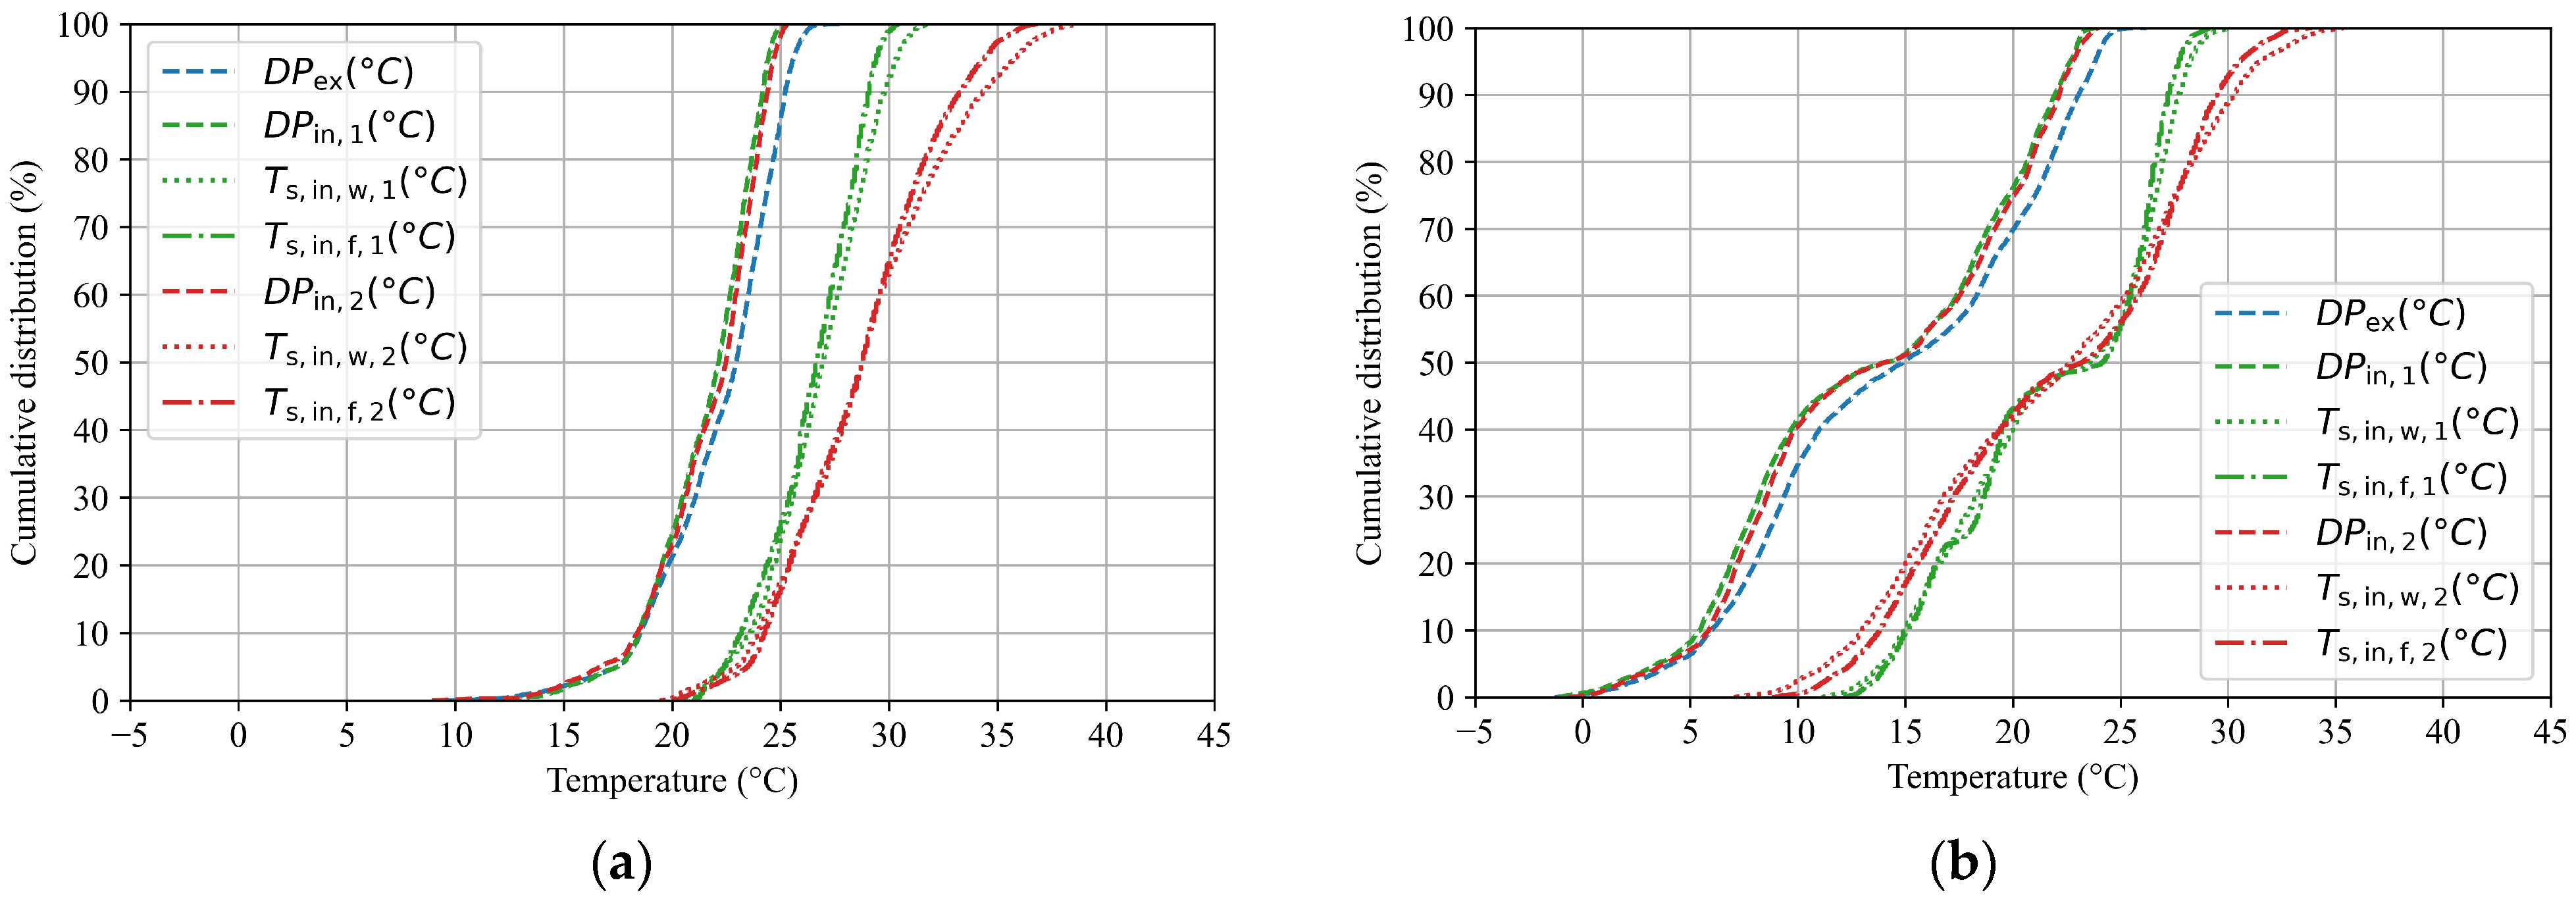
3.3.1. Air Dew Point Temperature (DP) and Surface Temperature (Ts)
3.3.2. Condensation Risk
- The ratio of indoor air vapor pressure to the saturation vapor pressure at the interior surface temperature;
- The ratio of ventilated outdoor air vapor pressure to the saturation vapor pressure at the same interior surface temperature.
3.4. Typical Weeks
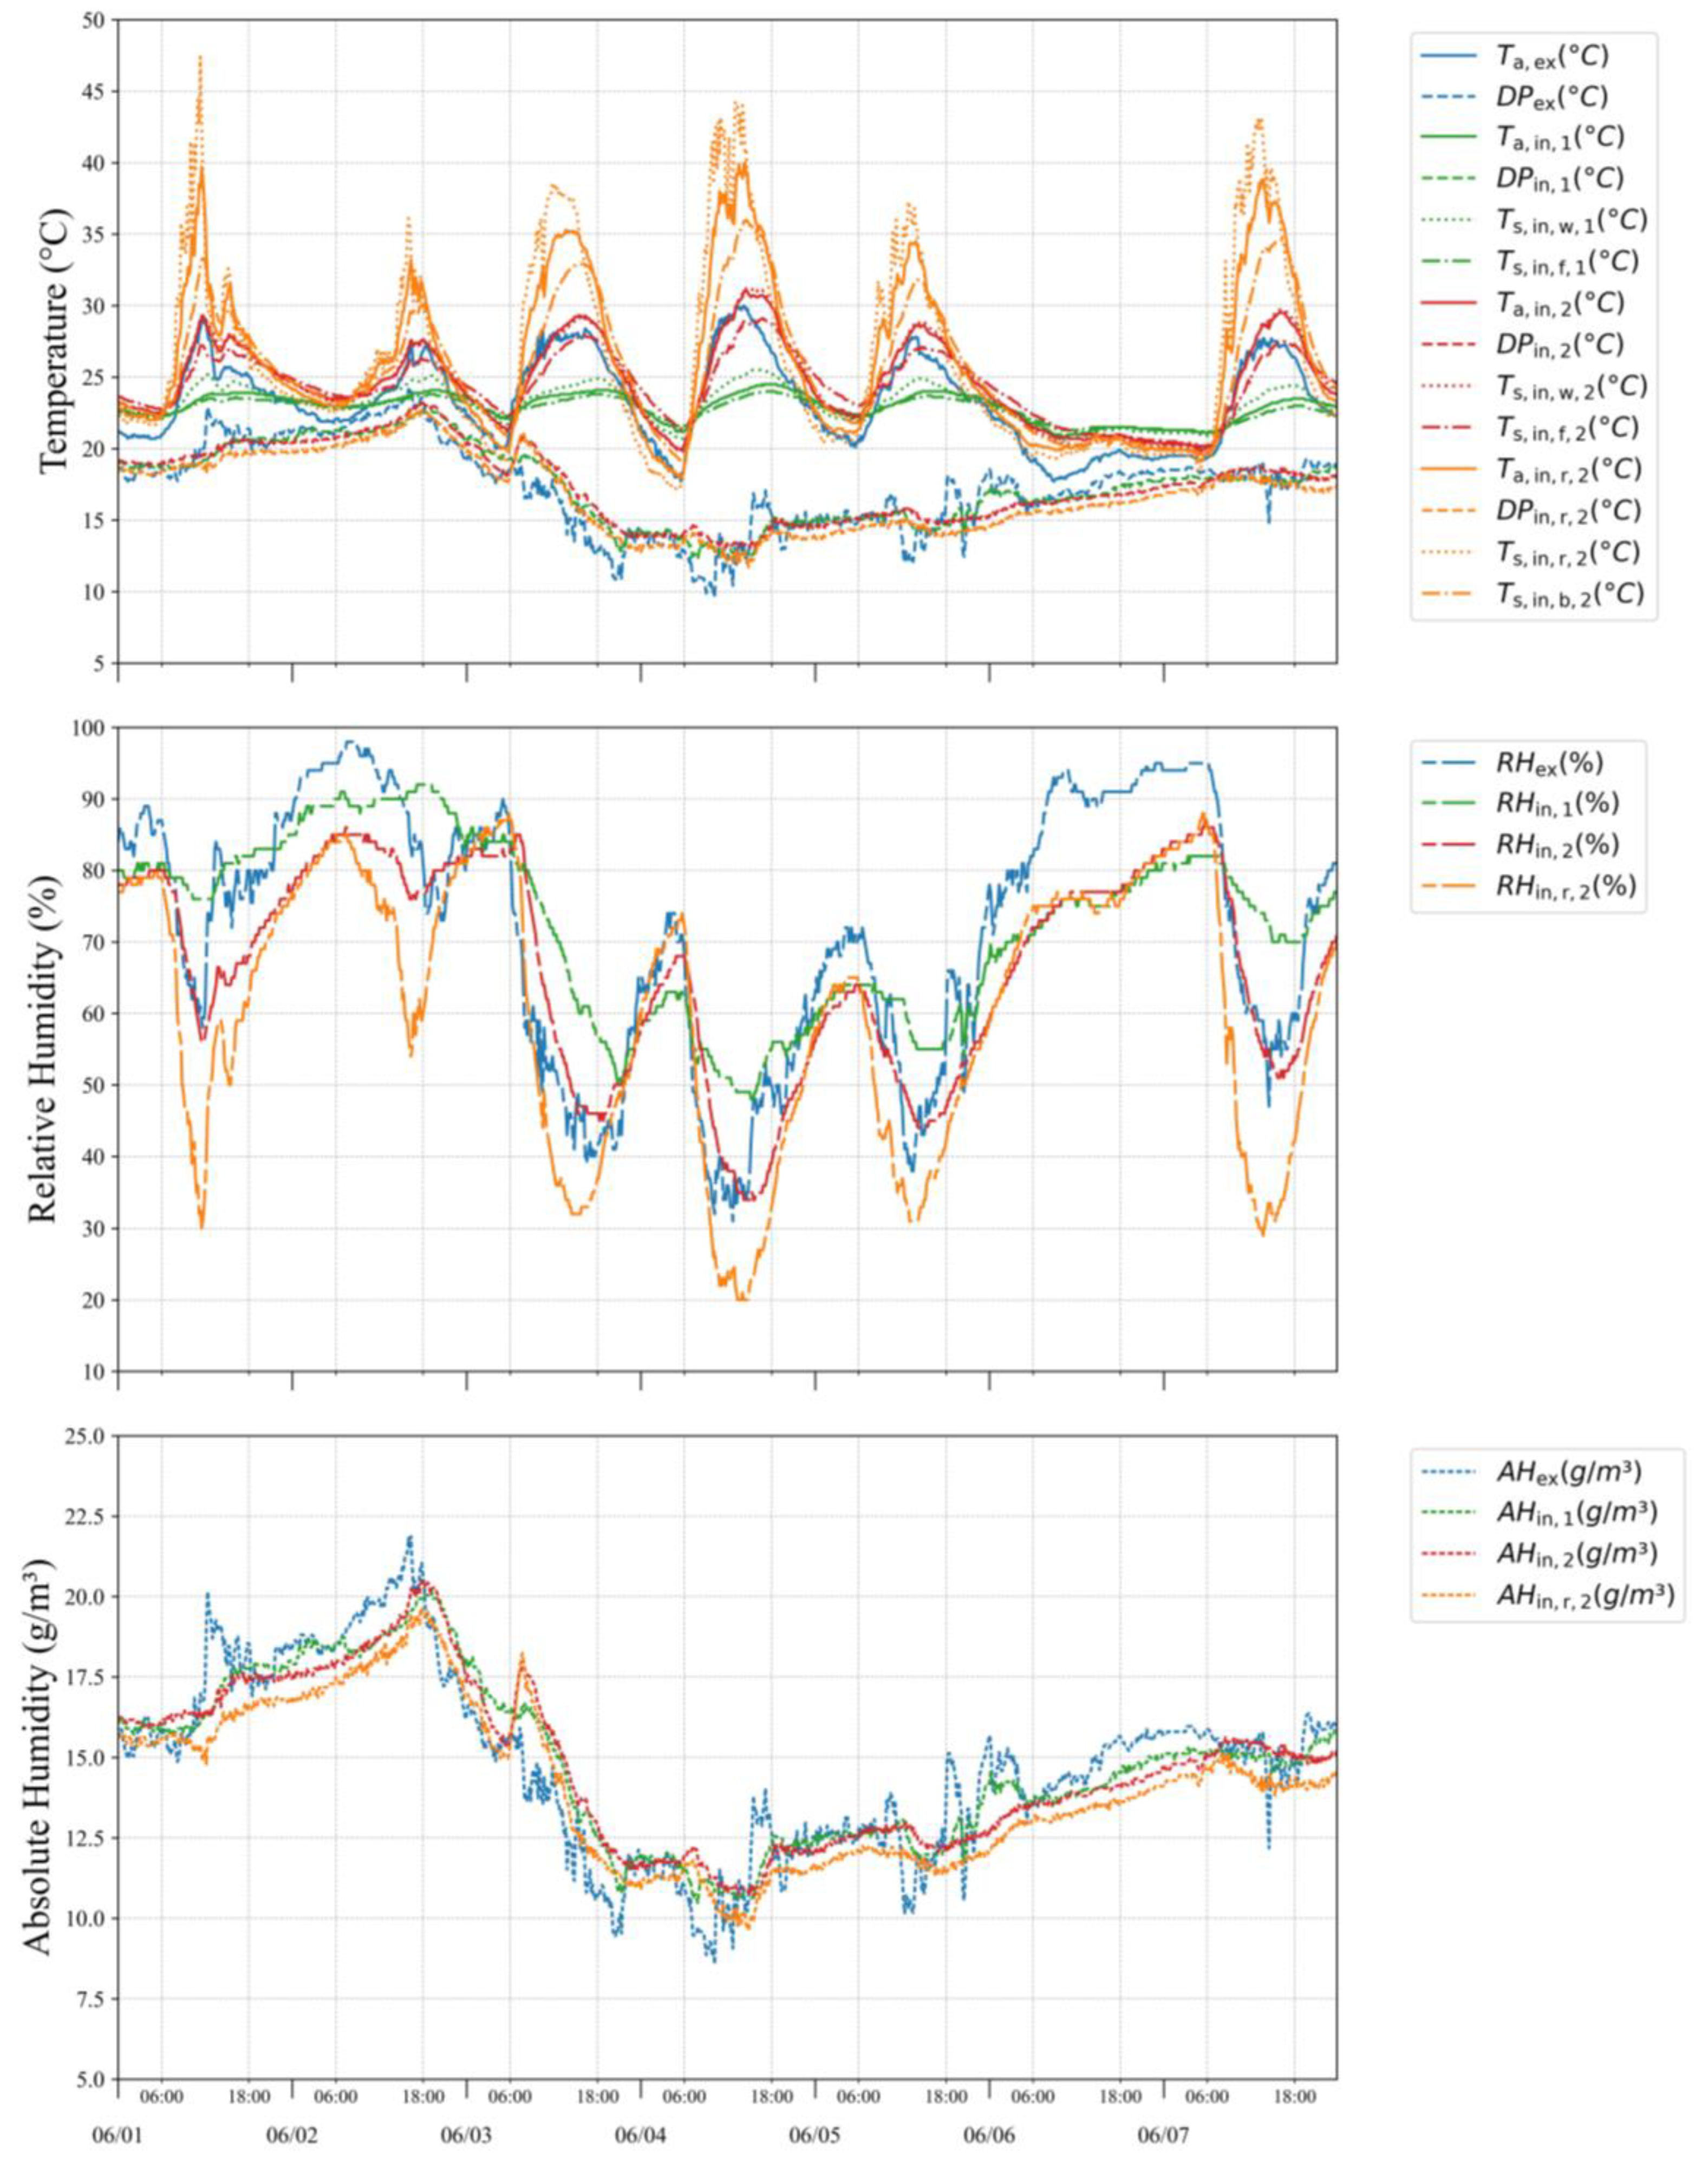
3.4.1. Early Summer (Rainy Season)
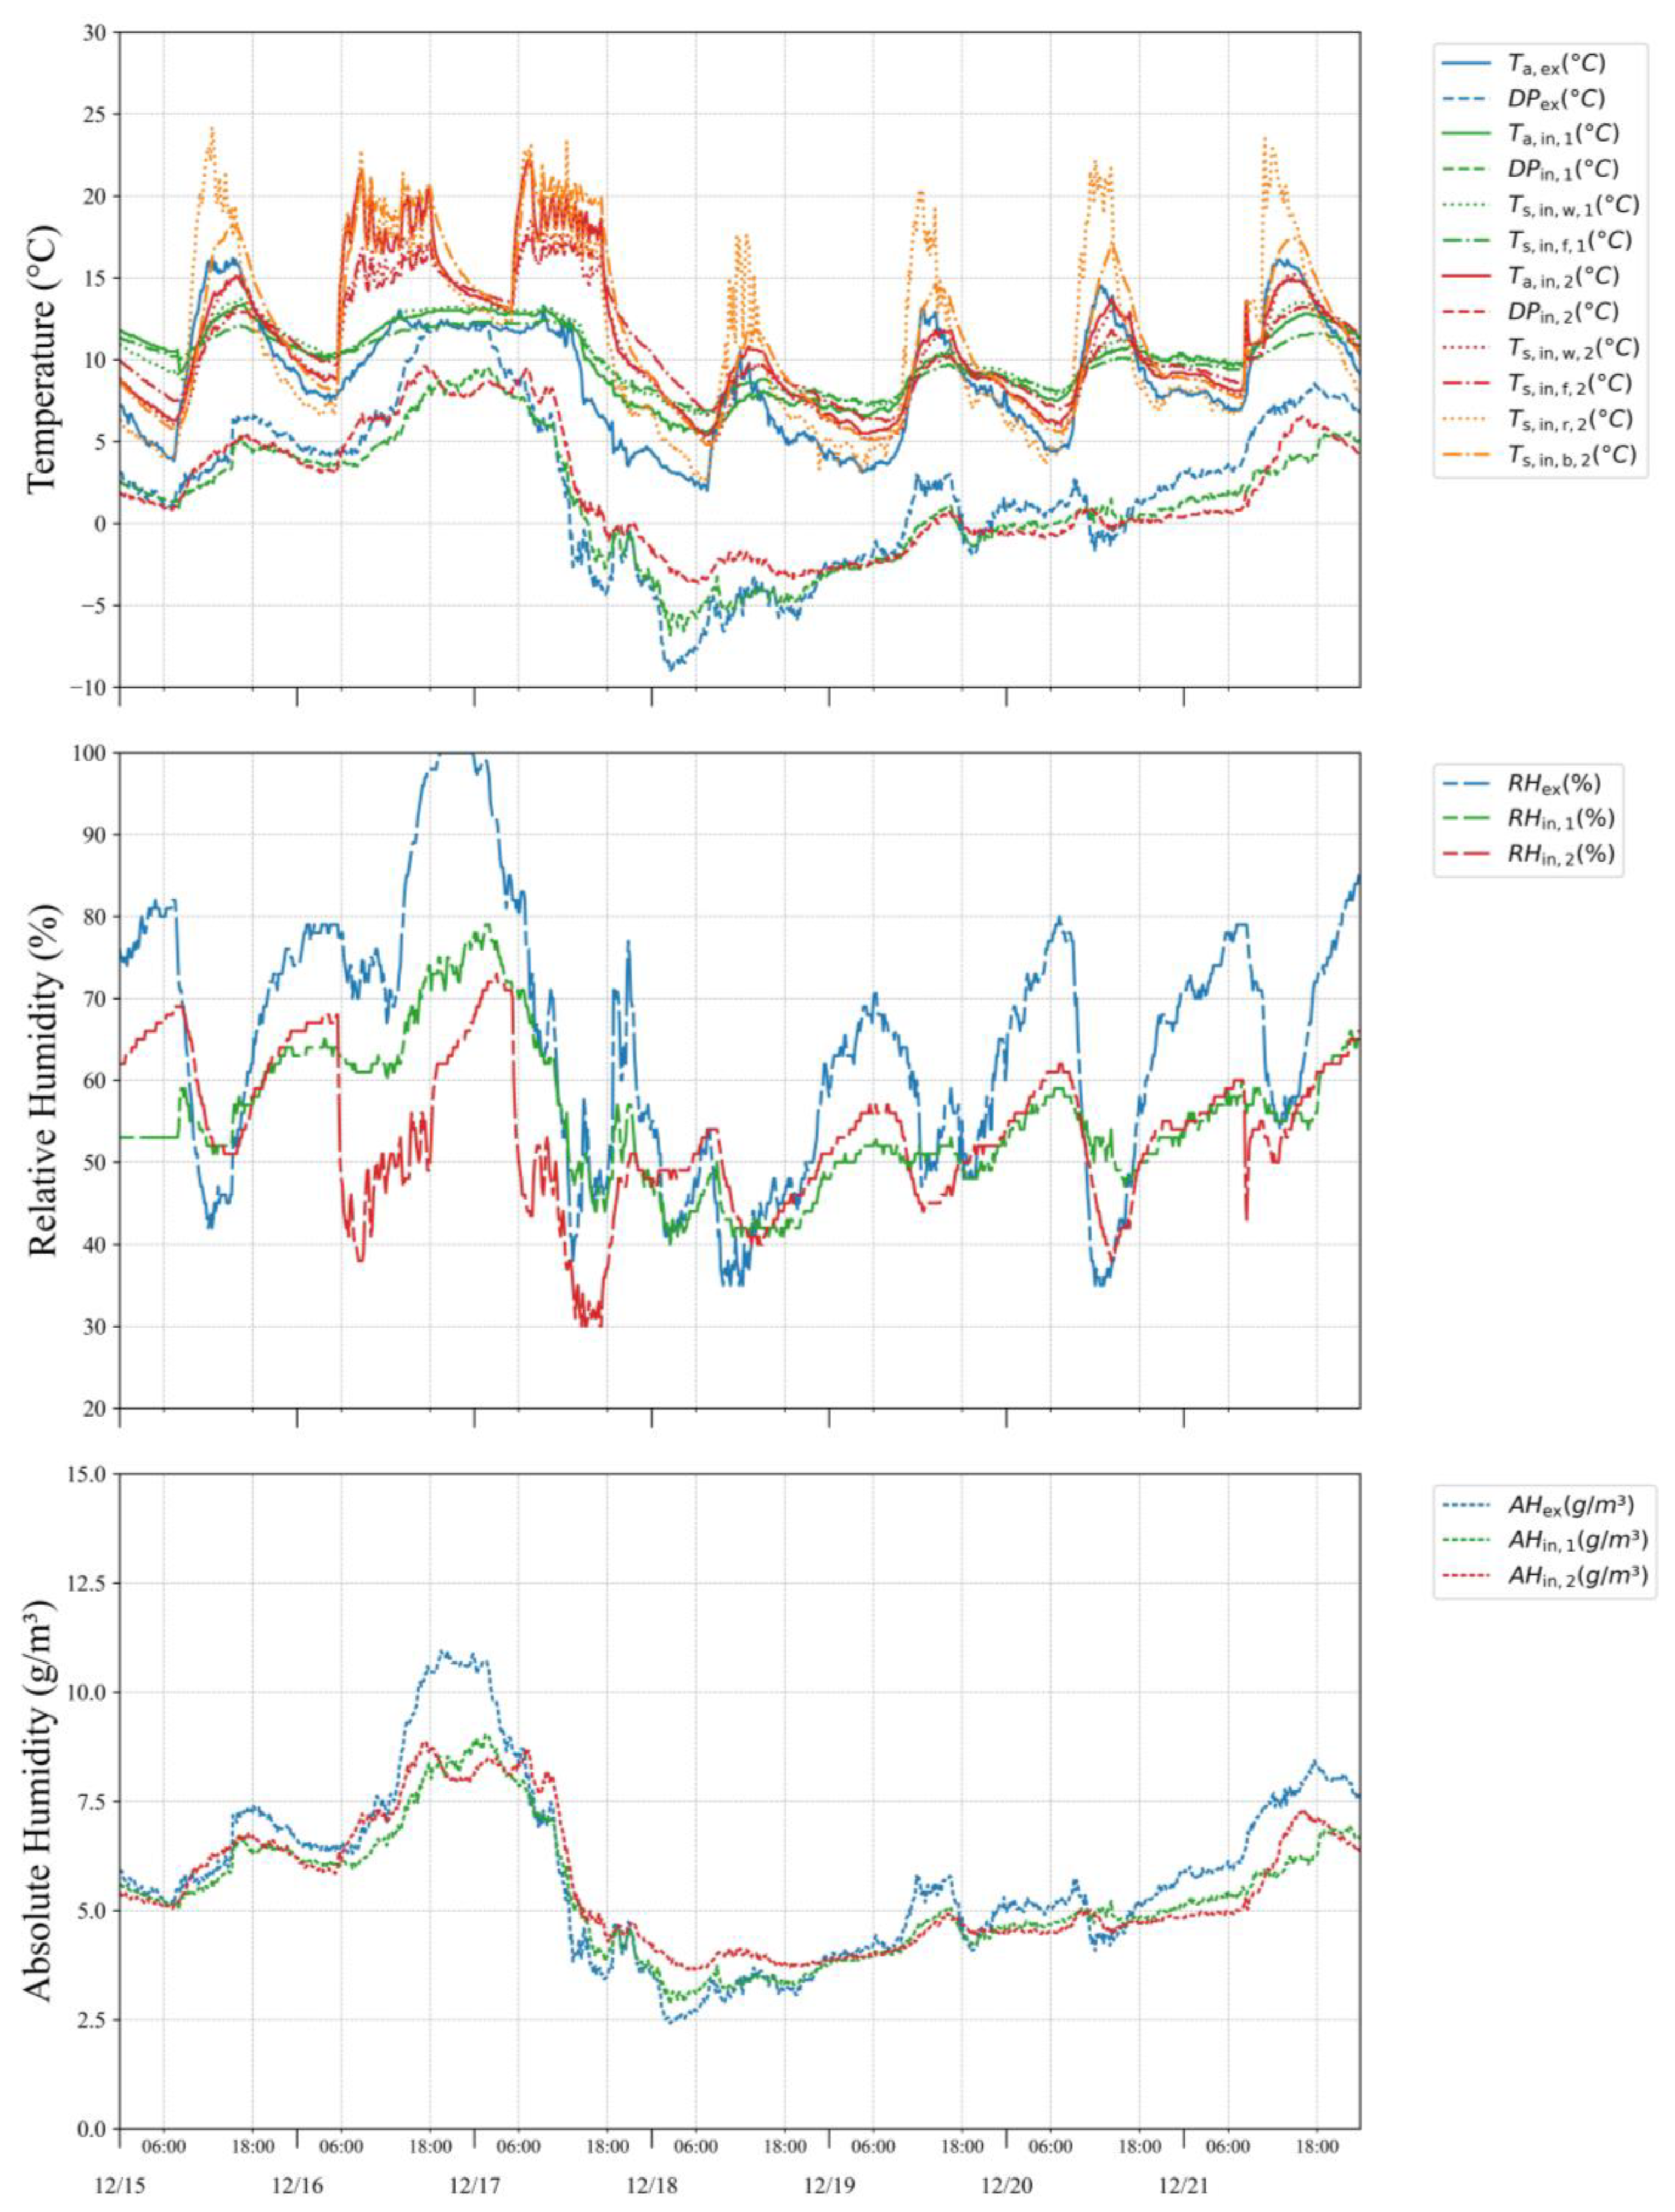
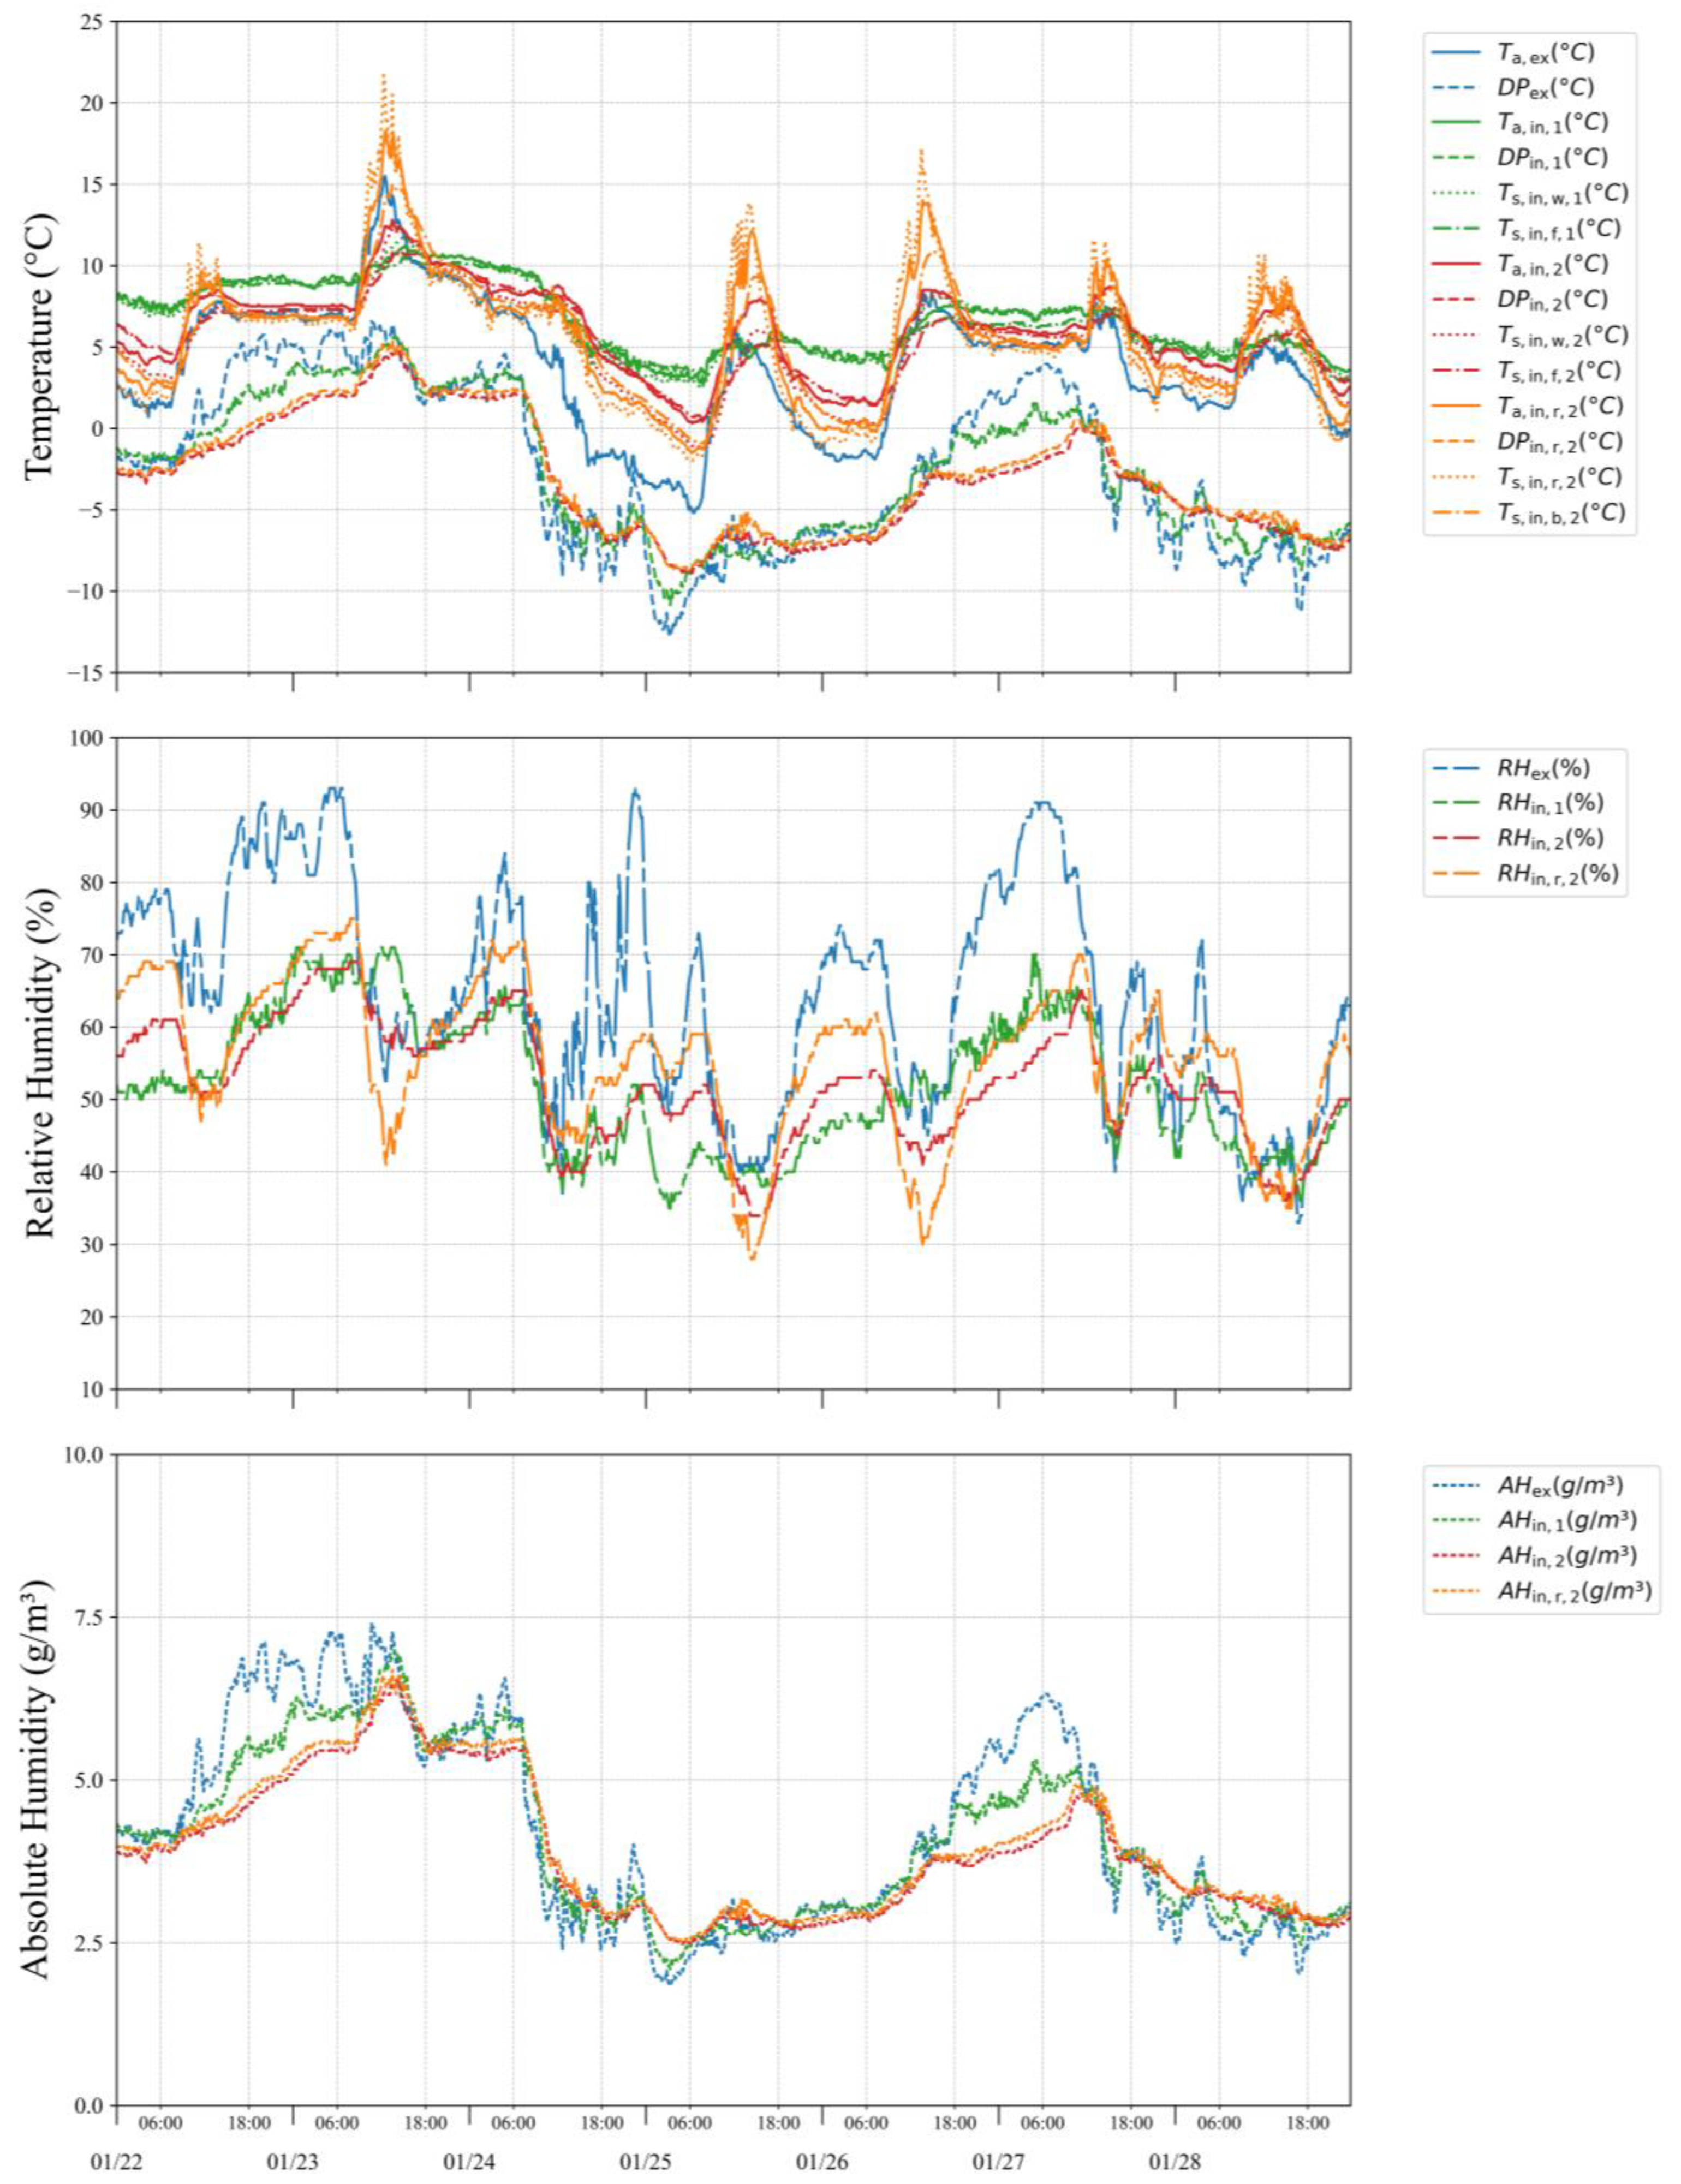
3.4.2. Winter
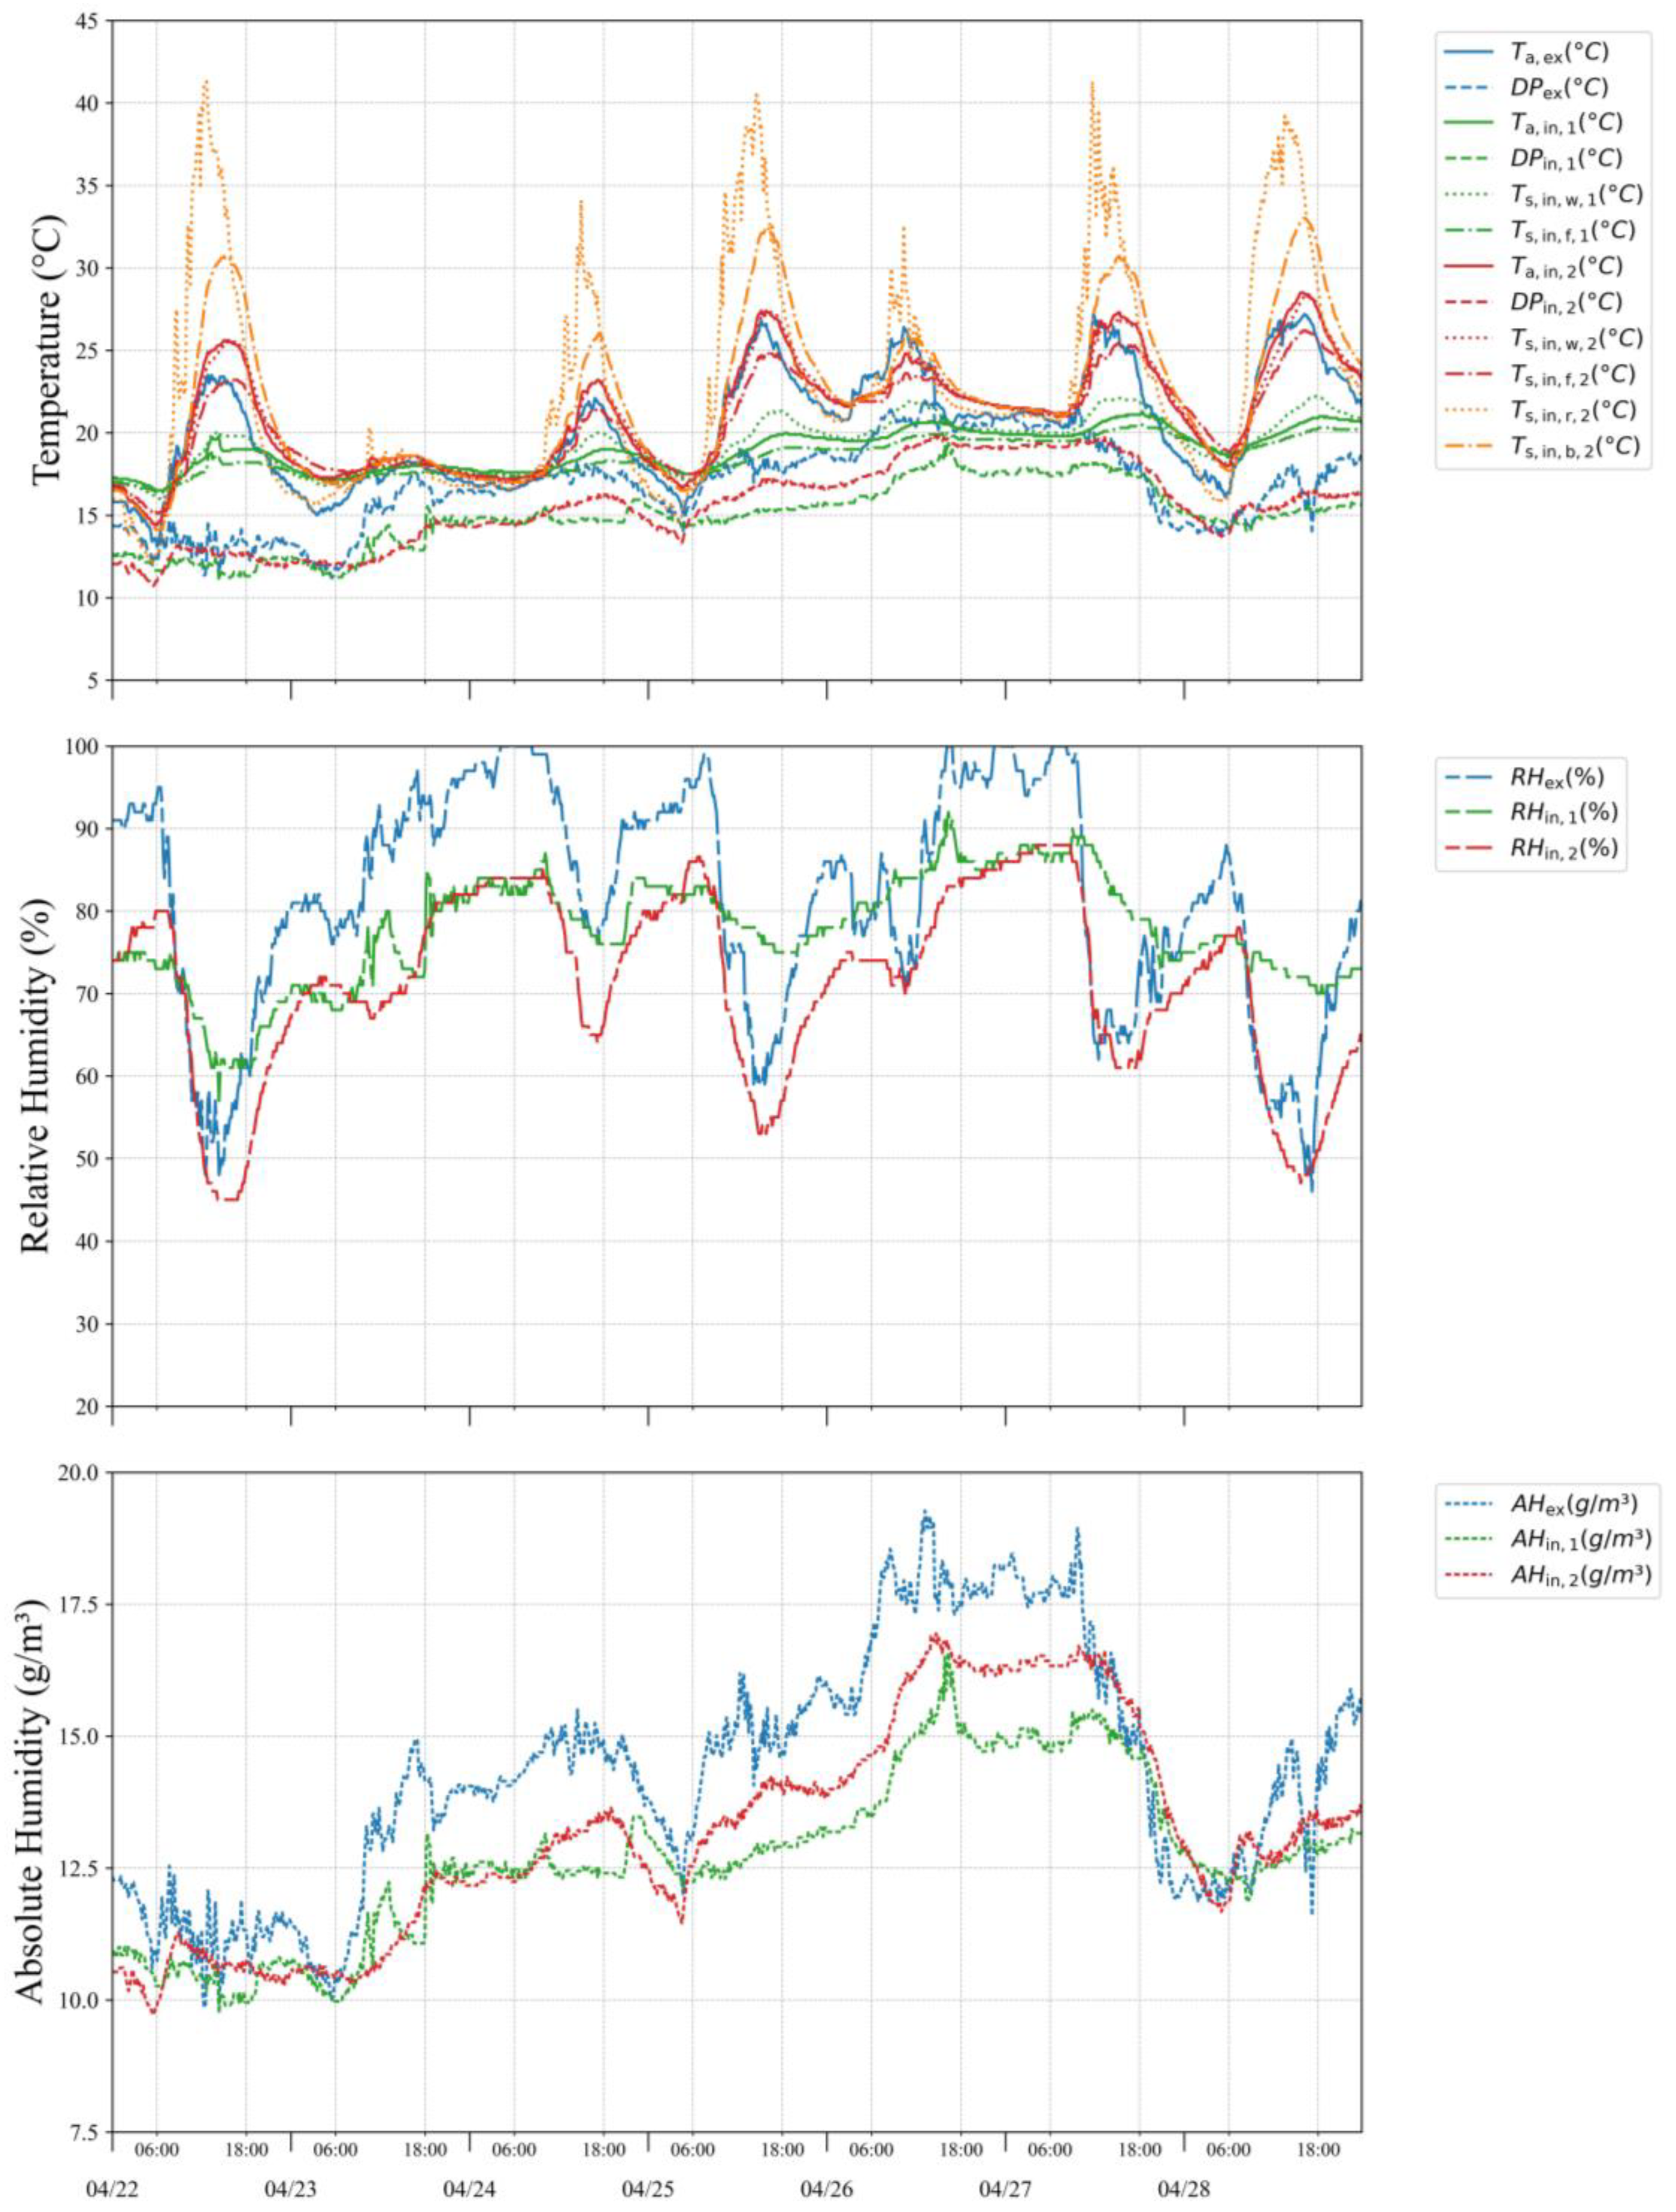
3.4.3. Spring
4. Conclusions
5. Limitations and Future Works
Author Contributions
Funding
Data Availability Statement
Conflicts of Interest
Appendix A

| Element | Internal Surface Thermal Resistance (m2·K/W) | External Surface Thermal Resistance (m2·K/W)—Direct Air Exposure | External Surface Thermal Resistance (m2·K/W)—Other Conditions |
|---|---|---|---|
| Roof | 0.09 | 0.04 | 0.09 (e.g., air gap) |
| Ceiling | 0.09 | - | 0.09 (e.g., attic space) |
| External Wall | 0.11 | 0.04 | 0.11 (e.g., air gap) |
| Floor | 0.15 | 0.04 | 0.15 (e.g., subfloor layer) |
| Element | Surface Thermal Resistance (Target Zone Side) (m2·K/W) | Surface Thermal Resistance (Adjacent Zone Side) (m2·K/W) |
|---|---|---|
| Boundary Wall | 0.11 | 0.11 |
| Upper Floor Partition | 0.09 | 0.09 |
| Lower Floor Partition | 0.15 | 0.15 |
References
- Hashempour, N.; Taherkhani, R.; Mahdikhani, M. Energy Performance Optimization of Existing Buildings: A Literature Review. Sustain. Cities Soc. 2020, 54, 101967. [Google Scholar] [CrossRef]
- Li, Q.; Zhang, L.; Zhang, L.; Wu, X. Optimizing Energy Efficiency and Thermal Comfort in Building Green Retrofit. Energy 2021, 237, 121509. [Google Scholar] [CrossRef]
- Díaz-López, C.; Verichev, K.; Holgado-Terriza, J.A.; Zamorano, M. Evolution of Climate Zones for Building in Spain in the Face of Climate Change. Sustain. Cities Soc. 2021, 74, 103223. [Google Scholar] [CrossRef]
- Wang, X.; Zhang, L.; Su, X.; Yang, H. Daylighting and Energy Performance of the Window with Transparent Insulation Slats in the Humid Subtropical Climate Zone. Energy Build. 2023, 300, 113685. [Google Scholar] [CrossRef]
- Zhou, Y.; Herr, C.M. A Review of Advanced Façade System Technologies to Support Net-Zero Carbon High-Rise Building Design in Subtropical China. Sustainability 2023, 15, 2913. [Google Scholar] [CrossRef]
- He, Y.; Wang, Z.; Wong, H.M.; Chen, G.; Ren, C.; Luo, M.; Li, Y.; Lee, T.; Chan, P.W.; Ho, J.Y.; et al. Spatial-Temporal Changes of Compound Temperature-Humidity Extremes in Humid Subtropical High-Density Cities: An Observational Study in Hong Kong from 1961 to 2020. Urban Clim. 2023, 51, 101669. [Google Scholar] [CrossRef]
- Nasrollahzadeh, N. Comprehensive Building Envelope Optimization: Improving Energy, Daylight, and Thermal Comfort Performance of the Dwelling Unit. J. Build. Eng. 2021, 44, 103418. [Google Scholar] [CrossRef]
- Sung, W.-P.; Chen, T.-Y.; Liu, C.-H. Strategy for Improving the Indoor Environment of Office Spaces in Subtropical Cities. Buildings 2022, 12, 412. [Google Scholar] [CrossRef]
- Haddad, S.; Paolini, R.; Synnefa, A.; De Torres, L.; Prasad, D.; Santamouris, M. Integrated Assessment of the Extreme Climatic Conditions, Thermal Performance, Vulnerability, and Well-Being in Low-Income Housing in the Subtropical Climate of Australia. Energy Build. 2022, 272, 112349. [Google Scholar] [CrossRef]
- Takasu, M.; Ooka, R.; Rijal, H.B.; Indraganti, M.; Singh, M.K. Study on Adaptive Thermal Comfort in Japanese Offices under Various Operation Modes. Build. Environ. 2017, 118, 273–288. [Google Scholar] [CrossRef]
- Coelho, G.B.A.; Rebelo, H.B.; De Freitas, V.P.; Henriques, F.M.A.; Sousa, L. Current and Future Geographical Distribution of the Indoor Conditions for High Thermal Inertia Historic Buildings across Portugal via Hygrothermal Simulation. Build. Environ. 2023, 245, 110877. [Google Scholar] [CrossRef]
- Annila, P.J.; Hellemaa, M.; Pakkala, T.A.; Lahdensivu, J.; Suonketo, J.; Pentti, M. Extent of Moisture and Mould Damage in Structures of Public Buildings. Case Stud. Constr. Mater. 2017, 6, 103–108. [Google Scholar] [CrossRef]
- Chen, X.; Yang, H.; Zhang, W. Simulation-Based Approach to Optimize Passively Designed Buildings: A Case Study on a Typical Architectural Form in Hot and Humid Climates. Renew. Sustain. Energy Rev. 2018, 82, 1712–1725. [Google Scholar] [CrossRef]
- Creutzig, F.; Agoston, P.; Minx, J.C.; Canadell, J.G.; Andrew, R.M.; Quéré, C.L.; Peters, G.P.; Sharifi, A.; Yamagata, Y.; Dhakal, S. Urban Infrastructure Choices Structure Climate Solutions. Nat. Clim. Change 2016, 6, 1054–1056. [Google Scholar] [CrossRef]
- Grafakos, S.; Trigg, K.; Landauer, M.; Chelleri, L.; Dhakal, S. Analytical Framework to Evaluate the Level of Integration of Climate Adaptation and Mitigation in Cities. Clim. Change 2019, 154, 87–106. [Google Scholar] [CrossRef]
- Daioglou, V.; Mikropoulos, E.; Gernaat, D.; Van Vuuren, D.P. Efficiency Improvement and Technology Choice for Energy and Emission Reductions of the Residential Sector. Energy 2022, 243, 122994. [Google Scholar] [CrossRef]
- Barbaresi, A.; Bovo, M.; Torreggiani, D. The Dual Influence of the Envelope on the Thermal Performance of Conditioned and Unconditioned Buildings. Sustain. Cities Soc. 2020, 61, 102298. [Google Scholar] [CrossRef]
- Stagrum, A.E.; Andenæs, E.; Kvande, T.; Lohne, J. Climate Change Adaptation Measures for Buildings—A Scoping Review. Sustainability 2020, 12, 1721. [Google Scholar] [CrossRef]
- Sharifi, A. Co-Benefits and Synergies between Urban Climate Change Mitigation and Adaptation Measures: A Literature Review. Sci. Total Environ. 2021, 750, 141642. [Google Scholar] [CrossRef]
- Li, J.; Ng, S.T.; Skitmore, M. Review of Low-Carbon Refurbishment Solutions for Residential Buildings with Particular Reference to Multi-Story Buildings in Hong Kong. Renew. Sustain. Energy Rev. 2017, 73, 393–407. [Google Scholar] [CrossRef]
- Zheng, W.; Wei, F.; Su, S.; Cai, J.; Wei, J.; Hu, R. Effect of the Envelope Structure on the Indoor Thermal Environment of Low-Energy Residential Building in Humid Subtropical Climate: In Case of Brick–Timber Vernacular Dwelling in China. Environ. Technol. Innov. 2022, 28, 102884. [Google Scholar] [CrossRef]
- Xia, D.; Xie, W.; Guo, J.; Zou, Y.; Wu, Z.; Fan, Y. Building Thermal and Energy Performance of Subtropical Terraced Houses under Future Climate Uncertainty. Sustainability 2023, 15, 12464. [Google Scholar] [CrossRef]
- Li, M.; Cao, J.; Xiong, M.; Li, J.; Feng, X.; Meng, F. Different Responses of Cooling Energy Consumption in Office Buildings to Climatic Change in Major Climate Zones of China. Energy Build. 2018, 173, 38–44. [Google Scholar] [CrossRef]
- Ouanes, S.; Sriti, L. Regression-Based Sensitivity Analysis and Multi-Objective Optimisation of Energy Performance and Thermal Comfort: Building Envelope Design in Hot Arid Urban Context. Build. Environ. 2024, 248, 111099. [Google Scholar] [CrossRef]
- Liu, S.; Kwok, Y.T.; Lau, K.K.-L.; Ouyang, W.; Ng, E. Effectiveness of Passive Design Strategies in Responding to Future Climate Change for Residential Buildings in Hot and Humid Hong Kong. Energy Build. 2020, 228, 110469. [Google Scholar] [CrossRef]
- Li, B.; Du, C.; Yao, R.; Yu, W.; Costanzo, V. Indoor Thermal Environments in Chinese Residential Buildings Responding to the Diversity of Climates. Appl. Therm. Eng. 2018, 129, 693–708. [Google Scholar] [CrossRef]
- Jalali, Z.; Shamseldin, A.Y.; Ghaffarianhoseini, A. Impact Assessment of Climate Change on Energy Performance and Thermal Load of Residential Buildings in New Zealand. Build. Environ. 2023, 243, 110627. [Google Scholar] [CrossRef]
- Avanzini, M.; Pinheiro, M.D.; Gomes, R.; Rolim, C. Energy Retrofit as an Answer to Public Health Costs of Fuel Poverty in Lisbon Social Housing. Energy Policy 2022, 160, 112658. [Google Scholar] [CrossRef]
- Azimi Fereidani, N.; Rodrigues, E.; Gaspar, A.R. A Review of the Energy Implications of Passive Building Design and Active Measures under Climate Change in the Middle East. J. Clean. Prod. 2021, 305, 127152. [Google Scholar] [CrossRef]
- De Azevedo Correia, C.M.; Amorim, C.N.D.; Santamouris, M. Use of Passive Cooling Techniques and Super Cool Materials to Minimize Cooling Energy and Improve Thermal Comfort in Brazilian Schools. Energy Build. 2024, 312, 114125. [Google Scholar] [CrossRef]
- Nguyen, A.T.; Rockwood, D.; Doan, M.K.; Dung Le, T.K. Performance Assessment of Contemporary Energy-Optimized Office Buildings under the Impact of Climate Change. J. Build. Eng. 2021, 35, 102089. [Google Scholar] [CrossRef]
- Chen, Y.; Ren, Z.; Peng, Z.; Yang, J.; Chen, Z.; Deng, Z. Impacts of Climate Change and Building Energy Efficiency Improvement on City-Scale Building Energy Consumption. J. Build. Eng. 2023, 78, 107646. [Google Scholar] [CrossRef]
- Cho, W.; Iwamoto, S.; Kato, S. Condensation Risk Due to Variations in Airtightness and Thermal Insulation of an Office Building in Warm and Wet Climate. Energies 2016, 9, 875. [Google Scholar] [CrossRef]
- Banti, N. Existing Industrial Buildings—A Review on Multidisciplinary Research Trends and Retrofit Solutions. J. Build. Eng. 2024, 84, 108615. [Google Scholar] [CrossRef]
- Seifhashemi, M.; Capra, B.R.; Milller, W.; Bell, J. The Potential for Cool Roofs to Improve the Energy Efficiency of Single Storey Warehouse-Type Retail Buildings in Australia: A Simulation Case Study. Energy Build. 2018, 158, 1393–1403. [Google Scholar] [CrossRef]
- Zhou, B.; Wang, D. Integrated Performance Optimization of Industrial Buildings in Relation to Thermal Comfort and Energy Consumption: A Case Study in Hot Summer and Cold Winter Climate. Case Stud. Therm. Eng. 2023, 46, 102991. [Google Scholar] [CrossRef]
- Mustafa, J.; Alqaed, S.; Sharifpur, M.; Meyer, J. Optimization of Window Solar Gain for a Building with Less Cooling Load. Case Stud. Therm. Eng. 2024, 53, 103890. [Google Scholar] [CrossRef]
- Chen, Y.; Liu, J.; Pei, J.; Cao, X.; Chen, Q.; Jiang, Y. Experimental and Simulation Study on the Performance of Daylighting in an Industrial Building and Its Energy Saving Potential. Energy Build. 2014, 73, 184–191. [Google Scholar] [CrossRef]
- Liu, X.; Liu, X.; Zhang, T.; Ooka, R.; Kikumoto, H. Comparison of Winter Air Infiltration and Its Influences between Large-Space and Normal-Space Buildings. Build. Environ. 2020, 184, 107183. [Google Scholar] [CrossRef]
- Tian, D.; Zhang, J.; Gao, Z. The Advancement of Research in Cool Roof: Super Cool Roof, Temperature-Adaptive Roof and Crucial Issues of Application in Cities. Energy Build. 2023, 291, 113131. [Google Scholar] [CrossRef]
- Xu, J.; Li, Y.; Wang, R.Z.; Liu, W.; Zhou, P. Experimental Performance of Evaporative Cooling Pad Systems in Greenhouses in Humid Subtropical Climates. Appl. Energy 2015, 138, 291–301. [Google Scholar] [CrossRef]
- Riahinezhad, M.; Hallman, M.; Masson, J.-F. Critical Review of Polymeric Building Envelope Materials: Degradation, Durability and Service Life Prediction. Buildings 2021, 11, 299. [Google Scholar] [CrossRef]
- You, S.; Li, W.; Ye, T.; Hu, F.; Zheng, W. Study on Moisture Condensation on the Interior Surface of Buildings in High Humidity Climate. Build. Environ. 2017, 125, 39–48. [Google Scholar] [CrossRef]
- Ma, Z.; Cui, S.; Chen, J. Demand Response through Ventilation and Latent Load Adjustment for Commercial Buildings in Humid Climate Zones. Appl. Energy 2024, 373, 123940. [Google Scholar] [CrossRef]
- Li, Z.; Chen, W.; Deng, S.; Lin, Z. The Characteristics of Space Cooling Load and Indoor Humidity Control for Residences in the Subtropics. Build. Environ. 2006, 41, 1137–1147. [Google Scholar] [CrossRef]
- Gaspar, K.; Casals, M.; Gangolells, M. A Comparison of Standardized Calculation Methods for in Situ Measurements of Façades U-Value. Energy Build. 2016, 130, 592–599. [Google Scholar] [CrossRef]
- Bienvenido-Huertas, D. Assessing the Environmental Impact of Thermal Transmittance Tests Performed in Façades of Existing Buildings: The Case of Spain. Sustainability 2020, 12, 6247. [Google Scholar] [CrossRef]
- Evangelisti, L.; Barbaro, L.; Guattari, C.; De Cristo, E.; De Lieto Vollaro, R.; Asdrubali, F. Comparison between Direct and Indirect Heat Flux Measurement Techniques: Preliminary Laboratory Tests. Energies 2024, 17, 2961. [Google Scholar] [CrossRef]
- Evangelisti, L.; Barbaro, L.; De Cristo, E.; Guattari, C.; D’Orazio, T. Towards an Improved Thermometric Method: Convective and Radiative Heat Transfer for Heat Flux Measurement through an Indirect Approach. Therm. Sci. Eng. Prog. 2024, 49, 102479. [Google Scholar] [CrossRef]
- Nardi, I.; Lucchi, E. In Situ Thermal Transmittance Assessment of the Building Envelope: Practical Advice and Outlooks for Standard and Innovative Procedures. Energies 2023, 16, 3319. [Google Scholar] [CrossRef]
- Kim, H.; Lamichhane, N.; Kim, C.; Shrestha, R. Innovations in Building Diagnostics and Condition Monitoring: A Comprehensive Review of Infrared Thermography Applications. Buildings 2023, 13, 2829. [Google Scholar] [CrossRef]
- Tardy, F. A Review of the Use of Infrared Thermography in Building Envelope Thermal Property Characterization Studies. J. Build. Eng. 2023, 75, 106918. [Google Scholar] [CrossRef]
- Bailo, C.M.; Matud, C.C.; García-Ballano, C.J.; Ruiz-Varona, A. Evaluation Thermal of the Building Envelope: Rehabilitated Building versus Non-Rehabilitated. Case Stud. Constr. Mater. 2024, 20, e02846. [Google Scholar] [CrossRef]
- Chowdhury, A.A.; Rasul, M.G.; Khan, M.M.K. Parametric Analysis of Thermal Comfort and Energy Efficiency in Building in Subtropical Climate. In Thermofluid Modeling for Energy Efficiency Applications; Elsevier: Amsterdam, The Netherlands, 2016; pp. 149–168. ISBN 978-0-12-802397-6. [Google Scholar]
- Chernousov, A.A.; Chan, B.Y.B. Numerical Simulation of Thermal Mass Enhanced Envelopes for Office Buildings in Subtropical Climate Zones. Energy Build. 2016, 118, 214–225. [Google Scholar] [CrossRef]
- Nardi, I.; Lucchi, E.; de Rubeis, T.; Ambrosini, D. Quantification of Heat Energy Losses through the Building Envelope: A State-of-the-Art Analysis with Critical and Comprehensive Review on Infrared Thermography. Build. Environ. 2018, 146, 190–205. [Google Scholar] [CrossRef]
- Kumar, D.; Alam, M.; Zou, P.X.W.; Sanjayan, J.G.; Memon, R.A. Comparative Analysis of Building Insulation Material Properties and Performance. Renew. Sustain. Energy Rev. 2020, 131, 110038. [Google Scholar] [CrossRef]
- Xue, Y.; Fan, Y.; Wang, Z.; Gao, W.; Sun, Z.; Ge, J. Facilitator of Moisture Accumulation in Building Envelopes and Its Influences on Condensation and Mould Growth. Energy Build. 2022, 277, 112528. [Google Scholar] [CrossRef]
- Gourlis, G.; Kovacic, I. A Study on Building Performance Analysis for Energy Retrofit of Existing Industrial Facilities. Appl. Energy 2016, 184, 1389–1399. [Google Scholar] [CrossRef]
- Lewczuk, K.; Kłodawski, M.; Gepner, P. Energy Consumption in a Distributional Warehouse: A Practical Case Study for Different Warehouse Technologies. Energies 2021, 14, 2709. [Google Scholar] [CrossRef]
- Gu, J.; Goetschalckx, M.; McGinnis, L.F. Research on Warehouse Design and Performance Evaluation: A Comprehensive Review. Eur. J. Oper. Res. 2010, 203, 539–549. [Google Scholar] [CrossRef]
- El Masri, Y.; Rakha, T. A Scoping Review of Non-Destructive Testing (NDT) Techniques in Building Performance Diagnostic Inspections. Constr. Build. Mater. 2020, 265, 120542. [Google Scholar] [CrossRef]
- Tolstorebrov, I.; Senadeera, W.; Eikevik, T.M.; Bantle, M.; Sæther, M.; Petrova, I. Study on Drying of Seaweeds and Importance of Glass Transition and Stabilization. Processes 2024, 12, 373. [Google Scholar] [CrossRef]
- López-Pérez, O.; Picon, A.; Nuñez, M. Volatile Compounds and Odour Characteristics of Seven Species of Dehydrated Edible Seaweeds. Food Res. Int. 2017, 99, 1002–1010. [Google Scholar] [CrossRef] [PubMed]
- Faqih, F.; Zayed, T. Defect-Based Building Condition Assessment. Build. Environ. 2021, 191, 107575. [Google Scholar] [CrossRef]
- Hikuma, M. Development of the Distribution Mechanism in the Processed Seafood Industry. J. Jpn. Soc. Distrib. Sci. 2018, 41, 33–46. (In Japanese) [Google Scholar] [CrossRef]
- Climate.Onebuilding.Org. Available online: https://climate.onebuilding.org/ (accessed on 5 September 2024).
- Barbosa, M.T.G.; Rosse, V.J.; Laurindo, N.G. Thermography Evaluation Strategy Proposal Due Moisture Damage on Building Facades. J. Build. Eng. 2021, 43, 102555. [Google Scholar] [CrossRef]
- Li, Z.; Jin, Y.; Liang, X.; Zeng, J. Thermography Evaluation of Defect Characteristics of Building Envelopes in Urban Villages in Guangzhou, China. Case Stud. Constr. Mater. 2022, 17, e01373. [Google Scholar] [CrossRef]
- Pereira, C.; De Brito, J.; Silvestre, J.D. Harmonising the Classification of Diagnosis Methods within a Global Building Inspection System: Proposed Methodology and Analysis of Fieldwork Data. Eng. Fail. Anal. 2020, 115, 104627. [Google Scholar] [CrossRef]
- Tetens, O. Über einige meteorologische Begriffe. Z. Geophys. 1930, 6, 297–309. [Google Scholar]
- Japan Meteorological Agency. Available online: https://www.jma.go.jp/jma/indexe.html (accessed on 6 September 2024).
- Ministry of Land, Infrastructure, Transport and Tourism (MLIT). Overview of the Energy Conservation Standards Revision; MLIT: Tokyo, Japan, 2016; Available online: https://www.mlit.go.jp/common/001012880.pdf (accessed on 20 August 2024). (In Japanese)
- Bastien, D.; Winther-Gaasvig, M. Influence of Driving Rain and Vapour Diffusion on the Hygrothermal Performance of a Hygroscopic and Permeable Building Envelope. Energy 2018, 164, 288–297. [Google Scholar] [CrossRef]
- Asadi, I.; Shafigh, P.; Abu Hassan, Z.F.B.; Mahyuddin, N.B. Thermal Conductivity of Concrete—A Review. J. Build. Eng. 2018, 20, 81–93. [Google Scholar] [CrossRef]
- Draganova, V.Y.; Yokose, H.; Tsuzuki, K.; Nabeshima, Y. Field Study on Nationality Differences in Adaptive Thermal Comfort of University Students in Dormitories during Summer in Japan. Atmosphere 2021, 12, 566. [Google Scholar] [CrossRef]
- Khoukhi, M.; Hassan, A.; Abdelbaqi, S. The Impact of Employing Insulation with Variant Thermal Conductivity on the Thermal Performance of Buildings in the Extremely Hot Climate. Case Stud. Therm. Eng. 2019, 16, 100562. [Google Scholar] [CrossRef]
- Zilberberg, E.; Trapper, P.; Meir, I.A.; Isaac, S. The Impact of Thermal Mass and Insulation of Building Structure on Energy Efficiency. Energy Build. 2021, 241, 110954. [Google Scholar] [CrossRef]
- Guo, L.; Liao, Y.; Cheng, Z.; Zheng, H.; Guo, L.; Long, E. Experimental Study on Dynamic Effect of External Insulation on Indoor Thermal Environment and Energy Consumption. Energy Build. 2022, 274, 112299. [Google Scholar] [CrossRef]
- Brambilla, A.; Sangiorgio, A. Mould Growth in Energy Efficient Buildings: Causes, Health Implications and Strategies to Mitigate the Risk. Renew. Sustain. Energy Rev. 2020, 132, 110093. [Google Scholar] [CrossRef]
- ASHRAE 62.1-2013; Ventilation for Acceptable Indoor Air Quality. American Society of Heating, Refrigerating and Air-Conditioning Engineers, Inc.: Atlanta, Georgia, 2013.
- United States Environmental Protection Agency. Mold Course Chapter 2. Available online: https://www.epa.gov/mold/mold-course-chapter-2 (accessed on 6 September 2024).
- Raunima, T.; Laukkarinen, A.; Kauppinen, A.; Kiviste, M.; Tuominen, E.; Ketko, J.; Vinha, J. Indoor Air Temperature and Relative Humidity Measurements in Finnish Schools and Day-Care Centres. Build. Environ. 2023, 246, 110969. [Google Scholar] [CrossRef]
- Ferrantelli, A.; Vornanen-Winqvist, C.; Mattila, M.; Salonen, H.; Kurnitski, J. Positive Pressure Effect on Moisture Performance in a School Building. J. Build. Phys. 2019, 43, 121–142. [Google Scholar] [CrossRef]
- Summa, S.; Remia, G.; Di Perna, C. Comparative and Sensitivity Analysis of Numerical Methods for the Discretization of Opaque Structures and Parameters of Glass Components for EN ISO 52016-1. Energies 2022, 15, 1030. [Google Scholar] [CrossRef]
- Jia, C.; Zhang, Z.; Wang, M.; Han, S.; Cao, J.; Rong, Y.; Du, C. Investigation on Indoor Thermal Environment of Industrial Heritage during the Cooling Season and Its Impacts on Thermal Comfort. Case Stud. Therm. Eng. 2023, 52, 103769. [Google Scholar] [CrossRef]
- Chae, Y.; Kim, S.H. Selection of Retrofit Measures for Reasonable Energy and Hygrothermal Performances of Modern Heritage Building under Dry Cold and Hot Humid Climate: A Case of Modern Heritage School in Korea. Case Stud. Therm. Eng. 2022, 36, 102243. [Google Scholar] [CrossRef]
- Bui, A.; Johnson, F.; Wasko, C. The Relationship of Atmospheric Air Temperature and Dew Point Temperature to Extreme Rainfall. Environ. Res. Lett. 2019, 14, 074025. [Google Scholar] [CrossRef]
- ISO 6946:2017; Building components and building elements—Thermal resistance and thermal transmittance—Calculation methods. ISO: Geneva, Switzerland, 2017. Available online: https://www.iso.org/standard/65708.html (accessed on 3 October 2024).
- Japanese Energy Conservation Law for Buildings, Section 3: Thermal Transmittance and Linear Thermal Transmittance. Available online: https://www.kenken.go.jp/becc/documents/house/3-3_240401_v22.pdf (accessed on 3 October 2024).


| Element | Thermal Transmittance (U-Value/Heat Transfer Coefficient) (W/m2·K) | Layer Composition (from Inner Side to Outer Side in the Zone) | Layer Thickness (mm) | Thermal Conductivity (λ) (W/(m·K)) |
|---|---|---|---|---|
| Roof | 3.70 | High flame retardant foam | 4 | 0.029 |
| Galvalume steel sheet | 0.6 | 45 | ||
| Wall | 0.59 | Calcium silicate board | 8 | 0.14 |
| Glass wool | 50 | 0.038 | ||
| Non-closed air layer | - | - | ||
| Polyethylene foam | 4 | 0.037 | ||
| Galvalume steel sheet | 0.5 | 45 | ||
| Floor 2 | 2.56 | Polyvinyl chloride flooring sheet | 2 | 0.19 |
| Concrete | 130 | 1.60 | ||
| Galvanized Steel Sheet | 1.2 | 45 | ||
| Floor 1 | 3.33 | Concrete | 180 | 1.60 |
| Roller Shutter | 6.67 | Steel sheet | 1.6 | 55 |
| Element | Type of Glass | Glass Layer Composition (Layer Thickness (mm)) | Glass Thermal Transmittance (W/(m2·K)) | Solar Heat Gain Coefficient | Window (Glass with Frame) Thermal Transmittance (W/(m2·K)) |
|---|---|---|---|---|---|
| W1 | Single-glazed glass | Single-glazed glass (4) | 6 | 0.88 | 6.3 |
| W2 | Double-glazed glass | Transparent glass (5) air gap (6) transparent glass (5) | 3.3 | 0.79 | 4.2 |
| Month | Mean Ta (°C) | Max Ta (°C) | Min Ta (°C) | Mean RH (%) | Max RH (%) | Min RH (%) |
|---|---|---|---|---|---|---|
| January | 6.02 | 15 | −4 | 70.91 | 100 | 36 |
| February | 7.68 | 20.3 | −2.9 | 68.04 | 95 | 27 |
| March | 9.78 | 23.2 | −1.7 | 70.91 | 100 | 36 |
| April | 15.55 | 27.8 | 2.9 | 75.00 | 100 | 28 |
| May | 20.04 | 30 | 7 | 66.95 | 100 | 26 |
| June | 23.47 | 33.8 | 13.9 | 78.52 | 99 | 38 |
| July | 27.26 | 35.6 | 21.1 | 80.27 | 100 | 46 |
| August | 27.92 | 34.7 | 20.9 | 74.97 | 99 | 40 |
| September | 24.95 | 33.5 | 15.5 | 69.59 | 93 | 30 |
| October | 19.72 | 28.6 | 8.8 | 69.24 | 98 | 30 |
| November | 13.03 | 22 | 3.6 | 71.55 | 100 | 36 |
| December | 8.23 | 18.5 | 0.9 | 71.57 | 96 | 37 |
| Measurement Parameter | Measurement Instrument | Range of Measurement | Accuracy | Measurement Resolution |
|---|---|---|---|---|
| Surface temperature | FLIR ONE Pro | −20 °C~400 °C | ±3 °C | 0.1 °C |
| Air temperature Air relative humidity | T&D TR-72nw | Ta: 0 to 55 °C RH: 10 to 95% RH | ±0.5 °C, ±5% RH at 25 °C, 50% RH | 0.1 °C 1% RH |
| Surface temperature | T&D TR-71A | −40 to 110 °C | Avg. ±0.3 °C at −20 to 80 °C | 0.1 °C |
| Date | Mean Ta (°C) | Max Ta (°C) | Min Ta (°C) | Mean RH (%) | Min RH (%) |
|---|---|---|---|---|---|
| 4 June 2021 | 20.8 | 23.5 | 19.2 | 97.0 | 88.0 |
| 26 January 2023 | 2.3 | 7.6 | −3.4 | 68 | 48 |
| Season | Ta,ex (°C) | Ta,in,1 (°C) | Ta,in,2 (°C) | ||||||||||||
|---|---|---|---|---|---|---|---|---|---|---|---|---|---|---|---|
| Mean | Median | σ | Min | Max | Mean | Median | σ | Min | Max | Mean | Median | σ | Min | Max | |
| Summer | 27.27 | 27.2 | 3.57 | 17.7 | 36.8 | 26.65 | 26.9 | 2.28 | 20.8 | 31 | 28.97 | 28.8 | 4.01 | 19.7 | 39.2 |
| Autumn | 20.99 | 22.3 | 6.97 | 4.4 | 34.7 | 22.46 | 24.3 | 4.7 | 12.6 | 29.7 | 22.13 | 22.9 | 6.65 | 7.5 | 35.8 |
| Winter | 7.73 | 7.6 | 3.84 | −2.1 | 19.9 | 9.38 | 9.2 | 2.29 | 3.4 | 15.3 | 9.15 | 8.8 | 3.51 | 1.1 | 22.9 |
| Spring | 17.59 | 18 | 5.41 | 1.7 | 30.9 | 17.01 | 17.5 | 3.94 | 5.4 | 23.9 | 18.84 | 19 | 5.22 | 3.8 | 32.1 |
| Season | RHex (%) | RHin,1 (%) | RHin,2 (%) | ||||||||||||
|---|---|---|---|---|---|---|---|---|---|---|---|---|---|---|---|
| 50–60 | 60–70 | 70–80 | 80–90 | 90–100 | 50–60 | 60–70 | 70–80 | 80–90 | 90–100 | 50–60 | 60–70 | 70–80 | 80–90 | 90–100 | |
| Summer | 13 | 16 | 21 | 25 | 19 | 9 | 19 | 40 | 30 | 2 | 18 | 22 | 27 | 13 | 5 |
| Autumn | 20 | 19 | 23 | 17 | 9 | 32 | 28 | 16 | 0 | 0 | 27 | 33 | 17 | 3 | 0 |
| Winter | 22 | 19 | 18 | 10 | 3 | 35 | 17 | 3 | 0 | 0 | 36 | 23 | 7 | 0 | 0 |
| Spring | 18 | 21 | 19 | 11 | 10 | 34 | 27 | 16 | 8 | 0 | 27 | 23 | 13 | 4 | 0 |
| Month | ΔAH1 (g/m3) | ΔAH2 (g/m3) | ||||||||||||
|---|---|---|---|---|---|---|---|---|---|---|---|---|---|---|
| >0 g/m3 | Min | 25% | 50% | 75% | Max | Mean | >0 g/m3 | Min | 25% | 50% | 75% | Max | Mean | |
| (% of Time) | (% of Time) | |||||||||||||
| June | 54 | −3.78 | −0.42 | 0.06 | 0.43 | 3.95 | 0.05 | 48 | −8.00 | −0.70 | −0.03 | 0.50 | 4.84 | −0.05 |
| July | 9 | −5.09 | −1.66 | −1.08 | −0.56 | 3.52 | −1.13 | 14 | −10.39 | −1.70 | −1.03 | −0.33 | 3.98 | −1.07 |
| August | 6 | −5.15 | −1.78 | −1.25 | −0.78 | 3.69 | −1.28 | 14 | −10.17 | −1.72 | −1.08 | −0.46 | 3.95 | −1.15 |
| September | 8 | −5.31 | −1.71 | −1.16 | −0.63 | 1.86 | −1.18 | 17 | −8.68 | −1.74 | −0.98 | −0.29 | 3.69 | −1.05 |
| October | 8 | −4.39 | −1.28 | −0.74 | −0.38 | 1.68 | −0.86 | 23 | −9.79 | −1.21 | −0.56 | −0.05 | 3.14 | −0.68 |
| November | 8 | −3.11 | −1.05 | −0.64 | −0.29 | 2.75 | −0.70 | 24 | −3.97 | −0.95 | −0.48 | −0.01 | 3.43 | −0.49 |
| December | 25 | −2.74 | −0.54 | −0.28 | −0.01 | 1.32 | −0.32 | 39 | −2.88 | −0.55 | −0.21 | 0.30 | 2.03 | −0.17 |
| January | 24 | −2.62 | −0.40 | −0.20 | 0.00 | 1.25 | −0.28 | 37 | −3.21 | −0.45 | −0.14 | 0.19 | 2.28 | −0.21 |
| February | 42 | −1.77 | −0.35 | −0.07 | 0.17 | 1.81 | −0.12 | 49 | −2.98 | −0.49 | −0.03 | 0.41 | 2.39 | −0.09 |
| March | 23 | −6.74 | −0.99 | −0.47 | −0.03 | 4.51 | −0.66 | 29 | −3.85 | −0.98 | −0.45 | 0.14 | 4.25 | −0.48 |
| April | 20 | −4.77 | −1.42 | −0.59 | −0.11 | 3.45 | −0.79 | 27 | −4.15 | −1.41 | −0.60 | 0.07 | 3.54 | −0.65 |
| May | 17 | −5.05 | −1.36 | −0.73 | −0.25 | 4.79 | −0.76 | 24 | −4.81 | −1.46 | −0.71 | −0.02 | 4.93 | −0.69 |
Disclaimer/Publisher’s Note: The statements, opinions and data contained in all publications are solely those of the individual author(s) and contributor(s) and not of MDPI and/or the editor(s). MDPI and/or the editor(s) disclaim responsibility for any injury to people or property resulting from any ideas, methods, instructions or products referred to in the content. |
© 2024 by the authors. Licensee MDPI, Basel, Switzerland. This article is an open access article distributed under the terms and conditions of the Creative Commons Attribution (CC BY) license (https://creativecommons.org/licenses/by/4.0/).
Share and Cite
Xu, Y.; Fukuda, H.; Wei, X.; Yin, T. Envelope Deficiencies and Thermo-Hygrometric Challenges in Warehouse-Type Buildings in Subtropical Climates: A Case Study of a Nori Distribution Center. Energies 2024, 17, 5192. https://doi.org/10.3390/en17205192
Xu Y, Fukuda H, Wei X, Yin T. Envelope Deficiencies and Thermo-Hygrometric Challenges in Warehouse-Type Buildings in Subtropical Climates: A Case Study of a Nori Distribution Center. Energies. 2024; 17(20):5192. https://doi.org/10.3390/en17205192
Chicago/Turabian StyleXu, Yue, Hiroatsu Fukuda, Xindong Wei, and Tingting Yin. 2024. "Envelope Deficiencies and Thermo-Hygrometric Challenges in Warehouse-Type Buildings in Subtropical Climates: A Case Study of a Nori Distribution Center" Energies 17, no. 20: 5192. https://doi.org/10.3390/en17205192
APA StyleXu, Y., Fukuda, H., Wei, X., & Yin, T. (2024). Envelope Deficiencies and Thermo-Hygrometric Challenges in Warehouse-Type Buildings in Subtropical Climates: A Case Study of a Nori Distribution Center. Energies, 17(20), 5192. https://doi.org/10.3390/en17205192