Article

Neutronics Analysis on High-Temperature Gas-Cooled Pebble Bed Reactors by Coupling Monte Carlo Method and Discrete Element Method

Department of Mechanical and Nuclear Engineering, Virginia Commonwealth University, Richmond, VA 23284, USA
*
Author to whom correspondence should be addressed.
Energies 2024, 17(20), 5188; https://doi.org/10.3390/en17205188
Submission received: 1 October 2024 / Revised: 13 October 2024 / Accepted: 16 October 2024 / Published: 18 October 2024

Abstract

:
The High-Temperature Gas-Cooled Pebble Bed Reactor (HTG-PBR) is notable in the advanced reactor realm for its online refueling capabilities and inherent safety features. However, the multiphysics coupling nature of HTG-PBR, involving neutronic analysis, pebble flow movement, and thermo-fluid dynamics, creates significant challenges for its development, optimization, and safety analysis. This study focuses on the high-fidelity neutronic modelling and analysis of HTG-PBR with an emphasis on achieving an equilibrium state of the reactor for long-term operations. Computational approaches are developed to perform high-fidelity neutronics analysis by coupling the superior modelling capacities of the Monte Carlo Method (MCM) and Discrete Element Method (DEM). The MCM-based code OpenMC and the DEM-based code LIGGGHTS are employed to simulate the neutron transport and pebble movement phenomena in the reactor, respectively. To improve the computational efficiency to expedite the equilibrium core search process, the reactor core is discretized by grouping pebbles in axial and radial directions with the incorporation of the pebble position information from DEM simulations. The OpenMC model is modified to integrate fuel circulation and fresh fuel loading. All of these measures ultimately contribute to a successful generation of an equilibrium core for HTG-PBR. For demonstration, X-energy’s Xe-100 reactor—a 165 MW thermal power HTG-PBR—is used as the model reactor in this study. Starting with a reactor core loaded with all fresh pebbles, the equilibrium core search process indicates the continuous loading of fresh fuel is required to sustain the reactor operation after 1000 days of fuel depletion with depleted fuel circulation. Additionally, the model predicts 213 fresh pebbles are needed to add to the top layer of the reactor to ensure the keff does not reduce below the assumed reactivity limit of 1.01.

1. Introduction

The High-Temperature Gas-Cooled Pebble Bed Reactor (HTG-PBR) is an emerging outstanding advanced reactor technology among the Gen-IV reactors [1]. The HTG-PBR is primarily notable for its high thermal efficiency and inherent safety features [2,3]. Unlike the traditional reactors like Light Water Reactors (LWRs), the HTG-PBR uses hundreds of thousands of spherical fuel pebbles, each containing thousands of TRi-structural ISOtropic (TRISO) fuel particles. These particles are designed to withstand very high temperatures of up to 1600 °C and prevent the release of radioactive fission products [2,4]. The HTG-PBR is gaining significant attention globally as a promising advanced nuclear reactor design, renowned for its high thermal efficiency and inherent safety features. Several countries, including Germany, South Africa, and China, past or present have been at the forefront of HTG-PBR development, with China achieving notable milestones through its HTR-PM project [5], which is the world’s first commercial-scale demonstration of this technology [2]. The Xe-100 reactor is one of the most advanced HTG-PBR designs currently under development by X-energy in the United States [2,6]. The Xe-100 is a modular, high-temperature gas-cooled reactor that utilizes TRISO fuel and is designed to deliver 200 MW of thermal energy or 80 MW of electrical power per module. Its design emphasizes flexibility, safety, and efficiency, making it a strong candidate for near-term deployment [2]. Given its advanced design and ongoing development, the Xe-100 is selected as the model reactor for the present analysis, offering a representative case for the study of neutronic behavior and fuel management in the HTG-PBR.
Among the many distinguishing features of HTG-PBR, the most prominent one is probably that the fuel is not stationary during reactor operation. Instead, the fuel pebbles continuously circulate through the reactor core from top to bottom axially until each pebble reaches its design burnup limit. During each circulation cycle, the fuel content within the pebbles is evaluated. Depending on fissile material abundance or specific burnup value, a pebble is either reinserted into the reactor or removed. Variations in fuel content occur in each pebble due to differences in speed, position, and circulation path. Therefore, detailed analysis with a high-fidelity HTG-PBR model is needed for fuel cycle performance, future development, and anticipated operational occurrences that embrace neutronic analysis, depletion, pebble circulation, and fresh fuel loading.
A variety of computer codes have been developed for the neutronic analysis of HTG-PBR using both deterministic and stochastic approaches. Despite the global development of many new codes, deterministic approach-based codes like VSOP [7] and PEBBED [8] remain the most commonly used and respected for equilibrium state calculations for HTG-PBR in industries. These codes are multigroup diffusion theory-based codes, though they differ in their algorithms and numerical methods. However, the use of TRISO fuel particles in pebbles introduces a double-heterogeneity effect on the neutronics, making neutron cross-section generation challenging for deterministic codes. The stochastic Monte Carlo Methods (MCM) can naturally handle this double heterogeneity and manage the complex geometries of advanced reactor systems, making them ideal for detailed PBR core analyses [3,9]. Nevertheless, due to their high computational time requirements, MCM have only become practical in recent years. For instance, an MCM-based burnup analysis code for HTG-PBR (referred to as MCPBR), developed by Setiadipura and Obara [10], can perform calculations for HTG-PBR with a once-through-then-out fueling scheme. Similarly, a three-dimensional full-core analysis methodology using the MCM-based MCNP code [11] has been developed for simulating HTG-PBR with multi-pass fueling schemes by Fratoni and Greenspan [12]. To examine the burnup and isotopic composition of an equilibrium core during the run-in process of the pebble bed reactor, Wu et al. [13] developed a layer-to-layer method for moving pebbles through the reactor core, achieving a keff of approximately 1.0 in the process. This approach involved shifting pebbles downward through five axial layers, with fresh fuel loaded at the top and depleted pebbles removed from the bottom.
Our earlier work on HTG-PBR analysis [3] proposed a computationally efficient method by splitting the reactor core axially and radially to analyze the equilibrium state of the reactor with a multi-fuel region model or run-in process. Rather than explicitly moving pebbles and loading fresh fuel at each pass, the average burnup of the reactor core is adjusted and a feasible burnup model is determined based on a parabolic velocity profile. This method did not explicitly account for the precise number of fresh pebbles loaded, and the burnup was adjusted in regions in accordance with the effective multiplication factor of the reactor (i.e., the keff value) corresponding to a certain threshold. Very recently, Stewart et al. [14] proposed a different approach for the run-in phase investigation of the equilibrium state of HTG-PBR, focusing on the grouping of pebbles. The explicit circulation and tracking of the pebbles was realized with the Python script module kugelpy. In their investigation, Stewart replaces 50% of the pebbles from these groups when they meet two conditions: reaching a specific burnup or completing two passes through the reactor during the run-in scenario. In contrast, Robert et al. [15] performed a hyper-fidelity analysis in this regard by analyzing the burnup of each pebble individually, precluding the group analysis approach used by others. However, the computational cost of the neutronic analysis of each fuel pebble is very high in these investigations.
On the other hand, the accurate modeling of fuel pebble loading and circulations in the HTG-PBR is paramount for evaluating the equilibrium state of the reactor core over long durations. The literature suggests a number of different methodologies for pebble loading, whereas the lack of a quantitative or smooth loading of fresh pebbles is always a limitation in this aspect. Furthermore, modeling the pebble granular movement during pebble circulation in HTG-PBR is even more challenging due to the dense quasi-static granular flow, which usually involves numerous interactions and non-thermal forces. Despite these challenges, advancements in research have led to various plausible mathematical methodologies for pebble flow, including the Continuum Approach [16,17], the Void Model [18], the Spot Model [19], and the Discrete Element Method (DEM) [20]. However, a universally accepted theoretical model has yet to emerge. Among these approaches, DEM is generally considered more suitable and adaptable for modeling dense pebble moving flow in HTG-PBR. In 2012, Jiang et al. [21] compared DEM simulations of pebble flow within a pebble bed reactor with experimental results and found good qualitative agreement between them. Reger et al. [22,23] used the DEM Project Chrono code [24] to compare pebble packing and velocity profiles, achieving strong agreement with experimental data. Reger et al. [22] also used Jiang et al.’s [21] experimental data on pebble flow for their analysis of velocity profiles.
In the present work, an MCM and DEM coupled approach is developed to achieve an equilibrium state for HTG-PBR by smoothly and quantitatively loading fresh pebbles during circulation and evaluating the equilibrium reactor core for long-term operation. Utilizing the MCM-based code OpenMC [25] and employing the DEM-based code LIGGGHTS [26] for pebble loading, an equilibrium core search process for the Xe-100 reactor is performed by incorporating strategies for multi-pass burned fuel circulation and fresh fuel loading. In the course of achieving an equilibrium state for the pebble bed reactor, a different approach from earlier work is implemented, which basically introduced an arbitrary burnup feeding method as the keff reduces to the critical limit [3]. In the present study, fresh fuel is loaded into the reactor core by applying the first principle of mass conservation law to ensure the consistency of fuel nuclides and their associated actinides. The developed OpenMC core model has the capability of multi-pass fuel circulation and fresh fuel loading. It enables the analysis of the equilibrium state of the Xe-100 reactor and assists in optimizing the Xe-100 reactor.
The remainder of the paper is organized as follows: Section 2 gives an overview of the X-energy’s Xe-100 reactor, which is considered as an exemplified HTG-PBR model in the study. Section 3 describes the computational modeling approach and methodology employed in the work. Section 4 reports the results generated from the analysis of the model reactor, including some forehand code verification efforts on MCM and DEM, respectively. The last section, Section 5, offers some concluding remarks and future perspectives on the present work

2. Overview of the Xe-100 Reactor

2.1. Xe-100 Reactor

The Xe-100 reactor is a graphite-moderated, pebble bed reactor with a thermal power output of 165 MW, utilizing TRISO-coated low-enriched uranium oxycarbide (UCO) fuel [2,27,28]. This reactor features several advanced safety and operational characteristics, including a negative temperature coefficient of reactivity that automatically stops the nuclear chain reaction in the event of unintentional core heat-up [2]. The reactivity control system (RCS) and reactivity shutdown systems (RSSs), located within side reflectors, manage reactivity control and cold shutdown effectively. Additionally, the reactor can remove residual heat through thermal conduction, radiation, and natural convection, with a reactor cooling system protecting the reactor structure during operation and upset conditions [28]. The Xe-100 design also includes a moderation ratio that minimizes reactivity increase due to steam ingress, maintaining safety margins. The reactor core, with a designed low average power density (<4 W/cm3), employs a single-zone core with a sinusoidal power profile. Fuel pebbles, each loaded with about 7 g of low-enriched uranium, pass through the core approximately six times during their service life, ensuring efficient fuel use and enhanced safety [2].
Figure 1 illustrates the schematics of the Xe-100 reactor model used in this study. The entire core of the Xe-100 reactor has a hopper-like shape with a maximum diameter of 2.4 m and a minimum chute diameter of 0.52 m. The active core’s height is approximately 11 m, accommodating over 200,000 pebbles. Different colors in Figure 1 indicate the different major materials/components used in the reactor. The sky blue color represents the graphite, while the dark color represents the helium gas flowing through the core. The fuel pebbles are shown with scattered points arbitrarily distributed in the core region. In addition, the reactor model incorporates two types of control rods within a 1.24 m thick graphite reflector surrounding the reactor core: the reactivity control system (RCS) and the reserve shutdown system (RSS). The RCS features a maximum insertion length of 660 cm, while the RSS has a maximum insertion length of 860 cm. Both types of control rods have a diameter of 13 cm and comprise annular B4C compact that is 8 mm in thickness and stacked within Incoloy 800H canisters. The canisters possess an inner radius of 41.5 mm, an inner wall thickness of 0.5 mm, and an outer wall thickness of 2.5 mm. The control rod borings are situated within the reflector, approximately 10 cm away from the active core. During the simulation, unfilled regions of RCS and RSS bores are filled with helium gas. During reactor operation, helium gas passes through the porosity of the packed pebble bed and transfers heat energy to the thermal power plant for electricity generation. Some researchers in the literature have proposed an efficient utilization of waste heat from the gases for electricity generation using a thermoelectric energy conversion device [29].

2.2. Fuel Characteristics

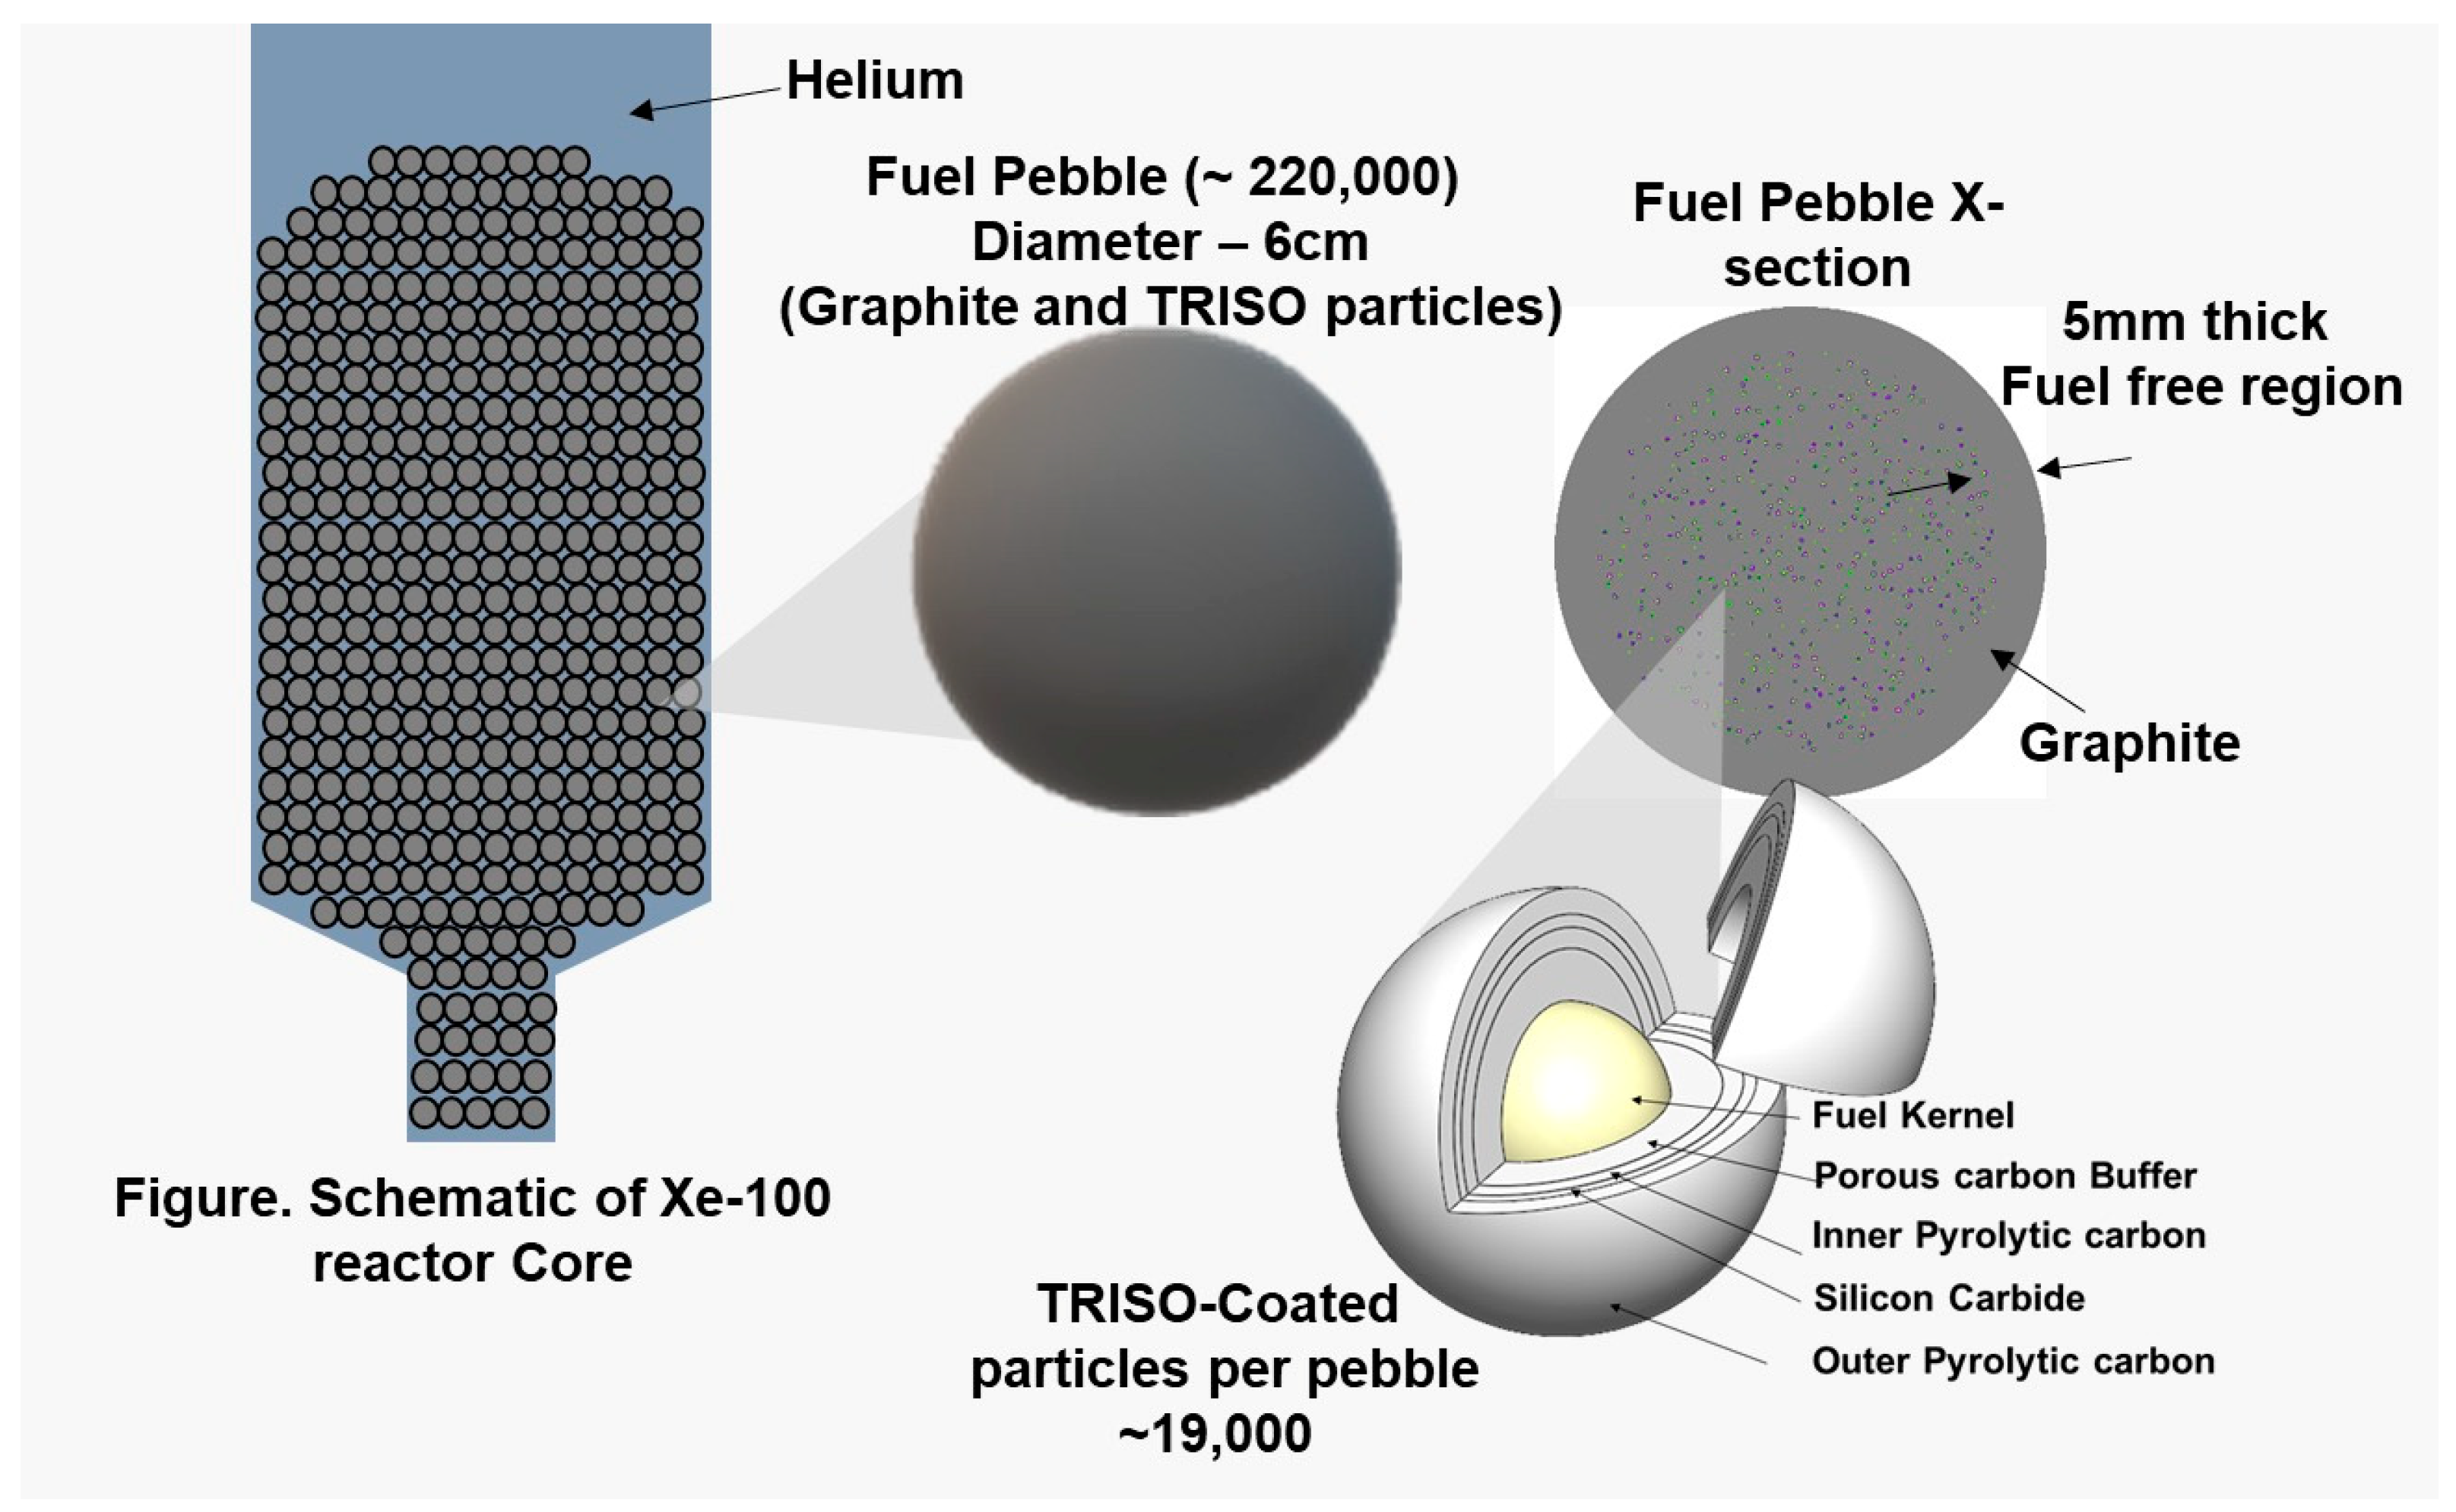
The Xe-100 reactor core is designed to accommodate ~220,000 fuel pebbles, and each fuel pebble contains approximately 19,000 TRISO-coated particles kernelled with UCO fuel. Figure 2 gives a schematic view of the Xe-100 reactor core, fuel pebble, and TRISO-coated particle. A standard fuel pebble in Xe-100 has a diameter of 6 cm with a 0.5 cm thickness non-fuel shell (see Figure 2). These TRISO-coated particles provide robust containment that protects the fuel kernel through multiple protective layers. These layers are designed to withstand high temperatures, prevent the release of radioactive fission products, and ensure the integrity of the fuel under various operating conditions. The specifications of the TRISO-coated particle, including the thickness of each protective layer, are detailed in Table 1.

2.3. Equilibrium State of HTG-PBR

An equilibrium state of a nuclear reactor is a critical operational condition where the reactor reaches a quasi-static state, at which key reactor performance characteristics such as neutron flux, fuel burnup, and flux distribution stabilize and remain unchanged. It typically also results in a critical status with keff = 1. Achieving this equilibrium state of a reactor is essential for consistent and predictable reactor performance, which is crucial for reactor safety analyses and licensing calculations [2,3]. However, compared to traditional reactors like LWRs, achieving an equilibrium state with an HTG-PBR is far more challenging largely due to the online refueling strategy and the continuous movement of fuel pebbles. During the initial operation, when a single batch of fresh fuel pebbles is loaded into the core, the HTG-PBR may reach a supercritical state (keff > 1). Therefore, a run-in phase with a mix of fuel pebbles and graphite (non-fuel) pebbles is often conducted and used to facilitate the reactor transition towards the equilibrium state more smoothly [9,14]. Stewart et al. [14] compared two equilibrium core realization scenarios: the “jump-in” scenario, where the reactor is started with a single load of fresh fuel, and the “run-in” scenario, where graphite pebbles are mixed with fuel pebbles. The results indicated that after approximately 3000 days, the keff value in both scenarios converged to the same value. In the present study, a scenario is considered that starts with a single type of fuel, which seems to fall into the ‘jump-in’ scenario described above. But, unlike the work by Stewart et al. [14], which replaced burned pebbles in groups after their second pass or upon reaching maximum burnup, the present study employs a partial replacement of burned group pebbles based on the keff value. In this way, one is allowed to maintain the equilibrium state while optimizing reactor operation. The details of this approach is described in Section 3.4.

3. Computational Modelling Approaches

The equilibrium core of an HTG-PBR can be achieved through a multiphysics coupled computational framework that utilizes advanced modelling techniques to account for each unique physics process involved in the HTG-PBR. The MCM-based OpenMC code is essential for neutronic analysis, predicting the overall neutron behavior by tracking interaction histories of each individual neutron in the reactor core. To accurately represent the physical positioning and interactions of the fuel pebbles, the DEM-based LIGGGHTS code is employed to model pebble dynamic effects, including contact, gravity, and friction forces. Unlike most of the former work where pebble positions are assumed to be orderly packed, the present approach accounts for the realistic random packing of pebbles [30]. The random pebble positions obtained by DEM are exported to the neutronics model for more precise neutronic analysis. Similar to most neutronics work, the fuel depletion calculation is still handled directly within OpenMC, where the Bateman equation is integrally solved alongside the neutronic analysis, ensuring an accurate and seamless calculation of changing isotopic compositions at each burnup state.

3.1. MCM for Neutronics Simulations

The MCM for solving the neutron transport problems differs from the deterministic method in that it does not directly attack the transport equation itself. Its significant advantage lies in its avoidance of computational errors due to mathematics model approximation in geometry and physics. Instead, it simulates the movement of individual neutrons interacting with nuclei by leveraging probability distributions governing the neutron transport in a medium. By simulating a large number of particles, MCM can effectively mimic physical experiments. The average behavior of the quantities of interest (i.e., the mean value) with MCM can be estimated with associated statistical errors, which are governed by the Central Limit Theorem as shown in Equation (1)
σ 2 1 N .
The theorem indicates the statistical error (i.e., the variance σ 2 ) of the estimated mean parameter is inversely proportional to the number of simulated neutrons (N).
In this work, the MCM-based open-source code OpenMC [25] is used to simulate neutron transport phenomena in HTG-PBR. OpenMC is being developed by the Computational Reactor Physics Group at the Massachusetts Institute of Technology. Since the time of its inception, OpenMC has been a dedicated MCM-based neutron transport simulation code with a focus on neutron criticality calculations. OpenMC is a Python-based library designed for neutron transport simulations using Monte Carlo methods. The modeling strategy involves first defining the materials (such as fuel, moderator, and coolant), followed by specifying the geometry of components like TRISO particles, pebbles, and the reactor. Boundary conditions are also set during the geometry definition to control neutron behavior at the model’s edges. Finally, simulation settings, including neutron sources and tallies, are configured. OpenMC has be used for modelling and analyzing a variety of nuclear reactors including LWRs and advanced reactors. More details about the modelling features and capabilities of the OpenMC code can be found in Refs. [25,31].
The OpenMC code can estimate the keff value of the reactor in an equilibrium state by tracking neutron histories inside the reactor core. Prior to modelling the reactor using OpenMC for neutronics simulations, necessary reactor specifications such as geometry, materials, settings, tallies, and other variables are required. These needed parameters for the Xe-100 reactor model are described in Section 2. The neutronics calculations performed in this study used the ENDF/B-VII.1 neutron cross-sections library, which provides multipole formatted nuclear data spanning a wide range of temperature from 250 K to 1200 K. For nuclear data at other specific temperatures, OpenMC utilizes the interpolation or nearest method to map the cross-sections library data.

3.2. DEM for Pebble Movement

Most of the previous HTG-PBR investigations, such as the work shown in Refs. [2,12,13], assume orderly packed pebbles with constant porosity throughout. In the present work, approaches that mimic the more realistic scenario of randomly packed pebbles in the Xe-100 reactor are considered. DEM [20] is employed to track the arbitrary positions of individual pebbles during their granular slow movement within the reactor vessel. DEM is a dedicated computational technique designed to model the motion of individual particles by applying the principle of Newton’s second law of motion (note: in the case of HTB-PBR, pebbles are treated as particles in DEM). Each particle in DEM is subject to various forces, including gravity force, contact forces (from particle–particle and particle–wall interactions), and other external forces such as friction and cohesion [26]. While DEM is highly effective for simulating granular materials and powders, the computational cost can be high, especially when simulating millions of particles. To improve the computational efficiency of DEM, various optimized and parallelized open-source as well as commercial DEM-based codes have been developed in both CPU and GPU platforms. Examples among them include LIGGGHTS [26], StarCCM+ [32], Project Chrono [24], and so on.
In this work, the open-source DEM code LIGGGHTS is used [26] to track the positions of the granular moving pebbles inside the Xe-100 reactor. The computational domain of the DEM is determined by the reactor vessel wall boundary, which is imported to DEM through an STL-formatted file. During the DEM simulation, realistic pebble positions are determined by considering various forces in the reactor core such as gravity force ( F G ), pebble–wall contact forces ( F p w c ), and pebble–pebble contact forces ( F p p c ). The Gran Hertz model is employed to calculate the contact forces, while the Elastic-Plastic Spring Dashpot model is used to simulate the interaction between pebbles. Detailed descriptions of these forces and models can be found in Ref. [26]. The positions of the pebbles obtained from DEM simulation are exported to OpenMC using an in-house Python (version 3) script. OpenMC uses these positions to place fuel pebbles within the reactor vessel with the help of the OpenMC built-in function openmc.model.TRISO. Figure 3 illustrates the execution and communication between the DEM code LIGGGHTS and MCM code OpenMC during the pebble placement procedure.

3.3. Fuel Depletion Model

The OpenMC package includes a built-in function called openmc.deplete that assesses material decay and transmutation by solving the Bateman equation [33,34], which can be simplified and expressed as
d N i ( t ) d t = λ i 1 N i 1 ( t ) λ i N i ( t ) ,
where N i is the   i th nuclide concentration. λ i is the decay coefficient of the material. The decay and transmutation of the nuclides contribute to the heat energy in the reactor core. The openmc.deplete() class is intensively use in the depletion calculations of the present work.
In this work, the fuel burnup effect in the reactor is measured by %FIMA (Fissions per Initial heavy Metal Atom). The %FIMA burnup provides a standard metric for evaluating the efficiency and performance of nuclear fuel in reactors [34]. It is literally given by
% FIMA = N U 235 , i + N U 238 , i N U 235 , f N U 238 , f N A c t , f N U 235 , i + N U 238 , i ,
where N U 235 and N U 238 are the numbers of Uranium-235 and Uranium-238 nuclides, respectively, and subscripts i and f stand for the initial and final status in the burnup, respectively. N A c t is the number of all other actinides, including Uranium-236, Plutonium isotopes (Pu-238, Pu-239, Pu-240, Pu-241, and Pu-242), Neptunium-237, Americium-241, Curium isotopes (Cm-242, Cm-243, and Cm-244), and so on. The %FIMA burnup measures the fraction of initial fissile atoms that have undergone fission, providing a direct assessment of how much of the original fuel has been consumed. The %FIMA burnup also considers contributions from the breeding and subsequent fission of other actinides like Pu-239, which are produced during reactor operation. This inclusive approach ensures that %FIMA burnup accurately reflects the overall fission activity within the fuel, making it comparable to burnup values obtained through mass spectrometry. Furthermore, the %FIMA burnup remains consistent and reliable even in high burnup scenarios where the neutron spectrum and actinide composition change significantly, thereby providing a robust metric for fuel management and reactor operation analysis [35].

3.4. Equilibrium Core Search Process

The equilibrium state of a reactor ensures the safe and efficient operation of the reactor for a long period. The OpenMC neutronics code can be used to generate an equilibrium state for a reactor by evaluating the keff value through an equilibrium core search process. Previously, it has been suggested that the keff value of the Xe-100 reactor with single fuel pebbles reaches 1.38023 with 10 pcm (per cent mille) deviation [3]. Therefore, researchers proposed using a mixture of fuel pebbles initially (fuel pebbles and non-fuel pebbles) to facilitate the equilibrium core search process. For the long-term operation of Xe-100, maintaining a balance of the core average fuel burnup along with the fuel circulation and loading is essential for the equilibrium state operation. As the fuel burns, the reactor naturally moves towards a subcritical state, where the neutron population decreases, reducing the reactor’s power output. To counteract this effect, fresh fuel pebbles are continuously loaded and depleted pebbles are continuously discharged. During the equilibrium core search process, fuel depletion simulations track changes in isotopic composition, and fresh fuel loading is managed to reach and sustain the critical state of the reactor. This average burnup balance is essential for maintaining the stable reactivity that guarantees consistent power output and overall reactor safety.
In pebble bed reactors like the Xe-100 reactor, the depletion of fuel within the pebbles is highly dependent on their position within the active reactor core. However, the computational cost of tracking and evaluating the neutronic behavior and fuel depletion for each individual pebble is high. To mitigate the computational burden and enable an efficient equilibrium core search process for Xe-100 without a significant loss of the modeling fidelity, the reactor core is discretized into subregions in both axial and radial directions, considering uniform fuel properties within each subregion. The subregion is simply a group of pebbles. This approach simplifies the analysis while maintaining accuracy. The fuel circulation and loading processes are modeled based on the pebble grouping approach, which essentially greatly reduces the computational cost and enables an efficient equilibrium core generation. The following subsections elaborate the modeling details on fuel pebble grouping, circulation, and loading during the Xe-100 equilibrium core search process.

3.4.1. Pebble Grouping

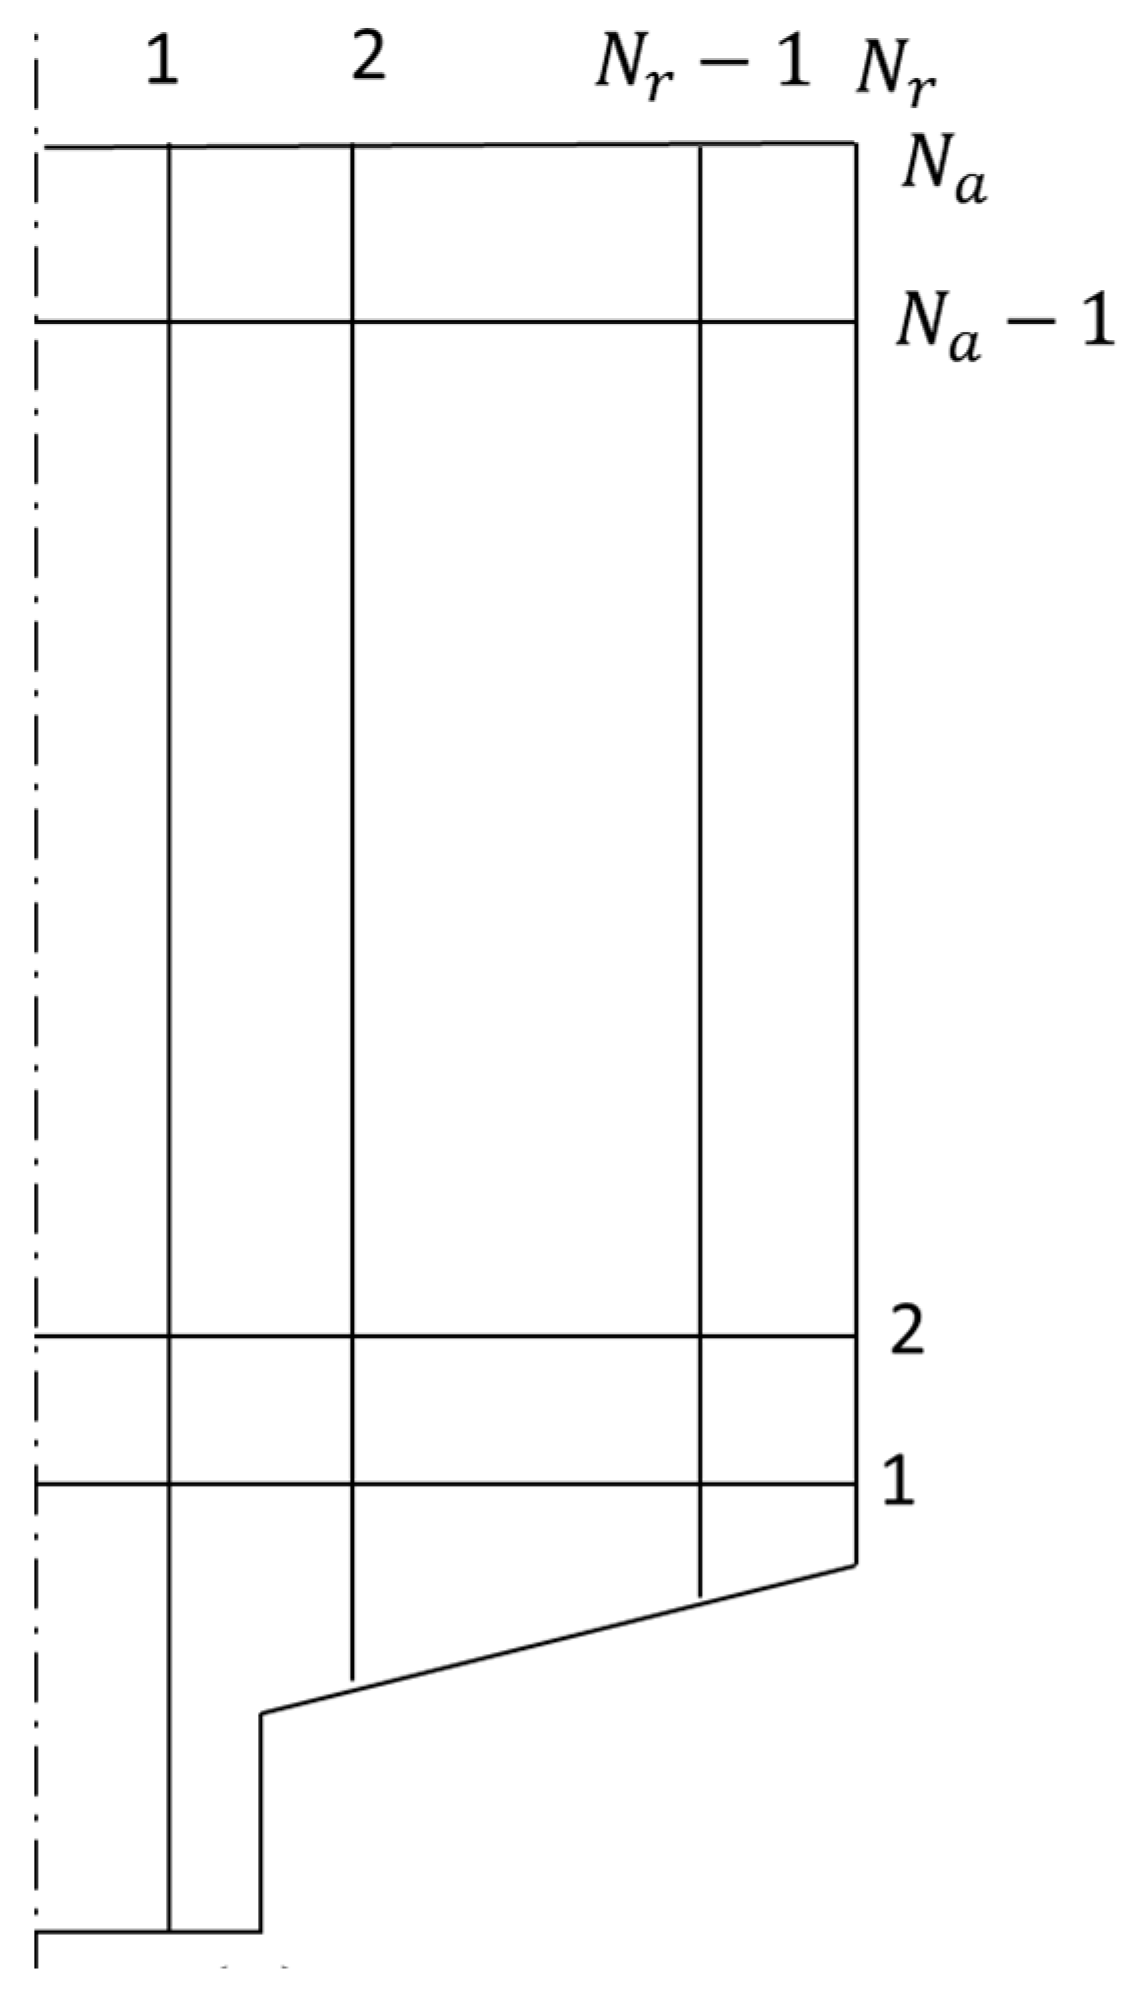
In the present study, the Xe-100 reactor core is divided into subregions in both the axial and radial directions. The size of the subregion is determined with a rule of placing an equal number of grouped pebbles in the subregion. The division of subregions for pebble grouping is carried out as follows. First, the reactor core is divided axially with an equal number of pebbles in each axial region, letting the total number of axial regions be Na. Then, each axial region is further divided radially with an equal number of grouped pebbles in the radial direction, letting the total number of radial regions be Nr. As a result, the total number of subregions for the core is N a × N r . The pebble grouping procedure ensures each subregion contains the same number of pebbles. Figure 4 illustrates a two-dimensional (2D) view of the axial and radial subregion divisions after the pebble grouping procedure.
It is noteworthy that the size of each subregion is not necessary uniform in order to ensure pebble number equality for each subregion, particularly for the subregions close to the cone and chute portion of the Xe-100 core (see Figure 1). It is also envisoned that when the total number of subregions increases, the computational cost also increases. After all, the pebble grouping procedure is essentially the first step required for the Xe-100 equilibrium core search because it enhances the efficiency of the following neutronics analysis, which demands fuel pebble circulation and loading.

3.4.2. Fuel Circulation Modeling

During the operation of Xe-100, the pebbles gradually move downward through the reactor core. Thus, the circulation of fuel pebbles within the reactor core using OpenMC involves moving the entire axial region towards the subsequent bottom axial region. To realize this in a manageable manner, one assumption is made that all pebbles in one radial subregion move to the subsequent radial subregion with no mixing of pebbles between radial or axial regions. To effectively incorporate the fuel circulation in the OpenMC model, one unique Fuel ID (FD) is assigned to each fuel while the region (RG) and subregion (SR) positions are fixed in the reactor core. The fuel circulation process is modeled into uniformly separated time steps. At each time step, the unique FD of the fuel in each SR is updated to reflect the movement of pebbles from one subregion to another, effectively circulating the fuel throughout the core. Figure 5 illustrate the fuel circulation process in OpenMC from the time step t to the next time step t + Δt, where Δt is the time interval between the two time steps. It is also the time step used to count the fuel burnup variations in the process.
It is noted that the region and subregion IDs shown in Figure 5 are provided only to explain the modeling approach. In practice, OpenMC assigns a unique FD to the fuel pebbles within each subregion. For example, as shown in Figure 5, the subregion SR-0 is initially assigned with a unique fuel FD-0, and subregion SR-1 is assigned a unique fuel FD-1. After a specified time interval, the unique FD-0 fuel may move to the subregion SR-6, and the unique FD-1 fuel may move to SR-7. This process is consistently applied to all subregions, ensuring the systematic circulation of all of the fuel pebbles.
The total number of time steps needed for the fuel circulation is determined based on the total number of pebble passes in the realistic Xe-100 operation as well as the number of axial regions (i.e., the N a value) used in the simulation. One satisfactory criterion for the selected time step is to ensure the entire axial region moves downward after each time step during the equilibrium core search. This criterion ensures a systematic and efficient circulation of fuel, maintaining consistent reactor operation.

3.4.3. Fresh Fuel Loading Modeling

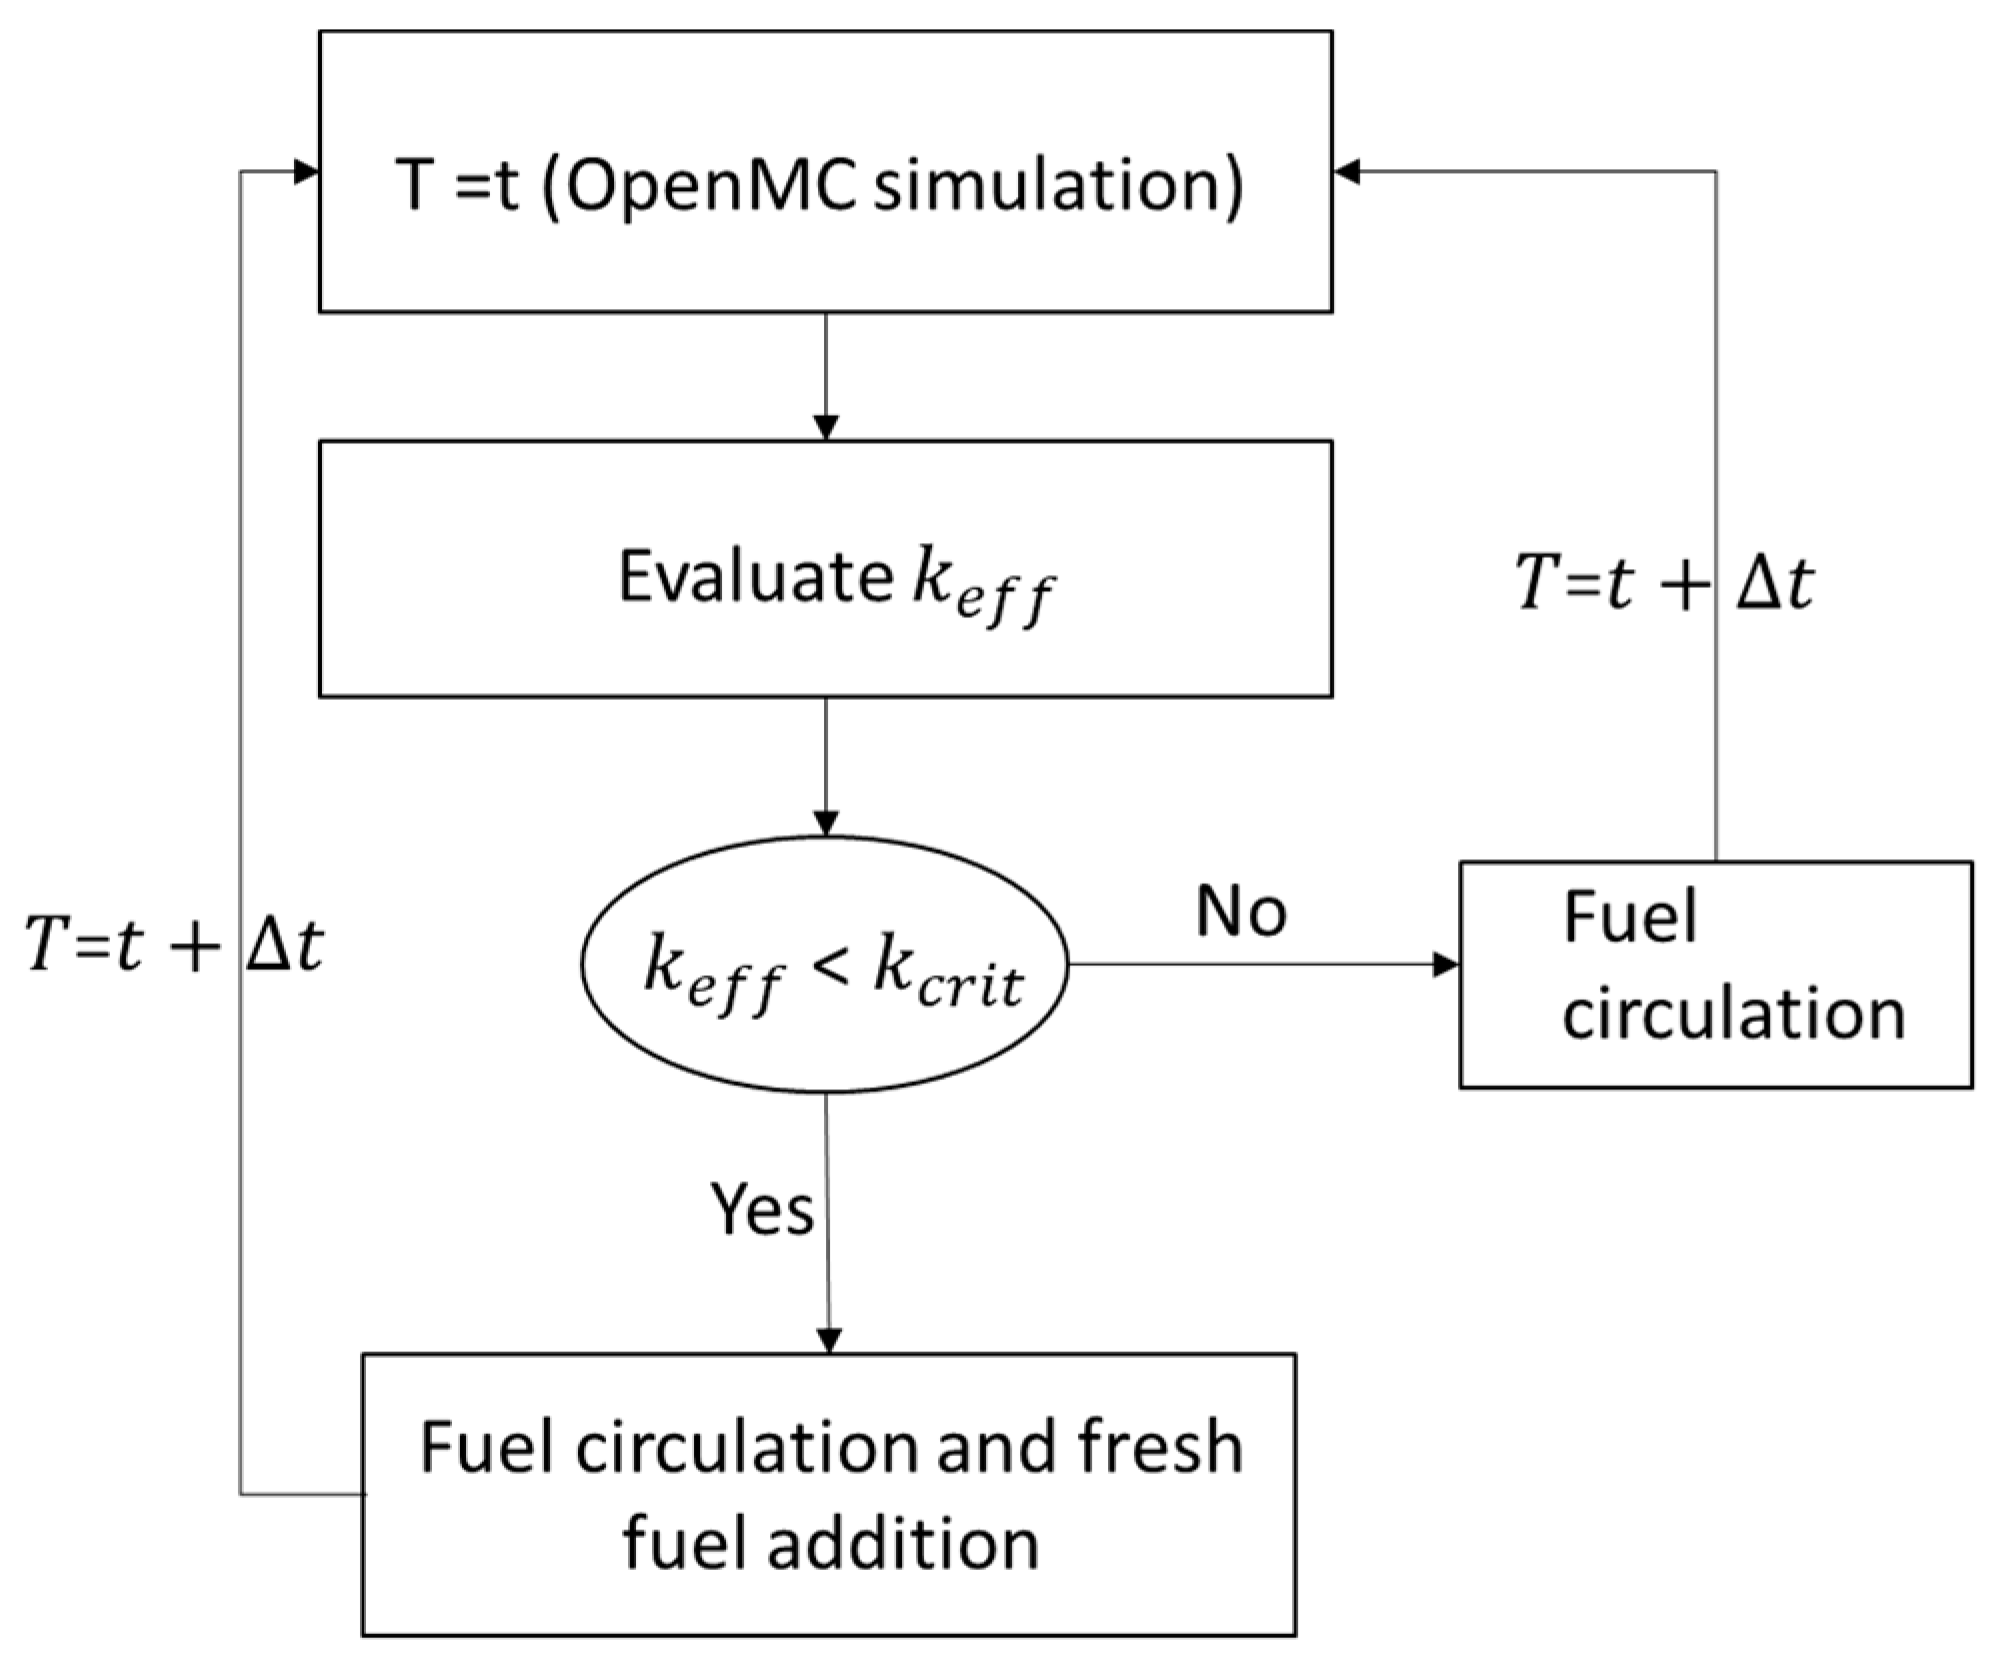
In practice, a number of fresh fuel pebbles are continuously loaded into the Xe-100 reactor to compensate for the fuel burnup and fuel circulation out of the core. In the simulation of the equilibrium core search process, fresh fuel is introduced during the search steps when the keff value of the reactor decreases to one prescribed reactivity limit (referred to as kcrit thereafter). Figure 6 shows the detailed procedure of fuel circulation and fresh fuel loading in the process.
The fresh fuel pebbles are loaded into the reactor core from the top regions, resulting in a partial pebble replacement for the top region. Since the model used in the simulation is not capable of replacing part of the pebbles in the region, the following approximations based on the principles of mass and nuclide conservations are introduced to count for the partial pebble replacement in the top regions. Since the top region is partially replaced with fresh fuel, the average fissile fuel content in the top region is increased. The mass conservation is applied to create a ‘new’ fuel for the region by updating the mass of all nuclides contained in the fuel. The updating scheme can be expressed as
F U r , N a = ( 1 b ) F P r , N a + b F F r , N a ,
where F U r , N a represents the fuel updated for the top axial region (subscript N a ) and radial subregion (subscript r), F P r , N a is the average of the previous pebbles’ atom fraction in subregion ( r , N a ) , F F r , N a is the average of the fresh pebbles’ atom fraction in subregion ( r , N a ) , and b is the fraction of fresh pebbles loaded into the subregion calculated by
b = N f N r , N a ,
where N r , N a is the number of pebbles in the subregion ( r , N a ) and N f is the number of fresh fuel pebbles loaded into the subregion ( r , N a ) . The actual number of pebbles to be replaced in a certain subregion is determined by the DEM simulation, which mimics the pebble mitigation process in both the axial and radial directions after the pebble is loaded or circulated back to the reactor during operation.

4. Results and Discussion

The present study begins with a static Xe-100 reactor analysis using the MCM-based OpenMC code. The pebble positions in the static core are rendered via the DEM-based LIGGGHTS code modeling as explained in Section 3.2. The static core calculations are then followed with a full core depletion analysis without considerations for the burnt fuel pebble circulation and fresh fuel pebble loading. The neutronics behavior of the core is demonstrated by the keff values at various burn states. Based on the static core analysis, an equilibrium state of the Xe-100 core is generated by taking into account the gradually depleted fuel circulation and fresh fuel loading. The equilibrium core is analyzed to examine the behavior of long-term operations of the reactor. Prior to the Xe-100 reactor analysis, preliminary code verification efforts were carried out to check the applicability of the OpenMC and LIGGGHTS code to neutronics and pebble movement simulations, respectively.

4.1. MCM Verification—Single Pebble Neutronics

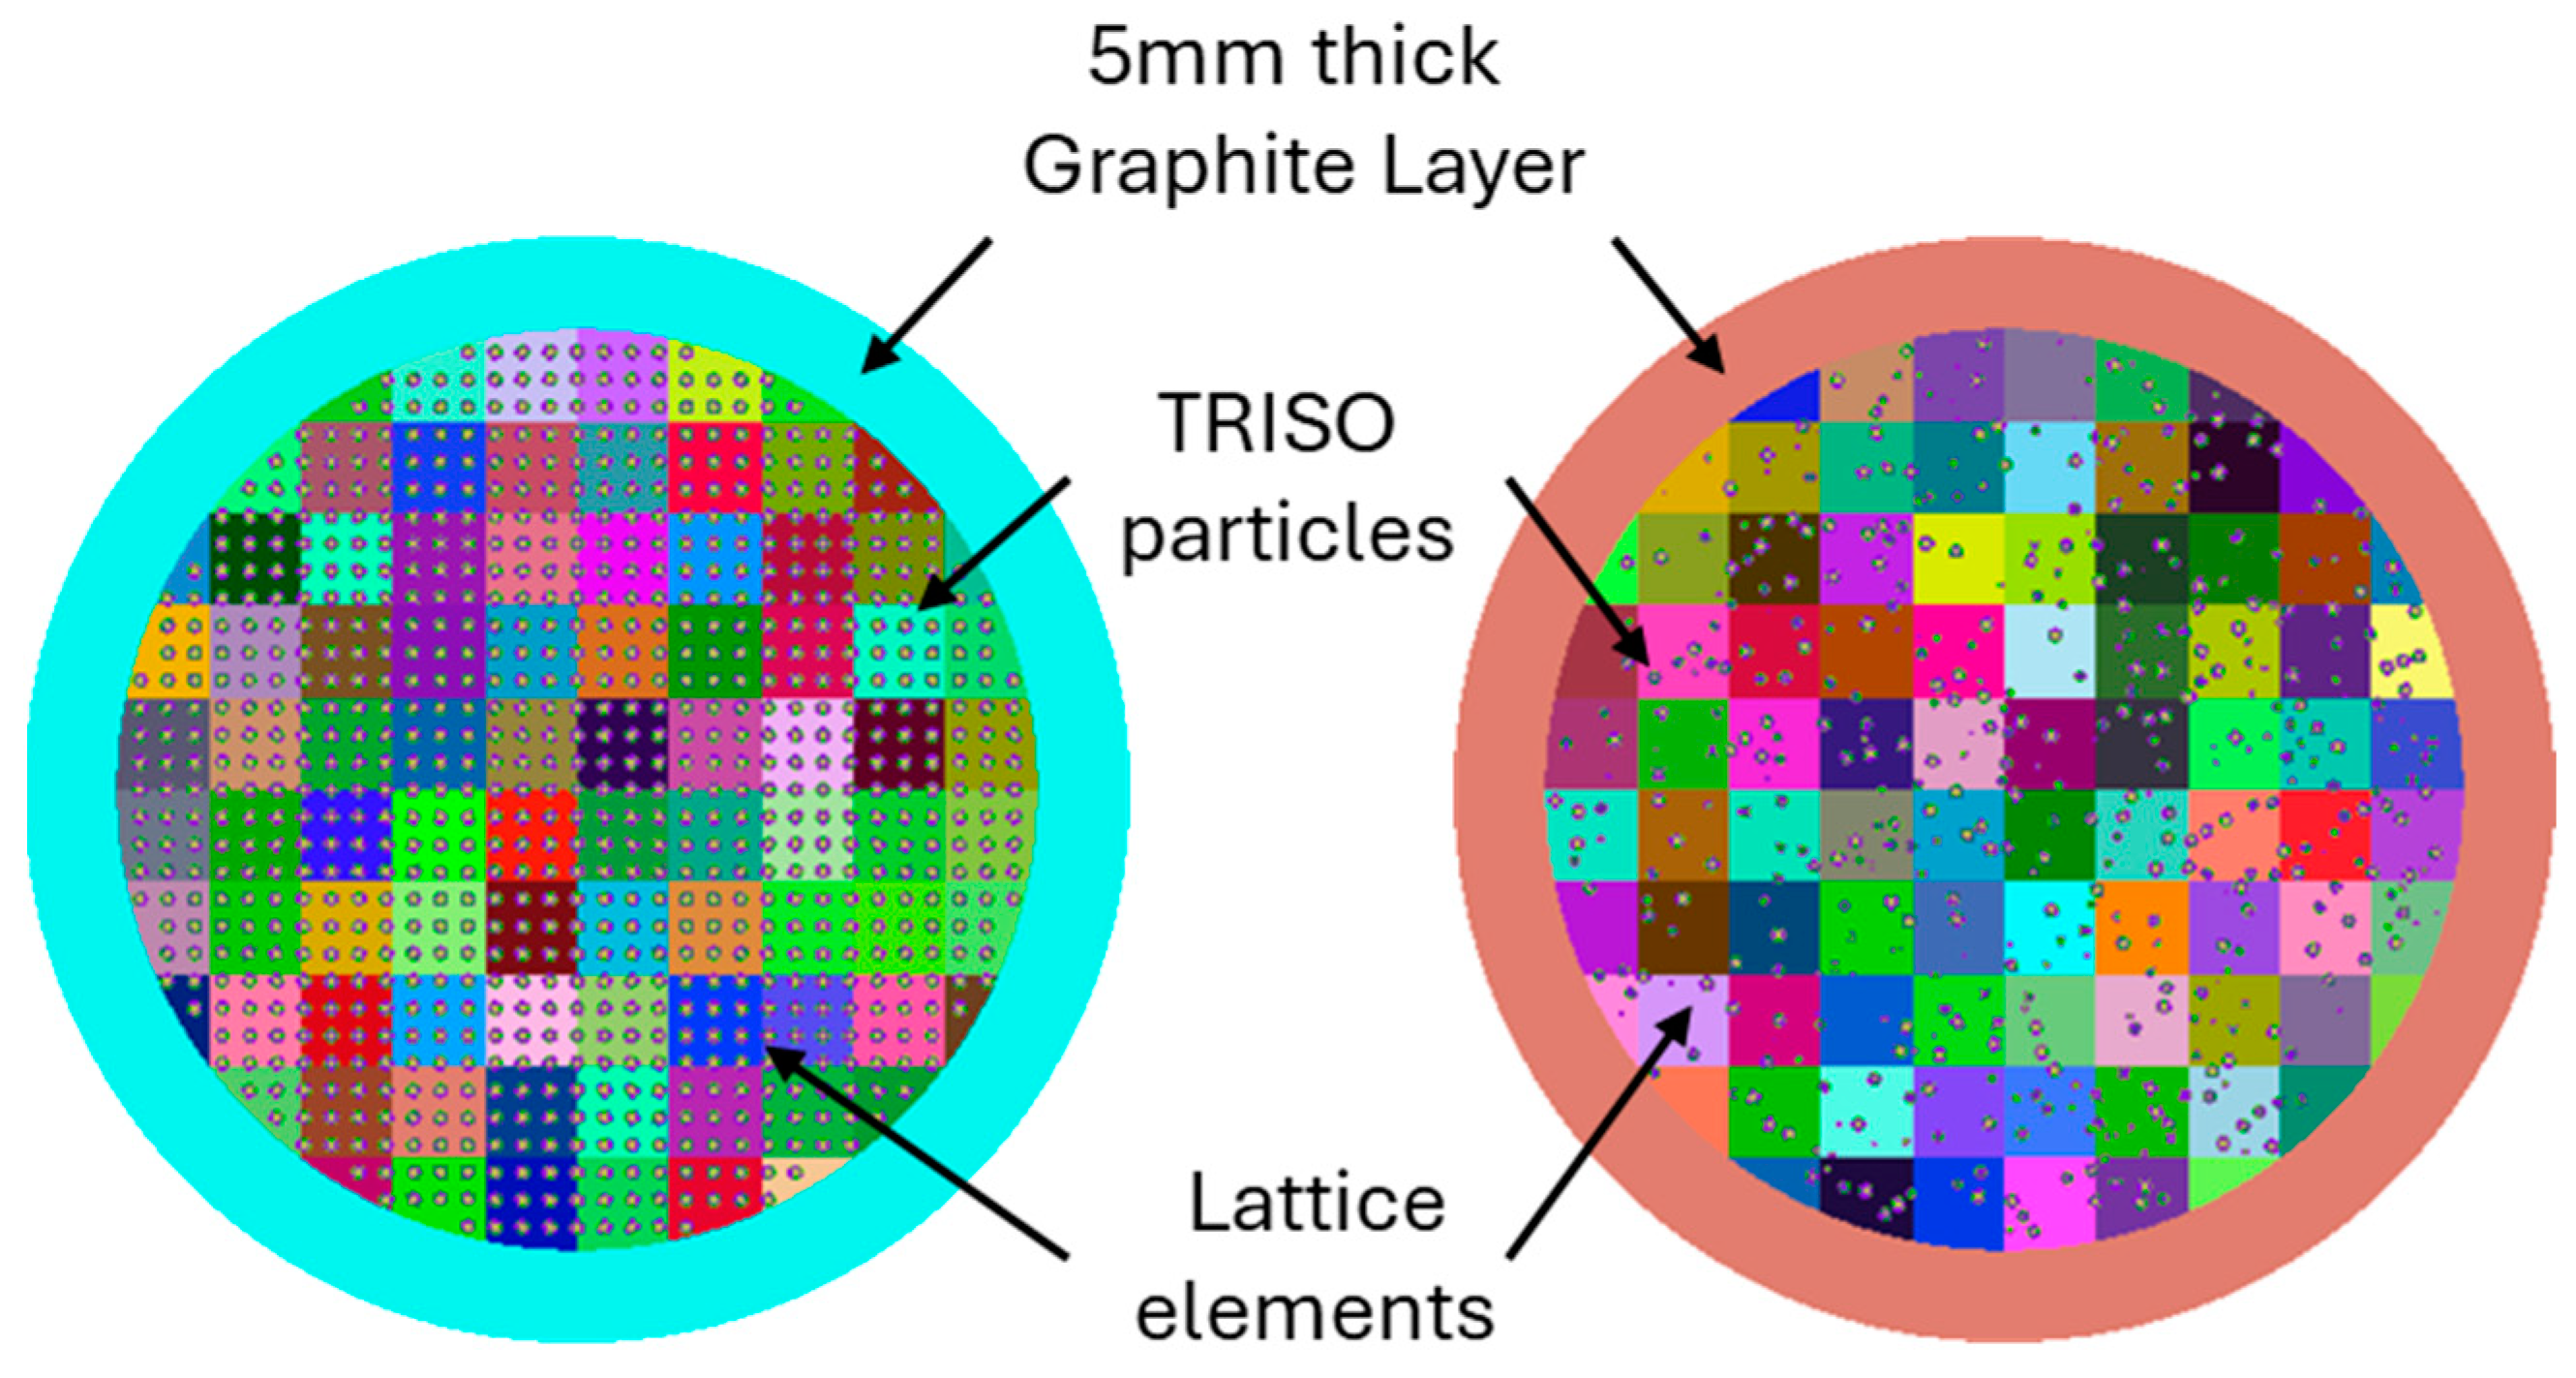
For the purpose of verifying the MCM-based code OpenMC, neutronics analysis results for a single fuel pebble are compared with those obtained from the MCNP code [11], which is a well-recognized MCM-based neutronics analysis code developed by Los Alamos National Laboratory. Figure 7 gives a 2D view of the fuel pebble model generated by OpenMC. The dimensional sizes of the typical fuel pebble in the Xe-100 reactor are used here and the key characteristic parameters of the TRISO fuel particle can be found in Table 1.
As shown in Figure 7, two distinct TRISO particle distribution patterns, uniform dispersion and random dispersion, are analyzed in the study. The uniform distribution of TRISO-coated particles is achieved by generating a cubic mesh within the spherical pebble. Each cubic cell center is considered as a TRISO particle position by verifying that it lies within the pebble’s radius. For the random TRISO particle distribution pattern, the OpenMC built-in function openmc.model.pack_spheres is used to randomly place particles inside the pebble. Small blocks of different colors within the pebble represent a superimposed lattice structure used by OpenMC to provide a significant reduction in computation time required for simulations. OpenMC generates a virtual lattice within the physical model and maps the positions of TRISOs to specific lattice points, thereby reducing the required search space [5]. As a result, the computational domain of a single pebble was divided into a 10 × 10 × 10 lattice in OpenMC (see Figure 7). As mentioned earlier in Section 3.1, the ENDF/B-VII.1 cross-section library was used in OpenMC calculations. Cross-sections of materials at both room temperature (293.62 K) and a peak temperature of 1200 K are considered. For the MCNP simulations, the ZAID.83c and ZAID.80c cross-section in the same ENDF/B libraries were utilized for the two different temperatures of 293.62 K and 1200 K, respectively.
The leakage of neutrons is prevented by applying the reflective boundary condition at the outer surface of the pebble, thus only the infinite multiplication factor result (i.e., the k value) is produced in this verification study. Two types of reflective boundaries referred to as white and mirror reflective boundary conditions (BCs), as described in the literature [4], were considered. The kcode mode simulation was conducted in both codes, starting with a point neutron source specified within the pebble. For each eigenvalue search batch, 50,000 neutron particles were generated, with a total of 1000 batches being considered, including 10 inactive ones. In this comparative study, the standard deviation for k values was maintained at or below 0.00010 (i.e., ~10 pcm) for both MCM codes. The final k values of the single pebble models with uniform and random TRISO particle distributions are summarized in Table 2 and Table 3 for the room temperature and 1200 K conditions, respectively.
Table 2 presents a comparison of the k values of the pebble for uniform and random distributions of TRISO-coated particles at room temperature under both white and mirror boundary conditions. The results show that there is a difference in the k value of slightly over 0.007 in all cases when comparing white and mirror boundary conditions. Specifically, the k value tends to be lower under white boundary conditions than that under mirror reflective conditions. This discrepancy may be explained with a higher number of neutrons remaining within the outer pebble shell after isotropic reflection in white conditions. As a result, mirror conditions may reflect more neutrons back toward the fuel region or the center of the pebble. A similar trend is observed for the cases with a temperature of 1200 K, as shown in Table 3, where the k value under mirror reflective boundary conditions is consistently approximately 0.009 higher than that under white reflective conditions.
On the other hand, the comparative analysis of the results from both MCNP and OpenMC codes reveals that nearly negligible differences exist in k values for all cases. However, even for the uniform particle distribution case, where TRISO particle positions are identical in both MCNP and OpenMC, minor deviations in k values are still observed. This deviation is consistent with the findings of Raflis et al. [36], in which the researchers conducted a similar study on a fuel assembly for a modular gas-cooled fast reactor using both MCNP and OpenMC. Additionally, temperature may significantly affect the k value in neutronics evaluation. All of these results confirmed that the neutronics models and calculations performed under OpenMC are acceptable for the further analysis of HTG-PBR.

4.2. DEM Validation—Pebble Bed Packing

As part of the code verification effort, the experimental and simulation data reported in Reger et al. [23] was used to verify the DEM modeling by LIGGGHTS code. The experimental setup consisted of a 139.7 mm diameter poly methyl methacrylate (PMMA) column packed with 31.75-mm-diameter PMMA spheres, providing a bed aspect ratio of 4.4. A detailed description of the pebble bed test experiment can be found in Ref. [23].
According to the main specifications of the experiment for a cylindrical vessel with an aspect ratio of 7.33, our DEM model predicts 789 pebbles sequentially dropped into the reactor, which exactly matches the number of pebbles loaded in the experiment. As reported by experimental data on packed beds in Ref. [23], the average porosity (ε) was found to be in the range of 0.4111 < ε < 0.4213. The average porosity of the packed bed was calculated using the LIGGGHTS DEM code. The resulting porosity of our DEM model is approximately 0.417, which falls within experimental uncertainty and closely matches the porosity value of 0.413 as estimated by the computational model in Ref. [23]. All of these results preliminarily justify the validity of using the LIGGGHTS DEM code for the pebble bed reactor modeling.

4.3. Static Xe-100 Reactor Core Analysis

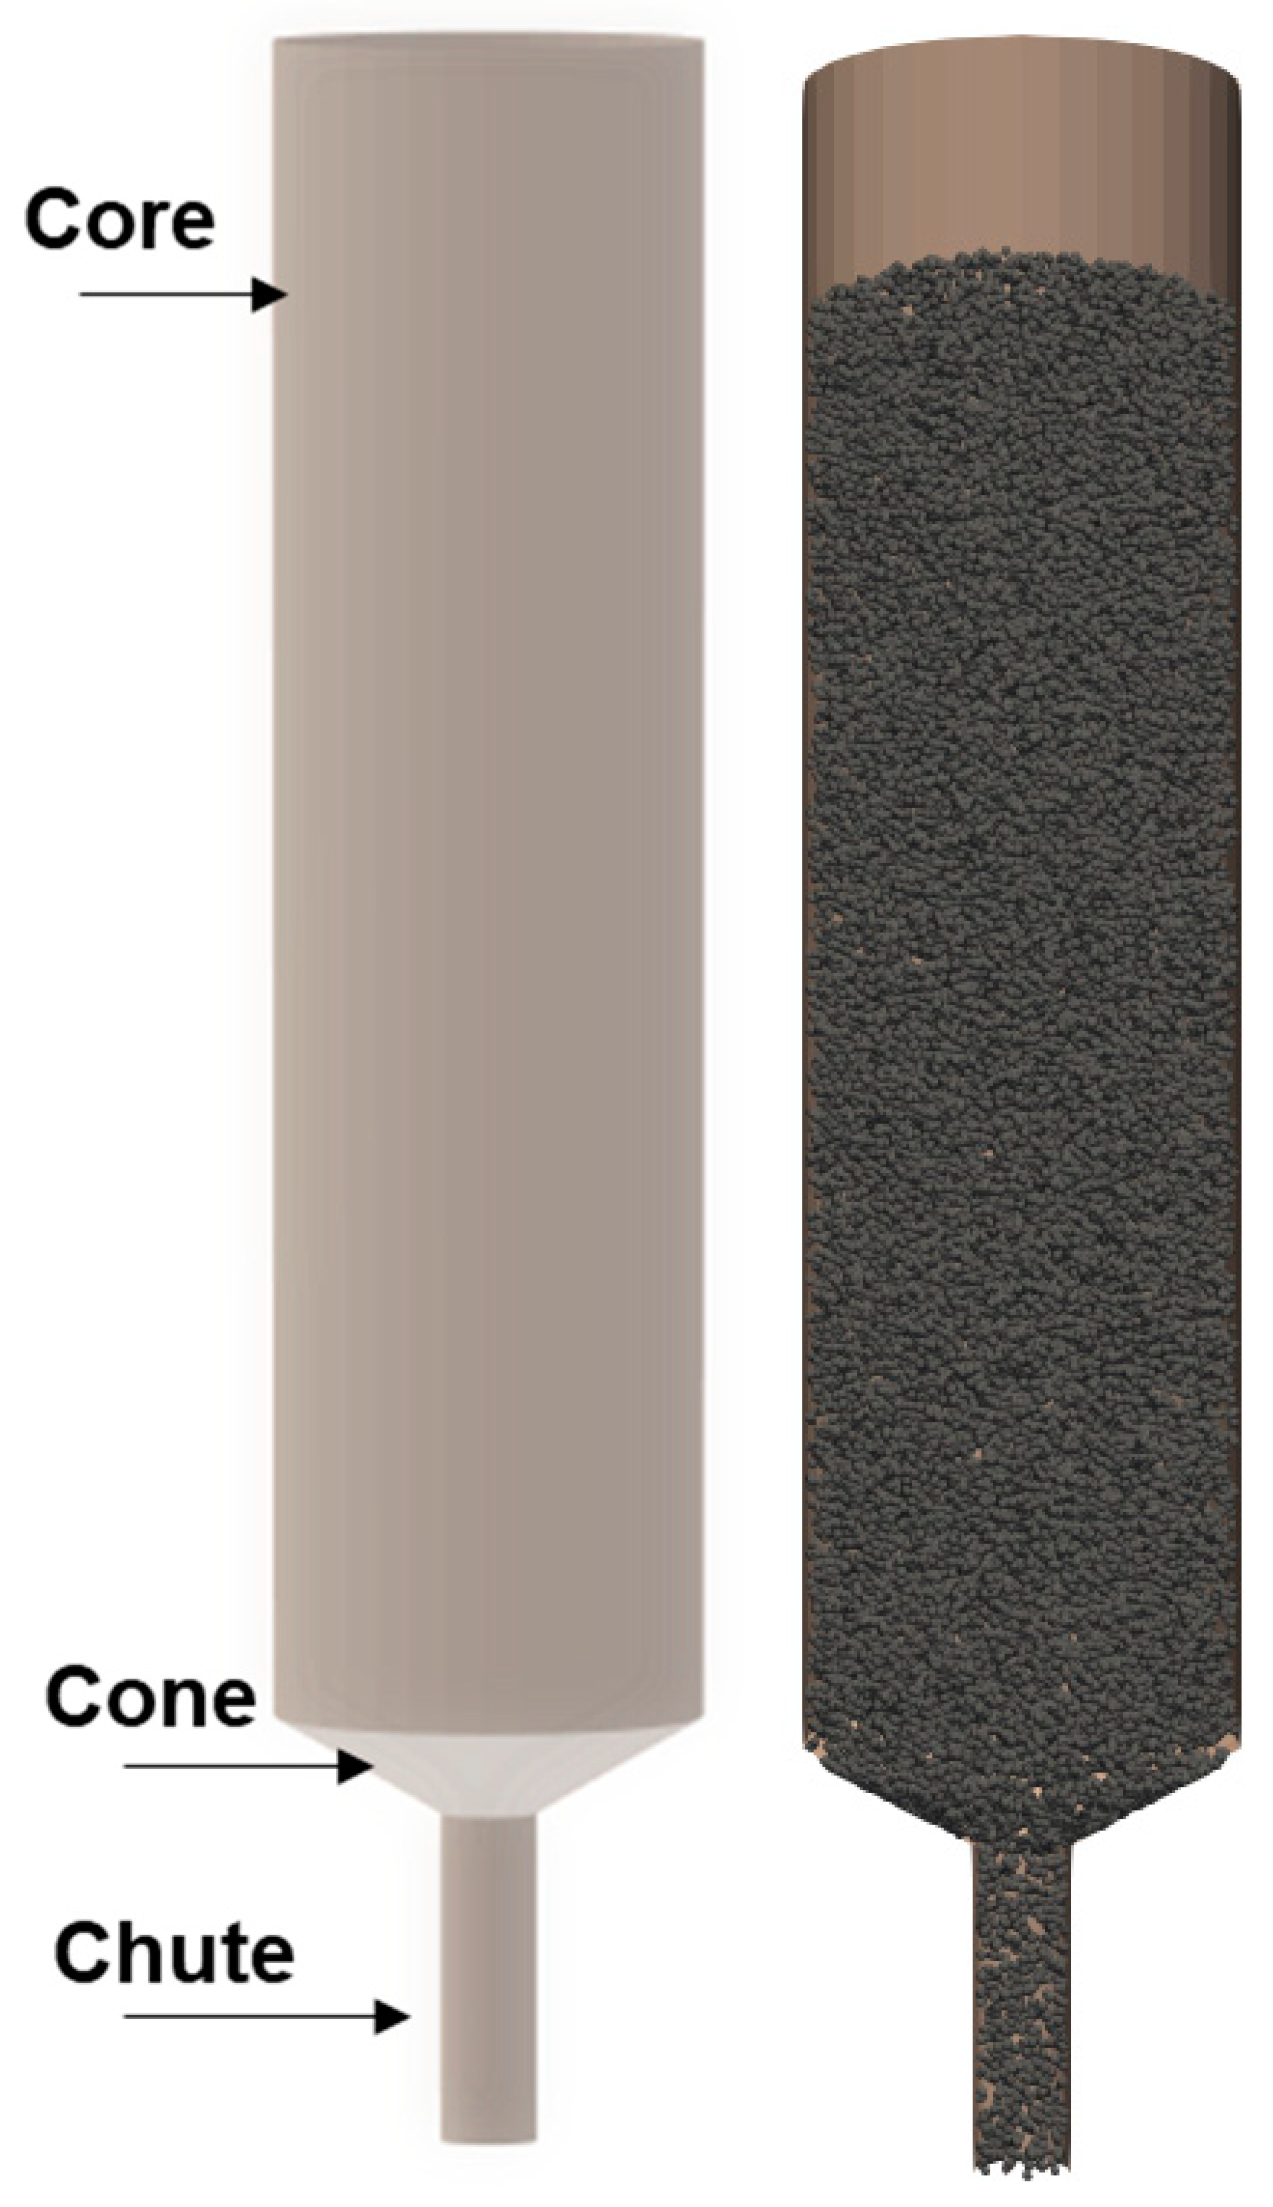
To enable the neutronic analysis of a static Xe-100 reactor core, the LIGGGHTS DEM code is used to load the pebbles of a single fuel type into the Xe-100 reactor vessel. The left part in Figure 8 shows a CAD model of Xe-100 reactor walls, which are exported into the DEM model to act as the wall boundary with packed pebbles between these walls as shown on the right part of Figure 8.
To realize the static core configuration, fuel pebbles are initially loaded from the top of the core using the LIGGGHTS code with a velocity of 5 m/s, which is the speed suggested by the work in Ref. [17] for pebble bed loading. The outlet from the chute is considered closed during the initial loading, and the core is fully filled with a total of 220,848 pebbles within an assumed time of 105 s. An additional settling time of ~10 s is allocated. During the pebble-loading procedure, the DEM code incorporates pebble–wall and pebble–pebble interactions, rolling friction, and gravitational forces.
After the reactor vessel is fully loaded with pebbles, the DEM code attains the positions of each pebble. These positions are then exported to the OpenMC code. In OpenMC, the material composition of pebbles and the enclosing TRISO-coated particles at each position are located. The OpenMC code is then executed to analyze the neutronic behavior after setting the source definition and boundary conditions.
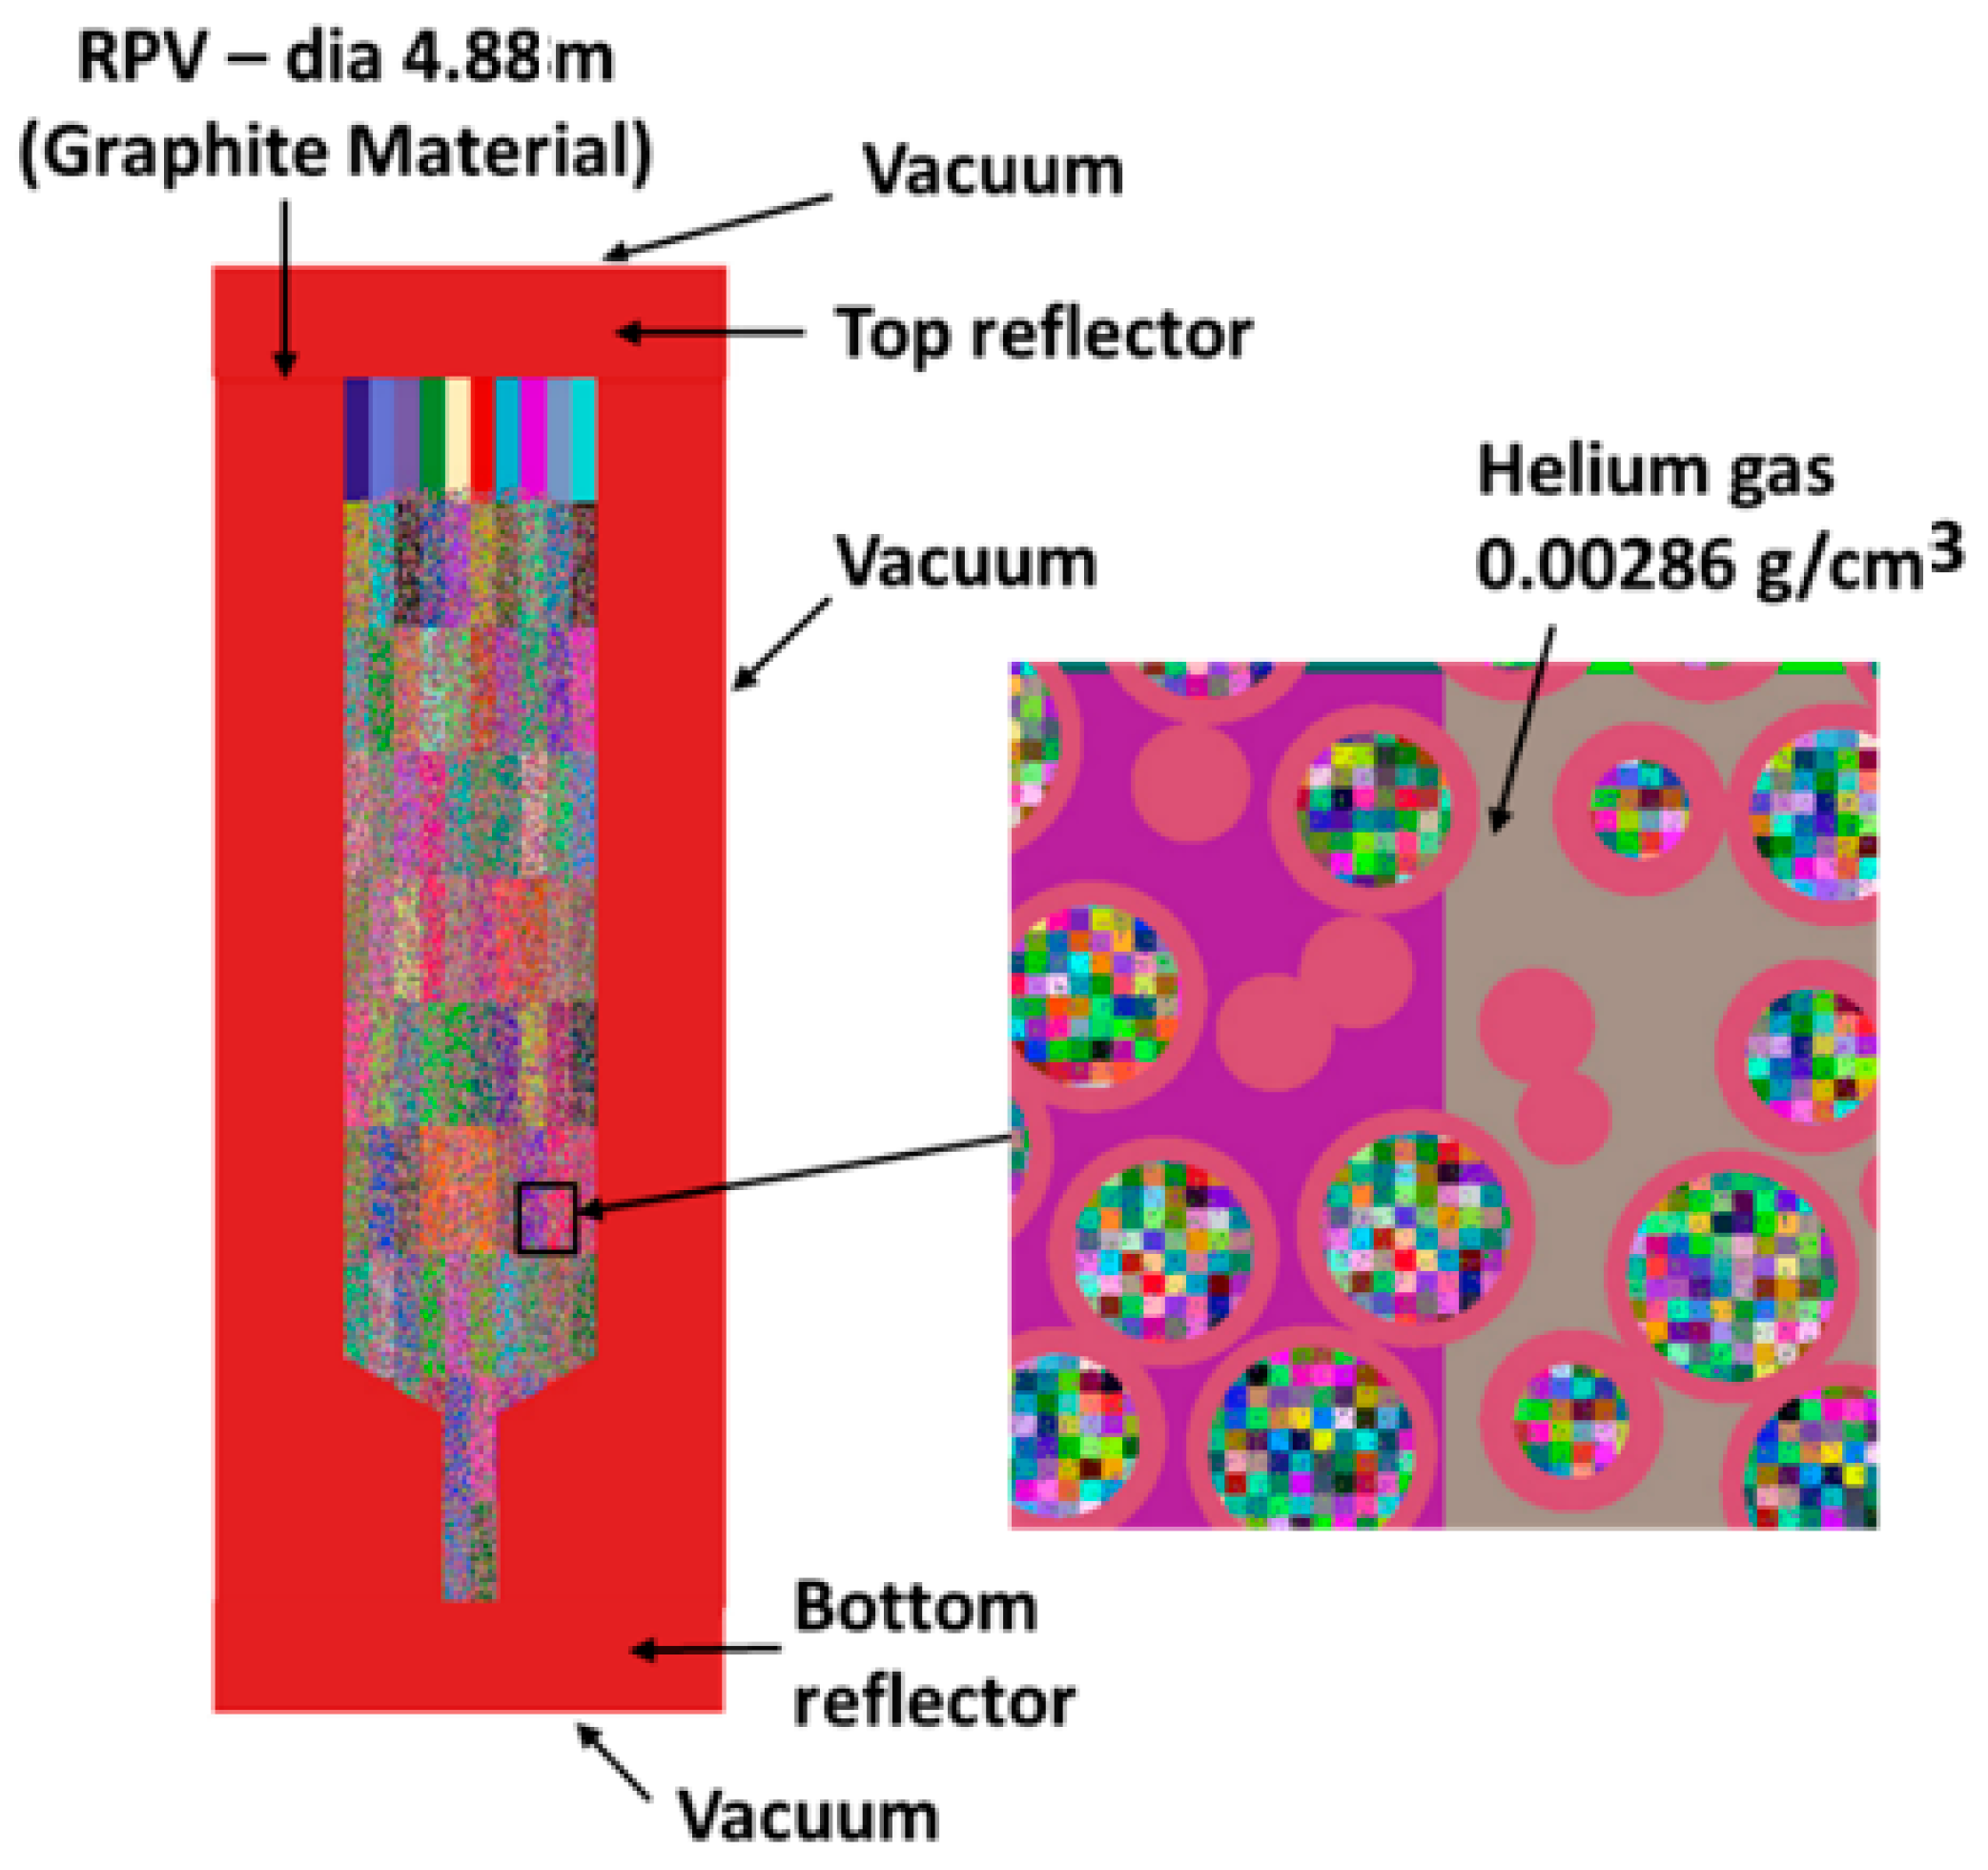
The side boundary of the reactor core is surrounded with thick graphite layers while mirror reflective boundary conditions are applied to the top and bottom surface of the core. Similar to the single pebble model described in Section 4.1, for the purpose of computation acceleration, a lattice grid of 10 × 10 × 10 is generated within each pebble as well as the entire core in the OpenMC model. Figure 9 illustrates the OpenMC core model with boundary conditions indicated and the lattice structure imposed in both the core and pebbles. For the static Xe-100 core analysis, no reactivity control elements are modeled.
The static Xe-100 core model was calculated by OpenMC using the VCU Oak HPC workstation, which is capable of parallel computing and has 40 cores, one thread per core, 2.40 GHz Intel Xeon E7-8894-processors, and 2880 GB of memory. The calculation of the single state keff eigenvalue took about 3.5 h. With a single type of fuel material in all pebbles, the static core is converged with a keff value close to 1.39035 with a standard deviation of 0.00021 (i.e., 21 pcm). The neutron leakage fraction is approximately 4.787% with a standard deviation of 0.5%. Lu et al. [3] also conducted a similar neutronic analysis of the static Xe-100 reactor using the MCM-based Serpent code [37]. The authors assumed a uniform packing of 223,000 pebbles, each containing 19,542 identical TRISO-coated particles at 900 K. The keff value of the static core found in their study was 1.38023 with a standard deviation of ±10 pcm, which differs by about 1% from our results. This difference could be attributed to variations in the number of pebbles, TRISO-coated particles, and packing uniformity in the analysis.
With the reactor core initially filled with fresh fuel pebbles, the keff value reaches a supercritical zone, thus an equilibrium state of the Xe-100 core is dispensable before any practical neutronics performance evaluation. Before the current static core model is used for a generation of equilibrium core, which will be presented in Section 4.4, a one-time whole core depletion calculation is performed using the static model to assess the feasibility of the long-term operation of the Xe-100 reactor core. The total burn time is set to be 1549 days, which is the reported total residence time of a fuel pebble in a typical HTG-PBR [2]. Figure 10 presents the one-time depletion result with the static core model. The statistical uncertainties of the keff values are kept as less than 0.1% (i.e., 100 pcm) in this calculation. The keff plot indicates that the reactor reaches criticality (keff = 1.0) after approximately 1000 days, which highlights the necessity of refueling the reactor core with fresh fuel beyond this point. Additionally, the average burnup of the reactor core at the time of 1000 days is around 10.5% FIMA.

4.4. Equilibrium for the Xe-100 Reactor with Pebble Circulation and Loading

Earlier research [3,14] proposed a startup core configuration for HTG-PBR with a mixture of fuel pebbles and non-fuel pebbles to achieve a quasi-equilibrium state at the beginning of reactor operation [2,3]. As time passes and fuel burns, non-fuel pebbles are replaced with fuel pebbles, eventually reaching and maintaining an equilibrium state for the reactor. The total residence time of a fuel pebble in an HTG-PBR with 165 MW thermal power has been reported as 1549 days [2], during which the pebble circulates six times through the core and completes one pass for every 258 days on average.
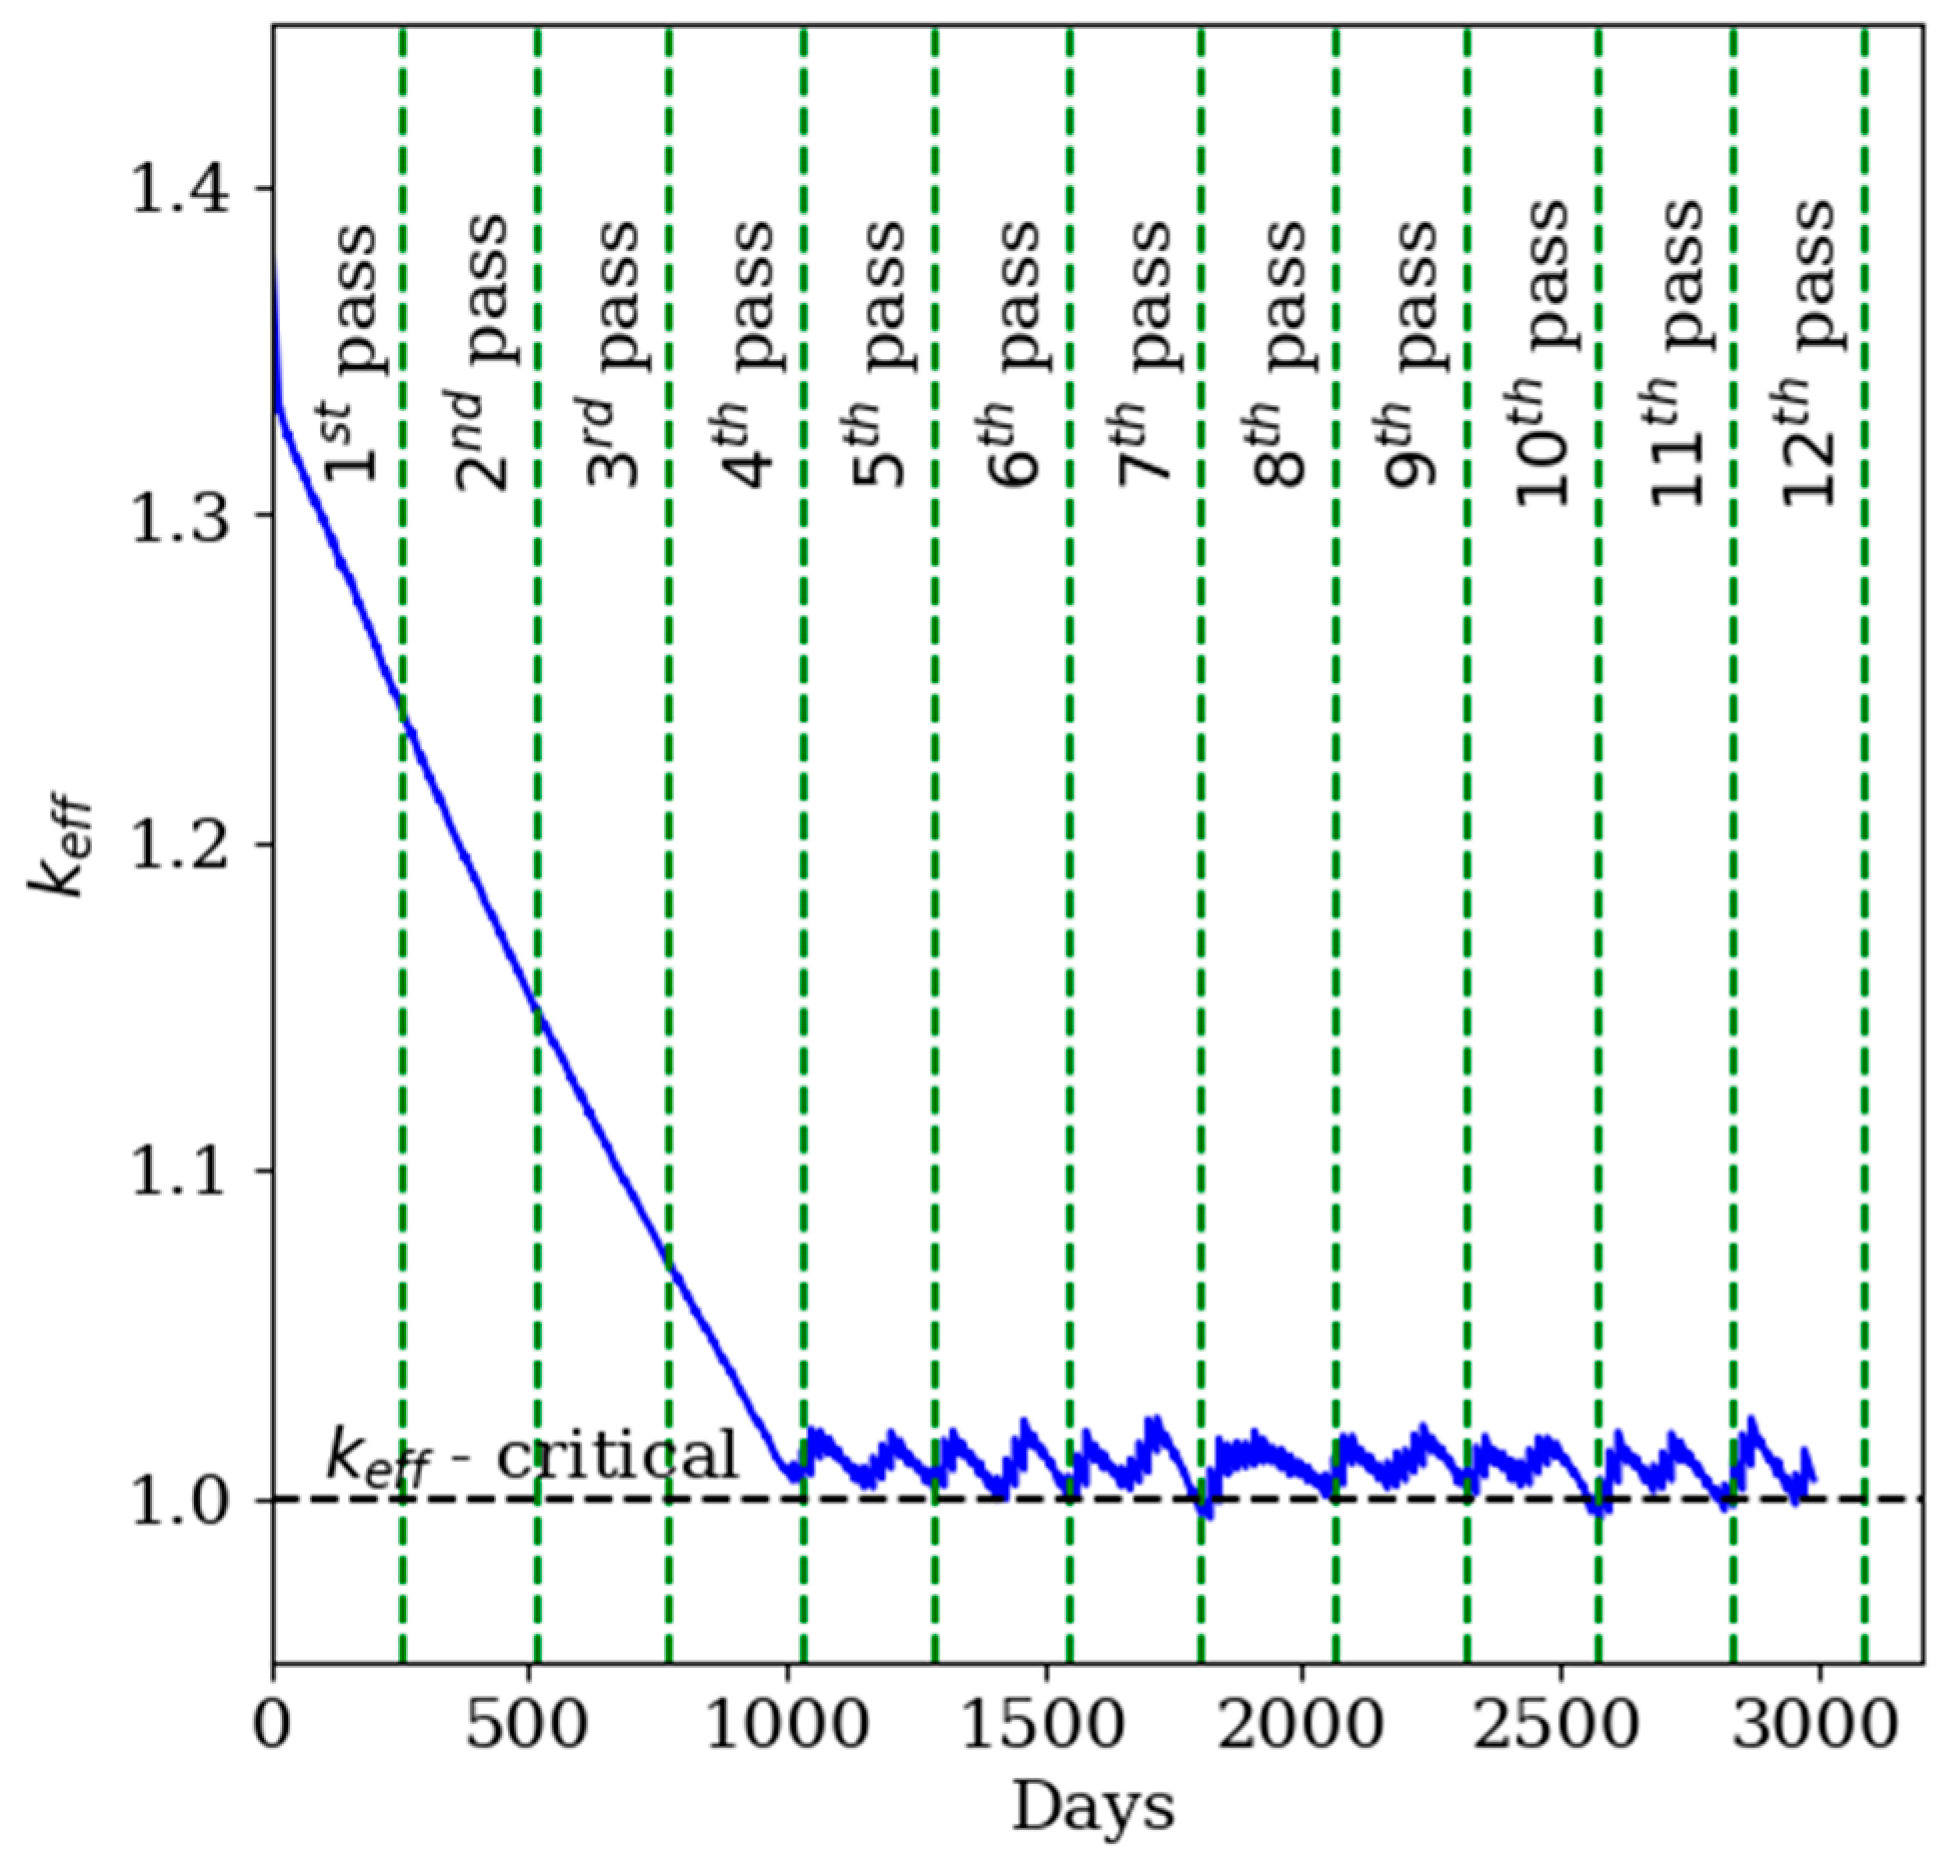
In this study, the equilibrium state of the Xe-100 core is achieved following the methodology discussed in Section 3.4. With the consideration of the burned fuel circulation and fresh fuel loading, the time step used for the equilibrium core generation is determined based on the number of passes within the residence time and the axial division of the reactor core. In this case, the reactor core is divided axially into 15 regions (Na = 15), resulting in a time step of 17.2 days for the equilibrium core search process. This setting also indicates that 14,732 pebbles are distributed to each axial region, which is further divided into five radial regions ( N r = 5). As a result, the reactor core has a total of 75 subregions, each containing approximately 2946 pebbles. In the equilibrium core search process, fresh fuel loading is triggered by the keff value. When the keff value decreases to 1.01, which is the kcrit value specified in this study, fresh fuel is loaded from the top region of the reactor core. The details of fuel circulation in the equilibrium core search using OpenMC are elaborated in Section 3.4, including the specifics of the percentage of fresh fuel and its loading approach. This equilibrium core search process is conducted for a total of around 3000 days, and the control rods are modeled and placed at the critical positions of the reactor operation throughout the search process [2,3]. Figure 11 presents the results of the keff value changes during the equilibrium core search for the Xe-100 reactor. The statistical errors of all keff values are maintained at less than 100 pcm in this calculation. The total computational time of the equilibrium core search took about 360 h (~15 days) using the VCU Oak HPC workstation with 40 cores for parallel computing.
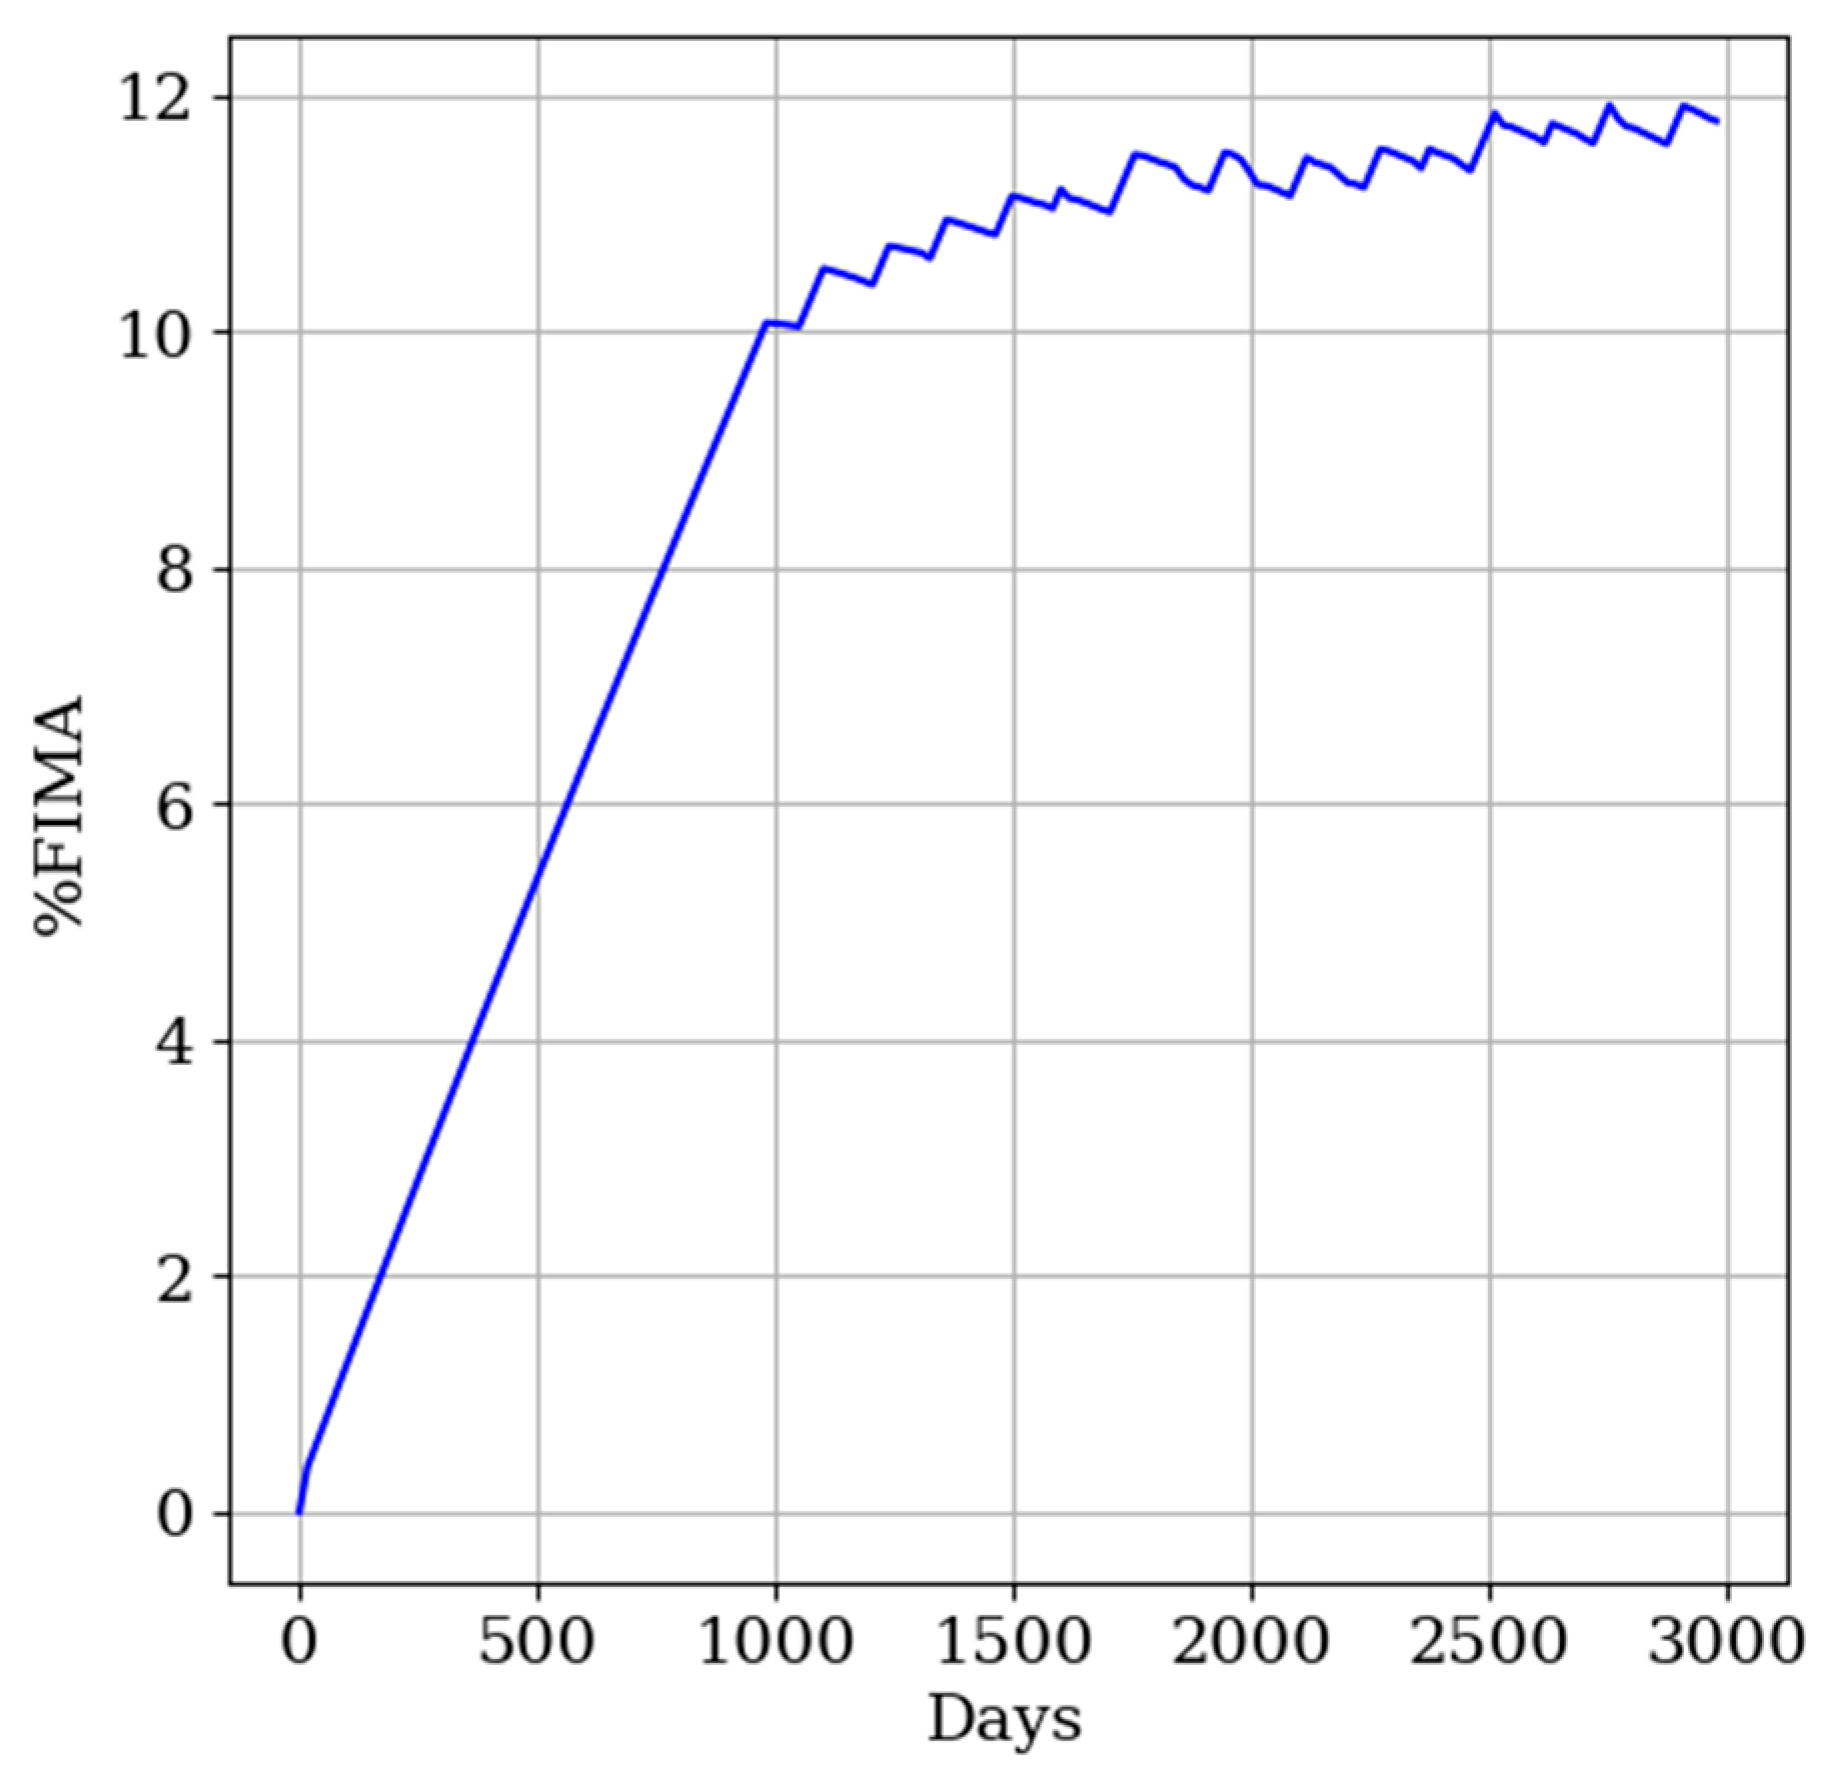
As shown in Figure 11, with a startup core loaded with all fresh fuels, the keff value decreases to below 1.01 around 1000 days with burned fuel circulation. Once the fresh fuel loading is triggered, a small spike in the keff value is observed in the search process. The keff values fluctuate between 1.0 and 1.01 for the remaining search time until the end point at 3000 days, which arguably indicates the Xe-100 reactor core is achieving a near-equilibrium state. The realization of an equilibrium core state can be further justified by the burnup result. Figure 12 shows the core average burnup performance in terms of %FIMA during the equilibrium core search process. The average burnup is evaluated by the arithmetic mean burnup of all subregions within the reactor core. The average fuel burnup increases linearly up to 1000 days and then stabilizes around 12% for the rest of the time until the search ends. The fluctuation of the average burnup and maximum burnup is due to the loading of fresh fuel. When fresh fuel is introduced into the subregion, the overall burnup in the reactor core decreases.
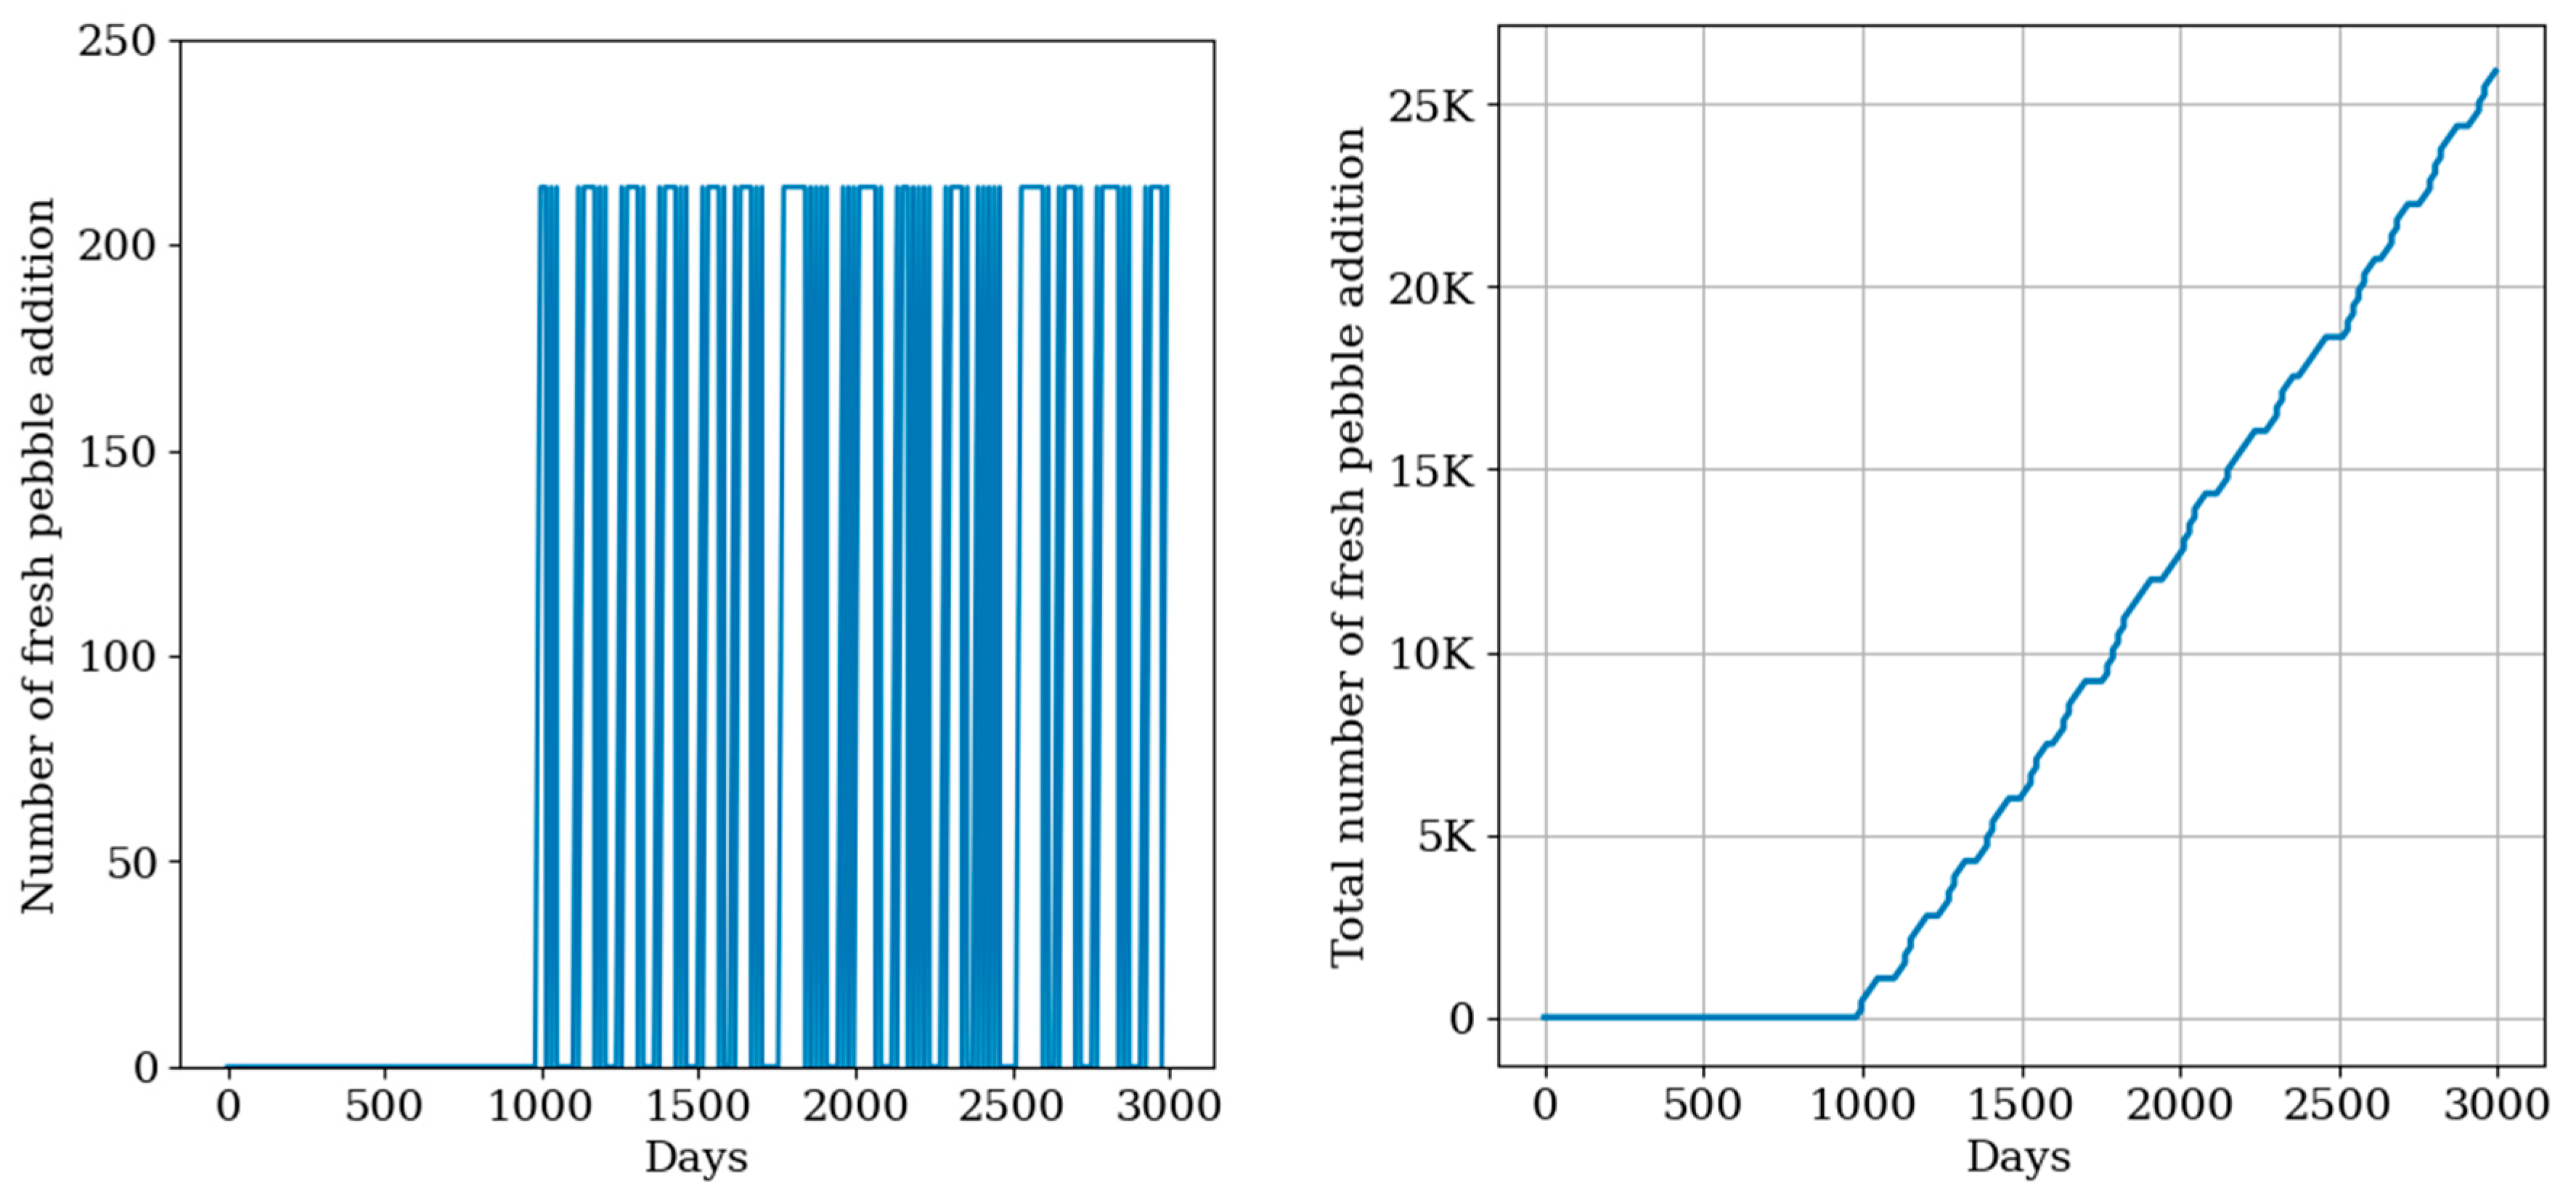
It is more indicative examine the number of fresh pebbles loaded during the equilibrium core search steps. As discussed in Section 3.4.3, when the keff value reduces to a critical level, fresh pebbles are loaded into the reactor. With the modeling setting used in this study, fresh pebbles are loaded at a rate of 213 per step from the top subregion of the reactor core based on the keff condition. Figure 13 (the left part) clearly shows the loading of 213 pebbles per step over time, with the collected number of pebbles loaded after each time step of 17.2 days. Figure 13 (the right part) depicts the accumulated number of fresh pebbles loaded into the core over all time steps.

5. Conclusions and Future Work

This study presents computational modeling and simulation approaches to conduct neutronics analysis for the HTG-PBR by coupling the specific modeling capacities of the MCM and DEM. The MCM based on the open-source code OpenMC and the DEM based on the open-source code LIGGGHTS were employed to simulate the neutron transport and pebble movement phenomena in the reactor, respectively.
A straightforward code verification and validation procedure was carried out on both codes before using them for the whole core analysis. Due to the absence of experimental data for validation, the neutronic analysis results produced by OpenMC were cross-verified against results obtained from the MCNP code for a single pebble case at various conditions. In general, excellent agreement was found for the results from both codes at any condition. Additionally, the neutronic result of the static whole core model with all fresh fuel was compared with data previously reported by our earlier work [3]. This comparison revealed a difference in the keff value of approximately 0.01, which is likely due to variations in the number of pebbles, TRISO-coated particles, and other assumptions made during the simulations. Furthermore, the DEM code for packing the pebbles was validated by comparing the average porosity with experimentally reported values. The estimated porosity was 0.417 for 789 pebbles in a column reactor, which demonstrates good agreement with the experimental data.
An equilibrium state core for the HTG-PBR type reactor Xe-100 was generated using the methodologies presented in this study. The equilibrium core was achieved by coupling OpenMC and LIGGGHTS calculations. The long-term neutronics behavior of the Xe-100 reactor was evaluated by the OpenMC code, while fuel pebble loading was simulated through the DEM code to provide a more realistic representation of pebble packing within the reactor core. This study effectively demonstrated the process of fresh fuel loading and fuel circulation during the equilibrium core search process by coupling the modeling capabilities of OpenMC and DEM code. Starting with a reactor core loaded with all fresh fuel pebbles, the equilibrium core search process indicates that the continuous loading of fresh fuel is required to sustain reactor operation after 1000 days of fuel depletion with depleted fuel circulation. Additionally, the model predicts 213 fresh pebbles need to be added to the top layer of the reactor to ensure the keff does not reduce below the assumed reactivity limit of 1.01.
The current practice for the HTG-PBR equilibrium core search has apparent limitations due to some modeling approximations made in the process. Some future work can be proposed for optimizing and improving the process of fresh fuel loading, possibly incorporating the mixing of pebbles during multi-pass cycles to improve the reactor’s performance. Additionally, future modeling efforts can be considered to include the effects of temperature variations and thermal feedback to provide more accurate predictions of the Xe-100 reactor’s behavior during equilibrium state operation. All of these efforts will refine the current models and enhance the reliability of the simulation results.

Author Contributions

Conceptualization, Z.W.; Methodology, K.S.M. and Z.W.; Software, K.S.M.; Validation, K.S.M.; Investigation, K.S.M.; Writing—original draft, K.S.M.; Writing—review & editing, B.G. and Z.W.; Supervision, Z.W.; Project administration, B.G. and Z.W.; Funding acquisition, B.G. All authors have read and agreed to the published version of the manuscript.

Funding

This work is performed with the support of the U.S. Department of Energy’s Nuclear Energy University Program (NEUP) with the Award No. DE-NE0009304.

Data Availability Statement

The original contributions presented in the study are included in the article, further inquiries can be directed to the corresponding author.

Acknowledgments

The authors acknowledge the College of Engineering at the Virginia Commonwealth University for providing high-performance computing resources that have contributed to the research results reported in this paper. The authors thank Ben Impson for providing MCNP calculation results for code verification. The authors also thank Gökberk Ünal and Holden Walker for performing internal reviews of the paper during the preparation of the manuscript.

Conflicts of Interest

The authors declare no conflict of interest.

References

  1. Bouchard, J.; Bennett, R. Generation IV advanced nuclear energy systems. Nucl. Plant J. 2008, 26, 42–45. [Google Scholar]
  2. Mulder, E.J.; Boyes, W.A. Neutronics characteristics of a 165 MWth Xe-100 reactor. Nucl. Eng. Des. 2020, 357, 110415. [Google Scholar] [CrossRef]
  3. Lu, C.; Wu, Z. A New Method to Efficiently Estimate the Equilibrium State of Pebble Bed Reactors. Nucl. Technol. 2022, 208, 1577–1590. [Google Scholar] [CrossRef]
  4. Wang, Q.; Yu, J.; She, D.; Forget, B. Modelling of the HTR-PM Pebble-bed Reactor using OpenMC. Trans. Am. Nucl. Soc. 2020, 22, 9–12. [Google Scholar]
  5. OECD. Nuclear Development; OECD Nuclear Engery Agency: Paris, France, 2022. [Google Scholar] [CrossRef]
  6. Mulder, E.J.; Van Staden, M. The Coupled Neutronics and Thermo-Fluid Dynamics Design Characteristics of the Xe-100 200 MWth Reactor; Transactions of the American Nuclear Society: La Grange Park, IL, USA, 2016. [Google Scholar]
  7. Teuchert, E.; Hansen, U.; Haas, K.A. VSOP-Computer Code System for Reactor Physics and Fuel Cycle Simulation (Juel—1649); Kernforschungsanlage Juelich GmbH, NTRL: Jülich, Germany, 1980. [Google Scholar]
  8. Terry, W.K.; Gougar, H.D.; Ougouag, A.M. Direct deterministic method for neutronics analysis and computation of asymptotic burnup distribution in a recirculating pebble-bed reactor. Ann. Nucl. Energy 2002, 29, 1345–1364. [Google Scholar] [CrossRef]
  9. Lu, C.; Hiscox, B.D.; Terrani, K.A.; Brown, N.R. Fully ceramic microencapsulated fuel in prismatic high temperature gas-cooled reactors: Analysis of reactor performance and safety characteristics. Ann. Nucl. Energy 2018, 114, 277–287. [Google Scholar] [CrossRef]
  10. Setiadipura, T.; Obara, T. Annals of Nuclear Energy Development of Monte Carlo-based pebble bed reactor fuel management code. Ann. Nucl. Energy 2014, 71, 313–321. [Google Scholar] [CrossRef]
  11. Werner, C.J.; Bull, J.S.; Solomon, C.J.; Brown, F.B.; McKinney, G.W.; Rising, M.E.; Dixon, D.A.; Martz, R.L.; Hughes, H.G.; Cox, L.J.; et al. MCNP Version 6.2 Release Notes (No. LA-UR-18-20808); Los Alamos National Laboratory (LANL): Los Alamos, NM, USA, 2018. [Google Scholar]
  12. Fratoni, M.; Greenspan, E. Equilibrium core composition search methodologies for pebble bed reactors. Nucl. Sci. Eng. 2010, 166, 1–16. [Google Scholar] [CrossRef]
  13. Wu, S.-C.; Sheu, R.-J.; Peir, J.-J.; Liang, J.-H. Burnup Computation for HTR-10 Using Layer-to-Layer Movement. In International Conference on Nuclear Engineering; American Society of Mechanical Engineers: New York, NY, USA, 2013; Volume 55836. [Google Scholar]
  14. Stewart, R.; Balestra, P.; Reger, D.; Merzari, E.; Strydom, G. High-fidelity simulations of the run-in process for a pebble-bed reactor. Ann. Nucl. Energy 2024, 195, 110193. [Google Scholar] [CrossRef]
  15. Robert, Y.; Siaraferas, T.; Fratoni, M. Hyper-fidelity depletion with discrete motion for pebble bed reactors. Sci. Rep. 2023, 13, 12711. [Google Scholar] [CrossRef]
  16. Nedderman, R.M.; Tuzun, U. A kinematic model for the flow of granular materials. Powder Technol. 1979, 22, 243–253. [Google Scholar] [CrossRef]
  17. Mullins, W.W. Stochastic theory of particle flow under gravity. J. Appl. Phys. 1972, 43, 665–678. [Google Scholar] [CrossRef]
  18. Caram, H.; Hong, D.C. Random-walk approach to granular flows. Phys. Rev. Lett. 1991, 67, 828–831. [Google Scholar] [CrossRef]
  19. Bazant, M.Z. The spot model for random-packing dynamics. Mech. Mater. 2006, 38, 717–731. [Google Scholar] [CrossRef]
  20. Thornton, C. On the relationship between the modulus of particulate media and surface energy of the constituent particles. J. Phys. D Appl. Phys. 1993, 26, 1587–1591. [Google Scholar] [CrossRef]
  21. Jiang, S.Y.; Yang, X.T.; Tang, Z.W.; Wang, W.J.; Tu, J.Y.; Liu, Z.Y.; Li, J. Experimental and numerical validation of a two-region-designed pebble bed reactor with dynamic core. Nucl. Eng. Des. 2012, 246, 277–285. [Google Scholar] [CrossRef]
  22. Reger, D.; Merzari, E.; Balestra, P.; Stewart, R.; Strydom, G. Discrete element simulation of Pebble Bed Reactors on graphics processing units. Ann. Nucl. Energy 2023, 190, 109896. [Google Scholar] [CrossRef]
  23. Reger, D.; Merzari, E.; Balestra, P.; Schunert, S.; Hassan, Y.; King, S. Direct Numerical Simulation and Large Eddy Simulation of a 67-Pebble-Bed Experiment. Nucl. Technol. 2024, 210, 1258–1278. [Google Scholar] [CrossRef]
  24. Tasora, A.; Serban, R.; Mazhar, H.; Pazouki, A.; Melanz, D.; Fleischmann, J.; Taylor, M.; Sugiyama, H.; Chrono, D.N. An open source multi-physics dynamics engine. In High Performance Computing in Science and Engineering: Second International Conference; Kozubek, T., Ed.; Springer: Berlin/Heidelberg, Germany, 2016; pp. 19–49. [Google Scholar] [CrossRef]
  25. Romano, P.K.; Horelik, N.E.; Herman, B.R.; Nelson, A.G.; Forget, B.; Smith, K. OpenMC: A state-of-the-art Monte Carlo code for research and development. Ann. Nucl. Energy 2015, 82, 90–97. [Google Scholar] [CrossRef]
  26. Kloss, C.; Goniva, C.; Hager, A.; Amberger, S.; Pirker, S. Models, algorithms and validation for opensource DEM and CFD–DEM. Prog. Comput. Fluid Dyn. Int. J. 2012, 12, 140–152. [Google Scholar] [CrossRef]
  27. Kadak, A.C.; Bazant, M.Z. Pebble Flow Experiments For Pebble Bed Reactors. In Proceedings of the 2nd International Topical Meeting on High Temperature Reactor Technology, Beijing, China, 22–24 September 2004. [Google Scholar]
  28. Olivier, L.D.; Mulder, E.J.; Wang, Z. Mechanistic source terms for the Xe-100 reactor XSTERM Code Development Approach. In Proceedings of the International Topical Meeting on High Temperature Reactor Technology (HTR 2016), Las Vegas, NV, USA, 6–10 November 2016; Volume 18587. [Google Scholar]
  29. Kondratiev, V.V.; Sysoev, I.A.; Kolosov, A.D.; Galishnikova, V.V.; Gladkikh, V.A.; Karlina, A.I.; Karlina, Y.I. Development and Testing of the Thermoelectric Thermal Energy Conversion Device in the Conditions of Existing Aluminum Production. Materials 2022, 15, 8526. [Google Scholar] [CrossRef] [PubMed]
  30. Colak, Ü.; Seker, V. Monte Carlo criticality calculations for a pebble bed reactor with MCNP. Nucl. Sci. Eng. 2005, 149, 131–137. [Google Scholar] [CrossRef]
  31. Romano, P.K.; Josey, C.J.; Johnson, A.E.; Liang, J. Depletion capabilities in the OpenMC Monte Carlo particle transport code. Ann. Nucl. Energy 2020, 152, 107989. [Google Scholar] [CrossRef]
  32. Siemens Digital Industries Software, Simcenter STAR-CCM+ User Guide, Version 2021.1. Adaptive Mesh Refinement for Overset Meshes, Siemens. 2021; pp. 3067–3070. Available online: https://plm.sw.siemens.com/en-US/simcenter/fluids-thermal-simulation/star-ccm/ (accessed on 24 April 2021).
  33. Cetnar, J. General solution of Bateman equations for nuclear transmutations. Ann. Nucl. Energy 2006, 33, 640–645. [Google Scholar] [CrossRef]
  34. Josey, C.; Forget, B.; Smith, K. High order methods for the integration of the Bateman equations and other problems of the form of y’ = F(y, t)y. J. Comput. Phys. 2017, 350, 296–313. [Google Scholar] [CrossRef]
  35. Harp, J.M.; Demkowicz, P.A.; Winston, P.L.; Sterbentz, J.W. An analysis of nuclear fuel burnup in the AGR-1 TRISO fuel experiment using gamma spectrometry, mass spectrometry, and computational simulation techniques. Nucl. Eng. Des. 2014, 278, 395–405. [Google Scholar] [CrossRef]
  36. Raflis, H.; Ilham, M.; Su’ud, Z.; Waris, A.; Irwanto, D. Comparative Study on Fuel Assembly of Modular Gas-cooled Fast Reactor using MCNP and OpenMC Code. J. Phys. Conf. Ser. 2021, 1772, 012031. [Google Scholar] [CrossRef]
  37. Leppänen, J.; Pusa, M.; Viitanen, T.; Valtavirta, V.; Kaltiaisenaho, T. The Serpent Monte Carlo code: Status, development and applications in 2013. Ann. Nucl. Energy 2015, 82, 142–150. [Google Scholar] [CrossRef]
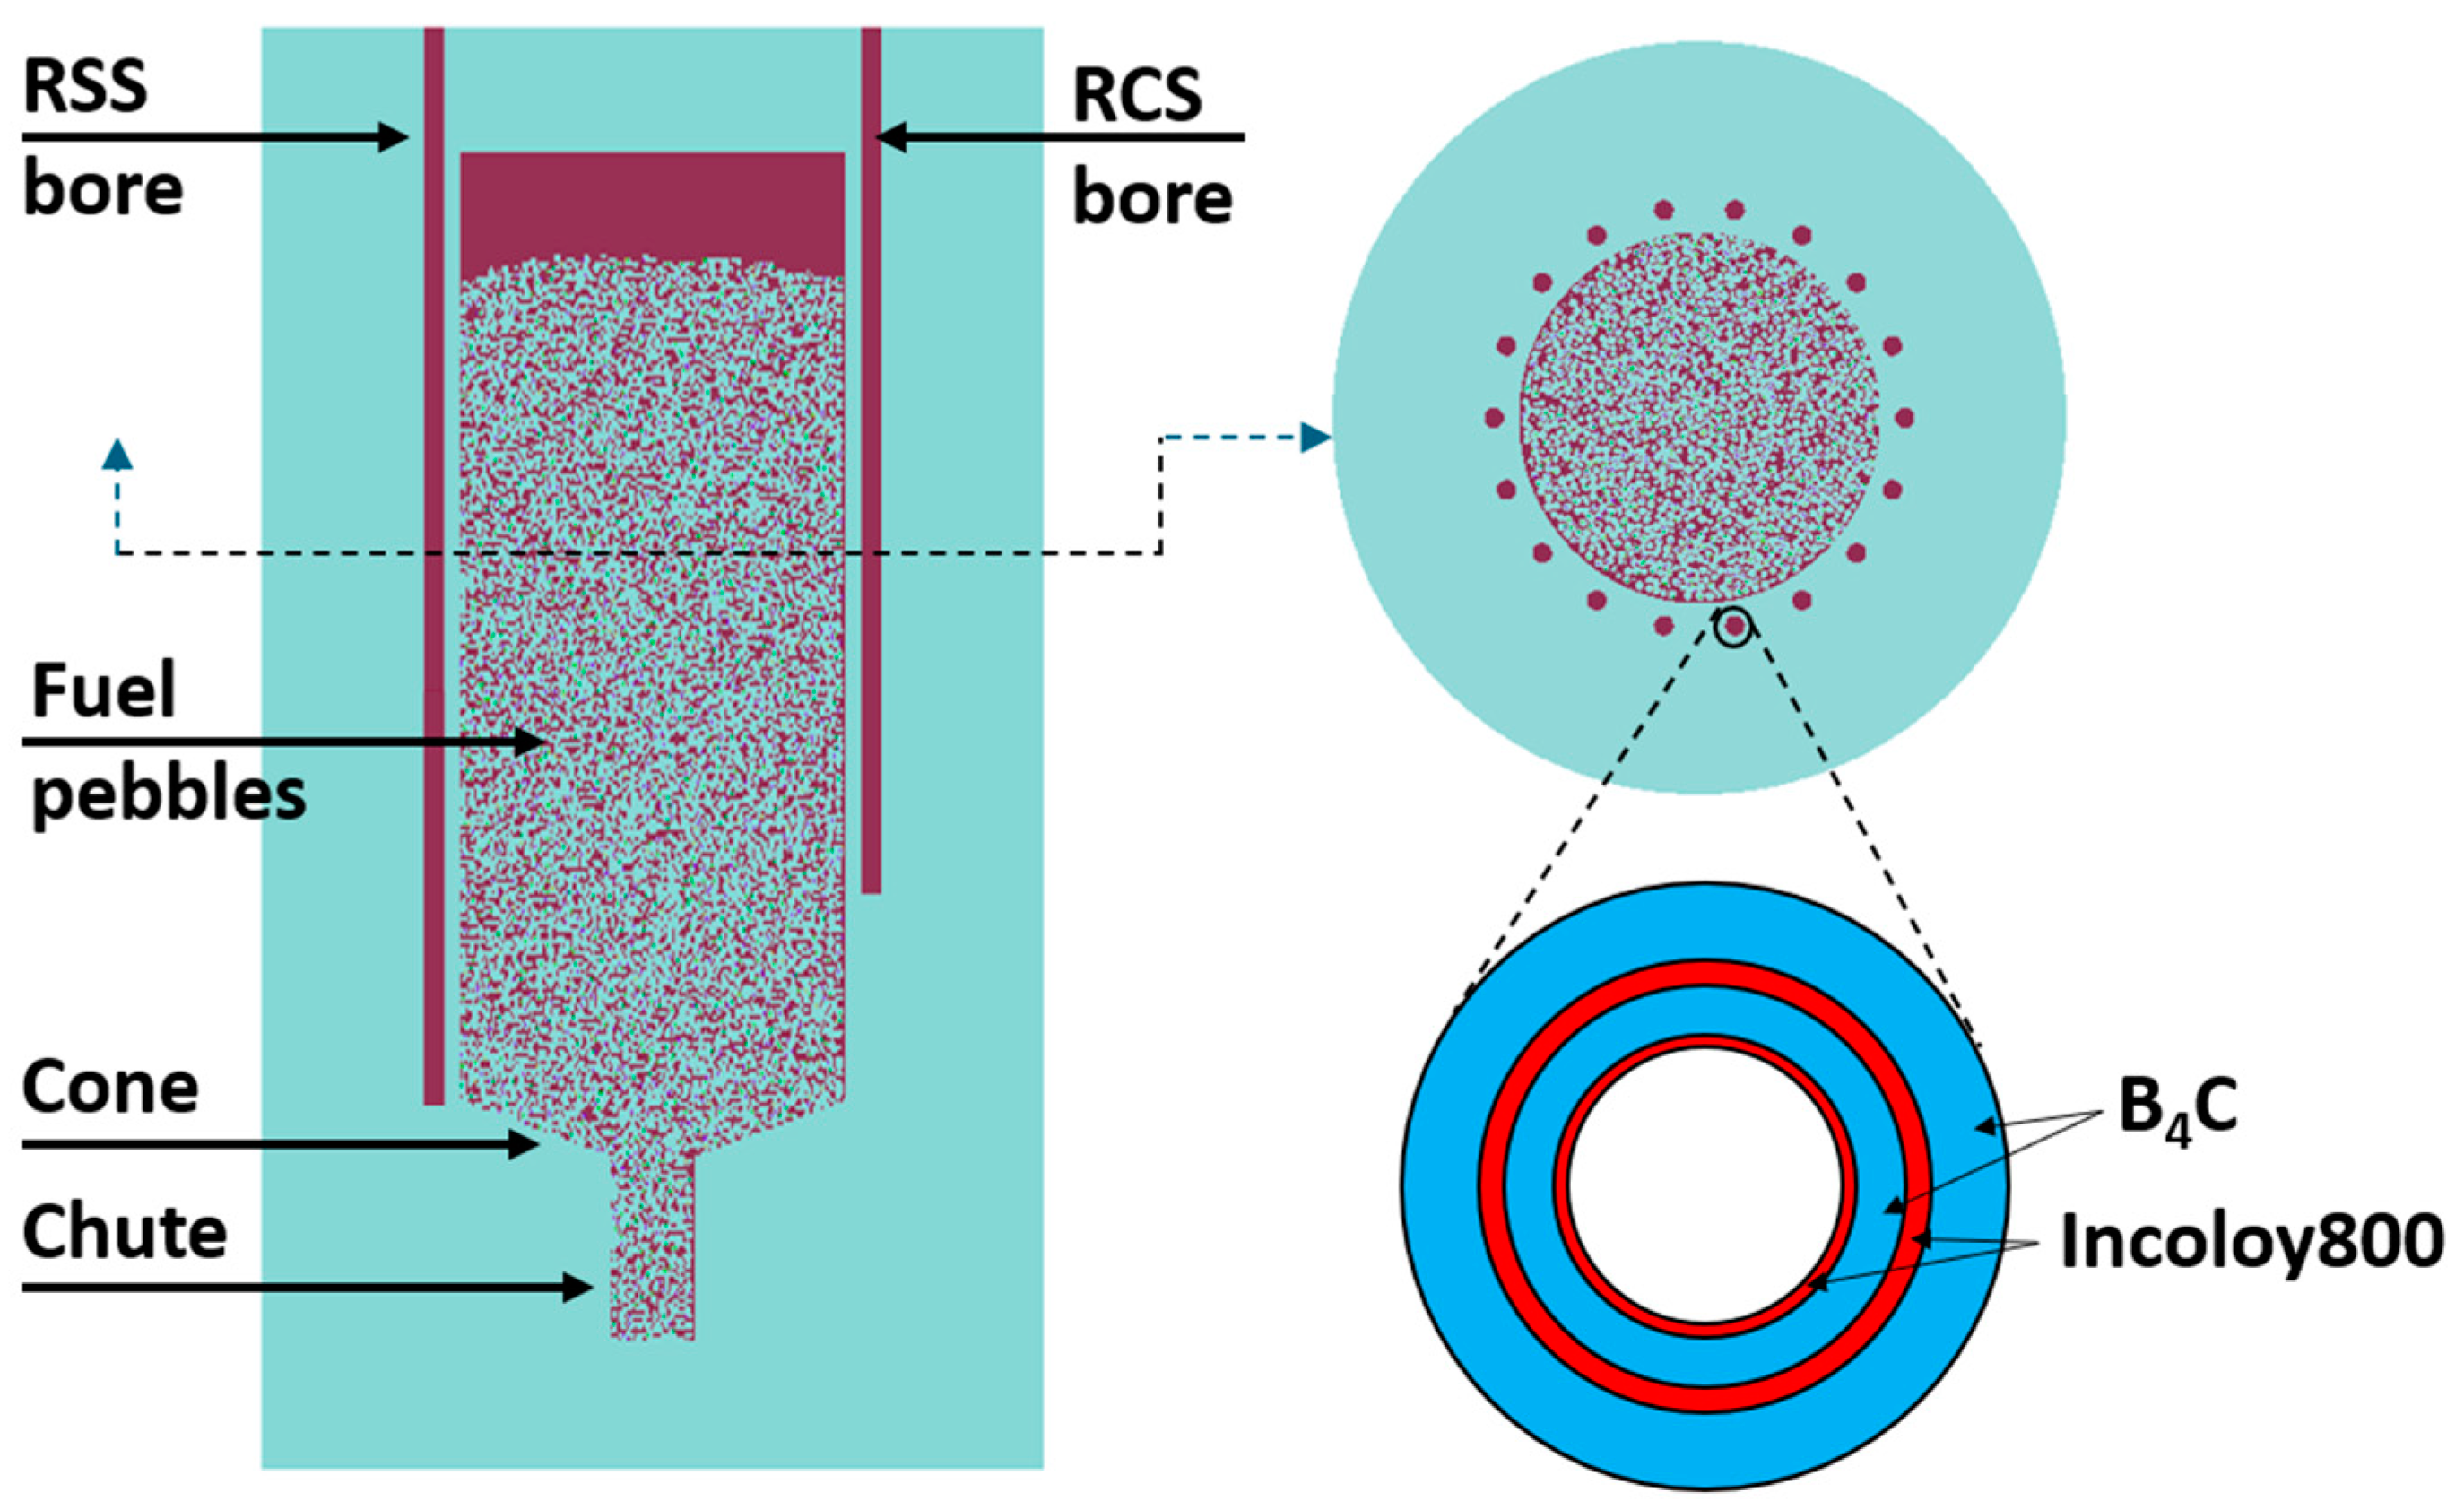
Figure 1. Schematic view of the Xe-100 reactor.
Energies 17 05188 g001
Figure 2. Schematic view of the Xe-100 reactor, fuel pebble, and TRISO-coated particle.
Energies 17 05188 g002
Figure 3. Coupling between LIGGGHTS and OpenMC.
Energies 17 05188 g003
Figure 4. Diagram of axial and radial subregions in the reactor core.
Energies 17 05188 g004
Figure 5. Diagram of the fuel circulation in the reactor core.
Energies 17 05188 g005
Figure 6. Flowchart of the fuel circulation and loading procedure.
Energies 17 05188 g006
Figure 7. The 2D single pebble model in OpenMC shown in a 10 × 10 × 10 lattice grid with TRISO-coated particles distributed in a uniform pattern (left) and a random pattern (right).
Energies 17 05188 g007
Figure 8. The CAD model of Xe-100 reactor walls (left) and the reactor loaded with over 200 hundred thousand fuel pebbles via DEM simulation (right).
Energies 17 05188 g008
Figure 9. The lattice of the reactor (left) and pebbles (right) used in OpenMC models.
Energies 17 05188 g009
Figure 10. Changes in the keff value (left) and fuel burnup (right) along with the fuel burnup time.
Energies 17 05188 g010
Figure 11. Variation in keff values during the equilibrium core search process with burned fuel circulation and fresh fuel loading considered (Colored lines separate the pass time for fuel circulation).
Energies 17 05188 g011
Figure 12. Core average burnup during the equilibrium core search with burned fuel circulation and fresh fuel loading considered.
Energies 17 05188 g012
Figure 13. The number of fresh pebbles loaded at each step (left) and the accumulated number of fresh pebbles loaded during the equilibrium core search (right).
Energies 17 05188 g013
Table 1. Parameters for a TRISO-coated fuel particle.
MaterialDensity (g/cm3)Composition (Atomic Fraction)Dimension (μm)
UCO Fuel Kernel10.9235U: 0.05232
238U: 0.28101
16O: 0.49982
17O: 0.00019
C: 0.16667
425 (diameter)
Carbon Buffer1.0C: 1.0100 (thickness)
Inner PyC1.9C: 1.040 (thickness)
SiC3.2C: 0.5
Si: 0.5
35 (thickness)
Outer PyC1.9C: 1.040 (thickness)
Table 2. The k of the single pebble model at room temperature.
Pebble ModelCodek (White B.C.)k (Mirror B.C.)Diff. in k
UniformMCNP1.60743 ± 0.000081.61471 ± 0.00004−0.00728
OpenMC1.60818 ± 0.000111.61560 ± 0.00012−0.00750
Deviation−0.00067−0.00089-
RandomMCNP1.61017 ± 0.000071.61723 ± 0.00006−0.00706
OpenMC1.61025 ± 0.000111.61739 ± 0.00012−0.00714
Deviation0.000080.00016-
Table 3. The k value of the single pebble model at the 1200 K temperature.
Pebble ModelCodek (White B.C.)k (Mirror B.C.)Diff. in k
UniformMCNP1.50820 ± 0.000071.51774 ± 0.00007−0.00954
OpenMC1.50789 ± 0.000121.51757 ± 0.00012−0.00968
Deviation0.000310.00017 -
RandomMCNP1.51203 ± 0.000081.52111 ± 0.00006−0.00908
OpenMC1.51071 ± 0.000121.51980 ± 0.00012−0.00909
Deviation−0.00132−0.00131-
Disclaimer/Publisher’s Note: The statements, opinions and data contained in all publications are solely those of the individual author(s) and contributor(s) and not of MDPI and/or the editor(s). MDPI and/or the editor(s) disclaim responsibility for any injury to people or property resulting from any ideas, methods, instructions or products referred to in the content.