Abstract
This study presents a comparative analysis of the accuracy of different methodologies for the design and performance evaluation of thermoelectric generators (TEGs), using analytical, computational numerical, and experimental approaches. TEGs are promising devices for capturing waste energy in industrial processes, converting waste heat into electrical energy and contributing to energy sustainability. However, the efficiency of TEGs is a significant challenge due to their low conversion rates. To address this challenge, three different methodologies were developed and systematically compared. Analytical Model: Developed for the electrical design of thermoelectric micro generators, using theoretical performance data and industrial temperature gradients. This method offers a robust theoretical view but may not capture all practical variables. Computational model in Simulink/MATLAB: Created and validated to consider the variation of the Seebeck coefficient and the internal resistance of thermoelectric modules with temperature. This model provides an accurate simulation of operating conditions but depends on the accuracy of the input parameters. Experimental Multi-string Electrical Arrangement Prototype: This involved the design and construction of a prototype followed by experimental tests to validate its performance. This method provides valuable empirical data but can be limited by the complexity and cost of the experiments. The results show that each methodology has specific advantages and limitations, offering valuable insights for the development of more efficient TEG systems. The comparison of analytical, numerical, and experimental methods revealed differences in accuracy and efficiency, highlighting the importance of an integrated approach to TEG design. This study lays a solid foundation for future research and practical applications in the field of industrial residual energy harvesting.
1. Introduction
The growing demand for energy and the need for efficient energy harvesting methods have fueled research and development into new technologies. Thermoelectric generators (TEGs) are promising devices that directly convert thermal energy into electrical energy using the Seebeck effect. This effect, discovered by Thomas Johann Seebeck in 1821, occurs when two different materials are joined and exposed to a temperature gradient, generating a difference in electrical potential between the junction points [1,2,3,4,5,6].
Thermoelectric modules are made up of thermoelectric elements (TEs) that can be connected in series or parallel to increase the output voltage and thermal conductivity respectively. The application of TEGs in industrial processes to capture waste energy is particularly attractive, as it allows waste heat to be utilized, contributing to energy efficiency and environmental sustainability. Energy capture techniques are important because they allow the reuse of energy that would otherwise be wasted, reducing dependence on non-renewable energy sources and reducing greenhouse gas emissions, incorporating clean technologies to promote a sustainable future [6,7,8,9,10,11,12,13,14,15].
However, the efficiency of TEGs is a significant challenge due to their low conversion rates. To maximize the energy obtained, precise design and the implementation of power management techniques, such as DC–DC converters with maximum power point tracking (MPPT) algorithms [16,17,18,19,20,21], are essential.
This article presents a comparative analysis of the accuracy of different methodologies for the design of thermoelectric generators (TEGs), including analytical, numerical, computational, and experimental approaches. These methodologies make it possible to optimize the development of proofs of concept, providing a comprehensive and innovative solution for the design and implementation of TEG systems based on energy harvesting. It is worth noting that the methodologies adopted in this research are the result of research and development (R&D) by the Energy and Sustainability Research Group (GPEnSE) focused on the development of solid-state generators, self-powered devices, and autonomous sensors based on energy harvesting [22,23,24,25,26,27,28,29]. The main contributions of this article are:
Development of Analytical Modeling: Proposal and development of a detailed analytical approach for the electrical design of thermoelectric microgenerators, using theoretical performance data and temperature gradients.
Development of Computational Numerical Modeling: Creation and validation of a computer model in Simulink/MATLAB that considers the variation of the Seebeck coefficient and the internal resistance of thermoelectric modules with temperature.
Development of an Experimental Analysis: Carrying out experimental tests to validate the performance of the prototype and comparing the results with the analytical and numerical computer models.
Section 2 details the conceptual design of a Thermoelectric Generator (TEG) system featuring a multi-string electrical arrangement for energy harvesting. Section 3 outlines the analytical methodology for electrical design, including steps for electrical dimensioning, selection of thermoelectric modules, and configuration of the arrangement. This section concludes with the presentation of a Proof of Concept (PoC) TEG system designed using the proposed analytical methodology. Section 4 describes the development of a computational numerical model in Simulink/MATLAB (Version R 2023a), which accounts for variations in the Seebeck coefficient and internal resistance with temperature and validates the model using experimental data. Section 5 focuses on the development and experimental analysis of the multi-string electrical arrangement based on TEGs for energy harvesting. Section 6 presents the results, comparing the accuracy and efficiency of TEG systems obtained from each methodology. Finally, Section 7 summarizes the main findings of the study and provides recommendations for future research and practical applications.
2. Conceptual Design of a TEG System
This section describes the electrical design analytical methodology of a TEG system concept with a multi-string electrical arrangement for the TEG system. Figure 1 presents the block diagram outlining the main stages for assembling and applying a generic TEG system for energy harvesting. In this system, the heat source includes thermal losses that can be captured through surface contact, fin systems, and heat pipes. The thermal system should be customized according to the specific characteristics of the installation site to maximize resource utilization and enhance the waste recovery process.
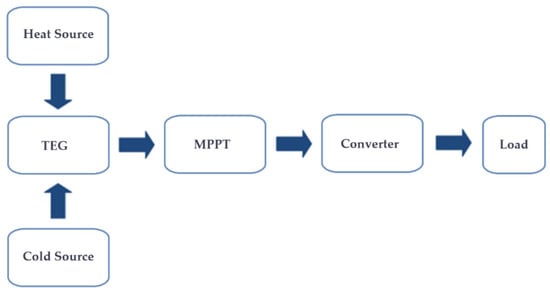
Figure 1.
Block diagram demonstration of the TEG system.
2.1. TEG Operated in Multi-String Electrical Arrangement
When operating the TEG system in a multi-string electrical arrangement, efficiency is not solely dependent on the thermoelectric modules, as their output power is influenced by the temperature gradient. Therefore, the temperatures to which the modules are subjected directly affect the overall system efficiency. Tests confirm that the thermoelectric modules function as a voltage source. When connected in series, the total output voltage equals the sum of the voltages of each individual module. Conversely, when connected in parallel, the current circulating among the modules, when powering a specific load, is equally divided according to the number of modules. To increase the system’s output voltage, multiple modules can be connected in series, while to supply a higher current, multiple modules can be connected in parallel. Due to variations in the temperatures of thermal processes, the output voltage of the modules also varies. For this reason, a DC–DC converter is necessary to maintain a constant voltage to supply a load. This converter can either step up or step down the output voltage and has its own efficiency, which influences overall system performance. Additionally, load impedance affects power transfer efficiency; maximum energy transfer is achieved when impedance matching occurs, meaning the internal electrical resistance of the system equals the electrical resistance of the load.
2.2. Maximum Power Point Tracking (MPPT)
The Maximum Power Point Tracking (MPPT) function optimizes the utilization of available energy by adjusting the impedance seen at the input of a DC–DC converter to operate at the point of maximum power. MPPT varies the conduction time of the transistor based on voltage and current data from the source, which is crucial for non-ideal voltage sources, such as solar panels subject to light variations or TEGs with variable temperature gradients.
One of the most commonly used algorithms for this function is Perturb and Observe (P&O). This algorithm works by perturbing the system’s current or voltage in small increments and monitoring the corresponding changes in power. If the power increases with perturbation, the system was operating below the maximum power point and the perturbation continues in the same direction. If the power decreases, it indicates that the system has passed the maximum power point, and the direction of the perturbation is reversed.
This process is repeated continuously, allowing MPPT to “track” the maximum power point and adjust the system’s operation to maximize energy generation. Figure 2 shows a graph with the operating points and a diagram illustrating how the P&O algorithm makes decisions to find the maximum power point. The basic principle of the P&O algorithm involves periodically perturbing the system’s current or voltage in small increments while monitoring the corresponding changes in power. If the power increases with the perturbation, it means the system was operating below the maximum power point and the perturbation continues in the same direction. If the power decreases with the perturbation, it indicates that the system has passed the maximum power point and the perturbation is reversed.
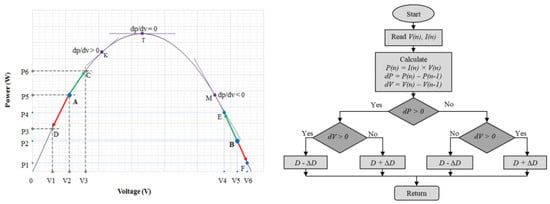
Figure 2.
Graph and diagram on MPPT operation [20,21].
The P&O algorithm is effective and widely used due to its simplicity of implementation; however, it may exhibit oscillations around the maximum power point and, under extreme conditions, may not converge quickly or lose track of the optimal point. Currently, for extreme conditions with high variability in the generated power due to external factors, various MPPT algorithms are being studied and developed, which can be used depending on the desired operation [30,31,32,33].
2.3. DC–DC Converters
The design of the DC–DC converter involves determining several parameters based on the specific characteristics of the system, including the load supply voltage, the maximum power that the load connected to the converter can handle, the minimum input voltage, and the maximum input voltage of the converter. To ensure correct sizing, it is necessary to establish key values such as the switching frequency of the transistor, the inductor current ripple (expressed as a percentage), and the output voltage ripple (also expressed as a percentage).
The choice of the most suitable DC–DC converter for the proposed cogeneration system should take into account the output voltage of the thermoelectric modules feeding the converter’s input and the required output voltage of the converter powering the load. Specifically, if the input voltage is lower than the desired output voltage, a boost converter is recommended as it elevates the output voltage. Conversely, if the input voltage exceeds the output voltage, a buck converter is more suitable, as it reduces the output voltage to the required level.
Although the described selection model is valid, it is not conclusive. For a more detailed analysis, the relationship between the converter’s output power (Po) and the power consumed by the switching elements (Pt) should be examined, disregarding current ripple (assuming the converter operates in continuous conduction mode) and voltage ripple. It is also assumed that the input voltage may vary and that the duty cycle should be controlled to maintain a constant output voltage. Figure 3 shows the relationship between these powers, representing the utilization efficiency of the switching elements as a function of the duty cycle. For voltages of the same magnitude, the buck converter is the most efficient in utilizing the switching elements, as the duty cycle (D) will be close to 1. The buck–boost converter, on the other hand, has a lower utilization index, with a maximum value of 25% if the duty cycle is 0.5. The major advantage of the buck–boost converter is its ability to operate with input voltages both lower and higher than the output voltage, adjusting according to the system’s needs, especially considering that thermoelectric modules vary with the temperature difference (4). For the physical sizing of any chosen converter model, it is recommended to use classical methodologies [34,35,36].
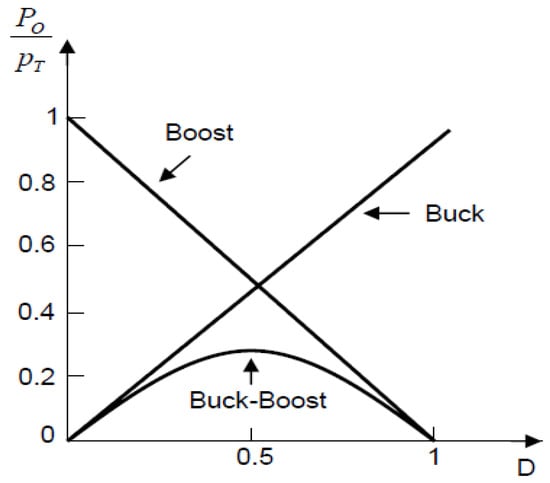
Figure 3.
Energy utilization in DC–DC converters (4).
3. Analytical Methodology and Design of the PoC
This subsection describes the analytical modeling and detailed design methodology steps for the electrical dimensioning of the TEG system including the (i) calculating of power output, voltage, and current requirements based on the theoretical performance curves of thermoelectric modules and predetermined temperature gradients. (ii) Selection of Thermoelectric Modules involves selecting the appropriate specific performance criteria (Seebeck coefficient, internal resistance, and module dimensions), and (iii) configuration of the thermoelectric modules in series or parallel is determined based on the desired output voltage and current. The arrangement is optimized to ensure maximum power output and efficient energy harvesting.
3.1. Analytical Methodology
The calculation methodology developed for the electrical dimensioning of the main components in the TEG system is based on the structure outlined in Section 2. Applying this methodology requires prior knowledge of the system’s thermal behavior at the installation site and the operational conditions of the load that will be powered. The necessary input data includes: (i) the power and supply voltage of the load; (ii) the temperature gradient and temperatures of the hot and cold sources; (iii) the number of daily operating hours; and (iv) the selection of the thermoelectric module along with its performance curve. To achieve the optimal configuration of the thermoelectric cogeneration system for a specific application, the design process should involve thermoelectric modules with different characteristics (performance curves and dimensions). The system configuration that best satisfies the specific requirements of the installation site should be chosen.
3.1.1. Forecast of Electrical Energy Demand and Load Current Estimation
The estimation of energy consumption in the thermoelectric system serves as the foundation for sizing the entire proposed system. This process involves calculating the daily energy consumption in watt-hours, taking into account that not all components operate continuously throughout the day. To determine the energy usage of each load, it is necessary to compile a list of the nominal power of each load and the number of hours each load operates for daily. The calculation follows Equation (1), and with the known load power and the effective voltage required for operation, the load current (ILoad) can be determined using Equation (2).
where PCons is the total energy consumption [Wh]; PLoad is the power of the load [W]; Nhour is the number of operating hours of the system [h], PLoad is the power of the load [W], and VLoad is the voltage of the load [V].
3.1.2. Estimation of the Number of TEG Modules
The number of thermoelectric modules needed for the cogeneration system is directly influenced by the load’s power and voltage requirements, as well as the temperature gradient within the thermal system, since the generated power increases proportionally with the temperature gradient. The selection of the thermoelectric module is critical at this stage because different models offer varying dimensions and characteristic performance curves for voltage, current, and power.
After determining the load current (ILoad), the next step is to choose the most suitable thermoelectric module for the project. The module’s datasheet should be reviewed to establish the optimal configuration of thermoelectric modules that will fulfill the voltage and current requirements of the load. This configuration is determined based on the temperature gradient of the thermal system and the performance curves of the selected modules. Figure 4 presents the performance curves for voltage, current, and power as a function of the temperature gradient, taken from the datasheet of the thermoelectric module inbC1-127.08HTS, WATRONIX [37].
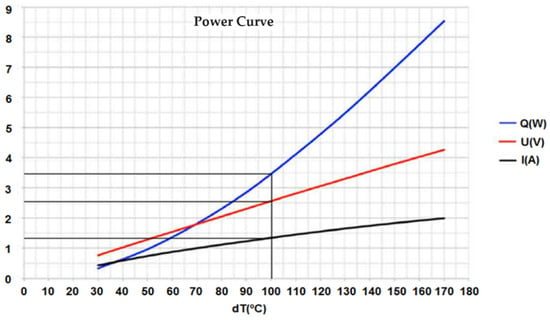
Figure 4.
Performance curves (voltage, current, and power) as a function of ΔT [37].
Some datasheets provide the hot and cold side temperatures instead of the temperature difference, as shown by the datasheet of the thermoelectric module TEHP1-24156-1.2, Thermomanic (Figure 5) [38].
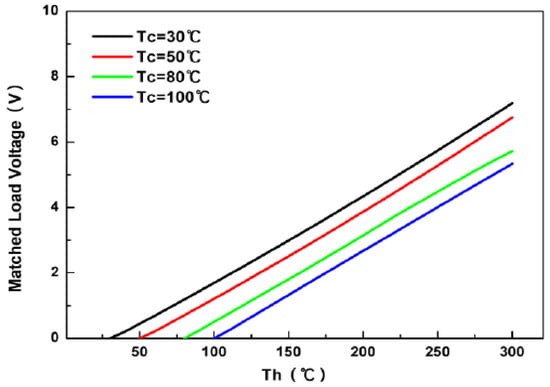
Figure 5.
Performance curve of generated voltage as a function of hot and cold temperatures [38].
Figure 5 shows the performance curve of the generated voltage for four different cold-side temperatures. If the system’s operating cold-side temperature (cold source) differs from the temperatures used to obtain the curves, the generated values should be approximated using interpolation based on Equation (3):
where TcHigh is the higher cold source temperature from the performance curve [°C], TcLow is the lower cold source temperature from the performance curve [°C], Tcmod is the cold source temperature for the thermoelectric module [°C], VHigh is the Voltage generated at TcHigh [V], VLow is the voltage generated at TcLow [V], and Vmod is the voltage generated at Tcmod [V].
Ideally, TcHigh and TcLow should be chosen so that Tcmod falls between these values. For example, if Tcmod is 70 °C, then TcHigh should be 80 °C and TcLow 50 °C. If Tcmod is 120 °C, TcHigh would be 100 °C and TcLow 80 °C. The interpolation method in Equation (3) is also recommended for determining the current or power generated based on performance curves, provided that the necessary adjustments are made.
3.1.3. Series Association in the Multi-String Electrical Arrangement
After determining the voltage generated by each thermoelectric module and the average input voltage required by the system’s DC–DC converter, the number of modules that need to be connected in series (NSerie) can be estimated, considering that the voltages of the individual modules will add up. The number of modules required to achieve the necessary voltage can be calculated using Equation (4), where ΔVConv represents the average voltage at the DC–DC converter [V], and Vmod denotes the voltage generated by each thermoelectric module [V].
It is essential to consider that the voltage used to power the converter should be the average of its maximum and minimum input values. For instance, if the DC–DC converter’s input voltage varies from 10 V to 20 V, then ΔVConv would be set at 15 V. This approach is vital for safety purposes, as the output voltage of the thermoelectric modules fluctuates with changes in the temperature gradient and can occasionally surpass the converter’s minimum or maximum input thresholds. If the resulting number of modules is not an integer, it should be appropriately rounded up or down to provide a wider operational range for the converter’s input voltage.
3.1.4. Parallel Association in the Multi-String Electrical Arrangement
Knowing the load current, the number of series blocks that need to be connected in parallel (NParallel) to meet the load current can be determined. The number of modules that must be connected in parallel to supply the maximum current required by the DC–DC converter (ICritical) is calculated using Equation (5), where ICritical is the maximum circuit current [A] and Imod is the current supplied per module [A].
As with the voltage-based calculation, the result is not always an integer. In this case, the number should always be rounded up because the current capacity of the modules must exceed the system’s current to ensure proper operation. For instance, if the calculated number is 3.9 modules, it is recommended to use 4 modules for full assurance, considering that temperature variations in the system also affect the maximum current of the modules. Adding more parallel blocks of modules does not pose a problem, as increasing the number of parallel blocks will not change the voltage but will increase the current capacity, providing extra reliability in case any module fails, though it will increase the project cost.
3.1.5. Multi-String Electrical Arrangement and Estimation of the Area the TEG System
Once the series and parallel configurations of the thermoelectric modules are determined, the total number of modules (Nmod) required for the electrical arrangement of the thermoelectric conversion system can be estimated using Equation (6), where NSerie represents the number of modules connected in series, and NParallel denotes the number of modules connected in parallel.
The minimum area (Area) occupied by the thermoelectric system can be determined based on the dimensions of the individual thermoelectric modules and the total number of modules required for the system’s electrical configuration. This area can be calculated using Equation (7), where Width and Length represent the dimensions of each module [cm], and Nmod is the total number of modules in the system.
3.2. Design of a TEG System (PoC) with a Multi-String Electrical Arrangement
To demonstrate the applicability of the developed methodology, this subsection will design a TEG system (PoC) with a multi-string electrical arrangement to operate with a temperature difference (ΔT) of approximately 100 °C, providing a load voltage of 12 Vdc and capable of supplying up to 30 Watts of power to the load.
The thermoelectric modules used are the INBC1-127.08HTS models from WATRONIX [37]. By applying the methodology described in Section 3.1 and using Equation (2), the maximum load current is determined to be 2 A. The DC–DC converter has a fixed output voltage of 12 Vdc with a fluctuating input voltage ranging from 10 to 34 V.
Based on the power curve provided in the datasheet (Figure 5), the output voltage of each module under load is determined to be 2.4 V, depending on the temperature gradient. This value will be used to calculate the required number of modules in series. Thus, for the calculations, the average input voltage of the DC–DC converter is used along with Equation (4) to determine the number of modules connected in series.
Since the calculated number of modules was fractional, it has been rounded to 10 modules in series (Nserie). The output voltage is then the product of the number of series-connected modules and the output voltage of each module (2.4 V), totaling 24 V.
Based on the power curve provided in the datasheet (Figure 5), with a temperature difference (ΔT) of approximately 100 °C, each module can supply around 3.5 W of power, with an output voltage of 2.4 Vdc and a current of 1.45 A. Therefore, applying Equation (5), the number of modules needed to be connected in parallel can be determined:
Thus, two parallel strings (Nparallel) should be used to ensure that the maximum operating current at the design temperature gradient is 2.9 A, which is greater than the system’s critical current of 2.4 A. The total number of modules in the multi-string arrangement is found by applying Equation (6), and the minimum area occupied by the TEG system is calculated using Equation (7).
3.3. Prototype of a Proof-of-Concept (PoC)
The Prototype of the TEG system with a multi-string electrical arrangement was designed using an analytical electrical design methodology to power a load of approximately 30 W, with an output voltage of 12 Vdc for a maximum operating temperature of +200 °C. The system utilizes 20 thermoelectric modules, model INBC1-127.08HTS by WATRONIX, arranged in a multi-string configuration (10 in series and 2 in parallel), covering a minimum area of 320 cm2. The cost for acquiring the TEG modules is $49.00 per unit, totaling $980.00. Each TEG module is capable of supplying approximately 3.5 W of power, with an output voltage of 2.4 Vdc and a current of 1.45 A per unit at a temperature difference (ΔT) of around 100 °C [29,37].
Figure 6 shows the schematic design of PoC, illustrating the electrical arrangement with 20 thermoelectric modules (model INBC1-127.08HTS by WATRONIX) configured with 10 modules in series and two strings connected in parallel [37].
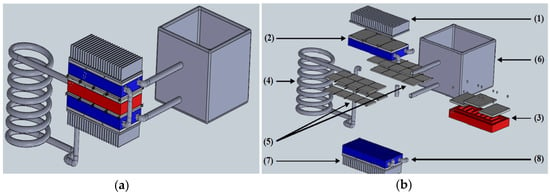
Figure 6.
Design of the proposed (a) and demonstrated parts and pieces of the generator (b).
The Proof of Concept (PoC) (Figure 6) is composed of two independent thermal transfer systems operating in tandem. The first system captures residual heat (3, 4) from industrial processes, comprising a heat transfer module (3) and a heat exchanger (hot plate) (4). This system facilitates heat transfer (4) via convection from the industrial process to the heat transfer block (3), where the thermoelectric modules (5) are arranged. The second system is a hybrid refrigeration–cogeneration setup (1, 2, 7, 8), which includes fins (1, 7) and a flat cooling block (2, 8) to enhance the contact area with the thermoelectric modules. This configuration generates hot water (6) that can be reused in the industrial process and maintains a thermal gradient essential for thermoelectric power generation. It is important to note that the thermal system can be adapted to various processes by replacing the heat exchanger (4), thereby optimizing thermal transfer to the TEG system.
4. Computational Numerical Modeling
This section addresses the computational modeling and simulation of a system composed of 20 thermoelectric generators (TEGs). The system is divided into three main parts: power generation, consisting of the thermoelectric modules under a specific temperature gradient; a DC–DC converter that maintains a constant output voltage; and a maximum power point tracker (MPPT). The initial focus is on simulating the modules based on a realistic model, evaluating their performance under different temperature gradients and loads. At the end of the chapter, an analysis is conducted to compare the accuracy of the simulated values with the experimental data.
The thermoelectric generator was initially modeled electrically as a non-ideal voltage source with a series resistance (), where the source voltage corresponds to the open-circuit voltage (), and the series resistance represents the internal resistance of the thermoelectric module. In this model, the open-circuit voltage is given by , where α is the Seebeck coefficient, and is the temperature gradient. The internal resistance is determined by adding a resistive load to the TEG terminals, measuring the output voltage and current. The internal resistance, , can be calculated (Equation (8)):
The power delivered to the load resistance is calculated from the voltage, , according to Equation (9):
By analyzing as a function of , keeping the other parameters constant, it is observed that power decreases as increases, as can be verified by calculating the limit of using Equation (10):
The power is zero both when the load resistance is zero and when this resistance is very high. The maximum power point occurs when .
Additionally, the short-circuit current, , is given by the ratio of the open-circuit voltage, , to the internal resistance, . When the load resistance equals the internal resistance, the current at the maximum power point (MPP) will be half of . Thus, it can be defined that the optimal operating point to extract the maximum power from a TEG should be according to Equation (11). The total power generated by the TEG, dissipated internally and in the load resistance, is described by Equation (12).
Rate that the power supplied varies according to the load resistance and the temperature gradient. For this reason, it is necessary for the load to be variable to track the variations of which change according to the Seebeck coefficient, while also remaining constant when required.
To obtain a fixed voltage, a DC–DC converter with a Perturb and Observe (P&O)- based MPPT algorithm is used. This algorithm measures the output current and voltage of the TEG and adjusts the converter’s duty cycle so that the resistance seen by the generator equals ; thus, allowing the maximum power to be extracted from the generator.
In the simulation, the inbC1-127.08HTS module from WAtronix Inc. (West Hills, CA, USA) was used in the Simulink/MATLAB (Version R 2023a). The simulation was adapted from the model provided by [16]. A system composed of 20 TEGs was simulated, arranged as two sets connected in parallel, with 10 TEGs in series in each set. The goal was to simulate a system with a converter capable of supplying 30 W at a constant 12 V to a load. The module used can generate 3.5 W of power with a voltage of 2.4 V and a current of 1.45 A under a temperature gradient of 100 °C. Based on the model developed in [16,20,21], the modules were assembled as shown in Figure 7, using a voltage source dependent on temperature parameters, the Seebeck coefficient, and the number of TEGs in series. Additionally, an internal resistance with a value equivalent to the series resistances was included.

Figure 7.
Internal view of the thermoelectric modules in Simulink®.
In the simulation, the gradient block (Th and Tc) calculates the difference between, which is then multiplied by the Seebeck coefficient and the number of modules; this will be the value of the dependent voltage source. A constant internal resistance value was used, as the data could not be obtained from the module manufacturer. The value used was the average measured internal resistance multiplied by the number of modules in series. The Seebeck coefficient and the internal resistance were calculated from the module power curve under a temperature gradient of 100 °C. Table 1 shows the data values used in the open circuit simulation.

Table 1.
Open Circuit Simulation Data.
The results of the computational simulation are presented in Figure 8, which shows the graph of the open circuit voltages of the system as the gradient varies from 5 °C to 80 °C with a 5 °C increment.
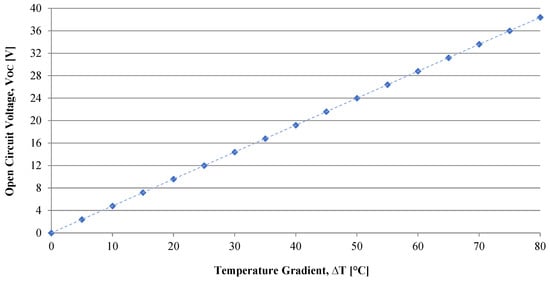
Figure 8.
Computational simulation results (no load) test (INBC1-127.08HTS).
The open circuit voltage is a straight line, as the Seebeck coefficient used is constant. Next, a variable load was added to measure the output values of the TEGs and obtain the voltage versus current curve, as well as the power versus voltage and power versus current curves. Figure 9 shows the system with the variable load and the meters.
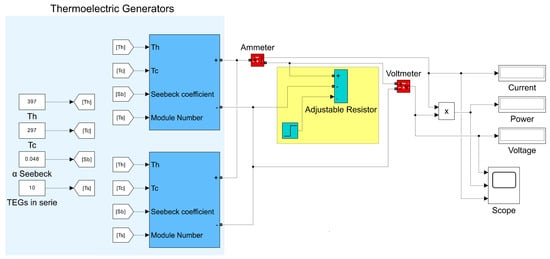
Figure 9.
Demonstration of circuit modeling with variable load.
As in the no load simulation, the same input values were used in both modules. The component and simulation data are presented in Table 2.

Table 2.
Variable Load Circuit Simulation Data.
Figure 10a shows the graphs generated from the simulation data. The first graph shows the variation of the output voltage relative to the current as a function of the temperature gradients.
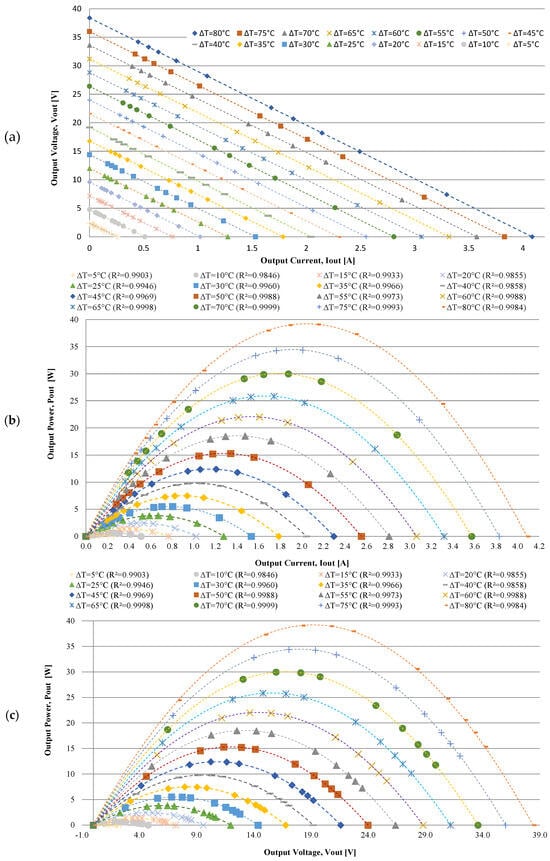
Figure 10.
Presents of computational simulation results (with load): (a) the output voltage versus output current curve; (b) the output power versus output current curve; and (c) the output power versus output voltage curve as a function of the temperature gradient.
The graph shows that the higher the temperature gradient, the farther from the origin the obtained line is. With a gradient of 80 °C, the voltage reaches up to 35 V under open-circuit conditions. However, the maximum power point is around 17 V–1.7 A. Very high or very low load resistance values relative to the TEG’s internal resistance result in an operating point close to one of the graph’s axes.
The power versus current graph (Figure 10b) shows a maximum of approximately 32 W–1.9 A operating under a gradient of 80 °C. As expected, the power increased until it reached a maximum point. After this point, the power begins to decrease as the current continues to increase until it reaches the short-circuit current limit of 3.7 A.
Meanwhile, Figure 10c shows the previous graph, where the power versus voltage graph exhibits a peak of maximum power around 32 W–17 V. As seen in the other graph, the highest voltage is the open-circuit voltage, occurring at 35 V when operating under a gradient of 80 °C.
5. Development and Experimental Analysis
This section outlines the development and experimental analysis of the TEG system, designed to output 30 W at 12 Vdc, with a maximum operating temperature of +200 °C. The system utilizes 20 thermoelectric modules (INBC1-127.08HTS—WATRONIX [29,30]). The experimental analysis was conducted with temperature gradients below the system’s maximum operating limit (Th = 170 °C) and a maximum temperature gradient (ΔT) of 80 °C. This limitation was necessary due to laboratory infrastructure constraints, particularly to comply with safety standards and ensure accurate data acquisition, as detailed in references [22,23,24]. The results of the experimental analysis are presented in Figure 11.
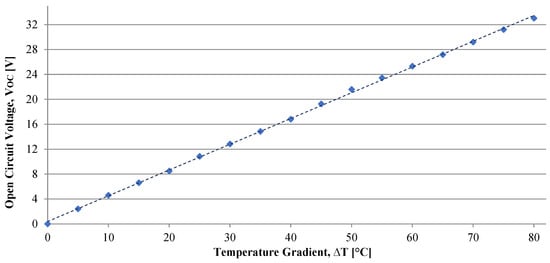
Figure 11.
Presentation of experimental results (no load)—a graph of the output voltage in the open circuit test (INBC1-127.08HTS).
The open circuit test involves subjecting the system to a defined temperature gradient and measuring its thermal properties, such as the temperatures of the hot and cold sources, along with the electrical voltage generated at the open terminals (Vout), with no load connected. Figure 11 illustrates the graph obtained from the open circuit test, depicting how the output voltage (Vout) increases with varying temperature gradients (ΔT). The results clearly indicate a linear relationship between the generated voltage and the temperature gradient. By applying the least squares method to the output voltage (Vout) data, Equation (13) is derived, which characterizes the open circuit voltage. To maintain a constant output voltage, the use of a DC–DC converter is necessary.
To determine the voltage–current (V-I) characteristics of the thermoelectric generator, a series of resistors were employed as the load to measure the output voltage (Vout) in volts [V] and the output current (Iout) in amperes [A] across various temperature gradients (ΔT) ranging from 5 °C up to the maximum operating limit of 80 °C. The results are depicted in Figure 12a, where the dashed lines represent linear regressions obtained using the least squares method, with each line corresponding to 5 °C intervals of temperature gradient.
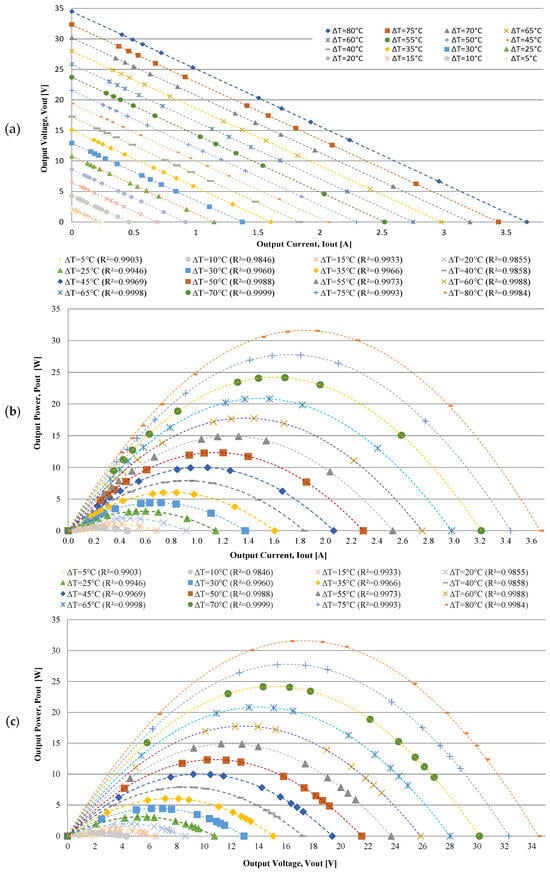
Figure 12.
Presentation of experimental results (with load): (a) the output voltage versus output current curve; (b) the output power versus output current curve; and (c) the output power versus output voltage curve as a function of the temperature gradient.
From examining the relationship between output voltage (Vout) and output current (Iout) at different temperature gradients (ΔT = TH − TC [°C]) in Figure 12a, it is clear that both Vout and Iout increase proportionally as the temperature gradient (ΔT) rises. This leads to a substantial increase in output power (Pout) at higher temperature gradients. The curves in Figure 12a exhibit a degree of linearity across different temperature gradients, which is attributed to the linear response of the module’s internal resistance (Rint) relative to the temperature gradient during the testing.
To determine the maximum power curve delivered by the solid-state generator, data from the open circuit test (Figure 11) and the voltage-current curve (Figure 12a) were employed. These data establish a direct proportional relationship between the temperature gradient (ΔT) and the power output (Pout) in watts [W] for a given fixed load resistance (RL) in ohms [Ω]. According to basic circuit analysis principles, the power dissipated in the external load is given by [W]. Using this equation with different resistance values as the fixed load (RL), Figure 12b shows the curve of maximum power output (Pout) as a function of output current (Iout) for various temperature gradients (ΔT). Figure 12c illustrates the maximum power output (Pout) curve as a function of output voltage (Vout) for different temperature gradients. The dashed curves in Figure 12b,c were derived by multiplying the linear regression lines from Figure 12a by the current delivered by the module to the load.
By examining the power output (Pout) curve as a function of the output current (Iout) in Figure 12b, the maximum current and power that the thermoelectric generator can supply at different temperature gradients (ΔT) can be identified. Similarly, by analyzing the maximum power curve (Pout) as a function of output voltage (Vout) shown in Figure 12c, the maximum power output (Pout) and corresponding voltage (Vout) at the output terminals of the solid-state thermoelectric generator can be determined for various temperature gradients.
6. Results and Discussion
In this section, the comparative results of the analytical, computational numerical, and experimental methodologies for the design and analysis of thermoelectric generators (TEGs) are presented and discussed. The analysis focuses on the main performance indicators: output power, voltage, and current. The results obtained with a temperature gradient of 80 °C for each methodology are detailed and compared below. Table 3 summarizes the results for the variables of power (P), voltage (V), and current (I) in the different methods. As observed, there are significant differences in the error percentages between the analytical, computational numerical, and experimental methods.

Table 3.
Results obtained with a temperature gradient of 80 °C.
Table 4 presents the percentage errors of the analytical and computational numerical methods in comparison to the experimental values. It is observed that the power in the analytical method showed an average error of 47.2% compared to the experimental value, indicating a significant discrepancy, suggesting that the analytical model may not capture all relevant factors. In contrast, the computational numerical method showed a smaller error of approximately 26.0%, indicating greater accuracy and alignment with the experimental data.

Table 4.
Percentage errors of the analytical and computational numerical models compared to experimental results for different temperature gradients.
The voltage in the analytical method had a percentage error of 17.9%, while the computational numerical method presented an error of only 4.5%. These results suggest that the computational model is significantly more accurate in estimating voltage, possibly because it considers temperature-dependent parameters.
As for the current, the analytical method presented an error of 35.3%, while the computational numerical method had an error of 22.8%, again showing greater accuracy of the computational model.
The 80 °C gradient was selected as it is representative of steady-state operation in practical applications. When comparing the graphs (Figure 10c and Figure 12c), it becomes evident that the computational method offers more accurate and reliable estimates compared to the analytical method when confronted with the experimental data. This underscores the importance of using detailed computational models to obtain more realistic predictions, considering temperature variations and other influencing factors.
Although the analytical model provides quick estimates, it does not account for variations in material properties with temperature changes, which can lead to significant discrepancies in real-world scenarios where thermal conditions are dynamic. The computational model, in turn, offers more detailed and accurate insights, although it requires substantial computational resources and precise data for predictions.
The experimental approach validates the theoretical models and highlights practical challenges, such as thermal management and electrical insulation, which are crucial for the effective implementation of TEG systems. The experimentation also revealed practical issues not captured by the theoretical models, such as thermal transfer between hot and cold surfaces, which affect the accuracy of the models.
Moreover, the theoretical models assume a uniform temperature gradient throughout the TEG multi-string arrangement, which is an oversimplification. In practice, surface roughness and other thermal resistances create significant variations in the temperature gradient and thermal losses of the TEG [25].
Therefore, each methodology has its strengths and limitations. An integrated approach that combines all three methodologies offers the most comprehensive solution for TEG system design: the analytical model is effective for initial sizing, the computational numerical model provides detailed performance analysis under variable conditions, and the experimental model validates the system’s applicability on a real scale, offering directions for future optimizations.
As a continuation of this research, the focus will be on developing a computational model that incorporates the other parameters, taking into account temperature gradient fluctuations, the variation of internal resistance with temperature, and other external influencing factors such as the inclusion of thermal losses associated with coupling and temperature gradient variation along the surface of the TEG multi-strings.
Buck Converter Design: Computational and Experimental—In order to ensure that the multi-string TEG provides a stable power supply to the load at a constant voltage, it is essential to design and implement a buck converter. The design of this converter is based on the voltage and power parameters generated by the TEGs and the required values needed to power the load. Additionally, the energy utilization characteristics for DC–DC converters, as illustrated in Figure 3, were considered in the design process.
To reduce the available DC voltage from the TEGs to a lower and constant value, a buck converter was designed utilizing the fundamental equations governing such converters. Figure 13 depicts the TEG modules integrated with the buck converter circuit modeled in Simulink®. Two distinct simulations were conducted: one under open-circuit conditions (No load) and the other under loaded conditions, employing the parameters listed in Table 5.
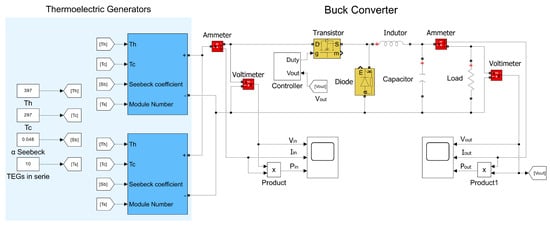
Figure 13.
Demonstration of buck converter circuit with a resistive load.

Table 5.
Buck converter design parameters circuit simulation.
The temperature gradient was incremented in 5 °C steps up to 80 °C. For each increment, the input and output voltages of the converter were measured. The resulting graphs, presented in Figure 14, show the relationship between the input voltage and the output voltage of the converter, both under open-circuit conditions and with a 4.8 Ohm load connected at the output.
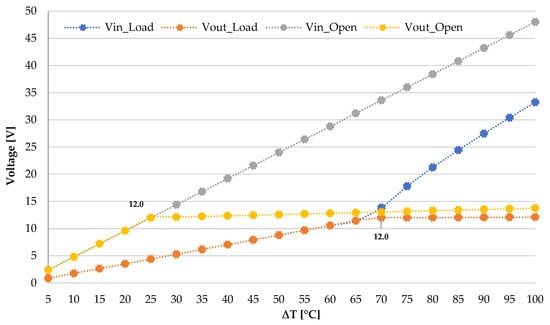
Figure 14.
Computational simulation results (open circuit and with load).
When operating under open-circuit conditions (no load), the converter exhibits a slight voltage drop compared to the input voltage at a ∆T of 25 °C. Under loaded conditions, the output voltage is approximately one-third of the input voltage at a ∆T of 70 °C, successfully achieving the expected voltage output designed for the converter. Additionally, the performance of the buck converter was experimentally analyzed by calculating the overall efficiency based on the input and output values of the converter (Table 5), demonstrating an efficiency exceeding 92.5%.
7. Conclusions
This paper presents a comprehensive comparative analysis of the accuracy of various methodologies for the design and analysis of thermoelectric generators (TEGs) operating under different temperature gradients. By employing analytical, computational numerical, and experimental approaches, the research aimed to evaluate the performance and efficiency of TEG systems in energy harvesting applications.
The findings of this study demonstrate that each methodology offers unique and valuable insights into the performance of TEG systems.
Analytical Methodology: The analytical model effectively estimated power output, voltage, and efficiency based on theoretical performance data across industrial temperature gradients. This methodology is particularly useful for initial dimensioning and configuration, providing quick and reliable estimates that can serve as a foundation for more detailed analyses.
Computational Numerical Model: The Simulink/MATLAB model, which incorporated temperature-dependent variations in the Seebeck coefficient and internal resistance, produced highly accurate predictions. The detailed analysis provided by the computational model under varying temperature conditions underscored the importance of accounting for these variations to achieve realistic and reliable results in the TEG system design.
Experimental Analysis: The experimental tests validated the performance of the TEG prototype, confirming the accuracy of both the analytical and computational models. Furthermore, the experimental approach identified practical challenges, such as thermal management and electrical insulation, which are critical for the successful implementation of TEG systems in real-world applications.
The comparative analysis revealed that an integrated approach, combining analytical, computational, and experimental methodologies, offers the most comprehensive solution for TEG system design. The analytical model is effective for initial design and dimensioning, the computational model provides detailed performance analysis, and the experimental analysis ensures real-world validation, making this approach robust and reliable.
In summary, this paper highlights several key contributions and potential applications of TEG systems, particularly those operating in multi-string electrical arrangements for energy harvesting. These systems have potential applications across various sectors, including wearable electronics, building integration, and automotive industries. The research demonstrates the value of an integrated approach that combines analytical, computational, and experimental methodologies for the design and analysis of TEG systems. Where, the key contributions of this study include: (i) comparative evaluation: the research successfully compared different methodologies for TEG design, providing a thorough evaluation of each approach’s accuracy and efficiency. (ii) Integrated insights: the integrated methodology offered unique insights into the performance and efficiency of TEG systems, with the combined approach delivering the most robust and comprehensive solution. (iii) Experimental application: the potential for using these modeling approaches in the accurate and efficient design of TEG systems in energy harvesting contexts is significant. The innovative aspects and advantages of the methodologies are as follows:
Simplified Analytical Method: This method uses performance curves provided by manufacturers, offering a quick way to estimate TEG configuration and sizing values. Its main advantages are the ease of application and rapid estimation of electrical configuration, making it ideal for initial analyses. However, this method does not consider external factors, non-uniform temperature gradients, coupling resistance, and variations in the internal resistance of the modules, leading to a higher margin of error.
Computational Method Integrated with the Analytical Model: The integration of the computational method with the analytical model allows for the inclusion of critical factors such as internal losses, variations in temperature gradients between strings, and coupling resistances. This approach offers greater accuracy by considering the variation of internal resistance as a function of temperature, enabling a more realistic estimate of the system output. When used together, the computational model enhances the precision of the results, providing a detailed analysis of real operating conditions.
Practical Implications and Future Research Directions: The methodologies developed in this study significantly contribute to the understanding and implementation of TEGs in energy harvesting systems, promoting energy efficiency and sustainability. The study facilitates the practical application of TEGs, especially in self-powered systems, standing out for its practical approach and adaptability. Future research should focus on developing models that integrate dynamic temperature gradient variations and external parameters, as well as exploring new materials that could improve TEG performance under extreme conditions.
Challenges in Practical Applications: Among the main challenges identified are the precise control of temperature gradients and the need to manage thermal losses and coupled resistances, which directly affect TEG performance. Practical implementation requires careful adaptation of theoretical models to reflect the complexities of real operating conditions.
The integrated approach proposed in this study offers a robust and accessible pathway for the design and analysis of multi-string TEGs, enhancing prediction accuracy and promoting broader use in diverse sectors. The methodologies developed serve as a foundation for future research and practical applications, enhancing the efficiency and sustainability of energy harvesting technologies. As a continuation of this research, it is proposed to develop an integrated model for the sizing of the heat transfer system and the MPPT converter with an optimized power conditioner. This model should combine thermal and electrical simulations using computational tools to maximize TEG efficiency, utilizing advanced techniques to optimize energy extraction and storage for energy harvesting applications.
Author Contributions
Conceptualization: O.H.A.J., E.A.d.S., E.R.d.L., S.V.B.D. and J.P.P.d.C.; methodology: O.H.A.J., E.A.d.S., E.R.d.L., S.V.B.D. and J.P.P.d.C.; validation: O.H.A.J., S.V.B.D. and J.P.P.d.C.; investigation and simulation: O.H.A.J., E.A.d.S. and E.R.d.L.; writing—original draft preparation: O.H.A.J., E.A.d.S., E.R.d.L., S.V.B.D. and J.P.P.d.C.—review and editing: O.H.A.J., E.A.d.S., E.R.d.L., S.V.B.D. and J.P.P.d.C.; project administration: O.H.A.J.; funding acquisition: O.H.A.J. and J.P.P.d.C. All authors have read and agreed to the published version of the manuscript.
Funding
This research was partially supported by the FACEPE agency (Fundação de Amparo a Pesquisa de Pernambuco) throughout the project with references APQ-0616-9.25/21 and APQ-0642-9.25/22. O.H.A.J. was funded by the Brazilian National Council for Scientific and Technological Development (CNPq), grant numbers 407531/2018-1, 303293/2020-9, 405385/2022-6, 405350/2022-8 and 406662/2022-3, as well as the Program in Energy Systems Engineering (PPGESE) Academic Unit of Cabo de Santo Agostinho (UACSA), Federal Rural University of Pernambuco (UFRPE) and the Federal University of Latin American Integration (UNILA).
Data Availability Statement
The original contributions presented in the study are included in the article, further inquiries can be directed to the corresponding author.
Conflicts of Interest
The authors declare no conflict of interest.
References
- Rowe, D.M. CRC Handbook of Thermoelectrics; CRC Press: Boca Raton, FL, USA, 1995. [Google Scholar]
- Riffat, S.B.; Ma, X. Thermoelectrics: A Review of Present and Potential Applications. Appl. Therm. Eng. 2003, 23, 913–935. [Google Scholar] [CrossRef]
- Snyder, G.J. Small Thermoelectric Generators. Electrochem. Soc. Interface 2008, 17, 54–56. [Google Scholar]
- Ding, L.C.; Akbarzadeh, A.; Tan, L. A review of power generation with thermoelectric system and its alternative with solar ponds. Renew. Sustain. Energy Rev. 2018, 81, 799–812. [Google Scholar]
- Gao, M. Thermoelectric Energy Harvesting; Artech House: Norwood, MA, USA, 2010; Volume 413–414, pp. 325–336. [Google Scholar]
- Ando Junior, O.H.; Maran, A.L.O.; Henao, N.C. A Review of the Development and Applications of Thermoelectric Microgenerators for Energy Harvesting. Renew. Sustain. Energy Rev. 2018, 91, 376–393. [Google Scholar] [CrossRef]
- Gao, M.; Rowe, D.M. Conversion Efficiency of Thermoelectric Combustion Systems. IEEE Trans. Energy 2007, 22, 528–534. [Google Scholar]
- Martins, J.; Goncalves, L.M.; Antunes, J.; Brito, F. Thermoelectric Exhaust Energy Recovery with Temperature Control through Heat Pipes; SAE International: Warrendale, PA, USA, 2011; pp. 1–23. [Google Scholar]
- Ismail, B.I.; Ahmed, W.H. Thermoelectric Power Generation Using Waste-Heat Energy as an Alternative Green Technology. In Recent Patents on Electrical Engineering; Bentham Science Publishers Ltd.: Potomac, MD, USA, 2009; Volume 2, pp. 27–39. [Google Scholar]
- Fairbanks, J. Vehicular Thermoelectric Applications. In Proceedings of the 6th European Conference on Thermoelectrics, Paris, France, 2–4 July 2008; Available online: http://ect2008.icmpe.cnrs.fr (accessed on 24 September 2012).
- Azarbayjani, M.; Anderson, J. Assessment of Solar Energy Conversion Technologies-Application of Thermoelectric Devices in Retrofitan Office Building. In Proceedings of the Sixteenth Symposium on Improving Building Systems in Hot and Humid Climates, Plano, TX, USA, 15–17 December 2008. [Google Scholar]
- Omer S., A.; Infield, D.G. Design optimization of thermoelectric devices for solar power generation. Sol. Energy Mater. Sol. Cells 1998, 53, 67–82. [Google Scholar]
- Dalola, S.; Ferrari, V.; Guizzetti, M.; Marioli, D.; Sardini, E.; Serpelloni, M.; Taroni, A. Autonomous Sensor System with RF Link and Thermoelectric Generator for Power Harvesting. In Proceedings of the International Instrumentation and Measurement Technology Conference, Victoria, BC, Canada, 12–15 May 2008. [Google Scholar]
- Fernández-Yáñez, P.; Gómez, A.; García-Contreras, R.; Armas, O. Evaluating thermoelectric modules in diesel exhaust systems: Potential under urban and extra-urban driving conditions. J. Clean. Prod. 2018, 182, 1070–1079. [Google Scholar]
- Kwan, T.H.; Wu, X.; Yao, Q. Multi-objective genetic optimization of the thermoelectric system for thermal management of proton exchange membrane fuel cells. Appl. Energy 2018, 217, 314–327. [Google Scholar]
- Mamur, H.; Üstüner, M.A.; Bhuiyan, M.R.A. Future Perspective and Current Situation of Maximum Power Point Tracking Methods in Thermoelectric Generators. Sustain. Energy Technol. Assess. 2022, 50, 101824. [Google Scholar] [CrossRef]
- Qasim, M.A.; Alwan, N.T.; PraveenKumar, S.; Velkin, V.I.; Agyekum, E.B. A New Maximum Power Point Tracking Technique for Thermoelectric Generator Modules. Inventions 2021, 6, 88. [Google Scholar] [CrossRef]
- Shao, R.; Yang, B.; Chen, N.; Han, Y. Maximum Power Point Tracking of Thermoelectric Generation Systems Under Nonuniform Temperature Distribution: A State-of-the-Art Evaluation. Front. Energy Res. 2022, 10, 857261. [Google Scholar] [CrossRef]
- Dalala, Z.M.; Saadeh, O.; Bdour, M.; Zahid, Z.U. A New Maximum Power Point Tracking (MPPT) Algorithm for Thermoelectric Generators with Reduced Voltage Sensors Count Control †. Energies 2018, 11, 1826. [Google Scholar] [CrossRef]
- Mamur, H.; Coban, Y. Detailed Modeling of a Thermoelectric Generator for Maximum Power Point Tracking. Turk. J. Electr. Eng. Comput. Sci. 2020, 28, 124–139. Available online: https://journals.tubitak.gov.tr/elektrik/vol28/iss1/9 (accessed on 2 August 2023). [CrossRef]
- Mamur, H.; Taşkin, S.; Aliüstüner, M. Modeling and Validation of the Thermoelectric Generator with Considering the Change of the Seebeck Effect and Internal Resistance. Turk. J. Electr. Eng. Comput. Sci. 2022, 30, 2688–2706. [Google Scholar] [CrossRef]
- Ando, O.H.; Izidoro, C.L.; Gomes, J.M.; Correia, J.H.; Carmo, J.P.; Schaeffer, L. Acquisition and Monitoring System for TEG Characterization. Int. J. Distrib. Sens. Netw. 2015, 11, 531516. [Google Scholar] [CrossRef]
- Izidoro, C.L.; Ando Junior, O.H.; Carmo, J.P.; Schaeffer, L. Characterization of Thermoelectric Generator for Energy Harvesting. Measurement 2017, 106, 283–290. [Google Scholar] [CrossRef]
- Ando Junior, O.H.; Calderon, N.H.; De Souza, S.S. Characterization of a Thermoelectric Generator (TEG) System for Waste Heat Recovery. Energies 2018, 11, 1555. [Google Scholar] [CrossRef]
- Kramer, L.R.; Maran, A.L.O.; de Souza, S.S.; Ando Junior, O.H. Analytical and Numerical Study for the Determination of a Thermoelectric Generator’s Internal Resistance. Energies 2019, 12, 3053. [Google Scholar] [CrossRef]
- Chamby Espejo, S.C.; Silva de Souza, S.; Ando Junior, O.H. Development of a Biochemical Oxygen Demand Incubator Prototype Based on Thermoelectric Effect with Monitoring System. IEEE Lat. Am. Trans. 2020, 18, 2037–2046. [Google Scholar] [CrossRef]
- Oliveira Maran, A.L.; Guerrero Martin, C.A.; Montes-Páez, E.; Ando Junior, O.H. Modelling and Simulation of a Thermoelectric Waste Heat Recovery System—TWRHS. DYNA 2021, 88, 265–272. [Google Scholar] [CrossRef]
- Calderón-Henao, N.; Venturini, O.J.; Franco, E.H.M.; Eduardo Silva Lora, E.; Scherer, H.F.; Maya, D.M.Y.; Ando Junior, O.H. Numerical–Experimental Performance Assessment of a Non-Concentrating Solar Thermoelectric Generator (STEG) Operating in the Southern Hemisphere. Energies 2020, 13, 2666. [Google Scholar] [CrossRef]
- Ando Junior, O.H. Microgerador termoelétrico para captação de energia baseado no efeito seebeck com sistema de transferência de calor intercambiável. BR nº BR1020130279471, 30 out. 2013, 04 fev. 2014. Revista da Propriedade Industrial, v. 1, n. 2254, 2014.
- Oliveira, F.M.; Ledesma, J.J.G.; Ando Junior, O.H. Rastreamento do Ponto de Máxima Potência (MPPT) Para Sistemas de Energia Solar Fotovoltaica: Técnicas, Implementação e Desempenho sob Sombreamento Parcial; CRV: Curitiba, Brazil, 2024; Volume 1, p. 284. [Google Scholar] [CrossRef]
- Watanabe, R.B.; Ando Junior, O.H.; Leandro, P.G.M.; Salvadori, F.; Beck, M.F.; Pereira, K.; Brandt, M.H.M.; de Oliveira, F.M. Implementation of the Bio-Inspired Metaheuristic Firefly Algorithm (FA) Applied to Maximum Power Point Tracking of Photovoltaic Systems. Energies 2022, 15, 5338. [Google Scholar] [CrossRef]
- Oliveira, F.M.; Mariano, A.C.S.; Salvadori, F.; Ando Junior, O.H. Power Management and Power Quality System Applied in a Single-Phase Nanogrid. Energies 2022, 15, 7121. [Google Scholar] [CrossRef]
- Oliveira, F.M.; Brandt, M.H.M.; Salvadori, F.; Izquierdo, J.E.E.; Cavallari, M.R.; Ando Junior, O.H. Development of an MPPT-Based Genetic Algorithm for Photovoltaic Systems versus Classical MPPT Techniques in Scenarios with Partial Shading. Inventions 2024, 9, 64. [Google Scholar] [CrossRef]
- Barbi, I. Eletrônica de Potência; Edição do Autor: Florianópolis, Santa Catarina, Brasil, 2005; Available online: https://inep.ufsc.br/livros/ (accessed on 2 August 2023).
- Barbi, I.; Martins, D.C. Conversores CC-CC Básicos Não Isolados; Edição dos Autores: Florianópolis, Santa Catarina, Brasil, 2000; Available online: https://inep.ufsc.br/livros/ (accessed on 2 August 2023).
- Dileep, G.; Singh, S.N. Selection of non-isolated DC-DC converters for solar photovoltaic system. Renew. Sustain. Energy Reviews 2017, 76, 1230–1247. [Google Scholar] [CrossRef]
- inbThermoelectric. inbC1-127.08HTS Thermoelectric Power Generation Datasheet. Available online: http://www.inbthermoelectric.com/Thermoelectric-Peltier-Modules/Power-Generators/inbC1-127.08HTS.html (accessed on 24 April 2024).
- Thermonamic. TEHP1-24156-1.2 Thermoelectric Module Datasheet; Thermonamic: Xiamen, China, 2022; Available online: https://www.thermonamic.com/TEHP1-24156-1.2-English.pdf (accessed on 19 April 2024).
Disclaimer/Publisher’s Note: The statements, opinions and data contained in all publications are solely those of the individual author(s) and contributor(s) and not of MDPI and/or the editor(s). MDPI and/or the editor(s) disclaim responsibility for any injury to people or property resulting from any ideas, methods, instructions or products referred to in the content. |
© 2024 by the authors. Licensee MDPI, Basel, Switzerland. This article is an open access article distributed under the terms and conditions of the Creative Commons Attribution (CC BY) license (https://creativecommons.org/licenses/by/4.0/).