Article

Improvement of Power Production Efficiency Following the Application of the GD InC Maximum Power Point Tracking Method in Photovoltaic Systems

Department of Electrical Engineering, Gachon University, Seongnam-si 13120, Republic of Korea
*
Author to whom correspondence should be addressed.
Energies 2024, 17(20), 5148; https://doi.org/10.3390/en17205148
Submission received: 24 July 2024 / Revised: 8 October 2024 / Accepted: 11 October 2024 / Published: 16 October 2024
(This article belongs to the Section F3: Power Electronics)

Abstract

:
This paper proposes a new maximum power point tracking (MPPT) method based on machine learning with improved power production efficiency for application to photovoltaic (PV) systems. Power loss occurs in the incremental conductance (InC) method, depending on the size of the voltage step used to track the maximum power point. Additionally, the size of the voltage step must be specified by the initial user; however, an appropriate size cannot be determined in a rapidly changing environment. To solve this problem, this study presents a gradient descent InC (GD InC) method that optimizes the size of the voltage step by applying an optimization method based on machine learning. The effectiveness of the GD InC method was verified and the optimized size of the voltage step was confirmed to produce the largest amount of power. When the size of the voltage step was optimized, a maximum difference of 4.53% was observed compared with the case when the smallest amount of power was produced. The effectiveness of the GD InC method, which improved the efficiency of power production by optimizing the size of the voltage step, was verified. Power can be produced efficiently by applying the GD InC method to PV systems.

1. Introduction

Owing to the persistent climate crisis, decarbonization through energy transition has emerged as a major element. Among decarbonization methods, the photovoltaic system, a source of renewable energy with relatively low facility costs compared with its power generation capacity, is in the limelight, and the number of relevant facilities is increasing every year [1,2,3].
However, the power production of PV systems is determined by factors such as the amount of solar radiation and temperature. Therefore, it is essential to apply the maximum power point tracking method, which enables the production of maximum power at all times. Among various MPPT methods, those that are used popularly are the perturb and observe (P&O) method and the incremental conductance method.
The P&O method was used to track the maximum power point by comparing the current voltage and power to the previous voltage and power. Additionally, the incremental conductance algorithm detects the slope of the P–V curve and the maximum power point (MPP) is tracked by searching for the peak in the P–V curve. The algorithm detects the MPP based on the size of the slope, and the maximum power point that occurred when the slope was 0. However, in the case of the P&O and InC methods, power loss occurs depending on the size of the voltage step in the process of tracking the maximum power point [4,5,6,7].
There are two categories of techniques proposed to effectively track the MPP in PV system modelling. The first category is based on conventional approaches, such as the fractional open circuit method [8], the short circuit current method [9], the perturb and observe method [10], and the incremental conductance method [11]. The conventional techniques are easy to implement, cheap, and are most widely used in commercial products. The second category is based on the soft computing approach, for instance the fuzzy logic control technique [12], the artificial neural network method [13], the particle swarm optimisation method [14], the ant-colony optimisation method [15], and the differential evolution method [16]. In cases where the voltage step size is large, the maximum power point is reached quickly; however, accurate maximum power point tracking is difficult because of excessive voltage fluctuations at the maximum power point. In addition, when the size of the voltage step is small, an accurate maximum power point is tracked; however, it takes a long time to reach the maximum power point. To solve this problem, methods such as the variable and adaptive InC methods, which change the size of the voltage step by multiplying the voltage step by a constant or exponential function, have been proposed; however, all the above-mentioned MPPT methods require the determination of the size of the initial voltage step. Therefore, it is difficult to select the appropriate voltage step size for PV systems, which have nonlinear output characteristics [17].
Therefore, this study proposes the gradient descent incremental conductance (GD InC) method, which optimizes the constant β, which determines the size of the voltage step of the adaptive InC method, to derive an appropriate voltage step. The GD InC method is a technique that adopted the gradient descent method among the optimization methods of machine learning, and the optimization process compares the power production results when PV panels are ideal and when MPPT was performed to derive the constant β value with the least error.
In addition, simulations were conducted using PSIM to analyze the effectiveness of the GD InC method. Based on the simulations, a DSP-based hardware was developed, and experiments were conducted to verify whether the same effectiveness could be achieved in a real environment. According to the results, it was found that the case in which the optimized β value was applied produced the largest amount of power, and through the foregoing, the performance of the GD InC method was verified.

2. Analysis of Various MPPT Methods for PV Systems and Methods to Apply the GD InC Method

2.1. Analysis of the P&O Method

The P&O method involves the installation of voltage and current sensors at the output terminal of a solar panel and comparing the initial values with the current voltage and power until the maximum power point is reached to determine the direction of the voltage step and determine the maximum power point based on the foregoing. Figure 1 shows the operation process of the P&O method, and the maximum power point tracking process is divided into a total of four cases. That is, when the power difference is positive, an increment is added to the voltage step and the output power is compared again to reduce the power difference. This is repeated until the power difference becomes negative to track the maximum power point. In addition, because the perturbation continues to maintain production at the maximum power point, the phenomenon of oscillation occurs even in the steady state, which is a loss; depending on the fixed voltage step, loss may be induced as the tracking performance degrades. A conventional P&O method has the advantage of being easy to implement due to its simple algorithm and can be widely used in terms of maximum power point tracking performance, but it is relatively inefficient in terms of power production efficiency. Various algorithms have been proposed to solve this problem, such as the derived InC method and variable MPPT with variable voltage step size [18,19,20].

2.2. Analysis of the InC Method

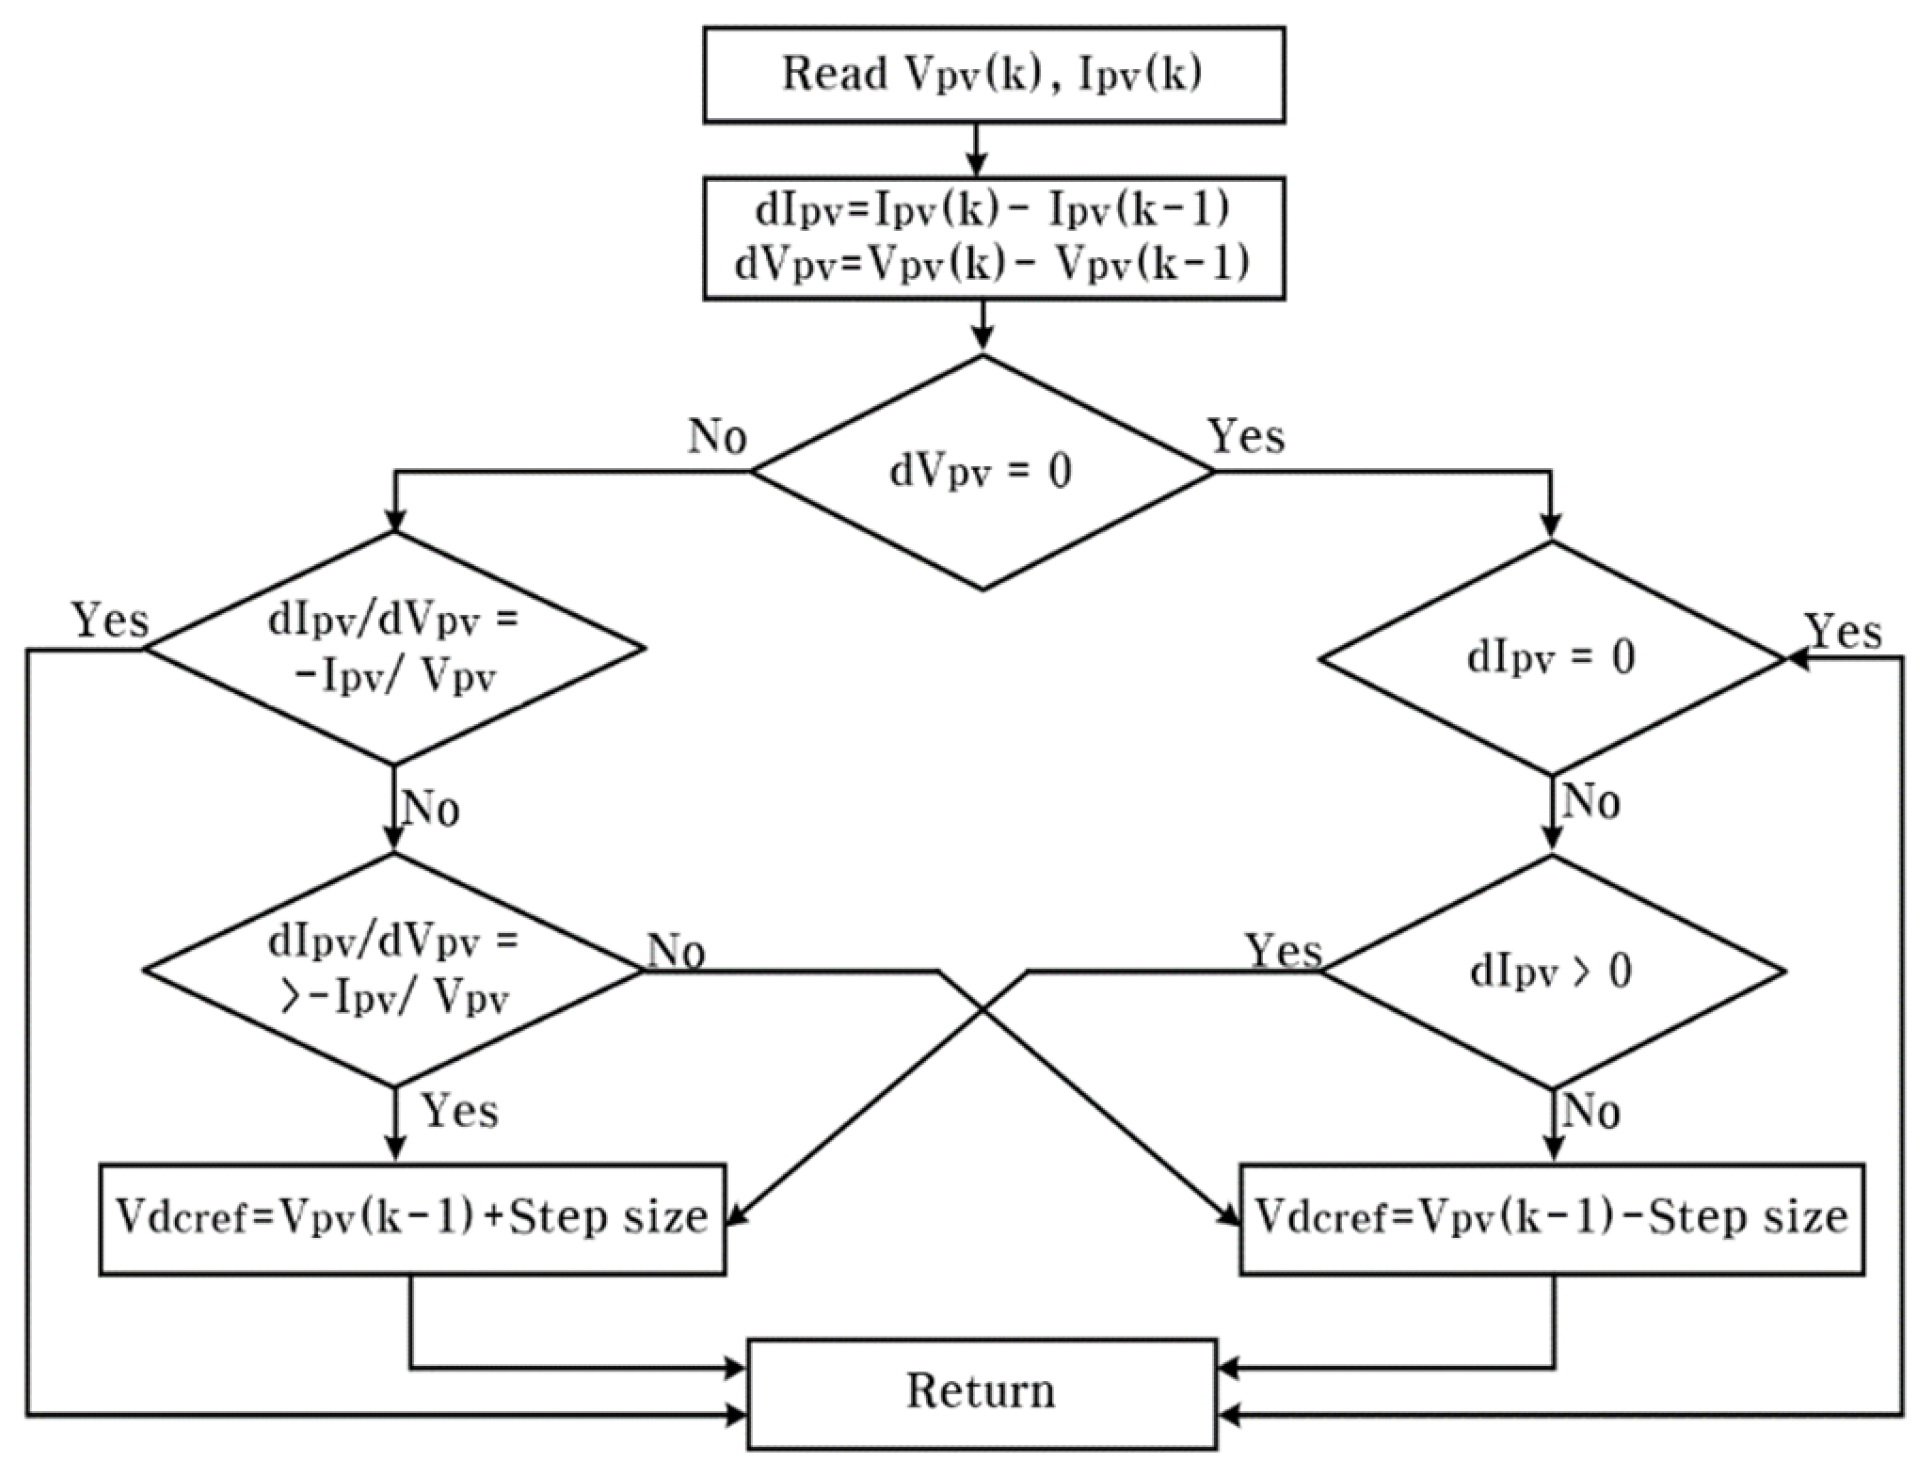
Figure 2 shows the operation process of the InC method and compares the instantaneous and incremental conductance. In this case, the output conductance is the ratio of current to voltage (I/V), and the incremental conductance refers to the ratio of the difference between current and voltage (ΔI/ΔV). The maximum power point was tracked by comparing the two relationships of incremental conductance and instantaneous conductance. If dI/dV > 0, the reference voltage increases with a fixed step voltage. However, if dI/dV < 0, the reference voltage decreases following the fixed step voltage, and the maximum power point is reached when the size of the slope (i.e., the size of the voltage step) becomes 0.
Many researchers have reported that the INC algorithm offers better performance than the P&O algorithm during rapidly changing weather conditions. The InC method has the advantage of tracking the maximum power point at a faster rate than the P&O method [21,22,23,24,25,26,27].

2.3. Performance Comparison for Selecting Appropriate MPPT Methods

In the actual experiment, to select a more appropriate MPPT technique, we aim to compare the performance of commonly used MPPT methods and identify the most effective one. This will allow us to introduce an algorithm that can increase power production in photovoltaic systems. From the data in Table 1, it can be seen that, according to the experimental results of reference [19], the results of the maximum output power of PV cells are 15.85 W and 19.78 W when light intensity is 800 W/ m 2 and 1000 W/ m 2 . The tracking accuracy of the perturbation observation method is the worst because the process of its maximum power point tracking has been in a fluctuating state. Therefore, in this paper, we have introduced the InC technique and will compensate for the shortcomings of the existing InC method

2.4. Derivation of Problems with the InC Method

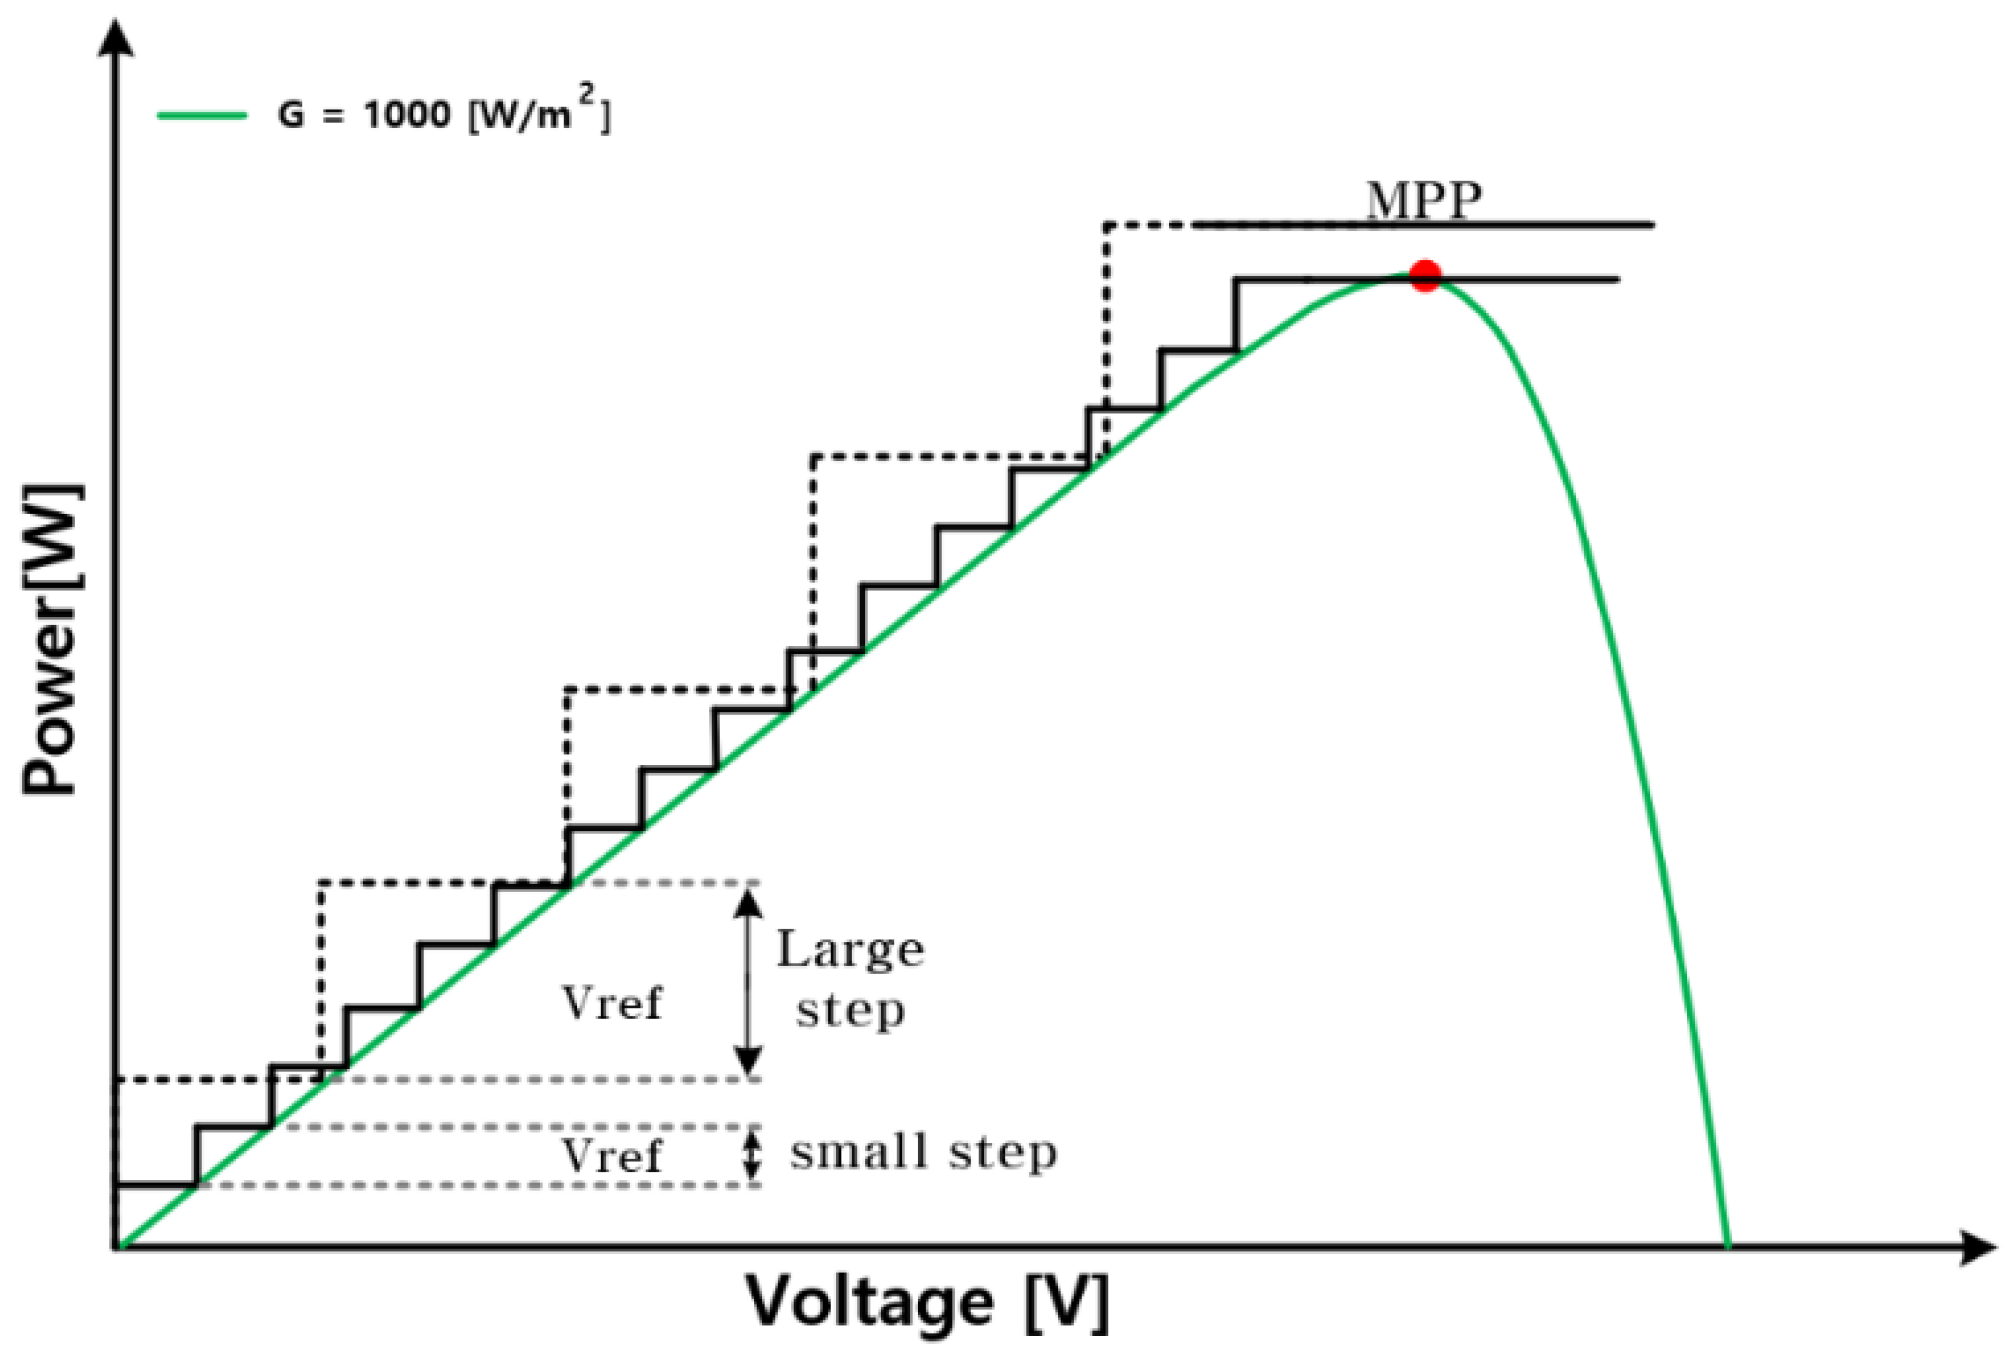
The InC method has two problems: power loss according to the size of the voltage step and the fact that power production is determined by the size of the voltage step initially specified by the user. Figure 3 shows a comparison of the operation processes when the size of the voltage step is small and when the size of the voltage step is large. When the size of the voltage step is small, an accurate MPP is tracked, but the MPP reaching time is delayed, resulting in a relatively low power production efficiency. However, when the voltage step is large, the speed at which the MPP was reached was enhanced. However, an accurate maximum power point can cannot be tracked because the oscillation in the steady state near the maximum power point is large. Therefore, methods to solve the shortcomings, such as varying the size of the voltage step by multiplying the size of the voltage step by a constant, have been proposed [28,29,30,31,32,33].
Additionally, the InC method has a fundamental limitation in that the size of the voltage step must be set initially, and it is difficult to select an appropriate voltage step size every time a PV system is installed in a rapidly changing external environment. In this study, to solve the problems of the InC method, the GD InC method, which can improve power production efficiency by designing an algorithm that introduces the gradient descent method among the optimization methods of machine learning to derive an appropriate voltage step size, was used.

2.5. Operation of the Proposed GD InC Method and the Optimization Process

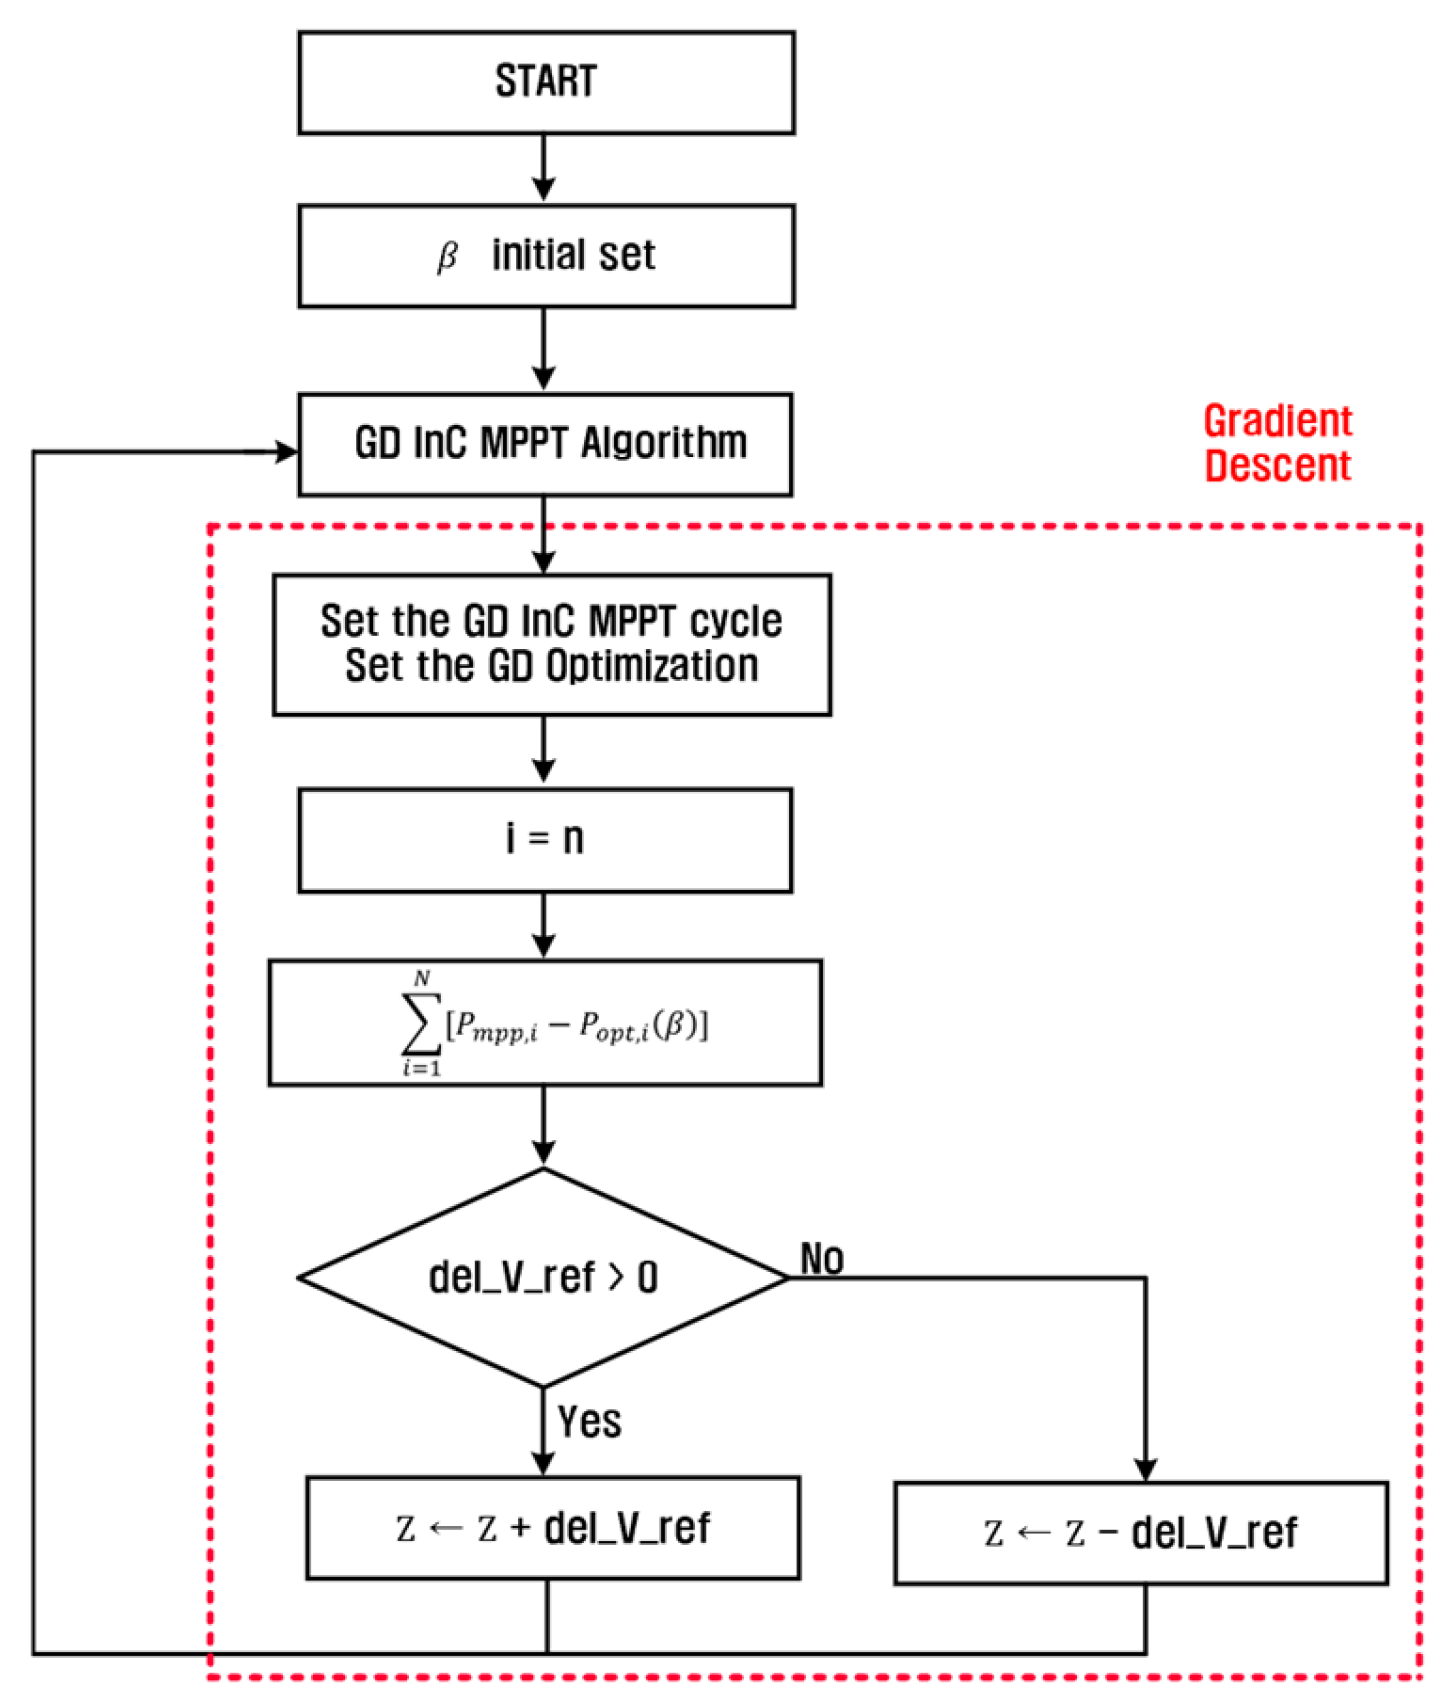
Figure 4 shows the operation process of the proposed GD InC method. A key characteristic of the GD InC method is minimizing the error of the objective function. The sequence indicates that the objective function to be optimized is set first. In this case, the subject to be optimized is the constant β, which varies the voltage step. Next, the number of iterations for the GD InC method is set to determine the learning capacity of the optimization technique in machine learning.
d e l _ V r e f = β P V
As shown in Figure 4, when the proposed GD InC method is operated for the first time, it is necessary to set i , the number of iterations for the GD InC method, and z , the number of iterations for the gradient descent method. Subsequently, optimization of β is performed using the gradient descent method, as expressed in Equation (2). This process minimizes the difference between the maximum power a PV panel can produce, and the power generated when MPPT is implemented.
M i n i m i z e = i = 1 N [ P m p p , i P o p t , i ( β ) ]
  • P m p p = m a x i m u m   p r o d u c e d   p o w e r   o f   p h o t o v o l t a i c   s y s t e m
  • P o p t = i t h   p r o d u c e d   p o w e r   w h e n   a p p l y i n g   M P P T
When the conditions in Equation (2) are not satisfied, the z-value is subtracted or added repeatedly until the conditions are satisfied. That is, the operation process of the GD InC method performs MPPT n times and thereafter compares the accumulated power amounts by β value to derive the β value that produces the largest accumulated power amount.
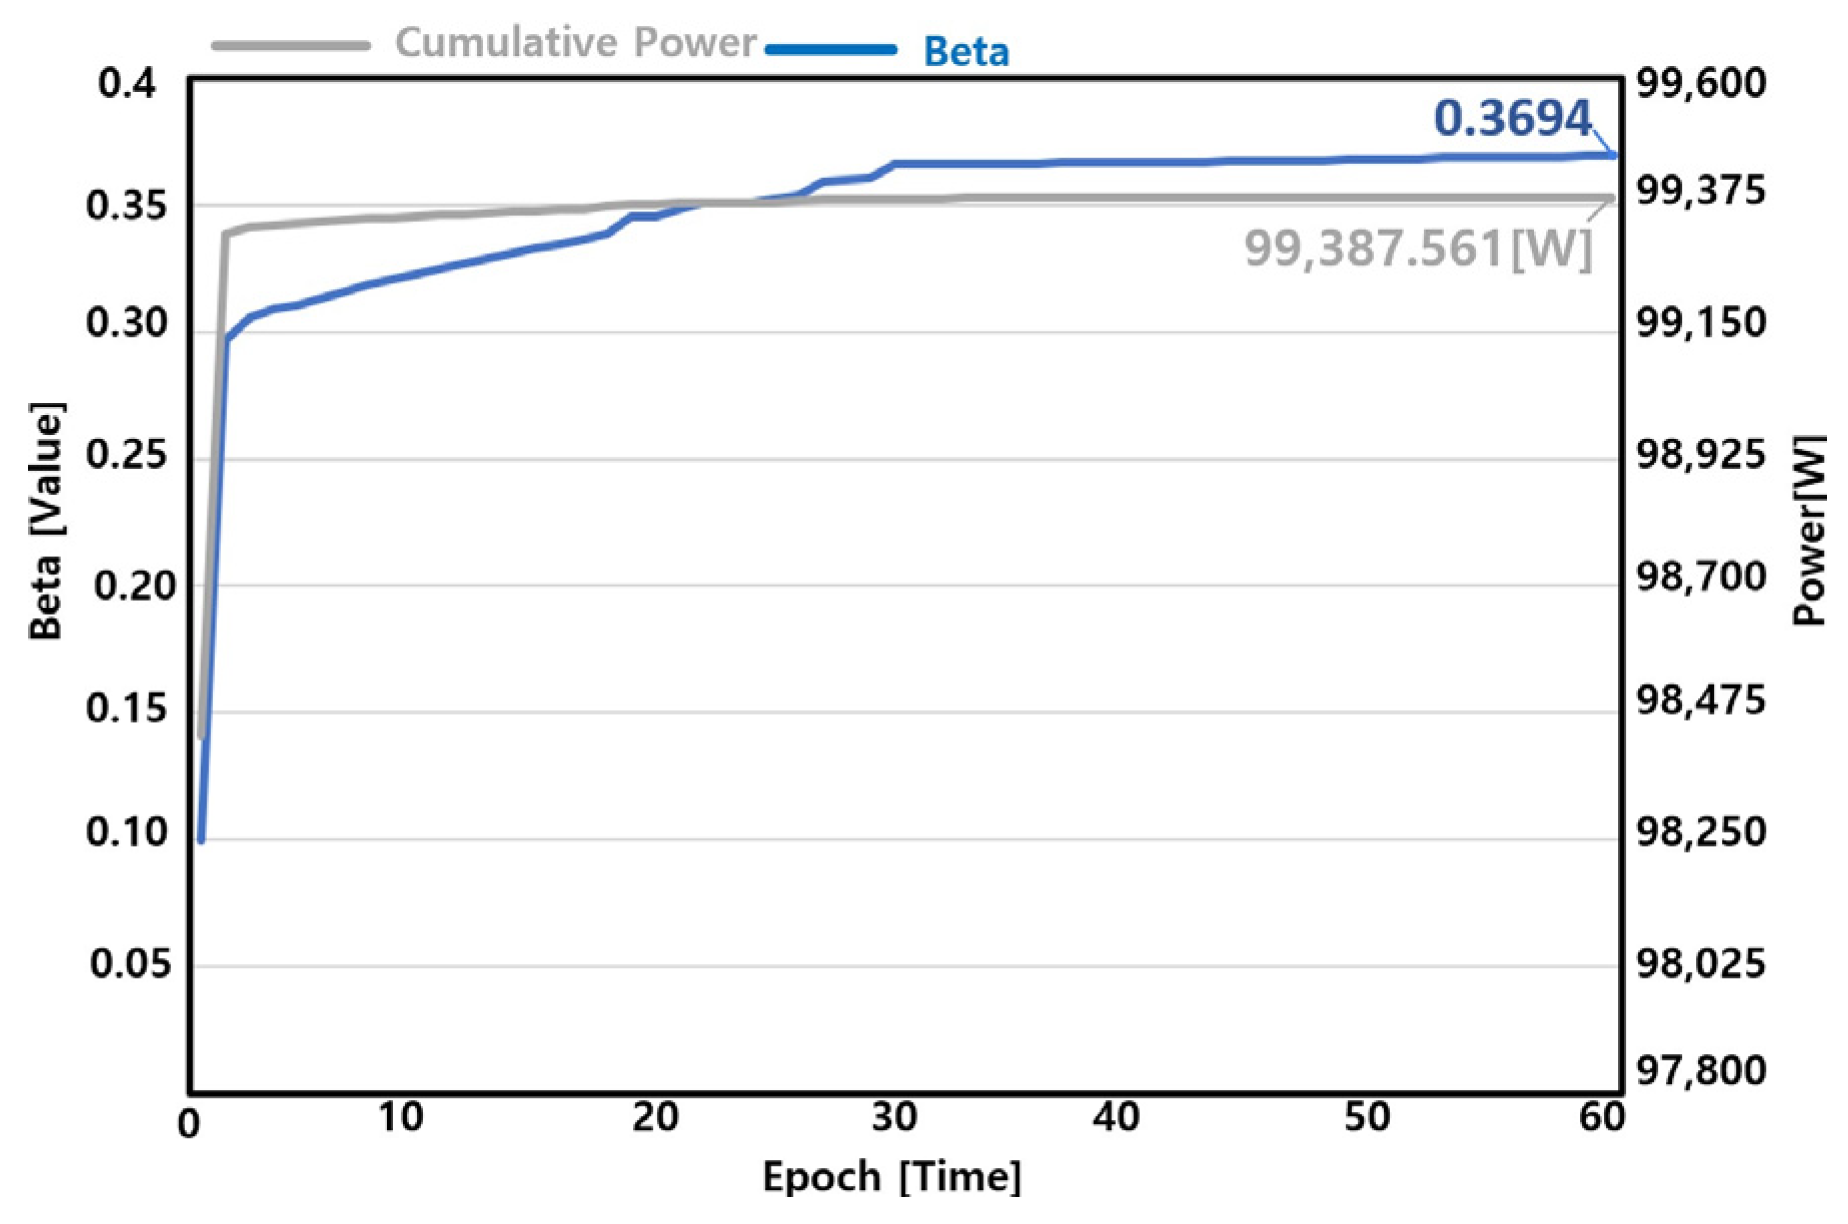
Figure 5 shows the summarized results of the machine learning optimization process. The gray solid line represents the accumulated power amount, and the blue solid line represents the β value. In addition, Beta means the β in Equation (1) that determines the size of the voltage step, and Epoch means the amount of learning. The amount of learning is 60 times of learning in total when 1000 iterations of MPPT is regarded as one time of learning. That is, the results of power production by performing the GD InC method 1000 times by β value are compared to finally derive the β value that produces the largest amount of power. Based on the result, 0.3694 is the β value that produces the largest amount of power, which is approximately 99,387 W.

3. Simulations and Experiments to Verify the Effectiveness of the Proposed GD InC Method

3.1. Analysis of the Effectiveness of the GD InC Method Through Simulation

Simulations were conducted to analyze the effectiveness and characteristics of the GD InC method. One PV panel and a DC-DC converter were used. A flyback converter was applied to the topology of the DC-DC converter. The converter consisted of voltage and current sensors, capacitors, transformers, and diodes. The turn ratio of the transformer was 1:4 and the switching frequency was set to 20 kHz. Additionally, the GD InC method and voltage control were set to be performed through DSP. Furthermore, the results derived through the GD InC were compared with the cumulative power amounts of other β values. The environment applied to the simulation was standard test conditions (STC), where the amount of solar radiation was assumed to be 1000 W / m 2 and the temperature was assumed to be 25 °C. The goal of the simulations was to identify the maximum power point tracking performance and the voltage control performance of the flyback converter.
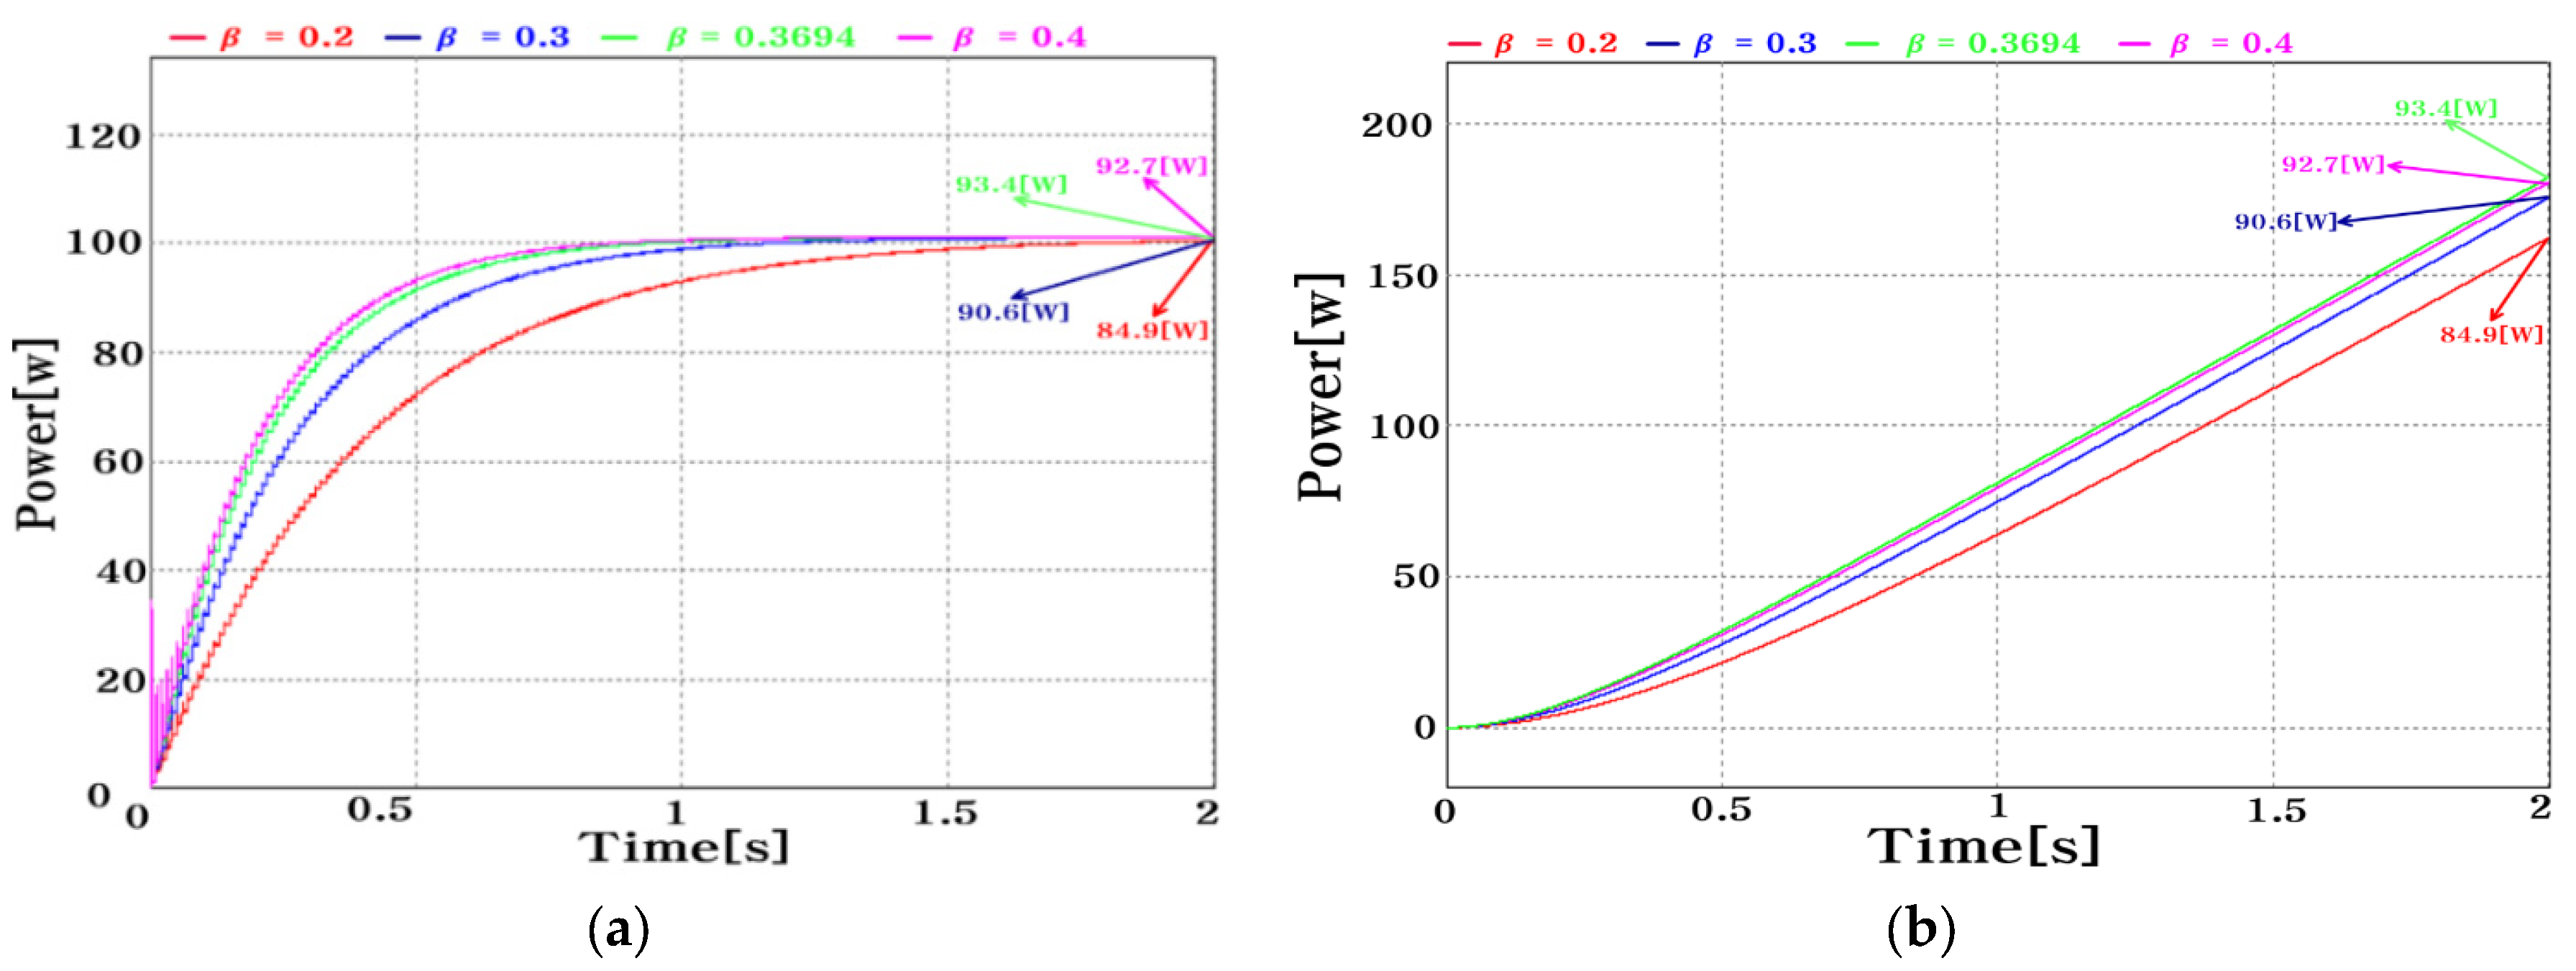
Figure 6 shows the simulation results based on the circuit diagram shown in Figure 6. According to the results in Figure 7a, power production increased linearly from 84.9 W when β was 0.2 to 90.6 W when β was 0.3, and 93.4 W when β was 0.3694. However, when β was 0.4, the MPPT reaching time was the earliest, but excessive voltage ripple occurred at the beginning. It was confirmed that, consequently, less power was produced, averaging 92.7 W, compared with the case where β was 0.3694.
Figure 7b shows the result of the cumulative calculation of the power production shown in Figure 7a, which indicates the cumulative power amount and shows the result of the measurement of the maximum values. It was found that when β was 0.3694, the largest amount of power was produced at 201.2 W, followed by the case where β was 0.4 at 199.9 W. Additionally, it can be seen that power production was relatively low when β was 0.2. Through the foregoing, it was confirmed that the optimized β produces the largest amount of power.

3.2. DSP-Based Hardware Design and Production

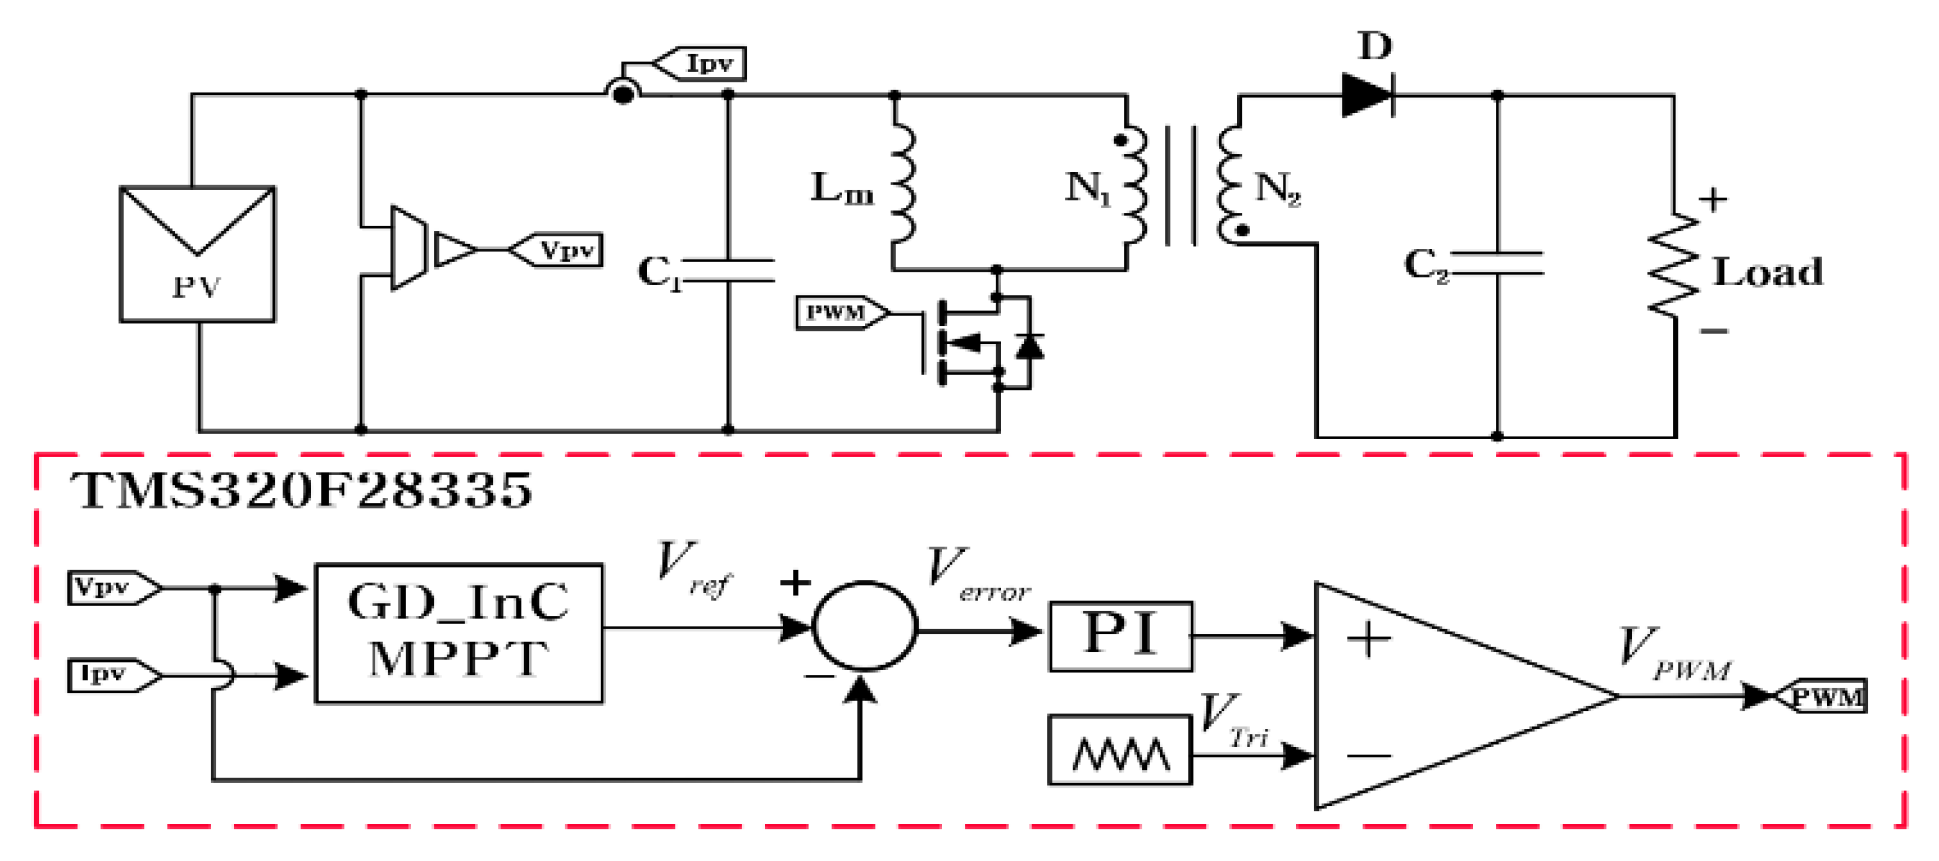
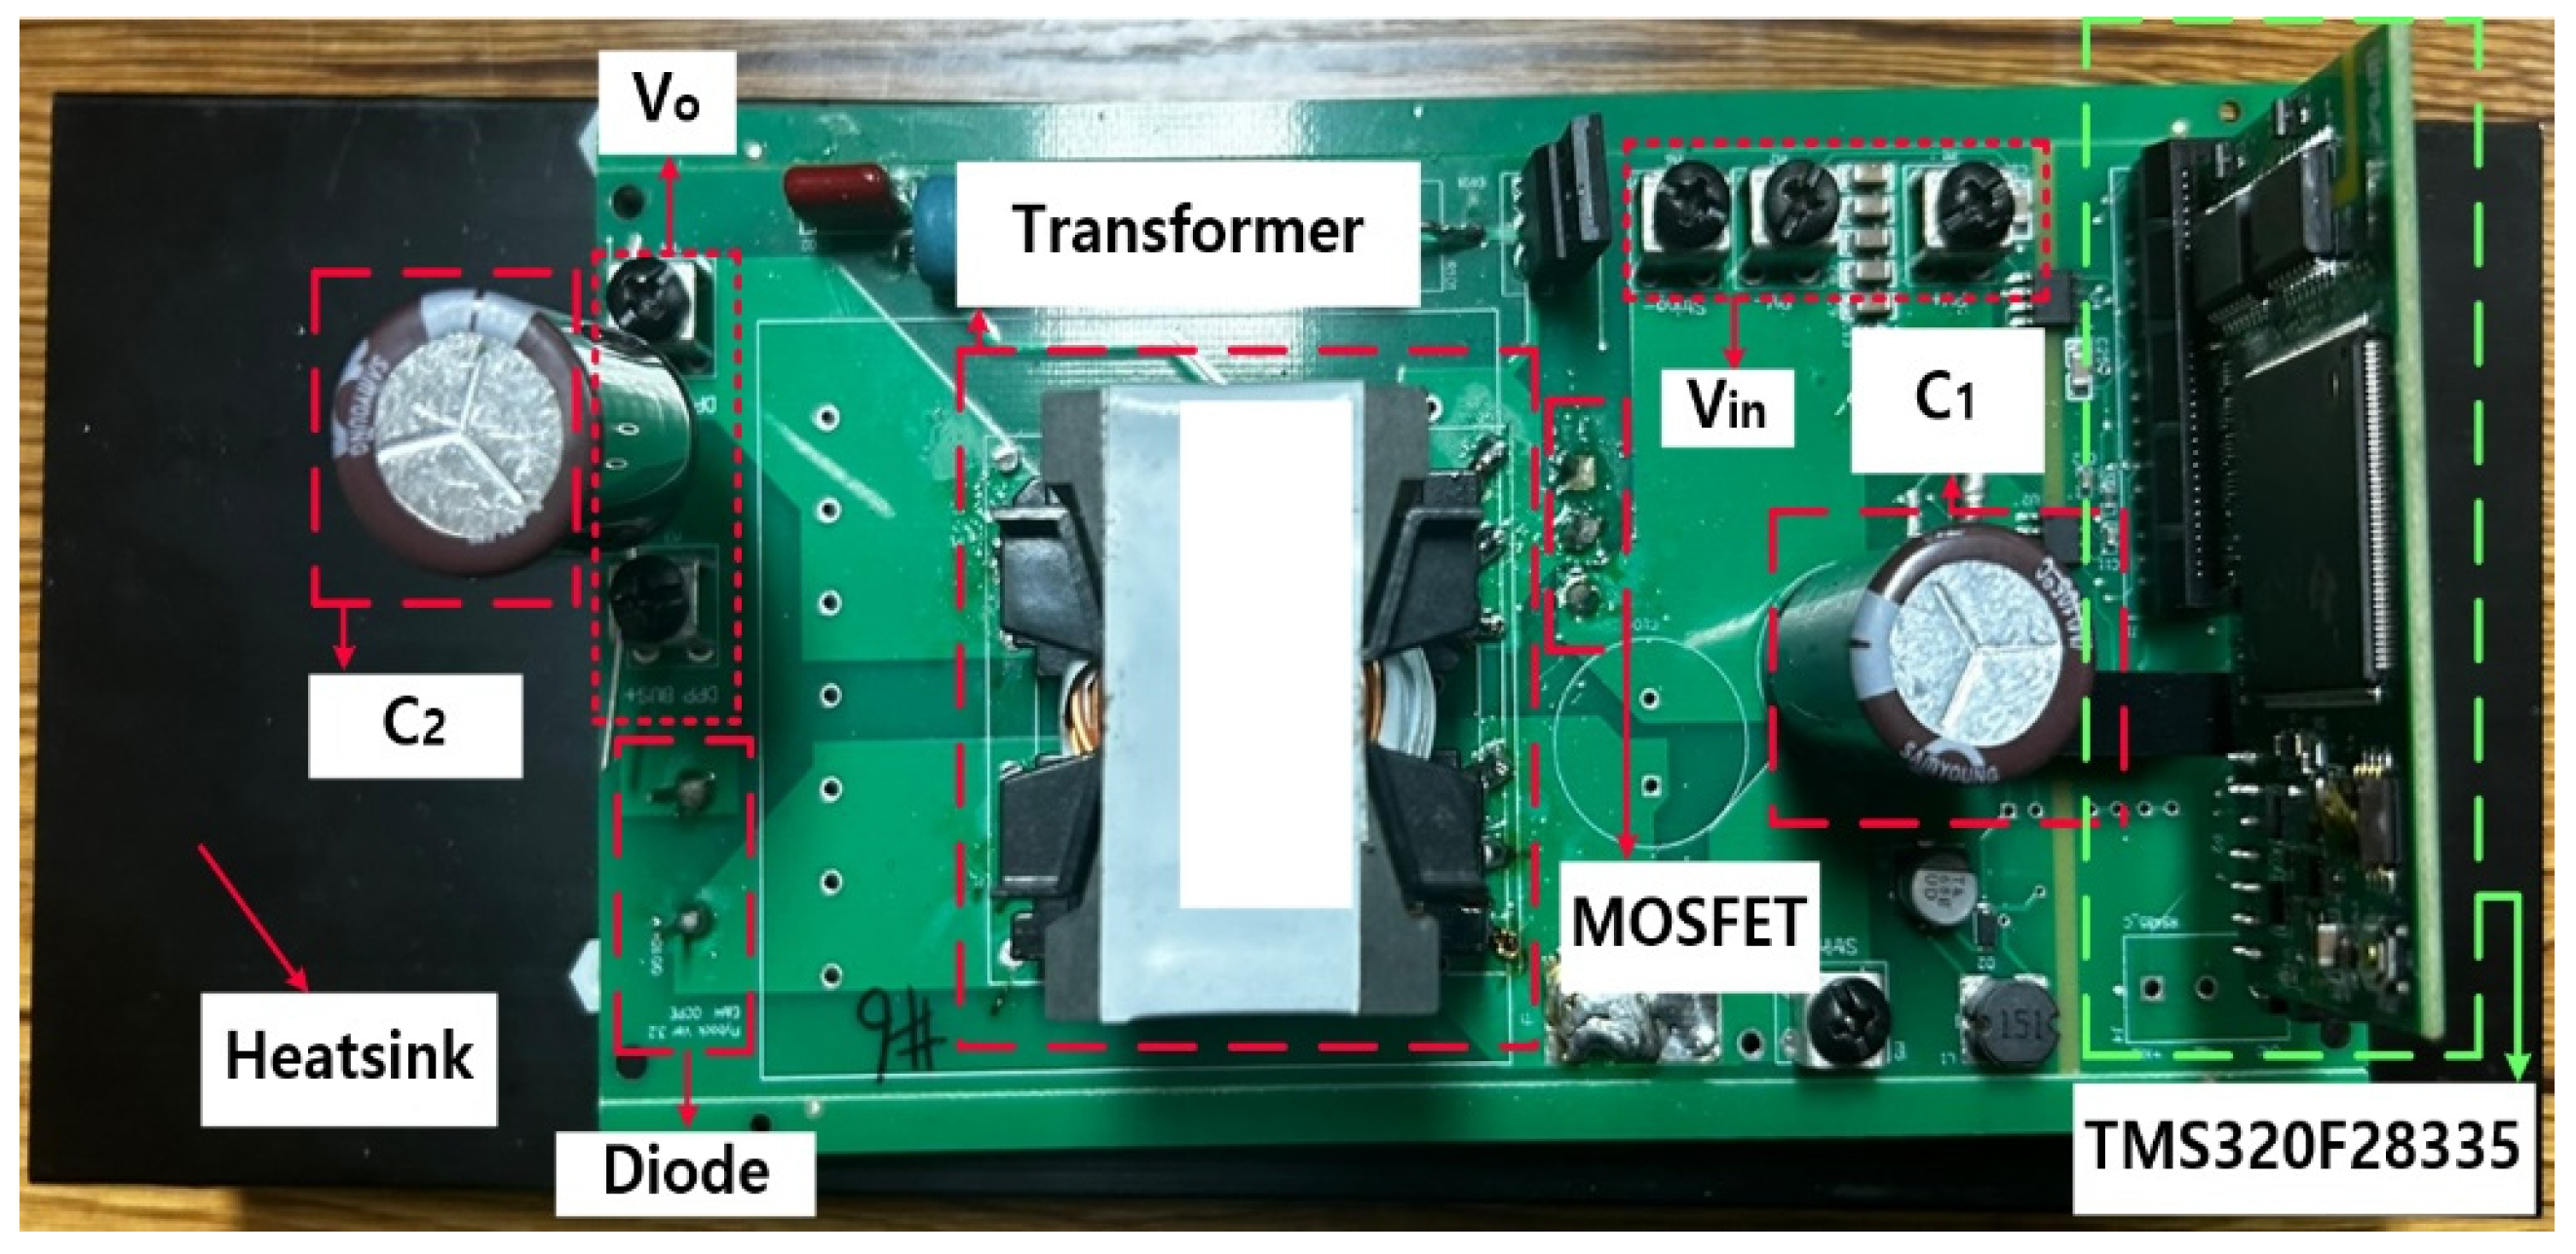
To verify the performance of the GD InC method, a DSP-based hardware designed based on simulations was used to conduct the experiments. In this case, the TMS320F28335 from Texas instruments in the Dallas, TX, USA was Used was used as the DSP. The MOSFT and diode applied to the flyback converter were attached to the heat sink at the bottom. A voltage sensor was located at the input terminal, and a current sensor was located at the output terminal of the PV panel. The values measured by the attached sensors were input to the DSP. V r e f was generated using the input voltage and current values. Thereafter, V T r i and V e r r o r were compared, and the results were compared with a triangular wave through a PI controller to generate a PWM waveform. Signals were stably supplied to the MOSFET so that voltage control could be performed. In this case, the target output voltage of the flyback converter was 80 V, and the circuit diagram designed for the above experiment is shown Figure 8, and Figure 9 shows the actual flyback converter.

3.3. Analysis of the Effectiveness of the GD InC Method Through Experiment

Experiments were conducted to verify the performance and effectiveness of the GD-InC method. The experimental equipment was configured as shown in Figure 10, with a 100 W PV panel, one electronic load, and one flyback converter. Additionally, an oscilloscope, two voltage probes, and two current probes were used. In this case, the math function of the oscilloscope was used to set the equipment to measure the average power of the panel and the cumulative power obtained by accumulating the power produced. In this case, the unit measured and displayed is kiloJoule. This unit was then converted to watts.
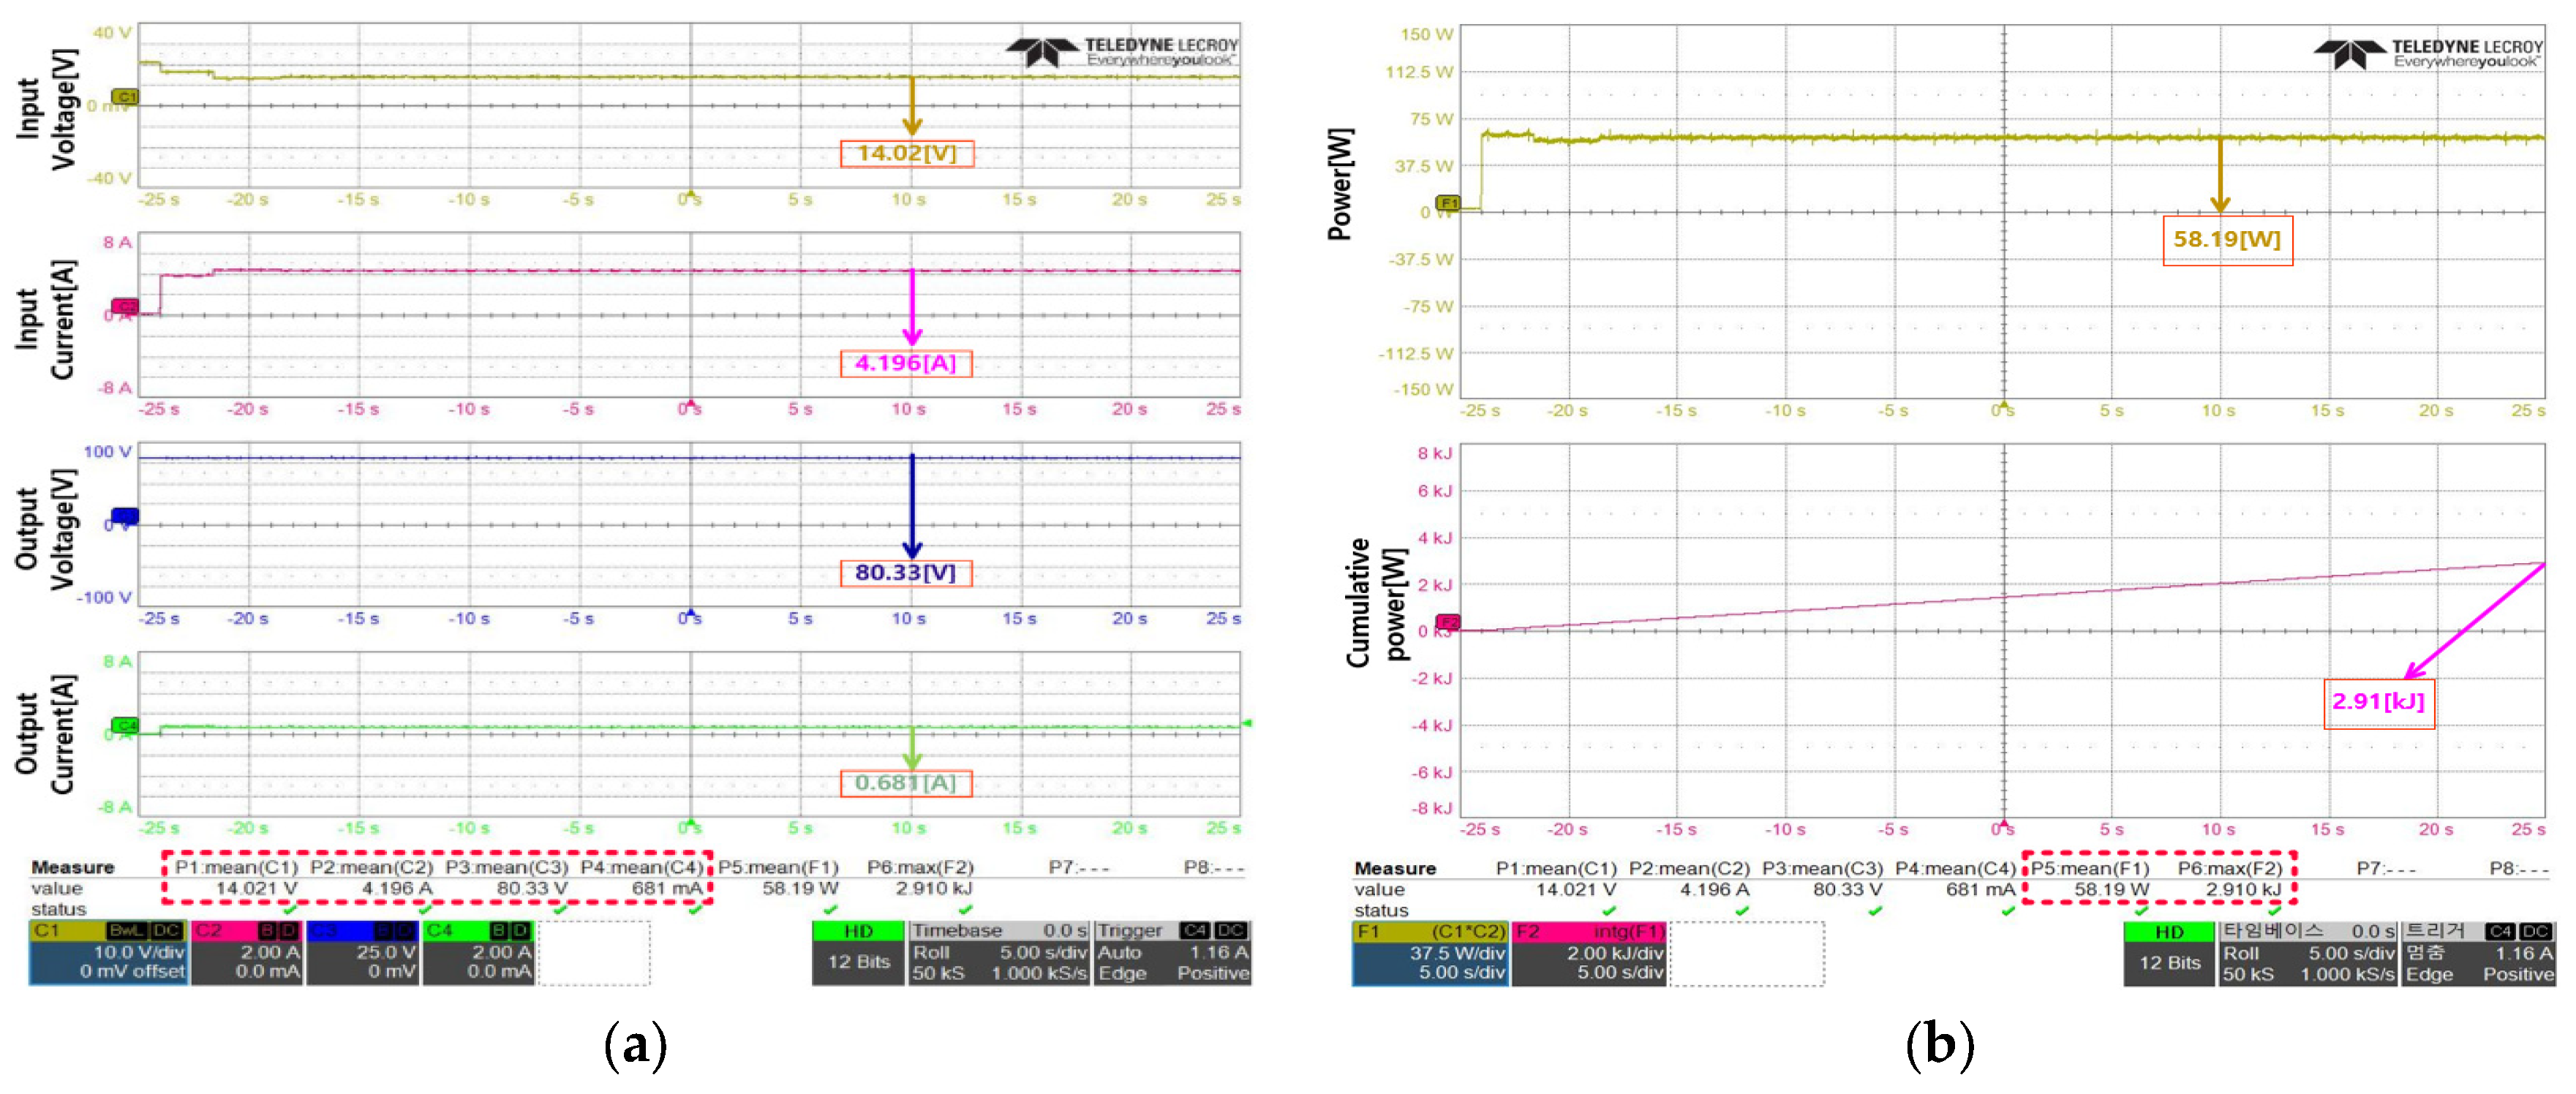
Figure 11 shows the experimental results in the case where β was 0.2. According to the experimental results, the average value of the input voltage was 14.02 V, and the average value of the input current was 4.196 A. The average value of the output voltage was measured as 80.33 V, and the average value of the output current was measured as 681 mA. Through the foregoing, it can be seen that the voltage control of the flyback converter was being performed well. Additionally, the calculated value after measuring the power produced for 50 s was an average of 58.19 W, as shown in Figure 11b. The accumulated energy value was 2.91 kJ, which converts to approximately 58.2 W.
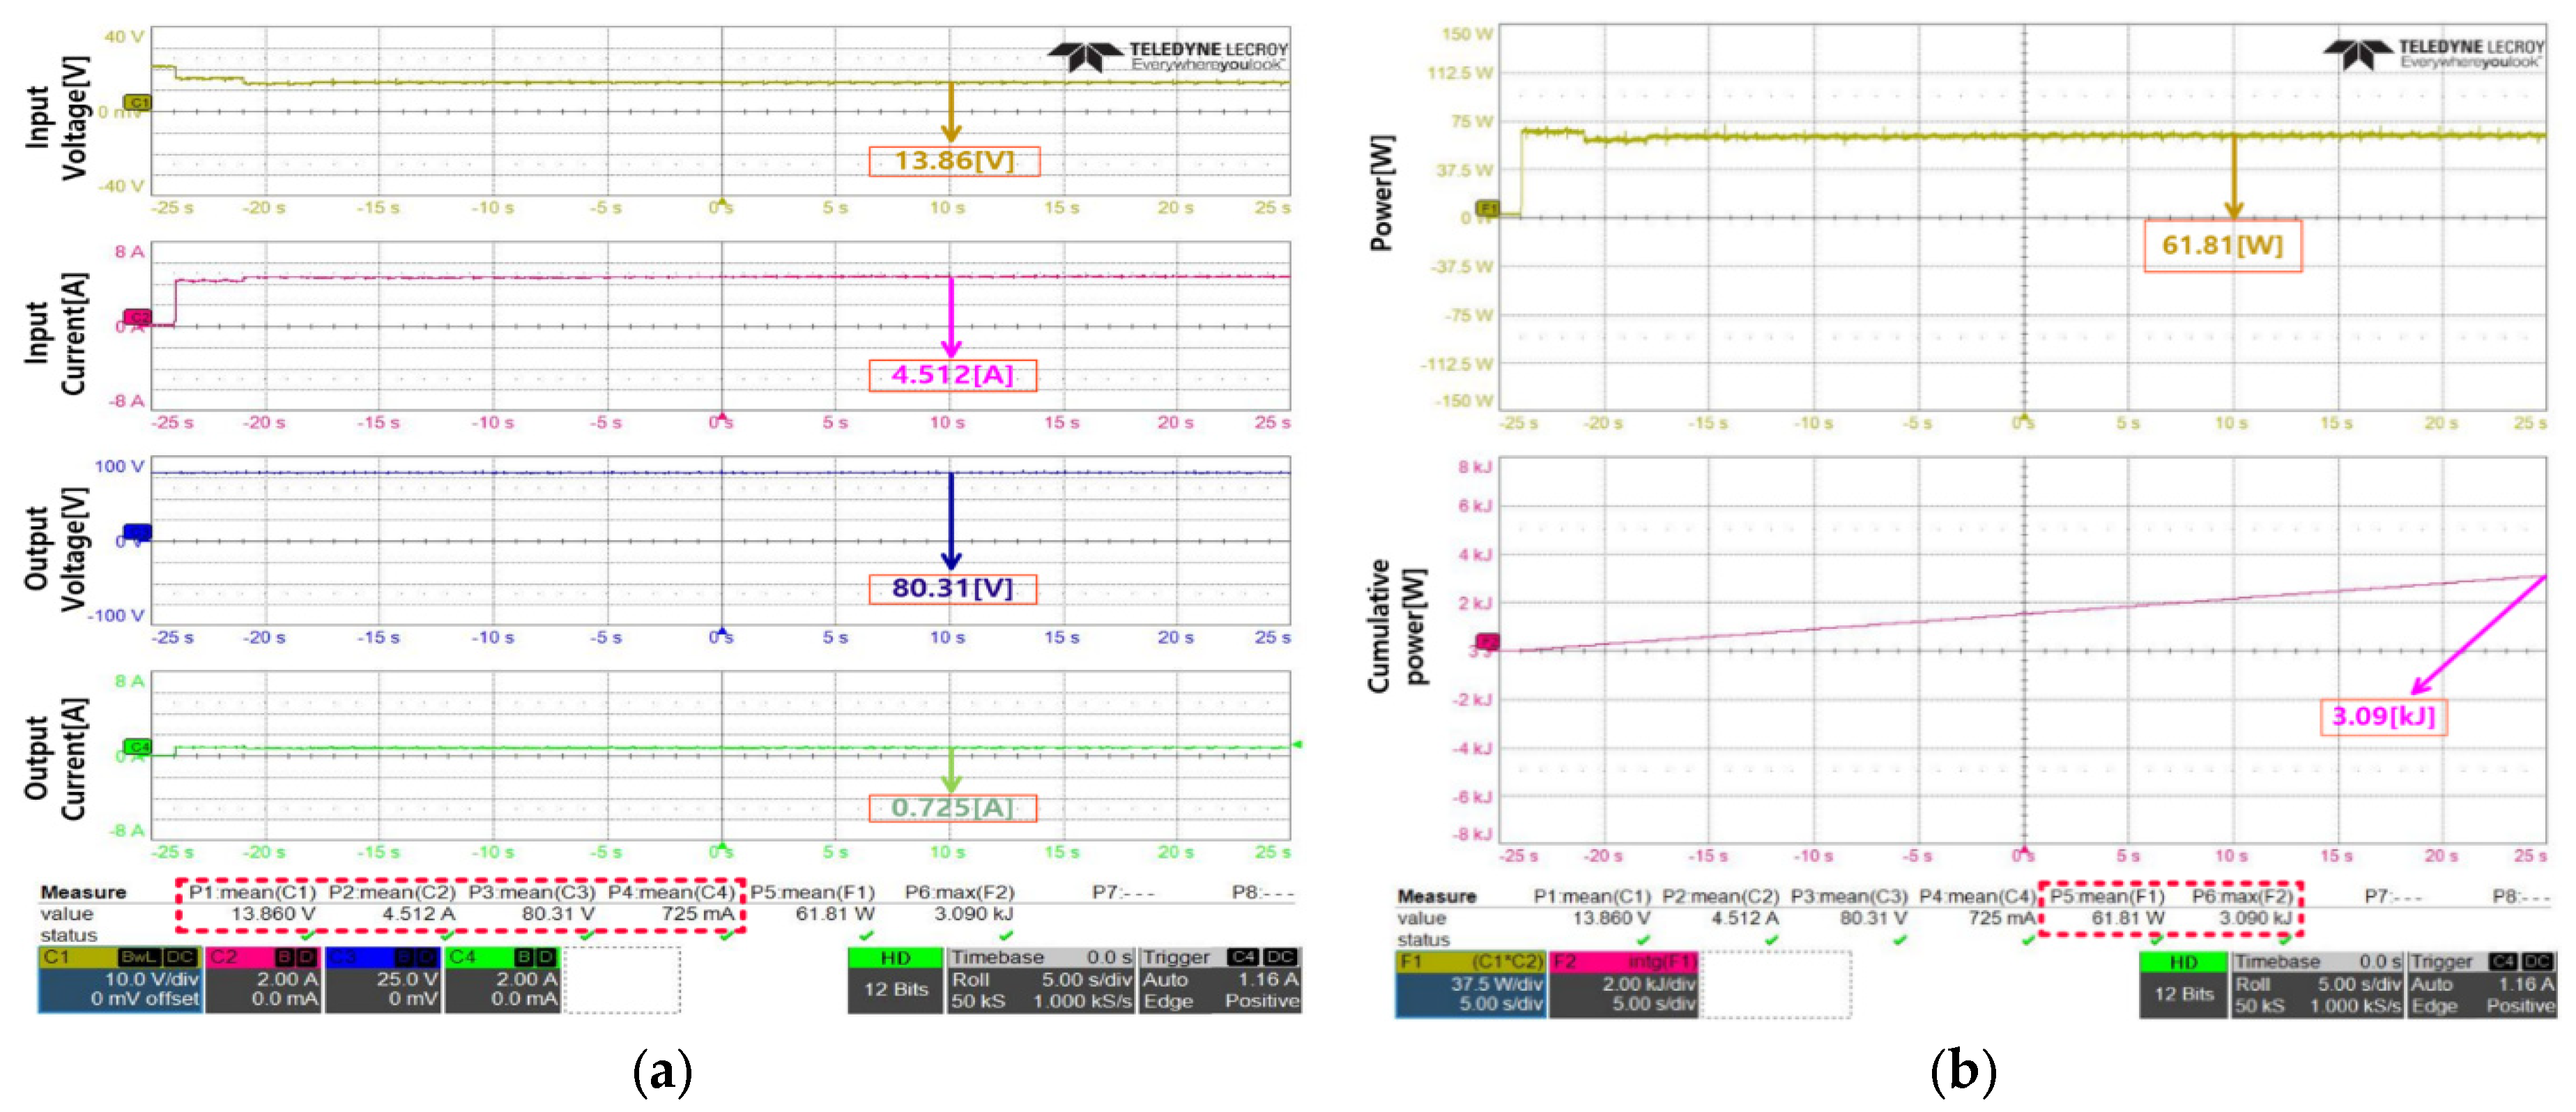
Figure 12 shows the experimental result in the case where β was 0.3. Figure 12a shows the results of the measurements of the input voltage, output voltage, input current, and output current. In this case, the input voltage and current were 13.86 V and 4.512 A, respectively. The measured output voltage was measured as 80.31 V and the output current was 725 mA. From the above-mentioned discussion, it can be seen that voltage control was performed using the target voltage of the flyback converter at 80 V. Figure 12b shows the results of the power measurements produced by the panel. An average of 61.81 W was produced, and the cumulative calculation of the power produced was 3.09 kJ. When this was calculated in W, it was confirmed that approximately 61.8 W was produced, which is 3.6 W more than the case where β was 0.2.
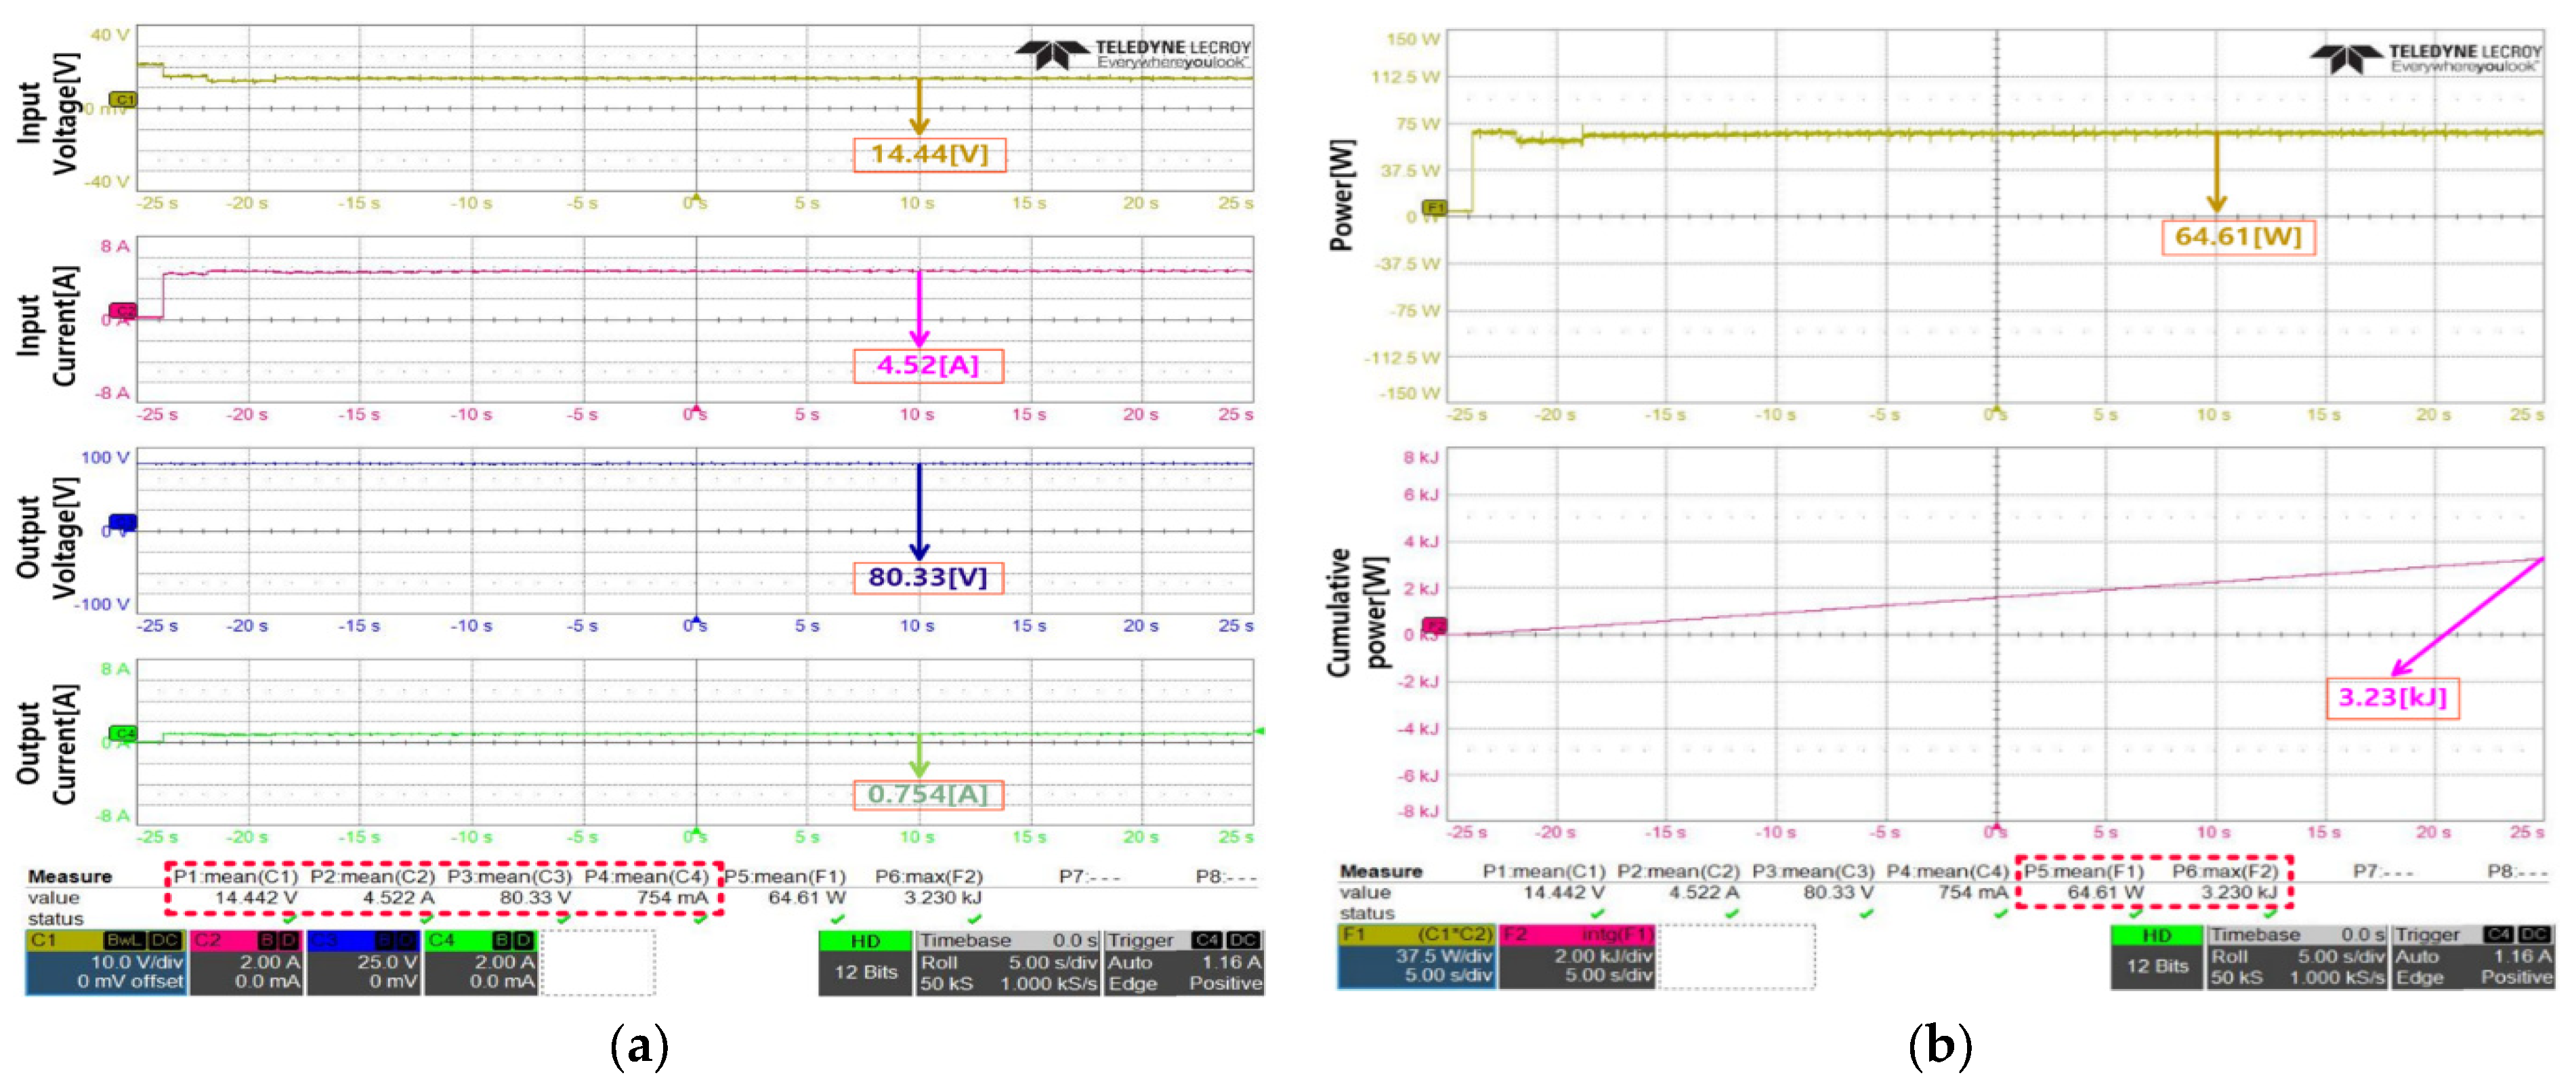
Figure 13 shows the experimental results in the case where β was 0.3694, which is the optimized value. To analyze the foregoing, the input voltage was 14.44 V, and the output current was 754 mA, which was the result of the measurement of the average values. Voltage control was also implemented in this case.
Figure 13b shows the results of the power measurements produced by the panel. An average of 64.61 W was produced, the cumulative calculation of the power produced was 3.23 kJ, and the value calculated in Watt was 64.6 W. It was confirmed that 2.8 W more power was produced than in the previous case where β was 0.3
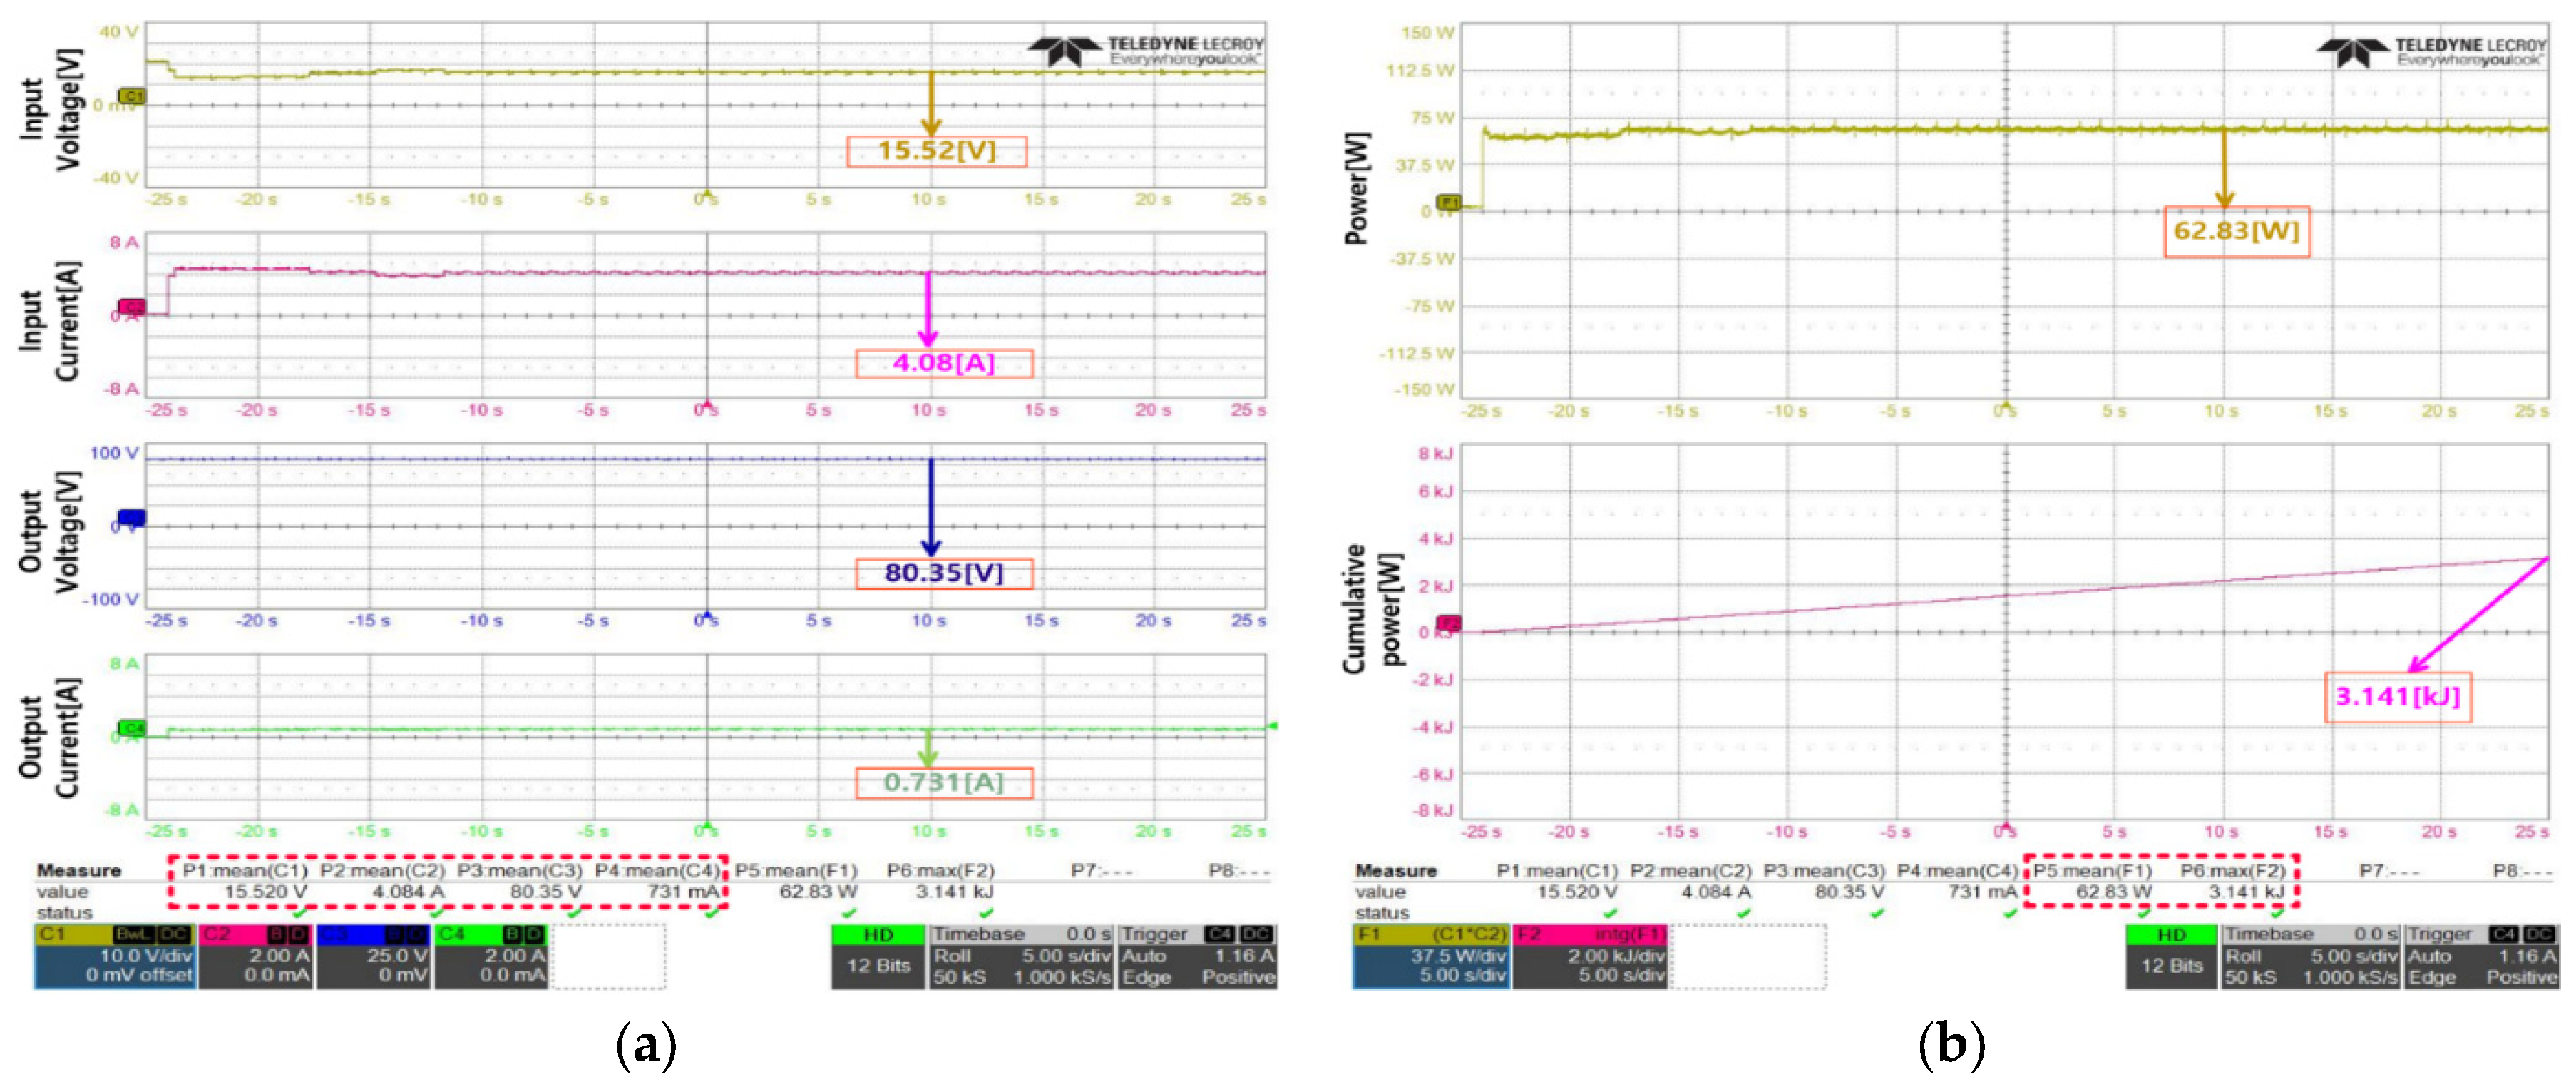
Figure 14 shows the results of the experiment conducted when β was 0.4. According to the experimental results, the average input voltage was 15.52 V and the average value of the input current was 4.084 A. The average output voltage was measured as 80.35 V, and the average output current was 731 mA. Based on these results, it can be seen that the voltage control was performed well with a difference of approximately 0.35 V when compared with the target value of 80 V for the voltage control of the flyback converter. Figure 14b shows the results of the power measurements produced by the panel. An average of 62.83 W was produced, the cumulative calculation of the power produced was 3.14 kJ, and the value calculated in Watt was 62.82 W. It was confirmed that 1.78 W less power was produced than in the previous case where β was 0.3694. Through the foregoing, it can be seen that less power is produced in this case than the case where β was optimized.
Figure 15 summarizes the experimental results. The figure shows a linear increase in power production when comparing the cases where β was 0.2, 0.3, and 0.3694. However, when comparing the cases where β was 0.4 and 0.3694, approximately 1.98 W less power was produced in the case where β was 0.4. This indicates that the least power was produced when β was 0.2, with a power difference of approximately 4.53% between the case with the least power and the case with the most power. These results demonstrate that the largest amount of power is produced when β is optimized, verifying the performance of the GD InC method.

4. Conclusions

In this paper, we proposed the GD InC method to address the limitations of the conventional InC method. The conventional InC method has a fundamental drawback where power production efficiency is constrained by the initially set voltage steps. To overcome this issue, we introduced a machine learning-based optimization method. The GD InC method optimizes the β value to achieve maximum power production, with the optimization results indicating that a β value of 0.3694 yields the highest power output.
The effectiveness of the GD InC method was validated through simulations and experiments using DSP-based hardware. We compared four different scenarios, including the case with the optimized β value. The results demonstrated that the optimized β value produced the highest power output, with up to a 4.53% efficiency improvement compared with the non-optimized β value. These findings confirm that the GD InC method is effective in enhancing power production efficiency by optimizing the voltage step size.
The proposed GD InC method has been shown to significantly improve power production efficiency when applied to PV systems. Future research should explore the applicability of the GD InC method across various environmental conditions and system configurations.

Author Contributions

Conceptualization, J.H. and J.S.; Methodology, J.H. and H.L.; Software, J.H.; Validation, H.L.; Formal Analysis, J.H.; Writing—Original Draft Preparation, J.H.; Writing—Review and Editing, J.H. and H.L.; Supervision, J.S. All authors have read and agreed to the published version of the manuscript.

Funding

This work was supported by the Ministry of Science and ICT (MSIT), Korea, under the Information Technology Research Center (ITRC) support program (RS-2023-00259004) supervised by the Institute for Information & Communications Technology Planning & Evaluation (IITP) and by a Human Resources Development of the Korea Institute of Energy Technology Evaluation and Planning (KETEP) grant funded by the Korean government Ministry of Trade, Industry, and Energy (No.20214000000060).

Data Availability Statement

The original contributions presented in the study are included in the article, further inquiries can be directed to the corresponding author.

Conflicts of Interest

The authors declare no conflicts of interest.

References

  1. Sachs, J.; Crete, E. Zero Carbon Action Plan; Sustainable Development Solutions Network (SDSN): New York, NY, USA, 2020. [Google Scholar]
  2. Villalva, M.G.; Gazoli, J.R.; Filho, E.R. Comprehensive Approach to Modeling and Simulation of Photovoltaic Arrays. IEEE Trans. Power Electron. 2009, 24, 1198–1208. [Google Scholar] [CrossRef]
  3. Alsumiri, M. Residual Incremental Conductance Based Nonparametric MPPT Control for Solar Photovoltaic Energy Conversion System. IEEE Access 2019, 7, 87901–87906. [Google Scholar] [CrossRef]
  4. Le, P.T.; Tsai, H.L.; Lam, T.H. A Wireless Visualization Monitoring, Evaluation System for Commercial Photovoltaic Modules Solely in MATLAB/Simulink Environment. Sol. Energy 2016, 140, 1–11. [Google Scholar] [CrossRef]
  5. Ali, A.; Almutairi, K.; Padmanaban, S.; Tirth, V.; Algarni, S.; Irshad, K.; Islam, S.; Zahir, M.H.; Shafiullah, M.; Malik, M.Z. Investigation of MPPT Techniques Under Uniform and Non-uniform Solar Irradiation Condition—A Retrospection. IEEE Access 2020, 8, 127368–127392. [Google Scholar] [CrossRef]
  6. Kadri, R.; Gaubert, J.-P.; Champenois, G. An Improved Maximum Power Point Tracking for Photovoltaic Grid-Connected Inverter Based on Voltage-Oriented Control. IEEE Trans. Ind. Electron. 2011, 58, 66–75. [Google Scholar] [CrossRef]
  7. Femia, N.; Petrone, G.; Spagnuolo, G.; Vitelli, M. Optimization of Perturb and Observe Maximum Power Point Tracking Method. IEEE Trans. Power Electron. 2005, 20, 963–973. [Google Scholar] [CrossRef]
  8. Delavari, H.; Zolfi, M. Maximum power point tracking in photovoltaic systems using indirect adaptive fuzzy robust controller. Soft Comput. 2021, 25, 10969–10985. [Google Scholar] [CrossRef]
  9. Sekkeli, A.G.M. Experimental evaluation of type-2 fuzzy logic controller adapted to real environmental conditions for maximum power point tracking of solar energy systems. Int. J. Circuit Theory Appl. 2022, 50, 4131–4145. [Google Scholar] [CrossRef]
  10. Nora, K.; Idir, A.; Grouni, S.; Boucherit, M.S. A New Combined Method for Tracking the Global Maximum Power Point of Photovoltaic Systems. Rev. Roum. Sci. Tech. Série Électrotechnique Énergétique 2022, 64, 2022. [Google Scholar]
  11. Kesilmiş, Z. A manhattan metric based perturb and observe maximum power point tracking algorithm for photovoltaic systems. Energy Sources Part A Recovery Util. Environ. Eff. 2022, 44, 469–492. [Google Scholar] [CrossRef]
  12. Sutikno, T.; Subrata, A.C.; Elkhateb, A. Evaluation of Fuzzy Membership Function Effects for Maximum Power Point Tracking Technique of Photovoltaic System. IEEE Access 2021, 9, 109157–109165. [Google Scholar] [CrossRef]
  13. Tightiz, L.; Mansouri, S.; Zishan, F.; Yoo, J.; Shafaghatian, N. Maximum Power Point Tracking for Photovoltaic Systems Operating under Partially Shaded Conditions Using SALP Swarm Algorithm. Energies 2022, 15, 8210. [Google Scholar] [CrossRef]
  14. Sedaghati, F.; Nahavandi, A.; Badamchizadeh, M.A.; Ghaemi, S.; Fallah, M.A. PV Maximum Power-Point Tracking by Using Artificial Neural Network. Math. Probl. Eng. 2012, 2012, 506709. [Google Scholar] [CrossRef]
  15. Mandourarakis, I.; Gogolou, V.; Koutroulis, E.; Siskos, S. Integrated Maximum Power Point Tracking System for Photovoltaic Energy Harvesting Applications. IEEE Trans. Power Electron. 2022, 37, 9865–9875. [Google Scholar] [CrossRef]
  16. Mumtaz, S.; Ahmad, S.; Khan, L.; Ali, S.; Khan, T.K.; Hassan, S. Adaptive Feedback Linearization Based NeuroFuzzy Maximum Power Point Tracking for a Photovoltaic System. Energies 2018, 11, 606. [Google Scholar] [CrossRef]
  17. Kumar, N.; Hussain, I.; Singh, B.; Panigrahi, B.K. Framework of Maximum Power Extraction From Solar PV Panel Using Self Predictive Perturb and Observe Algorithm. IEEE Trans. Sustain. Energy 2018, 9, 895–903. [Google Scholar] [CrossRef]
  18. Jabbar, R.I.; Mekhilef, S.; Mubin, M.; Mohammed, K.K. A Modified Perturb and Observe MPPT for a Fast and Accurate Tracking of MPP Under Varying Weather Conditions. IEEE Access 2023, 11, 76166–76176. [Google Scholar] [CrossRef]
  19. Yanarates, C.; Wang, Y.; Zhou, Z. Unity Proportional Gain Resonant and Gain Scheduled Proportional (PR-P) Controller-Based Variable Perturbation Size Real-Time Adaptive Perturb and Observe (P&O) MPPT Algorithm for PV Systems. IEEE Access 2021, 9, 138468–138482. [Google Scholar] [CrossRef]
  20. Sher, H.A.; Murtaza, A.F.; Noman, A.; Addoweesh, K.E.; Al-Haddad, K.; Chiaberge, M. A New Sensorless Hybrid MPPT Algorithm Based on Fractional Short-Circuit Current Measurement and P&O MPPT. IEEE Trans. Sustain. Energy 2015, 6, 1426–1434. [Google Scholar] [CrossRef]
  21. Shang, L.; Guo, H.; Zhu, W. An Improved MPPT Control Strategy Based on Incremental Conductance Algorithm. Prot. Control Mod. Power Syst. 2020, 5, 1–8. [Google Scholar] [CrossRef]
  22. Gupta, A.K.; Pachauri, R.K.; Maity, T.; Chauhan, Y.K.; Mahela, O.P.; Khan, B.; Gupta, P.K. Effect of Various Incremental Conductance MPPT Methods on the Charging of Battery Load Feed by Solar Panel. IEEE Access 2021, 9, 90977–90988. [Google Scholar] [CrossRef]
  23. Huynh, D.C.; Dunnigan, M.W. Development and Comparison of an Improved Incremental Conductance Algorithm for Tracking the MPP of a Solar PV Panel. IEEE Trans. Sustain. Energy 2016, 7, 1421–1429. [Google Scholar] [CrossRef]
  24. Kumar, N.; Hussain, I.; Singh, B.; Panigrahi, B.K. Self-Adaptive Incremental Conductance Algorithm for Swift and Ripple-Free Maximum Power Harvesting From PV Array. IEEE Trans. Ind. Inform. 2018, 14, 2031–2041. [Google Scholar] [CrossRef]
  25. Tey, K.S.; Mekhilef, S. Modified Incremental Conductance Algorithm for Photovoltaic System Under Partial Shading Conditions and Load Variation. IEEE Trans. Ind. Electron. 2014, 61, 5384–5392. [Google Scholar] [CrossRef]
  26. Safari, A.; Mekhilef, S. Simulation and Hardware Implementation of Incremental Conductance MPPT With Direct Control Method Using Cuk Converter. IEEE Trans. Ind. Electron. 2011, 58, 1154–1161. [Google Scholar] [CrossRef]
  27. Elgendy, M.A.; Zahawi, B.; Atkinson, D.J. Assessment of the Incremental Conductance Maximum Power Point Tracking Algorithm. IEEE Trans. Sustain. Energy 2013, 4, 108–117. [Google Scholar] [CrossRef]
  28. Ibrahim, M.H.; Ang, S.P.; Dani, M.N.; Rahman, M.I.; Petra, R.; Sulthan, S.M. Optimizing Step-Size of Perturb & Observe and Incremental Conductance MPPT Methods Using PSO for Grid-Tied PV System. IEEE Access 2023, 11, 13079–13090. [Google Scholar] [CrossRef]
  29. Yang, Y.; Wen, H. Adaptive Perturb and Observe Maximum Power Point Tracking With Current Predictive and Decoupled Power Control for Grid-Connected Photovoltaic Inverters. J. Mod. Power Syst. Clean Energy 2019, 7, 422–432. [Google Scholar] [CrossRef]
  30. Liu, F.; Duan, S.; Liu, F.; Liu, B.; Kang, Y. A Variable Step Size INC MPPT Method for PV Systems. IEEE Trans. Ind. Electron. 2008, 55, 2622–2628. [Google Scholar] [CrossRef]
  31. Bhattacharyya, S.; Kumar, P.D.S.; Samanta, S.; Mishra, S. Steady Output and Fast Tracking MPPT (SOFT-MPPT) for P&O and InC Algorithms. IEEE Trans. Sustain. Energy 2021, 12, 293–302. [Google Scholar] [CrossRef]
  32. Kim, E.; Warner, M.; Bhattacharya, I. Adaptive Step Size Incremental Conductance Based Maximum Power Point Tracking (MPPT). In Proceedings of the 47th IEEE Photovoltaic Specialists Conference (PVSC), Calgary, AB, Canada, 15 June–21 August 2020; Volume 2020, pp. 2335–2339. [Google Scholar] [CrossRef]
  33. Kollimalla, S.K.; Mishra, M.K. A Novel Adaptive P&O MPPT Algorithm Considering Sudden Changes in the Irradiance. IEEE Trans. Energy Convers. 2014, 29, 602–610. [Google Scholar] [CrossRef]
Figure 1. Flow chart of the operation process of the P&O method.
Energies 17 05148 g001
Figure 2. Flow chart of the operation process of the InC method.
Energies 17 05148 g002
Figure 3. Comparison of InC method operation processes according to the sizes of the voltage step.
Energies 17 05148 g003
Figure 4. Flow chart of the operation process of the proposed GD InC method.
Energies 17 05148 g004
Figure 5. β value and accumulated power amount change process in the course of 60 times of learning.
Energies 17 05148 g005
Figure 6. PV power generation simulation power circuit diagram to verify the effectiveness of GD InC method.
Energies 17 05148 g006
Figure 7. PSIM simulation results according to the β values used; (a) power change waveform; (b) result of calculation of cumulative power amounts.
Energies 17 05148 g007
Figure 8. PV system circuit diagram and control block diagram for GD InC method experiment.
Energies 17 05148 g008
Figure 9. Production and configuration of the flyback converter for PV systems.
Energies 17 05148 g009
Figure 10. View of the experiment to verify the effectiveness of the GD InC method.
Energies 17 05148 g010
Figure 11. Experimental results when β was 0.2 (a) input/output voltage, current; (b) produced power and resultant accumulated power.
Energies 17 05148 g011
Figure 12. Experimental results when β is 0.3: (a) input/output voltage, current; (b) results of measurement of produced power and accumulated amount of power.
Energies 17 05148 g012
Figure 13. Experimental results when β is 0.3694: (a) input/output voltage, current; (b) Results of measurement of produced power and accumulated amount of power.
Energies 17 05148 g013
Figure 14. Experimental results when β was 0.4: (a) input/output voltage, current; (b) results of measurement of produced power and accumulated amount of power.
Energies 17 05148 g014
Figure 15. Summary of measurement of cumulative power according to β values.
Energies 17 05148 g015
Table 1. Comparison of power production and efficiency by MPPT Methods.
MPPT Algorithm 800   W / m 2 1000   W / m 2 Tracking Accuracy
Constants voltage15.76 [W]19.69 [W]96.5 [%]
Perturb and observe15.35 [W]19.08 [W]86.7 [%]
Incremental Conductance15.59 [W]19.78 [W]97.5 [%]
Disclaimer/Publisher’s Note: The statements, opinions and data contained in all publications are solely those of the individual author(s) and contributor(s) and not of MDPI and/or the editor(s). MDPI and/or the editor(s) disclaim responsibility for any injury to people or property resulting from any ideas, methods, instructions or products referred to in the content.