Article

The Impact of Abrupt Sunlight Reduction Scenarios on Renewable Energy Production

by
Ashitosh Rajesh Varne
1,
Simon Blouin
2,
Baxter Lorenzo McIntosh Williams
1,* and
David Denkenberger
1,2,*
1
Department of Mechanical Engineering, University of Canterbury, Christchurch 8041, New Zealand
2
Alliance to Feed the Earth in Disasters (ALLFED), Lafayette, CO 80026, USA
*
Authors to whom correspondence should be addressed.
Energies 2024, 17(20), 5147; https://doi.org/10.3390/en17205147
Submission received: 19 September 2024 / Revised: 13 October 2024 / Accepted: 14 October 2024 / Published: 16 October 2024
(This article belongs to the Section A: Sustainable Energy)

Abstract

:
To combat global warming, energy systems are transitioning to generation from renewable sources, such as wind and solar, which are sensitive to climate conditions. While their output is expected to be little affected by global warming, wind, and solar electricity generation could be affected by more drastic climatic changes, such as abrupt sunlight reduction scenarios (ASRSs) caused by nuclear war (“nuclear winter”) or supervolcanic eruptions (“volcanic winter”). This paper assesses the impacts of an ASRS on global energy supply and security in a 100% renewable energy scenario. National generation mixes are determined according to roadmaps for a global transition to renewable energy, with wind and solar contributing a combined 94% of the global energy supply. Wind and solar generation are determined for a baseline climate and an ASRS following a large-scale nuclear exchange. While effects vary by country, overall wind and solar generation are expected to reduce by 59% in the first year following an ASRS, requiring over a decade for full recovery. Ensuring sufficient energy for everyone’s critical needs, including water, food, and building heating/cooling, would require international trade, resilient food production, and/or resilient energy sources, such as wood, geothermal, nuclear power, tidal power, and hydropower.

1. Introduction

Countries around the world are transitioning to renewable energy sources to reduce greenhouse gas emissions [1,2]. Solar and wind electricity generation are the fastest-growing renewable sources [3,4] and may account for more than 50% of the global energy supply by 2050 [5,6].
However, electricity generation from solar and wind is climate-sensitive and can only occur when these resources are available [7,8]. These climatic sensitivities are managed in current electricity systems, as wind and solar comprise a small proportion of total generation and are typically installed in locations optimized for climate [9,10].
The sensitivity of renewable electricity generation to climatic changes is widely recognized, and research has investigated the effects of global warming and climate change on renewable energy systems. In the 21st century, global warming and climate change are expected to have little effect on solar electricity generation [11]. The impacts on wind generation are less certain [12,13], as wind energy is affected by many factors, including sunlight, terrain, and temperature, and the implications of climate change for wind patterns are less well understood than those for solar energy [14,15].
However, more drastic and rapid climate disruptions are possible, such as an abrupt sunlight reduction scenario (ASRS), and resilience to such catastrophes is recognized as a key component of system-wide sustainability [16,17,18,19]. A nuclear war, asteroid/comet impact, or supervolcanic eruption could release immense amounts of aerosols, such as sulfates or carbon, into Earth’s stratosphere, where they would remain for several years [20,21]. The resulting reduction in sunlight would decrease temperatures and cause rapid, widespread climatic changes [22] (commonly referred to as a “nuclear winter” or “volcanic winter” if the reduction in sunlight is caused by nuclear war or supervolcanic eruption, respectively). Previous research has shown a severe ASRS would be catastrophic for humanity and could push billions of people into starvation [23,24], but its impacts on renewable energy production are unknown. As the severity of these impacts will increase with the renewable energy transition, a comprehensive analysis of the effects of an ASRS on global renewable energy production is required.
This work investigates the effects of an ASRS on a global energy system with a 100% renewable energy supply, and the implications of such a scenario for global energy security, resilience, and sustainability. A global climate model is used to assess the impacts of an ASRS on wind and solar energy resources, and national energy supply mixes are informed by roadmaps developed by Jacobson et al. [25] for a transition to a 100% renewable energy system.
This paper is structured as follows: Section 2 provides background information, Section 3 describes the methods, Section 4 presents the results of these analyses, and Section 5 and Section 6 provide discussion and conclusions, respectively.

2. Background

Jacobson et al. [25] show global average power demand is expected to be approximately 11,800 GW in a 100% renewable scenario, similar to current levels. This stability in energy demand is attributed to population growth and increased per capita energy services, offset by gains in energy efficiency and electrification.
The following renewable energy sources are included in Jacobson et al.’s roadmaps: Onshore and Offshore Wind; Wave; Geothermal; Hydroelectric; Tidal; Residential, Commercial, Government, and Utility Solar Photovoltaic (PV); and Concentrated Solar Power (CSP). Wind generation contributes 4400 GW (37%), and solar generation 6800 GW (57%), of the average global power supply, for a combined 94%.
The intermittent nature of renewable sources, particularly wind and solar, will require energy system changes to account for uncertainty in supply [26]. Three main strategies exist for managing these problems of intermittency:
  • Oversizing the generation and spill/dump of excess energy production [27,28,29]
  • Increasing demand flexibility by thermal storage [30,31], smart charging of electric vehicles [32,33,34,35], or other methods of demand side management (DSM) [36,37]
  • Storage, including pumped hydropower, compressed air energy storage, chemical batteries, hydrogen, or other energy storage methods [38,39,40,41]
While the nature in which the problems of intermittency are addressed will vary between countries, it is expected all energy systems with large shares of demand met by wind and solar will require strategies to manage supply uncertainty [42,43]. DSM is the most cost-effective method to address supply intermittency [44,45,46] and does so without introducing additional losses [47,48], so is expected to be the primary method in most countries. However, large-scale storage may be required to address inter-seasonal differences in energy supply and/or demand.
The realization of a 100% renewable energy system is likely many years away [6]. This work focuses on the impacts of an ASRS on renewable energy generation, so it includes assumptions about the installed capacity of different generation sources (detailed in Section 3). As discussed in this section, assumptions are also made about strategies for managing generation intermittency, which are important considerations for the magnitude of generation required to meet demand, such as whether oversized generation and/or storage systems will be required. The impacts of these and other assumptions are discussed in Section 5.5. To retain generalisability, further speculation about the composition of future energy systems, other than that required for energy supply considerations, is outside the scope of this work.

3. Methods

We consider a fully renewable global energy system to assess the effects of an ASRS on a potential future scenario, recognizing such a system may take many decades to be realized. The actual future contributions of wind and solar to the energy production of each country in a global renewable energy system are unknown. In this work, wind and solar generation in each country are based on the renewable roadmaps produced by Jacobson et al. [25]. While other renewable energy sources, such as biomass, tidal power, and hydroelectric, are likely to contribute to meeting energy needs, wind and solar are expected to be among the top contributors to future renewable energy systems [5,6,49,50,51].
Thus, we scale wind and photovoltaic to produce 100% of each country’s energy. As other energy sources may be present in future energy systems, this assumption means these analyses approach a reasonable expectation for energy generation in an ASRS, as biomass and concentrated solar power are likely to be more affected, and hydropower and tidal power less affected, by an ASRS than wind and solar. The fraction of energy generated using photovoltaics in each country is shown in Figure 1, with the balance supplied by wind.
We use climate modeling data from Coupe et al. [31] to inform the climatic impacts of an ASRS. Coupe et al. simulated the global climate response to a nuclear exchange between NATO and Russia, in which 150 Tg (150 million tonnes) of black carbon are injected into the stratosphere. Although modeling the results of a nuclear exchange, this scenario also serves as a proxy for worst-case ASRSs arising from other causes.
In this simulation, the nuclear exchange takes place in May; we designate the first complete calendar year after the nuclear exchange as “Year 1”. We extract three physical quantities from Coupe et al.’s simulation results: downwelling solar flux at the surface, zonal (parallel to latitude lines) wind at the lowest model level (at a mean height of 60 m), and meridional (parallel to longitude lines) wind at the lowest model level, all of which are provided with a 2° horizontal resolution.
To evaluate the production of solar power through the ASRS, we use monthly averages of downwelling surface solar flux. We assume solar energy production is directly proportional to the surface solar flux. We query the climate model results at the locations of existing solar farms [52], for two scenarios: post-ASRS, and a reference year in which the sun is not obscured. The ratio of the solar flux in these two scenarios for a given month of the year yields fractional solar power at each solar farm location compared to the baseline climate:
Psolar ASRS (i,t)/Psolar baseline (i,t) = fluxASRS (i,t)/fluxbaseline (i,t),
where Psolar, ASRS (i,t)/Psolar, baseline (i,t) is the relative change in solar power for location i at time t, and fluxASRS (i,t) and fluxbaseline (i,t) are the incident solar flux at location i and time t in ASRS and baseline scenarios, respectively [W/m2]. This relative change in solar power is then used to calculate a time series of the solar energy available at each solar farm, normalized according to the baseline climate, which is aggregated for each country, weighting each by the solar farm power capacity. For countries not represented in the solar farm database [52], we randomly select 100 locations within each country’s landmass for climate data querying, so a time series of solar power compared to baseline climate is obtained for every country.
For wind, we use data on wind speed at three-hour intervals from Coupe et al.’s model. This finer temporal resolution is important for wind energy production, as turbine power has a cubic relationship with wind speed, so modest reductions in wind speed can cause large decreases in power generation. We calculate the wind speed from its zonal and meridional components, then cube this result to obtain a proxy of wind power. Resulting wind powers are averaged monthly, then normalized against baseline (no ASRS) data:
Pwind, ASRS (i,t)/Pwind, baseline (i,t) = (vASRS (i,t))3/(vbaseline (i,t))3,
where Pwind, ASRS (i,t)/Pwind, baseline (i,t) is the relative change in wind power for location i at time t, and vASRS (i,t) and vbaseline (i,t) are the wind speed at location i and time t in ASRS and baseline scenarios [m/s]. Wind farm locations are then queried, using an analogous process to that for solar farms, generating one time series of wind power compared to the baseline climate for each country.
To assess the impact of the ASRS on total energy production, we weigh the solar and wind energy results by their respective contributions to the total energy production of each country in the 100% renewable energy roadmaps of [25]. World averages are then calculated by weighting each country by Jacobson et al.’s national energy production forecasts.
The following assumptions and approximations are used in these analyses. Their implications are discussed in Section 5.5:
  • No distinction is made between direct and diffuse solar radiation when calculating solar power.
  • The effects of wavelength-dependent scattering and absorption of sunlight are not included.
  • Wind turbine power output is assumed to be proportional to the cube of wind velocity.
  • The effects of large-scale energy storage are not assessed.

4. Results

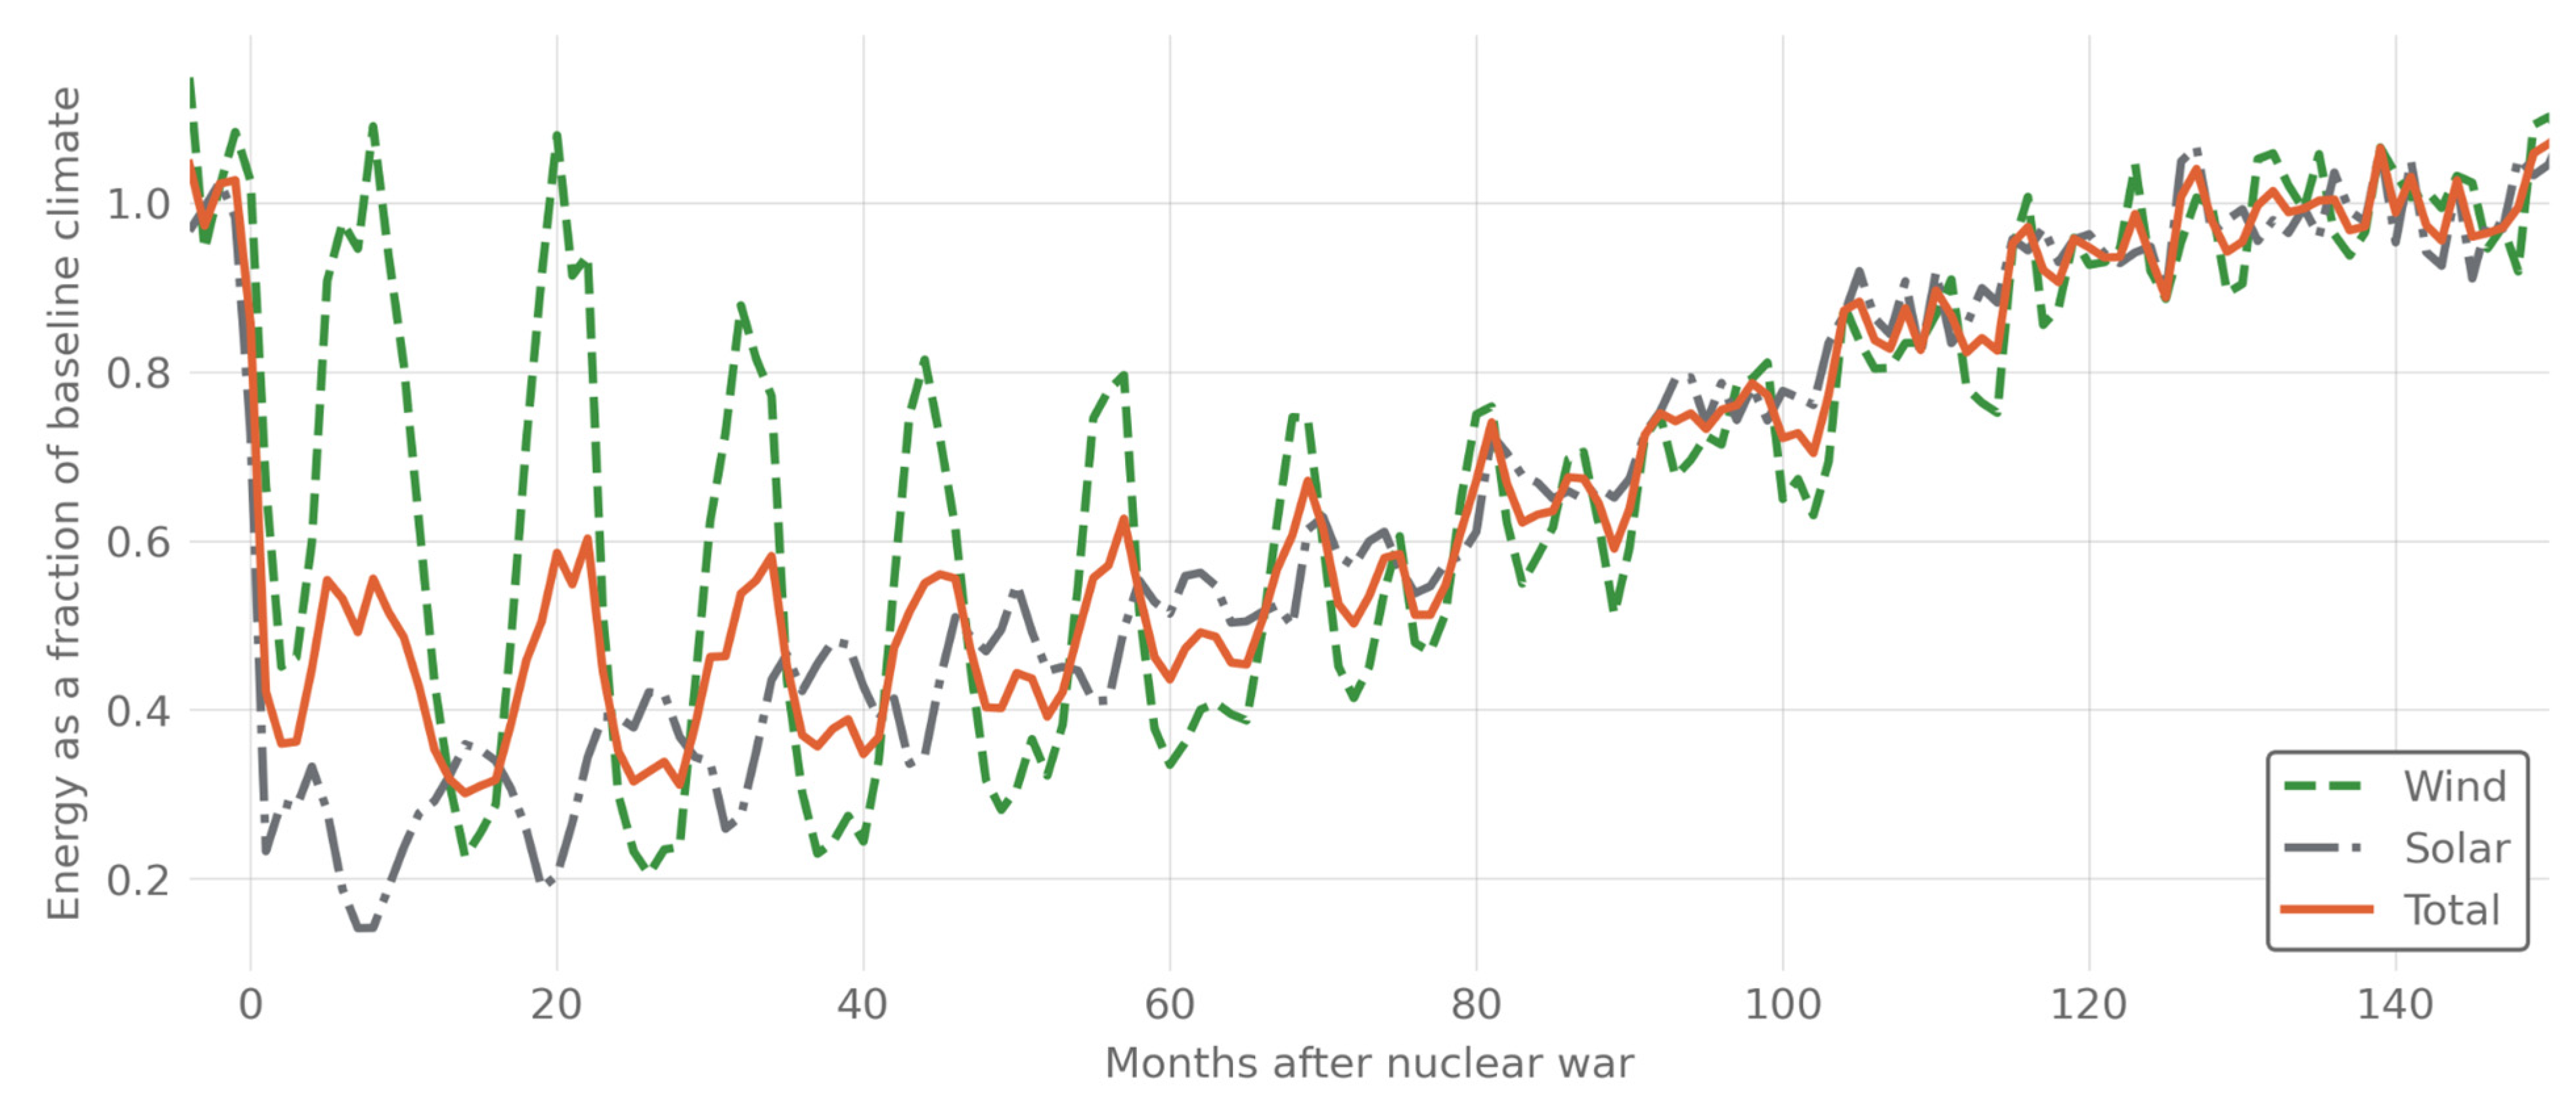
Changes in wind and solar production for 12 years following an ASRS are shown in Figure 2. Wind power shows an intra-annual fluctuation relative to production before the nuclear exchange, due to climatic variations throughout the year, and requires more than 10 years for full recovery. Solar power generation also requires more than a decade to fully recover but exhibits less intra-annual variability than wind. Combined wind and solar generation return to baseline levels after 10–11 years, reflecting the time required for the climate to restabilize after an ASRS.
Figure 3 shows the percentage of remaining solar energy production in the first year of an ASRS compared to the baseline climate case. These results show generation following an ASRS depends on latitude. Solar generation in Northern Hemisphere extratropical regions is expected to decline, retaining 0–20% of baseline production. Reductions in solar generation in tropical regions are expected to be less drastic, remaining around 45% of baseline levels. This disparity arises because (i) the sun is lower at higher latitudes, so sunlight passes through more particles in the stratosphere and is attenuated more than in tropical regions, and (ii) soot concentrations are generally higher in the Northern Hemisphere in this nuclear war scenario.
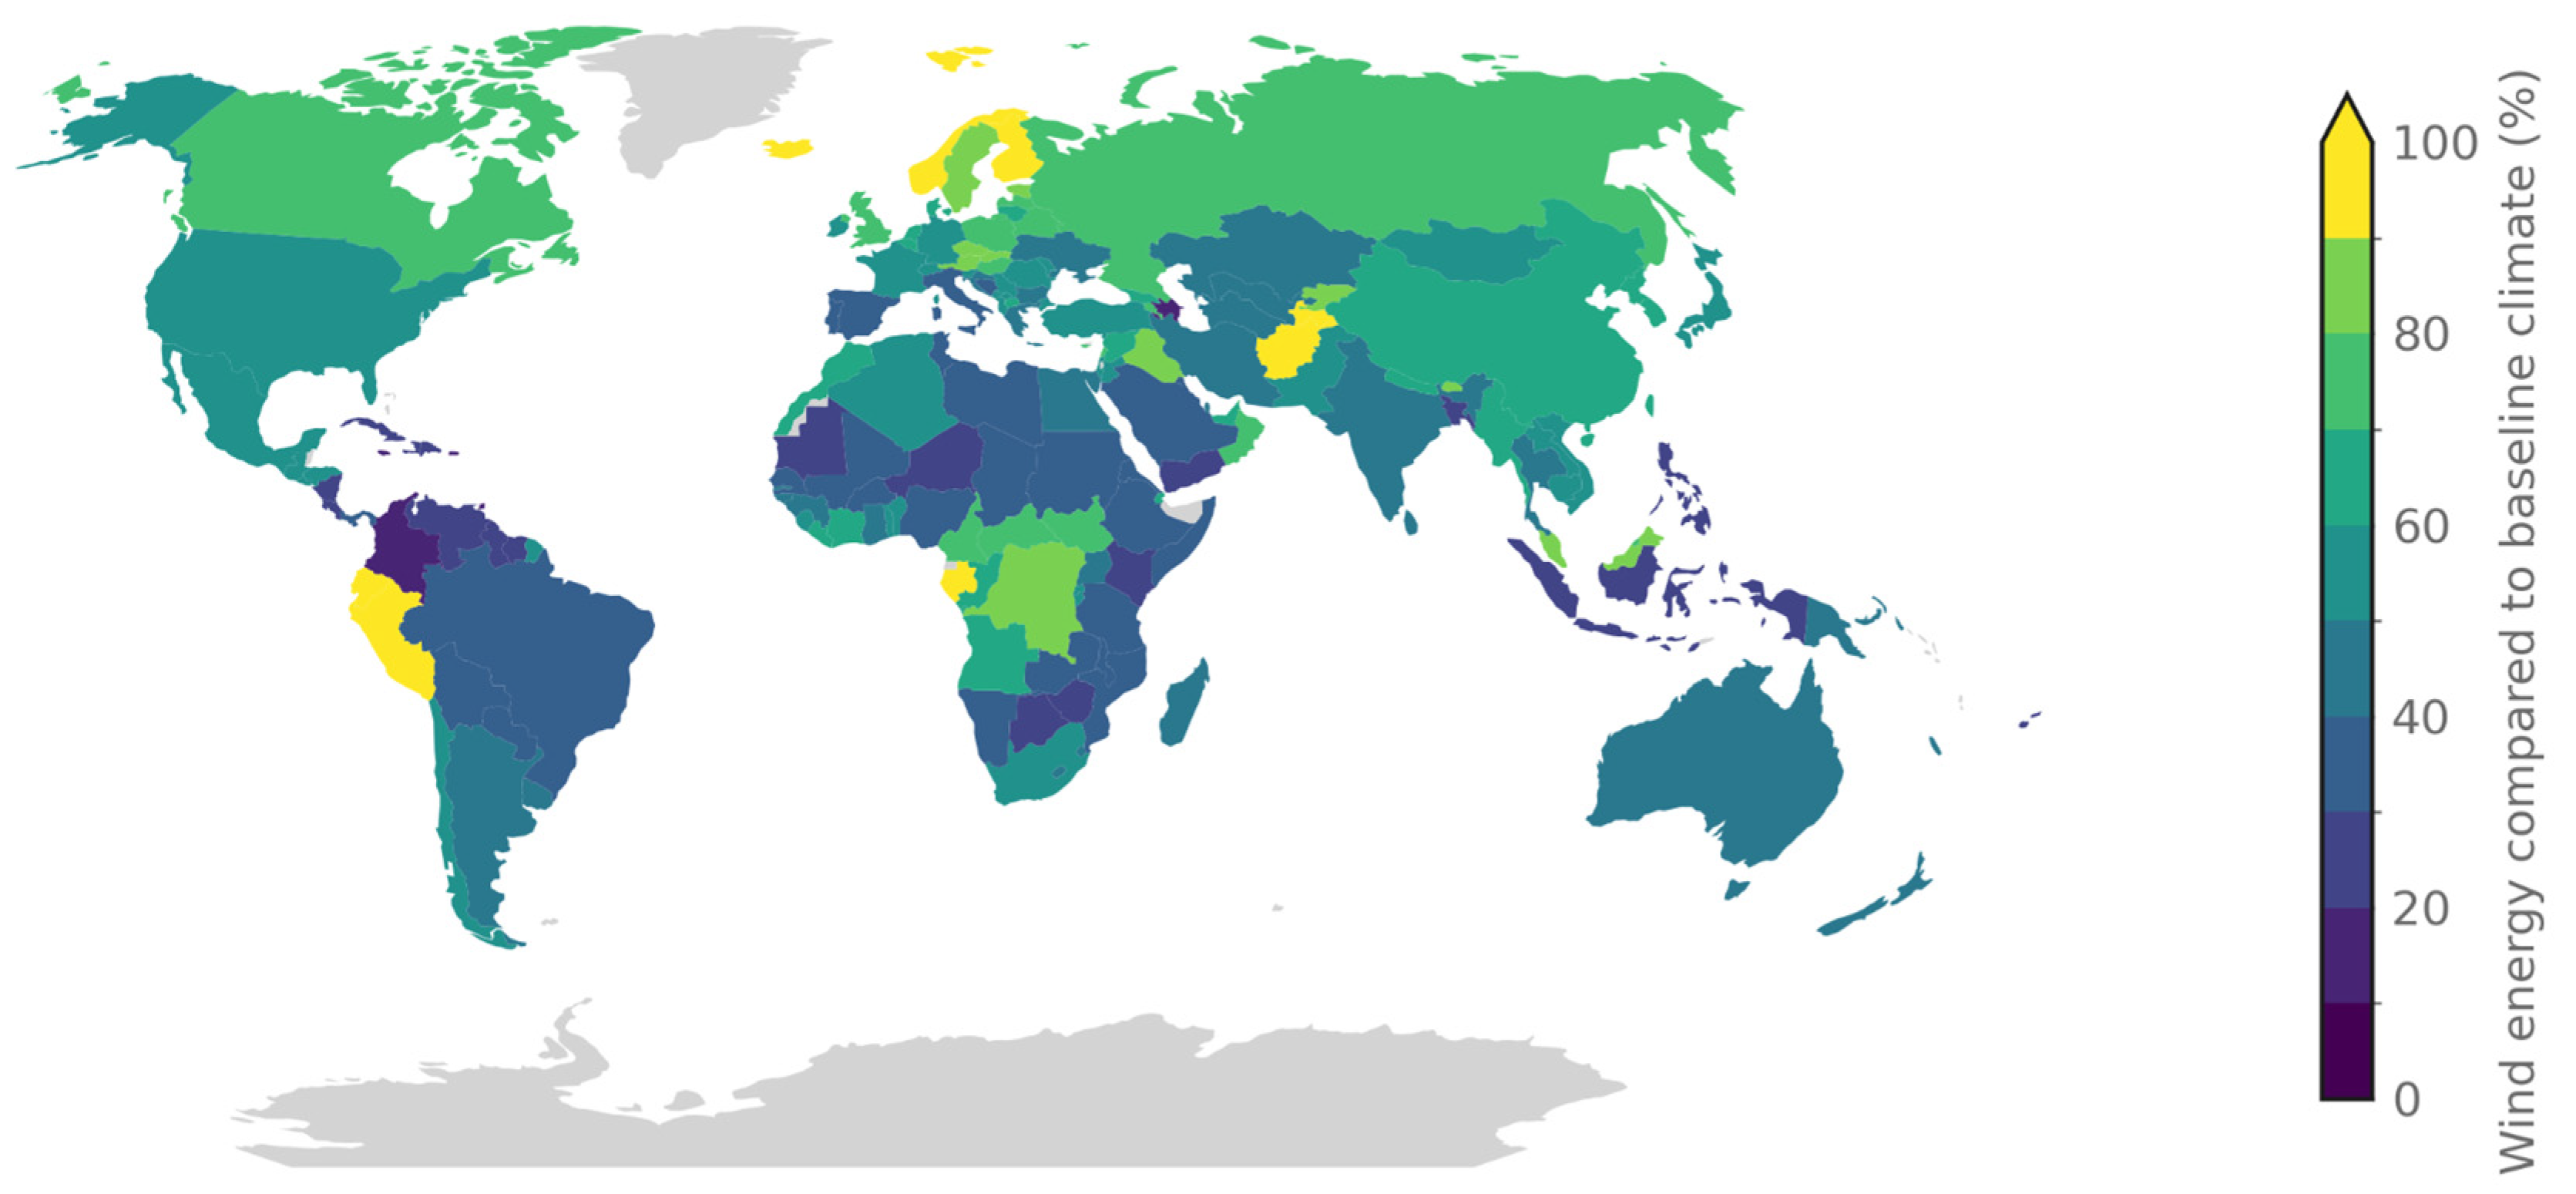
Changes in wind generation compared to the baseline scenario are shown in Figure 4. Reduced solar heating reduces temperature contrasts, reducing wind in most regions. These results show changes in wind generation following an ASRS vary with latitude, in the opposite direction to solar. In general, Northern Hemisphere extratropical regions are expected to retain around 65%, and tropical regions around 40% of baseline wind power.
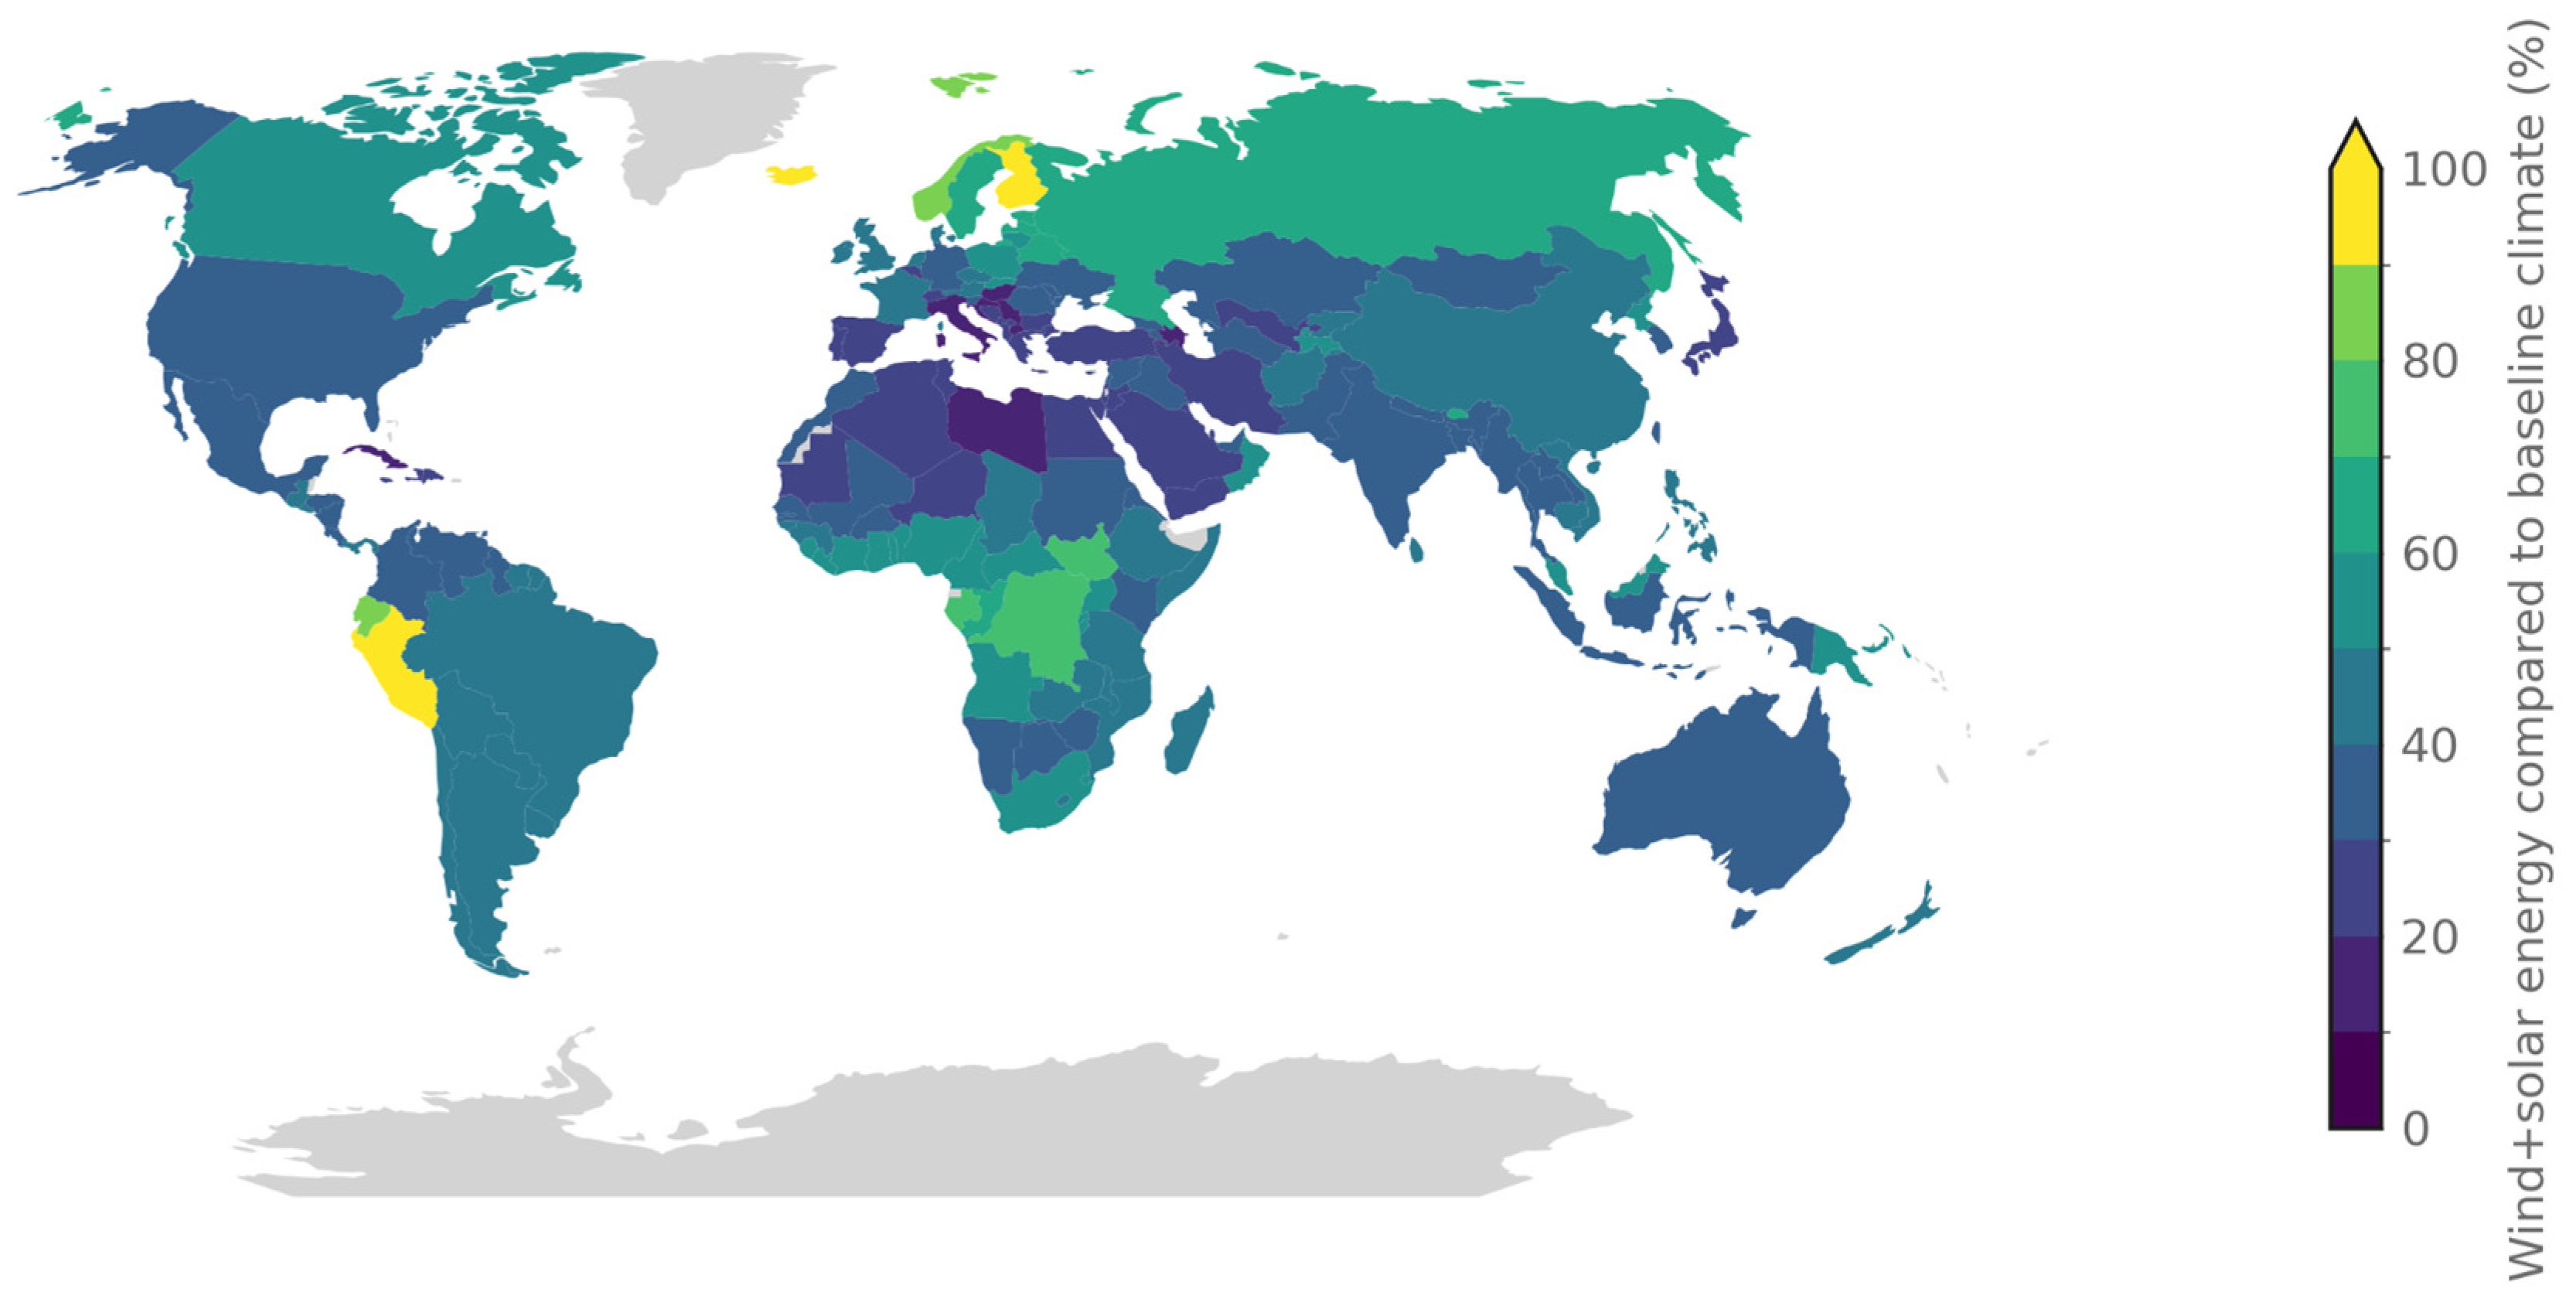
The change in combined wind and solar generation from the baseline scenario is shown in Figure 5. These results show that combined solar and wind generation is expected to reduce by 59% from baseline levels in the first year following an ASRS.

5. Discussion

A catastrophic ASRS, such as that resulting from a nuclear exchange between NATO and Russia, is expected to reduce global combined wind and solar generation by 59% in Year 1. Thus, an ASRS will considerably reduce total production in energy systems relying on renewable generation. Change in wind and solar generation is expected to vary between regions, with greater retention of solar generation in tropical regions and of wind generation in Northern Hemisphere extratropical regions, as shown in Figure 3 and Figure 4. However, high-latitude countries tend to use more wind power and low-latitude countries more solar power (Figure 1), due to the greater intensity of wind and solar energy at higher and lower latitudes, respectively. Thus, the differences in pre-ASRS generation would mitigate the worst effects of an ASRS on renewable generation. Despite these variations, renewable energy generation is expected to decrease in the vast majority of countries, as shown in Figure 5.
The impact of an ASRS on the current global energy system would be less pronounced. Wind and solar represent only 5% of current global primary energy consumption [53]. The primary energy from food biofuels is 0.7% of the total global primary energy supply. Since food would be scarce, food biofuels will likely cease in an ASRS, and this combined with a loss of 59% of wind and solar due to ASRS would be ~4% of primary energy loss, which would not pose a catastrophic energy problem.
However, an ASRS would pose challenges for a 100% renewable energy system, with only 41% of baseline energy production remaining. Thus, remaining energy should be prioritized to ensure critical needs are met, including water, shelter, and food. In the following sections, we calculate energy requirements for critical needs and resilient foods, to estimate whether post-ASRS energy production will be sufficient for survival. The primary energy use of water in the baseline scenario is around 4% of total generated electricity [54], or 0.7% of primary energy. This proportion is assumed for the 100% renewable case.
Following an ASRS, global energy requirements may be reduced due to population loss, and pollution and land use changes. Population loss is likely immediately following the cause of an ASRS, but the magnitudes of these losses are uncertain. For example, deaths from supervolcanic eruptions are highly dependent on the location of the eruption [55], and estimates for deaths in the first few days following a nuclear war range from tens of millions [56] to hundreds of millions [57]. Available resources for food and water supply could also be affected by changes in temperature and/or precipitation in an ASRS, or by pollution from the cause of the ASRS, such as radioactive fallout or volcanic ash. However, radioactive fallout in target countries is expected to be of concern for a year at most, even with the larger Cold War-era nuclear arsenals [58].
Additionally, reductions in supply are likely to cause reductions in demand, due to reduced consumption in non-essential areas. Thus, we calculate energy requirements for critical needs based on current consumption, avoiding assumptions about the magnitude of any population loss, pollution, or land use changes. The results of these calculations are thus generalizable to ASRSs with multiple causes, and these values can be scaled according to the magnitude of any reductions in energy demand or supply shocks.

5.1. Heating and Cooling

Currently, heating and cooling require 43 EJ and 8 EJ, respectively [59,60], with space conditioning (combined heating and cooling) representing 12% of global energy demand. In an ASRS, cooling demand would decrease and heating demand increase, so the total energy required globally for thermal comfort may remain relatively constant. However, these changing demands are likely to be unevenly spatially distributed, with some regions experiencing reduced, and others increased, space conditioning loads. Additionally, temperature reductions may cause freezing of some subterranean infrastructure, which would require additional energy to protect.

5.2. Food Production

We estimate energy requirements for food as a percentage of current energy requirements, to approximate food requirements in a future 100% renewable energy system. Conventional food production requires 6% of end-use energy, and the rest of the food system, including transport and storage, requires a further 16% [61]. However, conventional crop production could be reduced by up to 89% in an ASRS [62]. We assume food energy intensity is inversely proportional to its yield, assuming the same energy inputs per hectare (although low-yield land is unlikely to be farmed, so efficiency may increase).
Current food demand of approximately 4.3 billion tonnes [63] is expected to fall in a catastrophe due to reductions in waste, and in food going to animals and biofuels. While reductions up to a factor of 2.5 could still provide adequate food to meet basic caloric requirements, current systems would be insufficient due to reduced crop production in an ASRS [64], so system changes would be required to ensure sufficient production.
Such changes could include relocation of crops towards the equator, increases in planted area, extension of growing seasons with basic greenhouses [65], or resilient food sources, such as the following. Where possible, we calculate the energy required to feed everyone with a given food source, for comparison.
  • Seaweed: Seaweed farming could provide additional food in a catastrophe [66]. Seaweed production requires approximately 70 MJ per kg of dry carbohydrate equivalent (4000 kcal/kg) (dominated by drying energy) [67], so feeding the global population with seaweed would consume 21% of global primary energy.
  • Cellulosic sugar: Biorefineries, paper factories, and breweries could be repurposed to convert agricultural residues into cellulosic sugar [68]. Boilers could burn lignin and other waste products to produce additional electricity. These factories could potentially also produce leaf protein concentrate to contribute to nutritional needs [69].
  • Single-cell protein: Natural gas or biomethane could be used to grow single-cell protein (SCP) for human and animal consumption [70]. The energy intensity of methane SCP is 90–130 MJ (natural gas)/dry kg or 15.8 MJ (electricity)/dry kg, requiring a total of 3800–4800 billion cubic meters of natural gas and 870–910 GWh of electricity to feed everyone, equivalent to 90–115% and 34–36% of global natural gas and electricity consumption, respectively, or 31% of total primary energy. Hydrogen SCP [71], potentially more available in a 100% renewable energy system [72], would consume 6.5 TWh of electricity, equivalent to 21.5% of 2019 global electricity consumption (230% of primary energy), to feed everyone.
  • Edible fat from petroleum wax: Petroleum wax could be converted to edible fat, requiring 740–1000 TWh of electricity and 28,000–34,000 TWh of fuels per year, or 3.3–4.6% of the 2019 global electricity consumption and 42–51% of 2019 global coal production to feed everyone [73]. Since coal is 35% of primary energy [74], fat from wax would take 17% of primary energy. However, current paraffin wax production capacities would be insufficient for these requirements [73] and production would be smaller in a low-carbon scenario.
  • Mushrooms: Mushroom cultivation uses 2.7 MJ of electricity per kg of fresh mushrooms [75]. White button mushrooms have ~310 kcal/kg [76], or 36 MJ/dry kg. To feed everyone, mushroom cultivation would require ~60% of total 2019 electricity production, or ~10% of total primary energy.
  • Artificial light for food production: Algae could be grown in bioreactors, or vegetables in vertical farms, with artificial light [77]. Spirulina microalgae require 140–500 MJ (electricity)/kg dry [78], while artificial light-grown vegetables require about 4100 MJ (electricity)/kg dry (carbohydrate equivalent) at 0.4% electricity to calorie efficiency [79]. Thus, to feed everyone, spirulina would require 6.8–23.9 TWh of electricity (230–930% of 2019 global consumption). This is 40–160% of primary energy, even the lower bound of which would be infeasible in an ASRS because of other energy needs. Artificial light-grown vegetables would require 190 TWh (~1300% of primary energy) to feed everyone. Thus, only small amounts of these energy-intensive resilient foods could be produced post-ASRS.

5.3. Increasing Energy Production

Energy production could also be increased to mitigate post-ASRS supply reductions. Two broad methods of increasing post-ASRS energy production exist: increasing resilience before and rapidly scaling up after the catastrophe.
Figure 3 and Figure 4 suggest strategic locations for the establishment of solar and wind farms, such as Canada and China, where wind and solar generation, respectively, remain high after an ASRS. Integrating these data into energy infrastructure planning could increase energy security and resilience. However, this adaptive distribution of wind and solar generation may not be optimal from a business-as-usual perspective, so the costs of such a strategy may be high. Thus, other low-carbon generation with higher resilience to ASRS, such as geothermal, nuclear power, tidal power, fossil fuels with carbon capture and sequestration, and arguably, hydropower, could be prioritized.
Lower-cost pre-catastrophe interventions, such as preparations for rapid catastrophe response, would not involve pre-catastrophe system changes. Preparations should include planning for the construction of additional generation capacity. However, since renewable production is expected to decrease rapidly following an ASRS, as shown in Figure 5, energy expenditure to construct additional generation capacity should be reserved for cases with minimal up-front and ongoing energy requirements.
An ASRS is expected to reduce conventional food production by up to 89% [62], so energy solutions competing with food, such as using land crops or cellulose for biofuels, should be avoided unless food needs are met. However, biofuel production may be feasible with crops such as seaweed, since people and animals can consume only a limited amount.
Conversely, energy production from wood does not typically compete with food production. Thus, the conversion of internal combustion engine vehicles to run on wood gas could contribute to mitigating energy shortages [80]. Wood gasification requires an internal combustion engine (ICE), which may be limited in a 100% renewable scenario to biofuel or hydrogen ICEs. Wood gasification could also be used to generate electricity from hybrid electric vehicles and to provide direct shaft power from non-hybrid vehicles. Additionally, wood could provide space heating in fireplaces or wood-burning stoves [81].
If conventional electrical generation was scaled up following an ASRS, the focus should be on generation with high energy return on investment (EROI), which typically includes fossil fuel and nuclear power plants, although nuclear power plants’ long construction times would reduce their feasibility immediately following an ASRS. Additionally, fossil fuels may be limited in a 100% renewable energy system, as the majority of mines and wells would be inoperative.
Energy payback time (the period to generate the energy required for construction, fuel production, and decommissioning [82,83,84]) varies between technologies. Wind farms typically have energy payback periods of 6 months to 1 year [85], which would approximately double in an ASRS. Solar PV systems typically have 1–4 year energy payback periods [82], which would increase to 3–12 years in an ASRS. Hydroelectric power plants typically have energy payback periods of around 1–1.5 years [86], but additional capacity is limited, as existing power stations utilize the majority of available resources in many countries [86]. Concentrating solar power (CSP) typically has energy payback periods of 3–4 years [86], which would be further increased by reduced sunlight levels, so would not be viable in an ASRS. Natural gas and coal power plants typically have energy payback periods of 6–12 months and 4–8 months, respectively [86], but reopening of inoperative gas wells and coal mines could limit viability; instead, thermal power plants could be constructed to produce electricity from biogas and/or wood. Nuclear power plants typically have 6–14 month [86] energy payback periods once operational, but plant construction times could be prohibitively long. Geothermal power plants typically have payback periods of 3–6 months [86] but construction could be constrained by feasible locations.
Overall, while methods exist to increase energy production following an ASRS, considerations such as energy payback periods and the need to prioritize food production mean conventional energy sources are unlikely to be feasible. Thus, adaptive measures, including prioritization of critical needs and low-energy foods, will be imperative for energy system resilience. Further measures may include bolstering international cooperation to facilitate the exchange of energy and expertise between countries and fostering robust policies conducive to the rapid deployment of backup energy production. Countries should also consider pre-emptive planning, which is cheaper.

5.4. Summary and Key Takeaways

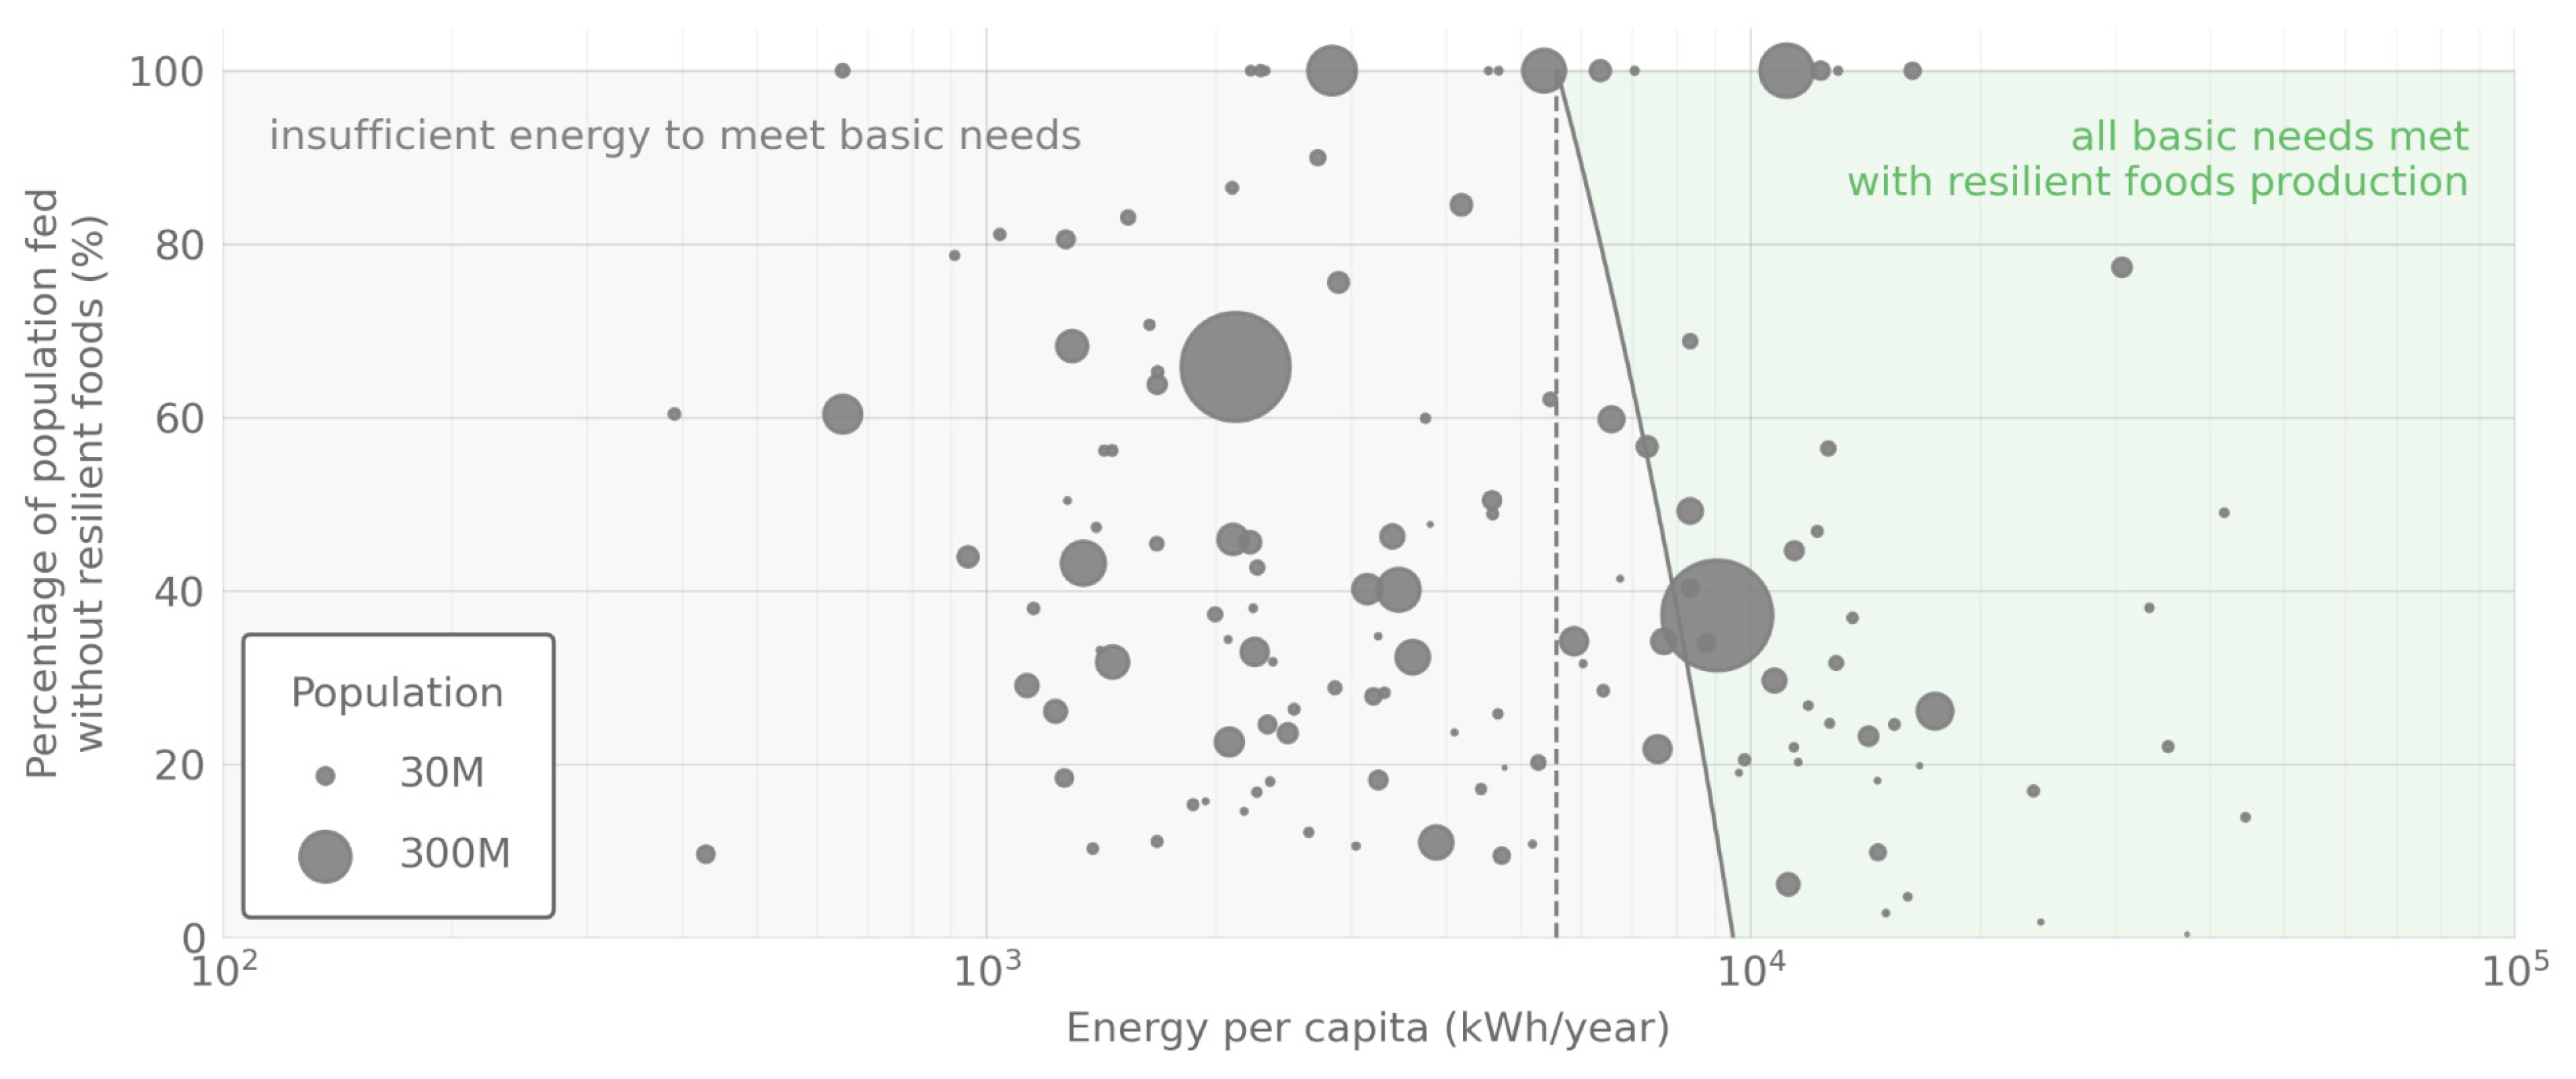
Current annual energy requirements for basic needs are (i) 51 EJ for space conditioning [59,60]; (ii) 95 EJ for the food system [61]; and (iii) 17 EJ for water [54]. Together, the current global demand for basic needs is 163 EJ per year (20,200 MJ, or 5600 kWh, per capita). An ASRS causing a 59% reduction in energy generation would bring global energy production to 153 EJ. Thus, energy production following an ASRS would be insufficient to meet current requirements for basic needs.
Additionally, reduced food production would necessitate additional energy for resilient foods. Figure 6 shows current global energy requirements for basic needs and the proportion of countries whose basic needs could all be met with resilient food production. This energy requirement is calculated by assuming calories required to maintain basic health (2100 kcal per person, or 8.8 MJ, per day [87], with 6–10% waste) are supplied with an equal distribution of mushrooms, cellulosic sugar, methane single-cell protein, seaweed, and petroleum fat to make up the conventional food shortfall. Countries on the left of the dashed vertical line in Figure 6 would not have enough energy to meet basic needs. Countries to the right of the solid diagonal line would have enough energy to meet basic needs, including the production of resilient food needed to fill the calorie gap caused by the ASRS (the amplitude of which varies from country to country [63]). Were the food system unaffected, countries inside the triangular shape formed by the dashed and solid lines would have enough energy to meet their basic needs. However, with reduced crop yields, these countries are unable to meet their basic needs because they have insufficient energy to fill the food gap with resilient food.
Resilient food production would allow more countries to feed their citizens, but global energy production would be insufficient to meet current requirements for basic needs. However, efficiency improvements and prioritizations, such as reducing food waste and improving heating efficiency, could conceivably allow all basic needs to be met. Furthermore, alternative energy sources would be available for some energy end-uses, such as heating houses with fireplaces and wood-burning stoves, rather than electricity. While they have not been quantified in this work, such measures would ease pressures on energy supply and increase energy security and resilience.
As well as the prioritization of energy use, other measures, including international cooperation, will be required to ensure basic needs are met for the maximum amount of people. Post-ASRS energy generation is expected to vary between countries, with generation in a small number of countries increasing and in others decreasing to less than 20% of pre-ASRS levels (Figure 5), so international energy trade will be required.
However, international energy trade may reduce in an ASRS, as most countries’ energy production will reduce, and is likely to further reduce if the ASRS is caused by a nuclear war because of infrastructure destruction and international tensions. Thus, individual nations should also implement measures to increase their resilience to an ASRS, including strengthening international relations and establishing comprehensive contingency plans to mitigate the impacts of catastrophic events on existing energy systems, including the rapid scaleup of resilient foods and resilient energy supply. More expensive interventions could include investing in diversified energy sources, strategic energy storage solutions, and resilient infrastructure, to guarantee energy supply for essential services and critical facilities.

5.5. Limitations and Future Work

This study assesses only the first-order effects of an ASRS on wind and solar energy generation: decreased sunlight on solar panels, and changes in wind speed from variations to differential heating. Other potential effects of an ASRS, such as increased efficiency of solar panels and the accumulation of ice on wind turbine blades, could further affect renewable generation. These second-order effects are complex and may counteract each other, so are not included in these analyses, and further research is needed to determine their nature and magnitude.
Solar and wind power exhibit interannual variability with typical year-to-year variations of around 10% at a single location [88,89,90]. Only one climate simulation is used in these analyses, so this variability cannot be separated from the effects of the ASRS, and variations on the order of 10% in a given country are best interpreted as within the range of expected fluctuations, rather than an impact of the ASRS. However, global interannual variability is much smaller (typically less than 3% for wind [91]), so these variations affect global assessments less.
No distinction is made in this work between direct and diffuse solar radiation when calculating solar power. Solar panels are typically tilted, so PV production could be disproportionately impacted by a reduction in direct radiation caused by atmospheric aerosols [92,93], which could occur following volcanic eruptions. However, the black carbon in a nuclear winter absorbs, rather than scatters, sunlight, so direct radiation is unlikely to be disproportionately affected [94]. Thus, these results should be considered representative, rather than completely predictive, of ASRSs caused by other types of events.
The scattering and absorption of sunlight by soot is wavelength-dependent [94,95], so an ASRS could shift the overall distribution of solar radiation reaching the Earth’s surface and affect solar energy outputs. However, these effects are unknown for a nuclear winter and are not included in these analyses.
In this study, wind turbine power output is assumed to equal the cube of wind velocity. With decreased wind speeds in an ASRS, the output of some turbines may decrease as wind speeds reduce below turbine cut-in speeds. However, the output of other turbines may increase as wind speeds reduce below the cut-out speed [96]. Assessment of the magnitude of these effects would require the cut-in and cut-out speeds of specific turbines, which would limit the generalisability of these results.
The 2° horizontal resolution used in this work is insufficient to capture local wind patterns experienced by wind farms, especially in regions with complex terrain. However, this study compares wind production in an ASRS with a baseline climate scenario using the same models of wind production, minimizing the effects of these differences. Additionally, a similar resolution has been used in previous studies assessing wind turbine output in different climates [15], indicating the suitability of this assumption where more detailed data are unavailable.
The results presented in this work are simulated forecasts and cannot be validated without the event of a catastrophic ASRS. However, the climate data upon which these results are based were generated from the best available model of global climate after nuclear winter, which has been used in many studies [21,62,97]. Additionally, while previous research has not assessed the impacts of an ASRS on renewable energy production, the halving of wind energy predicted in these analyses is higher than average expected changes in wind energy from moderate global warming [98], but lower than the most extreme predictions [13]. Thus, although these results have not been validated, they should be considered representative of what may occur in a severe ASRS.
Energy storage is not included in these analyses. Most methods of energy storage, such as batteries and pumped-hydroelectric storage, introduce additional energy losses, which would further constrain supply issues in an ASRS [99,100]. Demand-side management, which does not introduce additional losses, is expected to be the primary means by which supply intermittency is addressed in future renewable energy scenarios, so the effects of day-to-day storage losses are expected to be minimal [101]. However, the presented methods are generalizable, and future work can use system-specific information to assess the effects of an ASRS on an energy system with large-scale storage, such as that required for inter-seasonal energy balancing.

6. Conclusions

Global annual end-use energy is expected to be around 370 EJ in a 100% renewable energy system, with wind and solar energy electricity generation expected to contribute 94% of the global energy supply. For the worst-case scenario of the first year following a large-scale ASRS in a 100% renewable energy system, results show global energy production is expected to reduce by approximately 41% for wind power, 74% for solar power, and 59% for combined wind and solar. Combined production is expected to take over a decade to recover to pre-ASRS levels, with solar generation following a smooth recovery and wind generation exhibiting higher intra-annual variability due to changes in atmospheric circulation. Different regions are expected to be affected differently, with solar generation most affected in extratropical regions and wind generation most affected in tropical regions. The 59% reduction in energy production would decrease global energy security and necessitate prioritization measures to ensure critical energy needs are met, including food, water, and space heating/cooling. With conventional food production expected to decline alongside energy production after an ASRS, low-energy resilient food sources and low-energy practices, such as the construction of basic greenhouses, crop relocation, expansion of the planted area, seaweed farming, and the utilization of agricultural residues for sugar production should be developed alongside system-level adaptations, such as reductions in animal feed, food biofuels, and food waste. With these changes in food production alongside efficiency improvements and international energy trade, sufficient energy may be available to meet food, water, and heating/cooling needs for most of the global population. Other post-ASRS interventions would help to increase energy security, including wood combustion for home heating and wood gasification for transportation and farm equipment. Additionally, pre-catastrophe interventions would increase energy security following an ASRS, such as strengthened international collaboration and other low-carbon forms of energy, including geothermal, nuclear power, tidal power, fossil fuels with carbon capture and sequestration, and hydropower. We emphasize the need for collaborative international efforts to address global energy security in an ASRS but acknowledge the likelihood of limitations on collaboration and trade following an ASRS caused by an international nuclear exchange, which would leave many countries with insufficient energy to meet critical needs.

Author Contributions

Conceptualization, S.B. and D.D.; methodology, A.R.V., S.B. and D.D.; investigation, A.R.V., S.B., B.L.M.W. and D.D.; writing—original draft preparation, A.R.V. and B.L.M.W.; writing—review and editing, S.B., B.L.M.W. and D.D.; visualization, S.B. and B.L.M.W.; supervision, D.D.; All authors have read and agreed to the published version of the manuscript.

Funding

This research was funded in part by the Alliance to Feed the Earth in Disasters (ALLFED).

Data Availability Statement

The Python (version 3.9.0) scripts used in these analyses are publicly available at https://doi.org/10.5281/zenodo.12797740.

Conflicts of Interest

The authors declare no conflicts of interest.

References

  1. Olabi, A.G.; Abdelkareem, M.A. Renewable energy and climate change. Renew. Sustain. Energy Rev. 2022, 158, 112111. [Google Scholar] [CrossRef]
  2. He Pou a Rangi Climate Change Commission. Ināia tonu nei: A Low Emissions Future for Aotearoa; He Pou a Rangi Climate Change Commission: Wellington, New Zealand, 2021. [Google Scholar]
  3. Dalala, Z.; Al-Omari, M.; Al-Addous, M.; Bdour, M.; Al-Khasawneh, Y.; Alkasrawi, M. Increased renewable energy penetration in national electrical grids constraints and solutions. Energy 2022, 246, 123361. [Google Scholar] [CrossRef]
  4. Joskow, P.L. Challenges for wholesale electricity markets with intermittent renewable generation at scale: The US experience. Oxf. Rev. Econ. Policy 2019, 35, 291–331. [Google Scholar] [CrossRef]
  5. Mia, N.; Das, S.; Hossain, M.; Ahmed, N. A Review on Feasibility of Solar Based Renewable Energy: A Projection Up to 2050. In Proceedings of the 2020 IEEE International Conference on Technology, Engineering, Management for Societal Impact Using Marketing, Entrepreneurship and Talent (TEMSMET), Bengaluru, India, 10 December 2020; pp. 1–6. [Google Scholar]
  6. Lowe, R.J.; Drummond, P. Solar, wind and logistic substitution in global energy supply to 2050–Barriers and implications. Renew. Sustain. Energy Rev. 2022, 153, 111720. [Google Scholar] [CrossRef]
  7. Viviescas, C.; Lima, L.; Diuana, F.A.; Vasquez, E.; Ludovique, C.; Silva, G.N.; Huback, V.; Magalar, L.; Szklo, A.; Lucena, A.F.; et al. Contribution of Variable Renewable Energy to increase energy security in Latin America: Complementarity and climate change impacts on wind and solar resources. Renew. Sustain. Energy Rev. 2019, 113, 109232. [Google Scholar] [CrossRef]
  8. Pincelli, I.P.; Brent, A.C.; Hinkley, J.T.; Sutherland, R. Scaling up solar and wind electricity: Empirical modelling and a disruptive scenario for their deployments in Aotearoa New Zealand. J. R. Soc. N. Z. 2024, 1–23. [Google Scholar] [CrossRef]
  9. Lowery, C.; O’Malley, M. Optimizing wind farm locations to reduce variability and increase generation. In Proceedings of the 2014 International Conference on Probabilistic Methods Applied to Power Systems (PMAPS), Durham, UK, 7–10 July 2014; pp. 1–7. [Google Scholar]
  10. Ribeiro, A.E.D.; Arouca, M.C.; Coelho, D.M. Electric energy generation from small-scale solar and wind power in Brazil: The influence of location, area and shape. Renew. Energy 2016, 85, 554–563. [Google Scholar] [CrossRef]
  11. Jerez, S.; Tobin, I.; Vautard, R.; Montávez, J.P.; López-Romero, J.M.; Thais, F.; Bartok, B.; Christensen, O.B.; Colette, A.; Déqué, M.; et al. The impact of climate change on photovoltaic power generation in Europe. Nat. Commun. 2015, 6, 10014. [Google Scholar] [CrossRef]
  12. Gernaat, D.E.H.J.; de Boer, H.S.; Daioglou, V.; Yalew, S.G.; Müller, C.; van Vuuren, D.P. Climate change impacts on renewable energy supply. Nat. Clim. Chang. 2021, 11, 119–125. [Google Scholar] [CrossRef]
  13. Russo, M.A.; Carvalho, D.; Martins, N.; Monteiro, A. Forecasting the inevitable: A review on the impacts of climate change on renewable energy resources. Sustain. Energy Technol. Assess. 2022, 52, 102283. [Google Scholar] [CrossRef]
  14. Solaun, K.; Cerdá, E. Climate change impacts on renewable energy generation. A review of quantitative projections. Renew. Sustain. Energy Rev. 2019, 116, 109415. [Google Scholar] [CrossRef]
  15. Pryor, S.C.; Barthelmie, R.J.; Bukovsky, M.S.; Leung, L.R.; Sakaguchi, K. Climate change impacts on wind power generation. Nat. Rev. Earth Environ. 2020, 1, 627–643. [Google Scholar] [CrossRef]
  16. Berardi, G.; Green, R.; Hammond, B. Stability, sustainability, and catastrophe: Applying resilience thinking to US agriculture. Hum. Ecol. Rev. 2011, 18, 115–125. [Google Scholar]
  17. Fiksel, J. Sustainability and resilience: Toward a systems approach. Sustain. Sci. Pract. Policy 2006, 2, 14–21. [Google Scholar] [CrossRef]
  18. Maher, J.M., Jr.; Baum, S.D. Adaptation to and recovery from global catastrophe. Sustainability 2013, 5, 1461–1479. [Google Scholar] [CrossRef]
  19. Gasparini, P.; Manfredi, G.; Asprone, D. Resilience and Sustainability in Relation to Natural Disasters—A Challenge for Future Cities; Springer: Berlin/Heidelberg, Germany, 2014. [Google Scholar]
  20. Robock, A. Nuclear winter. Wiley Interdiscip. Rev. Clim. Chang. 2010, 1, 418–427. [Google Scholar] [CrossRef]
  21. Boyd, M.; Wilson, N. Island refuges for surviving nuclear winter and other abrupt sun-reducing catastrophes. Risk Anal. 2023, 43, 1824–1842. [Google Scholar] [CrossRef]
  22. Robock, A.; Oman, L.; Stenchikov, G.L. Nuclear winter revisited with a modern climate model and current nuclear arsenals: Still catastrophic consequences. J. Geophys. Res. Atmos. 2007, 112, D13. [Google Scholar] [CrossRef]
  23. Xia, L.; Robock, A.; Scherrer, K.; Harrison, C.; Jaegermeyr, J.; Bardeen, C.; Toon, O.; Heneghan, R. Global Famine after Nuclear War. Res. Square 2021. [Google Scholar] [CrossRef]
  24. Harwell, M.A. Nuclear Winter: The Human and Environmental Consequences of Nuclear War; Springer Science & Business Media: Berlin/Heidelberg, Germany, 2012. [Google Scholar]
  25. Jacobson, M.Z.; Delucchi, M.A.; Bauer, Z.A.; Goodman, S.C.; Chapman, W.E.; Cameron, M.A.; Bozonnat, C.; Chobadi, L.; Clonts, H.A.; Enevoldsen, P.; et al. 100% clean and renewable wind, water, and sunlight all-sector energy roadmaps for 139 countries of the world. Joule 2017, 1, 108–121. [Google Scholar] [CrossRef]
  26. Mlilo, N.; Brown, J.; Ahfock, T. Impact of intermittent renewable energy generation penetration on the power system networks–A review. Technol. Econ. Smart Grids Sustain. Energy 2021, 6, 25. [Google Scholar] [CrossRef]
  27. Rad, M.A.V.; Kasaeian, A.; Niu, X.; Zhang, K.; Mahian, O. Excess electricity problem in off-grid hybrid renewable energy systems: A comprehensive review from challenges to prevalent solutions. Renew. Energy 2023, 212, 538–560. [Google Scholar]
  28. Wagner, F. Surplus from and storage of electricity generated by intermittent sources. Eur. Phys. J. Plus 2016, 131, 445. [Google Scholar] [CrossRef]
  29. Clerjon, A.; Perdu, F. Matching intermittent electricity supply and demand with electricity storage-An optimization based on a time scale analysis. Energy 2022, 241, 122799. [Google Scholar] [CrossRef]
  30. Arteconi, A.; Hewitt, N.J.; Polonara, F. State of the art of thermal storage for demand-side management. Appl. Energy 2012, 93, 371–389. [Google Scholar] [CrossRef]
  31. Bishop, D.; Nankivell, T.; Williams, B. Peak loads vs. cold showers: The impact of existing and emerging hot water controllers on load management. J. R. Soc. N. Z. 2023, 1–26. [Google Scholar] [CrossRef]
  32. Williams, B.; Bishop, D.; Hooper, G.; Chase, J.G. Driving change: Electric vehicle charging behavior and peak loading. Renew. Sustain. Energy Rev. 2024, 189, 113953. [Google Scholar] [CrossRef]
  33. Dallinger, D.; Wietschel, M. Grid integration of intermittent renewable energy sources using price-responsive plug-in electric vehicles. Renew. Sustain. Energy Rev. 2012, 16, 3370–3382. [Google Scholar] [CrossRef]
  34. Mal, S.; Chattopadhyay, A.; Yang, A.; Gadh, R. Electric vehicle smart charging and vehicle-to-grid operation. Int. J. Parallel Emergent Distrib. Syst. 2013, 28, 249–265. [Google Scholar] [CrossRef]
  35. Moghaddam, Z.; Ahmad, I.; Habibi, D.; Phung, Q.V. Smart charging strategy for electric vehicle charging stations. IEEE Trans. Transp. Electrif. 2017, 4, 76–88. [Google Scholar] [CrossRef]
  36. Gellings, C.W.; Chamberlin, J.H. Demand-Side Management: Concepts and Methods; Fairmont Press: Atlanta, GA, USA, 1987. [Google Scholar]
  37. Williams, B.; Bishop, D.; Gallardo, P.; Chase, J.G. Demand Side Management in Industrial, Commercial, and Residential Sectors: A Review of Constraints and Considerations. Energies 2023, 16, 5155. [Google Scholar] [CrossRef]
  38. Koohi-Fayegh, S.; Rosen, M.A. A review of energy storage types, applications and recent developments. J. Energy Storage 2020, 27, 101047. [Google Scholar] [CrossRef]
  39. Khan, N.; Dilshad, S.; Khalid, R.; Kalair, A.R.; Abas, N. Review of energy storage and transportation of energy. Energy Storage 2019, 1, e49. [Google Scholar] [CrossRef]
  40. Ibrahim, H.; Ilinca, A.; Perron, J. Energy storage systems—Characteristics and comparisons. Renew. Sustain. Energy Rev. 2008, 12, 1221–1250. [Google Scholar] [CrossRef]
  41. Zohuri, B. Energy Storage Technologies and Their Role in Renewable Integration. In Hybrid Energy Systems: Driving Reliable Renewable Sources of Energy Storage; Zohuri, B., Ed.; Springer International Publishing: Cham, Switzerland, 2018; pp. 213–255. [Google Scholar] [CrossRef]
  42. Gelazanskas, L.; Gamage, K.A.A. Managing renewable intermittency in smart grid: Use of residential hot water heaters as a form of energy storage. In Proceedings of the 2016 19th International Symposium on Electrical Apparatus and Technologies (SIELA), Bourgas, Bulgaria, 29 May–1 June 2016; pp. 1–4. [Google Scholar]
  43. Perez-Arriaga, I.J.; Batlle, C. Impacts of intermittent renewables on electricity generation system operation. Econ. Energy Environ. Policy 2012, 1, 3–18. [Google Scholar] [CrossRef]
  44. Summerbell, D.L.; Khripko, D.; Barlow, C.; Hesselbach, J. Cost and carbon reductions from industrial demand-side management: Study of potential savings at a cement plant. Appl. Energy 2017, 197, 100–113. [Google Scholar] [CrossRef]
  45. Warren, P. A review of demand-side management policy in the UK. Renew. Sustain. Energy Rev. 2014, 29, 941–951. [Google Scholar] [CrossRef]
  46. Golmohamadi, H. Demand-side management in industrial sector: A review of heavy industries. Renew. Sustain. Energy Rev. 2022, 156, 111963. [Google Scholar] [CrossRef]
  47. Kazmi, H.; Mehmood, F.; Lodeweyckx, S.; Driesen, J. Gigawatt-hour scale savings on a budget of zero: Deep reinforcement learning based optimal control of hot water systems. Energy 2018, 144, 159–168. [Google Scholar] [CrossRef]
  48. Williams, B.; Gallardo, P.; Bishop, D.; Chase, J.G. Impacts of electric vehicle policy on the New Zealand energy system: A retro-analysis. Energy Rep. 2023, 9, 3861–3871. [Google Scholar] [CrossRef]
  49. Osorio-Aravena, J.C.; Aghahosseini, A.; Bogdanov, D.; Caldera, U.; Muñoz-Cerón, E.; Breyer, C. The role of solar PV, wind energy, and storage technologies in the transition toward a fully sustainable energy system in Chile by 2050 across power, heat, transport and desalination sectors. Int. J. Sustain. Energy Plan. Manag. 2020, 25, 2020. [Google Scholar]
  50. Kiriakidis, P.; Christoudias, T.; Kushta, J.; Lelieveld, J. Projected wind and solar energy potential in the eastern Mediterranean and Middle East in 2050. Sci. Total Environ. 2024, 927, 172120. [Google Scholar] [CrossRef] [PubMed]
  51. Li, M.; Virguez, E.; Shan, R.; Tian, J.; Gao, S.; Patiño-Echeverri, D. High-resolution data shows China’s wind and solar energy resources are enough to support a 2050 decarbonized electricity system. Appl. Energy 2022, 306, 117996. [Google Scholar] [CrossRef]
  52. Global Energy Monitor. Global Solar Power Tracker. Available online: https://globalenergymonitor.org/ (accessed on 19 May 2024).
  53. Hannah, R.; Rosado, P.; Roser, M. Energy Production and Consumption; Our World in Data: Oxford, UK, 2020. [Google Scholar]
  54. Masłoń, A.; Czarnota, J.; Szaja, A.; Szulżyk-Cieplak, J.; Łagód, G. The enhancement of energy efficiency in a wastewater treatment plant through sustainable biogas use: Case study from Poland. Energies 2020, 13, 6056. [Google Scholar] [CrossRef]
  55. Miller, C.F.; Wark, D.A. Supervolcanoes and their explosive supereruptions. Elements 2008, 4, 11–15. [Google Scholar] [CrossRef]
  56. Wellerstein, A.; Patton, T.; Kutt, M.; Glaser, A. Plan A. 2019. Available online: https://sgs.princeton.edu/the-lab/plan-a (accessed on 10 October 2024).
  57. Mizokami, K. 335 Million Dead? Or Double That? Here’s How People Would Die in the First Three Days of Nuclear War. 2020. Available online: https://nationalinterest.org/blog/buzz/335-million-dead-or-double-heres-how-people-would-die-first-three-days-nuclear-war-114761 (accessed on 10 October 2024).
  58. Johns, L.; Sharfman, P.; Medalia, J.; Vining, R.; Lewis, K.; Proctor, G. The Effects of Nuclear War. United States. Congress; Office of Technology Assessment: Washington, DC, USA, 1979; Available online: https://ota.fas.org/reports/7906.pdf (accessed on 11 October 2024).
  59. International Energy Agency. Space Heating Dashboard. 2023. Available online: https://www.iea.org/reports/space-heating#dashboard (accessed on 19 May 2024).
  60. International Energy Agency. Space Cooling Dashboard. 2023. Available online: https://www.iea.org/reports/space-cooling#dashboard (accessed on 19 May 2024).
  61. Day, F. Energy-Smart Food for People and Climate; FAO: Rome, Italy, 2011. [Google Scholar]
  62. Xia, L.; Robock, A.; Scherrer, K.; Harrison, C.S.; Bodirsky, B.L.; Weindl, I.; Jägermeyr, J.; Bardeen, C.G.; Toon, O.B.; Heneghan, R. Global food insecurity and famine from reduced crop, marine fishery and livestock production due to climate disruption from nuclear war soot injection. Nat. Food 2022, 3, 586–596. [Google Scholar] [CrossRef]
  63. Food and Agriculture Organization of the United Nations. FAOSTAT. Rome. 2024. Available online: https://www.fao.org/faostat/en/#home (accessed on 19 May 2024).
  64. Rivers, M.; Hinge, M.; Rassool, K.; Blouin, S.; Jehn, F.U.; Martínez, J.B.G.; Grilo, V.A.; Jaeck, V.; Tieman, R.J.; Mulhall, J.; et al. Food System Adaptation and Maintaining Trade Could Mitigate Global Famine in Abrupt Sunlight Reduction Scenarios. Glob. Food Secur. 2024, 43, 100807. [Google Scholar] [CrossRef]
  65. Alvarado, K.A.; Mill, A.; Pearce, J.M.; Vocaet, A.; Denkenberger, D. Scaling of greenhouse crop production in low sunlight scenarios. Sci. Total Environ. 2020, 707, 136012. [Google Scholar] [CrossRef]
  66. Jehn, F.U.; Dingal, F.J.; Mill, A.; Harrison, C.; Ilin, E.; Roleda, M.Y.; James, S.C.; Denkenberger, D. Seaweed as a resilient food solution after a nuclear war. Earths Future 2024, 12, e2023EF003710. [Google Scholar] [CrossRef]
  67. World Bank Group. Seaweed Aquaculture for Food Security, Income Generation and Environmental Health in Tropical Developing Countries; World Bank: Washington, DC, USA, 2016. [Google Scholar]
  68. Throup, J.; Martínez, J.B.G.; Bals, B.; Cates, J.; Pearce, J.M.; Denkenberger, D.C. Rapid repurposing of pulp and paper mills, biorefineries, and breweries for lignocellulosic sugar production in global food catastrophes. Food Bioprod. Process. 2022, 131, 22–39. [Google Scholar] [CrossRef]
  69. Donovan, A.; Oppenheimer, C. Imagining the unimaginable: Communicating extreme volcanic risk. In Observing the Volcano World: Volcano Crisis Communication; Springer: Berlin/Heidelberg, Germany, 2018; pp. 149–163. [Google Scholar]
  70. Martínez, J.B.G.; Pearce, J.M.; Throup, J.; Cates, J.; Lackner, M.; Denkenberger, D.C. Methane single cell protein: Potential to secure a global protein supply against catastrophic food shocks. Front. Bioeng. Biotechnol. 2022, 10, 906704. [Google Scholar] [CrossRef] [PubMed]
  71. Martínez, J.B.G.; Egbejimba, J.; Throup, J.; Matassa, S.; Pearce, J.M.; Denkenberger, D.C. Potential of microbial protein from hydrogen for preventing mass starvation in catastrophic scenarios. Sustain. Prod. Consum. 2021, 25, 234–247. [Google Scholar] [CrossRef] [PubMed]
  72. Ishaq, H.; Dincer, I.; Crawford, C. A review on hydrogen production and utilization: Challenges and opportunities. Int. J. Hydrogen Energy 2022, 47, 26238–26264. [Google Scholar] [CrossRef]
  73. Martínez, J.B.G.; Alvarado, K.A.; Denkenberger, D.C. Synthetic fat from petroleum as a resilient food for global catastrophes: Preliminary techno-economic assessment and technology roadmap. Chem. Eng. Res. Des. 2022, 177, 255–272. [Google Scholar] [CrossRef]
  74. Energy Institute. Insights by Source. 2023. Available online: https://www.energyinst.org/statistical-review/insights-by-source (accessed on 19 May 2024).
  75. Santos, A.F.; Gaspar, P.D.; de Souza, H.J.L. Eco-Efficiency in Mushroom Production: A Study on HVAC Equipment to Reduce Energy Consumption and CO2 Emissions. Appl. Sci. 2023, 13, 6129. [Google Scholar] [CrossRef]
  76. U.S Department of Agriculture. FoodData Central. Available online: https://fdc.nal.usda.gov/fdc-app.html (accessed on 19 May 2024).
  77. Denkenberger, D.; Pearce, J.; Taylor, A.R.; Black, R. Food without sun: Price and life-saving potential. Foresight 2019, 21, 118–129. [Google Scholar] [CrossRef]
  78. Tzachor, A.; Smidt-Jensen, A.; Ramel, A.; Geirsdóttir, M. Environmental impacts of large-scale Spirulina (Arthrospira platensis) production in hellisheidi geothermal park iceland: Life cycle assessment. Mar. Biotechnol. 2022, 24, 991–1001. [Google Scholar] [CrossRef]
  79. Nord, M.; Bryson, S. Dark food: Feeding people in space without photosynthesis. New Space 2022, 10, 187–192. [Google Scholar] [CrossRef]
  80. De Decker, K. Wood gas vehicles: Firewood in the fuel tank. Low-Tech Magazine, 18 January 2010. [Google Scholar]
  81. Jose, L.; Raxworthy, M.; Williams, B.L.M.; Denkenberger, D. Be clever or be cold: Repurposed ovens for space heating following global catastrophic infrastructure loss. EarthArXiv 2024. [Google Scholar] [CrossRef]
  82. Surek, T.; Cameron, C. Energy Payback: Clean Energy from PV; PV FAQs; NREL/Sandia: Albuquerque, NM, USA, 1999. [Google Scholar]
  83. Bhandari, K.P.; Collier, J.M.; Ellingson, R.J.; Apul, D.S. Energy payback time (EPBT) and energy return on energy invested (EROI) of solar photovoltaic systems: A systematic review and meta-analysis. Renew. Sustain. Energy Rev. 2015, 47, 133–141. [Google Scholar] [CrossRef]
  84. Kessler, W. Comparing energy payback and simple payback period for solar photovoltaic systems. In E3S Web of Conferences; EDP Sciences: Les Ulis, France, 2017; p. 00080. [Google Scholar]
  85. Marimuthu, C.; Kirubakaran, V. Carbon pay back period for solar and wind energy project installed in India: A critical review. Renew. Sustain. Energy Rev. 2013, 23, 80–90. [Google Scholar] [CrossRef]
  86. Smith, C.; Blink, J.A.; Fratoni, M.; Greenberg, H.R.; Halsey, W.; Simon, A.J.; Sutton, M. Nuclear Energy Return on Energy Investment; Lawrence Livermore National Lab. (LLNL): Livermore, CA, USA, 2012. [Google Scholar]
  87. FAO Joint. Energy and protein requirements: Report of a joint FAO/WHO/UNU Expert Consultation. In Energy and Protein Requirements: Report of a Joint FAO/WHO/UNU Expert Consultation; FAO: Rome, Italy, 1985; p. 206. [Google Scholar]
  88. Kumler, A.; Carreño, I.L.; Craig, M.T.; Hodge, B.-M.; Cole, W.; Brancucci, C. Inter-annual variability of wind and solar electricity generation and capacity values in Texas. Environ. Res. Lett. 2019, 14, 044032. [Google Scholar] [CrossRef]
  89. Krakauer, N.Y.; Cohan, D.S. Interannual variability and seasonal predictability of wind and solar resources. Resources 2017, 6, 29. [Google Scholar] [CrossRef]
  90. International Energy Agency. Managing Seasonal and Interannual Variability of Renewables. April 2023. Available online: https://www.iea.org/reports/managing-seasonal-and-interannual-variability-of-renewables (accessed on 19 May 2024).
  91. Eoltech. World & Europe Onshore Wind Power Portfolio: Interannual Variation of Wind Power Production. 2023. Available online: https://www.eoltech.fr/media/pdfs/202403_Eoltech_Global_Portfolio_Energy_Index.pdf (accessed on 19 May 2024).
  92. Calabrò, E. An algorithm to determine the optimum tilt angle of a solar panel from global horizontal solar radiation. J. Renew. Energy 2013, 2013, 307547. [Google Scholar] [CrossRef]
  93. Masili, M.; Ventura, L. Local tilt optimization of photovoltaic solar panels for maximum radiation absorption. Int. J. Photoenergy 2019, 2019, 3254780. [Google Scholar] [CrossRef]
  94. Coupe, J.; Bardeen, C.G.; Robock, A.; Toon, O.B. Nuclear winter responses to nuclear war between the United States and Russia in the whole atmosphere community climate model version 4 and the Goddard Institute for Space Studies ModelE. J. Geophys. Res. Atmos. 2019, 124, 8522–8543. [Google Scholar] [CrossRef]
  95. Liu, C.; Chung, C.E.; Yin, Y.; Schnaiter, M. The absorption Ångström exponent of black carbon: From numerical aspects. Atmos. Chem. Phys. 2018, 18, 6259–6273. [Google Scholar] [CrossRef]
  96. Lydia, M.; Kumar, S.S.; Selvakumar, A.I.; Kumar, G.E.P. A comprehensive review on wind turbine power curve modeling techniques. Renew. Sustain. Energy Rev. 2014, 30, 452–460. [Google Scholar] [CrossRef]
  97. Jägermeyr, J.; Robock, A.; Elliott, J.; Müller, C.; Xia, L.; Khabarov, N.; Folberth, C.; Schmid, E.; Liu, W.; Zabel, F.; et al. A regional nuclear conflict would compromise global food security. Proc. Natl. Acad. Sci. USA 2020, 117, 7071–7081. [Google Scholar] [CrossRef]
  98. Fant, C.; Schlosser, C.A.; Strzepek, K. The impact of climate change on wind and solar resources in southern Africa. Appl. Energy 2016, 161, 556–564. [Google Scholar] [CrossRef]
  99. Huang, R.; Zhou, K.; Liu, Z. Reduction on the inefficiency of heat recovery storage in a compressed carbon dioxide energy storage system. Energy 2022, 244, 123224. [Google Scholar] [CrossRef]
  100. Tutuncuoglu, K.; Yener, A. Optimal power policy for energy harvesting transmitters with inefficient energy storage. In Proceedings of the 2012 46th Annual Conference on Information Sciences and Systems (CISS), Princeton, NJ, USA, 21–23 March 2012; pp. 1–6. [Google Scholar]
  101. Stanelyte, D.; Radziukyniene, N.; Radziukynas, V. Overview of demand-response services: A review. Energies 2022, 15, 1659. [Google Scholar] [CrossRef]
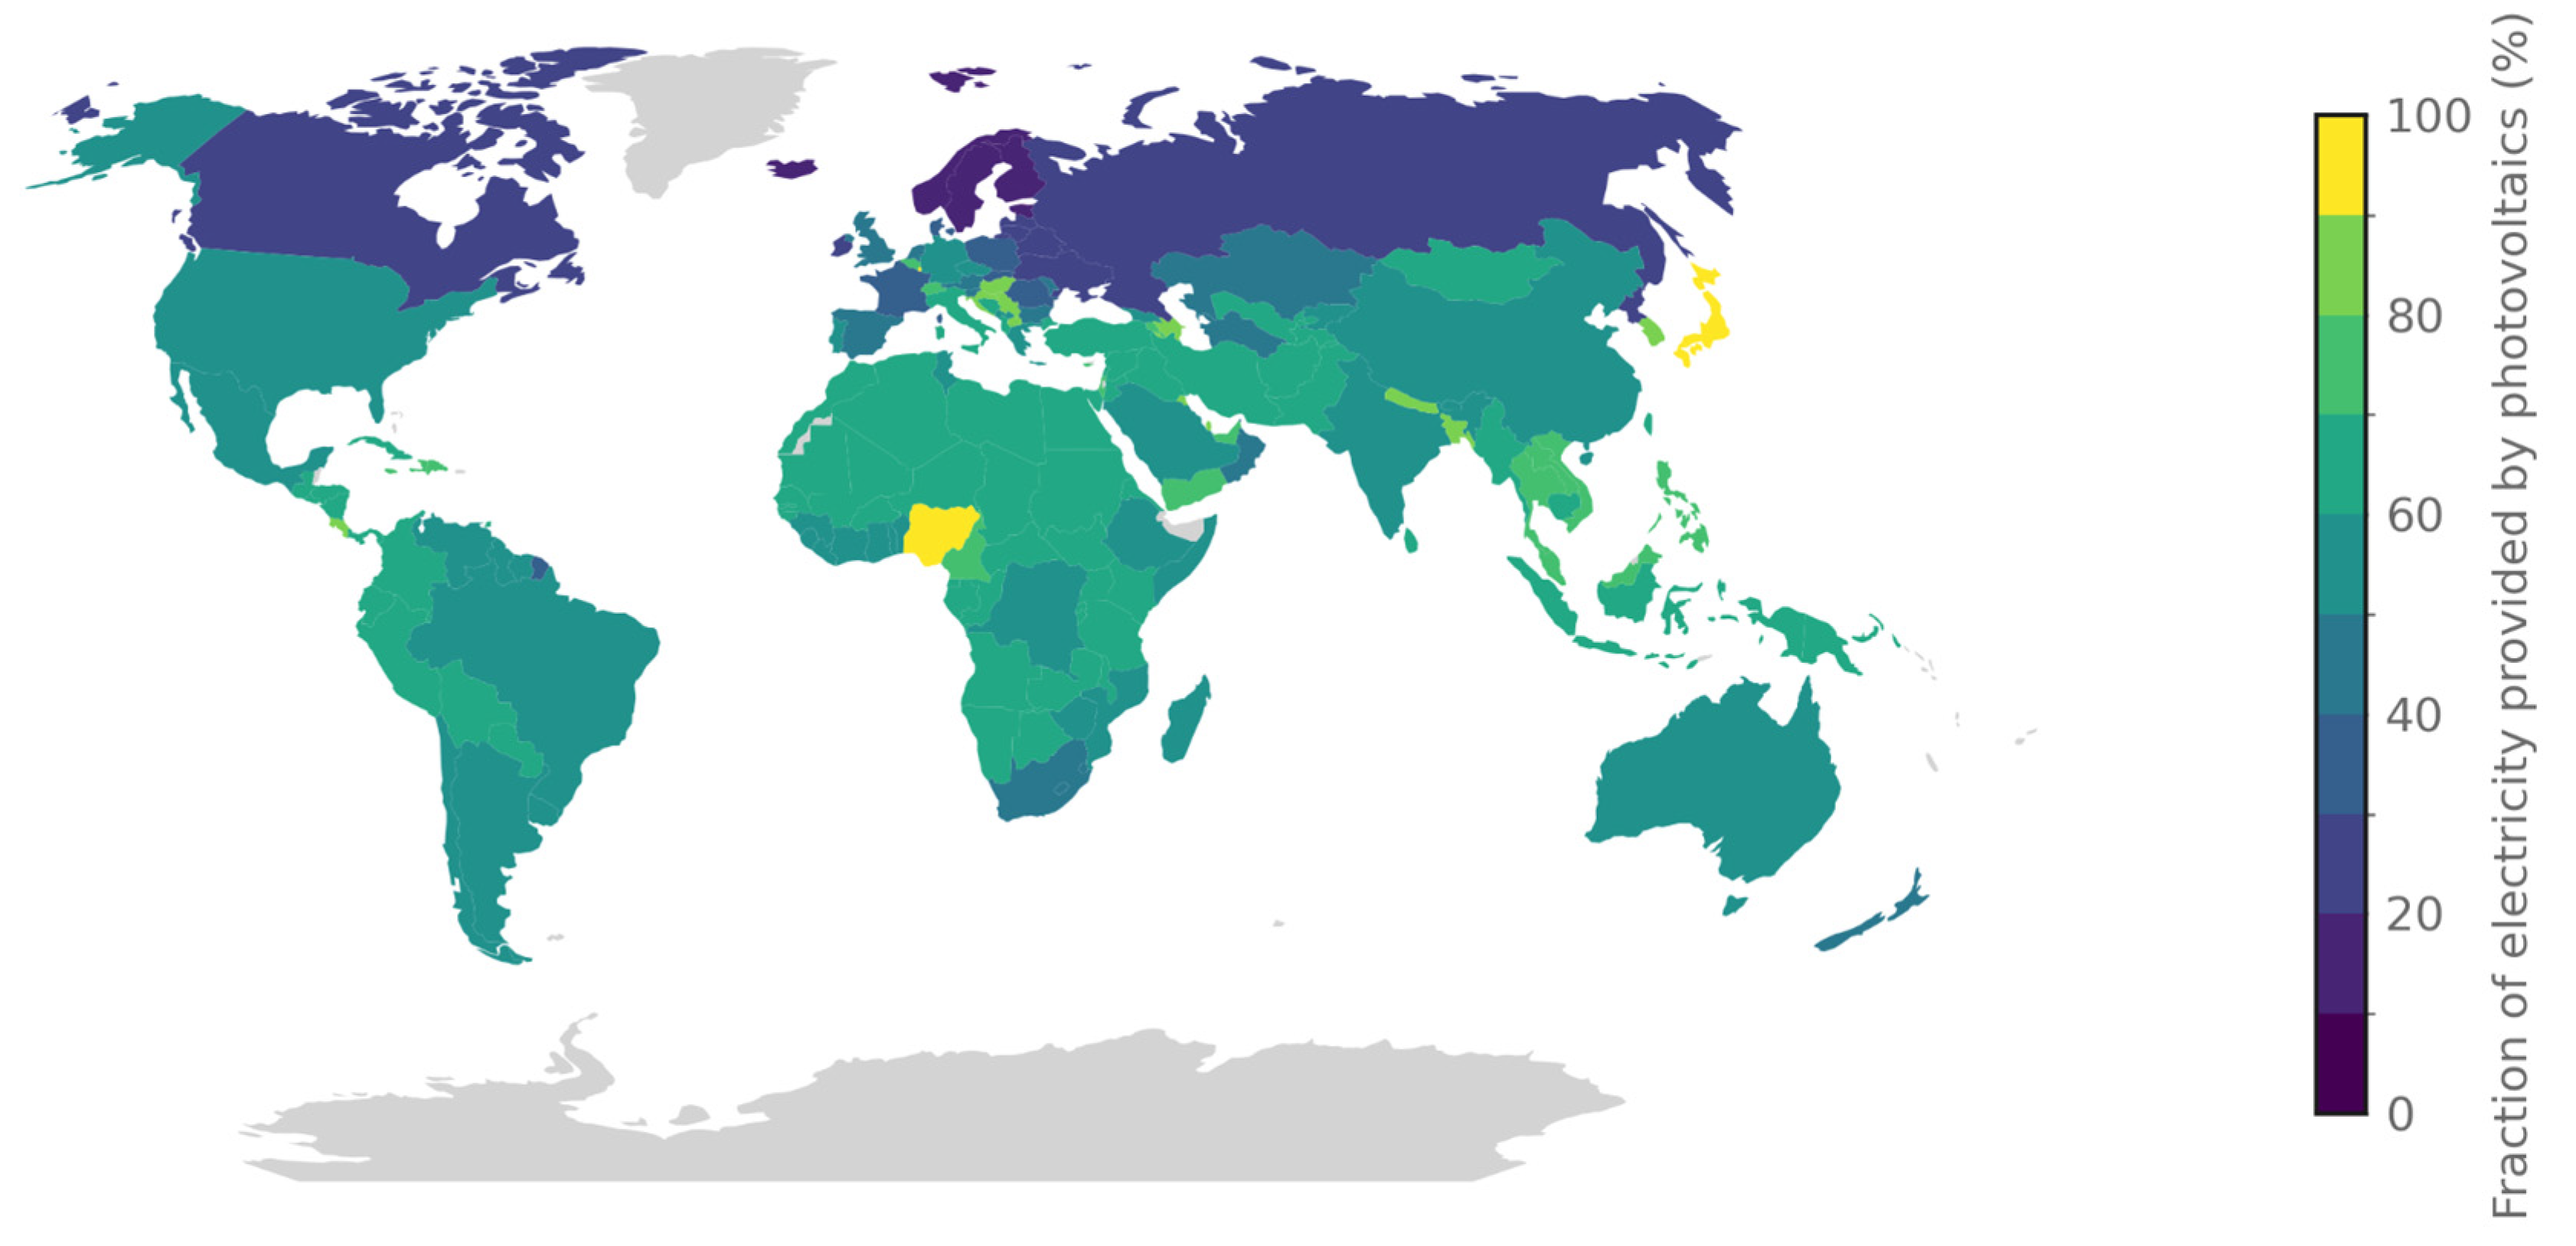
Figure 1. Percentage of energy provided by solar photovoltaics for baseline climate in a 100% renewable scenario.
Energies 17 05147 g001
Figure 2. Global wind and solar production for 12 years after an ASRS caused by a nuclear exchange between NATO and Russia.
Energies 17 05147 g002
Figure 3. Solar energy generation compared to baseline in the first calendar year after nuclear war.
Energies 17 05147 g003
Figure 4. Wind energy generation compared to baseline in the first calendar year after nuclear war.
Energies 17 05147 g004
Figure 5. Wind and solar (overall energy) production compared to baseline in the first calendar year after nuclear war.
Energies 17 05147 g005
Figure 6. Percentage of the population of each country fed without resilient foods [63]. The dashed line represents current energy requirements for critical needs (20,200 MJ, or 5600 kWh, per year, per capita), and the solid line represents the amount of energy needed to fill the food gap with resilient food production, assuming calories are met by an equal distribution of mushrooms, cellulosic sugar, methane single-cell protein, seaweed, and petroleum fat.
Energies 17 05147 g006
Disclaimer/Publisher’s Note: The statements, opinions and data contained in all publications are solely those of the individual author(s) and contributor(s) and not of MDPI and/or the editor(s). MDPI and/or the editor(s) disclaim responsibility for any injury to people or property resulting from any ideas, methods, instructions or products referred to in the content.