Abstract
Shale gas reservoirs with nanoporous media have become one of the primary resources for natural gas development. The nanopore diameters of shale reservoirs range from 5 to 200 nm, with permeability ranging from 1 × 10⁻⁹ to 1 × 10⁻⁶ μm2. The natural gas production from shale gas reservoirs is low, necessitating the use of multi-stage hydraulic fracturing in horizontal wells. Segmented multi-cluster perforation fracturing is an effective method for shale gas extraction in these wells. The number of clusters significantly impacts the productivity of horizontal wells. Therefore, it is essential to analyze the impact of cluster numbers on fracture productivity in shale gas reservoir development. In this study, the equivalent flow resistance method was applied to establish a productivity model for multi-stage hydraulic fracturing horizontal wells in shale gas reservoirs considering diffusion and slip. An approximate analytical solution was obtained, and the effects of cluster length, diffusion coefficient, and fracture network permeability on productivity were analyzed. The results show that gas production gradually increases with the increase in the number of clusters and cluster length. However, as the number of clusters increases, the interference between clusters leads to a decrease in the productivity of individual clusters. As the fracture permeability, fracture network permeability, and diffusion coefficient increase, shale gas production also gradually increases. The permeability of the fracture network has the greatest impact on productivity. These research results are beneficial for the design of clusters in horizontal well fracturing and are of great importance for the development and production of shale gas reservoirs.
1. Introduction
1.1. The Current Development Status and Mainstream Development Technologies of Shale Gas Reservoirs
China’s shale gas production reached 25 billion cubic meters in 2023, accounting for over 10% of the total national natural gas production that year. Shale gas has become one of the main drivers in China’s natural gas production [1]. However, the unique formation mechanism, multi-scale reservoir types, and diverse gas occurrence modes (mainly adsorbed and free, with a small amount in dissolved form) of shale gas reservoirs lead to significant differences in reservoir evaluation methods, parameters, and testing technologies compared to conventional gas reservoirs [2]. The nanopore throat diameter of shale reservoirs ranges from 5 to 200 nm, with permeability between 1 × 10⁻⁹ and 1 × 10⁻⁶ μm2, and randomly distributed microfractures [3]. The natural gas production from shale reservoirs without reservoir stimulation is low [4]. Development through horizontal wells alone often falls short of expected results [5]. Current successful development practices indicate that hydraulic fracturing is the primary technology for effective shale reservoir development. The combination of horizontal wells and staged fracturing techniques can maximize the contact area between complex fracture networks and the matrix, achieving enhanced production effects [6] (as shown in Figure 1).
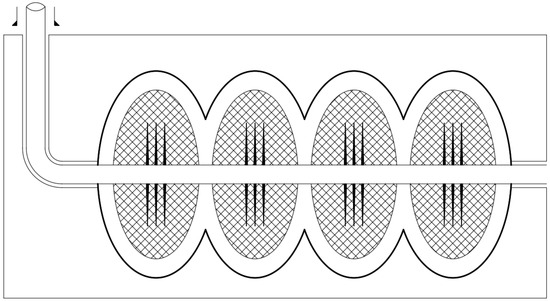
Figure 1.
Schematic diagram of seepage field of shale gas fractured horizontal well.
In recent years, with advances in tight gas reservoir development technology, multi-stage fracturing in horizontal wells has been widely applied. Compared to traditional single-fracture hydraulic fracturing, multi-stage fracturing in horizontal wells can significantly improve extraction efficiency and production, making single-fracture hydraulic fracturing insufficient to meet the overall demands of current tight gas reservoirs [7,8]. Increasingly, reservoirs have adopted multi-cluster fracturing, where the traditional process of creating a single fracture through fracturing has been replaced by multiple perforations during a single fracturing process to create multi-clusters (as shown in Figure 2). Figure 2 depicts the actual full-diameter core after fracturing and displays characteristics of multi-cluster fracturing. It is apparent that a single fracture model cannot adequately represent the characteristics of multi-cluster fractures [9,10].

Figure 2.
Multi-cluster pressure effect of actual full-diameter core [9,10]. Reprinted with permission from Ref. [9]. Copyright 2021, Society of Exploration Geophysicists; Reprinted with permission from Ref. [10]. Copyright 2020, American Rock Mechanics Association. (a) Example core description of 3 ft section, Reprinted by permission of the AAPG whose permission is required for further use; (b) Dense hydraulic fractures observed at the HFTS.
Fu W. [10] proposed an upscaling model for multi-clusters and hydraulic fractures, where multi-clusters were upscaled to a single fracture for research purposes (as shown in Figure 3).
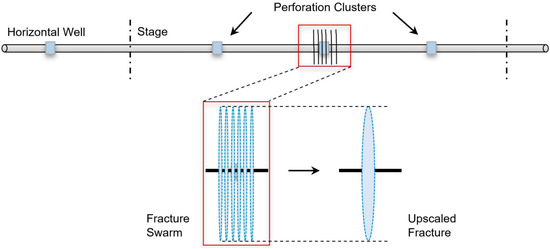
Figure 3.
Up-scale model of multi-clusters and hydraulic fractures [10]. The bottom half of the figure shows each of the simulated hydraulic fractures is equivalent to a swarm consisting of N fractures.
At the same time, micro seismic technology also demonstrates the effect of multi-cluster fracturing. After multi-well fracturing, a dense cluster formation of fractures was revealed, making it difficult to distinguish the morphology of individual fractures (as shown in Figure 4).

Figure 4.
Microseismic tests show a fracture model with multi-clusters [11,12].
In the study, the correctness and applicability of the flow model based on clusters as production units were validated through the establishment of a multi-cluster flow model in shale gas reservoirs using the flow resistance method. The influence of the number of clusters and the half-length of clusters on the gas production of horizontal wells under steady-state conditions was analyzed. Simultaneously, the impact of multi-cluster interference and parameters such as cluster spacing on the production of fractured horizontal wells was investigated. Such research is important for a better understanding and optimization of shale gas development. Although a steady-state solution was used for simplification, future work should focus on developing non-steady-state models to account for the dynamic nature of pressure distribution over time.
1.2. The Flow Models of Shale Gas Reservoirs at the Nanoscale Level
Shale gas flow occurs through nano-microscale matrix pores, micro-fractures, clusters, and wellbores, exhibiting multi-scale characteristics. Different flow mechanisms exist at different scales [13]. Currently, the Knudsen number (Kn) is commonly used to classify the flow regimes of shale gas at different pore size scales. The main classifications include Darcy flow (continuous flow), slip flow (slip effect), transitional flow (combination of slip effect and gas diffusion), and free molecular flow (Knudsen diffusion).
To further complicate the flow dynamics, the anisotropic mechanical properties of shale have been shown to significantly impact these flow regimes, particularly at the nano and microscale levels. Zheng (2019) [14] demonstrated that the laminated structure and preferred orientation of micro-fractures within shale can lead to significant variations in permeability, thus influencing the efficiency of gas flow through different pore sizes. These findings suggest that anisotropy must be considered when modeling the transition between different flow regimes.
Rafieepour et al. (2020) [15] extended this understanding by integrating experimental triaxial tests and well log data into a comprehensive model. They developed a 3D transversely isotropic wellbore stability (WBS) model that accounts for variations in Young’s modulus and shear modulus based on bedding plane orientation. This model was applied to the Bakken formation, demonstrating that ignoring anisotropy could lead to significant errors in predicting wellbore deformation and gas flow behavior. The model particularly highlighted how changes in the mechanical properties of shale affect gas flow at the nanoscale, influencing the accuracy of predictions in multiscale flow models.
Zheng (2023) [16] further refined this model by conducting a three-dimensional analysis of stress distribution and wellbore deformation under anisotropic conditions.
where τ is deviator stress; M is the ratio between the two radii of the ellipsoid; γ is mean stress; γ0 is pre-consolidation pressure.
Their findings emphasize that P-wave velocity, calculated from the stiffness tensor, plays a crucial role in connecting experimental data with field data, thereby providing a more accurate prediction of shale behavior under stress. These insights underscore the importance of incorporating anisotropic mechanical properties into flow models, particularly in formations where the effects of transverse isotropy are pronounced.
These advanced models provide a more comprehensive understanding of the multi-scale flow behavior in shale gas reservoirs. By considering anisotropy in their models [15,16], have demonstrated that more accurate and reliable predictions of gas movement through shale formations are achievable, ultimately leading to improved strategies for gas extraction and resource management. This integrated approach to modeling not only enhances the predictability of shale gas flow but also aligns with the broader objective of optimizing shale gas extraction by addressing the unique challenges posed by anisotropic shale formations.
Shale gas exists in two main forms: adsorbed gas on the surface of organic matter and free gas in natural fractures and inter-particle pores. The development process primarily involves large-scale hydraulic fracturing of horizontal wells, allowing methane gas to flow from tiny pores into fractures and then into the wellbore. The complex mechanisms of shale gas development are determined by multiple storage mechanisms and reservoir characteristics of multiple media: diffusion and migration in nano-microscale pores, slip phenomena on pore surfaces, and flow in pores and micro-fractures. These multi-scale mechanisms collectively constitute the multi-scale flow of methane gas in shale reservoirs.
Studies on multi-scale flow issues are of significant importance for shale gas development in China [17,18]. Schepers (2009) [19] pointed out that the flow of shale gas in nano-scale pores and micro-fractures exhibited slip effects and high-speed non-Darcy effects, with non-Darcy flow being predominant. Guan (2011) [20] indicated that the multi-scale pore structure of shale gas reservoirs determined the multi-scale flow modes. In the shale matrix, influenced by slip and diffusion, the flow velocity was described by the Beskok–Karniadakis model [21,22]:
where
where v is the seepage velocity, m/s; Km is the matrix permeability, mD; μ is the gas viscosity, mPa·s; Kn is the Knudsen number, dimensionless; p is the pressure beneath the target formation, MPa; x is the distance between two seepage sections, m; a is the rarefaction factor of the gas, dimensionless.
Yao (2013) [23] systematically summarized the characteristics of nanometer-scale pore structures in shale reservoirs and the multiscale transport mechanisms in shale gas development. They derived a multiscale unified mathematical model of shale gas fractures-rock dual media using the form of flow flux algebra.
where Mg is the molar mass of the gas, kg/mol; Z is the gas compressibility factor, dimensionless; R is the gas constant, dimensionless; T is the temperature, K; φm is the rock porosity, dimensionless; pwfl is the pressure at both ends of the fracture, Pa; pL is the Langmuir pressure, Pa; VL is the Langmuir volume, m3/kg; ρs is the shale core density, kg/m3; Vstd is the molar volume at standard conditions (0 °C, 101.325 kPa), m3/mol; bm is the Klinkenberg coefficient of gas in the rock, dimensionless; bf is the fracture permeability, mD; μg is the gas viscosity, mPa·s; Kf is the fracture permeability, mD; re is the drainage radius, m; rw is the wellbore radius, m.
Research results indicated that optimizing the allocation of pressure drop, fracture half-length, fracture conductivity, diffusion coefficient, and fracture spacing could achieve high-efficiency production capacity of shale gas.
Zhu (2014) [24,25] made modifications and simplifications to the Beskok–Karniadakis model.
where Dk is the diffusion coefficient, m2/s.
1.3. The Equation for the Production of Hydraulic Fractured Horizontal Shale Gas Wells
Researchers have proposed a more suitable nonlinear seepage capacity model for shale gas production in China. Wang (2012) [26,27] considered the issue of mutual interference between hydraulic fracturing cracks and established a production forecast model for hydraulically fractured horizontal wells, as shown in Figure 5.
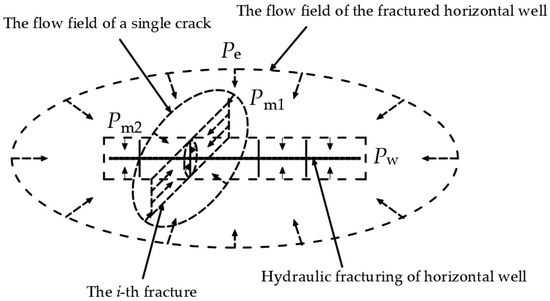
Figure 5.
Simplified diagram of flow field of fractured horizontal Wells [26,27].
By considering mutual interference between multiple fracture flow regions, the production of any single fracture was as follows:
where pw is the bottomhole flowing pressure, MPa; pe is the outer boundary pressure of the gas reservoir, MPa; G is the initiation pressure gradient, MPa·m−1; xfi is the half-length of the fracture, m; h is the reservoir thickness, m; wfi is the cluster width, m; Si is the interference area between any two fractures when multiple fractures are created in a horizontal well, m2; af is the semimajor axis of an elliptical flow area formed by any hydraulic fracture, m.
The model includes the multi-field coupled flow of gas from the matrix to the fractures and then to the horizontal well during the development process, taking into account the interactions between the fractures. It could be effectively applied to predict production from hydraulically fractured horizontal wells in low-permeability reservoirs. Numerical simulation results indicated the presence of an optimal number of fractures in horizontal well fracturing. When the horizontal section of the horizontal well is 300 m long, the optimal number of fractures is five.
Yao (2015) [28,29,30] established a semi-analytical and semi-numerical productivity model, considering the effects of desorption, slippage, and diffusion.
where
where t is time, s; r is the distance from the wellbore, m; Tsc is the temperature at standard conditions, 273.15 K; Zsc is the gas compressibility factor at standard conditions, assumed to be 1, dimensionless; psc is the pressure at standard conditions, 0.1 MPa; T is the target formation temperature, K; Z is the gas compressibility factor at the target formation, dimensionless; m is the pseudo-pressure function, dimensionless; p is the formation pressure, MPa; pa is a known formation pressure, MPa.
The model analyzed the dimensionless permeability of nano-scale pores with respect to temperature and concluded that the influence of temperature on the transport process of shale gas in shale porous media is minimal. The contribution of desorbed gas production to the total production is relatively small in the early stages of production but becomes increasingly significant as production time progresses.
Xie (2015) [31] established a dual-media model for flat plates. The production model for shale gas was developed by using multi-stage fracturing horizontal wells.
where η is the gas density below the target formation, kg/m3; c is the total mass concentration of gas, kg/m3; s is the Laplace transformation constant, dimensionless; ε is the external radius of the matrix block in shale gas reservoirs, m.
Deng (2015) [32] considered diffusion slip flow in nano-scale pores and further took into account the fracturing characteristics of artificial fractures in shale reservoirs. A production capacity model for horizontal wells was established in shale gas reservoirs with multi-stage fracturing. The equation for the production from a single transverse fracture is as follows:
The model compared the desorbed gas, free gas, and total gas volumes in fractured horizontal wells. It shows that diffusion contributed significantly to gas production, accounting for approximately 80% of the total gas production.
Xu (2019) [33] considered multi-scale flow in natural fractures and nano-scale pores in shale gas reservoirs. A mathematical model of fluid flow for a fractured horizontal well with a main fracture was established, as shown in Figure 6.
where
where Q is the production rate of a single well, m3/s; n is the total number of fractures; xe is the half-length of the stimulated region, m; ye is the half-width of the stimulated region, m; df is the seepage width of a single fracture network, m; yeD is the distance from the closed boundary to the middle fracture, m; ηFD is the pressure-transmitting coefficient in the fracture grid region, m4/s; tD is time, s; qD is the dimensionless production rate of a fractured horizontal well in a shale gas reservoir, dimensionless.
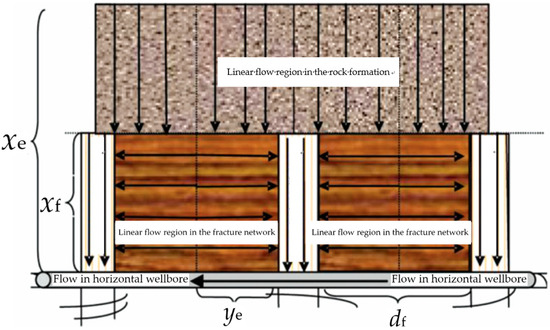
Figure 6.
Seepage model of fractured horizontal well in shale gas reservoir [33].
The model posited that the desorption of adsorbed gas mainly occurred within the matrix and could prolong the linear flow period. The greater the matrix porosity, the higher the production rate of shale gas wells. It was also understood that an increase in the permeability of the main fracture and an increase in formation pressure differential contributed to enhancing the production rate of shale gas wells.
2. Physical Models and Mathematical Models
2.1. Physical Seepage Model of Clusters in Multi-Fracturing Horizontal Well
According to the primary fracturing process of shale gas reservoirs, including single-cluster and multi-cluster fracturing, the flow field models of single-cluster, double-cluster, triple-cluster, and five-cluster fractures are shown in Figure 7. Assuming the development of shale gas reservoirs with multi-cluster hydraulic fracturing horizontal wells, each moment during the development process was considered a quasi-steady state. The entire production process of shale gas is the continuation of this quasi-steady-state process, without considering the adsorption–desorption of shale gas (which should be considered in unsteady-state flow).

Figure 7.
Physical models of clusters. (a) one cluster; (b) two clusters; (c) three clusters; (d) multi-clusters.
The flow region was divided into three parts: Zone I (linear area and radial area), Zone II (cluster network), and Zone III (shale matrix) (as shown in Figure 7a). Zone I included two parts: the flow in the region far from the wellbore inside the fracture was approximately linear along the fracture in a vertical plane, while the flow in the region near the horizontal wellbore was approximately radial in a horizontal plane (as shown in Figure 8).

Figure 8.
Profile view of the cluster.
The physical models of two-cluster, three-cluster, and multi-cluster seepage were shown in Figure 7b–d. Unlike single-cluster seepage, the seepage of fractures with two or more clusters affected by inter-cluster interference.
2.2. Mathematical Models of Seepage Considering Diffusion and Slip
The equation for the seepage velocity in the shale matrix in radial flow with diffusion and slippage is as follows [24].
2.3. The Mathematical Model of Seepage for Intra-Cluster Flow
- (1)
- Zone I (linear area) flow equation
The flow in the vertical plane is linear along the cluster, assuming infinite conductivity within the cluster. The height of the fracture cluster is equal to the formation thickness. The gas flow velocity inside the cluster could be considered as one-dimensional linear flow. The seepage velocity was as follows:
where Kf is the permeability of the cluster, mD.
Under steady-state conditions, the flow rate of one-dimensional linear flow within the cluster is determined by Darcy’s law equation:
where
- (2)
- Zone I (radial area) flow model
This area was approximated as a radial flow region equivalent to a circular supply radius of h/2, a length of wf, and an inner diameter of rw in the production area within the cluster. The radial seepage flow in the cluster agreed with Darcy’s model.
The flow rate of radial flow within the cluster was as follows:
where
- (3)
- Zone II (cluster network) ellipse flow model
When a horizontal well cluster is performed, the shape of the control area formed is elliptical in two dimensions, specifically an ellipse with the two endpoints of the fracturing cluster as the foci (as shown in Figure 9).
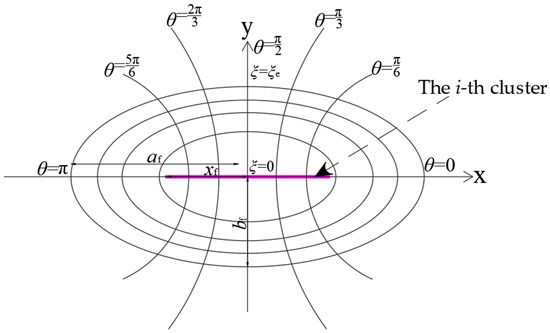
Figure 9.
Elliptic flow region model in Zone II.
The position on the elliptical coordinate system was represented by , and its relationship between rectangular coordinates and elliptical coordinates was as follows:
where ξ is the sum of the distances from any point in the elliptical coordinate system to the two foci; θ is the azimuth angle in the elliptical coordinate system.
The equation for the flow rate of the cluster transformation zone was as follows:
where
where KN is fracture network permeability, mD.
- (4)
- Zone III (shale matrix) ellipse flow equation
The unmodified area is defined as an elliptical flow area within the horizontal strata towards the fracture network zone. This area is a seepage area not affected by fracturing, with non-linear seepage behavior following Equation (18).
The flow equation of the unmodified area under steady-state conditions was as follows:
where
where Km is the matrix permeability, mD; Am is the semi-major axis of the unmodified area, m.
Under steady-state flow conditions, the flow rates through each zone were equal, , the pressures were equal at the interface. By eliminating pm1, pm2, and pm3, the equation for single-cluster production rate is derived as follows:
where
The pressure values of each boundary are as follows:
For multi-clusters, when two elliptical drainage areas intersected, the permeability pressure drop in that area increased. The production of the single cluster where elliptical drainage areas intersected is as follows:
where Si is the control area of any cluster when multi-clusters of horizontal well fracturing interfere with each other, m2; Bm is the untransformed zone ellipse minor axis, m.
The permeability control area of the edge cluster and the permeability control area of the central cluster are different (as shown in Figure 10). The description of Si is as follows:
where d is cluster distance and m; n is the number of clusters in the fracture.
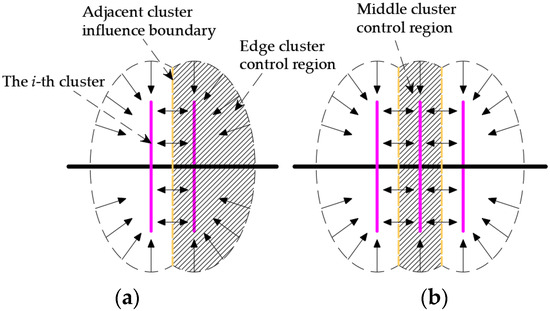
Figure 10.
Schematic diagram of the influence range of Si in the cross-region of multi-clusters. (a) the edge cluster; (b) the middle cluster.
The production equation of a horizontal well is as follows:
where m is the number of stages in the horizontal well fracturing.
3. Solution and Analysis
Based on the basic parameters of shale gas reservoirs, a fractured well in a shale gas reservoir in the Sichuan Basin [22] was referenced (as shown in Table 1). The impact of the diffusion coefficient, cluster half-length, and cluster conductivity on gas well productivity was analyzed for a horizontal well with n clusters by Equation (37). And about the pressure distribution in the seepage zone, please refer to Appendix A.

Table 1.
Basic parameters of the model.
3.1. Influences of Factors on Production
3.1.1. The Influence of Cluster Number
Figure 11 shows the variation in the daily production rate with changing production pressure under different cluster numbers. The results indicated that as the cluster number increased, gas production gradually increased. However, due to interference between clusters, the rate of increase in gas production diminished as the cluster number reached a certain level. With increasing production pressure, the gas production curve of clusters that interfered with each other became more flattened compared to clusters that did not interfere with each other. This indicated that a higher number of clusters is not necessarily better during fracturing, and there is an optimal cluster number that needs to be determined.
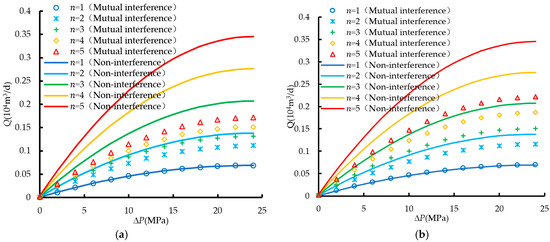
Figure 11.
Daily production with different cluster number conditions. (a) d = 5 m; (b) d = 10 m.
3.1.2. The Influence of Cluster Length
Gas production increased with the extension of cluster half-length (as shown in Figure 12). The growth of cluster half-length enhanced the reservoir’s permeability and gas production. However, when the half-length reached a certain extent, the rate of increase in gas production decreased. This is primarily because excessively long clusters may cause increased interference between fractures, resulting in a lower marginal gain in effective penetration area. While longer clusters generated by fracturing led to higher gas production, the length of clusters is constrained by reservoir geological conditions and fracturing processes. It is impossible to achieve infinite fracture length, and the cluster half-length can only be determined based on specific construction conditions.
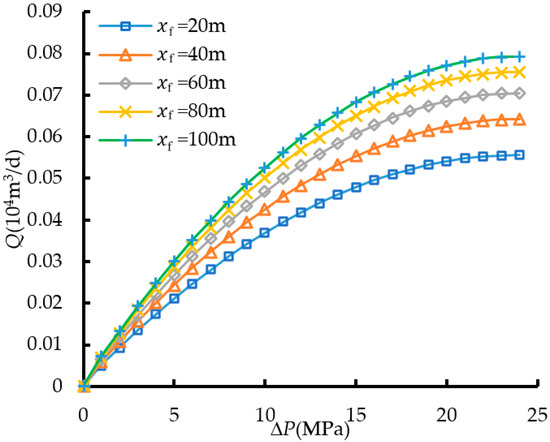
Figure 12.
Daily production with different cluster half-lengths.
3.1.3. The Influence of Diffusion Coefficient on Shale Gas Production
The diffusion coefficient represents the extent of gas diffusion, which is the amount of gas passing through a unit area per unit time. Figure 13 shows that gas production increased proportionally with the increase in the diffusion coefficient. This occurs primarily because a higher diffusion coefficient enhances the transport of gas from nanopores to the fracture network, thereby increasing overall yield. In practical shale gas production, the diffusion coefficient of methane gas generally does not vary significantly.
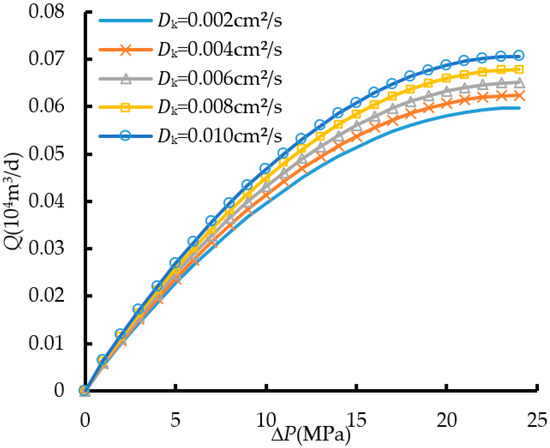
Figure 13.
Daily production with different diffusion coefficients.
3.1.4. The Influence of Fracture Cluster Conductivity on Shale Gas Production
The fracture cluster conductivity (also known as flow conductivity) indicates the ability of fracture clusters to allow fluid flow under closure pressure. Figure 14 shows that gas production increased with the increase in fracture cluster conductivity, but the growth rate was relatively small. Figure 11, Figure 12 and Figure 14 show that shale gas production primarily relies on the size of the stimulated area during hydraulic fracturing, including the half-length of fractures and the number of fracture clusters. Fracture clusters serve as conduits for gas flow with relatively low resistance; thus, the impact of fracture cluster conductivity on the ultimate production capacity of shale gas wells is relatively weaker.
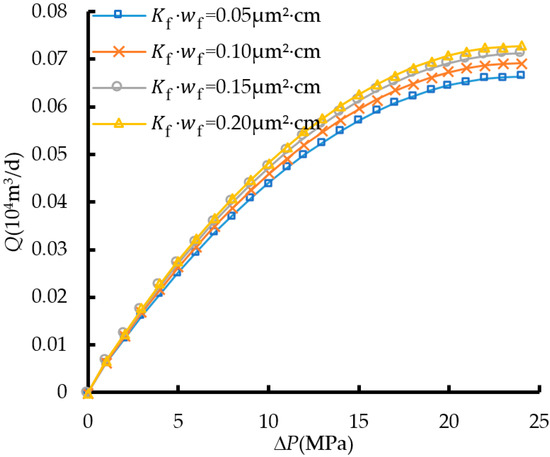
Figure 14.
Daily production with different fracture conductivity.
3.1.5. The Influence of Transformation Zone Permeability on Shale Gas Production
Figure 15 shows that gas production increased significantly with the increase in the permeability of the modified zone, and the growth rate was substantial. However, when the permeability of the modified zone reached a certain level, the rate of increase in gas production started to diminish.
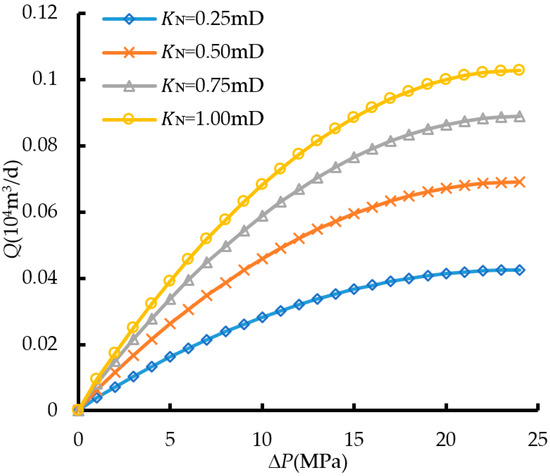
Figure 15.
Daily production with different fracture network permeability.
3.1.6. Sensitivity Analysis of Various Parameters
Figure 16 illustrates the impact of various parameters on cluster production capacity. The convergence of the four lines at a single point is due to identical production conditions (i.e., the same parameters). As shown in Figure 16, the permeability of the fracture network zone has a significant impact on cluster production capacity, while the diffusion coefficient and fracture cluster conductivity have a minor impact. The permeability of the fracture network zone has the greatest influence on production capacity, indicating that effectively increasing the permeability of the fracture network zone is the most effective means to enhance shale gas well productivity.
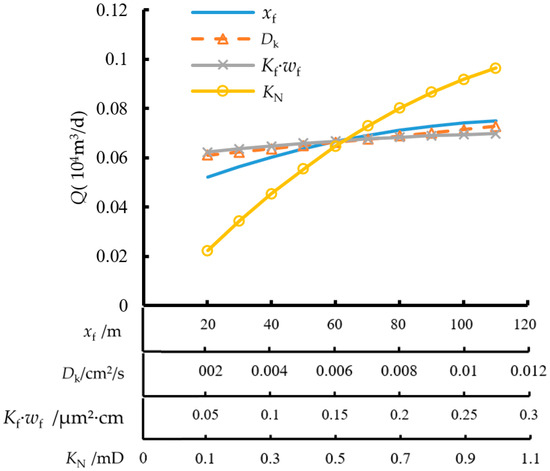
Figure 16.
Sensitivity of each parameter to one cluster productivity.
3.2. Production Analysis of Actual Wells
To further validate the cluster-centered flow model, two hydraulically fractured horizontal wells were selected for comparison and fitting with the theoretical production capacity model. The basic parameters of the wells in Western China are shown in Table 2.

Table 2.
Basic parameters of wells.
Figure 17 shows the comparison between the actual production data and calculated data for the N201 and N209 well areas. The results indicated that under the production pressure difference, the simulation results of this model were within 3% of the actual production data, indicating a good fit.
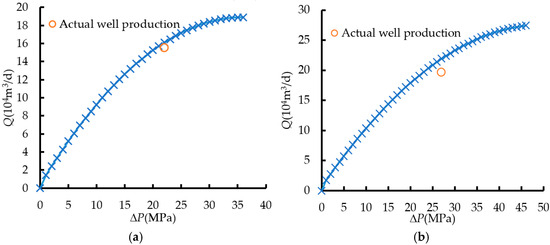
Figure 17.
Productivity fitting results of actual Wells. (a) well N201; (b) well N209.
4. Conclusions
Based on the analysis of the flow field characteristics of fractured horizontal wells, and considering the different regional seepage mechanisms and flow characteristics, one cluster flow of a fracturing horizontal well was divided into physical zones: Zone I (linear area and radial area), Zone II (cluster network), and Zone III (shale matrix).
A multi-scale seepage model was used with clusters as the basic seepage units, and based on the physical model of the three zones, an enhanced production model for shale gas reservoirs with multi-cluster fractured horizontal wells was established by applying the equivalent seepage resistance method, which considered diffusion and slip effects.
The influences of parameters were calculated and analyzed: gas production increases with the increase in the number and length of clusters; however, the increase in the number of clusters led to a decrease in the production of individual clusters. As the permeability of fractures, the permeability of the fracture network, and the diffusion coefficient increase, shale gas production also increases; the permeability of the fracture network has the greatest impact on production.
The comparison between actual production data from shale gas wells shows that the production model of multi-cluster fracturing horizontal wells has a good fit under certain production pressure conditions, which demonstrates the correctness of the model proposed in this study.
While the analysis assumed steady-state flow conditions, it is important to recognize that flow rates are time-dependent and can change as production continues. Incorporating time-dependent models will allow for a more accurate prediction of long-term production, particularly under conditions of fracture closure or declining reservoir pressure.
Author Contributions
Conceptualization, F.S.; methodology, F.S.; validation, C.Z.; formal analysis, X.H.; investigation, Y.W.; resources, F.S.; data curation, C.Z.; writing—original draft preparation, C.Z.; writing—review and editing, F.S.; visualization, X.H. and Y.W.; supervision, F.S.; project administration, F.S. All authors have read and agreed to the published version of the manuscript.
Funding
This paper is supported by the National Natural Science Foundation of China (No. 12272350), National Science and Technology Major Project (No. 2017ZX05072005).
Data Availability Statement
Dataset available on request from the authors.
Conflicts of Interest
The author declares no conflict of interest.
Appendix A
In order to analyze the pressure distribution in the seepage area affected by clusters, the magnitude of the seepage pressure drop caused by each region was calculated to establish reasonable development parameters.
(1) Zone I (radial area) flow equation
(2) Zone I (linear area) flow equation
(3) Zone II (cluster network) ellipse flow equation
(4) Zone III (shale matrix) ellipse flow equation
As shown in Appendix A Figure A1 and Figure A2, it is a typical pressure distribution influenced by a single cluster. The graphs indicate that the main pressure drop in a shale gas reservoir during production occurs in the fracture reformation zone. Therefore, increasing the permeability of the reformation zone can effectively improve the production capacity of shale gas wells, which is consistent with the sensitivity analysis of shale gas well production capacity parameters.
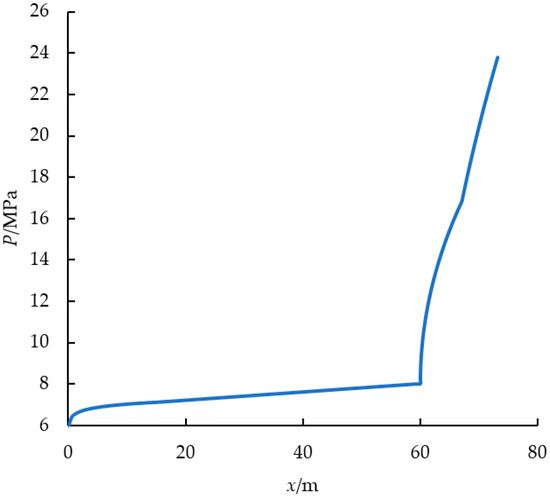
Figure A1.
Pressure distribution curve along cluster direction.
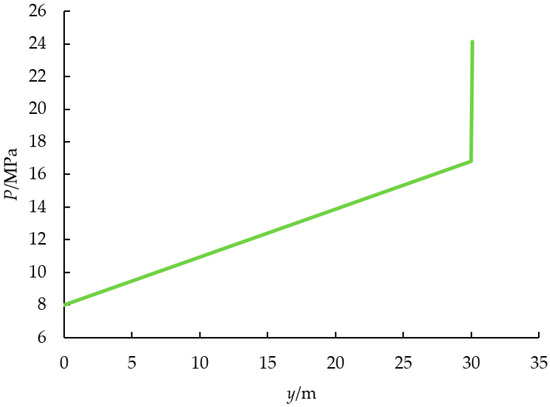
Figure A2.
Pressure distribution curve perpendicular to cluster direction.
References
- Nie, H.; Dang, W.; Zhang, K.; Su, H.; Ding, J.; Li, D.; Liu, X.; Li, P.; Li, P.; Yang, S.; et al. 20 Years of Research and Development of Chinese Shale Gas: Review and Outlook. Nat. Gas Ind. 2024, 44, 20–52. [Google Scholar]
- Li, L.; Wang, H.; Liu, H.; Li, Q.; Zhang, L. Natural gas powering future global development—Summary of the 27th World Gas Conference (WGC). Nat. Gas Ind. 2018, 38, 1–9. [Google Scholar]
- Min, H. Characteristics and Formation Mechanism of High-Over-Mature Shale Reservoirs of the Lower Cambrian Qiongzhusi Formation on the Southwestern Margin of the Yangtze Plate; Chengdu University of Technology: Chengdu, China, 2021. [Google Scholar]
- Dang, J.; Shen, B.; Chen, W.; Xu, S.; Zhang, Y.; Yang, M.; Xi, S. Research and Application of Fracturing Transformation Technology for Deep Tight Sandstone Gas Reservoir in J7 Block. Shandong Chem. Ind. 2023, 52, 184–187. [Google Scholar]
- Chen, W. Factors affecting segmented multi-clusters fracturing technology in horizontal wells. Chem. Eng. Equip. 2022, 6, 78–79. [Google Scholar]
- Li, T.; Zhang, J.; Guan, Y.; Yi, G.; Yang, Q.; Zhang, A. Research Progress on Production Evaluation Techniques of Segmented Fracturing in Horizontal Wells. Sci. Technol. Eng. 2023, 23, 8916–8927. [Google Scholar]
- Li, Q.; Wang, Y.; Wang, F.; Wu, J.; Usman Tahir, M.; Li, Q.; Yuan, L.; Liu, Z. Effect of thickener and reservoir parameters on the filtration property of CO2 fracturing fluid. Energy Sources 2020, 42, 1604880. [Google Scholar] [CrossRef]
- Li, Q.; Cheng, Y.; Li, Q.; Zhang, C.; Ansari, U.; Song, B. Establishment and evaluation of strength criterion for clayey silt hydrate-bearing sediments. Energy Sources Part A Recovery Util. Environ. Eff. 2018, 40, 742–750. [Google Scholar] [CrossRef]
- Ugueto, G.A.; Wojtaszek, M.; Huckabee, P.T.; Savitski, A.A.; Guzik, A.; Jin, G.; Chavarria, J.A.; Haustveit, K. An Integrated View of Hydraulic Induced Fracture Geometry in Hydraulic Fracture Test Site 2. In Proceedings of the Unconventional Resources Technology Conference, Houston, TX, USA, 26–28 July 2021. [Google Scholar]
- Fu, W.; Morris, J.; Fu, P.; Huang, J.; Sherman, C.S.; Settgast, R.R. Simulating Tightly-spaced Swarming Hydraulic Fractures at Field Scale Using an Upscaling Approach. In Proceedings of the ARMA US Rock Mechanics/Geomechanics Symposium, Golden, CO, USA, 28 June–1 July 2020; American Rock Mechanics Association: Alexandria, VA, USA, 2020. [Google Scholar]
- Liu, X.; Tan, Y.; Singh, A.; Waddle, R.; Hilarides, K.; Forand, D.; Liang, B.; Khan, S.; Rijken, M. Learnings on Fracture and Geomechanical Modeling from the Hydraulic Fracturing Test Site in the Midland Basin, West Texas. In Proceedings of the Asia Pacific Unconventional Resources Technology Conference, Virtual, 16–18 November 2021. [Google Scholar]
- Stegent, N.; Candler, C. Downhole Microseismic Mapping of More Than 400 Fracturing Stages on a Multiwell Pad at the Hydraulic Fracturing Test Site (HFTS): Discussion of Operational Challenges and Analytic Results. In Proceedings of the In Unconventional Resources Technology Conference, Houston, TX, USA, 23–25 July 2018. [Google Scholar]
- Song, Y.; Yang, Q.; Ren, Z.; Tao, Y.; Liao, H.; Qiao, L. Calculation of production capacity of fractured horizontal wells in shale gas reservoirs and its influencing factors. Daqing Pet. Geol. Dev. 2023, 42, 158–166. [Google Scholar]
- Zheng, D.; Miska, S.; Ziaja, S.; Ziaja, M.; Zhang, J. Study of anisotropic strength properties of shale. AGH Drill. Oil Gas 2019, 36, 93–112. [Google Scholar] [CrossRef]
- Rafieepour, S.; Zheng, D.; Miska, S.; Ozbayoglu, E.; Takach, N.; Yu, M.; Zhang, J. Combined Experimental and Well Log Evaluation of Anisotropic Mechanical Properties of Shales: An Application to Wellbore Stability in Bakken Formation. In Proceedings of the Annual Technical Conference and Exhibition, Virtual, 27–29 October 2020. [Google Scholar] [CrossRef]
- Zheng, D.; Miska, S.; Ozbayoglu, E.; Zhang, J. Combined Experimental and Well Log Study of Anisotropic Strength of Shale. In Proceedings of the Annual Technical Conference and Exhibition, San Antonio, TX, USA, 16–18 October 2023. [Google Scholar] [CrossRef]
- Zhu, W.; Chen, Z.; Song, Z.; Wu, J.; Li, W.; Yue, M. Research Progress on Development Theory and Technology of Chinese Shale Gas. J. Eng. Sci. 2021, 43, 1397–1412. [Google Scholar]
- Xia, Y.; Deng, Y.; Wei, S.; Jin, Y. Numerical Simulation of Multi-scale Coupled Flow in Fractured Shale Gas Reservoirs. Acta Mech. Sin. 2023, 55, 616–629. [Google Scholar]
- Schepers, K.C.; Nuttall, B.C.; Oudinot, A.Y.; Gonzalez, R.J. Reservoir Modeling and Simulation of the Devonian Gas Shale of Eastern Kentucky for Enhanced Gas Recovery and CO2 Storage. In Proceedings of the International Conference on CO2 Capture, Storage, and Utilization, San Diego, CA, USA, 2–4 November 2009. [Google Scholar] [CrossRef]
- Guan, F.; Wu, E.; Qiu, Z.; Chang, T. Influence of shale gas seepage mechanism on gas reservoir exploitation. Daqing Pet. Geol. Dev. 2011, 30, 4. [Google Scholar]
- Michel, G.G.; Sigal, R.F.; Civan, F.; Devegowda, D. Parametric Investigation of Shale Gas Production Considering Nano-Scale Pore Size Distribution, Formation Factor, and Non-Darcy Flow Mechanisms. In Proceedings of the SPE Annual Technical Conference and Exhibition, Denver, CO, USA, 30 October–2 November 2011. [Google Scholar]
- Freeman, C.M.; Moridis, G.J.; Blasingame, T.A. A Numerical Study of Microscale Flow Behavior in Tight Gas and Shale Gas Reservoir Systems. Transp. Porous Media 2011, 90, 253. [Google Scholar] [CrossRef]
- Yao, J.; Sun, H.; Fan, D.Y.; Wang, C.C.; Sun, Z.X. Numerical simulation of gas transport mechanisms in tight shale gas reservoirs. Pet. Sci. 2013, 10, 528–537. [Google Scholar] [CrossRef]
- Deng, J.; Zhu, W.; Ma, Q. A new seepage model for shale gas reservoir and productivity analysis of fractured well. Fuel 2014, 124, 232–240. [Google Scholar] [CrossRef]
- Zhu, W.; Qi, Q. Study on multi-scale complex flow mechanisms and models of shale gas. Science in China. Technol. Sci. 2016, 46, 111–119. [Google Scholar]
- Wang, Z.; Zhu, W.; Yue, M.; Gao, Y.; Zhao, G.; Wang, H. Calculation method of production capacity of fractured horizontal wells in low and ultra-low permeability oil reservoirs. J. Univ. Sci. Technol. Beijing 2012, 34, 750–754. [Google Scholar]
- Wang, Y.; Dong, D.; Li, J.; Wang, S.; Li, X.; Wang, L.; Cheng, K.; Huang, J. Characteristics of Longmaxi Formation shale gas reservoir in the Lower Silurian of southern Sichuan. Acta Pet. Sin. 2012, 33, 551–561. [Google Scholar]
- Zhang, M.; Yao, J.; Sun, H.; Zhao, J.; Fan, D.; Huang, Z.; Wang, Y. Triple-continuum modeling of shale gas reservoirs considering the effect of kerogen. J. Nat. Gas Sci. Eng. 2015, 24, 252–263. [Google Scholar] [CrossRef]
- Liu, J.; Shang, X.; Zhu, W. Numerical calculation of non-steady-state nonlinear seepage and production capacity prediction of shale gas vertical wells. Science in China. Technol. Sci. 2015, 45, 737–746. [Google Scholar]
- Wu, Y.; Moridis, G.; Berkeley, L.; Bai, B.; Zhang, K. A Multi-Continuum Model for Gas Production in Tight Fractured Reservoirs. In Proceedings of the Hydraulic Fracturing Technology Conference, The Woodlands, TX, USA, 19–21 January 2009. [Google Scholar] [CrossRef]
- Xie, W.; Li, X.; Zhang, L.; Wang, J.; Cheng, Z.; Yuan, L. Discussion on unstable production decline of multi-stage fractured horizontal wells in shale gas reservoirs. Nat. Gas Geosci. 2015, 26, 384–390. [Google Scholar]
- Jia, D. Research on Nonlinear Seepage Theory of Multi-Stage Fractured Horizontal Wells in Shale Gas Reservoirs; University of Science and Technology Beijing: Beijing, China, 2015. [Google Scholar]
- Xu, C.; Zhang, G.; Yin, J.; Ji, G.; Li, X. Comprehensive seepage model of fractured horizontal wells in shale gas reservoirs considering desorption-adsorption. Nat. Gas Geosci. 2019, 30, 111–118. [Google Scholar]
- Qi, Q. Research on Multi-Field Coupling Nonlinear Seepage Theory of Multi-Stage Fractured Horizontal Wells in Shale Gas Reservoirs; University of Science and Technology Beijing: Beijing, China, 2021. [Google Scholar]
- Wang, Y.; Wang, S.; Dong, D.; Li, X.; Huang, J.; Zhang, C.; Guan, Q. Fine dissection of lithofacies of Longmaxi Formation in the Lower Silurian of Chongqing and Jiaoshiba area, Sichuan Basin. Nat. Gas Geosci. 2016, 27, 423–432. [Google Scholar]
- Zhao, Y.; Cui, Q.; Gao, S.; Chen, M.; Zheng, C.; Zhang, L. Inversion of single-stage fracture parameters of shale gas wells based on shut-in pressure data—Taking shale gas wells in the Changning N209 area as an example. J. Shenzhen Univ. (Sci. Eng.) 2024, 41, 22–32. [Google Scholar] [CrossRef]
- Shen, C.; Wu, J.; Fu, Y.; Zeng, B. Dynamic evaluation of long horizontal section fracturing integration for shale gas wells—Taking the Changning national shale gas demonstration zone as an example. Nat. Gas Ind. 2022, 42, 123–132. [Google Scholar]
Disclaimer/Publisher’s Note: The statements, opinions and data contained in all publications are solely those of the individual author(s) and contributor(s) and not of MDPI and/or the editor(s). MDPI and/or the editor(s) disclaim responsibility for any injury to people or property resulting from any ideas, methods, instructions or products referred to in the content. |
© 2024 by the authors. Licensee MDPI, Basel, Switzerland. This article is an open access article distributed under the terms and conditions of the Creative Commons Attribution (CC BY) license (https://creativecommons.org/licenses/by/4.0/).