Abstract
Conventional thermal recovery methods for heavy oil suffer from significant issues such as high water consumption, excessive greenhouse gas emissions, and substantial heat losses. In contrast, electromagnetic heating, as a waterless method for heavy oil recovery, offers numerous advantages, including high thermal energy utilization, reduced carbon emissions, and volumetric heating of the reservoir, making it a focus of recent research in heavy oil thermal recovery technologies. This paper presents a numerical simulation study of electromagnetic heating for heavy oil recovery, using a heavy oil block in the Bohai Bay oilfield in China as a case study. Firstly, a multiphysics field coupled to a mathematical model was established, considering the impact of the temperature on the heavy oil viscosity, the threshold pressure gradient of non-Darcy flow, and the dielectric properties of the reservoir, along with heat dissipation from overlying and undercover sandstone and gravitational effects on fluid flow. Secondly, a numerical simulation method for the coupled multiphysics fields was developed, and the convergence and stability of the numerical simulation method were tested. Finally, a sensitivity analysis based on the numerical simulation results identified the factors affecting heavy oil production. It was found that electromagnetic heating significantly enhances heavy oil production, and the threshold pressure gradient greatly influences the prediction of heavy oil production. Moreover, heat dissipation from the overlying and undercover sandstone severely reduces cumulative oil production. When the production well is located below the electromagnetic heating antenna, larger well spacing results in higher cumulative heavy oil production. Higher heavy oil production is achieved when the antenna is positioned at the center of the reservoir for the studied cases. Power has a big effect on increasing heavy oil production, but its influence diminishes as power increases. There exists an optimal range of electromagnetic frequencies for maximum cumulative production, and higher water saturation leads to poorer electromagnetic heating efficiency. This study provides a theoretical foundation and technical support for the numerical simulation technology and development plan optimization of heavy oil reservoirs subjected to electromagnetic heating.
1. Introduction
Heavy oil is an important petroleum resource, accounting for approximately 40% of the world’s oil reserves [1]. Against the backdrop of increasing global demand for oil and gas, major countries such as China and the United States are focusing on boosting heavy oil production. China possesses abundant heavy oil resources; according to the latest data from the Geological Survey Bureau, heavy oil makes up about 25% of China’s geological oil resources and 8% of total oil and gas reserves. The geological resources of heavy oil amount to over 20 billion tons, with about 4 billion tons being recoverable [2,3]. China’s heavy oil resources are mainly distributed across the Bohai Bay, Songliao Basin, Tarim Basin, Turpan-Hami Basin, and northern Chinese plains [4,5,6]. Although heavy oil is widely distributed in China, its high content of resins and asphaltenes results in high viscosity, affecting its rheological properties. Additionally, due to heavy oil being a Bingham plastic non-Newtonian fluid, there exists a threshold pressure gradient in heavy oil reservoirs which must be overcome for oil flow, limiting the mobilization range of heavy oil reservoirs.
To reduce the viscosity of heavy oil fluids and expand the mobilization range of the reservoir, the industry generally employs thermal stimulation methods to raise the reservoir temperature, thereby reducing the viscosity of heavy oil and improving recovery rates. Currently adopted thermal recovery techniques include cyclic steam stimulation (CSS), steam drive, steam-assisted gravity drainage (SAGD), hot-water flooding, and in situ combustion [7,8,9,10]. Despite the applicability of traditional thermal recovery methods, they often face significant challenges such as high water consumption, excessive greenhouse gas emissions from steam generation, substantial heat losses through long pipelines and non-reservoir areas, and rapid declines in efficiency [11]. To address these issues, researchers have considered electromagnetic thermal recovery (EMTR) technology. Ritchey first proposed EMTR in 1956 for enhancing heavy oil recovery [12]. Compared to traditional thermal recovery methods, the waterless electromagnetic heating of heavy oil offers higher thermal energy utilization, volumetric heating, controllable heating targets, and smaller surface facility footprints. With the integration of renewable energy sources like wind and solar power at field sites, EMTR becomes an even more environmentally friendly and low-carbon technology.
EMTR involves the emission of electromagnetic waves via radiofrequency devices, which affect polar molecules in the reservoir, causing them to frictionally generate heat. This process encompasses the propagation and conversion of high-frequency electromagnetic waves into heat within the heavy oil reservoir, heat transfer within the reservoir, non-Darcy flow of non-Newtonian heavy oil, changes in reservoir thermal stress, and thermal expansion of heavy oil. It involves the strong nonlinear coupling of electromagnetic, temperature and seepage flow fields. Among these, the non-Darcy flow of heavy oil represents a nonlinear moving boundary problem under non-isothermal conditions, for which there is scant research both domestically and internationally [13]. However, the dynamic extension patterns of the effective mobilization regions of the reservoir under heating conditions, as characterized with such moving boundary models, are critical criteria for evaluating the effectiveness of thermal recovery methods in enhancing recovery rates.
Currently, there have been some achievements in research regarding EMTR of heavy oil both domestically and internationally. In 2013, M. Liu and Zhao [14] studied a single-phase radial seepage flow heat transfer coupled model for heavy oil recovery using electromagnetic heating based on a steady-state heat source distribution formula, utilizing COMSOL finite-element software [15]; however, Darcy’s law was used to describe the seepage flow behavior of heavy oil. In 2014, Davletbaev et al. investigated a two-dimensional seepage flow heat transfer coupled model for vertical fractured wells in heavy oil reservoirs under electromagnetic heating; again, Darcy’s law was applied to describe the seepage flow behavior of heavy oil [16]. In 2018, Khisamov et al. proposed an analytical production model for horizontal wells using the SAGD method, studying the dynamic impact of the threshold pressure gradient on steam chamber growth; however, the effect of temperature on the threshold pressure gradient was not considered [17]. In 2018, Wang et al. studied the influence of reservoir properties and the relative dielectric constant of the casing on temperature distribution during electromagnetic in situ thermal recovery of heavy oil reservoirs, considering the temperature dependence of reservoir properties; however, the impact of non-Darcy flow of heavy oil was not addressed [18]. In 2019, Chen et al. established a radial steady-state model for cyclic steam stimulation of heavy oil reservoirs, taking into account the impact of temperature on heavy oil viscosity and the threshold pressure gradient; however, the steady-state model could not reflect the temporal evolution of the effective mobilization region of the reservoir [19]. In 2019, Nevmerzhitskiy used streamline methods to study a thermal recovery model considering the impact of temperature on heavy oil viscosity and the threshold pressure gradient; however, the numerical results lacked verification against solutions of moving boundary models [20]. In 2019, Wang et al. used COMSOL to conduct studies on the radial seepage flow heat transfer coupled model for straight wells in heavy oil reservoirs under Ohmic heating and electromagnetic heating, describing the propagation of electromagnetic waves via Maxwell’s equations and coupling the generated heat source into the heat conduction equation; however, Darcy’s law was still used to describe the seepage behavior of heavy oil [21].
In 2020, Li et al. established a multiphysics field-coupled model of electromagnetic-temperature-seepage flow for microwave in situ heating of heavy oil and conducted numerical simulations to analyze the impact of microwave radiation frequency and power on formation temperature rise and viscosity reduction; however, the non-Newtonian characteristics of heavy oil were not considered [22]. In 2022, Zhang et al. proposed a numerical model for the flow of non-Newtonian Bingham fluids in heavy oil reservoirs using vertical-well radiofrequency (RF) heating, investigating the application of electromagnetic heating in in situ thermal recovery, including bidirectional coupling between non-Darcy flow, transient heat transfer, and electromagnetic (EM) fields. The threshold pressure gradient-induced moving boundary problem was simulated by modifying the gravitational acceleration term in Darcy’s law, and the ultimate mobilization distance was calculated [23]. Additionally, commercial reservoir simulation software CMG IMEX 2021 can simulate non-Darcy flow in heavy oil reservoirs, but there is a lack of verification of solutions for moving boundary models, and CMG does not couple the impact of temperature changes on the threshold pressure gradient. In 2023, Dong established a mathematical model for reservoir temperature distribution based on energy transmission during electromagnetic heating and optimized the frequency using the model solution [24]. In 2023, Zinnatullin et al. conducted experimental and numerical studies on the heating of source rocks under electromagnetic fields, deriving results on the dielectric parameters of source rocks at different temperatures [25]. In 2023, Xiao established an electromagnetic–thermal coupled model considering the temperature dependence of thermal properties in heavy oil reservoirs and analyzed factors affecting reservoir temperature [26]. In 2024, dos Santos Heringer et al. [27] studied the numerical simulation of three-dimensional non-isothermal heavy oil flow using horizontal wells and a variable number of static horizontal heaters via the finite volume method.
Given the limited research on numerical simulations of EMTR that simultaneously considers the impact of temperature changes on the viscosity of heavy oil fluids and the threshold pressure gradient for non-Darcy flow, and the predominance of vertical-well EMTR models, this study aims to use waterless electromagnetic in situ heating of heavy oil as an actual engineering application background. Focusing on a heavy oil field in a specific block of the Bohai Bay, we propose to conduct numerical simulations using COMSOL finite-element software for a SAGD-like horizontal-well EMTR model. This work will consider the mutual coupling of the non-Darcy flow field, temperature field, and electromagnetic field, the effect of temperature changes on the viscosity of Bingham plastic non-Newtonian heavy oil and the threshold pressure gradient, as well as the heat dissipation from overlying and undercover sandstone and the impact of gravity drainage. This study aims to optimize the spacing between injection and production wells and provide recommendations for the selection of radiofrequency device power and frequency, offering technical guidance for the efficient development of heavy oil reservoirs.
2. Physical Model
The physical model of SAGD-like EMTR of heavy oil is shown in Figure 1. The model includes a sandstone reservoir and overlying and undercover sandstone. Due to the different components of a sandstone reservoir, including the overlying and undercover sandstone, the parameters such as density, specific heat capacity, thermal conductivity, conductivity, and relative permittivity are also different. Two horizontal wells are located in the reservoir, and the upper horizontal well is the heating well with an electromagnetic heater (line source heating) in the wellbore for heating only. The horizontal well below is the production well. The top and bottom of the reservoir is a closed boundary. Assuming that the initial temperature of the reservoir and the overlying and undercover sandstone is uniform, there is heat conduction between the reservoir and the overlying and undercover sandstone, and heat will be transferred from the reservoir to the overlying and undercover sandstone. When the electromagnetic heater works, the viscosity and threshold pressure gradient of heavy oil gradually decrease with the increase in temperature near the heating well. Under the action of a pressure gradient and gravity, heavy oil flows to the production well located below the heating well.
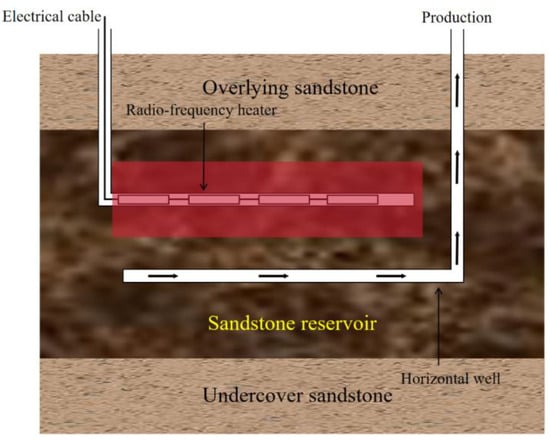
Figure 1.
Schematic diagram of the physical model of SAGD-like EMTR of heavy oil.
When the electromagnetic heater of the heating well is working, the electromagnetic wave acts on the polar molecules in heavy oil, and the electromagnetic energy is converted into heat energy under the effects of dipole polarization and ion conduction, and the volume heating of the reservoir is realized [28]. The viscosity and threshold pressure gradient of heavy oil will decrease with the increase in the temperature of the reservoir, which is conducive to the flow of heavy oil, and will also reduce the heavy oil density (fluid thermal expansion) [29], which will further affect reservoir pressure. In turn, the change in reservoir pressure will cause a change in the seepage flow velocity, affecting the heat convection and then causing a change in the temperature field. In addition, changes in the temperature and pressure fields causes deformation of the porous medium of the reservoir, which directly affects its porosity, so the threshold pressure gradient of the fluid flow, the relative permittivity of the reservoir, the thermal conductivity of the reservoir, and the specific heat capacity of the reservoir will also change, and finally, these changes affect the seepage flow field, temperature field, and electromagnetic field. Therefore, the electromagnetic in situ thermal recovery of heavy oil is a complex nonlinear seepage flow process under the coupling of the electromagnetic field, temperature field, and seepage flow field. The coupling relationship between the physical fields is shown in Figure 2.
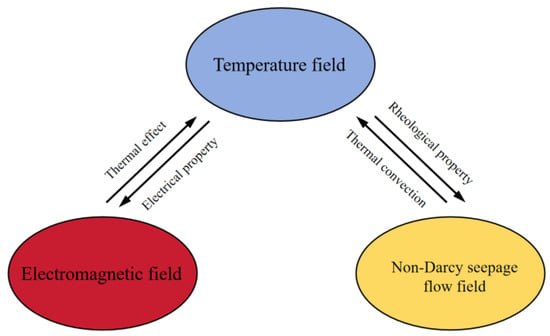
Figure 2.
Schematic diagram of the coupling of the electromagnetic field, temperature field, and seepage flow field.
The vertical cross section of the physical model in Figure 1 is taken as the research object, and the diagram of the geometry for the simulation model is shown in Figure 3. The heating well is located in the center of the heavy oil reservoir, and the production well is located 5 m below the vertical direction of the heating well. In this geometry, the thickness of the reservoir is 30 m, the radial horizontal width along the wellbore is 60 m, and the thicknesses of the overlying and undercover sandstone are 20 m. Γ is the outer boundary of the whole geometry of the reservoir and the overlying and undercover sandstone; Ω1 is the boundary of the heating well; Ω2 is the boundary of the producing well; θo is the boundary between the overlying sandstone and the reservoir. θu is the boundary between the undercover sandstone and the reservoir. In this model, the assumptions are as follows: all area boundaries are continuous smooth boundaries; the heating well is heated via a line source, and the electric field intensity is distributed symmetrically along the heating well; the physical parameters of the overlying and undercover sandstone are homogeneous and isotropic; the reservoir sandstone is homogeneous, and all other physical parameters are isotropic except reservoir permeability; assuming local thermal equilibrium of the heavy oil reservoir, the rock and fluid in the formation always have the same temperature locally; the effect of hydrodynamic thermal dispersion is not considered; the water in the reservoir is irreducible water, and only heavy oil flows in the reservoir; the physical parameters of the overlying and undercover sandstone are the same as the physical parameters of the reservoir sandstone; the phase change of water in the reservoir is ignored.
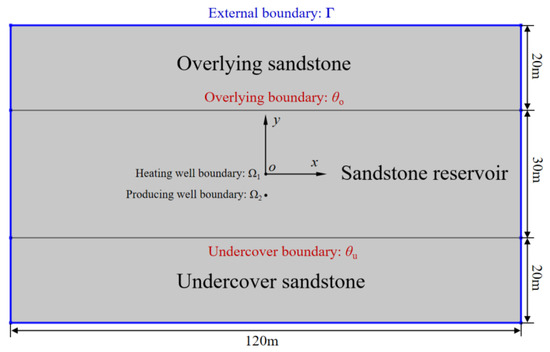
Figure 3.
The diagram of the geometry for the simulation model.
3. Mathematical Model
3.1. Equation for Electromagnetic Field
There is an electromagnetic heater in the heating well. When the electromagnetic heater is used, electromagnetic waves are emitted externally. Because the reservoir is a loping medium, when electromagnetic waves propagate in the reservoir, the electric field distribution in the reservoir can be calculated according to the Maxwell equation, and the governing equation is as follows [30]:
where E is the electric field vector, V/m; μt is the relative magnetic permeability of the reservoir. εt is the relative permittivity of the reservoir; ε0 is the dielectric constant of a vacuum, F/m; σt is the reservoir conductivity, S/m; ω is the angular frequency, rad/s; K0 is the wave number, rad/m; j is the imaginary unit; f is the electromagnetic wave frequency, Hz.
The relative permittivity εt of the reservoir is obtained via the weighted average of the relative permittivity of heavy oil, the relative permittivity of formation water, and the relative permittivity of sandstone [31]:
where ϕ is the reservoir porosity matrix; Sw is the irreducible water saturation; εr is the relative permittivity of sandstone; εw is the relative permittivity of formation water; εo is the relative permittivity of heavy oil.
The conductivity of the reservoir is obtained from the weighted average of the conductivity of formation water, the conductivity of sandstone, and the conductivity of heavy oil:
where σr is the conductivity of sandstone, S/m; σw is the conductivity of formation water, S/m; σo is the conductivity of heavy oil, S/m.
Wave number K0 is obtained using the relative magnetic permeability and relative permittivity of a vacuum according to the following equation:
where εv is the relative permittivity of a vacuum; μv is the relative magnetic permeability of a vacuum.
At the same time, the overlying and undercover sandstone are also lossy media. When electromagnetic waves propagate in the overlying and undercover sandstone, the electric field distribution in the overlying and undercover sandstone can be calculated according to the Maxwell equation, and its governing equation is as follows:
where μr is the relative magnetic permeability of sandstone; ε0 is the dielectric constant of vacuum, F/m.
The heating well is assumed to be a perfect electrical conductor [30]:
The initial condition of the electric field is the following [30]:
Scattering boundary conditions are set on the outer boundary of the geometry and the boundary of the production well [30]:
Reservoir heat source Q is the heat generated via electromagnetic heating [30]:
where Re means the real part; E* denotes the transposition of E.
3.2. Equation for Temperature Field
The heat transfer process of the heavy oil reservoir belongs to the heat transfer of porous media. Assuming local thermal equilibrium of the heavy oil reservoir, the governing equation of heat conduction is as follows [23]:
where ρt is the density of the reservoir, kg/m3; Ct is the specific heat capacity of the reservoir, J/(kg·K); v is the velocity of the fluid, m/s; Kt is the thermal conductivity of the reservoir, W/(m·K); T is the temperature of the reservoir, K; t is the time, Day.
The thermal conductivity of the reservoir Kt is obtained from the weighted average of the thermal conductivity of formation water, the thermal conductivity of sandstone, and the thermal conductivity of heavy oil:
where Kr is the thermal conductivity of sandstone, W/(m·K); Kw is the thermal conductivity of formation water, W/(m·K); Ko is the thermal conductivity of heavy oil, W/(m·K). For the overlying and undercover sandstone, the water saturation is 1.0, and the specific heat capacity of the reservoir Ct meets the following relation:
where Cr is the specific heat capacity of sandstone, J/(kg·K); Cw is the specific heat capacity of formation water, J/(kg·K); Co is the specific heat capacity of heavy oil, J/(kg·K).
The reservoir density satisfies the following relationship:
where ρr is the density of sandstone, kg/m3; ρw is the density of formation water, kg/m3; ρo is the heavy oil density, kg/m3.
The heat transfer process of the overlying and undercover sandstone is only solid heat transfer, and the governing equation of the heat transfer of sandstone is as follows:
where Tθ is the temperature of the overlying and undercover sandstone, K.
The initial condition of the temperature field is:
where T0 is the initial temperature, K.
The boundary between the reservoir and overlying sandstone is a temperature continuity condition:
where is the temperature of the reservoir at the junction with the overlying sandstone, K; is the temperature of the overlying sandstone at the junction, K.
The boundary between the reservoir and undercover sandstone is a temperature continuity condition:
where is the temperature of the reservoir at the junction with undercover sandstone, K; is the temperature of the undercover sandstone at the junction, K.
The heating well and the production well are both thermally insulated:
where Ω1 is the boundary of the heating well; Ω2 is the boundary of the producing well, and q is the heat flux.
For the outer boundary of the reservoir, the overlying and undercover sandstone is the constant temperature outer boundary:
where Γ is the outer boundary of the geometry.
3.3. Equation for Seepage Flow Field
The flow of heavy oil in the pores of sandstone follows the law of conservation of mass, and the governing equation is as follows [23]:
where v is the non-Darcy flow velocity of heavy oil, m/s; ρo is the heavy oil density, kg/m3.
In the production process of the heavy oil reservoir, due to the existence of a threshold pressure gradient, the flow of heavy oil in the reservoir belongs to low-velocity non-Darcy flow. Using the threshold pressure gradient to rewrite the Darcy flow equation, the motion equation of low-velocity non-Darcy flow with the threshold pressure gradient is as follows [23]:
where x and y are space coordinates, m; vx is the seepage flow velocity of heavy oil in the x direction, m/s; vy is the seepage flow velocity of heavy oil in the y direction, m/s; kx is the horizontal permeability of the reservoir, mD; ky is the vertical permeability of the reservoir, mD; λx is the threshold pressure gradient in the x direction, Pa/m; λy is the threshold pressure gradient in the y direction, Pa/m; μ is the viscosity of heavy oil, mPa·s; p is reservoir pressure, Pa; g is the gravitational acceleration, m/s2.
The change in the threshold pressure gradient with the fluidity of heavy oil is as follows [32]:
In addition, with the decrease in reservoir pressure, the reservoir porosity decreases, and the flow resistance of heavy oil increases, which reduces the production efficiency. The equation for the state of the relationship between the reservoir pressure and porosity is as follows [33]:
where Cϕ is the pore compression coefficient of sandstone, Pa−1; pi is the initial reservoir pressure, Pa; ϕi is the initial porosity under the initial pressure.
The equation for the state of the relationship between the reservoir pressure and heavy oil density is as follows [34]:
where Cρ is the pore compression coefficient of heavy oil, Pa−1; ρi is the initial density under the initial pressure.
For the reservoir initial pressure, we have the following:
A constant pressure production condition is adopted, then
where pw is the constant pressure in the production well, Pa.
The outer boundary of the reservoir and the heating well are null flow conditions:
3.4. Temperature Dependence for Reservoir Parameters
In this paper, heavy oil, sandstone, and formation water in the Lvda 5-2 North Oilfield of Bohai Sea were taken as experimental samples to test the dielectric property, thermal conductivity property, and rheological property of the reservoir with temperature.
3.4.1. The Change in the Reservoir Dielectric Property with Temperature
The relative permittivity of heavy oil was measured at different temperature points, and the experimental result is shown in Figure 4. The relative permittivity of heavy oil is a constant independent of temperature. Also, the relative permittivity of formation water was measured at different temperature points, and the experimental result is shown in Figure 5.
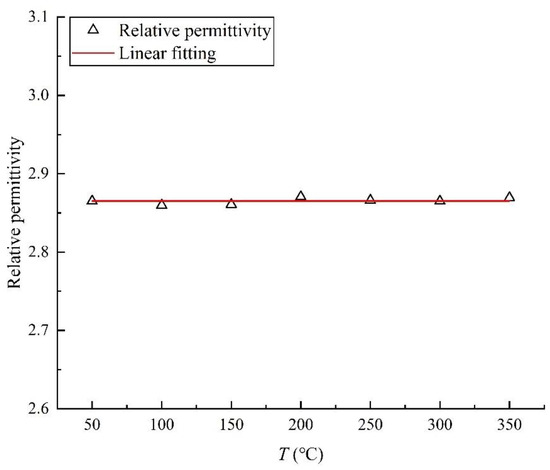
Figure 4.
The change in heavy oil relative permittivity with temperature.
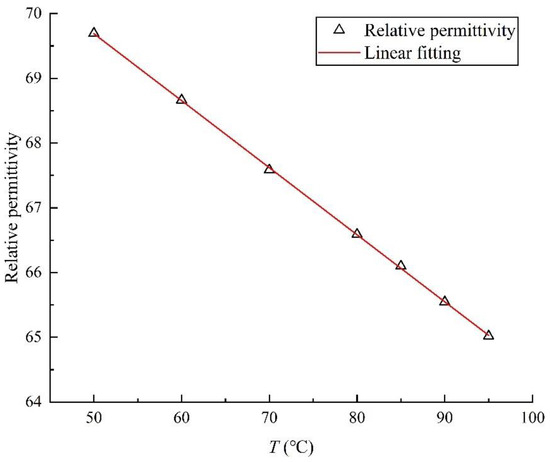
Figure 5.
The change in formation water relative permittivity with temperature.
Fitting the experimental data, the equation of the relative permittivity of formation water with respect to temperature is as follows:
The electrical conductivity of formation water at different temperature points was measured, and the experimental result is shown in Figure 6.
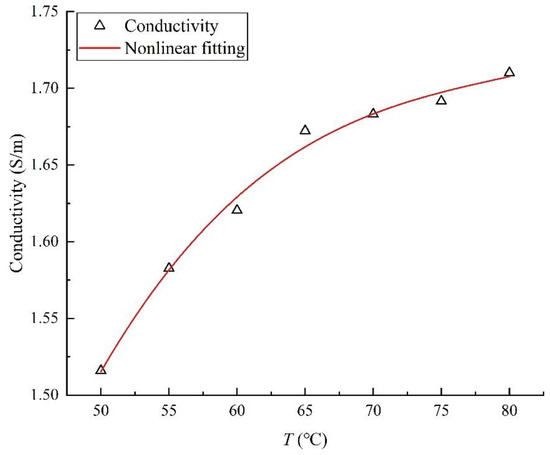
Figure 6.
The change in formation water conductivity with temperature.
Through fitting the experimental data, the equation of the formation water electrical conductivity depending on the temperature is as follows:
The change in the conductivity of heavy oil with temperature was measured, and the experimental result is shown in Figure 7.
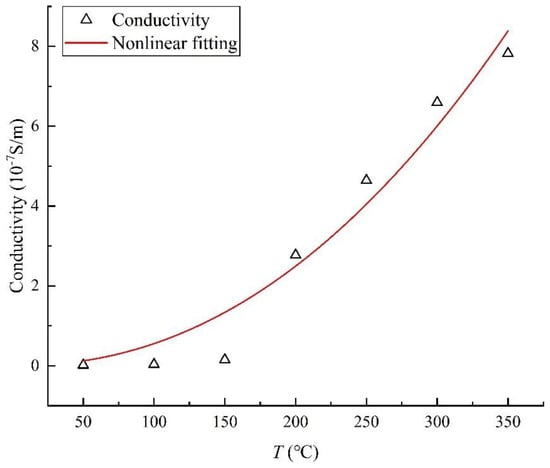
Figure 7.
The change in heavy oil conductivity with temperature.
The experimental data are fitted, and the equation of the heavy oil electrical conductivity in function of temperature is
The conductivity of sandstone was measured as a function of temperature, and the experimental result is shown in Figure 8.
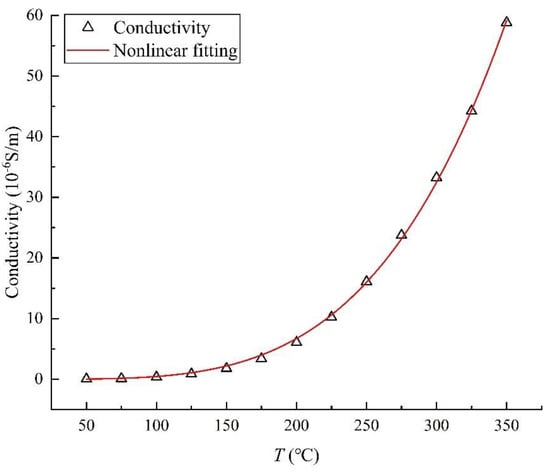
Figure 8.
The change in sandstone conductivity with temperature.
By fitting the experimental data, the equation of the sandstone electrical conductivity as a temperature function is
3.4.2. The Change in the Reservoir Thermal Properties with Temperature
The thermal conductivity of heavy oil as a function of temperature was measured, and the experimental result is shown in Figure 9.
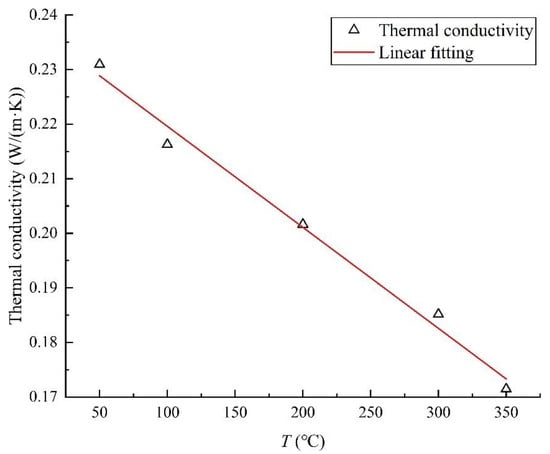
Figure 9.
The change in heavy oil thermal conductivity with temperature.
After fitting the experimental data, the equation of the thermal conductivity of heavy oil with respect to temperature is as follows:
Considering the effect of temperature on the specific heat capacity of water, the equation of the specific heat capacity of water with temperature is as follows [35]:
The equation of the specific heat capacity of heavy oil with respect to temperature is as follows [35]:
The equation of the specific heat capacity of sandstone with temperature as a temperature function is as follows [35]:
3.4.3. The Change in the Reservoir Rheological Property with Temperature
The viscosity of heavy oil was measured at different temperature points, and the experimental result is shown in Figure 10.
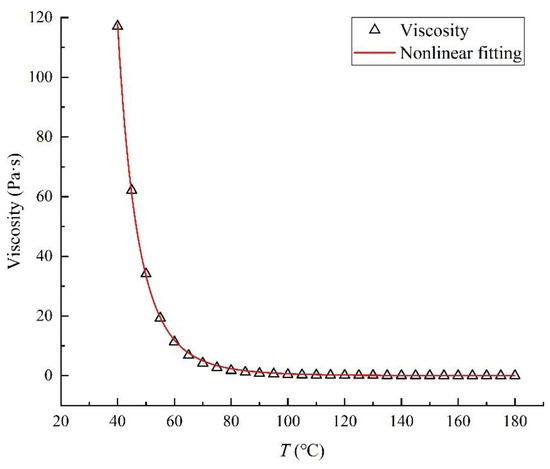
Figure 10.
The change in heavy oil viscosity with temperature.
By fitting the experimental data, the equation of the viscosity of heavy oil with respect to temperature is as follows:
Heavy oil expands when heated, and its density changes. Based on field heavy oil experimental data, Zhang performed curve fitting to obtain the equation of heavy oil density and temperature as follows [36]:
By substituting Equation (40) into Equation (27), the equation of heavy oil density with temperature and reservoir pressure is as follows:
4. Numerical Simulation Method
Based on the established mathematical model, the numerical model of SGAD-like horizontal-well EMTR of the heavy oil reservoir considering the threshold pressure gradient of non-Darcy heavy oil flow is established via the finite-element numerical simulation software COMSOL. The model applies an electromagnetic wave-radio module, Darcy’s law module, and porous medium heat transfer module. Since the threshold pressure gradient is considered in the mathematical model and belongs to non-Darcy flow, the Darcy’s law module of COMSOL cannot be directly applied. The Darcy motion equation considering the influence of gravity is provided in the Darcy’s Law module as follows:
where gx is the horizontal acceleration of gravity, m/s2; gy is the vertical acceleration of gravity, m/s2.
In order to realize the simulation of non-Darcy seepage flow behavior by using Darcy’s law module, the acceleration of gravity in Equation (42) is written as a piecewise function in the following form through the external interface of the acceleration of gravity of Darcy’s law module in COMSOL [21]:
It can be seen with ease that by substituting Equation (43) into Equation (42), a non-Darcy seepage velocity equation the same as Equation (23) can be formed by using Darcy’s law module.
The specific flow chart of a multiphysics field coupled to a numerical simulation method is shown in Figure 11. Among them, Equation (11) for the electromagnetic wave-radio module is used to mathematically describe the heat source of Equation (12) for the porous medium heat transfer module, and Equation (23) of Darcy’s law module is just the convection velocity of Equation (12) of porous medium in the heat transfer module. Meanwhile, the temperature field of porous medium in the heat transfer module will affect the dielectric constant, reservoir thermal parameters, and fluid rheological properties as shown in Equations (31)–(41). The coupled nonlinear partial differential equations are numerically solved with the implicit finite-element method through the software COMSOL. And the nonlinear discretization equations are solved via the Newton iteration method.
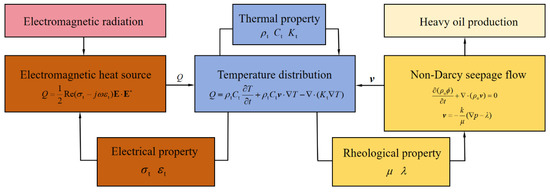
Figure 11.
Flow chart a of multiphysics field coupled to a numerical simulation method.
5. Case Study
5.1. Characteristics of the Heavy Oil Reservoir
Based on actual data from the above-mentioned Lvda 5-2 North Oilfield of Bohai Sea, parameters of the reservoir, overlying and undercover sandstone, and electromagnetic heating in the numerical model are set. Although the reservoir is heterogenous in reality, the relevant quantitative information is not available; a homogenous reservoir is assumed just for a numerical simulation case study here. The physical parameters of the reservoir and electromagnetic heating parameters are shown in Table 1. The physical parameters of overlying and undercover sandstone are shown in Table 2. The conductivity, viscosity of heavy oil, density of heavy oil, and thermal conductivity of heavy oil affected by temperature were input into the model according to the fitting function of the corresponding experimental data. The process of SAGD-like EMTR of heavy oil is simulated via the numerical method. During the recovery process, the production well and the heating well work simultaneously. The heating horizontal well located in the center of the reservoir is only for the purpose of electromagnetic heating without oil production. The production well is located 5 m vertically below the heating well and is produced at constant pressure. The time of electromagnetic heat recovery of heavy oil is set as 2000 days to study the influence of electromagnetic heating on reservoir flow denaturation and conduct sensitivity analysis on the influencing factors for heavy oil daily production. The daily production of heavy oil is obtained by integrating the heavy oil flow rate along the producing wellbore surface.

Table 1.
Physical parameters of the reservoir and electromagnetic heating parameters.

Table 2.
Physical parameters of overlying and undercover sandstone.
5.2. Convergence and Stability Test of Numerical Simulation
In order to improve the calculation accuracy, the mesh near the wellbore is encrypted and refined. Among them, the largest unit size is 2.4 m; the minimum unit size is 0.009 m; the maximum unit growth rate is 1.2; the curvature factor is 0.25; the narrow area resolution is 1. The complete grid contains 4028 vertices, 7840 domain units, and 320 boundary units, and the model grid division diagram is shown in Figure 12.
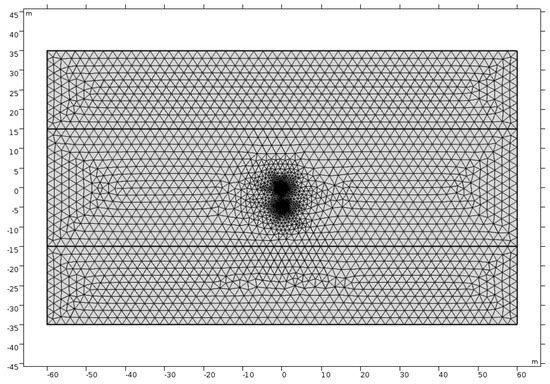
Figure 12.
Grid division diagram of heavy oil electromagnetic thermal production numerical simulation in SAGD-like mode.
By implementing the given numerical setting and grid generation scheme, the electromagnetic thermal production of heavy oil in the SAGD-like model is numerically simulated. The convergence diagram is shown in Figure 13. According to the convergence diagram, the model solution converges quickly and smoothly based on the provided numerical settings and mesh generation.
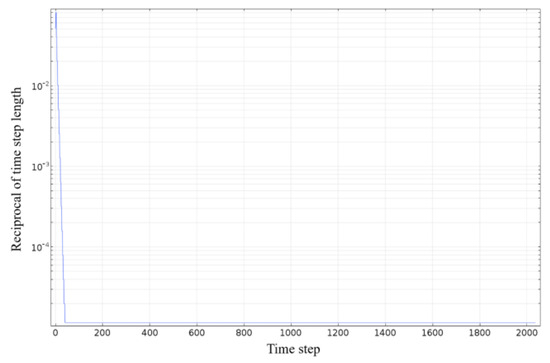
Figure 13.
Convergence diagram of numerical simulation of electromagnetic thermal production of heavy oil in SAGD-like model.
In addition, space grid independence is tested to determine the choice of space grid generation scheme. Four different space grid generation schemes are designed, as shown in Table 3. The comparison of heavy oil daily production among numerical simulation scenarios with different space grid densities is as shown in Figure 14. It can be seen from Figure 14 that space grid density has little effect on the numerical solution result of heavy oil daily production. In order to balance the computation speed and solution accuracy, grid 2# is selected for the numerical solution. In order to verify the independence of the numerical model with respect to the time step, the time step is changed. And the time step is set to 0.1 d, 0.5 d, and 1.0 d, respectively, and the heavy oil daily production is obtained as shown in Figure 15. The variation curves of heavy oil daily production with time corresponding to different time steps for the numerical simulation completely coincide. Therefore, the numerical solution of the model is independent of the density of time step. In conclusion, the setting of the space grid and time step has little effect on the model numerical solution, which demonstrates the good numerical stability due to the implicit numerical scheme of the finite-element method.

Table 3.
Grid information for the space grid independence test.
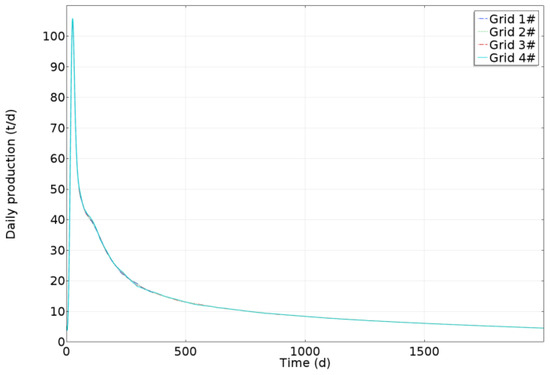
Figure 14.
The comparison of heavy oil daily production between different mesh generation scenarios for the space grid independence test.
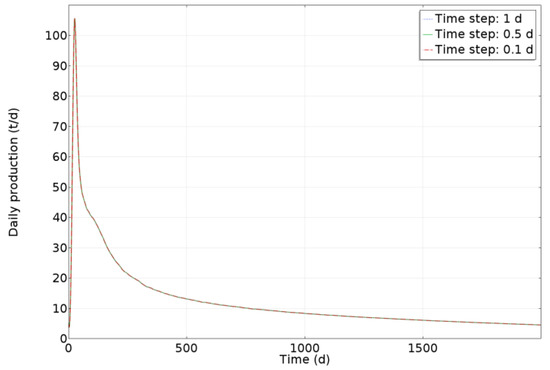
Figure 15.
Daily production of heavy oil at different time steps.
5.3. Analysis of Numerical Simulation Results
5.3.1. Impact of Overlying and Undercover Sandstone
In order to study the influence of the heat dissipation of the overlying and undercover sandstone on reservoir temperature distribution and heavy oil production, the heat dissipation condition of the overlying and undercover sandstone is compared with that of the upper and lower boundary adiabatic condition and reservoir temperature distribution and cumulative heavy oil production. The reservoir temperature distribution after 2000 days of electromagnetic heating under heat dissipation and adiabatic conditions is shown in Figure 16. The maximum temperature under adiabatic condition is higher than that under the heat dissipation condition, and the heating range under the adiabatic condition is larger. The cumulative production of heavy oil under the heat dissipation and adiabatic conditions is shown in Figure 17. The cumulative production of heavy oil under heat dissipation conditions is smaller than that under adiabatic conditions, and the difference is larger as time goes on. After 2000 days of production, the cumulative production of heavy oil under adiabatic condition is 40,268.6 tons, and that under the heat dissipation condition is 34,126.3 tons. Therefore, it is necessary to consider the heat dissipation of overlying and undercover sandstone in the simulation.
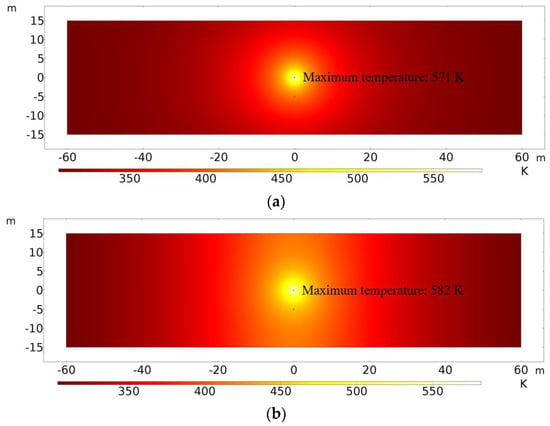
Figure 16.
Reservoir temperature distribution after 2000 days of electromagnetic heating under heat dissipation and adiabatic conditions. (a) Heat dissipation condition; (b) adiabatic condition.
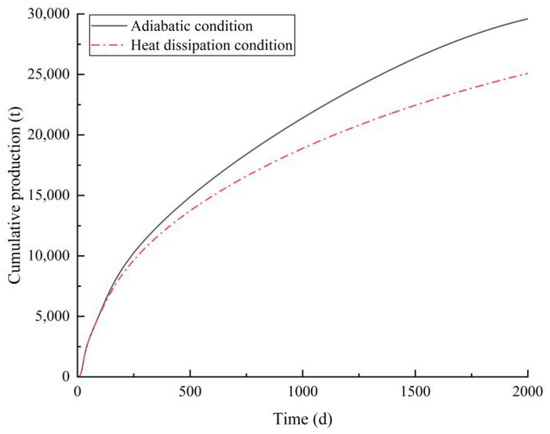
Figure 17.
Comparison of cumulative heavy oil production under heat dissipation and adiabatic conditions.
5.3.2. Influence of Electromagnetic Heating on Rheological Properties of Heavy Oil
The temperature distribution of the heavy oil reservoirs after 50 days, 500 days, 1000 days, and 2000 days of continuous exploitation via electromagnetic heating is shown in Figure 18. After 2000 days of heating, the heat energy generated via the electromagnetic heater is highly concentrated near the horizontal well. The variation in the temperature distribution along the radial direction of the heating well with time is shown in Figure 19. After 2000 days of operation of the electromagnetic heater, the maximum temperature of the reservoir reaches 571 K, which is very beneficial to production. For reservoirs more than 35 m away from the heated wellbore, the temperature can be slightly increased by about 10 K, from 303.15 K to 313.15 K. Extending the heating time is more effective for expanding the heating range. With the increase in heating time, the temperature rise rate slows down, and extending the heating time has little effect on expanding the heating range.
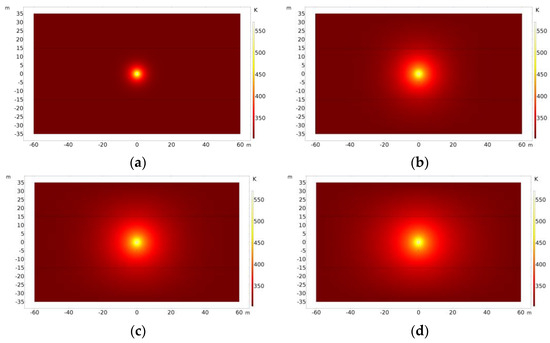
Figure 18.
Temperature distribution of reservoirs under different heating times. (a) t = 50 d; (b) t = 500 d; (c) t = 1000 d; (d) t = 2000 d.
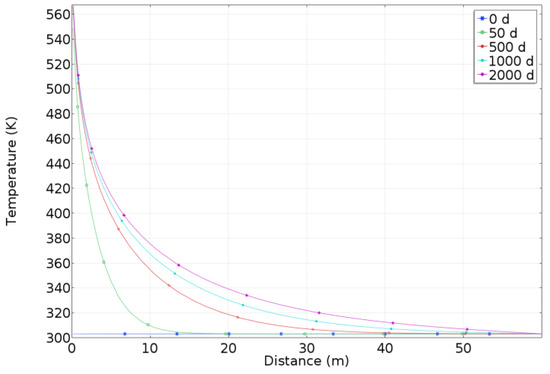
Figure 19.
Radial distribution of temperature along the heated wellbore.
The viscosity distribution of heavy oil in storage changes with the time of electromagnetic thermal production, as shown in Figure 20a. As can be seen from Figure 20a, the viscosity of heavy oil is sensitive to temperature, and after electromagnetic heating, the fluid viscosity almost in the entire reservoir decreases. When the heating time reaches 1000 days, the viscosity of heavy oil fluid within a 30 m radial distance of the heated wellbore is greatly reduced, and the fluidity of heavy oil fluid within this range is greatly improved.
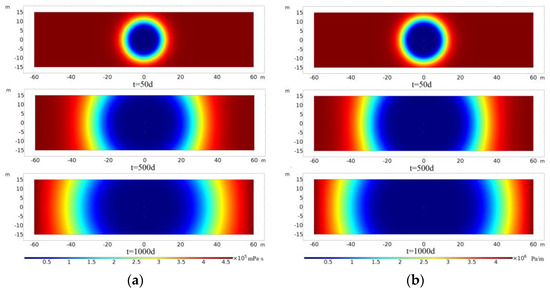
Figure 20.
Distribution of oil viscosity and horizontal threshold pressure gradient of reservoir at different times. (a) Viscosity distribution of heavy oil; (b) distribution of reservoir pressure gradient value.
Due to the different reservoir vertical and horizontal permeabilities, the value of the threshold pressure gradient is slightly different, but the property of the threshold pressure gradient is the same. Figure 20b shows that the distribution of the horizontal threshold pressure gradient changes with the time of EMTR. It can be seen from Figure 20b that when the reservoir temperature rises, the value of the threshold pressure gradient decreases. In the vicinity of the wellbore, the threshold pressure gradient is greatly reduced, and the flow capacity of heavy oil fluid is improved to a large extent, and the flow of heavy oil fluid can be approximated to Darcy flow. With the increase in heating time, the threshold pressure gradient in a larger area is significantly reduced, and a larger area of the reservoir is disturbed (or utilized) as fluid flow overcomes the smaller threshold pressure gradient. In summary, electromagnetic heating improves fluid flow of heavy oil.
Figure 21 shows the reservoir pressure distribution and heavy oil fluid velocity distribution after 30, 300, and 1000 days of continuous production. The presence of the threshold pressure gradient will lead to the existence of moving boundaries during production. The motion boundary can be clearly identified in Figure 21b. The area within the dynamic boundary belongs to the effective utilization range of the reservoir, and the heavy oil flow occurs in this area. For the area outside the dynamic boundary, the fluid flow velocity is equal to zero, and this area of the reservoir is not effectively utilized. Comparing the pressure distribution and flow velocity distribution in the production process of the heavy oil reservoir, it can be seen that in the initial stage of production, the dynamic boundary moves faster, and the reservoir utilization range expands significantly.
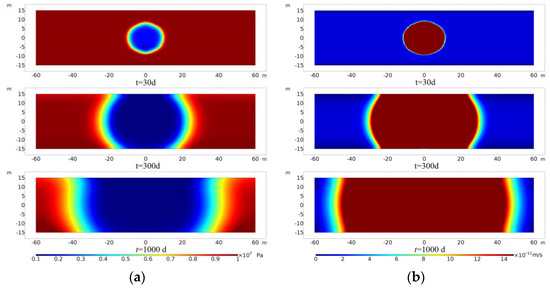
Figure 21.
Distribution of reservoir pressure and heavy oil seepage flow velocity at different time. (a) Pressure distribution of reservoir; (b) distribution of heavy oil seepage flow velocity.
5.3.3. Sensitivity Analysis of Heavy Oil Production
Here, the influences of the threshold pressure gradient, well spacing, assembly heating well location, electromagnetic heating power, electromagnetic heating frequency, and reservoir water saturation on heavy oil production are analyzed.
The effect of the threshold pressure gradient on heavy oil production is illustrated by comparing the daily production of heavy oil under Darcy and non-Darcy flow. The daily production of heavy oil under Darcy and non-Darcy flow is shown in Figure 22. The maximum daily production of heavy oil in Darcy flow is 152 tons, which is higher than the maximum daily production of 106 tons in non-Darcy flow, indicating that the existence of the threshold pressure gradient has an obstructing effect on the flow of heavy oil in the reservoir, and ignoring the threshold pressure gradient will have a great impact on the daily production of heavy oil. After hundreds of days, the daily production of Darcy flow becomes lower than that of non-Darcy flow. This can be attributed to the fact that the effect of electromagnetic heating on improving the mobility of heavy oil is very significant at the later stage of the non-Darcy flow. The cumulative production of heavy oil in Darcy and non-Darcy flow is shown in Figure 23. The cumulative production of heavy oil in Darcy flow rose rapidly in the initial stage of production, but with the increase in production time, reservoir pressure decreased, the heavy oil flow rate slowed down, and the cumulative production tended to be flat. After 2000 days of production, the cumulative Darcy flow was 31,344 tons, and the non-Darcy flow was 25,083 tons, indicating that a larger reservoir was deployed without regard to the threshold pressure gradient. The comparison of pressure distribution in Darcy and non-Darcy flow reservoirs over time is shown in Figure 24. Without considering the threshold pressure gradient, the entire reservoir is deployed, and reservoir pressure drops rapidly. In summary, considering the threshold pressure gradient has a great impact on the calculation accuracy of production, so it is necessary to consider the threshold pressure gradient.
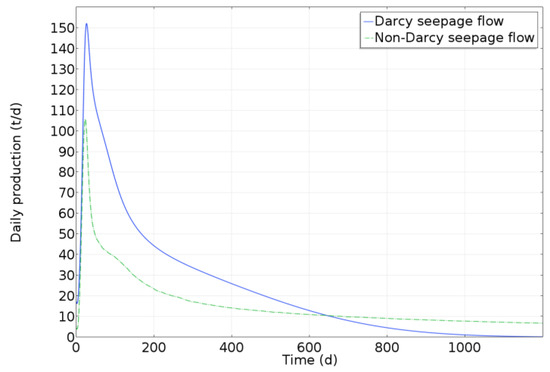
Figure 22.
Comparison of heavy oil daily production between Darcy and non-Darcy flow.
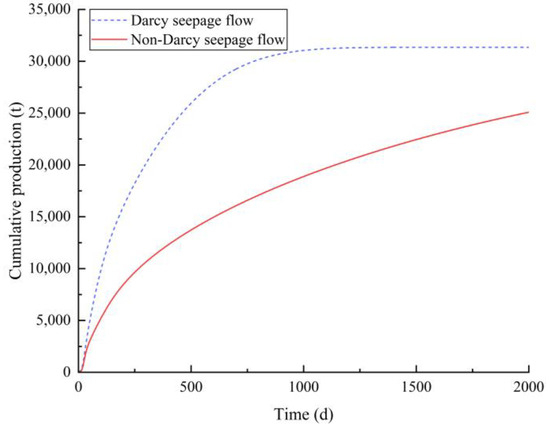
Figure 23.
Comparison of heavy oil cumulative production of Darcy and non-Darcy flow.
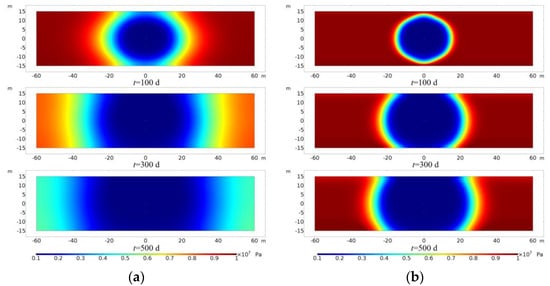
Figure 24.
Comparison of reservoir pressure distribution between Darcy and non-Darcy flow. (a) Darcy flow; (b) non-Darcy flow.
The production well is moved vertically to change the spacing between the heating well and the production well, and the heavy oil daily production is compared and analyzed under different well spacings of 10 m, 8 m, 5 m, and 2 m. Since there was little difference in daily production between different well spacings after 300 days of production, the daily production of the first 300 days of production was selected for comparison in order to facilitate observation. The comparison of heavy oil daily production under different well spacings is shown in Figure 25. The smaller the well spacing, the faster the daily production of heavy oil in the early stage of production, the shorter the time to reach the maximum daily production, and the higher the maximum production. This is because, in the case of smaller well spacing, the temperature near the production well rises faster, and the heavy oil fluidity near the production well is improved faster.
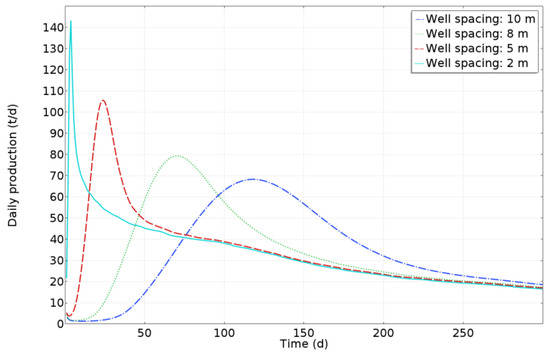
Figure 25.
Comparison of heavy oil daily production at different well spacings.
The distribution of reservoir pressure when heavy oil reaches the maximum daily production under different well spacings is shown in Figure 26. When the daily production of heavy oil reaches the maximum, the pressure near the producing well is significantly lower than that in other areas, and the heavy oil flow rate reaches the maximum under the action of a pressure gradient. The cumulative production of heavy oil under different well spacings is shown in Figure 27. In the initial stage of production, the cumulative production of those with smaller well spacing increased rapidly. With the increase in production time, the cumulative daily production of those with larger well spacing exceeded that of those with smaller well spacing. The corresponding cumulative daily production under different well spacings was 23,844 tons (2 m), 25,083 tons (5 m), 25,189 tons (8 m), and 25,242 tons (10 m). When the well spacing is larger, the production well location is lower, and a wider range of heavy oil in the reservoir above the production well is affected by gravity drainage, so the cumulative production is higher; however, the effect of the increase in well spacing on the production is reduced.
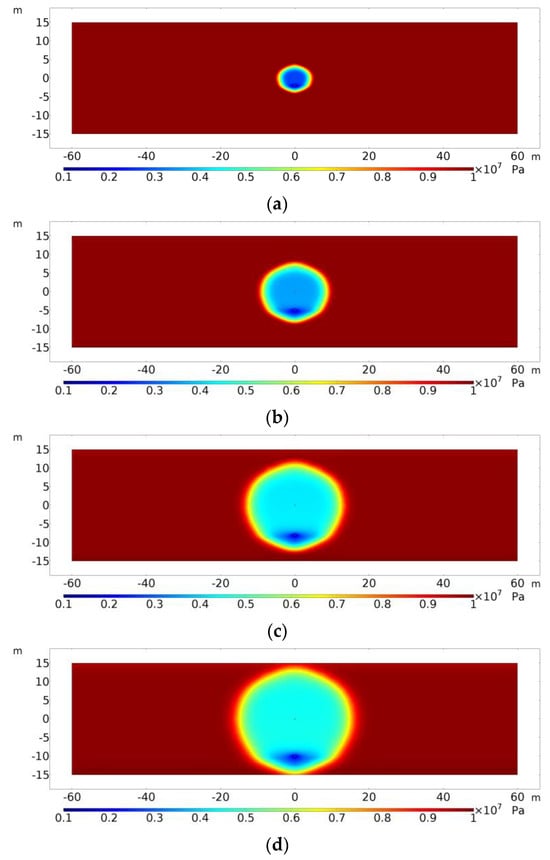
Figure 26.
Reservoir pressure distribution when heavy oil reaches maximum daily production at different well spacings. (a) 2 m (t = 4 d); (b) 5 m (t = 24 d); (c) 8 m (t = 73 d); (d) 10 m (t = 120 d).
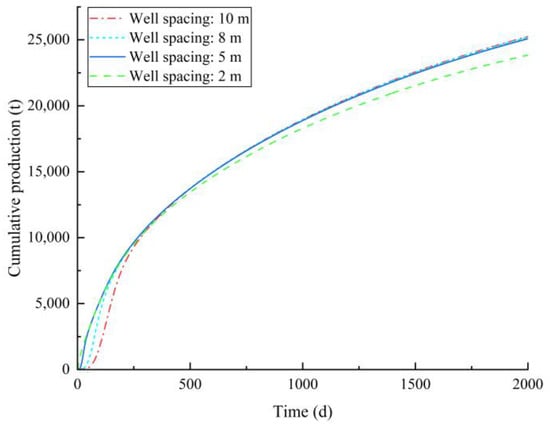
Figure 27.
Comparison of heavy oil cumulative production at different well spacing.
Keeping the spacing of the production well and heating well unchanged, we move the position of the heating well and production well in the vertical direction; and then, we analyzed and compared the heavy oil daily production of the production well corresponding to four different locations: the distance of the heating well from the x-axis (as shown in Figure 3) is set as +10 m, +5 m, 0 m, and −5 m, respectively. Obviously, if the location of the heating well is fixed, the location of the assembly of the heating well and producing well is fixed. Since there was little difference in daily production after 1000 days among the four locations, daily production in the first 1000 days of production was selected to make a distribution comparison chart for convenience of observation. The comparison of heavy oil daily production under different heating well locations is shown in Figure 28. When the heating well is located at +5 m and −5 m, the time required to reach the maximum daily production is the same as that at the center, and the daily production curves of the two are similar. However, when the heating well is located at −5 m, the daily production of heavy oil is slightly higher than that at +5 m. When the heating well is located at +10 m, the maximum daily production of heavy oil is lower than other locations. When the heating well is located at 0 m, the daily production of heavy oil before 200 days is the highest. This can be attributed to the reason that when the heating well is located at 0 m, i.e., at the center of the reservoir, the heat loss from the overlying and undercover sandstone is the least, and then the reservoir heating efficiency is the best. The cumulative production of heavy oil under different heating well locations is shown in Figure 29. When the heating well is located in the center of the reservoir, the cumulative production of heavy oil is the highest. This is because when the heating well is located in the center of the reservoir, the electromagnetic wave will dissipate the most energy through the reservoir. When the heating well moves up and down, the influence of the overlying and undercover sandstone on the heat loss will expand. Therefore, in this context, placing the heating well in the center of the reservoir is the most conducive to heavy oil production. It can also be seen from Figure 28 that the production of the heating well at −5 m is higher than that at +5 m. Take 500 days of production as an example, and the pressure distribution at these two places is shown in Figure 30. The upper part of the reservoir at +5 m has a larger pressure reduction range, while the lower part of the reservoir has a larger pressure reduction range. Due to the existence of gravity drainage, heavy oil in the lower part of the reservoir is more likely to flow out, so the heavy oil production at −5 m is higher than that at +5 m.
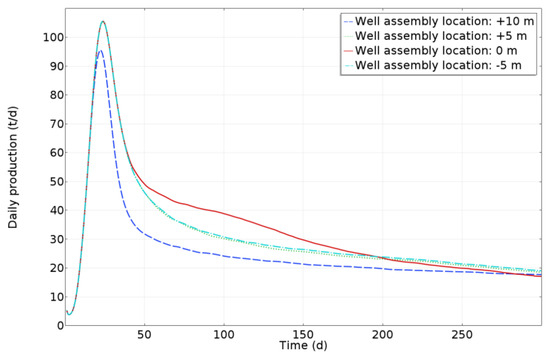
Figure 28.
Comparison of heavy oil daily production at different heating and producing well assembly locations.
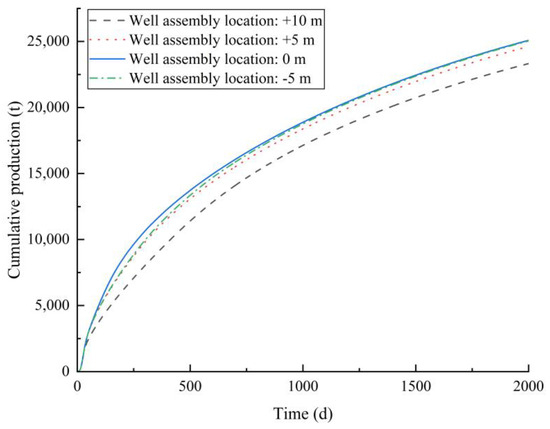
Figure 29.
Comparison of heavy oil cumulative production at different heating and producing well assembly locations.
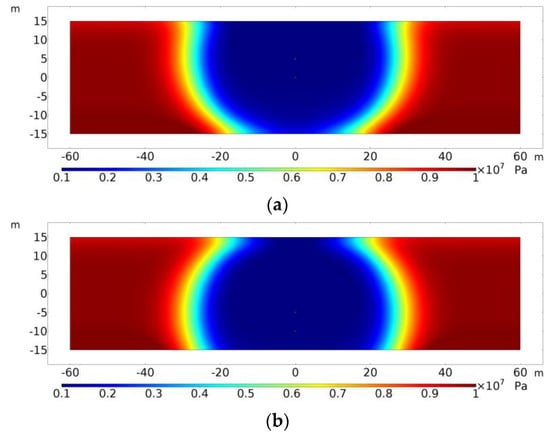
Figure 30.
Comparison of reservoir pressure distribution at different heating and producing well assembly locations. (a) Distance of heating well from x-axis: +5 m; (b) distance of heating well from x-axis: −5 m.
By changing the electromagnetic heating power, the heavy oil production under different power levels was compared and analyzed. Since the daily production of heavy oil under different power levels after 300 days of production is small, the daily production of heavy oil in the first 300 days of production is selected to make a distribution comparison chart for convenience of observation. Figure 31 shows the temperature distribution of the reservoir after 2000 days of electromagnetic heating under different power levels. The higher the power, the higher the reservoir temperature. The comparison of heavy oil daily production under different power levels is shown in Figure 32. The higher the power, the faster the daily production of heavy oil in the early stage of production, and the higher the maximum daily production of heavy oil. The cumulative production of heavy oil under different power levels is shown in Figure 33. The cumulative heavy oil production after 2000 days of production at different power levels is 23,847 tons (500 kW), 25,083 tons (1000 kW), 26,005 tons (2000 kW), and 26,267 tons (2500 kW), respectively. The greater the power, the higher the cumulative production of heavy oil. This is because the greater the power, the higher the reservoir temperature, the greater the reduction in the heavy oil viscosity and threshold pressure gradient, and the greater the improvement in the heavy oil fluidity, which is conducive to the production of heavy oil. Moreover, as the power value increases, its positive effect on the cumulative heavy oil production becomes less sensitive.
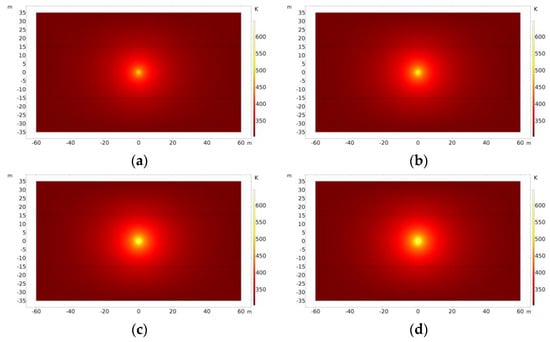
Figure 31.
Reservoir temperature distribution after 2000 days of electromagnetic heating at different power levels. (a) Maximum temperature: 516 K (P = 500 kW); (b) maximum temperature: 571 K (P = 1000 kW); (c) maximum temperature: 628 K (P = 2000 kW); (d) maximum temperature: 647 K (P = 2500 kW).
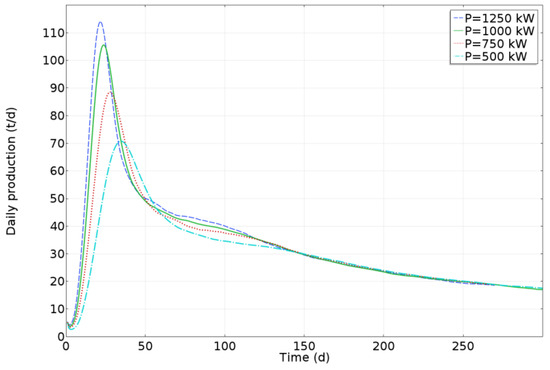
Figure 32.
Comparison of heavy oil daily production at different power levels.
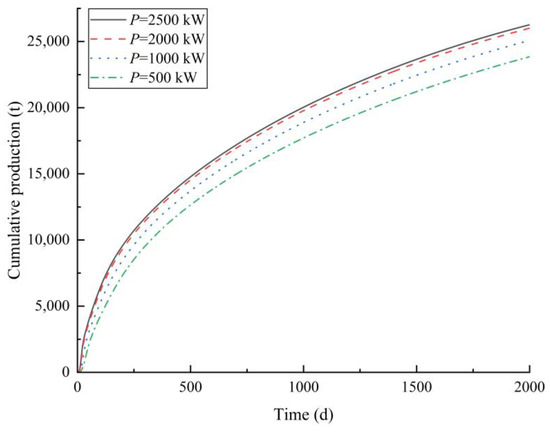
Figure 33.
Comparison of heavy oil cumulative production at different power levels.
The production of heavy oil under different electromagnetic heating frequencies was compared and analyzed. After 300 days of production, the daily production of heavy oil at different frequencies has a small difference. In order to facilitate observation, the daily production of heavy oil in the first 300 days of production is selected for distribution comparison. The comparison of heavy oil daily production at different frequencies is shown in Figure 34. The maximum daily production of heavy oil first increases and then decreases with the increase in frequency, and the influence of frequency on the daily production of heavy oil is weakened with the increase in frequency. The cumulative production of heavy oil at different frequencies is shown in Figure 35. The cumulative production of heavy oil after 2000 days of production at different frequencies is 27,089 tons (6.8 × 10⁴ Hz), 29,210 tons (6.8 × 10⁵ Hz), 25,083 tons (6.8 × 10⁶ Hz), and 24,606 tons (6.8 × 10⁸ Hz), respectively. The transient cumulative production of heavy oil produced for 2000 days shows a trend of first rising and then decreasing with the increase in frequency. This is because, with the increase in frequency, the penetration ability of the electromagnetic wave becomes weaker, more energy is dissipated in the reservoir, and the reservoir temperature rises faster. At the same time, the heating ability of the electromagnetic wave to the far distance of the heating well is weakened. The increase in frequency has a weaker effect on the rise in reservoir temperature than the decrease in the distant heating effect of the reservoir, resulting in a decrease in the effective utilization range of the entire reservoir and a decrease in production, indicating that there is a frequency range of electromagnetic heating that is most conducive to reservoir exploitation for a specific reservoir.
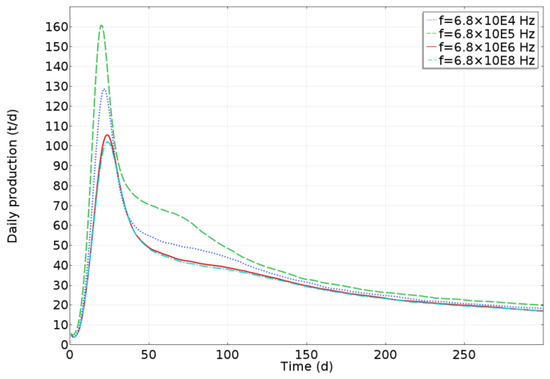
Figure 34.
Comparison of heavy oil daily production at different frequencies.
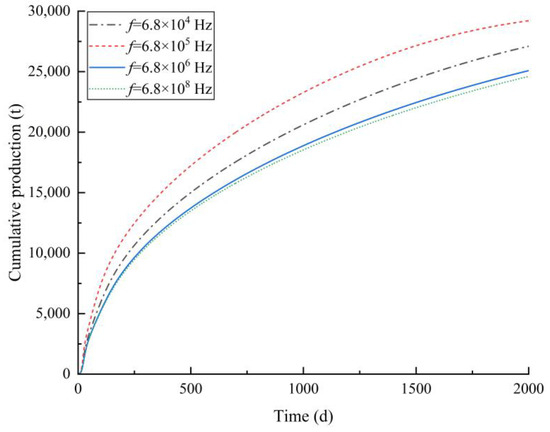
Figure 35.
Comparison of heavy oil cumulative production at different frequencies.
The influence of reservoir water saturation on heavy oil production was studied by changing the water saturation in the numerical model. The temperature distribution of reservoirs under different degrees of water saturation is shown in Figure 36. The higher the degree of reservoir water saturation, the slower the rise in heavy oil daily production and the lower the maximum daily production of heavy oil. The reservoir pressure distribution when heavy oil reaches the maximum daily production at different degrees of water saturation is shown in Figure 37. The comparison of heavy oil daily production under different degrees of water saturation is shown in Figure 38. Oil production initially decreases and then begins to increase. This can be attributed to the reason that initially, the heavy oil production has not been affected by the electromagnetic heating; due to too poor flow ability of the unheated heavy oil, the production decreases initially; and the heavy oil production begins to increase as it is affected by the electromagnetic heating after some time. The cumulative production of heavy oil under different degrees of water saturation is shown in Figure 39. The higher the degree of reservoir water saturation, the lower the cumulative heavy oil production, which is due to the larger specific heat capacity of water. When the degree of water saturation is higher, the lower the reservoir temperature, the lower the reduction range of heavy oil viscosity, and the higher the threshold pressure gradient under the same heating condition, so the improvement of heavy oil rheology is small and the heavy oil production is low.
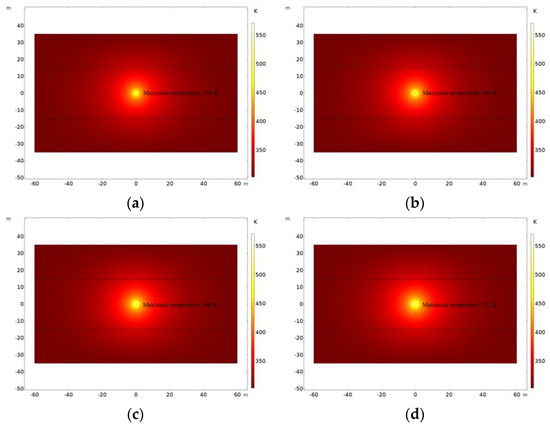
Figure 36.
Temperature distribution of reservoirs under different degrees of water saturation. (a) Sw = 0.4; (b) Sw = 0.37; (c) Sw = 0.33; (d) Sw = 0.3.
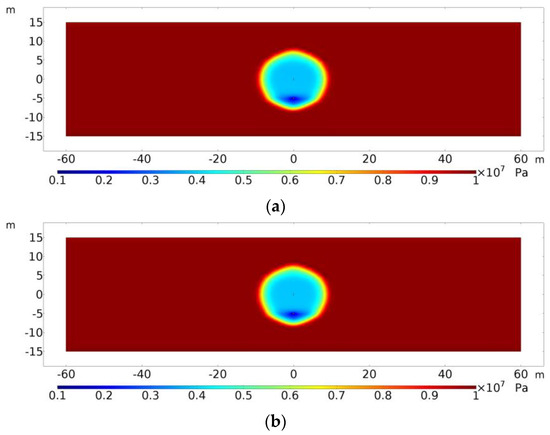
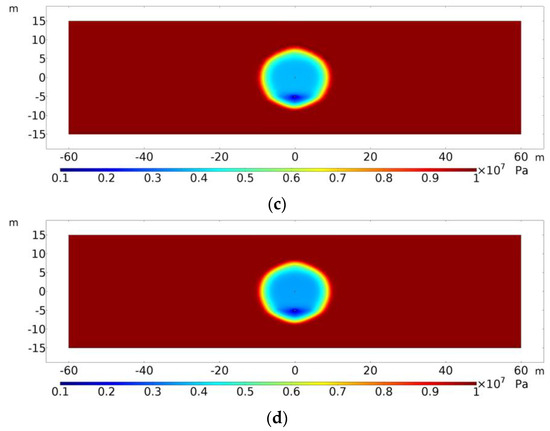
Figure 37.
Reservoir pressure distribution when heavy oil reaches maximum daily production at different degrees of water saturation. (a) Sw = 0.4 (t = 31 d); (b) Sw = 0.37 (t = 29 d); (c) Sw = 0.33 (t = 26 d); (d) Sw = 0.3 (t = 24 d).
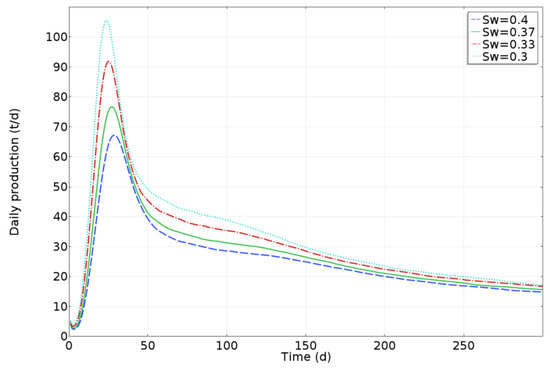
Figure 38.
Comparison of heavy oil daily production at different degrees of water saturation.
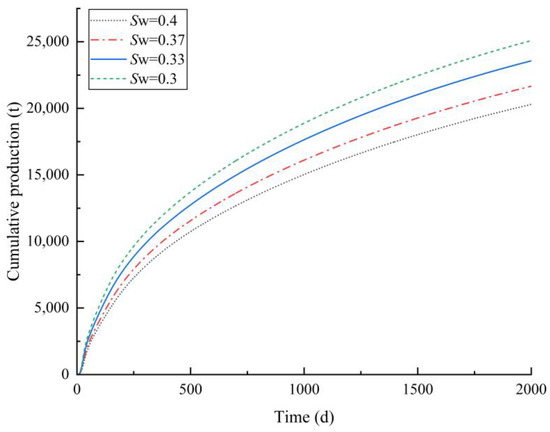
Figure 39.
Comparison of heavy oil cumulative production at different degrees of water saturation.
6. Conclusions
This study uses waterless EMTR of heavy oil as an actual engineering application background, focusing on the Lvda 5-2 North Oilfield of Bohai Sea. It comprehensively considers the mutual coupling of electromagnetic, temperature, and seepage flow fields, the non-Darcy flow characteristics of heavy oil, and the impact of the temperature field on the rheological properties of Bingham plastic non-Newtonian heavy oil and the dielectric properties of the reservoir. Additionally, it takes into account the anisotropy of permeability in heavy oil reservoirs, heat dissipation from overlying and undercover sandstone, and the effects of gravity drainage. A physical model of a SAGD-like horizontal-well EMTR for heavy oil reservoirs is established, with the vertical two-dimensional cross-section of this physical model selected as the subject of study. Finite-element methods are employed using COMSOL software to perform numerical simulations of the multiphysics field.
The model couples the electromagnetic field, temperature field, and seepage flow field and introduces the threshold pressure gradient into the Darcy’s law module of the numerical model by modifying the gravitational acceleration vector in Darcy’s law. Based on the numerical simulation results, the impact of heat dissipation from the overlying and undercover sandstone was analyzed, as was the effect of electromagnetic heating on the rheological properties of heavy oil. The necessity of considering the threshold pressure gradient in the study of heavy oil production was also highlighted. This study shows that, without accounting for heat dissipation from overlying and undercover sandstone, the cumulative heavy oil production is overestimated compared to actual production, underscoring the importance of considering heat dissipation from these layers. Electromagnetic heating plays a significant role in reducing the viscosity and threshold pressure gradient of heavy oil, improving its mobility and enhancing the productivity of the heavy oil reservoir. Additionally, by comparing the production of heavy oil under Darcy and non-Darcy flow conditions, it was found that the threshold pressure gradient has a considerable impact on the accuracy of production predictions, thus emphasizing the necessity of considering the threshold pressure gradient.
The sensitivity of heavy oil production to changes in the distance between the production well and the heating well, the position of the heating well, and the power and frequency of electromagnetic heating were investigated, along with the differences in production between heavy oil reservoirs with varying degrees of water saturation. The results indicate the following:
- When the production well is located below the heating well, the greater the well spacing, the higher the cumulative heavy oil production. This is due to the effect of gravity drainage; when the production well is positioned lower, gravity plays a more significant role in aiding heavy oil production. The difference in heavy oil production between different well spacings is within 5%, indicating that well spacing is not the most critical factor affecting heavy oil production for the well spacing range from 2 m to 10 m;
- When the well spacing remains constant, heavy oil production is higher when the heating well is located at the center of the reservoir compared to other positions. This is because when the heating well is centered in the reservoir, the electromagnetic waves dissipate the most energy as they pass through the reservoir, resulting in more uniform heating. In contrast, when the heating well is moved vertically, the presence of overlying and undercover sandstone leads to greater heat loss;
- Increasing the power of electromagnetic heating has a significant effect on enhancing heavy oil production. Higher power leads to higher reservoir temperatures, which in turn results in a greater decrease in heavy oil viscosity and the threshold pressure gradient, thus improving the mobility of heavy oil. However, as the power value increases, its positive effect on the cumulative heavy oil production becomes less sensitive. Therefore, to determine the optimal power range for actual reservoir production, economic and production factors must be considered comprehensively;
- As the frequency of electromagnetic heating increases, heavy oil production initially rises and then declines. Additionally, the impact of frequency on heavy oil production diminishes with increasing frequency. Therefore, based on the changes in heavy oil production at different frequencies, the optimal frequency range can be determined;
- The higher the water saturation of the reservoir, the lower the heavy oil production. This is because water has a higher specific heat capacity than oil. When the reservoir has a higher water saturation, under the same heating conditions, the reservoir temperature is lower, resulting in less improvement in the rheological properties of heavy oil and consequently leading to lower heavy oil production. In addition, it can be known from Equation (22), the effect of initial water saturation change on the volume of oil in the reservoir is not considered in our model. Therefore, the small water saturation will have a more positive effect on the oil production.
Author Contributions
Conceptualization, W.L., J.Y. and Y.Y.; methodology, W.L. and J.Y.; software, M.S.; validation, M.S.; formal analysis, J.Y., Y.Y., W.L. and M.S.; investigation, J.Y., W.L., Y.Y., Y.C. and M.S.; data curation, Y.Y. and J.Y.; writing—original draft preparation, W.L., M.S. and Z.M.; writing—review and editing, W.L., M.S. and Z.M.; visualization, M.S. and Z.M.; supervision, W.L.; project administration, J.Y., Y.Y. and Y.C.; funding acquisition, W.L. All authors have read and agreed to the published version of the manuscript.
Funding
This research was funded by the State Key Lab of the Offshore Oil and Gas Exploitation in China, grant number CCL2023RCPS0166RQN.
Data Availability Statement
The raw data supporting the conclusions of this article will be made available by the authors on request. The data are not publicly available due to the policy of the State Key Lab of the Offshore Oil and Gas Exploitation in China.
Conflicts of Interest
The authors declare no conflicts of interest.
References
- Gomaa, S.; Salem, K.G.; El-hoshoudy, A.N. Enhanced heavy and extra heavy oil recovery: Current status and new trends. Petroleum 2024, 10, 399–410. [Google Scholar] [CrossRef]
- Li, H.; Wang, Q.; Wu, Y. Current status and development direction of Low-Carbon exploitation technology for heavy oil. Energies 2023, 16, 2219. [Google Scholar] [CrossRef]
- Zhu, J.; Shi, C.; Dong, C.; Hu, G.; Wang, T.; Yao, Y. Ultra heavy oil production experience in China. Soc. Pet. Eng. 2024, 23, 192302. [Google Scholar]
- Dou, L.; Zhu, Y.; Yang, T.; Xu, S.; Ping, X. Origins of heavy oils in the Erlian Basin\NE China. Mar. Pet. Geol. 1998, 15, 769–781. [Google Scholar] [CrossRef]
- Chen, J.; Zhao, Z.; Deng, C.; Liao, J.; Wang, X.; Wang, P. Formation mechanism of condensates, waxy and heavy oils in the southern margin of Junggar Basin. NW China Sci. China Earth Sci. 2017, 50, 972–991. [Google Scholar] [CrossRef]
- Yu, G.; Lin, T.; Sun, Y.; Sun, Y. Multi-component thermal fluid technology on extra-heavy oil to enhance oil recovery in Bohai Bay of China. Int. Soc. Offshore Polar Eng. 2014, 978, 15–20. [Google Scholar]
- Gomaa, S.; Salem, K.G.; El-hoshoudy, A. Recovery of heavy oil and extra heavy oil; current status, new trends, and enhancement techniques. Petroleum 2023, 10, 15–25. [Google Scholar]
- Zhao, Q.; Guo, L.; Wang, Y.; Jin, H.; Chen, L.; Huang, Z. Enhanced oil recovery and in situ upgrading of heavy oil by supercritical water injection. Energy Fuels 2020, 34, 360–367. [Google Scholar] [CrossRef]
- Upreti, S.R.; Lohi, A.; Kapadia, R.A.; El-Haj, R. Vapor extraction of heavy oil and bitumen: A review. Energy Fuels 2007, 21, 156274. [Google Scholar] [CrossRef]
- He, H.; Li, Q.; Zheng, H.; Liu, P.; Tang, J.; Ma, Y. Simulation and evaluation on enhanced oil recovery for steam huff and puff during the later phase in heavy oil Reservoir-A case study of block G in Liaohe oilfield, China. J. Petrol. Sci. Eng. 2022, 219, 111092. [Google Scholar] [CrossRef]
- Tang, Y.; Ge, Q.; Lun, Z.; Yin, X.; Wu, M.; Ma, T.; Qi, Y.; Zhang, S. EOR Mechanisms and Applications of Thermal Composite Technologiesin Deep Heavy Oil Reserves; Gotech: Dubai, United Arab Emirates, 2024. [Google Scholar]
- Ritchey, H.W. Radiation Heating. U.S. Patent Application No. 2757738, 7 October 1956. [Google Scholar]
- Yao, J.; Liu, W.; Chen, Z. Numerical Solution of a moving boundary problem of one-dimensional flow in semi-infinite long porous media with threshold pressure gradient. Math. Probl. Eng. 2013, 2013, 384246. [Google Scholar] [CrossRef]
- Liu, M.; Zhao, G. A performance comparison study of electromagnetic heating and SAGD process. In Proceedings of the SPE Heavy Oil Conference-Canada, Calgary, AB, Canada, 11–13 June 2013; p. SPE-165547-MS. [Google Scholar]
- COMSOL Multiphysics; C. M. Library: Charlotte, NC, USA, 2016.
- Davletbaev, A.; Kovaleva, L.; Babadagli, T. Heavy oil production by electromagnetic heating in hydraulically fractured wells. Energy Fuels 2014, 28, 5737–5744. [Google Scholar] [CrossRef]
- Khisamov, R.S.; Morozov, P.E.; Khairullin, M.K.; Shamsiev, M.N.; Abdullin, A.I. Simulation of the SAGD process taking into ac-count the threshold pressure gradient. Oil Ind. J. 2018, 8, 48–51. [Google Scholar]
- Wang, Z.; Gao, D.; Fang, J. Numerical simulation of RF heating heavy oil reservoir based on the coupling between electromagnetic and temperature field. Fuel 2018, 220, 14–24. [Google Scholar] [CrossRef]
- Chen, M.; Wang, Z.; Yin, C.; Shan, S. Ultimate drainage radius of cyclic steam stimulation in low-permeability heavy oil reservoirs. J. Shenzhen Univ. Sci. Eng. 2019, 36, 281–288. [Google Scholar]
- Nevmerzhitskiy, Y. Applying Streamline Method for Viscoplastic Oil Flow Simulation. In Proceedings of the SPE Russian Petroleum Technology Conference, Moscow, Russia, 22–24 October 2019; p. SPE-196873-MS. [Google Scholar]
- Wang, Z.; Gao, D.; Diao, B. Comparative performance of electric heater vs. RF heating for heavy oil recovery. Appl. Therm. Eng. 2019, 160, 114105. [Google Scholar] [CrossRef]
- Li, G.; Zhu, Y.; Yang, Z.; Xie, Y.; Jia, M. Numerical simulation research on microwave in-situ heating technology for developing heavy oil in low-permeability reservoirs. Spec. Oil Gas Reserv. 2020, 27, 120–126. [Google Scholar]
- Zhang, Q.; Liu, W.; Taleghani, A.D. Numerical study on non-Newtonian Bingham fluid flow in development of heavy oil reservoirs using radiofrequency heating method. Energy 2022, 239, 122385. [Google Scholar] [CrossRef]
- Xuelin Dong, X.; Duan, Z.; Nie, T.; Gao, D. An analytical model for reservoir temperature during electromagnetic heating based on power transmission. Appl. Therm. Eng. 2023, 219, 119441. [Google Scholar] [CrossRef]
- Zinnatullin, R.R.; Musin, A.A.; Kovaleva, L.A. Study of heating of oil source rocks in a high-frequency electromagnetic field by the method of Physico-Mathematical modeling. High Temp. 2023, 60, 136–139. [Google Scholar] [CrossRef]
- Xiao, J.; Gao, D.; Dong, X.; Feng, C.; Wang, Z. Temperature Distribution of Heavy Oil Reservoirs Under Radio Frequency Heating and Analysis of Influencing Factors. In Proceedings of the 57th U.S. Rock Mechanics/Geomechanics Symposium, Atlanta, GA, USA, 25–28 June 2023. [Google Scholar]
- Dos Santos Heringer, J.D.; de Souza, G.; Amaral Souto, H.P.; Puime Pires, A. On the numerical simulation of non-isothermal heavy oil flow using horizontal wells and horizontal heaters. Braz. J. Chem. Eng. 2024, 41, 179–196. [Google Scholar] [CrossRef]
- Bientinesi, M.; Petarca, L.; Cerutti, A.; Bandinelli, M.; Simoni, M.D.; Manotti, M.; Maddinelli, G. A radiofrequency/microwave heating method for thermal heavy oil recovery based on a novel tight-shell conceptual design. J. Petrol. Sci. Eng. 2013, 107, 18–30. [Google Scholar] [CrossRef]
- Hu, Y.; Wang, Q.; Zhao, J.; Guo, Z.; Zhang, Y. Development of efficiently coupled thermo-hydro-mechanical model to predict hydraulic fracture morphology in heavy oil reservoirs. Environ. Earth Sci. 2018, 77, 778. [Google Scholar] [CrossRef]
- Wang, Z.; Gao, D.; Liu, K.; Tan, T.; Li, W. Study on radio frequency heating pattern of heavy oil reservoir based on multi-antenna configuration. In Proceedings of the SPE International Heavy Oil Conference and Exhibition, Kuwait City, Kuwait, 10–12 December 2018; p. SPE-193774-MS. [Google Scholar]
- Wang, Z. Basic Research on the Downhole Radio Frequency Heating Technology. Ph.D. Thesis, China University of Petroleum (Beijing), Beijing, China, 2020. [Google Scholar]
- Prada, A.; Civan, F. Modification of Darcy’s law for the threshold pressure gradient. J. Petrol. Sci. Eng. 1999, 22, 237–240. [Google Scholar] [CrossRef]
- Wang, S.; Huang, Y.; Civan, F. Experimental and theoretical investigation of the Zaoyuan field heavy oil flow through porous media. J. Petrol. Sci. Eng. 2006, 50, 83–101. [Google Scholar] [CrossRef]
- Liu, W.; Liu, C.; Duan, Y.; Yu, J.; Sun, H.; Yan, X.; Qiao, C.; Yang, Y. Integrated flow model for evaluating maximum fracture spacing in horizontal wells. Phys. Fluids 2023, 35, 023104. [Google Scholar] [CrossRef]
- Chute, F.; Vermeulen, F.; Cervenan, M.; Mcvea, F.J. Electrical properties of Athabasca oil sands. Can. J. Earth Sci. 1979, 16, 9–21. [Google Scholar] [CrossRef]
- Zhang, Q. Study on Compression Properties of Crude Oil Based on Ultrasonic Testing. Master’s Thesis, China University of Petroleum (East China), Qingdao, China, 2017. [Google Scholar]
Disclaimer/Publisher’s Note: The statements, opinions and data contained in all publications are solely those of the individual author(s) and contributor(s) and not of MDPI and/or the editor(s). MDPI and/or the editor(s) disclaim responsibility for any injury to people or property resulting from any ideas, methods, instructions or products referred to in the content. |
© 2024 by the authors. Licensee MDPI, Basel, Switzerland. This article is an open access article distributed under the terms and conditions of the Creative Commons Attribution (CC BY) license (https://creativecommons.org/licenses/by/4.0/).