Abstract
Proton Exchange Membrane Fuel Cells (PEMFCs) are promising technology to convert chemical energy from dihydrogen in electrical energy. HT-PEMFCs are working at high temperatures (above 120 °C) and with doped orthophosphoric acid H3PO4 PBI membranes. In such devices, bipolar metallic plates are used to provide reactive gas inside the fuel cell and collect the electrical current. The metallic elements used as bipolar plates, end plates, and interconnectors in acid electrolyte and gaseous fuel cells are severely damaged by a combination of oxidation (due in particular to the use of oxygen, whether pure or contained in the air) and corrosion (due in particular to acid effluents from the electrolyte). This degradation rapidly leads to the loss of the electrical conductivity of the metallic elements and today requires the use of very specific alloys, possibly coated with pure gold. The solution investigated in the present study is the use of a protective coating based on single-phase nitrides obtained by reactive magnetron sputtering or reactive HiPIMS (High-Power Impulse Magnetron Sputtering). The influence of the microstructure on the physical–chemical properties was studied. The electrochemical properties were quantified following two approaches. First, the corrosion current of the developed coatings was measured at room temperature and at higher temperatures using the Linear Sweep Voltammetry (LSV) technique. Then, Electrochemical Impedance Spectroscopy (EIS) measurements were performed to better identify and evaluate their corrosion-resistance performances.
1. Introduction
Today, how to use dihydrogen as an energy carrier, from its production to its various applications, is a key point of many industrial and research projects. Among the international working groups, the “Hydrogen Council” created in 2017 is demonstrating very important developments [1]. With around 150 members now, it aims to bring together industrial players and investors in order to promote the development of hydrogen technologies. Among the various technologies linked to dihydrogen (including its production by green electrolysis and its use), fuel cells (FCs) are among the solutions planned as an alternative and/or complement to batteries and fossil fuels. The aim is to produce a significant amount of electrical energy while reducing the carbon dioxide emissions and carbon footprint. There are many different types of FCs depending on the working temperature, type of membrane, and selected materials for the electrodes. This study will focus on Proton Exchange Membrane Fuel Cells operating at High Temperatures (HT-PEMFCs). These systems consist of metallic bipolar plates collecting the produced electric current, separated by acid-impregnated polymer membranes. In the case of HT-PEMFCs, capable of operating at 160 °C, the PBI (polybenzimidazole) membranes used contain concentrated orthophosphoric acid (H3PO4). The electrolyte in an HT-PEMFC is therefore a corrosive environment for the adjacent materials, promoting degradation and accelerated ageing of these components, including the metal bipolar plates. When the FC is operating, these phenomena induce a decrease in the electrochemical performance and can lead to system shutdown. Promising solutions for LT-PEMFCs operating with NAFION membranes (in the 60–80 °C range) exist to protect these bipolar plates [2,3]. In the case of HT-PEMFCs, the degradation process leads to ohmic resistance of the metallic elements, requiring the use of very specific and expensive alloys (such as Inconel 625), or possibly a coating with pure gold metal. Metallic element degradation and the fact that the only effective solution to protect them is currently the use of a pure gold coating (a very expensive solution) are considerable hindrances to their development [4,5].
In this context, the main objective of the present study is therefore to propose an alternative solution to noble metal coatings as protective coatings for the metallic bipolar plates used in PEMFCs. This protective coating will be deposited using two different reactive magnetron sputtering technologies: Radio Frequency Magnetron Sputtering, hereafter referred to as “conventional” RF-MS, and High-Power Impulse Magnetron Sputtering (HiPIMS) [6]. The choice of the material to be deposited is crucial and delicate because the specifications are complex. The coating must, on the one hand, protect the bipolar plates from the aggressions linked to their environment (chemical, i.e., membrane and gas used, and operating temperature) and also be a very good electrical conductor so as not to limit the collection of the current, all this in order to guarantee an extended life duration (lifespan 8000 h) [7]. Due to its good performances both as a corrosion-protective material and an electrical conductor, tantalum nitride (TaN) was selected, elaborated, and studied under PEMFC working conditions.
The present work is an investigation of the structural and electrochemical properties of TaN thin layers. A study on the corrosion properties at room temperature and at high temperatures (up to 120 °C) was carried out in a liquid electrolyte, i.e., a solution of H3PO4 (0.5 mol L−1). The influence of the crystallographic structure of the TaN coatings on the corrosion resistance, in correlation with the deposition technology, will be discussed. Chemical analyses carried out before and after electrochemical tests will attempt to highlight the chemical phenomena responsible for the degradation of the protective coatings, if any. Finally, the results obtained in an aqueous environment enabled establishing a classification based on the stability performance. Microstructural analyses were used to determine the influence of a TaN crystallographic structure and thin film microstructure on the physical properties. The characterizations of the samples involved X-ray Diffraction (XRD), Scanning Electrochemical Microscopy (SEM), and X-ray Photoelectron Spectroscopy (XPS). The electrochemical measurements consisted of Open Circuit Potential (OCP) recording, Linear Sweep Voltammetry (LSV), and Electrochemical Impedance Spectroscopy (EIS).
2. Materials and Methods
2.1. Material Deposition Method
TaN films were deposited by reactive Radio Frequency Magnetron Sputtering (RF-MS) and by reactive HiPIMS (High-Power Impulse Magnetron Sputtering in reactive mode, hereafter referred to as “HiPIMS”). In RF-MS, the cathode (and target) are powered with a 13.56 MHz sinusoidal signal. In HiPIMS, high voltage negative pulses (a few 100 V) are applied to the cathode, with a low duty cycle and a high frequency (from 100 to 1000 Hz). In HiPIMS, the power is applied to the magnetron (metallic target in this study) in unipolar pulses, leading to peak target power densities of the order of several kilowatts per square centimeter while keeping the average target power density low enough to avoid magnetron overheating and target melting [8]. These conditions result in the generation of a highly dense plasma discharge, where a large fraction of the sputtered material is ionized (>90%) [9,10]. This difference induces modifications in the plasma composition (more ionized species) and species energies and therefore in the coating’s microstructures obtained.
One of the advantages of HiPIMS sputtering is its ability to form homogeneous and continuous thin films even on substrates with complex geometry [11]. But, the huge advantage of the HiPIMS process concerns the final microstructure of the films. Thin films deposited by RF-MS have, under specific deposition conditions, rather columnar microstructures and rough surfaces [12,13,14]. HiPIMS, thanks to the energy of the species and an optimization of the set-up parameters (pulse duration, frequency, intensity, etc.), favors the growth of nanostructured and very dense smooth films.
TaN thin layers were deposited on AlN substrates (mirror polished plane surfaces) by reactive magnetron sputtering processes in Plassys MP700 equipment pumped down via mechanical and turbo-molecular pumps. The ultimate pressure before processing was in the range of 2–3 × 10⁻⁵ Pa. TaN layers were deposited by reactive sputtering of a tantalum (99.98%) metallic target in an argon–nitrogen plasma (10%), both gases being 99.9999% pure. The total pressure during the deposition process was 0.5 Pa. The vacuum chamber was equipped with 75 mm in diameter targets and an ion source (Anatech IS 3000). The distance from the magnetron source to the substrates was 70 mm. All deposited and studied layers were 0.5 µm of thickness.
2.2. Electrical and Electrochemical Measurements
Electrical conductivity relaxation experiments were performed using the four probes method. Four platinum wires (ϕ = 0.1 mm) were connected to the sample using platinum paste. The applied current was 10 mA (current density J ≈ 100 mA cm−2). Measurements were performed under various atmospheres (mixture of oxygen and nitrogen) using two mass flow controllers or by introducing dry air. In both cases, the same flow rate (≈1 cm3 s−1) was used.
Electrochemical measurements were led in homemade set-up (Figure 1). The designed electrochemical cell enables characterizing evolution of the corrosion behavior of coated samples under a controlled temperature. Figure 1a shows an overview of the cell, while Figure 1b details the window to position the sample in contact with the electrolyte. This device consists of a PTFE (Polytetrafluoroethylene, commonly known as Teflon, RS COMPONENTS, Beauvais, France) tank, chosen for its chemical inertia, that can hold 100 mL of liquid electrolyte. The working electrode, i.e., the sample, is held against the circular window. The active surface area is 1.54 cm2. Two platinum wire electrodes (wire diameter = 0.3 mm) are used both as reference electrodes and for measuring the electrolyte conductivity. A platinum grid (3600 mesh and wire diameter = 0.04 mm) with a larger surface area is used as a counter-electrode. It is placed at the opposite side of the window housing the working electrode. The complete cell can be placed in an oven for temperature-controlled experiments from room temperature up to 120 °C.
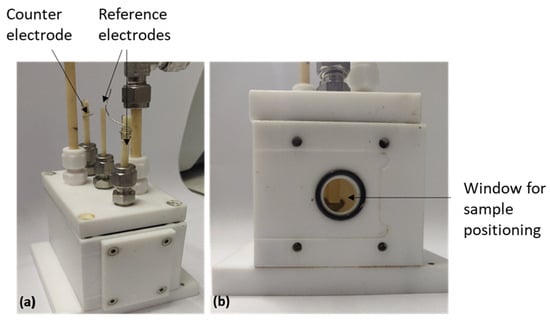
Figure 1.
Electrochemical cell designed at ICMCB: (a) cell overview and (b) face with the window enabling sample contact with the electrolyte. Contact surface 1.54 cm2.
The electrochemical properties were determined by Linear Sweep Voltammetry (LSV) using a three-electrode configuration and Electrochemical Impedance Spectroscopy (EIS) measurements with samples mounted on a Rotating Disk Electrode (RDE) of 7 mm in diameter. This device enables controlling convection phenomena within the electrolyte by imposing a fixed rotation speed on the sample (800 rpm in this study). Impedance diagrams were acquired between 105 Hz and 0.05 Hz. Polarization data were obtained by cyclic voltammetry measurements using an Autolab PGSTAT 302N equipped with a Frequency Response Analyzer (FRA). Measurements were performed under intentiostatic control with a 0.1 mA modulation amplitude, from 105 to 0.1 Hz. LSV measurements were also performed under intentiostatic control, with a 0.1 mA s−1 speed rate, from −2 mA to 2 mA between reference and working electrodes with a three-electrode configuration. All tests were performed in a solution of 0.5 mol L−1 orthophosphoric acid H3PO4.
2.3. Structural, Microstructural, and Surface Analyses
In order to determine the crystalline structure of the coatings, X-ray diffractograms were collected using the so-called conventional way and by Grazing Incidence X-ray Diffraction (GIXD) with a fixed 0.5° incidence angle. The advantage, particularly for thin films, is the limited penetration depth of X-rays into the sample, minimizing the signal from the substrate. By varying the incident angle, X-rays’ penetration depth can be varied from a few nanometers up to a few hundred nanometers. Only grazing incidence diffractograms are presented.
Both surfaces and cross sections of the coatings were observed using a Scanning Electron Microscope (SEM) (JEOL 6330A).
X-ray photoelectron Spectroscopy XPS spectra were collected with a ThermoFisher Scientific K-Alpha spectrometer (ThermoFisher Scientific, Ottawa, ON, Canada) using a monochromatic Al Kα X-radiation (1486.6 eV) and a hemispherical electron energy analyzer. Samples were clamped on the metallic holder without any additional preparation. This technique was used to characterize extreme surfaces (i.e., about 3 to 5 nm in depth) with a 400 µm diameter X-ray spot size. The binding energies reported were referenced with the Ta 4f and N 1s. Experimental data curves were fitted into components with Gaussian–Lorentzian peaks using the ThermoFisher Scientific Advantage software.
3. Results and Discussion
3.1. Material Characterization
Figure 2 shows the diffractograms obtained from the different deposited coatings. The fcc-TaN RF-MS diffractogram shows five peaks related to (111), (200), (220), (311), and (222) planes (JCPDS ref 00-049-1283). Intensity ratios of the different peaks do not correspond to the theoretical ones. For the fcc-TaN HiPIMS coating, the texture changes drastically. Only one peak corresponding to (200) planes is observable (the others correspond to the aluminum nitride AlN substrate). For the h-TaN RF-MS coating, five peaks related to the (110), (111), (221), (300), and (211) planes (JCPDS ref 01-039-1485) are present. For the h-TaN HiPIMS, two peaks are observed: (110) and (300). Even if the process impacts the texture, all the tantalum nitrides are single-phased in this study. For the fcc-TaN RF-MS, there is no shift, so no residual stress. The process parameters used for the fcc-TaN HiPIMS or to stabilize the h-TaN RF-MS and HiPIMS lead to peak shifts to lower angles compared to their theoretical positions. These shifts are usually attributed to residual stresses. For the fcc-TaN HiPIMS, an increase in the unit cell parameter witnesses tensile stress presence. For the h-TaN RF-MS, compared to the theoretical values of cell parameters a and c, tensile stresses occur in the basal plane and along the c-axis. For the h-TaN HiPIMS, tensile stresses occur in the basal plane and compression stresses along the c-axis.
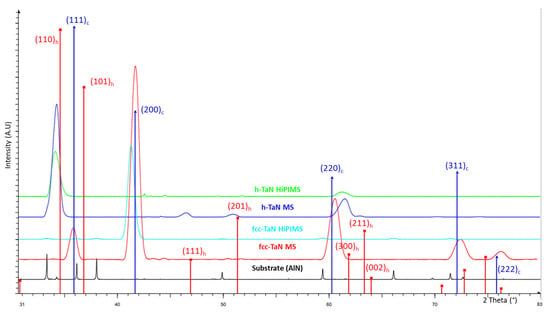
Figure 2.
GIXD diffractograms (0.5°) of AlN substrate, h-TaN and fcc-TaN RF-MS coatings, and h-TaN and fcc-TaN HiPIMS coatings. DRX references data h-TaN (red lines): JCPDS 00-039-1485; fcc-TaN: JCPDS 00-049-1283 (blue lines).
The SEM surface coating observations validate the coating continuity regardless of the crystal structure for both deposition methods. The change in the deposition process from RF-MS to HiPIMS leads to smoother surfaces whatever the considered structure, which agrees with the literature and the obtaining of a nanostructured coating by HiPIMS [15,16,17,18]. The SEM pictures in Figure 3 illustrate this qualitative modification of the surface topology regarding h-TaN.
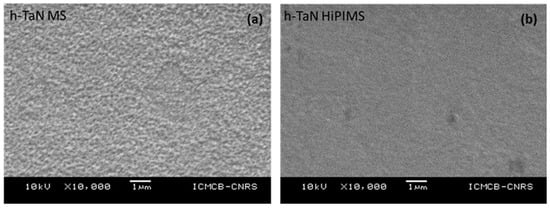
Figure 3.
SEM surface images of h-TaN (a) MS and (b) HiPIMS deposited on mirror polished AlN substrate.
The cross section observations confirmed the columnar microstructure for h-TaN MS (Figure 4), whereas, for HiPIMS h-TaN, the microstructure seems to be denser. Similar results are observed regarding fcc-TaN.
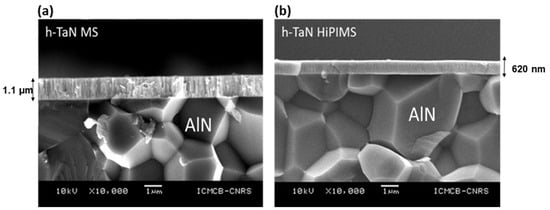
Figure 4.
SEM cross section images of h-TaN (a) MS and (b) HiPIMS deposited on mirror polished AlN substrate (similar deposition duration, 3 h).
XPS analyses were performed after 30 s ionic etching (Ar+) in order to physically remove any contamination from the surfaces to be observed (carbon, oxygen, etc.). Figure 5 shows the XPS spectra as the resulting simulations of the peak’s curves. The simulations of the Ta 4f tantalum spectra include three Ta 4f7/2–Ta 4f5/2 doublets corresponding to the presence of three different chemical bonds. The high-energy doublet (black curve, Figure 5) corresponds to a Ta-O oxide bond (26.5–28.4 eV). The second doublet (yellow curve, Figure 5) located at (24.0–25.9 eV) corresponds to a Ta-N nitride bond. Finally, the last doublet (pink curve, Figure 5) positioned at (22.8–24.7 eV) is attributed to modifications induced by Ar+ ion etching. Its position is intermediate between Ta-Ta metallic and Ta-N nitride bonds. It should be noted that the tantalum metal bond at 21.7 eV for Ta 4f7/2 [19,20,21,22] is not observed. Thanks to the etching, most of the surface oxidation has therefore been removed. Concerning the N1s peaks, changes can be observed depending on the coating (Figure 5). For the same structure (fcc- or h-TaN), the switch from RF-MS to HiPIMS leads to an increase in the low-energy N1s peak (i.e., a decrease in the ratio of the peaks at 397.8 eV and 396.8 eV). A possible hypothesis is the difference in the ordering of the coatings. With HiPIMS, the species arrive at the surface with very high kinetic energies and can therefore generate the presence of defects such as vacancies. Based on the XPS results, the N/Ta ratios are calculated and reported in Table 1.
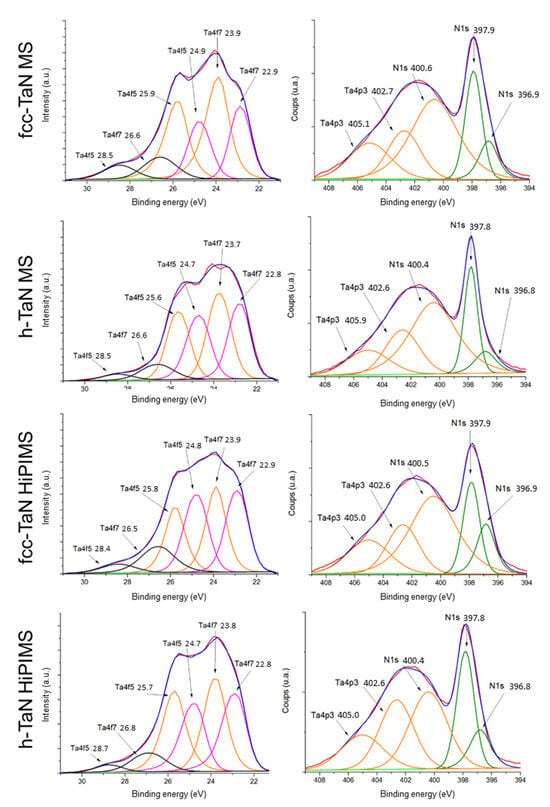
Figure 5.
XPS Ta 4f and N 1s spectra obtained on TaN coatings after 30 s of etching (experimental curve in red; de-summed curve in blue). energie de liaison: binding energy.

Table 1.
N/Ta ratios determined by XPS after 30 s of etching depending on the coating type.
The N/Ta ratios estimated from the XPS analyses are consistent with the literature data. Based on the Ta-N binary equilibrium phase diagram, the N/Ta ratio varies from 0.9 to 1 for h-TaN and from 0.66 to 1 for fcc-TaN [23]. The lower value found for the h-TaN MS coating could be explained by the specific stabilization mechanism of this phase out of equilibrium. When the incident energy of the species is increased and the composition of the plasma is changed (more ionized species) with the HiPIMS process, no significant modification is observed for fcc-TaN, while this ratio is increased to reach the theoretical value for h-TaN. Additional experiments are required to conclude a change in the stabilization mechanism.
3.2. Electrical Conductivity
As previously mentioned, PEMFC bipolar plates need to be protected against corrosion while remaining good electrical conductors. Table 2 summarizes the electrical conductivities and resistivities of all the TaN coatings, gold reference layer, and 316L stainless steel. To compare with the reference gold coating, measurements were also realized on 1 µm gold layers elaborated in the same MS device (0.5 Pa, gold target) and on a conventional steel (316L) used as bipolar plate material [7].

Table 2.
Conductivity and resistivity at room temperature of TaN gold and 316L thin films.
At room temperature, all the TaN coatings have a conductivity greater than 100 S cm−1 (a lower conductivity value is required for bipolar plates [1,2]). The gold layers show values of 1328 ± 23 S cm−1 Compared to the bulk electrical conductivity of gold (around 455,000 S cm−1 [24]), this value is low, but it can be explained by the reduced mean free path of the electrons in a thin layer due to the scattering effect. Obviously, the electrical resistivity, and other properties, of thin films are not expected to be the same as those of bulk material due to scale factors. In this study, the 1 µm thickness and the densely packed fibrous grain microstructure explain the value obtained. The values found for the 316L bulk steel (14,396 ± 1223 S cm−1) agree with those of the literature. The 316 stainless steels have electrical conductivity of about 2.5 to 6.5% that of pure copper (6.3 · 105 S cm−1 [25]), i.e., from 15,750 to 40,950 S cm−1.
Concerning the TaN coatings, it can be deduced from the conductivity and resistivity values presented in Table 2 that both the crystalline structure and deposition process (MS or HiPIMS) influence the electrical properties. The fcc-TaN layers have a rather low electrical conductivity (between 300 and 550 S cm−1), consistent with Nieto et al. [12]. An increase in the conductivity values for the fcc-TaN HiPIMS samples is noticed. The densification and the microstructure changes (grain size, grain morphology, texture, etc.) may explain this slight improvement. The h-TaN resistivity (ρ = 107 for MS or 251 µΩ cm for HiPIMS) values are higher than the 316L values and lower than the gold MS and fcc-TaN values. When h-TaN samples are HiPIMS-deposited, the conductivity decreases, whereas it increases for fcc-TaN. The change in the microstructure (decrease in grain size, texture changes, etc.) and densification of h-TaN HiPIMS do not enable explaining this evolution. Based on the quantification of the N-content by XPS, the N/Ta ratio for h-TaN HiPIMS agrees with the one expected from the equilibrium binary diagram (from 0.9 to 1), whereas, for the h-TaN MS, it is lower than the expected one (0.93 and 0.69, respectively). It is well known that the N2/Ar flow rate ratio influences the electrical behavior from conductive to insulator when increasing [26]. Yu et al. reported that the resistivity of fcc-TaNx changed significantly from highly conductive (102 µΩ cm) to insulating (106 µΩ cm) through changes in the stoichiometry depending on the N2 pressure and temperature during the film deposition [27]. In their study, the resistivity of the TaN films varied slightly as their thicknesses changed. The dominance of the Ta vacancies under N-rich conditions was predicted theoretically and is known to be responsible for metal–insulator transition in rock salt TaN [27,28]. The generated vacancies and antisite defects (N atoms occupying Ta sites) or N-rich thermodynamically stable phase formation (tetragonal Ta4N5 or orthorhombic Ta3N5) under N-rich conditions may be the cause of the large increase in the resistivity of the TaN films as the R value increased in their study. In this study, the N2/Ar flow rate ratio (around 10%) and the coating thickness (µm) are fixed. Only the change in the N-content seems to explain the evolution of the conductivity when the process is changed.
In order to reproduce the working atmospheres of the HT-PEMFC bipolar plates (exposed to an oxidizing gas (dioxygen) on one side and a reducing gas (dihydrogen) on the other side), the electrical conductivity measurements were carried out under controlled atmospheres of pure Ar, Ar + 5%H2, air, and pure O2 from room temperature up to 200 °C. Figure 6 summarizes the different evolutions of the conductivity values as a function of the temperature, the atmosphere composition, the TaN structure (fcc or h), and the process (MS or HiPIMS).
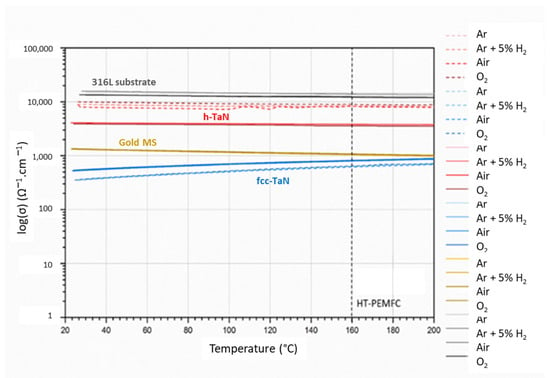
Figure 6.
Evolution of the electrical conductivity of TaN coatings under different atmospheres as a function of temperature (from room temperature to 200 °C (vertical dashed line represents the HT-PEMFC temperature during operation).
For all the TaN coatings, the influence of the temperature and gas atmosphere on the conductivity is low. All meet the specifications (σ > 100 S cm−1). At 160 °C, the electrical conductivity of the fcc-TaN MS and fcc-TaN HiPIMS are reduced by, respectively, 40% and 23% in comparison with the reference. Conversely, for the h-TaN MS and h-TaN HiPIMS, the values are about, respectively, 7 and 3 times higher. Moreover, compared to the cubic phase, h-TaN shows a semiconductor-like evolution with the temperature. All the selected materials have very low activation energies, although those with semiconductor-like behavior always have higher activation energies. Based on these results, h-TaN seems to be the most interesting phase to guarantee performant electrical properties for the protection of the bipolar plates of HT-PEMFCs.
3.3. Electrochemical Measurements
3.3.1. Voltammetry
In order to characterize the electrochemical behavior of the developed samples, voltammetric measurements were carried out. The electrolyte used is a solution of orthophosphoric acid H3PO4 with a concentration of 0.5 mol L−1. Using a three-electrode cell enables determining the stability range of the electrolyte and the electrochemical response of the working electrode to different electrical polarizations. The potential range at which the current is sufficiently low corresponds to the electrolytic domain. The degradation phenomena suffered by the working electrode are strongly reduced for these voltage values. The goal is therefore to obtain a large zone of electrochemical stability (i.e., the higher value of ΔE) that is as wide and flat as possible.
In the case of the 316L alloy without a protective coating (Figure 7a), the stability domain corresponds to the plateau between 1.2 V/ENH and stops just before −0.5 V/ENH (ΔE = 1.7 V/ENH). The anode part corresponds to the oxidation of the 316L working electrode with the release of dioxygen. The cathodic part corresponds to the reduction of the 316L working electrode with the release of dihydrogen. From these results, using the Tafel line method, the corrosion current icorr and corrosion potential Ecorr of the 316L steel are determined [29,30]. Figure 7b illustrates how the corrosion potential Ecorr and corrosion current icorr values are determined using the anodic branch and the position of the peak. The corrosion potential Ecorr characterizes the thermodynamic stability and thus the nobility of the coating. The corrosion current icorr characterizes the kinetics of the reactions and thus the rate at which the coating degrades. For the 316L Steel at room temperature, icorr is estimated to be equal to 0.02 mA cm−2 and Ecorr is 0.85 V/ENH.
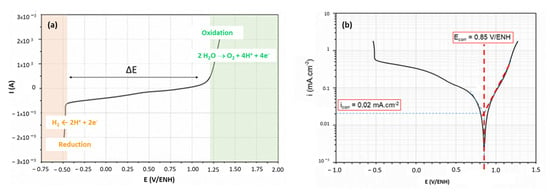
Figure 7.
The 316L alloy corrosion behavior at room temperature: (a) polarization curve I–E and (b) Tafel (Log |i| = f(E) plot obtained from the polarization curve with red dashed line determine the Ecorr and icorr values.
In order to obtain the most effective protective coating, the lowest corrosion current and the highest corrosion potential (within the stability range of the electrolyte) are the best compromise. When the corrosion current of a material is higher, then the material is protected. In the opposite situation, the material is deteriorated [31,32].
To understand the degradation mechanisms involved and, above all, the influence of the different characteristics of the protective coatings, free from the influence of the substrate, the quantification of the electrochemical properties was carried out on continuous coatings deposited on an insulating AlN substrate. The results are presented in Table 3.

Table 3.
Corrosion current and potential icorr and Ecorr values for the reference gold coating and the four TaN coatings at room temperature and 120 °C. Arrow indicates the tendency when compared with results at room temperature.
The Ecorr and icorr values of the gold reference coating are higher than those of all the TaN coatings whatever the test temperature. It should also be noted that, at room temperature as well as at 120 °C, the corrosion current of the gold thin film is higher than the required limit of 1 µA cm−2 [7], although it is the best coating currently used in HT-PEMFCs. Regardless of the deposition process, a significant decrease in the corrosion potential values is observed for the fcc-TaN MS and fcc-TaN HiPIMS when the test temperature increases. The corrosion current increases with the temperature for fcc-TaN MS and is quasi-constant for the fcc-TaN HiPIMS. For the h-TaN MS and h-TaN HiPIMS, a slight decrease occurs for the Ecorr values when the icorr values are stable. At room temperature, considering the rate of degradation of the coatings via the evolution of the corrosion current values, it can be observed that, for the nitride coatings, a drop in Icorr is observed ranging from around 90%, whatever the process and structure, compared to the gold coating. The corrosion current is always lower for those coatings obtained by HiPIMS. These electrochemical results indicate that the use of a tantalum nitride coating drastically reduces the reaction kinetics, with a slightly greater effect if the coating is deposited by HiPIMS.
At 120 °C, the decreases in the icorr and Ecorr values are reduced compared to the gold ones. The TaN coatings can be considered less sensitive to a temperature effect. The use of TaN coatings reduces the corrosion currents (compared to gold) by 82%, 89%, 86%, and 91% for the fcc-TaN MS, fcc-TaN HiPIMS, h-TaN MS, and h-TaN HiPIMS, respectively. Furthermore, the corrosion currents of the two HiPIMS coatings and the h-TaN MS remain identical at room temperature and at 120 °C.
As mentioned in the literature [33], the current densities should be examined at potentials of 0.6 V/SCE (i.e., 0.8 V/ENH) and–0.1 V/SCE (i.e., 0.1 V/ENH). These values are assigned to the cathodic and anodic potentials, respectively, when a PEMFC is in operation. The challenge is therefore to obtain the lowest current densities in both cases. An example for the h-TaN MS at 120 °C is presented in the Tafel formalism in Figure 8. The values are reported in Table 4.
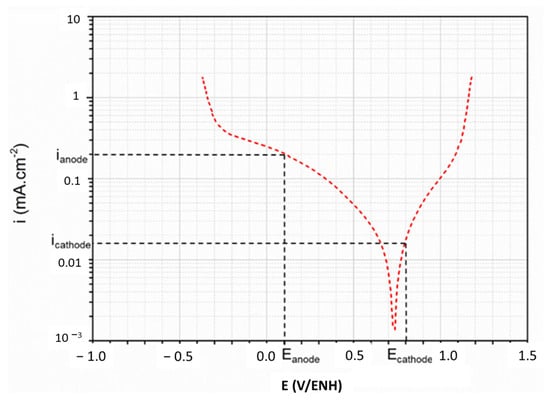
Figure 8.
Example of the determination of the current densities for anodic and cathodic potentials at 120 °C for h-TaN MS.

Table 4.
Current densities estimated for anodic and cathodic potentials at 120 °C for all the TaN and the reference gold coatings.
For gold, no significant difference is observed between the absolute values of the current densities for a cathodic potential and for an anodic potential. For all the TaN coatings, the anodic potentials are always much higher than the cathodic potentials in terms of the absolute value. Regardless of the TaN film, the protective coatings all have current densities greater than their corrosion current density when placed at an anodic or cathodic potential, suggesting that the coatings will all undergo degradation in HT-PEMFC working conditions. However, it is interesting to note that these anodic and cathodic current density values appear to be significantly reduced compared to those obtained for the gold MS. These results reveal very promising prospects for these TaN thin films in the field of protecting bipolar plates in acidic environments, especially when they are elaborated using the HiPIMS technique. These have both the lowest values of current density and constant icorr values when the temperature increases.
3.3.2. Electrochemical Impedance Spectroscopy
Electrochemical Impedance Spectroscopy measurements were carried out on the fcc and hTaN coatings (Figure 9a,b, respectively). Concerning the EIS modeling, two approaches to interpreting corrosion impedance results are presented in the literature. The first models the corrosion reactions by an equivalent circuit, as presented in Figure 9a: a resistance Rs (seria resistance) is used to model the resistance of the electrolyte. The resistance Rpr (polarization resistance) and the CPEpr (Constant Phase Element) enable the behavior of the reaction products (corrosion) to be characterized. The resistance Rct provides information on the charge transfer. The CPEdl describes the behavior of the Double Layer interface between the working electrode and the electrolyte [34,35]. The second model frequently encountered in the literature concerning corrosion studies is shown in Figure 9b: a series resistance R1 always represents the resistivity of the electrolyte. The grouping R2 and CPE2 characterizes the formation of an oxide layer. The grouping R3 and CPE3 then provides information on mass transfer phenomena (diffusion of reactants and reaction products) [36].
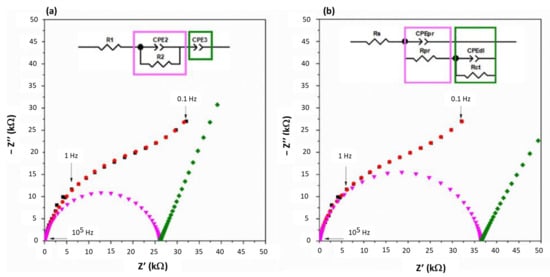
Figure 9.
Typical Nyquist plots: experimental (black) and modeling (red) data obtained for gold and fcc and h-TaN HiPIMS coating. The associated equivalent circuit is reported inside the figure.
Both equivalent circuits were used to simulate the impedance results obtained in this study. Figure 9 shows typical results of these equivalent models when applied to the data obtained for the HiPIMS fcc-TaN. However, the R3 resistor has been removed in the case of the second example because it cannot be distinguished further. In Figure 9, the black curves are the experimental data, and the red curves are the modeling results. The pink and green curves are simulations of only parts of the model. For both types of models, a good correlation of the simulated results with the experimental results was obtained. The following results concern the first model (see equivalent circuit in Figure 9a).
The average R1 (or Rs) value is estimated to be 49 ± 7 Ω. The elements of the CPE2 and R2 circuit associated in parallel have been assigned to the charge transfer process taking place between the electrolyte and the surface of the working electrodes. It thus evidences the oxidation (or not) of the materials. The evolution of the equivalent capacitance Ceq2 (deduced from the CPE2) in Table 5 as a function of the materials shows that the materials tested, coated or not, have close values for these tests performed at room temperature. This impedance contribution can then be considered as an identification signature of the electrochemical process involved (probably the formation of oxide layers). The comparison of the R2 values (Table 5 for the different deposited materials (gold; TaN layers) shows that the values are all lower than those obtained for gold. This result is in good agreement with the corrosion current densities reported in Table 4. The first conclusion is that the charge transfer is the limiting step in the corrosion process. The equivalent capacitance Ceq3 (Table 5) varies very little for all the coated samples, with values equivalent to that found for the reference gold coating. The second conclusion is that the material transport phenomena at the electrode surface are quite similar under these measurement conditions. Here again, the fcc-TaN MS has a behavior that differs from that of the other materials. The value of the pseudo-capacitance is between that of the substrate and that of the reference coating. However, although there is a factor of 10 between the value of Ceq (equivalent capacity) attributed to the substrate and that attributed to the TaN coatings, the value for the fcc-TaN MS is found to be only twice as high as that of the reference coating. The presence of the coating therefore appears to affect the material transport characteristics of the surface of the coated samples. Therefore, it is mainly the presence, or absence, of the coating that strongly influences the diffusion phenomena of the species on the electrode surface.

Table 5.
R2, equivalent capacity Ceq2 and Ceq3 values estimated at room temperature for the 316L substrate, the gold MS, and the four TaN coatings.
4. Conclusions
Single-phase and well-crystalized thin films of h-TaN and fcc-TaN have been deposited on AlN substrates. As a first step, it was verified that the electrical conductivity of the TaN coatings reached the value set out in the specifications (σ > 100 S cm−1), including at high temperatures (200 °C) and under an oxidizing or reducing atmosphere. In a second step, the electrochemical measurements carried out in a liquid electrolyte highlighted the promising behavior of the TaN thin films as corrosion-protective coatings. The corrosion measurements carried out on the TaN coatings have shown that TaN thin films, regardless of the deposition technique (MS or HiPIMS) or structure (fcc or h), can protect the 316L bipolar plates and present corrosion current densities validating the criteria set out by the specifications (i.e., DOE targets). The present study enables demonstrating the promising properties of TaN coatings for protecting the bipolar plates for PEMFCs and particularly the hexagonal phase, which presents a higher electrical conductivity than the cubic phase and a similar corrosion current density when elaborated with HiPIMS. Electrochemical measurements in complete fuel cell configuration Electrode Membrane Assemblies (EMAs) with protected current collectors have to confirm the stability improvement under the working conditions. A specific article will be dedicated to this study.
Author Contributions
Conceptualization, F.M., M.C. and A.P.-Q.; Validation, F.M.; Investigation, A.A., S.F., D.M. and A.P.-Q.; Data curation, A.A.; Writing—original draft, F.M.; Writing—review & editing, F.M., M.C. and A.P.-Q.; Supervision, F.M. and A.P.-Q.; Project administration, M.C.; Funding acquisition, M.C. All authors have read and agreed to the published version of the manuscript.
Funding
This research received no external funding.
Data Availability Statement
Data is contained within the article.
Acknowledgments
This work was financially supported by the ANR-ASTRID program, AID—Agence d’Innovation de Défense, DGA—Direction Générale de l’Armement, and SAFRAN.
Conflicts of Interest
The authors declare that they have no known competing financial interests or personal relationships that could have appeared to influence the work reported in this paper.
References
- Hydrogen Council. Available online: https://hydrogencouncil.com/en/ (accessed on 1 January 2023).
- Hermann, A.; Chaudhuri, T.; Spagnol, P. Bipolar plates for PEM fuel cells: A review. Int. J. Hydrogen. Energy 2005, 30, 1297–1302. [Google Scholar] [CrossRef]
- Antunes, R.A.; Oliveira, M.C.L.; Ett, G.; Ett, V. Corrosion of metal bipolar plates for PEM fuel cells: A review. Int. J. Hydrogen Energy 2010, 35, 3632–3647. [Google Scholar] [CrossRef]
- Cherevko, S.; Topalov, A.; Katsounaros, I.; Mayrhofer, K. Electrochemical dissolution of gold in acidic medium. Electrochem. Commun. 2013, 28, 44–46. [Google Scholar] [CrossRef]
- Cherevko, S.; Topalov, A.A.; Zeradjanin, A.R.; Katsounaros, I.; Mayrhofer, K.J.J. Gold dissolution: Towards understanding of noble metal corrosion. RSC Adv. 2013, 3, 16516–16527. [Google Scholar] [CrossRef]
- Anders, A. Tutorial: Reactive high-power impulse magnetron sputtering (R-HiPIMS). J. Appl. Phys. 2017, 121, 171101. [Google Scholar] [CrossRef]
- United States Driving Research and Innovation for Vehicle et Efficiency and Energy Sustainability, Fuel Cell Technical Team Roadmap. November 2017. Available online: https://www.energy.gov/sites/default/files/2017/11/f46/FCTT_Roadmap_Nov_2017_FINAL.pdf (accessed on 25 September 2024).
- Lundin, D.; Sarakinos, K. An introduction to thin film processing using high-power impulse magnetron sputtering. J. Mater. Res. Focus Issue Plasma Ion-Beam Assist. Mater. Process. 2012, 27, 780–792. [Google Scholar] [CrossRef]
- Michiels, M.; Konstantinidis, S.; Snyders, R.; La pulvérisation cathodique magnétron en régime d’impulsions de haute puissance (HiPIMS). Techniques de l’Ingénieur. Available online: https://www.techniques-ingenieur.fr/base-documentaire/materiaux-th11/traitements-de-surface-des-metaux-par-voie-seche-et-en-milieu-fondu-42360210/la-pulverisation-cathodique-magnetron-en-regime-d-impulsions-de-haute-puissance-hipims-in207/ (accessed on 25 September 2024).
- Attabi, S.; Himour, A.; Laouar, L.; Motallebzadeh, A. Mechanical and wear behaviors of 316L stainless steel after ball burnishing treatment. J. Mater. Res. Technol. 2021, 15, 3255–3267. [Google Scholar] [CrossRef]
- Giroire, B.; Ahmad, M.A.; Aubert, G.; Teule-Gay, L.; Michau, D.; Watkins, J.J.; Aymonier, C.; Poulon-Quintin, A. A comparative study of copper thin films deposited using magnetron sputtering and supercritical fluid deposition techniques. Thin Solid Film. 2017, 643, 53–59. [Google Scholar] [CrossRef]
- Nieto, A.; Guzmán, M.; Conde-Gallardo, A.; Contreras, O. Synthesis of Superconductive TaN Thin Films by Reactive DC Sputtering. J. Electron. Mater. 2022, 51, 4649–4658. [Google Scholar] [CrossRef]
- Ehiasarian, A.P.; New, R.; Münz, W.-D.; Hultman, L.; Helmersson, U.; Kouznetsov, V. Influence of high-power densities on the composition of pulsed magnetron plasmas. Vacuum 2002, 65, 147–154. [Google Scholar] [CrossRef]
- Bernoulli, D.; Müller, U.; Schwarzenberger, M.; Hauert, R.; Spolenak, R. Magnetron sputter deposited tantalum and tantalum nitride thin films: An analysis of phase, hardness and composition. Thin Solid Film. 2013, 548, 157–161. [Google Scholar] [CrossRef]
- Nazon, J.; Sarradin, J.; Flaud, V.; Tedenac, J.C.; Fréty, N. Effects of processing parameters on the properties of tantalum nitride thin films deposited by reactive sputtering. J. Alloys Compd. 2008, 464, 526–531. [Google Scholar] [CrossRef]
- Vargas, M.; Castillo, H.A.; Restrepo-Parra, E.; De La Cruz, W. Stoichiometry behavior of TaN, TaCN and TaC thin films produced by magnetron sputtering. Appl. Surf. Sci. 2013, 279, 7–12. [Google Scholar] [CrossRef]
- Cheviot, M.; Gouné, M.; Poulon-Quintin, A. Monitoring tantalum nitride thin film structure by reactive RF magnetron sputtering: Influence of processing parameters. Surf. Coat. Technol. 2015, 284, 192–197. [Google Scholar] [CrossRef]
- Sarakinos, K.; Martinu, L. Synthesis of thin films and coatings by high power impulse magnetron sputtering. In High Power Impulse Magnetron Sputtering; Lundin, D., Minea, T., Gudmundsson, J.T., Eds.; Elsevier: Amsterdam, The Netherlands, 2020; pp. 333–374. [Google Scholar] [CrossRef]
- Sarakinos, K.; Alami, J.; Konstantinidis, S. High power pulsed magnetron sputtering: A review on scientific and engineering state of the art. Surf. Coat. Technol. 2010, 204, 1661–1684. [Google Scholar] [CrossRef]
- Chang, C.-C.; Jeng, J.S.; Chen, J.S. Microstructural and electrical characteristics of reactively sputtered Ta-N thin films. Thin Solid Film. 2002, 413, 46–51. [Google Scholar] [CrossRef]
- Matula, R.A. Electrical resistivity of copper, gold, palladium, and silver. J. Phys. Chem. Ref. Data 1979, 8, 1147–1298. [Google Scholar] [CrossRef]
- Zaman, A.; Meletis, E. Microstructure and Mechanical Properties of TaN Thin Films Prepared by Reactive Magnetron Sputtering. Coatings 2017, 7, 209. [Google Scholar] [CrossRef]
- Frisk, K. Analysis of the phase diagram and thermochemistry in the Ta–N and the Ta–C–N systems. J. Alloys Compd. 1998, 278, 216–226. [Google Scholar] [CrossRef]
- Lacy, F. Developing a theoretical relationship between electrical resistivity, temperature, and film thickness for conductors. Nanoscale Res. Lett. 2011, 6, 636. [Google Scholar] [CrossRef]
- Umran, U. Resistivity of Steel. In The Physics Factbook; Glenn, E., Ed.; Springer: New York, NY, USA, 2006. [Google Scholar]
- Kim, D.-K.; Lee, H.; Kim, D.; Kim, Y.K. Electrical and mechanical properties of tantalum nitride thin films deposited by reactive sputtering. J. Cryst. Growth 2005, 283, 404–408. [Google Scholar] [CrossRef]
- Yu, L.; Stampfl, C.; Marshall, D.; Eshrich, T.; Narayanan, V.; Rowell, J.M.; Newman, N.; Freemanand, A.J. Mechanism and control of the metal-to-insulator transition in rock salt tantalum nitride. Phys. Rev. B 2002, 65, 245110. [Google Scholar] [CrossRef]
- Tan, P.; Fu, L.; Teng, J.; Zhu, J.; Yang, W.; Zhou, L. Effect of texture on wear resistance of tantalum nitride film. Tribol. Int. 2019, 133, 126–135. [Google Scholar] [CrossRef]
- Riekkinen, T.; Molarius, J.; Laurila, T.; Nurmela, A.; Suni, I.; Kivilahti, J.K. Reactive sputter deposition and properties of TaxN thin films. Microelectron. Eng. 2002, 64, 289–297. [Google Scholar] [CrossRef]
- Alishahi, M.; Mahboubi, F.; Khoie, S.M.M.; Aparicio, M.; Hübner, R.; Soldera, F.; Gago, R. Electrochemical behavior of nanocrystalline Ta/TaN multilayer on 316L stainless steel: Novel bipolar plates for proton exchange membrane fuel-cells. J. Power Sources 2016, 322, 1–9. [Google Scholar] [CrossRef]
- Wang, L.W.L.; Li, L.; Liu, H.; Wang, S.; Fang, H.; Gao, H.; Gao, K.; Zhang, Y.; Sun, J.; Yan, J. Polylaminate TaN/Ta coating modified ferritic stainless steel bipolar plate for high temperature proton exchange membrane fuel cell. J. Power Sources 2018, 399, 343–349. [Google Scholar] [CrossRef]
- Mendizabal, L.; Oedegaard, A.; Kongstein, O.E.; Lædre, S.; Walmsley, J.; Barriga, J.; Gonzalez, J.J. TaNX coatings deposited by HPPMS on SS316L bipolar plates for polymer electrolyte membrane fuel cells: Correlation between corrosion current, contact resistance and barrier oxide film formation. Int. J. Hydrogen Energy 2017, 42, 3259–3270. [Google Scholar] [CrossRef]
- Hernandez, H.H.H.; Reynoso, A.M.R.; Gonzalez, J.C.T.; Moran, C.O.G.; Hernandez, J.G.M.; Ruiz, A.M.; Hernandez, J.M.; Cruz, R.O. Electrochemical Impedance Spectroscopy (EIS): A Review Study of Basic Aspects of the Corrosion Mechanism Applied to Steels. In Electrochemical Impedance Spectroscopy; El-Azazy, M., Min, M., Annus, P., Eds.; IntechOpen: London, UK, 2020. [Google Scholar] [CrossRef]
- Liu, Y.; Li, H.; Li, Z. EIS Investigation and Structural Characterization of Different Hot-Dipped Zinc-Based Coatings in 3.5% NaCl Solution. Int. J. Electrochem. Sci. 2013, 8, 7753–7767. [Google Scholar] [CrossRef]
- Gharaibeh, A.; Felhősi, I.; Keresztes, Z.; Harsányi, G.; Illés, B.; Medgyes, B. Electrochemical Corrosion of SAC Alloys: A Review. Metals 2020, 10, 1276. [Google Scholar] [CrossRef]
- Iken, H.; Basseguy, R.; Guenbour, A.; Bachir, A.B. Classic and local analysis of corrosion behaviour of graphite and stainless steels in polluted phosphoric acid. Electrochim. Acta 2007, 52, 2580–2587. [Google Scholar] [CrossRef]
Disclaimer/Publisher’s Note: The statements, opinions and data contained in all publications are solely those of the individual author(s) and contributor(s) and not of MDPI and/or the editor(s). MDPI and/or the editor(s) disclaim responsibility for any injury to people or property resulting from any ideas, methods, instructions or products referred to in the content. |
© 2024 by the authors. Licensee MDPI, Basel, Switzerland. This article is an open access article distributed under the terms and conditions of the Creative Commons Attribution (CC BY) license (https://creativecommons.org/licenses/by/4.0/).