Article

Unconventional Fracture Networks Simulation and Shale Gas Production Prediction by Integration of Petrophysics, Geomechanics and Fracture Characterization

1
Research Institute of Petroleum Exploration and Development, China National Petroleum Corporation, Beijing 100083, China
2
State Key Laboratory of Petroleum Resources and Prospecting, China University of Petroleum Beijing, Beijing 102249, China
3
Department of Chemical and Petroleum Engineering, University of Calgary, Calgary, AB T2N 1N4, Canada
4
China National Oil and Gas Exploration and Development Corporation, Beijing 100083, China
5
CNPC Greatwall Drilling Company Geology Research Institute, Panjin 124000, China
*
Authors to whom correspondence should be addressed.
Energies 2024, 17(20), 5084; https://doi.org/10.3390/en17205084
Submission received: 6 September 2024 / Revised: 29 September 2024 / Accepted: 10 October 2024 / Published: 12 October 2024
(This article belongs to the Section H: Geo-Energy)

Abstract

:
The proficient application of multistage fracturing methods enhances the status of the Duvernay shale formation as a highly esteemed shale reservoir on a global scale. Nevertheless, the challenge is in accurately characterizing unconventional fracture behavior and predicting shale productivity due to the complex distributions of natural fractures, pre-existing faults, and reservoir heterogeneity. The present study puts forth a Geo-Engineering approach to comprehensively investigate the Duvernay shale reservoir in the vicinity of Crooked Lake. To begin with, on the basis of the experimental results and well-logging interpretations, a high-quality petrophysical and geomechanical model is constructed. Subsequently, the establishment of an unconventional fracture model (UFM) takes into account the heterogeneity of the reservoir and the interactions between hydraulic fractures and pre-existing natural fractures/faults and is further validated by 18,040 microseismic events. Finally, the analysis of well productivity is conducted by numerical simulations, revealing that the agreement between the simulated and observed production magnitudes exceeds 89%. This paper will guide the efficient development of increasingly important unconventional shale resources.

1. Introduction

In recent years, unconventional shale resources have emerged as a prominent factor in the global energy market. The exploration and extraction of shale gas have been effectively carried out in the United States, Canada, Argentina, and China, for example. According to statistical data presented by the International Energy Agency (IEA), Canada’s shale gas production reached a volume of 58 × 108 m3 throughout the year 2020 [1]. Canada is positioned as the fourth most significant global producer, with the United States (7570 × 108 m3), China (230 × 108 m3), and Argentina (129 × 108 m3) surpassing its production levels. Particularly, the Western Canadian Sedimentary Basin (WCSB) in Canada is known for its extensive distribution of unconventional shale resources, which hold significant promise for the development of shale oil and gas reservoirs [2]. The Duvernay shale formation is considered to be among the source rock formations that originated in the WSCB during the Upper Devonian period.
The Duvernay shale formation possesses substantial oil and gas resources, including natural gas, liquid hydrocarbon, and crude oil. The estimated quantities of these resources are 23.22 × 10¹² m3, 115.54 × 10⁸ t, and 250.5 × 10⁸ t, respectively [3]. The measured average values for the shale matrix porosity and permeability in the Duvernay formation are only 0.065 and 394 nD, respectively [4]. Consequently, multistage hydraulic fracturing techniques have been employed to boost matrix permeability and facilitate commercial production. As of the end of the year 2020, the Duvernay formation witnessed the successful implementation of more than 1000 horizontal wells employing fracturing methods. Based on a statistical analysis of fracturing treatment, empirical evidence has revealed that the mean total pumped volume of fracturing fluids and the mean total mass of proppants deposited per well are 56,313 m3 and 7213 t, correspondingly [5]. Consequently, the mean shale gas production per well throughout an initial 12 month period attained a value of 483 million cubic feet [6]. The successful implementation of highly efficient stimulation techniques has greatly facilitated the practical utilization of the Duvernay shale formation, elevating its status to that of a globally renowned shale resource [7].
Nevertheless, the efficient and economic development of shale resources presents significant hurdles for the petroleum industry, primarily due to an intricate distribution of shale sweet spots and the substantial expenses associated with drilling and fracturing horizontal wells [8]. Numerous investigations have been undertaken to delineate the properties of shale reservoirs and forecast the output of shale formations. Some researchers combined the advantages of multicontinuum and discrete fracture/matrix (DFM) representations to adequately capture the effects of the multiscaled fracture system [9,10]. The findings of previous studies have indicated that the development of shale reservoirs is influenced by various elements, including reservoir petrophysics, geomechanics, and the occurrence of natural fractures and faults [11]. Hence, in order to accurately describe a shale reservoir, it is important to include many aspects of reservoir quality, such as petrophysics, geomechanics, and the presence of natural fractures and faults, during a study process [12,13]. However, limited scholarly investigations have been undertaken to integrate both a geologic study and engineering applications. Hence, it is imperative to use an integrated methodology to comprehensively characterize shale reservoirs and effectively facilitate their efficient and cost-effective exploitation.
The objective of this study is to present a comprehensive geological engineering approach for the characterization of the Duvernay shale reservoir near Crooked Lake, Alberta. Reservoir petrophysics is characterized through the utilization of core experiments. Furthermore, utilizing rock mechanical experiments and well-logging interpretations, we undertake the task of characterizing rock mechanics and principal stress tensors to create a comprehensive geomechanical model. Subsequently, the utilization of the focal processes of microseismicity is applied to discern extensive natural cracks and faults. Next, utilizing the previously described models, together with the data on perforation and treatment, a simulation of the expansion of complete three-dimensional hydraulic fracture networks is conducted to establish an unconventional fracture networks model. The history matching of horizontal well production is carried out and its accuracy is further validated by analyzing the production performance of fractured wells.

2. Field Background

The geographic area under investigation is near Crooked Lake, Alberta (Figure 1a), which is situated in the western portion of the Duvernay Shale Basin (Figure 1b) [2,14]. A hydraulic fracturing (HF) program consisting of four wells was conducted with the objective of exploiting the Duvernay shale formation [15,16]. This formation is situated below the Majeau Lake Formation and further beneath the Ireton Formation, as depicted in Figure 1c [17]. The Duvernay formation is found at a depth of 3820 m and has an estimated thickness of approximately 40 m, as determined from the interpretation of logging data from a prominent well (Figure 1d) [18].
The monitoring of the four-well HF program was conducted using a combination of a geophone array installed in shallow boreholes, broadband seismometers buried directly in the ground, and a strong-motion accelerometer, as illustrated in Figure 2a [15]. The University of Calgary conducted a research-oriented field program, known as the monitoring program, for a specific period from 25 October to 15 December 2016. A series of four horizontal wells denoted as H1, H2, H3, and H4 were drilled in a north–south orientation with the objective of targeting the Duvernay formation [16]. Table 1 summarizes the treatment information of four fracturing horizontal wells.
A total of 18,040 microseismicity events were identified, as a result of the comprehensive monitoring conducted by the seismological networks. A comprehensive microseismicity database may be accessed online via a prior research study [19]. Figure 2b displays the spatial and temporal perspectives of microseismicity. It is noteworthy to mention that the occurrence of microseismicity events exhibited a clustered distribution in proximity to certain fracturing stages. The occurrence of these events is commonly observed to have two predominant orientations: north–south and northeast–southwest. The dataset can be used to enhance the comprehension of the propagation of hydraulic fractures, together with the distribution of significant natural fractures or faults [20].
Furthermore, since 1 February 2017, these four HF wells have been actively extracting shale gas, with their respective gas production volumes being documented monthly (see Figure 2c). It is observed that, apart from the anomalous data resulting from the treatments, the gas production of the four wells exhibits a declining pattern. This trend suggests that the initial peak value, recorded at around 2140 e3m3 on 1 March 2017, has decreased to the present level of 350 e3m3 on 1 October 2022. The observed decline pattern could potentially be ascribed to the heterogeneity of the shale reservoir and the unique propagation of fractures in horizontal wells [21].

3. Methodology

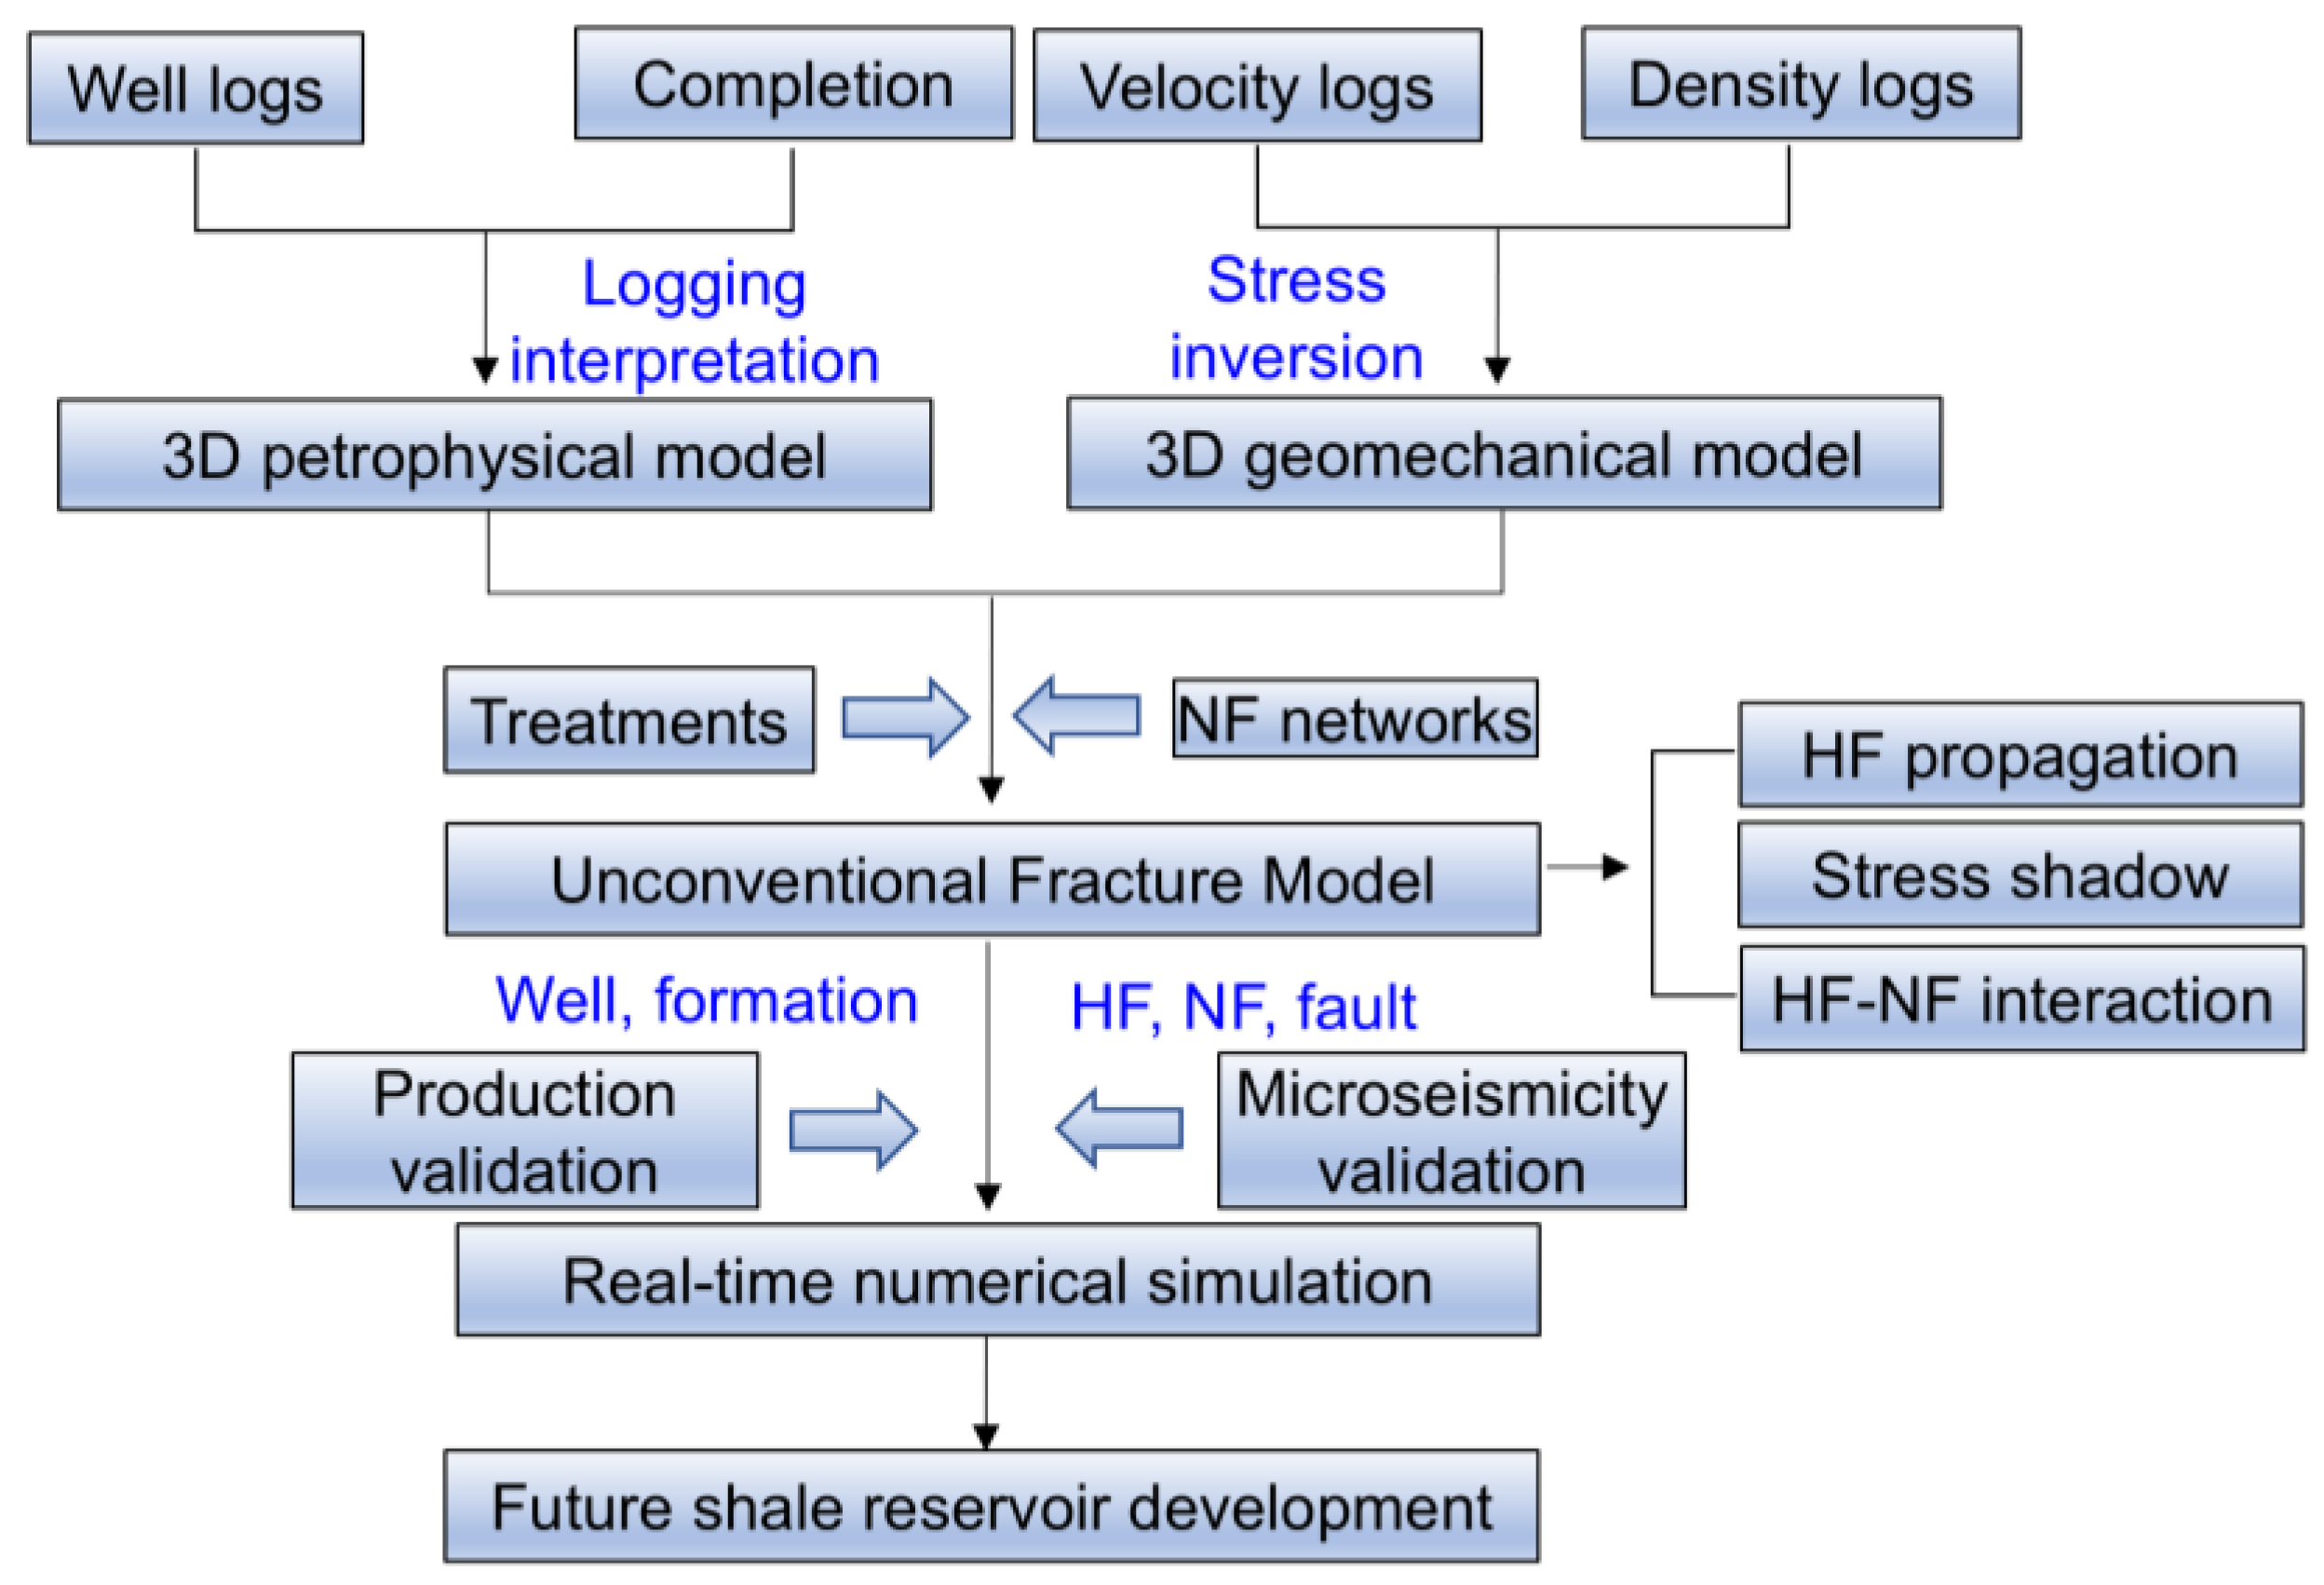
The present study introduces an integrated geological engineering approach for the purpose of characterizing the Duvernay shale reservoir. The characterization of reservoir petrophysics, such as porosity, permeability, and gas saturation, was conducted via the analysis of core experiments for the key well [22,23]. Furthermore, we developed a geomechanical model by characterizing elastic parameters (such as Poisson’s ratio and Young’s modulus) and in situ stress tensors (including vertical, minimum, and maximum principal stress) on the basis of rock mechanical tests and well-logging data. Subsequently, the utilization of microseismicity focal mechanisms was employed to detect significant natural fractures and faults on a larger scale within the region under investigation [5,24]. Subsequently, utilizing the models, together with the available completion and fracturing data, the simulation of complete 3D hydraulic fracture propagation was conducted to establish the unconventional fracture model (UFM) [25,26]. The UFM considers the typical process of hydraulic fracture propagation, together with the interactions that occur between hydraulic fractures and natural ones, and the interactions between nearby hydraulic fractures. Ultimately, numerical simulations were performed on horizontal wells, and these findings were then supported by the production performance of fractured wells. The methodology’s workflow is illustrated in Figure 3, with each individual step being comprehensively discussed below.

3.1. Reservoir Petrophysics and Geomechanics Features

The determination of correlations between well logs and petrophysical parameters was based on the analysis of core tests performed on the key well. The inferred porosity was obtained by utilizing the relationship between porosity measurements and acoustic logging from the key well [27,28]. The estimation of permeability was thereafter conducted by establishing a correlation between the core permeability and the porosity measurements. The petrophysical model was finally constructed using the Sequential Gaussian Simulation approach (SGS).
The rock’s mechanical properties, including Poisson’s ratio and Young’s modulus, were determined using the S-wave velocity and P-wave velocity logs, as demonstrated in Equations (1) and (2). The estimation of in situ stress tensors, encompassing the minimum and maximum principal stress, was conducted by utilizing the poroelastic horizontal strain model within an isotropic medium, as depicted in Equations (3) and (4) [29]. The geomechanical model was generated in a comparable manner via the Sequential Gaussian Simulation (SGS) approach.
P R = ( 0.5 × ( V P / V S ) 2 1 ) ( ( V P / V S ) 2 1 ) ,
Y M E = ρ V S 2 ( 3 V P 2 4 V S 2 ) ( V P 2 V S 2 ) ,
S h m i n = P R 1 P R × ( S V α P P ) + α P P + Y M E 1 P R 2 ε h + P R × Y M E 1 P R 2 ε H ,
S H m a x = P R 1 P R × ( S V α P P ) + α P P + Y M E 1 P R 2 ε H + P R × Y M E 1 P R 2 ε h ,
where Vs and Vp are S-wave velocity and P-wave velocity, respectively, m/s; ρ is rock density, g/cm3; PR is Poisson’s ratio (dimensionless); YME is Young’s modulus, GPa; Shmin and SHmax are the minimum and maximum horizontal principal stresses, MPa; Pp is formation pore pressure, MPa; α is the Biot coefficient (dimensionless); and εH and εh are the maximum and minimum tectonic strains, respectively (dimensionless).

3.2. Unconventional Fracturing Modeling

Utilizing the previously described models, along with the available fracturing data, the simulation of hydraulic fracture propagation was conducted to establish the UFM. The UFM considers the usual method of hydraulic fracture propagation, as well as the interactions that occur between hydraulic fractures and natural ones, together with the interactions that occur between neighboring hydraulic fractures. The prior literature documented the specifics of the UFM [25]. The utilization of the microseismicity event distribution was subsequently employed to validate the results obtained from the UFM analysis [26].
The utilization of the UFM proves to be more advantageous compared to a traditional pseudo-3D fracture model for addressing the challenges associated with fracturing fluid flow and elastic deformations inside unconventional fracture networks. Equation (6) presented below illustrates the fundamental equations of mass conservation, as expressed by [25]:
q S + ( H f l w a v g ) t + Q L = 0   ( Q L = 2 h l o μ l o ) ,
where q is the flowing rate, m3/s; w a v g is the average fracture width, m; H f l is the fluid-filled fracture height, m; and Q L is the twice value of the leak-off velocity μ l o multiplying leak-off height h l o .
The rheological behavior of fracturing fluid within hydraulic fractures beneath the ground is characterized by two distinct flow regimes: Darcy’s flow and laminar flow. The regulations governing these flows are determined by Equations (7) and (8) as stated in a prior study [26]:
p S = α 0 1 w ¯ 2 n 0 + 1   q H f l | q H f l | n 0 1 ( L a m i n a r ) ,
α 0 = 2 K 0 Φ ( n 0 ) n 0 ( 4 n 0 + 2 n 0 ) n 0 ;   Φ ( n 0 ) = 1 H f l H f l ( w ( z ) w ¯ ) 2 n 0 + 1 n 0 d z ,
where K0 and n0 are a consistency index and a power-law index, respectively (dimensionless); w(z) is the fracture width at a depth of z, m; and f is the Fanning friction index constricted by the turbulent flow (dimensionless).
Moreover, the aggregate quantity of fracturing fluids corresponds to the volume of fluid contained inside the UFM, a portion of which escapes into the surrounding geological formation. The boundary conditions imposed at fracture locations are defined by the net pressure and zero flow rate. The subsequent equation, denoted as Equation (9), represents the governing equation to characterize the physical process above:
0 t q ( t ) d t = 0 L ( t ) h ( s , t ) w ¯ ( s , t ) d s + H L 0 t 0 L ( t ) 2 μ L d s d t d h l o ,
The phenomenon known as “stress shadow” is intricately linked to the interplay of adjacent hydraulic cracks. The quantification of stress shadow effects is necessary as they play a significant role in the UFM. The displacements of hydraulic fractures in close proximity, namely the opening and shearing displacements, have a significant impact on the stress tensors of the hydraulic fracture. The additional shear stress ( τ s i ) and normal stresses ( σ n i ) induced on a hydraulic fracture due to the presence of adjacent hydraulic fractures were determined using the model proposed by Crouch and Starfield. This was achieved by applying Equations (10) and (11) as outlined in prior studies [26].
σ n i = j = 1 N A i j C n s i j D s j + j = 1 N A i j C n n i j D n j ,
  τ s i = j = 1 N A i j C s s i j D s j + j = 1 N A i j C s n i j D n j ,
where Aij is the 3D correction factor (dimensionless); Cij is the 2D elastic influence coefficient (dimensionless).
The identification of natural fractures and faults often relies on the analysis of localized processes of microseismicity. This approach is commonly used to detect and characterize significant natural fractures and faults at a larger scale. The focal strike of mainshocks provides insight into the alignment of pre-existing faults [30]. The spatial arrangement of microseismic activity indicates the structural configuration of the corresponding faults and/or natural fractures [14].
Hydraulic fracturing has the potential to intersect, impede, or widen pre-existing natural fractures. The computation of the average apertures ( W ¯ ) of hydraulic fractures at a junction site between a natural fracture (NF) and a hydraulic fracture (HF) with a given half-length (L) and height (H) was performed using Equation (12) [31]. The calculation of the average fluid pressure pNF(t) at a specific time t within the NF can be determined using Equation (13) once the fluids have successfully infiltrated the system [32].
W ¯ = 2.53 [ ( 1 P R s 2 ) q μ f L 2 Y M E s H ] 1 / 4 ,
p N F ( t ) = p f t a n h ( 2 k n f p f μ b s 2 t ) ,
where Q is injection rate, m3/s; μ is fluid viscosity, mPa·s; P R s is Poisson’s ratio (dimensionless); and Y M E s is Young’s modulus, GPa; p f is the pressure of fracturing fluids at the fracture tip, MPa; and k is the permeability of the natural fracture, mD.

3.3. Production Prediction via Reservoir Simulation

The fracture apertures inside shale reservoirs are characterized by their tiny size, resulting in fluid flow that can be effectively modeled as one-dimensional flow. The equations governing mass conservation for the phase fluids present in both the fracture and matrix regions are as follows [26]:
ϕ f ρ α S f , α t + ρ α v f , α τ f ρ α q f m , α w f = 0 ,
ϕ m ρ α S m , α t + · ρ α v m , α + ρ α q f m , α δ ( r τ f ) = 0 ,
v f , α = K f K f , r α μ α f p f , α τ f ,
v m , α = K m K m , r α μ α p m , α ,
where w f is fracture width, m; τ f is fracture strike; q f m , α is fluid flow rate from a fracture of unit length into the matrix per unit time, m3/(m·s); v f , α ,   v m , α are fluid flow rate in the fracture and matrix, respectively, m/s; ρ α is fluid density, kg/m3; μ α   is fluid viscosity, mPa·s; ϕ f ,   ϕ m   are porosity in fracture and matrix, respectively; K f ,   K m are absolute permeability in fracture and matrix, respectively, mD; K f , r α ,   K m , r α are relative permeability in fracture and matrix, respectively; p f , α ,   p m , α   are fluid pressure in fracture and matrix, respectively, MPa; S f , α , S m , α   are fluid saturation in fracture and matrix, respectively; δ is Kronecker function; ∇ is Laboulas operator; and t is time, s.
The production forecast using the UFM method, as described in the aforementioned expressions, was performed using the Petrel 2022 INTERSECT program. The study involved the utilization of numerical simulations to analyze the behavior of four horizontal wells. These simulations are based on models that incorporate petrophysics and geomechanics principles, together with the development of natural fractures and faults [33,34]. The accuracy of the predicted outcomes is additionally supported by the production performance observed in wells that have undergone fracturing [35,36]. The degree of similarity between the expected and actual field output will serve as an indicator of the accuracy of the integrated Geo-Engineering method [37,38,39,40].

4. Results and Discussion

4.1. Reservoir Petrophysics and Geomechanics Characterization

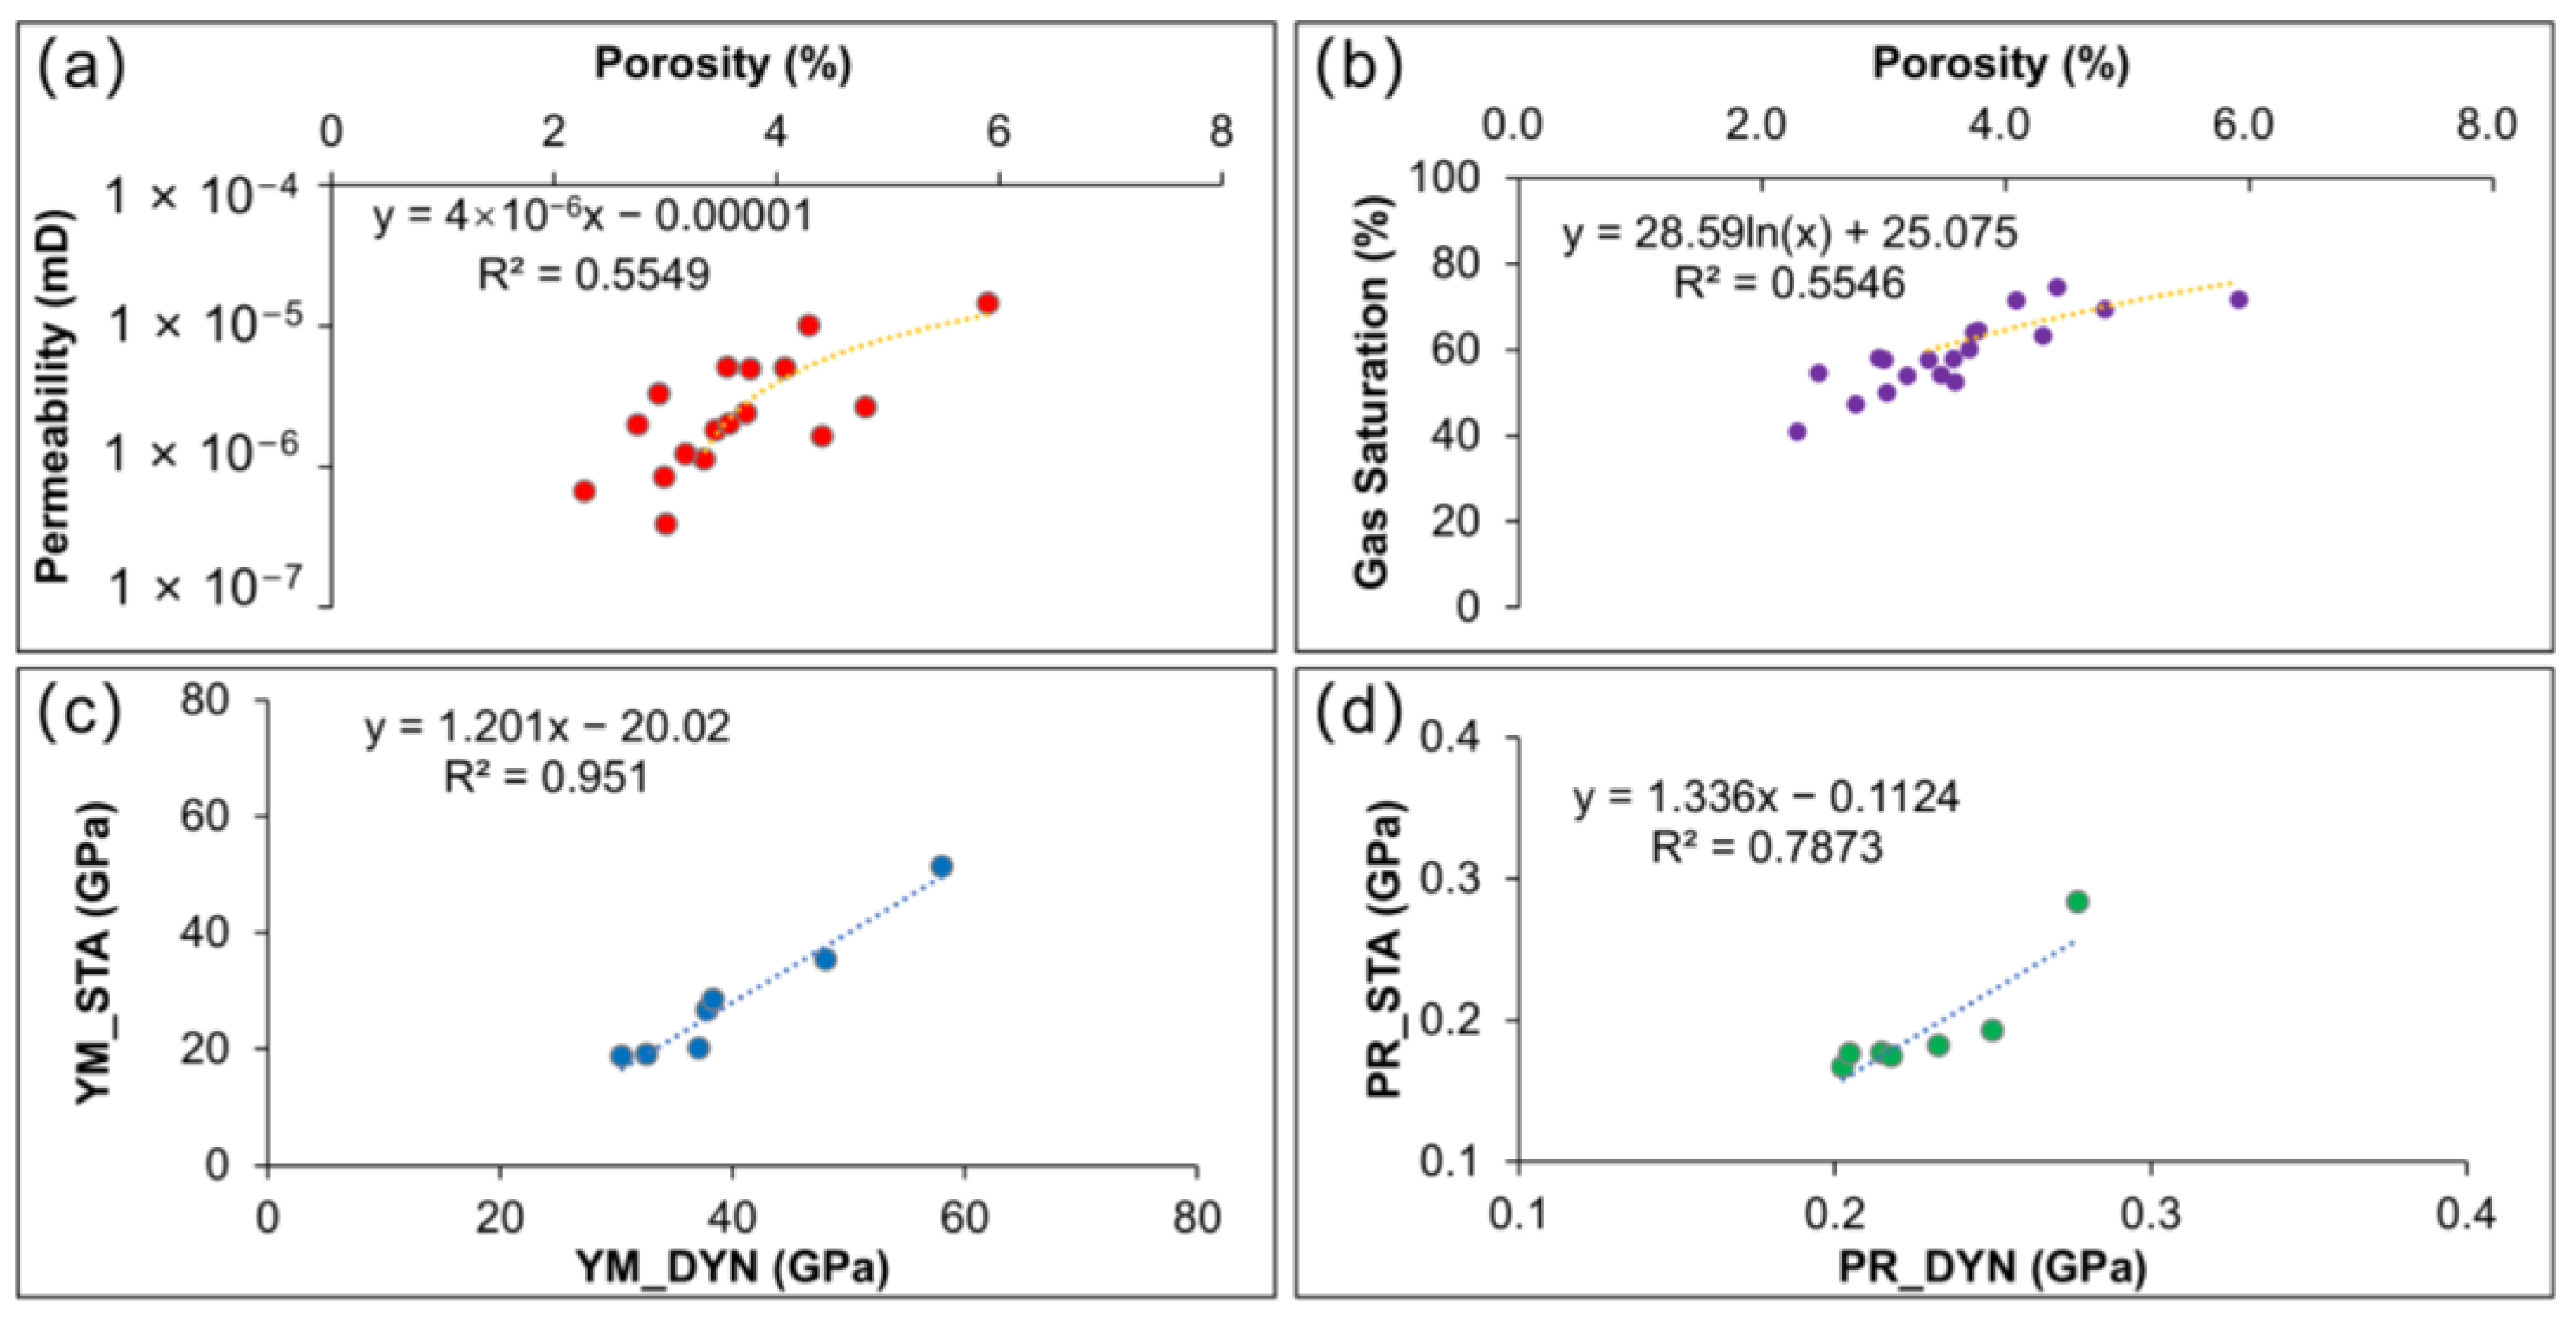
The petrophysics and geomechanics measurements of the key well and the relationships between the two parameters are shown in Figure 4. Petrophysical experiment analysis of the key well indicates rock porosity, permeability, and gas saturation cover the range of 2.28~5.91%, 3.86 × 10⁻⁷~1.43 × 10⁻⁵, and 41~74.6%, respectively. Meanwhile, geomechanics experiment analysis suggests that Young’s modulus and Poisson’s ratio have a range of 18.62~61.39 GPa and 0.167~0.283, respectively. It is also noted that both rock permeability and gas saturation have a positive non-linear relationship with porosity (Figure 4a,b). Meanwhile, the static Young’s modulus and Poisson’s ratio have a linear relationship with the dynamic ones, respectively (Figure 4c,d). Such relationships of rock properties will lay a foundation for the subsequent reservoir petrophysics and geomechanics characterization.
The inferred porosity was determined by applying Equation (17) to the porosity measurements and acoustic logging data obtained from the main well depicted in Figure 1. The inferred permeability was subsequently determined using Equation (18), which represents the correlation between core permeability and porosity measurements (Figure 5). Similarly, the determination of Poisson’s ratio and Young’s modulus is based on velocity logs, utilizing Equations (1) and (2). The determination of the lower and upper bounds of the major stress was derived by utilizing geomechanical parameters, as outlined in Equations (4) through (5) (Figure 5). Furthermore, it was also possible to derive the porosity and permeability of additional wells by utilizing the aforementioned formula. The petrophysical model was created using the Sequential Gaussian Simulation (SGS) method, as depicted in Figure 6a,b. Similarly, the geomechanical model was constructed using the SGS approach in a comparable manner, as shown in Figure 6c–f.
The petrophysical characteristics of Duvernay shale exhibit a diverse pattern regarding the magnitude of petrophysical parameters, suggesting significant regional heterogeneity of these parameters (Figure 6). The petrophysical tests for the main well indicated that the average reservoir porosity and permeability are 7.0% and 562.5 nD, respectively. The rock’s mechanical properties, such as Poisson’s ratio and Young’s modulus, were determined by rock mechanical experiments, yielding average values of 0.28 and 46.8 GPa, respectively. The average values of the in situ stress tensors, specifically the minimum principal stress and maximum principal stress, were 68.8 and 93.7 MPa, respectively. Such reservoir petrophysics and geomechanical models will provide a solid geological basis for subsequent fracture modeling.
P O R = 0.024522 ×   DT   1.1345
PERM = 20.32   ×   P O R 1.656

4.2. Unconventional Fracturing Model

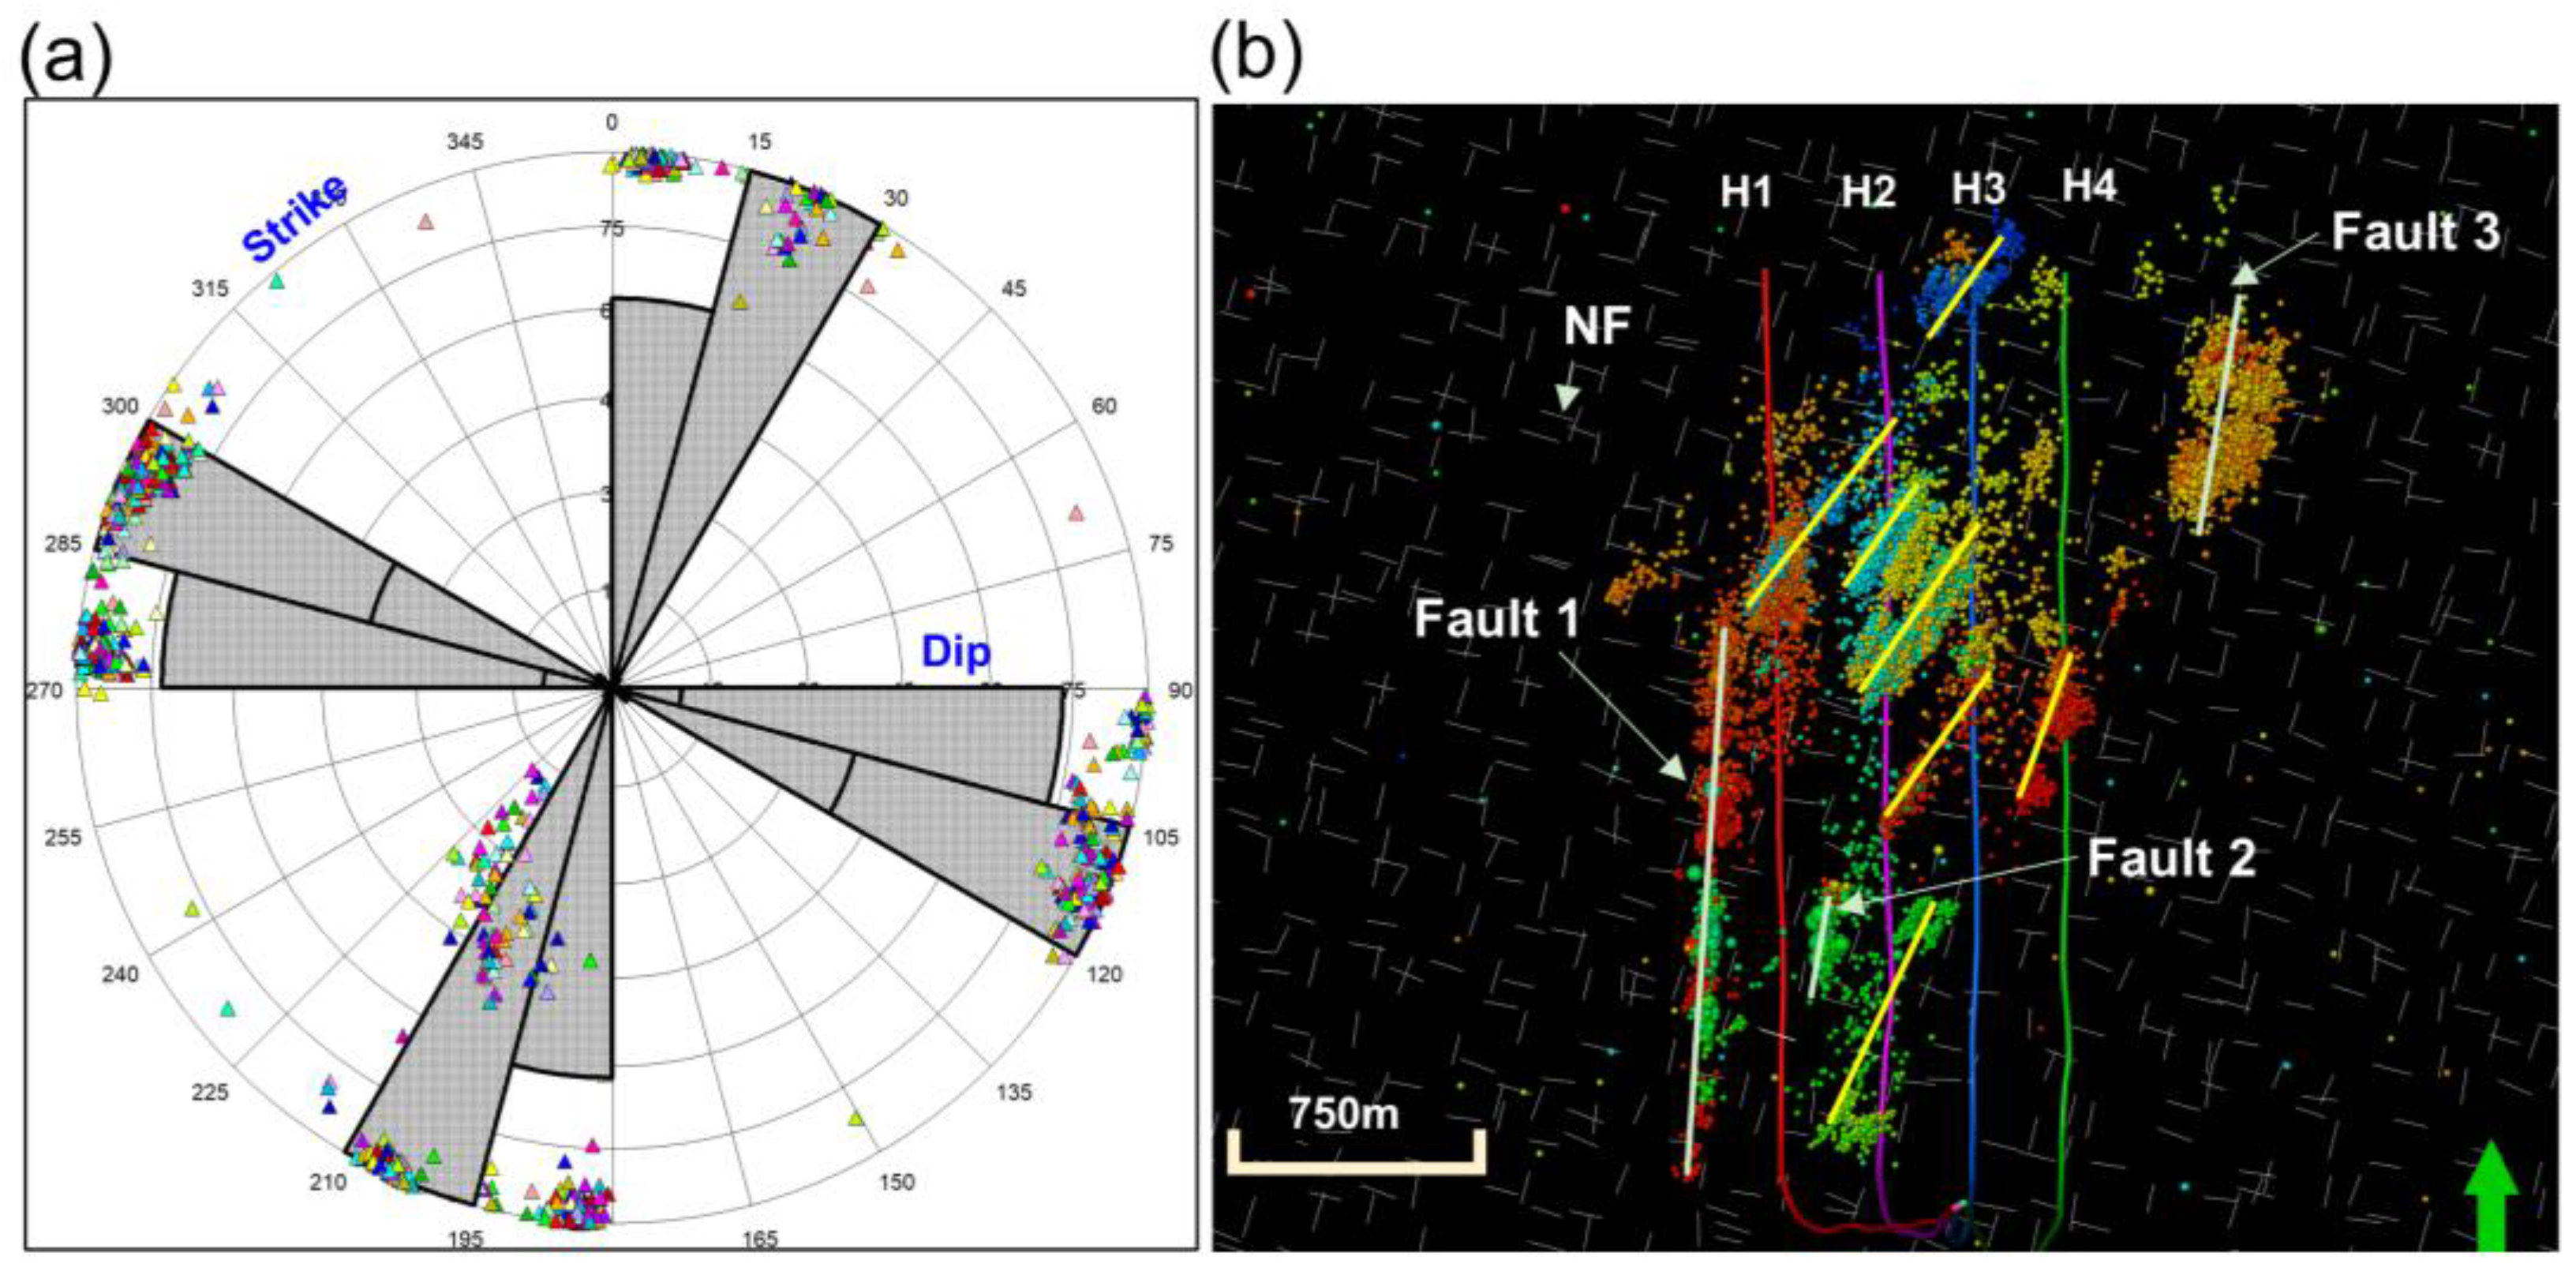
The analysis of induced events indicates that the natural fractures in the studied area were influenced by two distinct tectonic periods, resulting in the development of fractures with average dip azimuths of NE15° and NW285°, as shown in Figure 7a. The analysis of picture logs revealed that the natural fracture intensity was measured to be 0.05 m2/m3, while the linear density of natural fractures was found to be 1.51 m−1. The dimensions of the fracture space have been calculated to be 100 ± 50 m. The spatial distribution of inferred natural fractures is illustrated in Figure 7b.
Moreover, the linear dispersion of induced events has resulted in the acknowledgment of pre-existing faults. As depicted in Figure 7b, the presence of white lineaments in proximity to significant seismic events (often exceeding a magnitude of 2.0) suggests the existence of presumed fault structures. It has been observed that three inferred faults exhibit a predominant orientation trending in a nearly north–south direction. In contrast, the presence of yellow markers in conjunction with minor seismic events, often measuring less than 1.0 in magnitude, may indicate the possibility of hydraulic fractures. The reason for this is that these events exhibit an orientation of NE43°, which aligns with the maximum principal stress orientation and hence suggests the presence of inferred hydraulic fractures. Furthermore, the mechanical parameters of the natural fractures or faults used in this manuscript are 0.8 MPa/m in fracture/fault normal stiffness while 0.4 MPa/m. The cohesion and fraction angle are 1 MPa and 22.5 degree, respectively. Figure 7b depicts the spatial arrangement of inferred faults and some related hydraulic fractures.
The simulation of constructing the UFM for horizontal wells involves hydraulic fracture propagation, as described by Equations (5)–(12). Figure 8 depicts the dynamic representation of the UFM in conjunction with the stage completions of four horizontal wells from 30 October 2016 to 9 December 2016. The utilization of a zipper fracture pattern was observed in the deployment of the four horizontal wells. For example, Table 2 lists the simulated HF results of stage 15 for Well H4. Prior to 9 November 2016, there were no instances of pre-existing faults being reactivated. Only microseismicity events took place, which delineated the extent of hydraulic fractures as seen in Figure 8a,b. Since 9 December 2016, a series of pre-existing faults have been reactivated in a consecutive manner coinciding with the completion of the four horizontal wells. The data presented in Figure 8g–i indicate that Fault 1 could potentially be classified as a barrier fault, given there is a limited occurrence of hydraulic fractures from the H1 well that have crossed this fault. In contrast, Fault 2 might potentially be classified as a conduit fault due to the presence of numerous hydraulic fractures observed in the H1 and H2 wells (Figure 8d–i). The reactivation of Fault 3 has been ascribed to certain hydraulic fractures associated with H4 (Figure 8f–i). Additionally, the spread of hydraulic fractures is mostly influenced by the existence of pre-existing natural fractures (Figure 8a–i). Ultimately, the UFM serves as the foundation for the ensuing reservoir simulation of the four horizontal wells.

4.3. UFM-Based Production Prediction Results

The production history matching work was carried out by integrating calculations with the Petrel INTERSECT program, a reservoir numerical simulator known for its accuracy and efficiency, based on geology and geomechanical models, together with the UFM. The hydraulic fractures of four horizontal wells have been converted into a 3D discrete fracture network (DFN) model within the Petrel 2022 KINETIX program, as depicted in Figure 9a. The grids surrounding hydraulic fractures have been refined in order to obtain improved simulation outcomes. The prescribed values for the fracture cell width, minimum zone height, and unpropped conductivity are 7 m, 3.048 m, and 1.00 mD.m, respectively. The dimensions of the grid cells have been established as 50 m × 50 m in both the x and y directions. The grid angle has been configured to NE 43° in accordance with the propagation orientation of hydraulic fractures, as depicted in Figure 9b. The incorporation of parameters related to fluids, shale matrix, and fractures into the Petrel INTERSECT program has been performed based on the geological model and treatment data.
The final results of the UFM-based production prediction for the four horizontal wells are shown in Figure 10 through Figure 11. It is worth noting that the predicted bottom pressure matches well with the observed one in Figure 10, with an accordance rate of more than 86%. Furthermore, the simulated production performance exhibits a declining pattern in Figure 11, in line with the actual one. Except for certain operational aspects, the concordance between the simulation findings and production performance exceeds 89%, thereby proving the efficacy of this integrated approach in the development of shale gas. The predicted production data after 2022/10 can be used for further validation after obtaining the updated production data. The present study establishes a robust basis for the identification of suitable locations and the optimization of fracturing job sizes for forthcoming horizontal well installations in the prospective expansion of shale gas and oil reserves. This workflow can potentially be extended to other non-traditional shale sources to optimize the extraction of shale gas and oil.

5. Conclusions

The present study presents a comprehensive Geo-Engineering approach for the characterization of the Duvernay shale reservoir in the vicinity of the Crooked Lake area. The conclusions were derived in the following manner:
(1) Petrophysical studies determined the average porosity and permeability of the reservoir to be 7.0% and 562.5 nD, respectively. The average values of Poisson’s ratio and Young’s modulus were estimated to be 0.28 and 46.8 GPa, respectively, through triaxial compression experiments. The minimum principal stress was recorded at 68.8 MPa, while the maximum principal stress was measured at 93.7 MPa.
(2) The pre-existing natural fractures in the studied area were shown to have been influenced by two distinct tectonic events, resulting in the development of fractures with average dip azimuths of NE15° and SE285°, respectively. Based on the pattern of microseismicity, three pre-existing faults have been discovered.
(3) The UFM model was developed to effectively describe the intricate propagation of hydraulic fracture networks, taking into account the heterogeneity of the reservoir and the influence of stress shadows between various stages. The hydraulic fracture propagation outcomes were consistent with the spatial distribution of 18,040 microseismic events.
(4) Numerical simulations were performed to analyze well productivity, utilizing geological and geomechanical models. The concordance between the outcomes of the simulation and the actual performance in production surpasses 89%, signifying the efficacy of this integrated approach in the advancement of shale gas extraction.

Author Contributions

W.H.: Conceptualization, Methodology, Formal analysis, Investigation, Writing—original draft. P.W.: Conceptualization, Methodology, Formal analysis, Investigation. G.H.: Methodology, Formal analysis, Writing—review and editing. X.K.: Validation, Formal analysis. Y.J.: Software, Formal analysis. L.H.: Formal analysis, Investigation. Y.B.: Validation, Formal analysis. Z.P.: Investigation, Formal analysis. Y.L.: Software, Formal analysis. F.Y.: Software, Formal analysis. P.B.: Formal analysis, Investigation. Y.Z.: Software, Investigation. All authors have read and agreed to the published version of the manuscript.

Funding

This research was funded by the Science Foundation of China University of Petroleum, Beijing (No. 2462023BJRC001).

Data Availability Statement

The well completion, well logs, core experiments, and production data used in this work are obtained from the geoSCOUT database (https://www.geologic.com/geoscout/ (accessed on 1 August 2024)).

Acknowledgments

We acknowledge the support from Hai Wang and Muming Wang at the University of Calgary.

Conflicts of Interest

Authors Wensong Huang, Ping Wang, Xiangwen Kong and Yuepeng Jia were employed by the company China National Petroleum Corporation. Author Lei Huang was employed by the company China National Oil and Gas Exploration and Development Corporation. Author Yufei Bai was employed by the company CNPC Greatwall Drilling Company. The remaining authors declare that the research was conducted in the absence of any commercial or financial relationships that could be construed as a potential conflict of interest.

References

  1. IEA. Natural Gas Information: Overview; IEA: Paris, France, 2021; Available online: https://www.iea.org/reports/natural-gas-information-overview (accessed on 1 September 2024).
  2. Dunn, L.; Schmidt, G.; Hammermaster, K.; Brown, M.; Bernard, R.; Wen, E.; Befus, R.; Gardiner, S. The Duvernay Formation (Devo-nian): Sedimentology and reservoir characterization of a shale gas/liquids play in Alberta. In Proceedings of the GeoConvention 2012: Vision, Calgary, AB, Canada, 14–18 May 2012. [Google Scholar]
  3. Lyster, S.; Corlett, H.J.; Berhane, H. Hydrocarbon Resource Potential of the Duvernay Formation in Alberta—Update; AER/AGS Open-file Report 2017-02; Energy Resources Conservation Board: Edmonton, AB, Canada, 2017; 44p. [Google Scholar]
  4. Zhang, H.; Eaton, D.W.; Rodriguez, G.; Jia, S.Q. Source-Mechanism Analysis and Stress Inversion for Hydraulic-Fracturing-Induced Event Sequences near Fox Creek, Alberta. Bull. Seismol. Soc. Am. 2019, 109, 636–651. [Google Scholar] [CrossRef]
  5. Hui, G.; Chen, S.; He, Y.; Wang, H.; Gu, F. Machine Learning-Based Production Forecast for Shale Gas in Unconventional Reservoirs via Integration of Geological and Operational Factors. J. Nat. Gas Sci. Eng. 2021, 94, 104045. [Google Scholar] [CrossRef]
  6. Wang, S.; Chen, S. Insights to Fracture Stimulation Design in Unconventional Reservoirs Based on Machine Learning Modeling. J. Pet. Sci. Eng. 2019, 174, 682–695. [Google Scholar] [CrossRef]
  7. Li, Q.; Chen, M.; Fred, P.W.; Jin, Y.; Li, Z. Influences of engineering factors on shale gas productivity: A case study from the Haynesville shale gas reservoir in North America. Nat. Gas Ind. 2012, 32, 54–59. [Google Scholar]
  8. Kong, B.; Chen, S.; Chen, Z.; Zhou, Q. Bayesian Probabilistic Dual-Flow-Regime Decline Curve Analysis for Complex Production Profile Evaluation. J. Pet. Sci. Eng. 2020, 195, 107623. [Google Scholar] [CrossRef]
  9. Zhao, J.; Jin, L.; Azzolina, N.A.; Wan, X.; Yu, X.; Sorensen, J.A.; Kurz, B.A.; Bosshart, N.W.; Smith, S.A.; Wu, C.; et al. Investigating Enhanced Oil Recovery in Unconventional Reservoirs Based on Field Case Review, Laboratory, and Simulation Studies. Energy Fuels 2022, 36, 14771–14788. [Google Scholar] [CrossRef]
  10. Jiang, J.; Younis, R.M. Hybrid Coupled Discrete-Fracture/Matrix and Multicontinuum Models for Unconventional-Reservoir Simulation. SPE J. 2016, 21, 1009–1027. [Google Scholar] [CrossRef]
  11. Hui, G.; Chen, S.; Gu, F. Strike–Slip Fault Reactivation Triggered by Hydraulic-Natural Fracture Propagation during Fracturing Stimulations near Clark Lake, Alberta. Energy Fuels 2024, 38, 18547–18555. [Google Scholar] [CrossRef]
  12. Hui, G.; Chen, Z.; Wang, Y.; Zhang, D.; Gu, F. An integrated machine learning-based approach to identifying controlling factors of unconventional shale productivity. Energy 2023, 266, 126512. [Google Scholar] [CrossRef]
  13. Pawley, S.; Schultz, R.; Playter, T.; Corlett, H.; Shipman, T.; Lyster, S.; Hauck, T. The Geological Susceptibility of Induced Earthquakes in the Duvernay Play. Geophys. Res. Lett. 2018, 45, 1786–1793. [Google Scholar] [CrossRef]
  14. Hui, G.; Chen, Z.; Schultz, R.; Chen, S.; Song, Z.; Zhang, Z.; Song, Y.; Wang, H.; Wang, M.; Gu, F. Intricate Unconventional Fracture Networks Provide Fluid Diffusion Pathways to Reactivate Pre-Existing Faults in Unconventional Reservoirs. Energy 2023, 282, 128803. [Google Scholar] [CrossRef]
  15. Eaton, D.W.; Igonin, N.; Poulin, A.; Weir, R.; Zhang, H.; Pellegrino, S.; Rodriguez, G. Induced Seismicity Characterization during Hydraulic-Fracture Monitoring with a Shallow-Wellbore Geophone Array and Broadband Sensors. Seismol. Res. Lett. 2018, 89, 1641–1651. [Google Scholar] [CrossRef]
  16. Weir, R.; Lawton, D.; Lines, L.; Eyre, T.; Eaton, D. Application of Structural Interpretation and Simultaneous Inversion to Reservoir Characterization of the Duvernay Formation, Fox Creek, Alberta, Canada. Lead. Edge 2019, 38, 151–160. [Google Scholar] [CrossRef]
  17. Creaney, S.; Allan, J. Hydrocarbon Generation and Migration in the Western Canada Sedimentary Basin. Geol. Soc. Lond. Spec. Publ. 1990, 50, 189–202. [Google Scholar] [CrossRef]
  18. Li, G.; Luo, K.; Shi, D. Key Technologies, Engineering Management and Important Suggestions of Shale Oil/Gas Development: Case Study of a Duvernay Shale Project in Western Canada Sedimentary Basin. Pet. Explor. Dev. 2020, 47, 791–802. [Google Scholar] [CrossRef]
  19. Igonin, N.; Verdon, J.P.; Kendall, J.-M.; Eaton, D.W. Large-Scale Fracture Systems Are Permeable Pathways for Fault Activation During Hydraulic Fracturing. JGR Solid Earth 2021, 126, e2020JB020311. [Google Scholar] [CrossRef]
  20. Hui, G.; Chen, Z.; Chen, S.; Gu, F. Hydraulic fracturing-induced seismicity characterization through coupled modeling of stress and fracture-fault systems. Adv. Geo-Energy Res. 2022, 6, 269–270. [Google Scholar] [CrossRef]
  21. Chen, S.; Zhu, Y.; Wang, H.; Liu, H.; Wei, W.; Fang, J. Shale Gas Reservoir Characterisation: A Typical Case in the Southern Sichuan Basin of China. Energy 2011, 36, 6609–6616. [Google Scholar] [CrossRef]
  22. Tong, X.; Zhang, G.; Wang, Z.; Wen, Z.; Tian, Z.; Wang, H.; Ma, F.; Wu, Y. Distribution and Potential of Global Oil and Gas Resources. Pet. Explor. Dev. 2018, 45, 779–789. [Google Scholar] [CrossRef]
  23. Hui, G.; Chen, Z.; Yan, J.; Wang, M.; Wang, H.; Zhang, D.; Gu, F. Integrated Evaluations of High-Quality Shale Play Using Core Experiments and Logging Interpretations. Fuel 2023, 341, 127679. [Google Scholar] [CrossRef]
  24. Wozniakowska, P.; Eaton, D.W. Machine Learning-Based Analysis of Geological Susceptibility to Induced Seismicity in the Montney Formation, Canada. Geophys. Res. Lett. 2020, 47, e2020GL089651. [Google Scholar] [CrossRef]
  25. Weng, X.; Kresse, O.; Cohen, C.; Wu, R.; Gu, H. Modeling of Hydraulic-Fracture-Network Propagation in a Naturally Fractured Formation. SPE Prod. Oper. 2011, 26, 368–380. [Google Scholar]
  26. Weng, X.; Kresse, O.; Chuprakov, D.; Cohen, C.-E.; Prioul, R.; Ganguly, U. Applying Complex Fracture Model and Integrated Workflow in Unconventional Reservoirs. J. Pet. Sci. Eng. 2014, 124, 468–483. [Google Scholar] [CrossRef]
  27. Hui, G.; Chen, Z.-X.; Wang, H.; Song, Z.-J.; Wang, S.-H.; Zhang, H.-L.; Zhang, D.-M.; Gu, F. A Machine Learning-Based Study of Multifactor Susceptibility and Risk Control of Induced Seismicity in Unconventional Reservoirs. Pet. Sci. 2023, 20, 2232–2243. [Google Scholar] [CrossRef]
  28. Shen, L.W.; Schmitt, D.R.; Haug, K. Quantitative Constraints to the Complete State of Stress from the Combined Borehole and Focal Mechanism Inversions: Fox Creek, Alberta. Tectonophysics 2019, 764, 110–123. [Google Scholar] [CrossRef]
  29. Konstantinovskaya, E.; Li, Q.; Zhmodik, A.; Ibelegbu, C.; Schultz, R.; Shipman, T. Lateral Fluid Propagation and Strike Slip Fault Reactivation Related to Hydraulic Fracturing and Induced Seismicity in the Duvernay Formation, Fox Creek Area, Alberta. Geophys. J. Int. 2021, 227, 518–543. [Google Scholar] [CrossRef]
  30. Wang, R.; Wang, G.; Zhao, G.; Qian, M.; Liu, Y.; He, W.; Li, Z. Geological Characteristics and Resources Potential of Shale Oil in Chang 7 Member of Upper Triassic Yanchang Formation in Fuxian Area, Southern Ordos Basin, Western China. Unconv. Resour. 2023, 3, 237–247. [Google Scholar] [CrossRef]
  31. Valkó, P.; Economides, M.J. Performance of Fractured Horizontal Wells in High-Permeability Reservoirs. In Proceedings of the SPE Formation Damage Control Symposium, SPE, Lafayette, Louisiana, 14 February 1996; p. SPE-31149-MS. [Google Scholar]
  32. Wu, M.; Jiang, C.; Song, R.; Liu, J.; Li, M.; Liu, B.; Shi, D.; Zhu, Z.; Deng, B. Comparative Study on Hydraulic Fracturing Using Different Discrete Fracture Network Modeling: Insight from Homogeneous to Heterogeneity Reservoirs. Eng. Fract. Mech. 2023, 284, 109274. [Google Scholar] [CrossRef]
  33. Davies, R.J.; Mathias, S.A.; Moss, J.; Hustoft, S.; Newport, L. Hydraulic Fractures: How Far Can They Go? Mar. Pet. Geol. 2012, 37, 1–6. [Google Scholar] [CrossRef]
  34. Song, R.; Liu, J.; Yang, C.; Sun, S. Study on the Multiphase Heat and Mass Transfer Mechanism in the Dissociation of Methane Hydrate in Reconstructed Real-Shape Porous Sediments. Energy 2022, 254, 124421. [Google Scholar] [CrossRef]
  35. Du, J.; Liu, H.; Ma, D.; Fu, J.; Wang, Y.; Zhou, T. Discussion on Effective Development Techniques for Continental Tight Oil in China. Pet. Explor. Dev. 2014, 41, 217–224. [Google Scholar] [CrossRef]
  36. Guo, X.; Wu, K.; Killough, J.; Tang, J. Understanding the Mechanism of Interwell Fracturing Interference with Reservoir/Geomechanics/Fracturing Modeling in Eagle Ford Shale. SPE Reserv. Eval. Eng. 2019, 22, 842–860. [Google Scholar] [CrossRef]
  37. Hu, S.; Zhu, R.; Wu, S.; Bai, B.; Yang, Z.; Cui, J. Exploration and Development of Continental Tight Oil in China. Pet. Explor. Dev. 2018, 45, 790–802. [Google Scholar] [CrossRef]
  38. Wan, Y.; Li, Z.; Lu, B. The development of Fayetteville shale play and its implications. Nat. Gas Geosci. 2019, 30, 1655–1666. [Google Scholar]
  39. Zou, C.; Pan, S.; Jing, Z.; Gao, J.; Yang, Z.; Wu, S.; Zhao, Q. Shale oil and gas revolution and its impact. Acta Pet. Sin. 2020, 41, 1–12. [Google Scholar]
  40. Zhao, W.; Xia, M.; Zhang, Y.; Zhang, F.; Zhang, Y.; Zhu, H. Current situation and progress of shale gas exploration and development in Canada. Int. Pet. Econ. 2013, 21, 41–46. [Google Scholar]
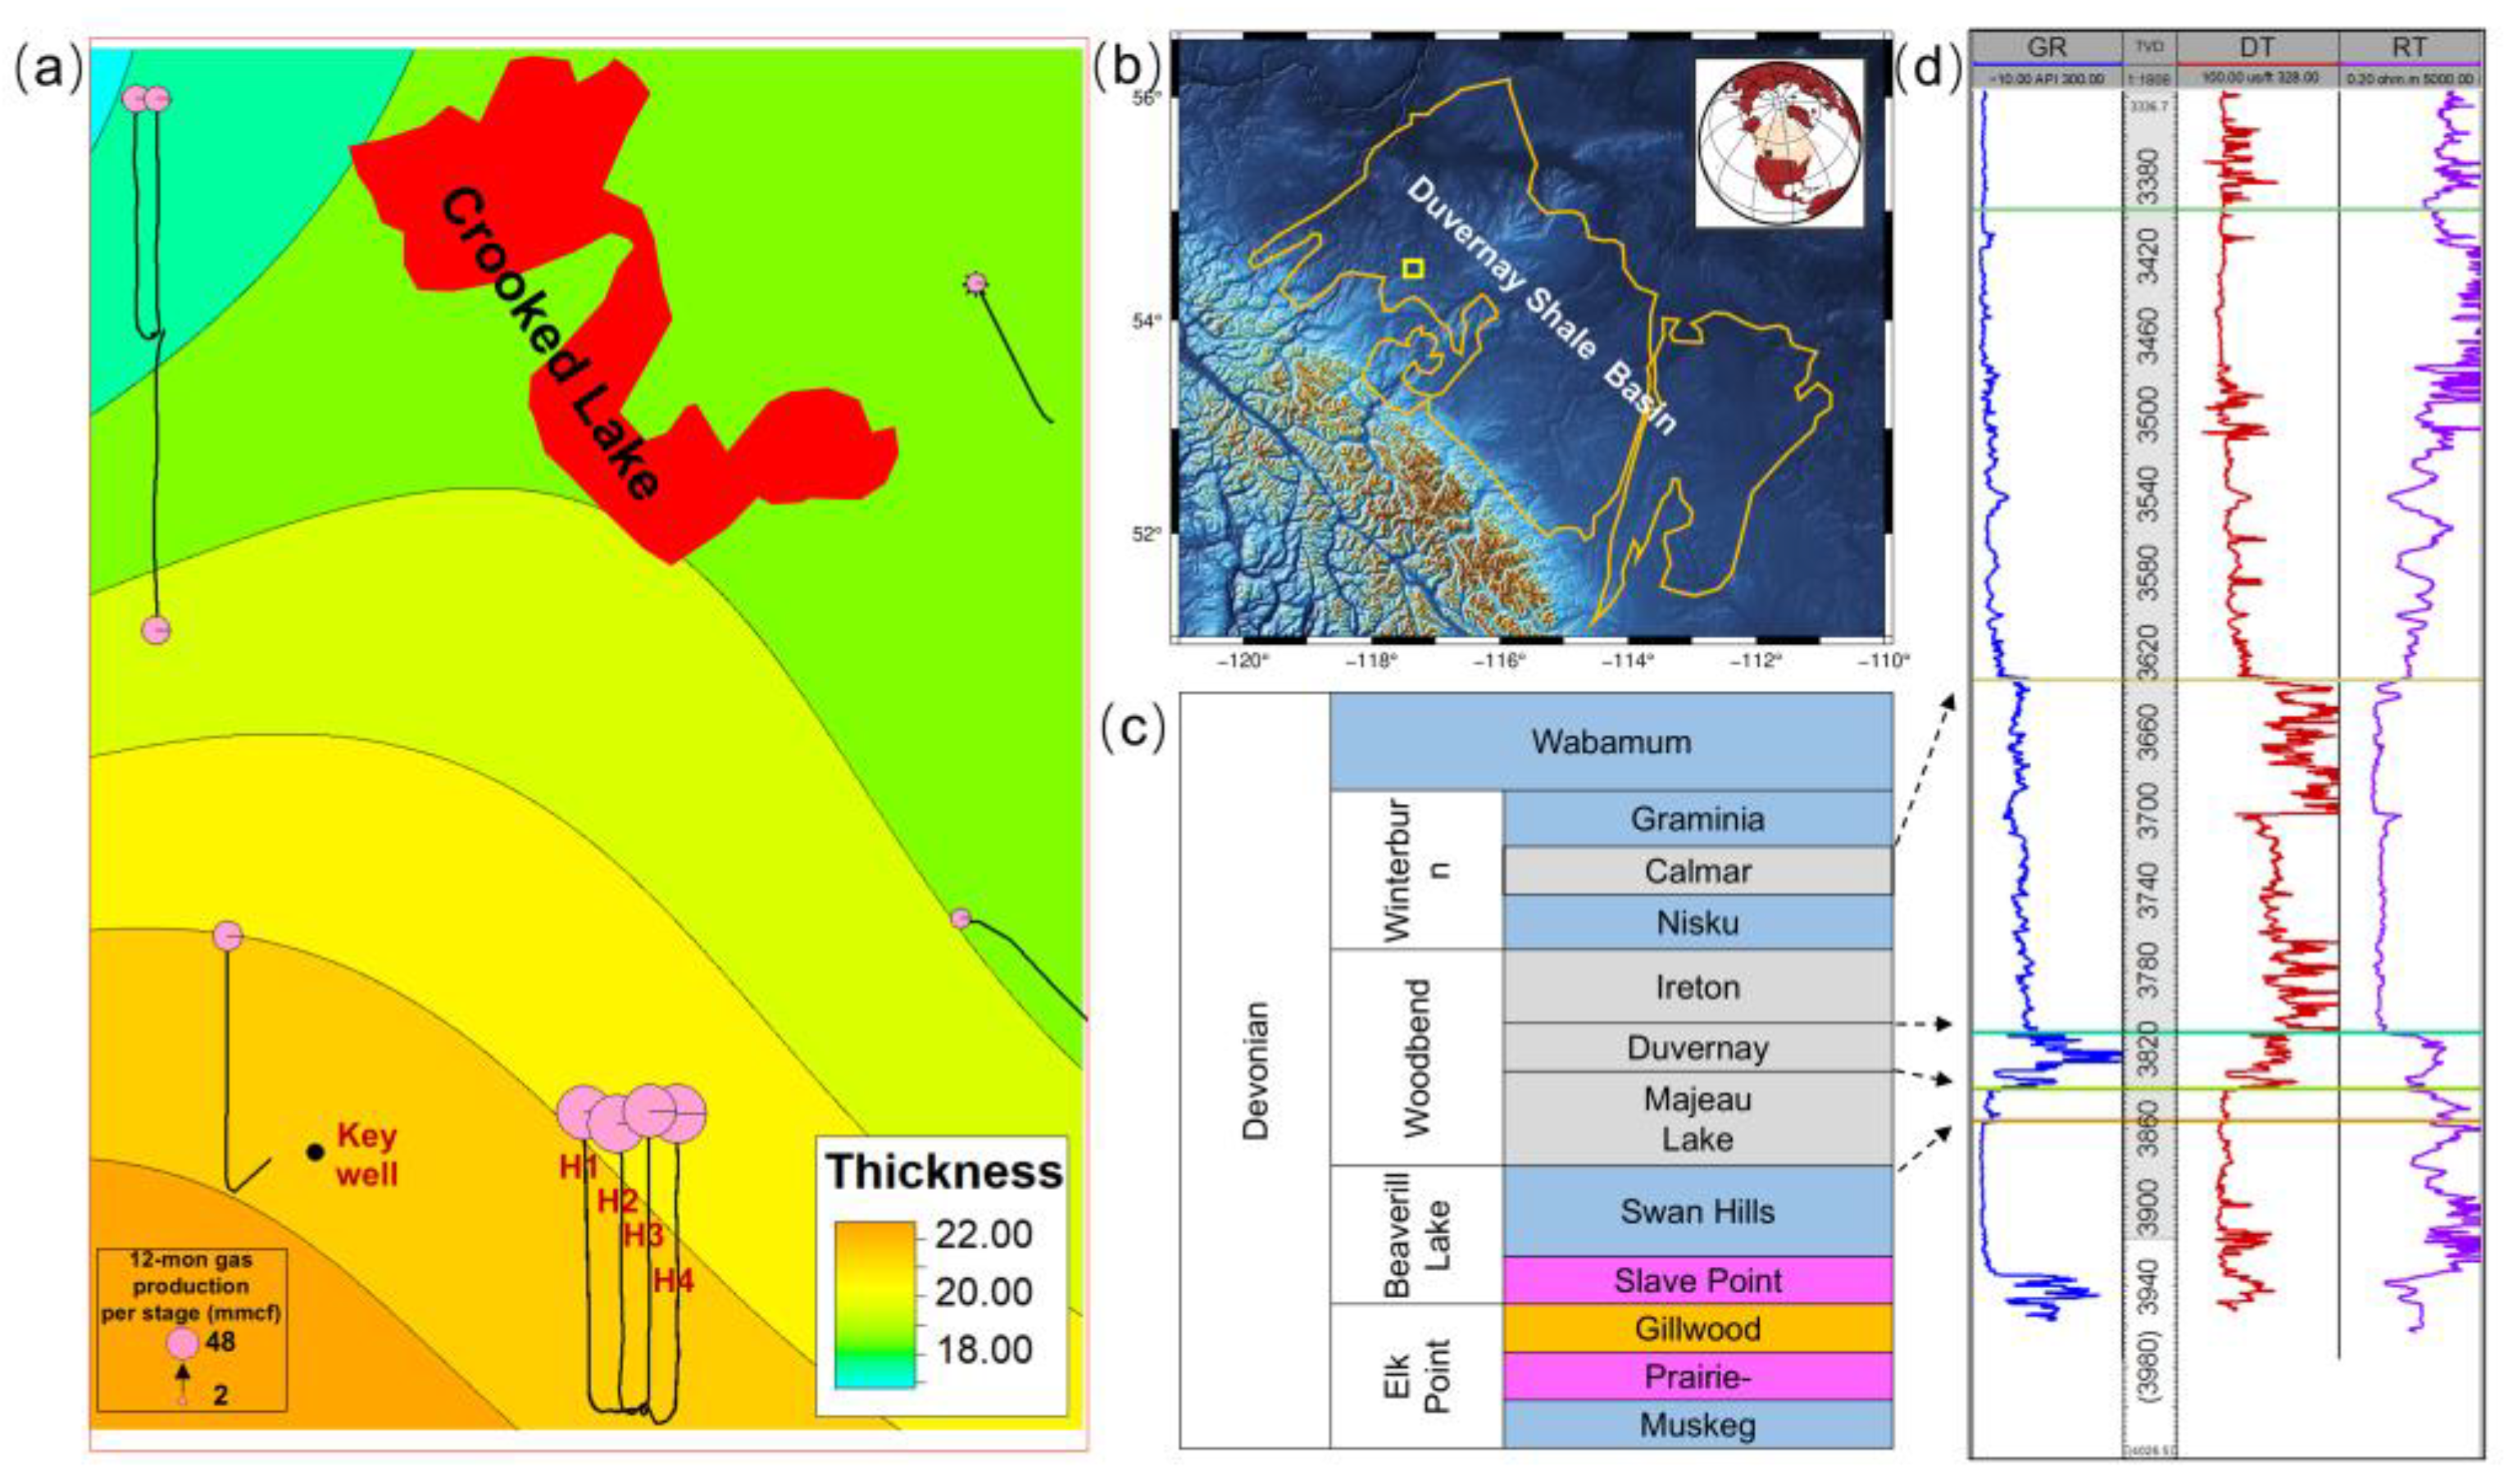
Figure 1. Geological information of the studied region. (a) Map view of the studied region. The pink circles mark the 12-month gas production per stage, scaled by production magnitude. The base map depicts the shale thickness. (b) Location of the studied region in the Duvernay Shale Basin. (c) The stratigraphy in the studied region. (d) The typical well-logging response of a key well whose location is marked in (a).
Energies 17 05084 g001
Figure 2. HF wells’ microseismicity monitoring and production history. (a) Burial broadband seismometers [15]. (b) Microseismicity events that occurred from 25 October to 15 December 2016 [19], monitored by seismology monitoring stations and colored according to time. (c) Monthly shale gas production of the four HF wells.
Energies 17 05084 g002
Figure 3. The workflow of the integrated geological engineering approach to shale gas development.
Energies 17 05084 g003
Figure 4. Petrophysics and geomechanics measurements of the key well and their relationships. (a) Relationships between porosity and permeability. (b) Relationships between porosity and gas saturation. (c) Relationships between dynamic and static Young’s modulus. (d) Relationships between dynamic and static Poisson’s ratio.
Energies 17 05084 g004
Figure 5. Petrophysics and geomechanics features of the key well within the Duvernay formation. GR = gamma ray, API. DT = acoustic, µs/m. RT = formation resistivity, Ω.m. POR = porosity. Perm = permeability, mD. PR = Poisson’s ratio. YME = Young’s modulus, GPa. Shmin = minimum principal stress, MPa. SHmax = maximum principal stress, MPa.
Energies 17 05084 g005
Figure 6. Petrophysical and geomechanical models based on the experiment results and well-logging interpretation. (af) Porosity, permeability, Poisson’s ratio, Young’s modulus, minimum principal stress, and maximum principal stress models. The base map also shows the location of the key well and four horizontal wells. The green arrow represents the north direction.
Energies 17 05084 g006
Figure 7. Natural fracture and fault features. (a) Focal strike and dip statistics for induced events. The color in small triangles represents different induced events. (b) Natural fractures and inferred faults in the studied region. White lineaments along large-magnitude events indicate inferred faults while yellow ones along small-magnitude events suggest potential hydraulic fractures. The green arrow represents the north direction.
Energies 17 05084 g007
Figure 8. The real-time UFM along with the stage completions of four horizontal wells. The white line shows the inferred faults. The pink one denotes the hydraulic fractures for each fracturing stage. The colorful area represents the induced microseismicity. Fault 1, Fault 2, and Fault 3 are marked by the white lines, The green arrow represents the north direction. (a) 2016/10/30 UFM; (b) 2016/11/04 UFM; (c) 2016/11/09 UFM; (d) 2016/11/14 UFM; (e) 2016/11/19 UFM; (f) 2016/11/24 UFM; (g) 2016/11/29 UFM; (h) 2016/12/04 UFM; (i) 2016/12/09 UFM.
Energies 17 05084 g008
Figure 9. Preparation for numerical simulation via Petrel KINETIX program. (a) Three-dimensional discrete fracture network model. The red lines show the simulated hydraulic fracture networks. (b) Unstructured gridding of DFN model for numerical simulation. The grids in the vicinity of hydraulic fractures are refined for subsequent numerical simulation.
Energies 17 05084 g009
Figure 10. The comparison between the predicted bottom pressure and the actual observed one of four horizontal wells. The solid line represents the predicted bottom pressure based on the numerical simulations, while the circles denote the observed bottom pressure in the studied region.
Energies 17 05084 g010
Figure 11. The production history matching of four horizontal wells. The circle lines represent the actual production of the four horizontal wells. The pink dashed line shows the end date of collected production data (2022/10).
Energies 17 05084 g011
Table 1. The treatment information of the four fracturing horizontal wells.
Well NameLateral Length (m)Average TVD (m)Number of StagesHF Start DateFrac Fluid Volume (m3)Proppant Amount (t)Max Injection Rate (m3/min)Avg Treating Pressure (MPa)
H12638.6 3456.53120 November 201638,303471211.773.3
H22640.0 3456.312525 October 201650,23255055.271.6
H32678.7 3448.93118 November 201644,309475511.970.7
H42626.4 3445.33117 November 201646,773463212.0773.2
Table 2. The simulated HF results of stage 15 for Well H4.
Simulation ResultsFracture 1Fracture 2Fracture 3Fracture 4
Propped Final Extension of HFN271.99 m136.37 m92.96 m227.88 m
Avg Propped Fracture Height18.84 m23.37 m27.26 m15.53 m
Avg Propped Fracture Aperture5.02 mm6.28 mm6.71 mm6.28 mm
Average Fracture Conductivity160.84 mD·m198.50 mD·m215.42 mD·m196.29 mD·m
Disclaimer/Publisher’s Note: The statements, opinions and data contained in all publications are solely those of the individual author(s) and contributor(s) and not of MDPI and/or the editor(s). MDPI and/or the editor(s) disclaim responsibility for any injury to people or property resulting from any ideas, methods, instructions or products referred to in the content.