Article

Experimental Study of the Fluid Contents and Organic/Inorganic Hydrocarbon Saturations, Porosities, and Permeabilities of Clay-Rich Shale

1
Daqing Oilfield Co., Ltd., Daqing 163002, China
2
National Key Laboratory for Multi-Resources Collaborative Green Production of Continental Shale Oil, Daqing 163712, China
3
Exploration and Development Research Institute of Daqing Oilfield Co., Ltd., Daqing 163712, China
4
Heilongjiang Provincial Key Laboratory of Reservoir Physics & Fluid Mechanics in Porous Medium, Daqing 163712, China
5
School of Petroleum Engineering, China University of Petroleum (East China), Qingdao 266580, China
*
Author to whom correspondence should be addressed.
Energies 2024, 17(2), 524; https://doi.org/10.3390/en17020524
Submission received: 15 December 2023 / Revised: 18 January 2024 / Accepted: 20 January 2024 / Published: 22 January 2024

Abstract

:
Unlike conventional reservoirs, shale is particularly complex in its mineral composition. As typical components in shale reservoirs, clay and organic matter have different pore structures and strong interactions with fluids, resulting in complex fluid occurrence-states in shale. For example, there are both free water and adsorbed water in clay, and both free oil and ad/absorbed oil in organic matter. Key properties such as fluid content, organic/inorganic porosity, and permeability in clay-rich shale have been poorly characterized in previous studies. In this paper, we used a vacuum-imbibition experimental method combined with nuclear magnetic resonance technique and mathematical modeling to characterize the fluid content, organic/inorganic porosity, saturation, and permeability of clay-rich shale. We conducted vacuum-imbibition experiments on both shale samples and pure clay samples to distinguish the adsorbed oil and water in clay and organic matter. The effects of clay content and total organic matter content (TOC) on porosity and adsorbed-fluid content are then discussed. Our results show that, for the tested samples, organic porosity accounts for 26–76% of total porosity. The oil content in organic matter ranges from 29% to 69% of the total oil content, and 2% to 58% of the organic oil content is ad/absorbed in kerogen. The inorganic porosity has a weak positive correlation with clay content, and organic porosity increases with rising levels of organic matter content. The organic permeability is 1–3 orders of magnitude lower than the inorganic permeability.

1. Introduction

With the maturity of horizontal well drilling technology and large-scale volume fracturing technology, the commercial development of shale oil has gradually been realized. Compared with conventional reservoirs, shale oil reservoirs are rich in organic matter and have high clay mineral content, diverse pore types, and complex spatial structures. Shale oil reservoirs have the characteristics of low porosity, low permeability, and high specific surface area. The presence of clay minerals can lead to severe water sensitivity effects, while significant capillary phenomena can cause water-locking phenomena. Depositional environments can significantly impact the components, contents, structures, and distribution of clay in shale oil layers. These factors of clay minerals in shale reservoirs have two aspects in their influence on the reservoir’s physical properties and rock-mechanical properties: one is the influence on the mechanical properties of shale rocks; the increased amounts of clay minerals will reduce natural fractures and reduce the “fracturability” of rock layers. The second is the influence on fluid continuity and flow characteristics, because the distribution of clay in shale will influence the continuity of organic matter, fluid distributions, and relationship between the two phases of permeability. The interactions between clay minerals and fluids can significantly affect the flow capacity of fluids [1,2]. Clay minerals will swell when they encounter water. The mechanism of clay swelling has been well studied, and the main understanding achieved describes the formation of hydrogen bonds on the surface of clay minerals which results in the adsorption of water [3,4], and the hydration of ions in clay minerals to form a diffuse double layer, which increases the inter-crystal distance of clay crystals [5]. The swelled clay will disperse and produce precipitation, blocking flow channels, resulting in reduced permeability [6,7]. The interaction between oil and clay minerals mainly focuses on the characterization of the occurrence-state of oil. The polar part of oil adsorbs to clay minerals due to hydrogen bonding [8]. When the water content increases, the proportion of adsorbed oil decreases and the proportion of free oil increases [9], thereby increasing the mobility of oil. However, due to the effect of clay swelling, the increase in flow ability is limited [10]. The above studies reveal the storage and flow characteristics of oil and water in clay minerals, but they do not systematically characterize the content and distribution characteristics of fluids in shale samples with complex mineral compositions.
The shale oil reservoir is rich in organic matter. The oil in shale reservoirs with high oil content and oil of medium to high maturity is of good quality, has low viscosity, and is mainly stored in the pores and kerogen. The occurrence-states of continental shale oil are diverse, mainly including free oil, oil adsorbed on the surface of minerals, and oil absorbed in the organic matter [11,12]. The free oil is mainly composed of small molecular components and is mainly found in micro-fractures, fractures between layers, and large-sized pores in the mudstone matrix [13,14]. The adsorbed oil is mainly composed of medium to large molecular components and is mainly adsorbed onto the surface of rock minerals and kerogen macromolecule skeletons through physical adsorption and non-covalent chemical adsorption [15,16]. The absorbed oil is mainly composed of medium to small molecular components, which are mainly small molecules entrapped within the internal network structure of kerogen or dissolved in asphaltene and residual water [17,18]. Two types of experimental characterization methods have been developed for studying the occurrence-state of shale oil: one is the solvent extraction method [18], and the other is the pyrolysis method [19]. Some scholars have also used molecular simulation technology to quantitatively evaluate the adsorption and free-oil content of either single-component hydrocarbons or mixed hydrocarbons in pores with different properties (type, size, shape, wettability, etc.) and under different conditions (temperature, pressure) [20]. The thickness and density-distribution of the adsorption layer were described in their studies.
Based on the wettability and occurrence characteristics of oil/water in organic/inorganic pores, through the fluid imbibition experimental method, Sang et al. [21] determined the inorganic porosity, organic porosity, maximum organic saturation, maximum inorganic saturation, and adsorption-relative miscible-fluid saturation of continental shale rock samples from the Jiyang Depression in eastern China. The oil content in organic matter (including free oil, adsorbed oil, and adsorbed oil) accounted for 6% to 55% of the total saturated oil content, of which 50% to 90% was ad- or absorbed oil. The inorganic and organic permeability of the measured shale samples were obtained by fitting the imbibition curves of the oil and water. The organic permeability was approximately one to two orders of magnitude lower than the inorganic permeability [22]. The above experiments and fitting processes did not consider the influence of clay on the contents of ad- and adsorbed fluid. The content levels of ad- and adsorbed fluid in the organic matter and clay minerals were not separated.
The objectives of this study are to characterize the fluids in different occurrence-states of shale rock samples rich in organic matter and clay minerals, and to obtain key parameters that are important in fluid-flow studies by considering the adsorbed fluid in organic matter and clay minerals. In this paper, a total of eight shale samples and two types of clay minerals were selected to conduct vacuum-imbibition tests in order to separately consider the organic porosity, inorganic porosity, organic saturation, and inorganic saturation of the shale samples. The experimental results were fitted to obtain the organic permeability and inorganic permeability of the tested samples. The clay contents and organic-matter contents of the samples were characterized to analyze the factors affecting the organic/inorganic saturation and the fluid content in different occurrence-states.

2. Experimental Methods

2.1. Rock Samples

Shale rock samples were collected from Well GY 7, Well GY 10HC, Well GY 4HC, Well GY 9HC, and Well GY 16 in the Songliao Basin, which is located in Daqing, Heilongjiang Province, in northern China. The mineralogy of the core samples was characterized by X-ray diffraction, and the TOC of core samples was characterized by the high-temperature pyrolysis method. The mineralogy and TOC of all samples are shown in Table 1. The shale samples have high content levels of clay minerals, mostly ranging from 30% to 50%. The TOC of samples are in the range of 1–3%.

2.2. Pore-Structure Characterization

Shale matrix has a complex pore structure, with pore sizes ranging from nanometers to micrometers. In this work, the morphology of the sample surface was observed using an SEM with argon ion-beam milling. Pore-size distribution was measured by the N2 adsorption method and the high-pressure mercury injection method. The N2 adsorption method was conducted at 77 K, using a Micromeritics ASAP 2020 surface-area and porosity analyzer. Pore-size distribution was calculated using the Barret–Joyner–Halenda (BJH) method [23]. An AutoPore IV 9500 was used to measure the pore throat sizes in the high-pressure mercury injection test.

2.3. Vacuum-Imbibition Tests

In this study, vacuum-imbibition tests were conducted to determine the organic and inorganic porosity, organic and inorganic saturation, and content of ad/absorbed oil of the shale rock samples. The helium was saturated to obtain the volume of the total pore space, and the oil and water imbibition tests were performed to obtain the volumes of the organic and inorganic pores.
An apparatus for vacuum-imbibition tests is shown in Figure 1. The experimental set-up consists of a gas cylinder, vacuum pump, pressure sensors, sealed test cells, and high-precision burettes. Each burette was sealed with plastic wrap and aluminum foil to prevent evaporation of the liquid. Due to the low amount of imbibed liquid in this experiment, we chose burettes with graduations at every 0.01 mL to ensure accurate measurement of the imbibed contents. The apparatus for the oil and water vacuum-imbibition test is divided into two parts; the upper part includes the valve V-2 and a high-precision burette, and the lower part includes the valve V-1 and the sealed cell. The role of the V-1 is to connect to the vacuum pump for vacuuming, and after the vacuuming is completed, the V-1 is closed to maintain the vacuum of the cell. The V-2 is the valve for the high-precision burette, preventing the liquid from leaking out from the bottom when the high-precision burette is filled with liquid. The upper and lower parts are assembled together for the imbibition experiment.
Due to the significant impact on volume accuracy made by the container’s volume in the experimental results, it is necessary to accurately measure the internal-space volume of the sealed cell. The internal volume of the sealed cell refers to all the volume below the valve V-1. First, the sealed cell was vacuumed for at least 4 h; then, it was connected to the burette filled with distilled water, and the volume of water imbibed was recorded. The internal volume was calibrated, at least three times, until the volume error of the three calibrations was less than 0.1 mL. The calibrated volumes were then averaged to calculate the accurate volume of the sealed cell.
The sealed cell was connected to the high-precision burette filled with oil or water. The valve V-2 was opened, and the initial position of the liquid was recorded. Then, the valve V-1 was opened, and the level of the liquid in the burette at first rapidly dropped to fill the space in the sealed cell not occupied by the rock sample. Then, the level of the liquid dropped slowly. The liquid position Vi and the corresponding time t were recorded until the liquid level no longer dropped.
The procedure of the vacuum-imbibition test is as follows:
(1)
The shale samples were broken into blocks of approximately 1 cm × 1 cm × 0.5 cm and extracted with CH2Cl2 for 15 days, and then dried for 48 h at 100 °C.
(2)
The processed rock-samples were divided into two parts of equal weight and placed in two sealed cells for water and oil imbibition tests. An air tightness test was conducted.
(3)
The samples were vacuumed, and then saturated with helium gas. The saturated gas content was obtained according to Boyle’s law to calculate the total pore volumes and porosities of the shale rock samples.
(4)
The samples were then vacuumed again, and oil and water were imbibed into the 2 cells. The imbibed volumes of oil and water were recorded, along with the time. The entire experimental process was conducted at a constant temperature of 25 °C. The n-dodecane (n-C12) was used as the oil phase, and the KCl solution with 8% mass concentration was used as the water phase.

2.4. Two-Dimensional Nuclear Magnetic Resonance Characterization

In this study, the nuclear magnetic resonance (NMR) technique is used to characterize the oil and water in different occurrence-states. In order to distinguish different hydrogen-bearing components in shale, we obtained the transverse relaxation (T2) and its relationship with the longitudinal relaxation time (T1) for the shale samples. The dry samples and the samples after the oil and water had been imbibed were subjected to NMR tests, and the components of kerogen, structural water, free water, adsorbed water, free oil, and adsorbed oil were identified from the T1–T2 maps.
The NMR tests were carried out on a MacroMR12-150H-VTHP instrument (Shanghai Niumag, Shanghai, China) operated at 12 MHz. The measurement parameters of the NMR were set as follows: waiting time, 4000 ms; number of echoes, 10,000; regulate first data, 0.08 ms; sampling frequency, 250 kHz; pulse 90, 20 μs.

3. Results and Discussion

3.1. Microstructure of Pore-Space and Pore Size Distribution

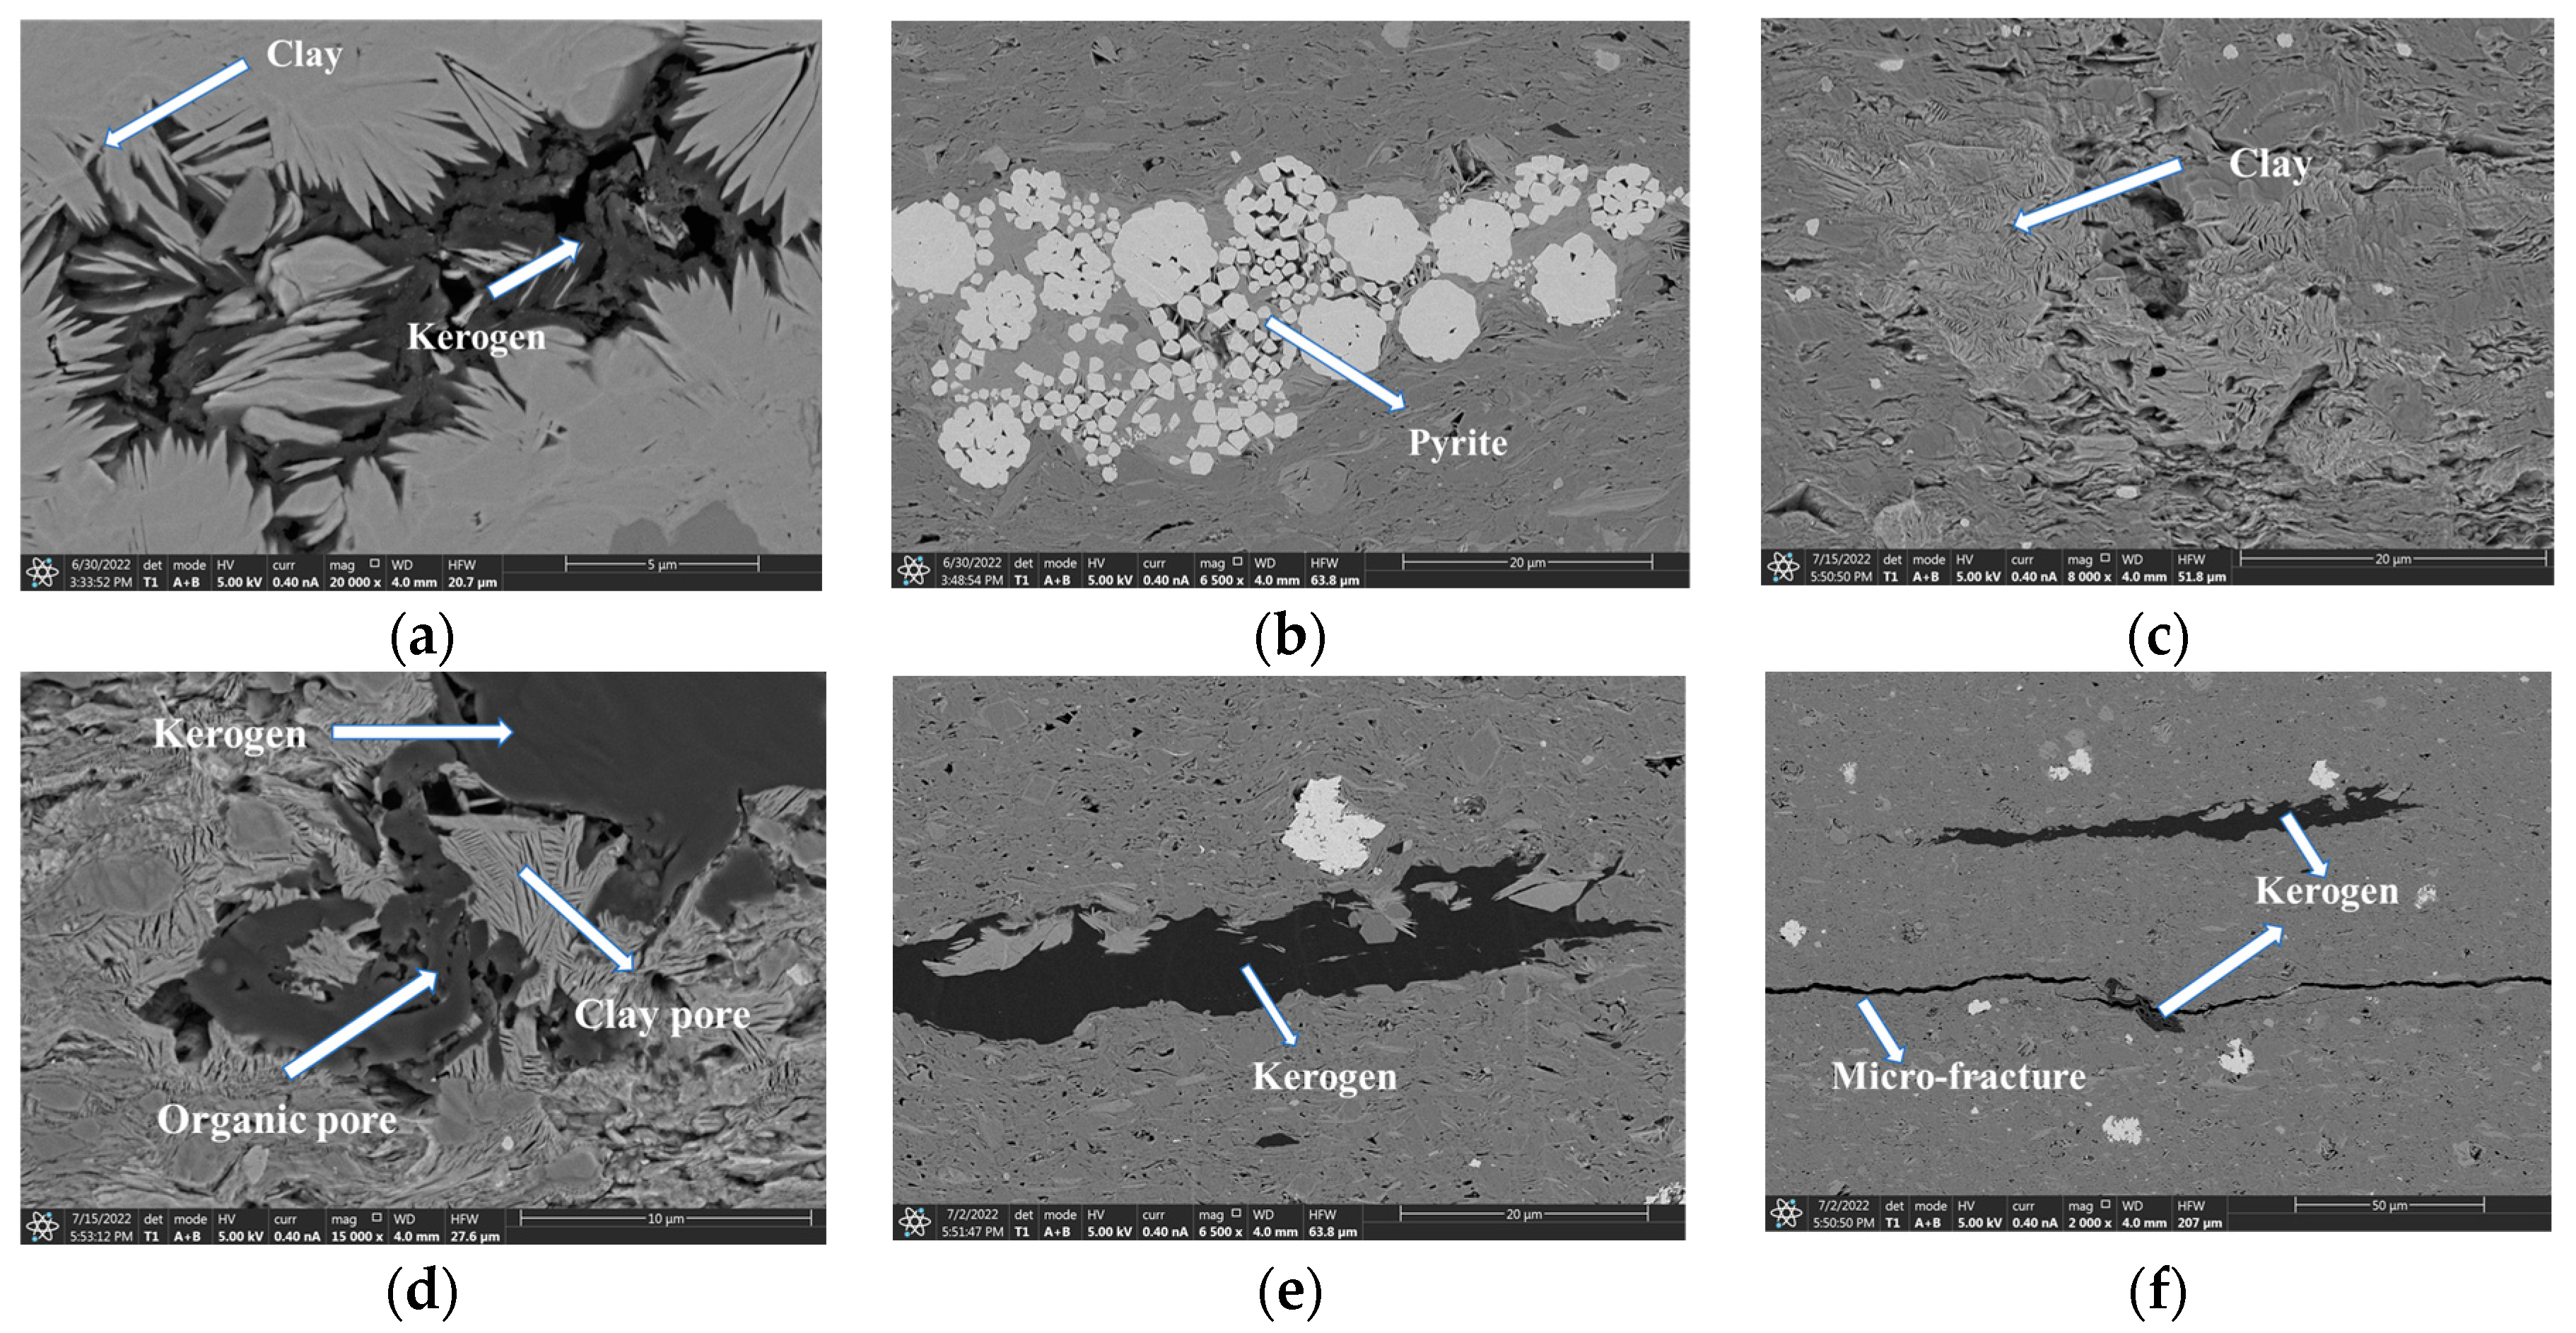
Combined with the argon ion-beam milling technique, scanning electron microscopy (SEM) was used to characterize the pores at nanometer resolution. Nano- and micro-scale pores were identified and analyzed based on SEM images. Some representative images are shown in Figure 2. Various minerals such as quartz, clay, kerogen, dolomite, and pyrite were observed from the SEM images. The pore type includes intergranular pores, intragranular dissolution pores, clay mineral pores, organic matter pores, and micro-fractures. It can be seen from the images that the organic matter and clay minerals are mixed, and there are large pores or micro-fractures on the edge of the kerogen. Some of the kerogen has a certain degree of pore development inside.
Due to the inconsistencies between resolution and field range, the SEM technique can only provide local pore structure information of rock samples, and cannot fully characterize the pore-size distribution of rock samples. Combined with high-pressure mercury injection and N2 adsorption testing, the full pore-size range of shale samples was characterized.
As shown in Figure 3a, the shale samples have a large number of pores with sizes of less than 100 nanometers. The pores with sizes of 2–100 nanometers and 10–200 μm account for the largest proportion of the pore volume and contribute to the main storage capacity. The pores with sizes of 2–100 nanometers mainly exist in the shale matrix, and are manifested as intergranular pores, intragranular pores, and intercrystalline pores. The pores with sizes of 10–200 μm are mainly micro-fractures.
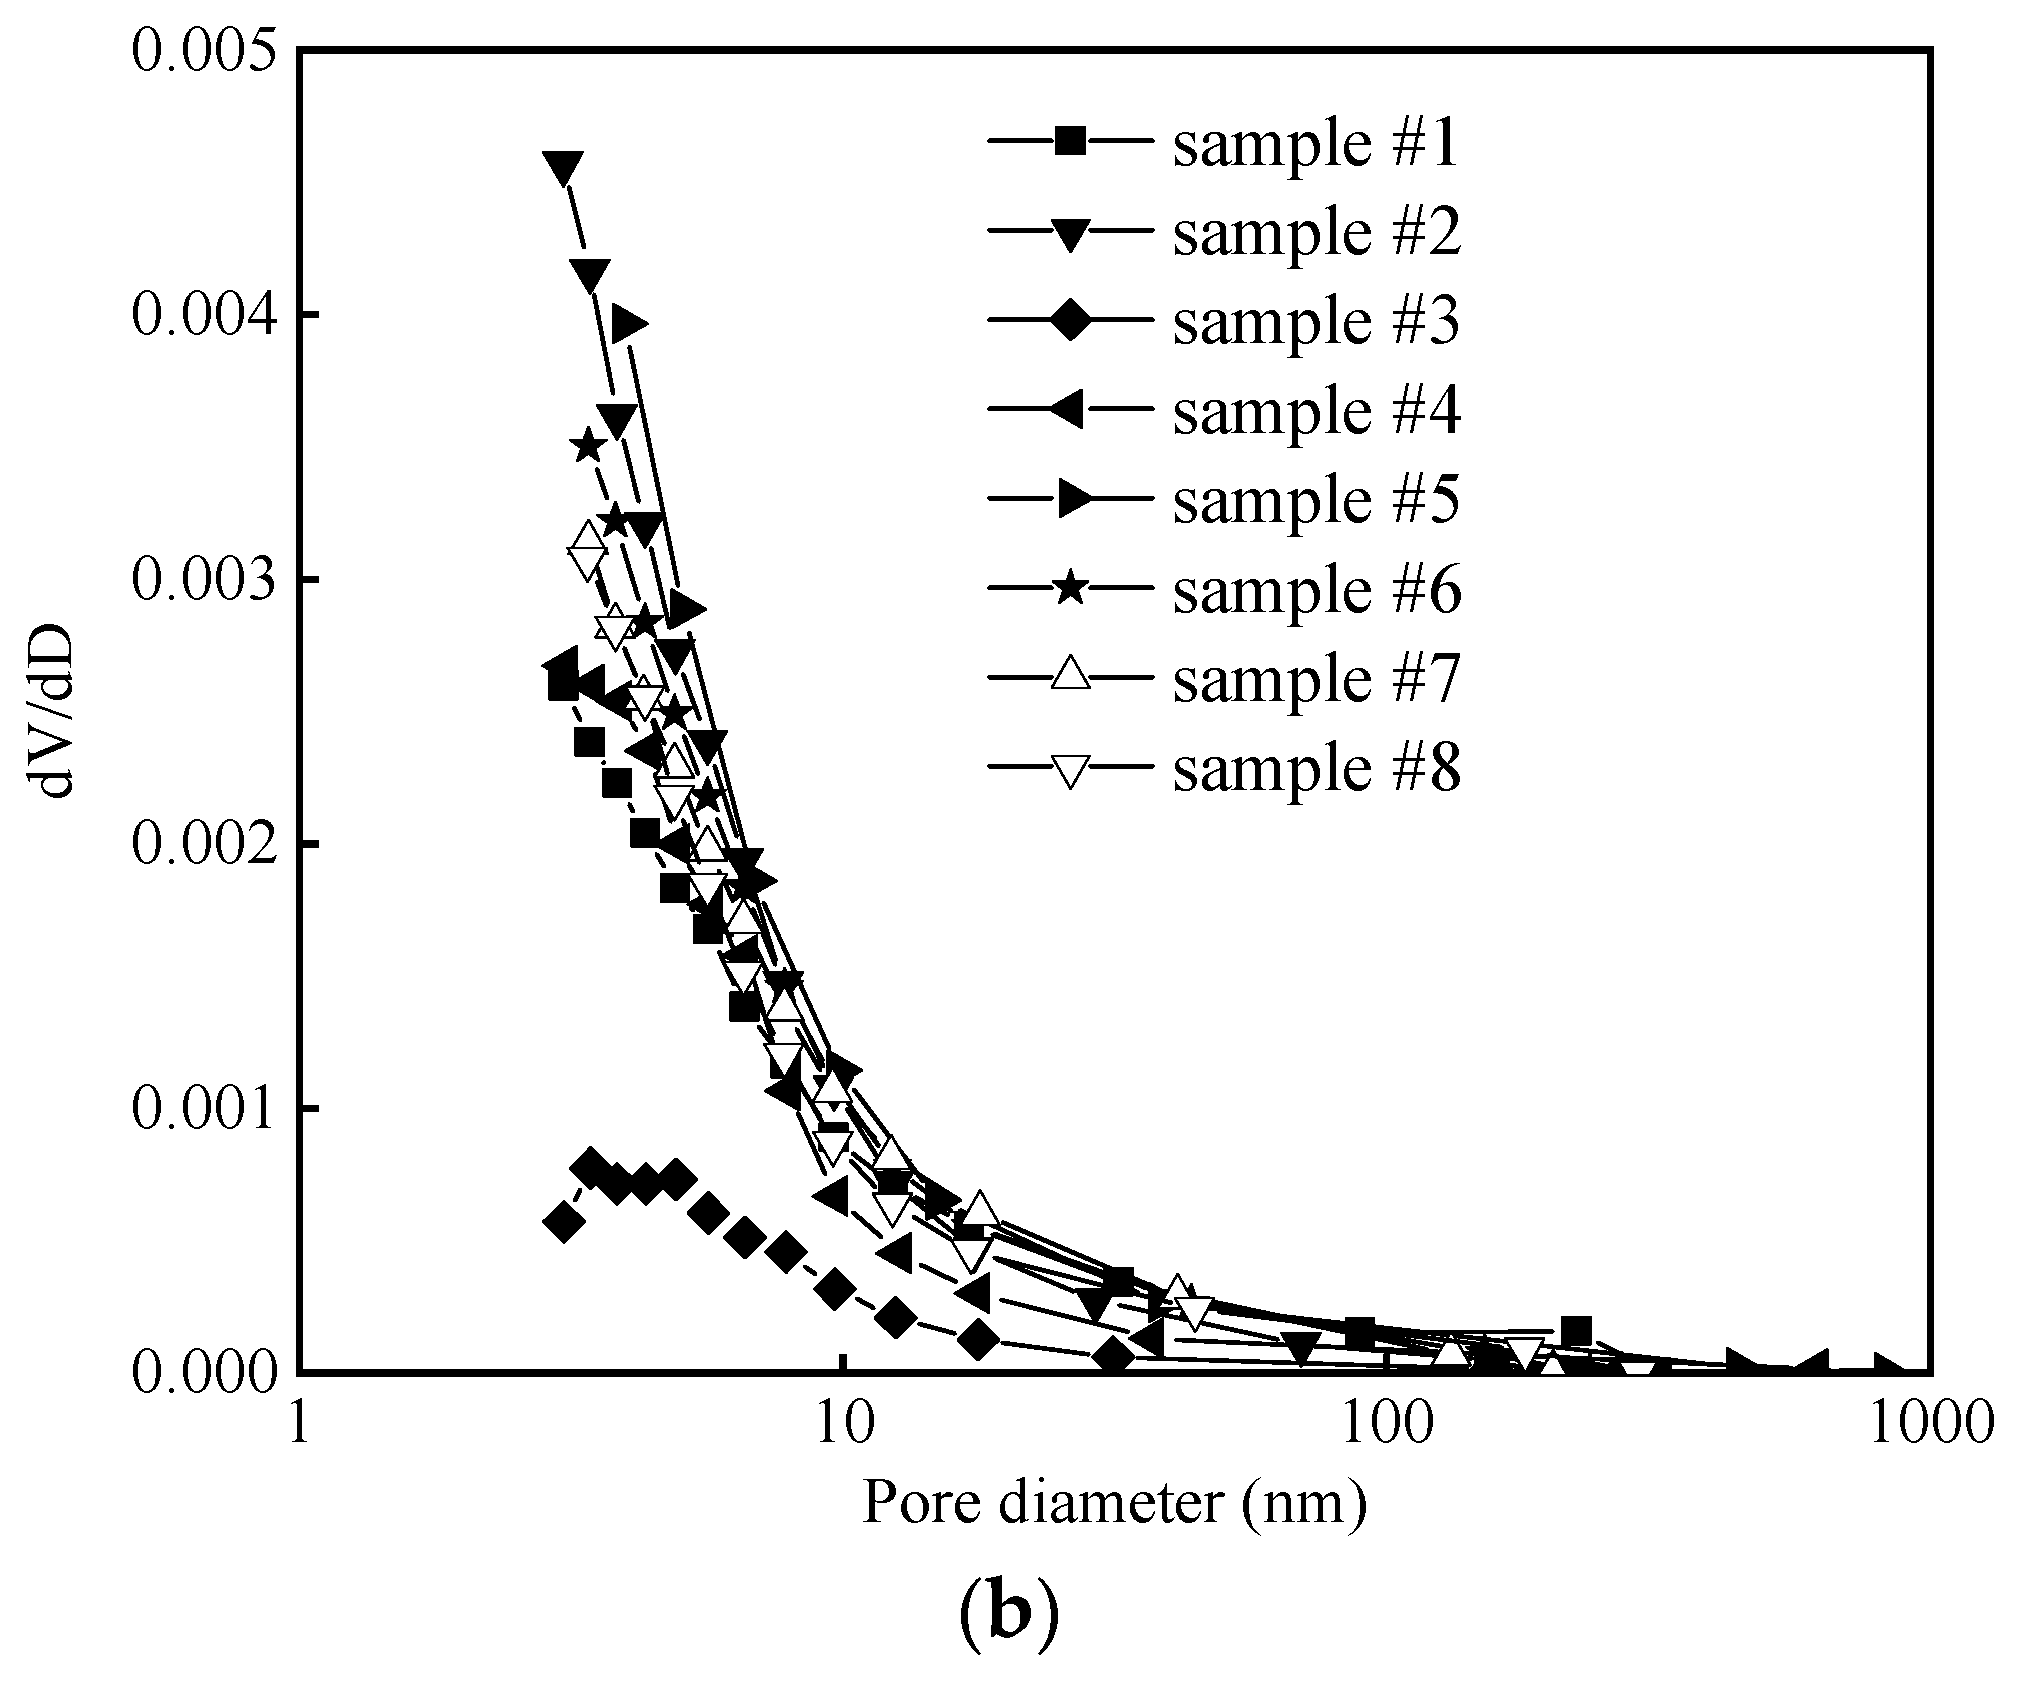
Figure 3b shows that the nanopores with pore diameters of less than 10 nanometers occupy the majority of the pore space. Its characteristics are related to the high clay content, which develops a large number of nanopores, mainly in the form of sheet pores or slit pores. Combined with high-pressure mercury porosimetry results, we can conclude that for shale samples, the pore size of nanoscale pores is generally less than 100 nanometers.

3.2. Inorganic and Organic Saturations and Porosities

In shale reservoirs, shale oil exists in various forms of occurrence, including free oil in inorganic pores and fractures, adsorbed oil in clay minerals, organic free-oil in organic pores, and ad- and adsorbed oil in the kerogen matrix. The inorganic minerals in shale reservoirs are mostly water-wet surfaces with relatively large pore sizes compared to organic pores. Organic pores have hydrophobic surfaces and are mostly nano-scale pores. For the vacuum-imbibition process, the single-phase flow occurs, and the surface energy of the oil is greater than that of water; therefore, oil can enter both the organic and inorganic pores, while water can only enter the hydrophilic inorganic pores and cannot enter the hydrophobic organic matter [21].
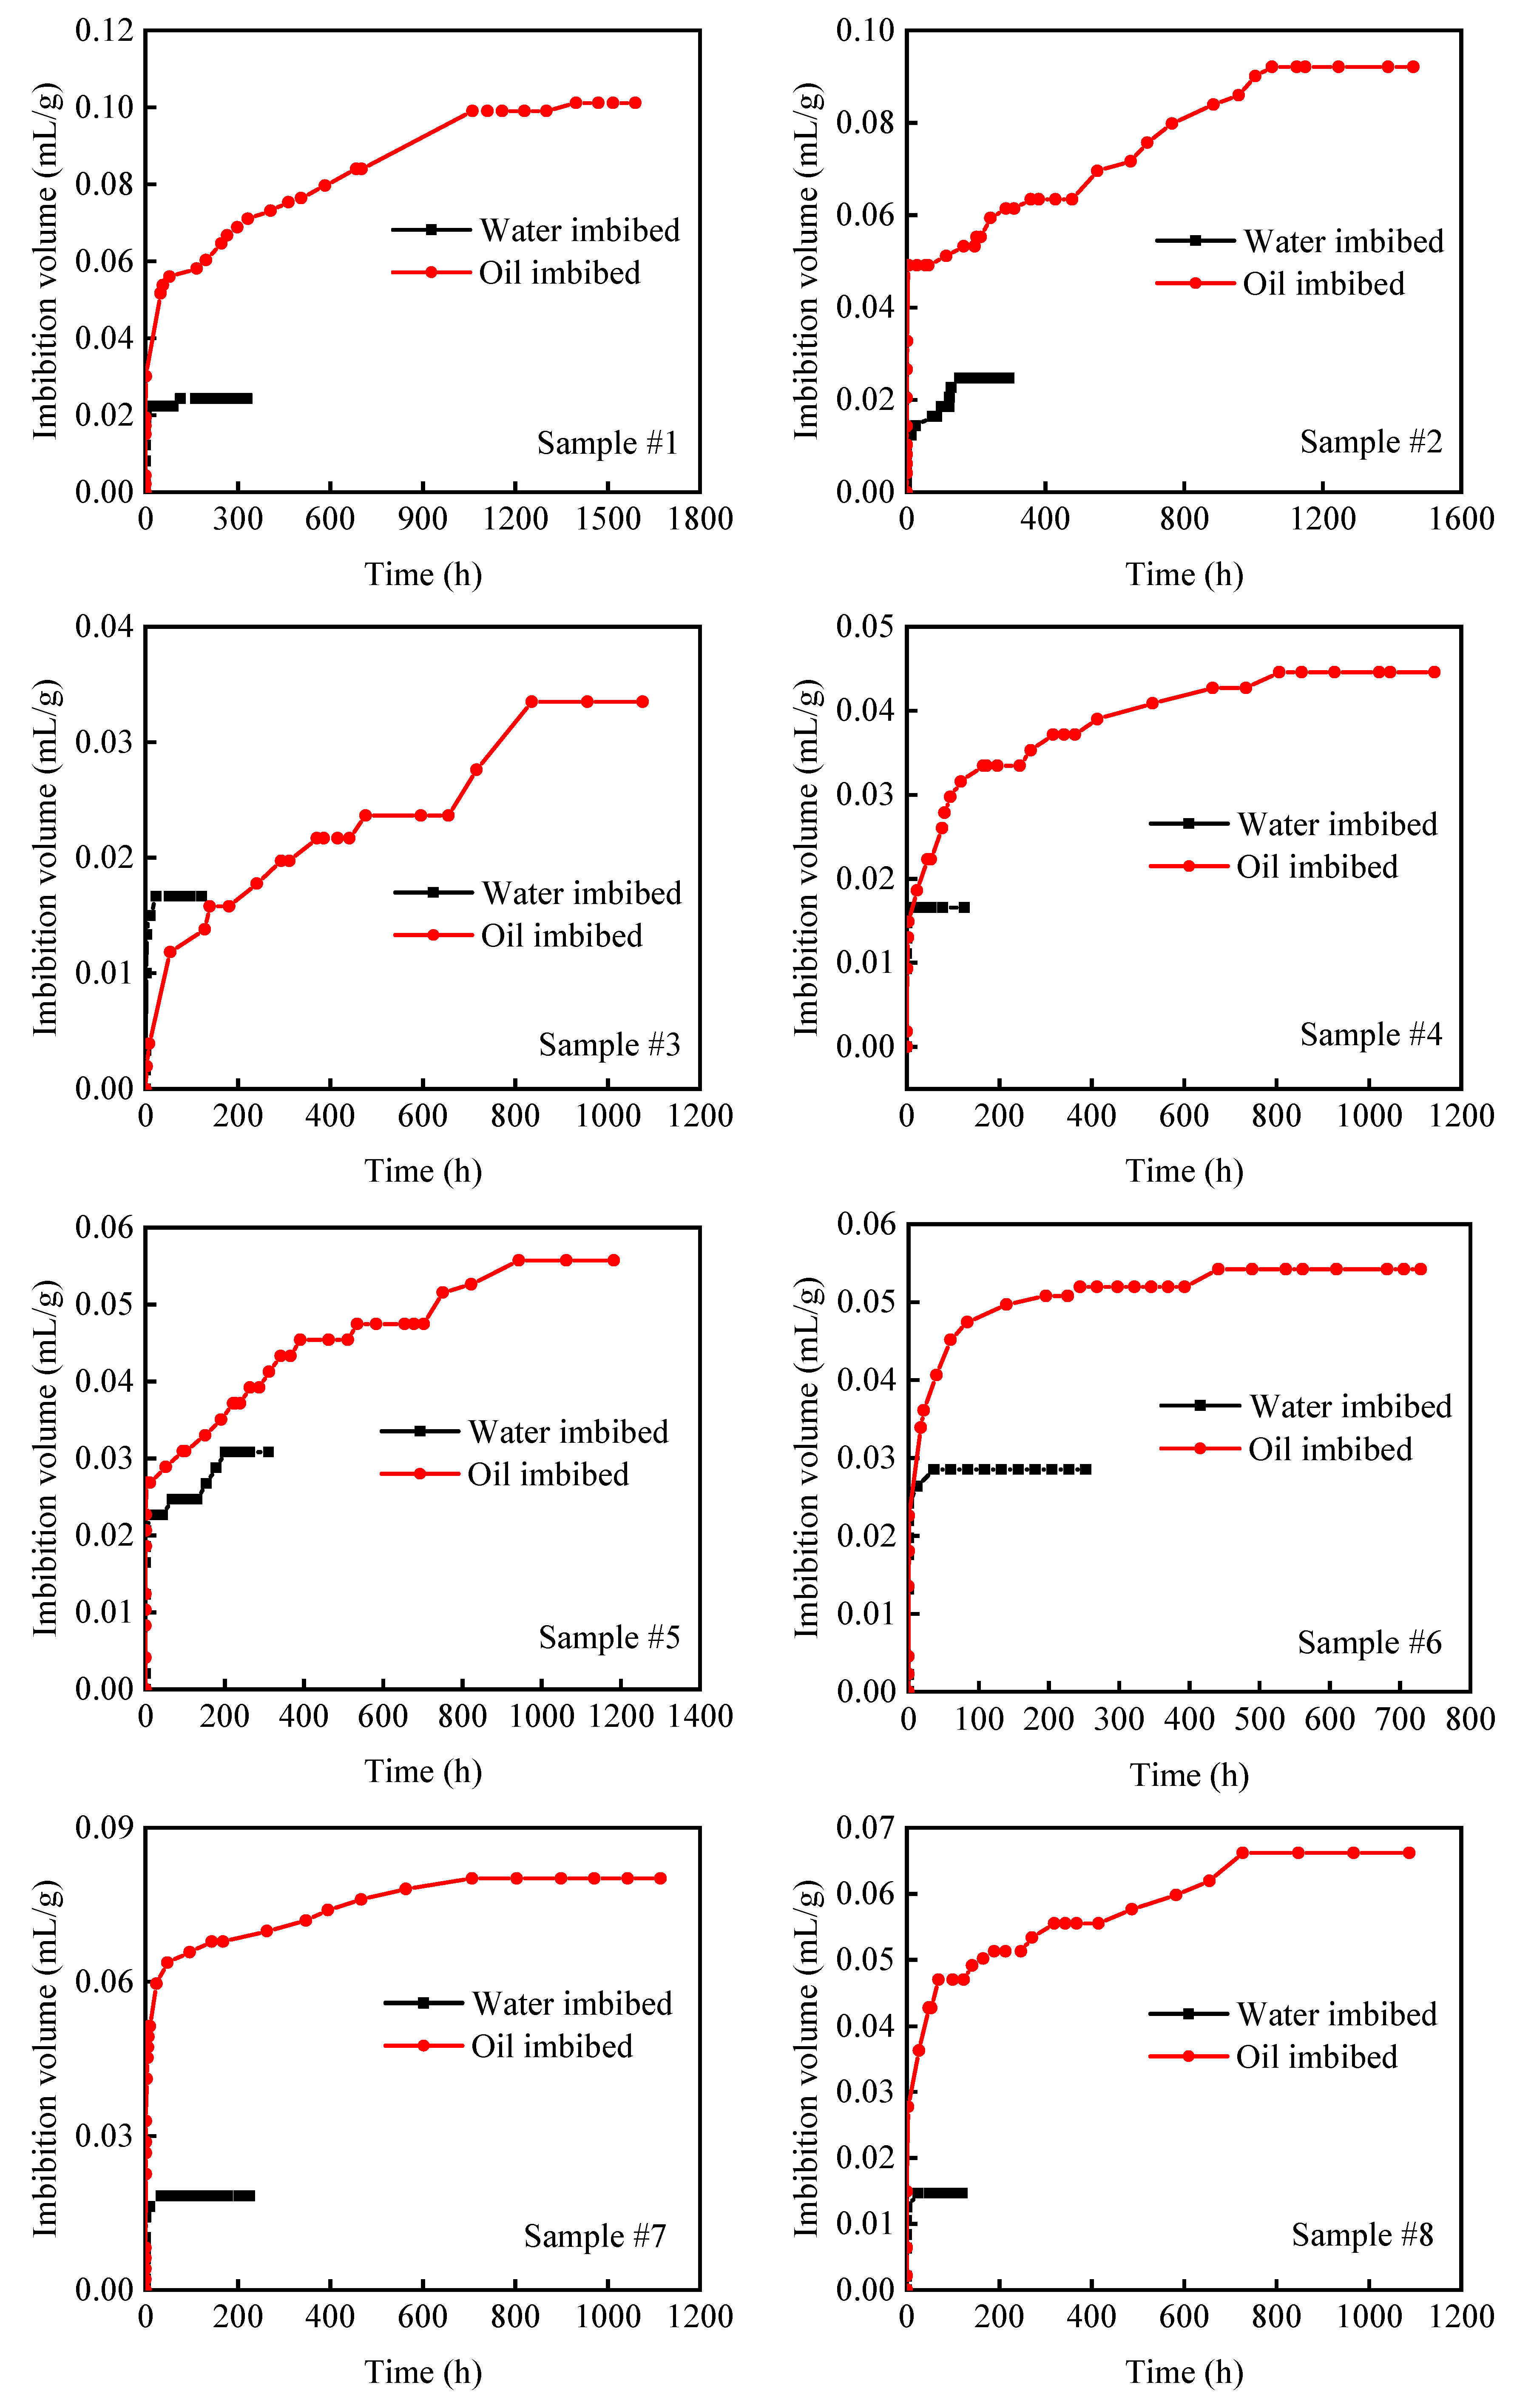
The vacuum-imbibition results of the shale samples are shown in Figure 4. The vacuum-imbibition curves of the oil and water show the following characteristics: (1) The imbibition of oil and water can be divided into two stages. At the early stage, the imbibition rate of oil and water is fast, and the imbibition volume rises rapidly. At the later stage, the imbibition rate gradually slows down, and the imbibition volume slowly rises until reaching a state of equilibrium at which the imbibition volume no longer changes. (2) The final imbibed volume of water is smaller than the final imbibed volume of oil. (3) It takes longer for oil to reach equilibrium than for water. For example, sample #6 took about 100 h to imbibe 0.029 mL/g of water, while the imbibition time and volume of oil were 730 h and 0.054 mL/g, respectively. The oil imbibition volume was 0.025 mL/g more than that of water. The final imbibed water volume of sample #1 was 0.024 mL/g, reaching equilibrium in approximately 4.2 days, while the final imbibed oil volume was 0.10 mL/g (4.17 times of the imbibed water volume), and took 66.2 days to reach equilibrium (15.8 times of the equilibrium time for water imbibition).
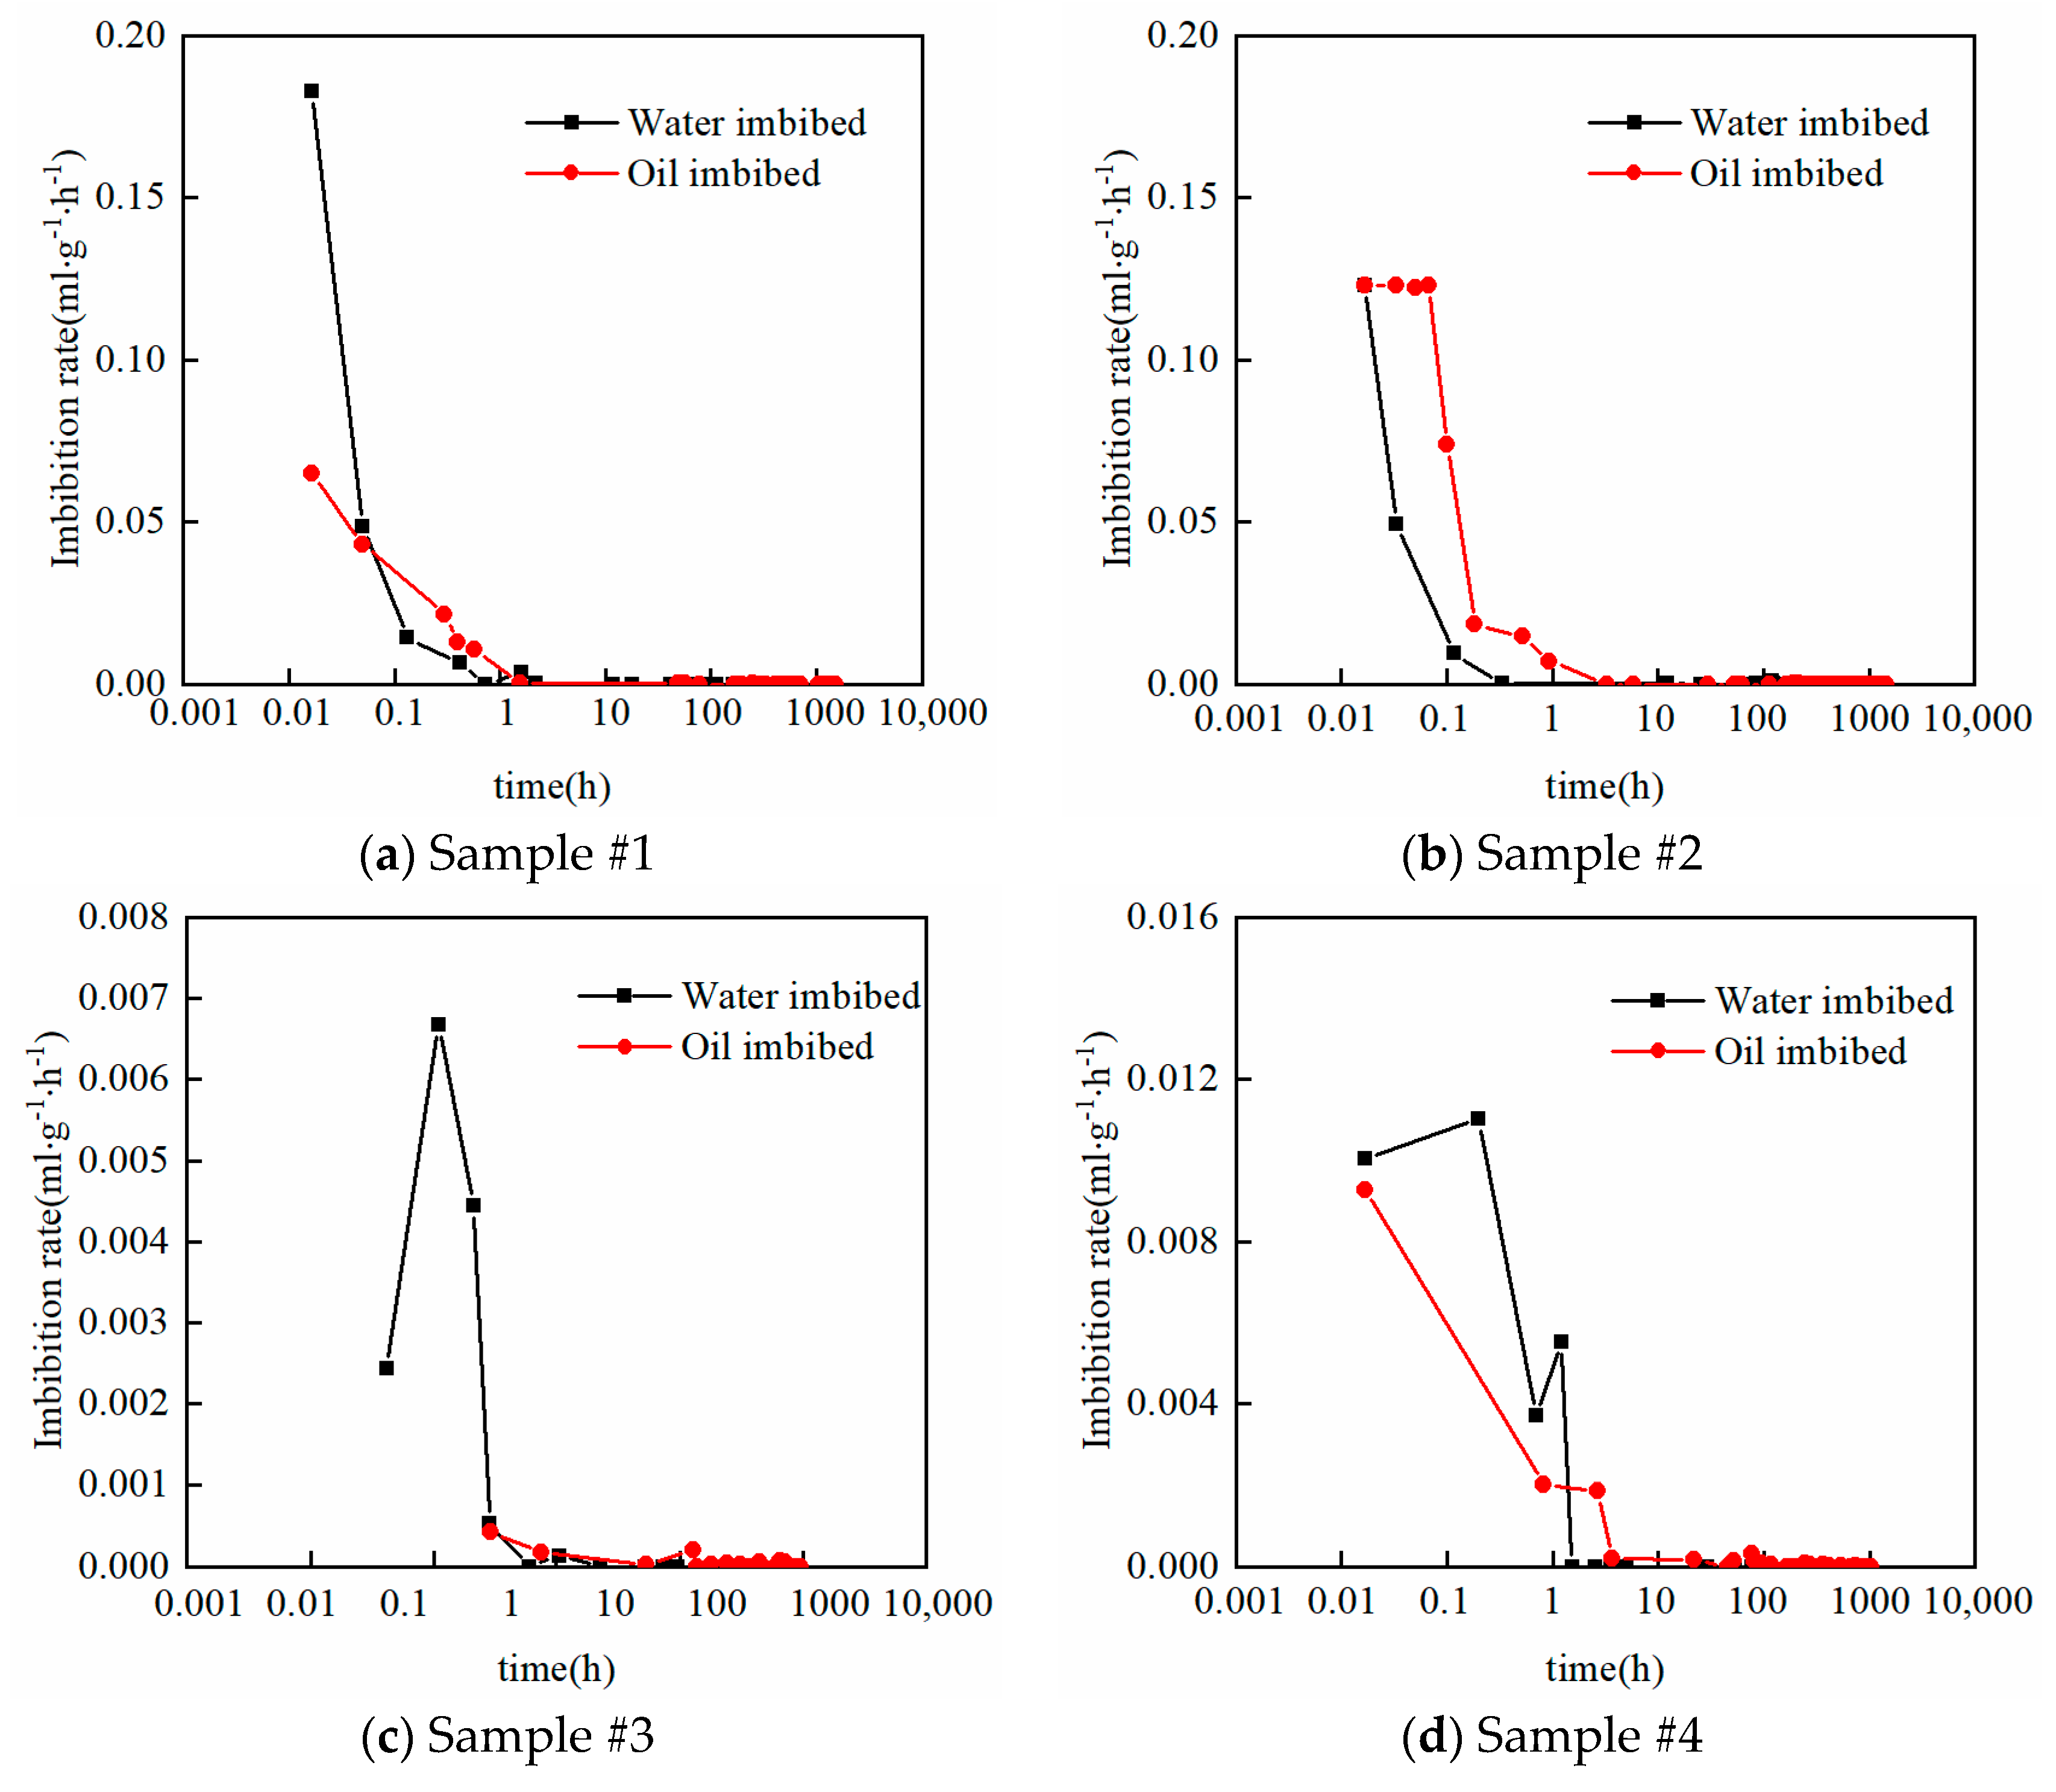
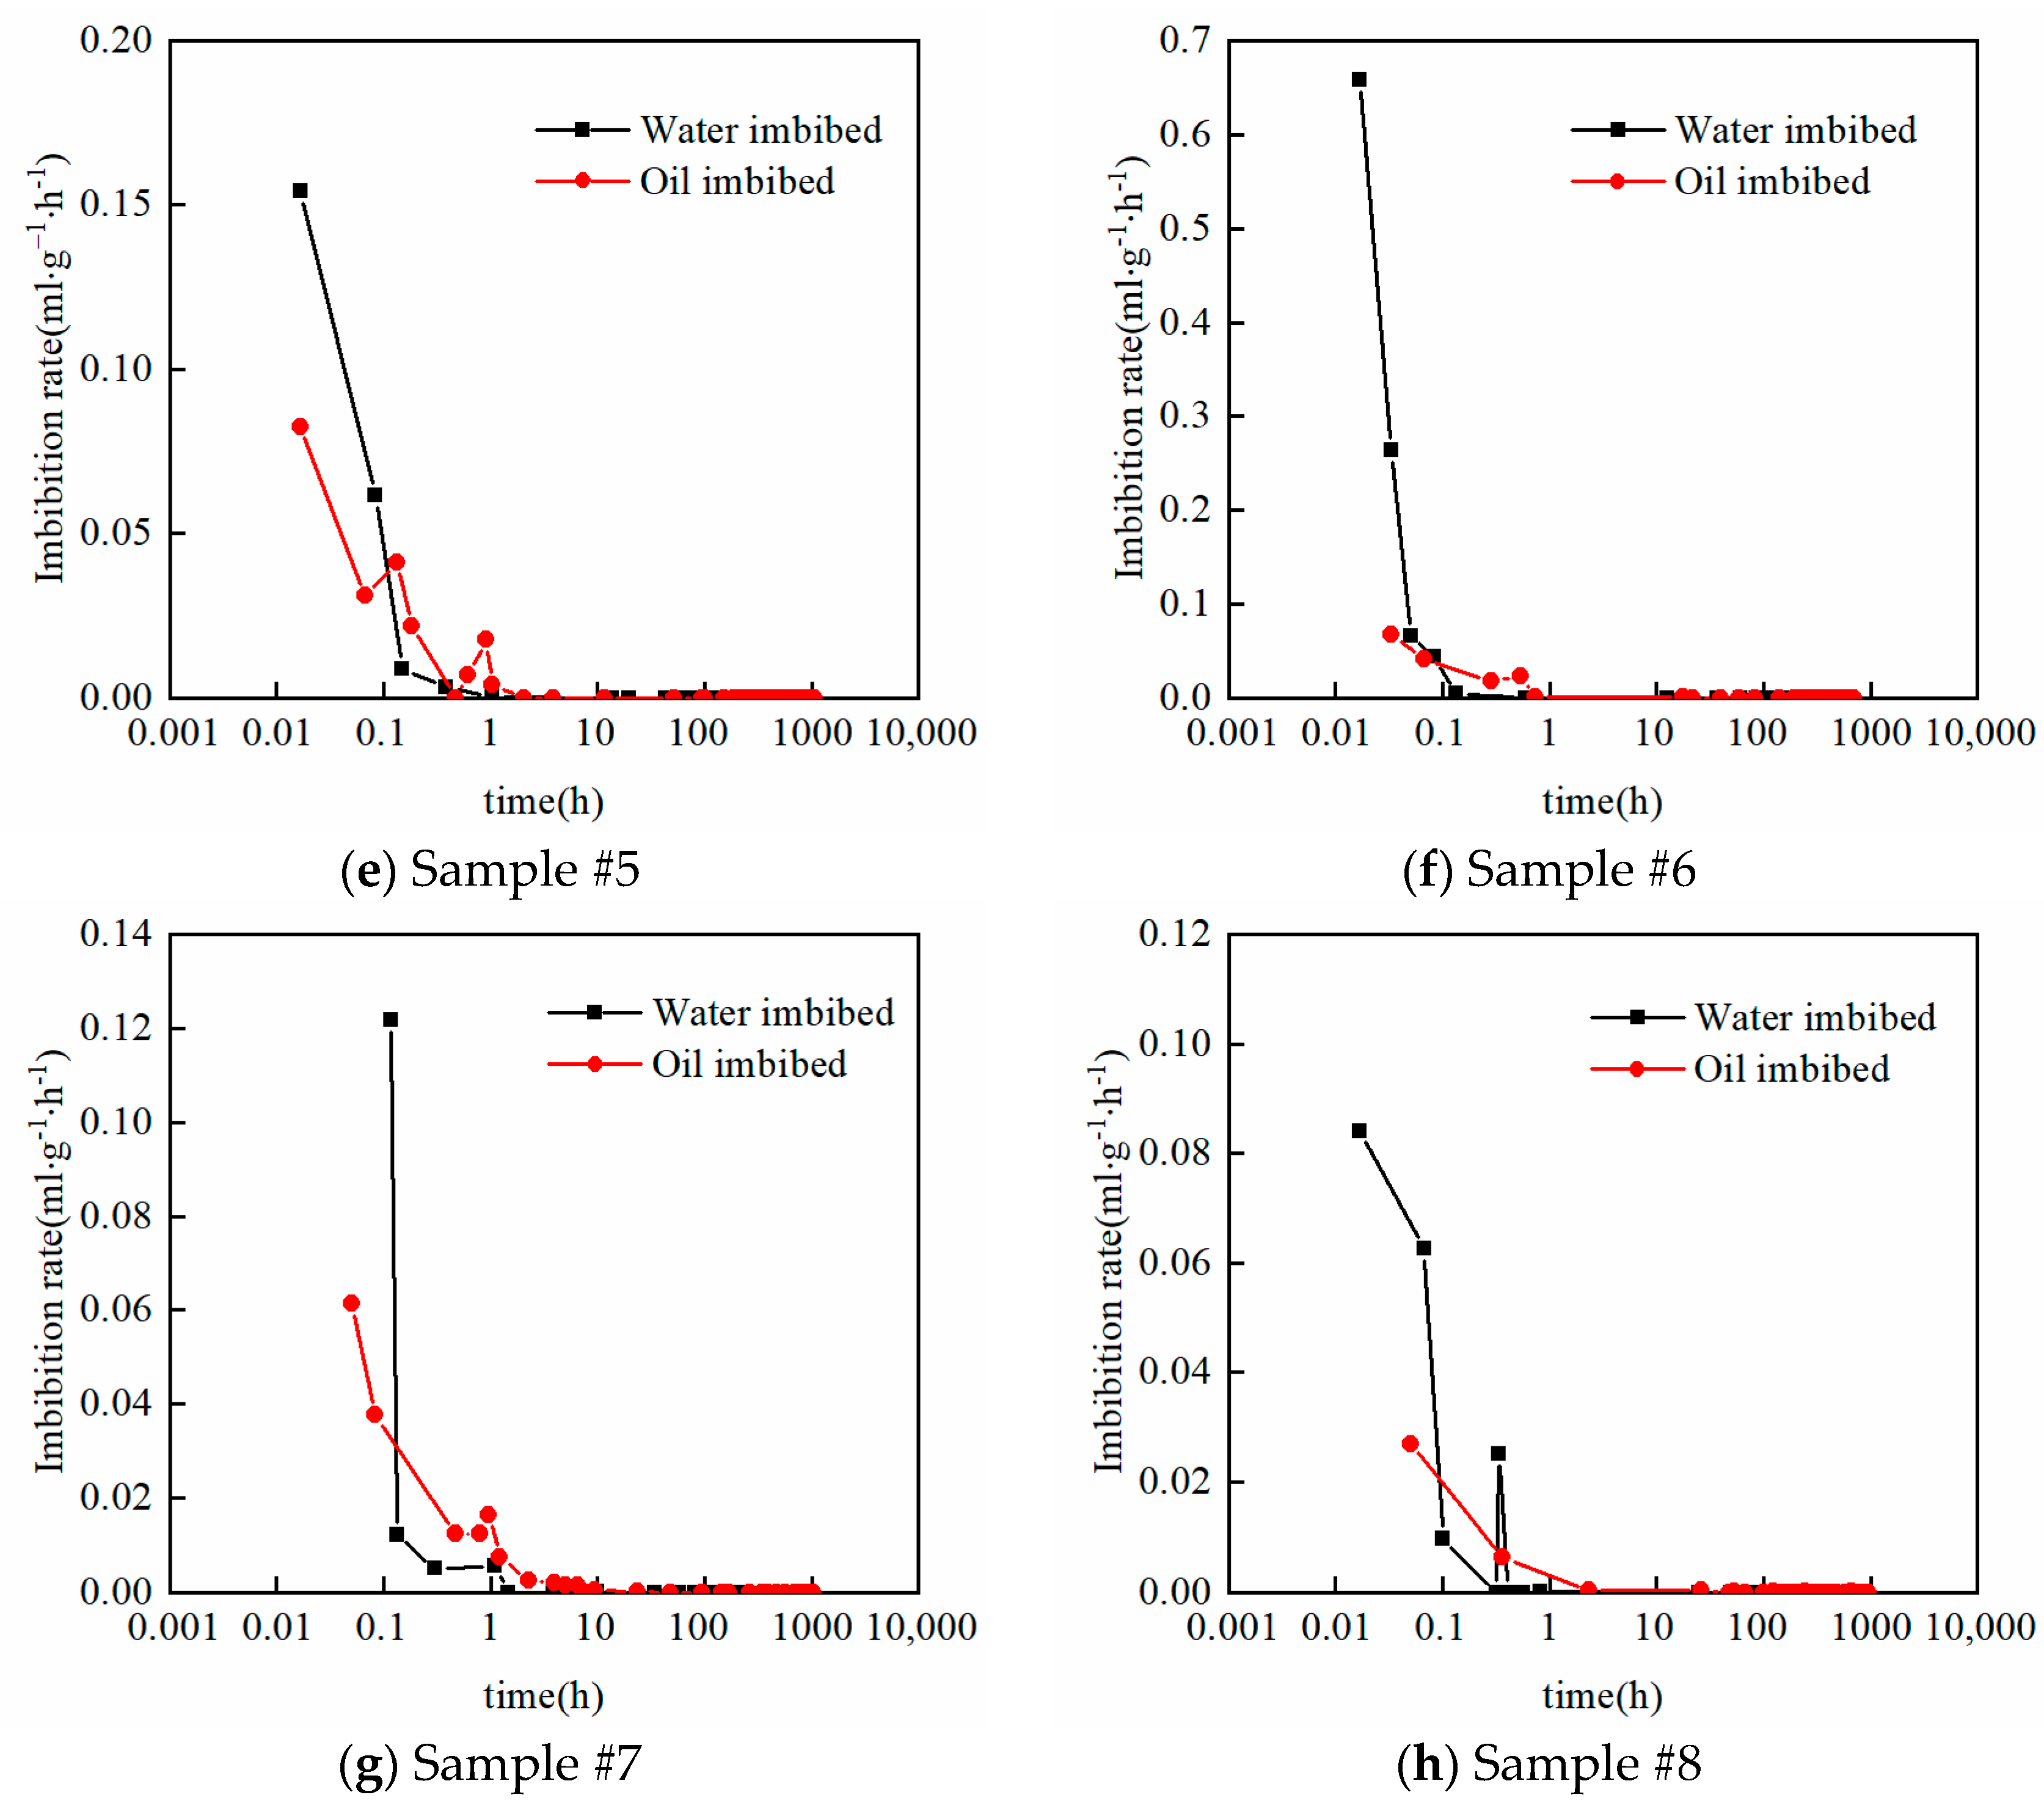
The imbibition time of oil is longer than that of water, which can be explained in following aspects. First, the overall pore size of organic pores is smaller than that of inorganic pores, resulting in lower permeability and poorer flow capacity of organic pores. Therefore, the flow of oil in organic pores is slower (as shown in Figure 5). Second, the viscosity of oil is higher than that of water, resulting in greater flow resistance, slowing down the flow velocity of oil. Furthermore, oil migrates in the organic matter by molecular diffusion, and the speed of diffusion movement is very slow, resulting in the continuous imbibition of oil into the sample at a lower speed in the later stage.
Based on the imbibed volumes of oil and water, we can distinguish organic and inorganic porosity and organic and inorganic saturation in shale and calculate the amount of ad/absorbed oil in kerogen. For example, the inorganic pore volume is equal to the imbibed water volume, because the imbibed water occupies all the inorganic pores. The gas-measured pore volume is the sum of the inorganic and organic pore volumes, so the organic pore volume is the gas-measured volume minus the imbibed-water volume. The imbibed oil is composed of the oil occupying pore space and the oil adsorbing or dissolving in kerogen, so the amount of ad/absorbed oil in kerogen is the imbibed oil volume minus the gas-measured pore volume.
In shale, besides organic matter, clay minerals also have adsorption effects on fluids due to the large specific surface area of the mineral. For shale samples with low levels of clay content, the analysis of vacuum-imbibition experimental data can ignore the influence of clay [21]. However, in this study, the samples from the Gulong shale have high levels of clay content, and clay has adsorption effects on both water and oil, so both water and oil can exist in an adsorbed state in the clay. The water imbibed into shale pores includes two parts: free water in inorganic pores, and adsorbed water in clay. The oil imbibed into shale pores includes four parts: free oil in inorganic pores, adsorbed oil in clay, free oil in organic pores, and ad/absorbed oil in kerogen.
The adsorption effect of clay on oil and water cannot be ignored for the determination of inorganic/organic porosity and saturation. For example, due to the large amount of adsorbed water in clay, if the influence of clay is not considered, the imbibed water volume is equal to the inorganic pore volume, resulting in an overestimation of the inorganic pore volume. Therefore, when analyzing the vacuum-imbibition data, it is necessary to further consider the adsorption effects of clay on oil and water.
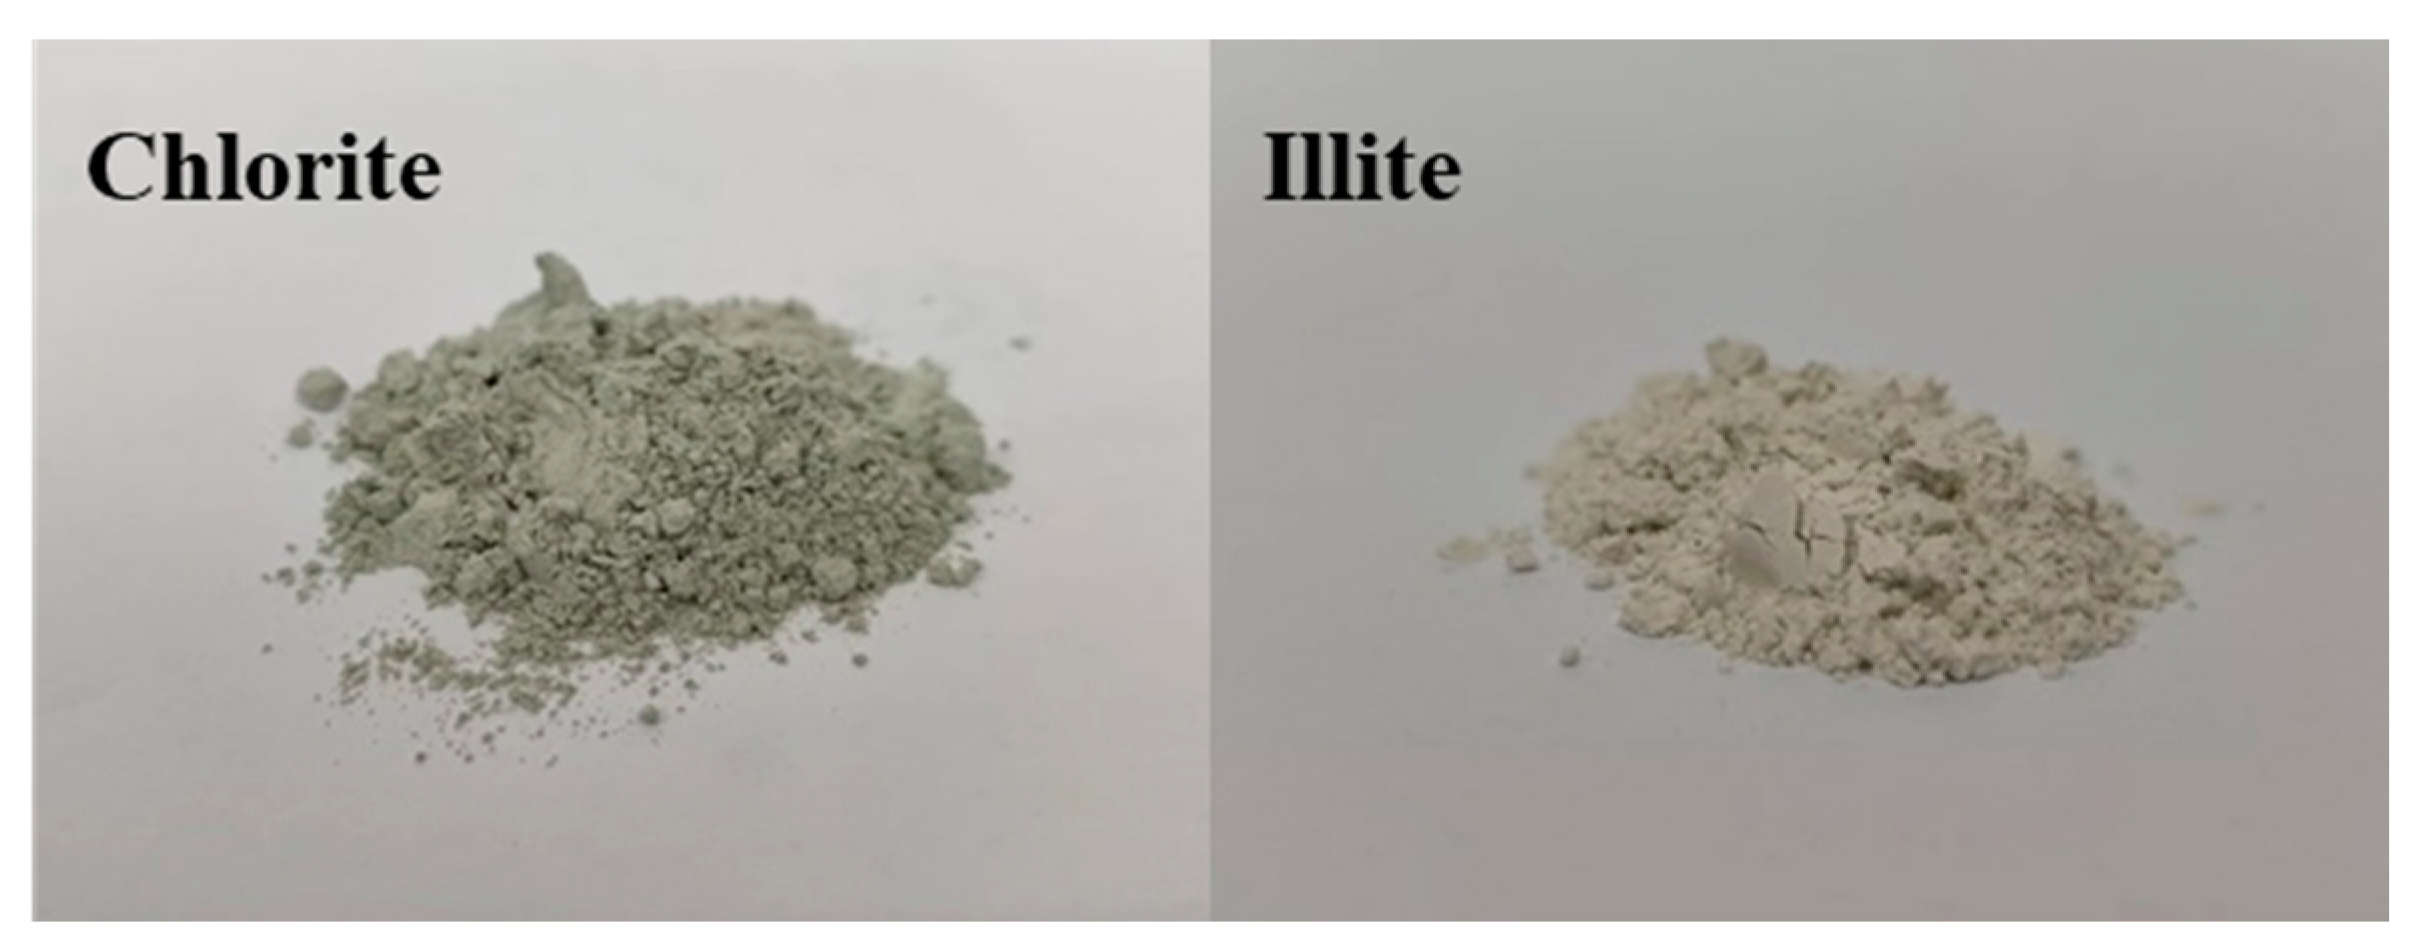
The clay composition of the selected shale samples is shown in Table 2. The clay components are dominated by illite, chlorite, and illite–chlorite mixed layers, with illite and chlorite accounting for the majority. Therefore, we selected pure samples of illite and chlorite to analyze the adsorption of clay on oil and water. The samples of illite and chlorite are shown in Figure 6. The experimental method and process were the same as those for the shale samples.
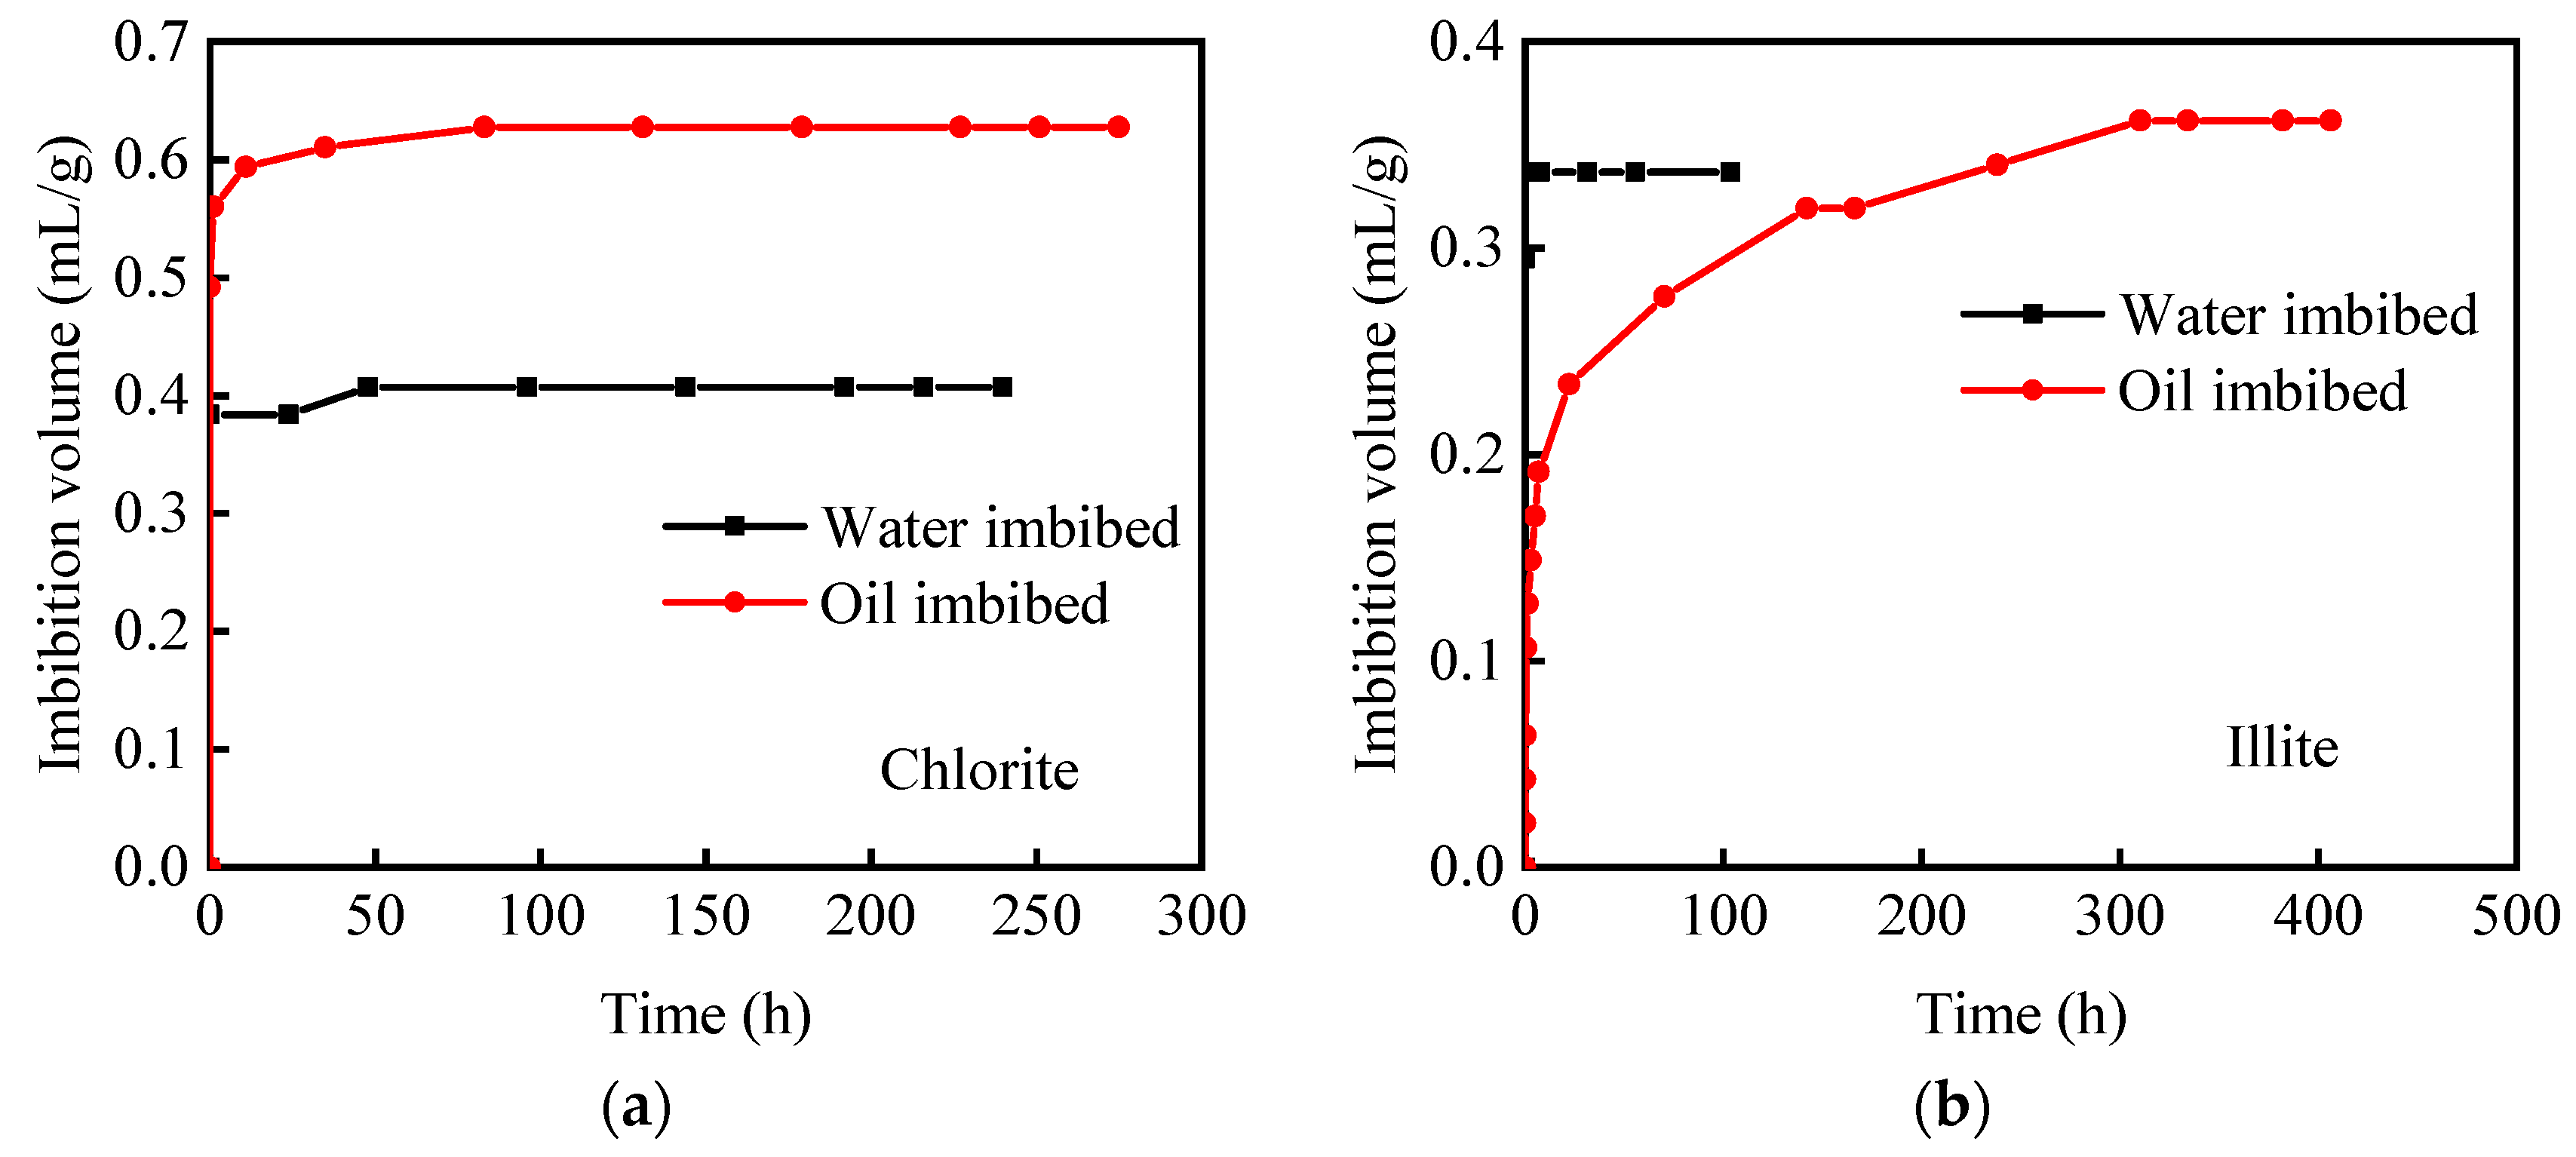
Figure 7 shows the vacuum-imbibition curves of water and oil in chlorite and illite samples. The vacuum-imbibition curve characteristics of illite and chlorite are similar to those of shale samples, with higher imbibition rates of oil and water in the early stage, followed by a decrease in the imbibition rate in the later stage. The final level of imbibed oil is higher than that of water, and the time for oil imbibition is longer than that for water. The time for oil and water imbibition to reach equilibrium in clay samples is shorter than that in shale samples, which is due to the lower mass of clay samples in the experiment, resulting in a reduced time for oil and water imbibition to reach equilibrium.
The imbibition curves of illite and chlorite show a difference in the imbibed volumes of oil and water. The final imbibed oil and imbibed water volumes of chlorite are higher than those of illite, indicating that the adsorption capacity of chlorite is stronger than that of illite. Through the vacuum-imbibition experiment, we determined that the adsorbed water volume and adsorbed oil volume in chlorite are 0.41 mL/g and 0.63 mL/g, respectively, and the adsorbed water volume and adsorbed oil volume in illite are 0.34 mL/g and 0.36 mL/g, respectively.
The oil and water imbibed volumes of the shale rock samples were calculated by removing the volumes adsorbed in chlorite and illite; the inorganic/organic porosity and saturation can then be calculated, and is shown in Table 3:
(1)
Inorganic porosity: The ratio of the inorganic pore volume to the apparent volume of the crushed sample. The inorganic pore volume is calculated by subtracting the adsorbed water volume in clay from the gas-measured pore volume.
(2)
Organic porosity: The ratio of the organic pore volume to the apparent volume of the crushed sample. The organic pore volume is the gas-measured pore volume minus the inorganic pore volume.
(3)
Inorganic saturation: The ratio of the volume of oil imbibed into the inorganic material to the total volume of imbibed oil. The oil imbibed into the inorganic material is the sum of the free oil in the inorganic pores (inorganic pore volume) and the clay-adsorbed oil.
(4)
Organic saturation: The ratio of the volume of oil imbibed into the organic matter to the total volume of imbibed oil. The oil imbibed into the organic matter is the sum of the free oil in organic pores and the ad/absorbed oil in the organic matter.
(5)
The percentage of adsorbed water in clay: The ratio of the clay-adsorbed water volume to the water volume within the inorganic matter.
(6)
The percentages of ad/absorbed oil in organic matter: The ratio of the volume of ad/absorbed oil in the organic matter to the volume of oil within the organic matter.
As typical components in shale, clay and organic matter control the pore spaces. Additionally, clay and organic matter have adsorption and dissolution effects on the oil and water, affecting the fluid content of shale. In this study, by combining mineral composition analysis and vacuum-imbibition experimental data, the effects of clay content and TOC on the inorganic/organic porosity and saturation were investigated.
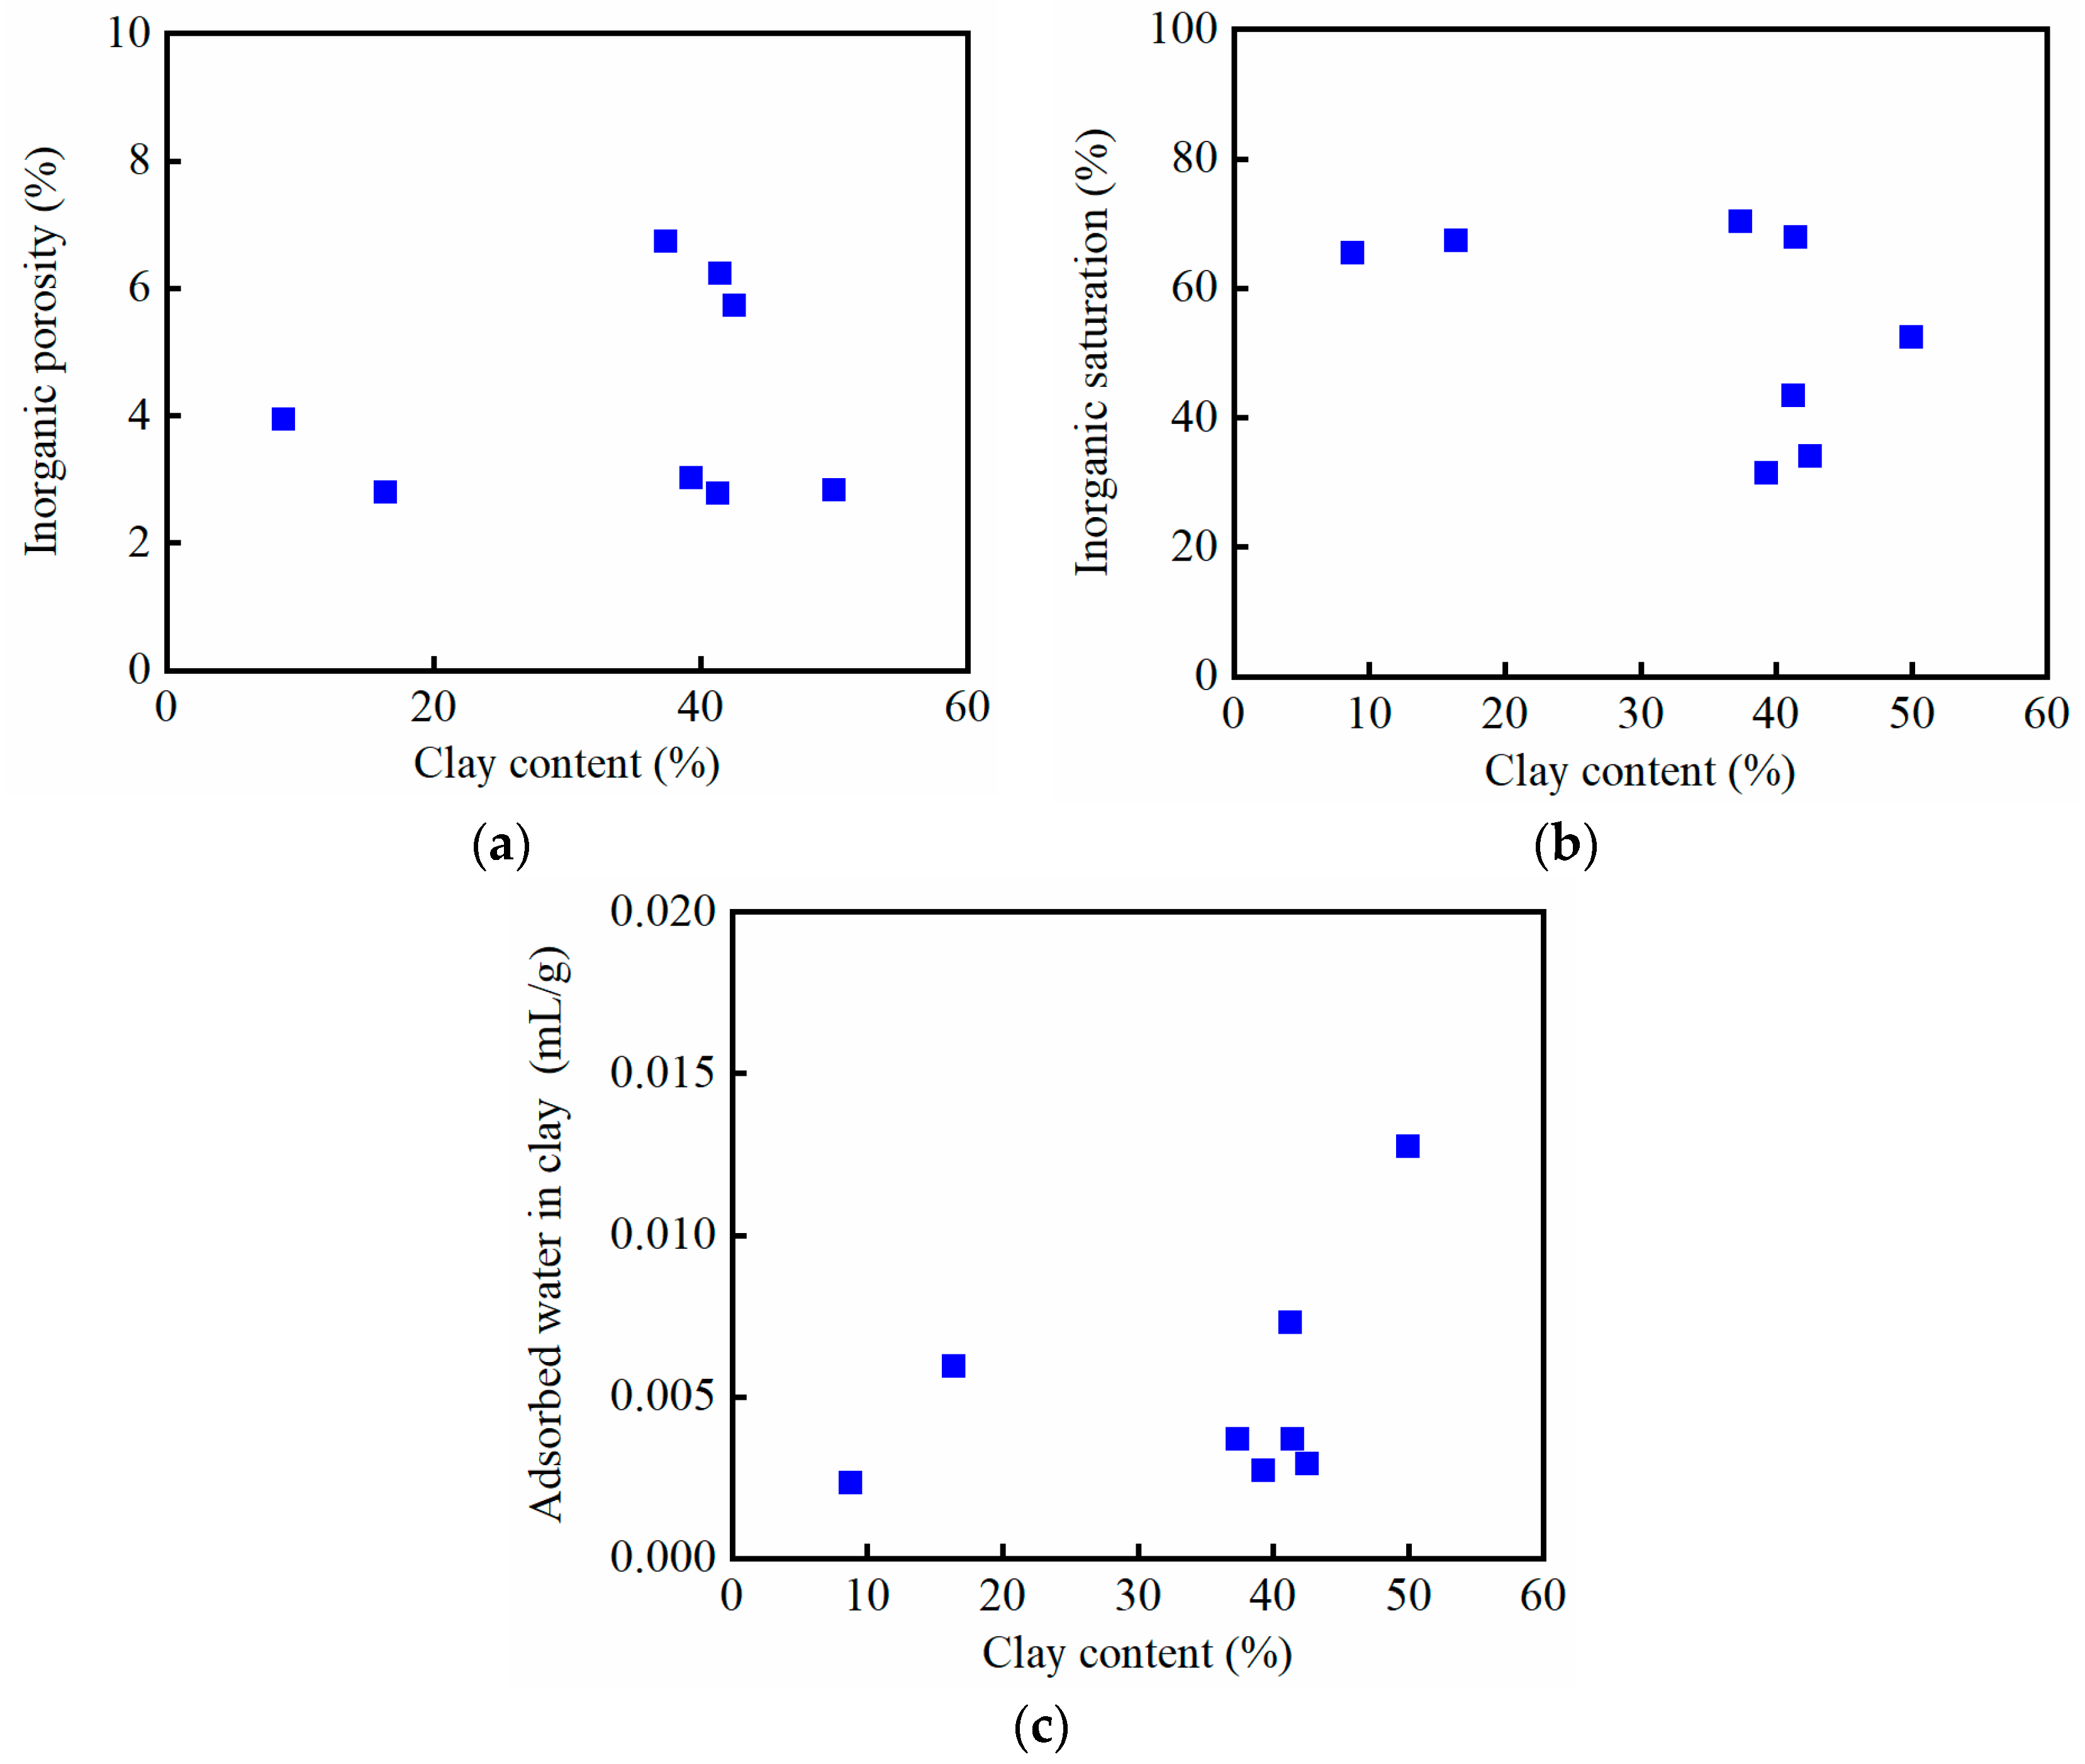
Figure 8 shows the trends of inorganic porosity (a), inorganic saturation (b), and adsorbed water in clay (c), together with the clay content levels of the shale samples. Figure 8a shows that the inorganic porosity has a weak growth trend with increases in clay content, which is related to the pore structure of clay in the shale samples. According to previous SEM scanning results, the pores in clay minerals are relatively developed, while the number of pores in other inorganic minerals is relatively low. In this case, as the clay content increases, the number and volume of inorganic pores increase, resulting in an increase in inorganic porosity. The relationship between inorganic saturation and clay content is not clear (as shown in Figure 8b). This is because the rock samples also contain other types of inorganic minerals besides clay, and the degree of their pore space development also affects inorganic saturation. Figure 8c shows that the content of adsorbed water in clay has a weak correlation with the clay content levels. The higher the level of clay content, the greater the specific surface area of pores, resulting in a stronger adsorption capacity.
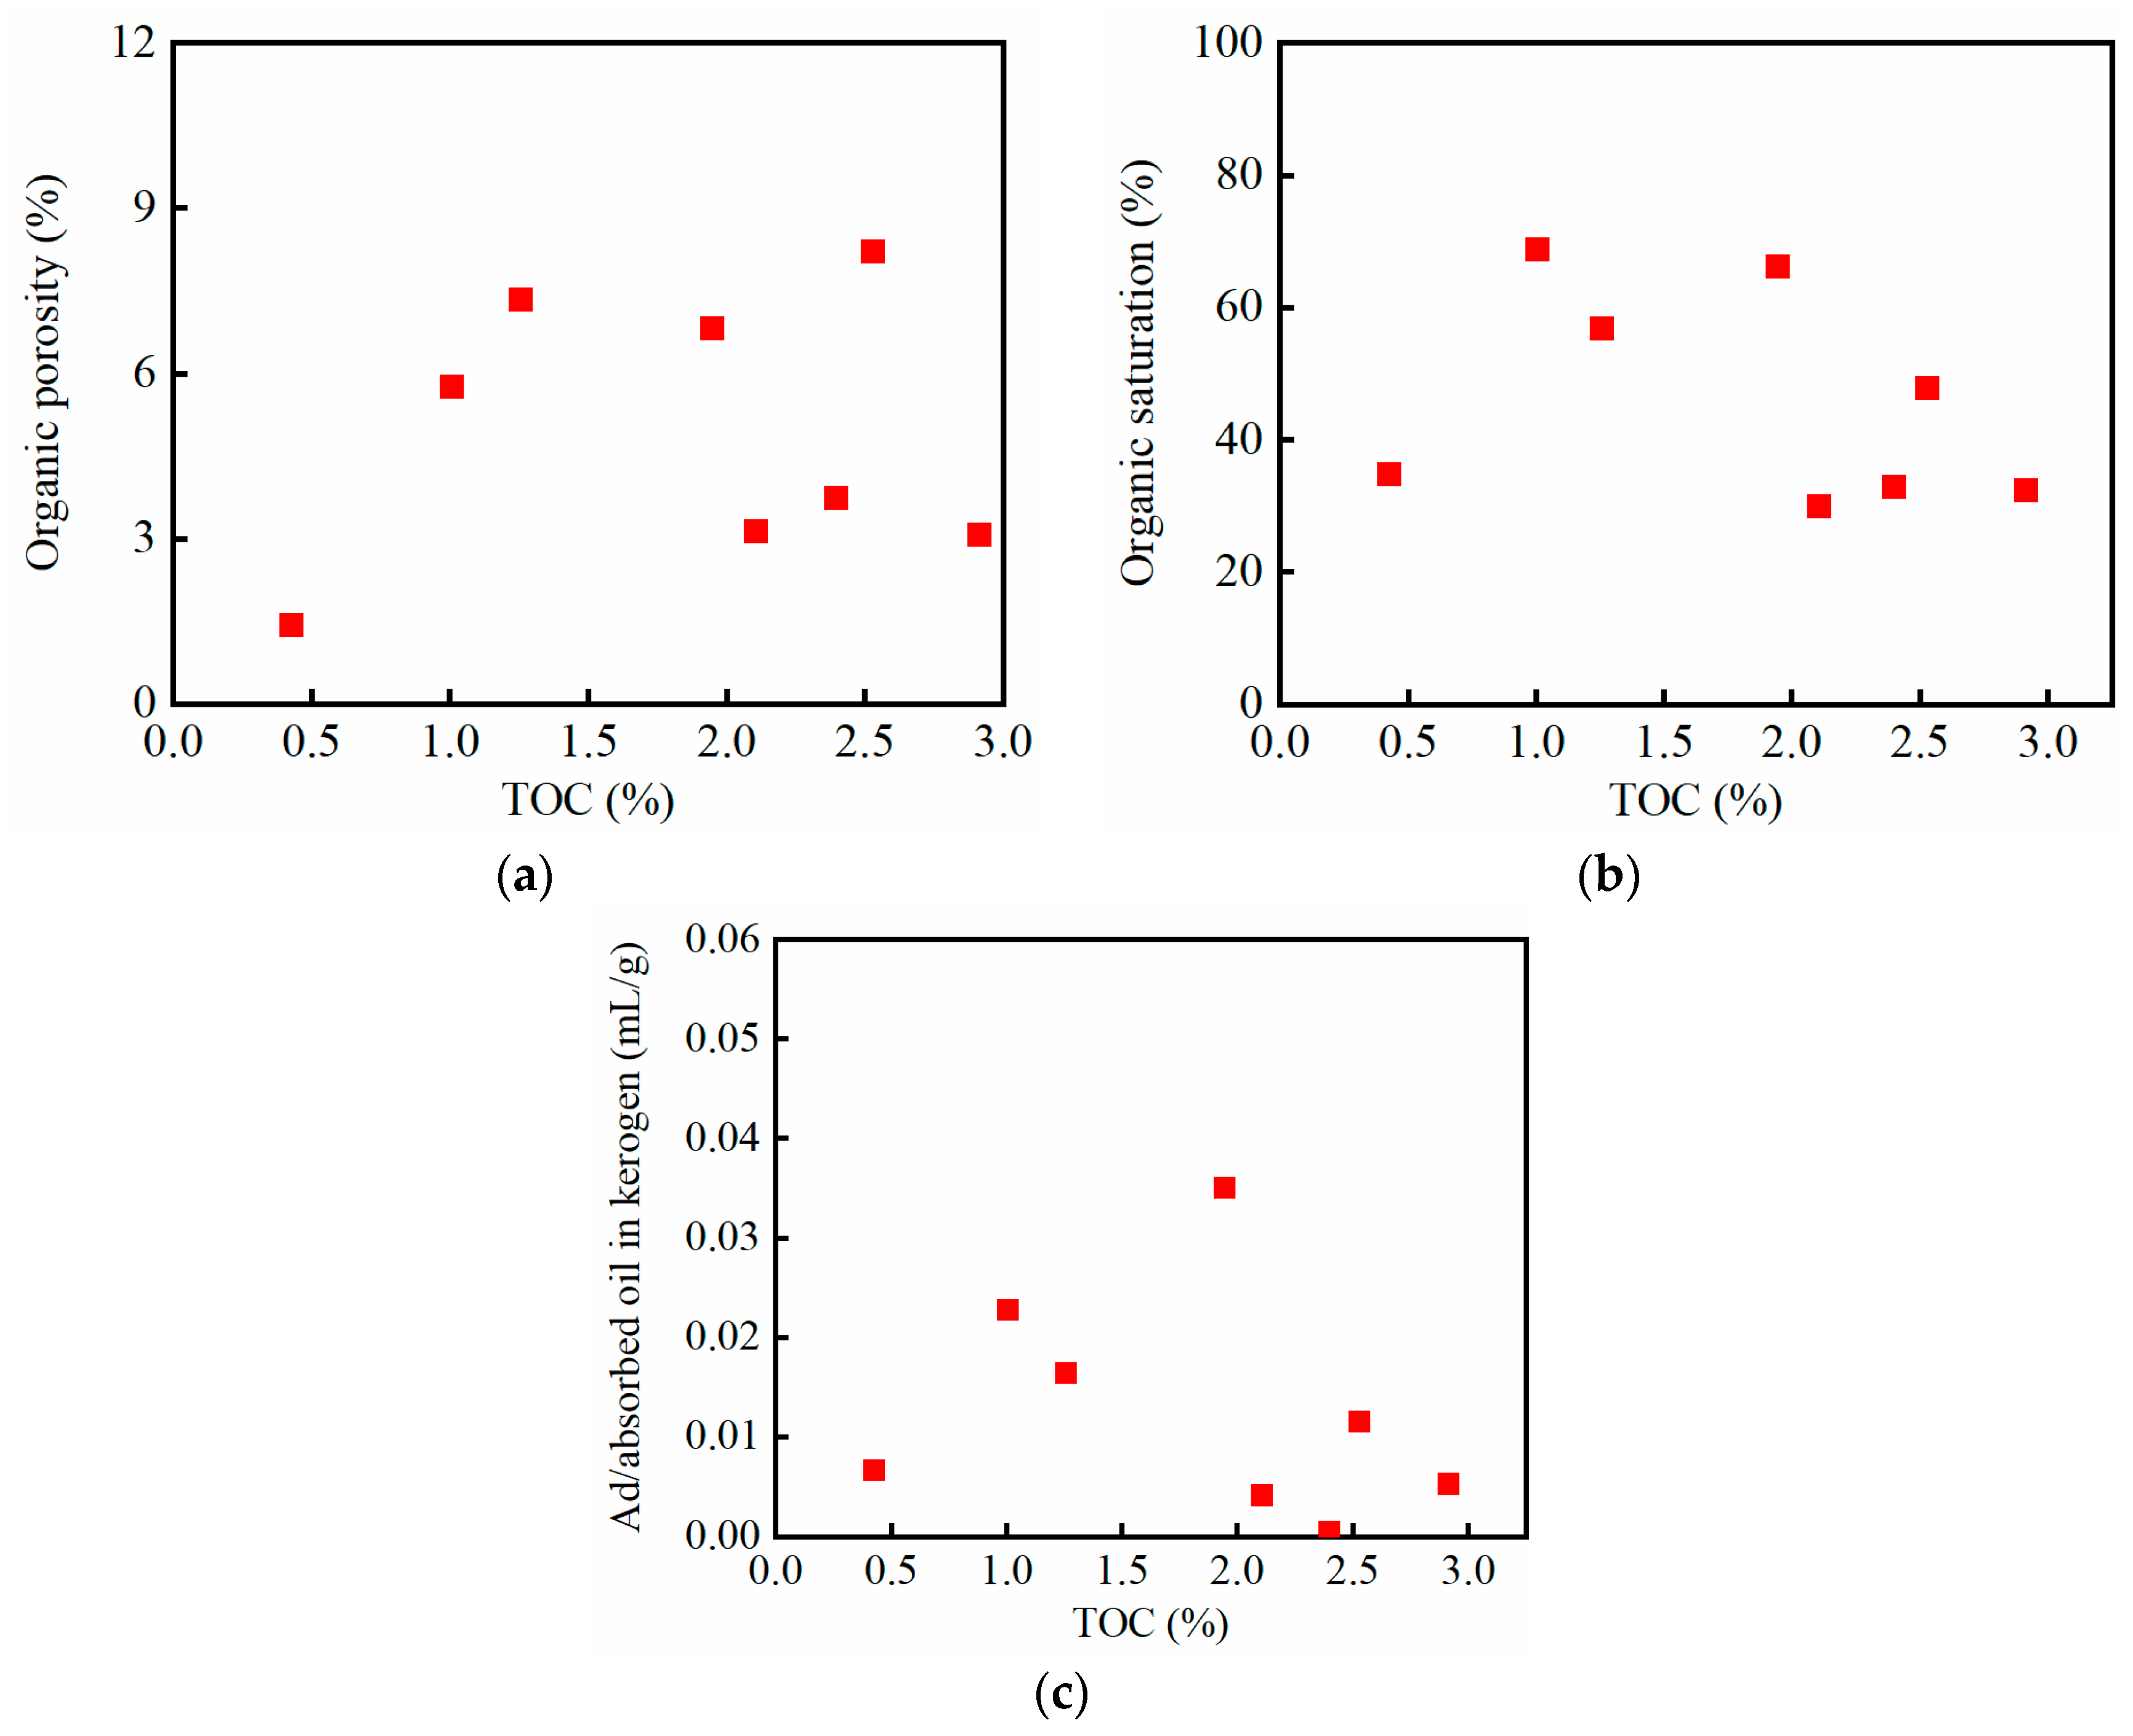
Figure 9 shows the trends of organic porosity (a), organic saturation (b), and ad/absorbed oil (c) with the TOC of the shale samples. There are a large number of pores in organic matter, and the higher the organic matter content level, the more the organic pore space should be. However, the results showed that the organic porosity has a weak growth trend with increases in the TOC. More test results are still needed to obtain a more obvious correlation. Figure 9b,c indicate that the relationships between both organic saturation and the amount of ad/absorbed oil in kerogen and the TOC are not clear. The adsorption capacity of organic matter is not only related to its content, but also affected by thermal maturity and kerogen type. The organic-matter properties of the shale samples tested are complex, so the organic saturation and the ad/absorbed oil content in kerogen do not show strong correlations with organic matter content.

3.3. NMR Spectrum of Fluid in Different States

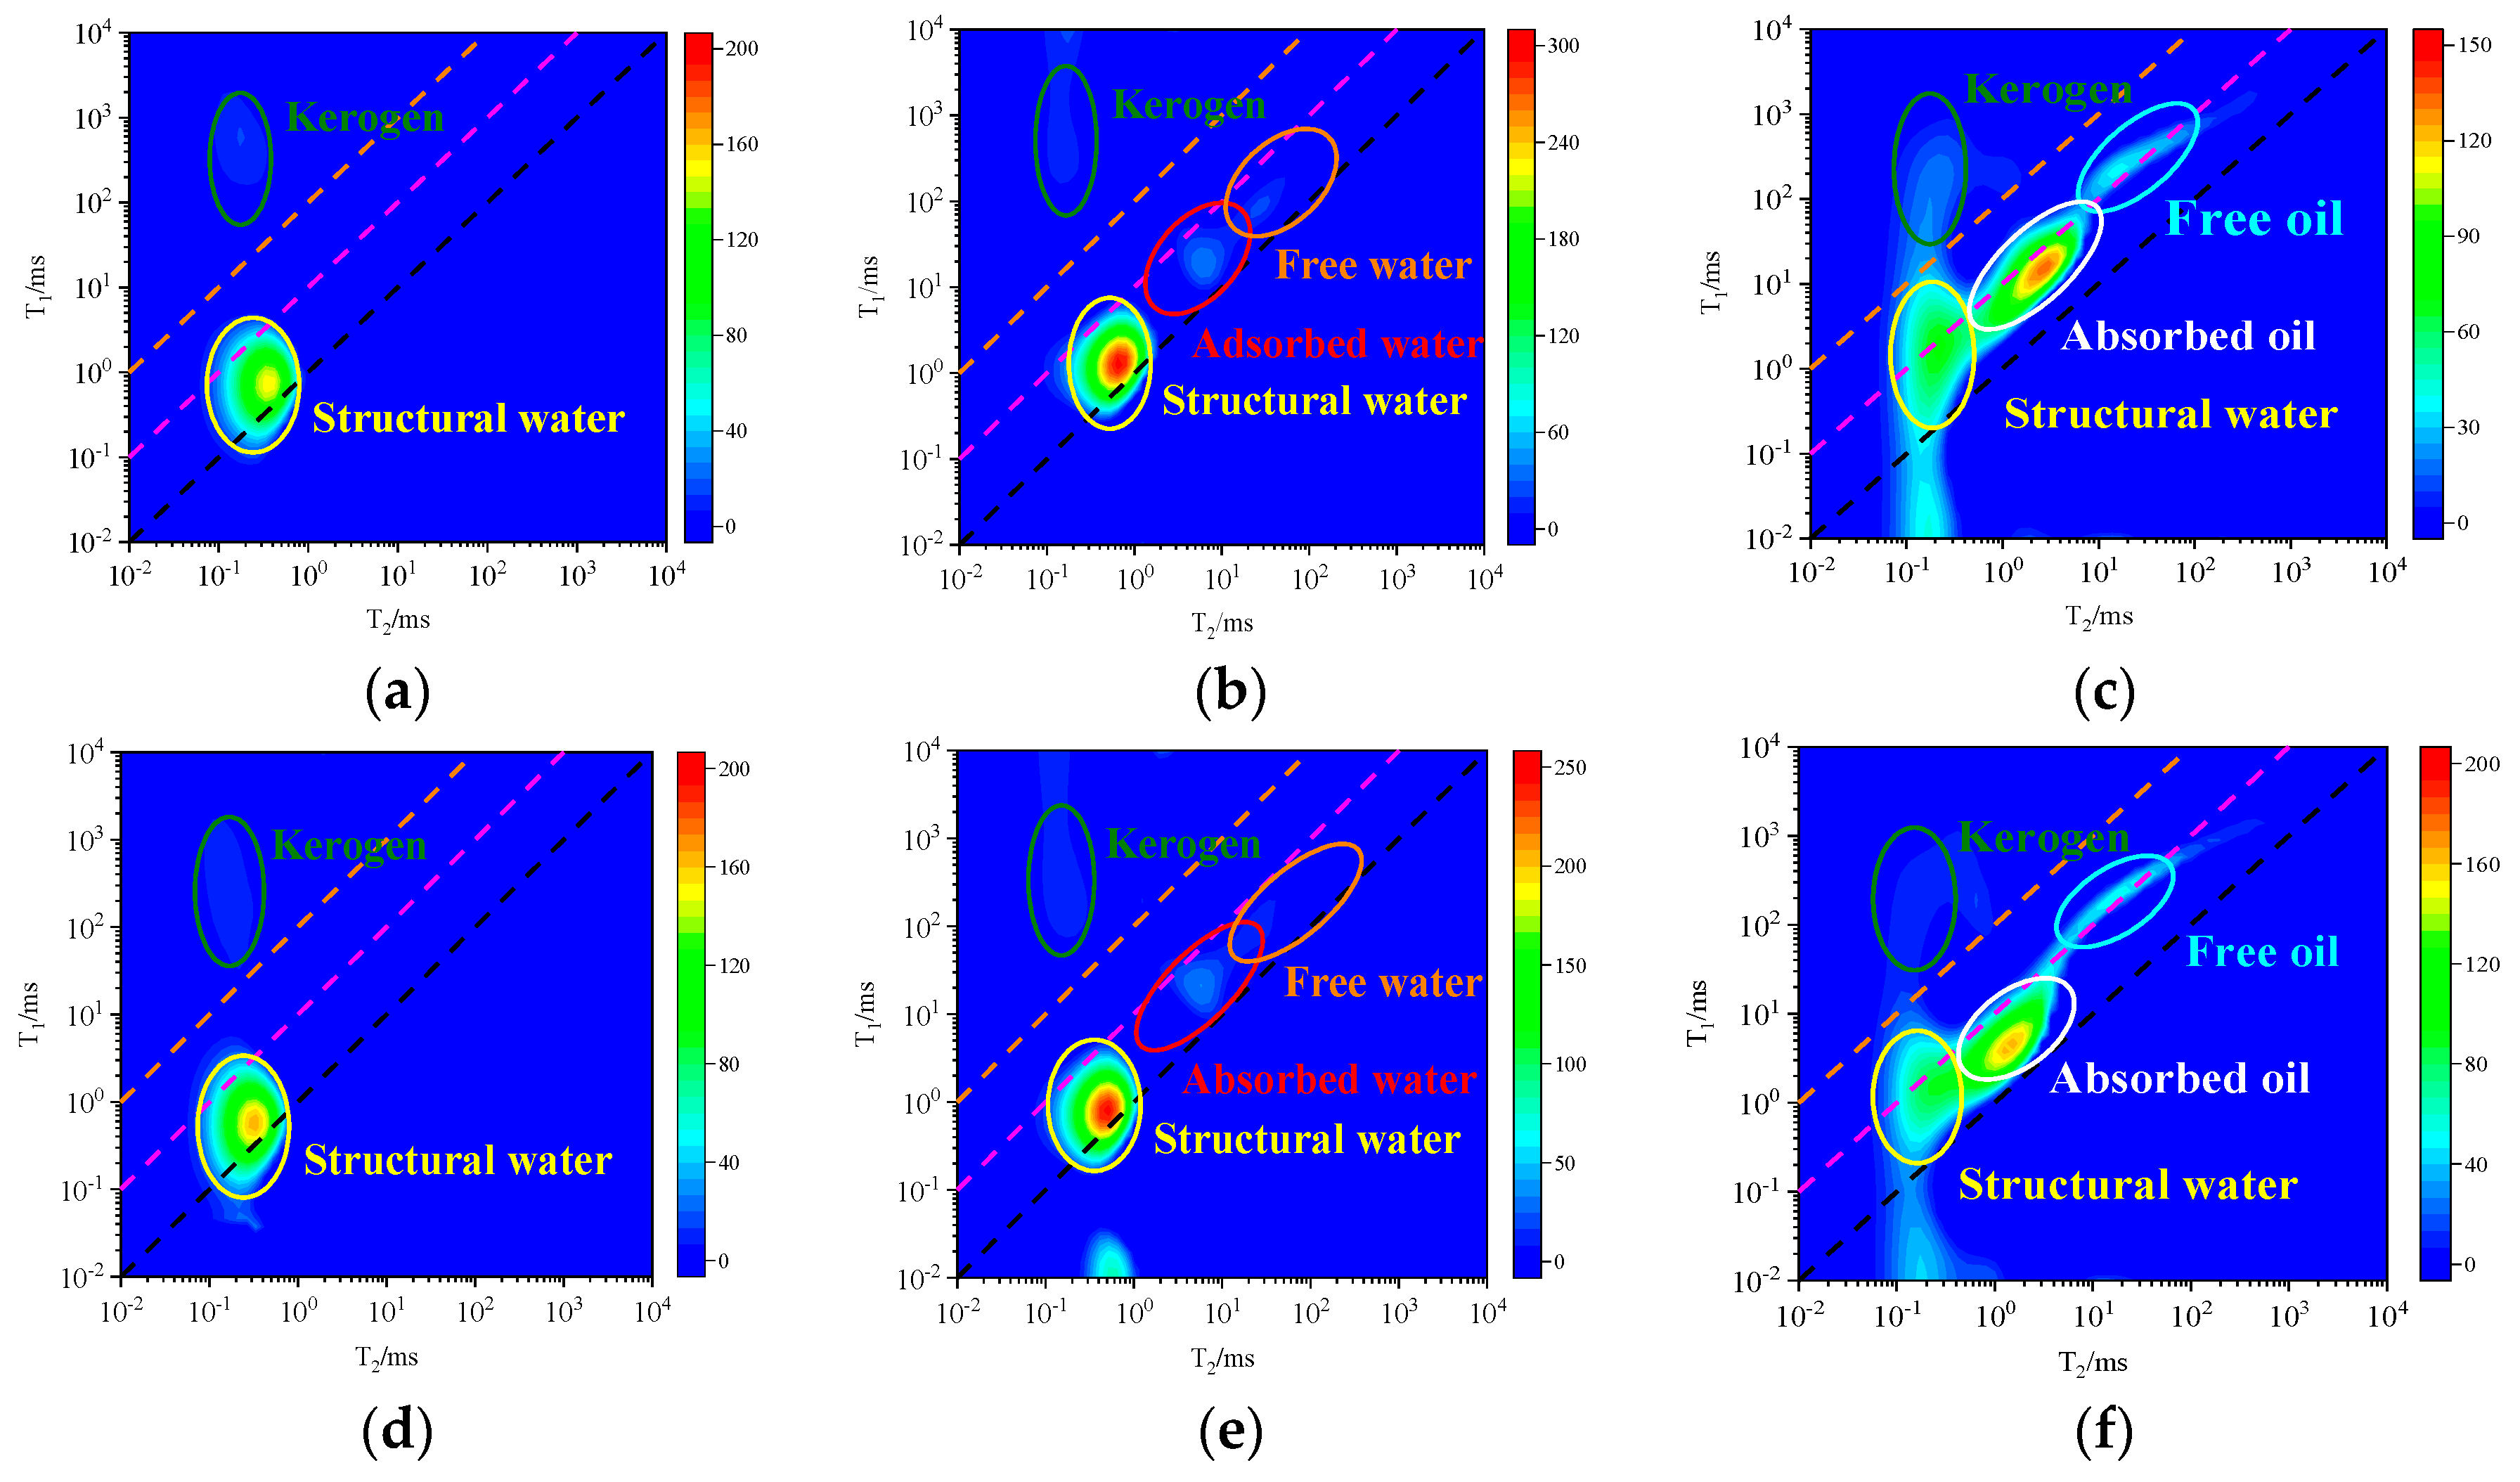
Li et al. [24] established an NMR T1-T2 map division method for distinguishing each hydrogen-bearing component. According to the T1–T2 map proposed by Li et al. [24], we identify the signals corresponding to different components. Figure 10 shows the T1–T2 map of shale samples before and after imbibition experiments. It can be seen that water is dominated by free water and structural water, while oil is dominated by free oil and adsorbed oil. The signal intensity of oil is significantly greater than that of water, which is consistent with the vacuum-imbibition experimental results.

3.4. Mathematical Model Coupling Organic and Inorganic Pores Considering Ad/Absorbed Fluid in Organic Matter and Clay

The continuous dual-porosity method is applied to simulate the oil–water imbibition process, in which the water phase flows only into the inorganic pores, while the oil phase flows into both inorganic and organic pores. The oil–water imbibition curve is fitted to solve for the permeabilities of inorganic and organic pores.
Shale reservoirs are composed of two continuous media systems: inorganic pores and organic pores. The two systems are coupled, and there is fluid exchange, forming a complex multi-scale coupled-flow system. Due to the different mineral compositions and pore-size distributions of inorganic and organic pores, there are differences in the permeabilities of the two systems. Considering the above factors, mathematical models for oil and water vacuum-imbibition are established. The basic assumptions of the model are as follows:
(1)
Oil exists in the form of a free state in inorganic pores, in the form of a free state and an adsorbed state in clay pores, and in the forms of an adsorbed state and a free state in organic pores.
(2)
Water only flows into inorganic pores. Oil can enter both organic and inorganic pores.
(3)
The matrix and the fluid are slightly compressible, and the influence of gravity is neglected.
(4)
The shale sample is spherical and isotropic.
(5)
During the experiment, the temperature and boundary pressure remained constant.
(6)
The adsorption of clay and kerogen on oil is considered. The adsorption amount is not a function of time, which means that the adsorption process is instantaneous.
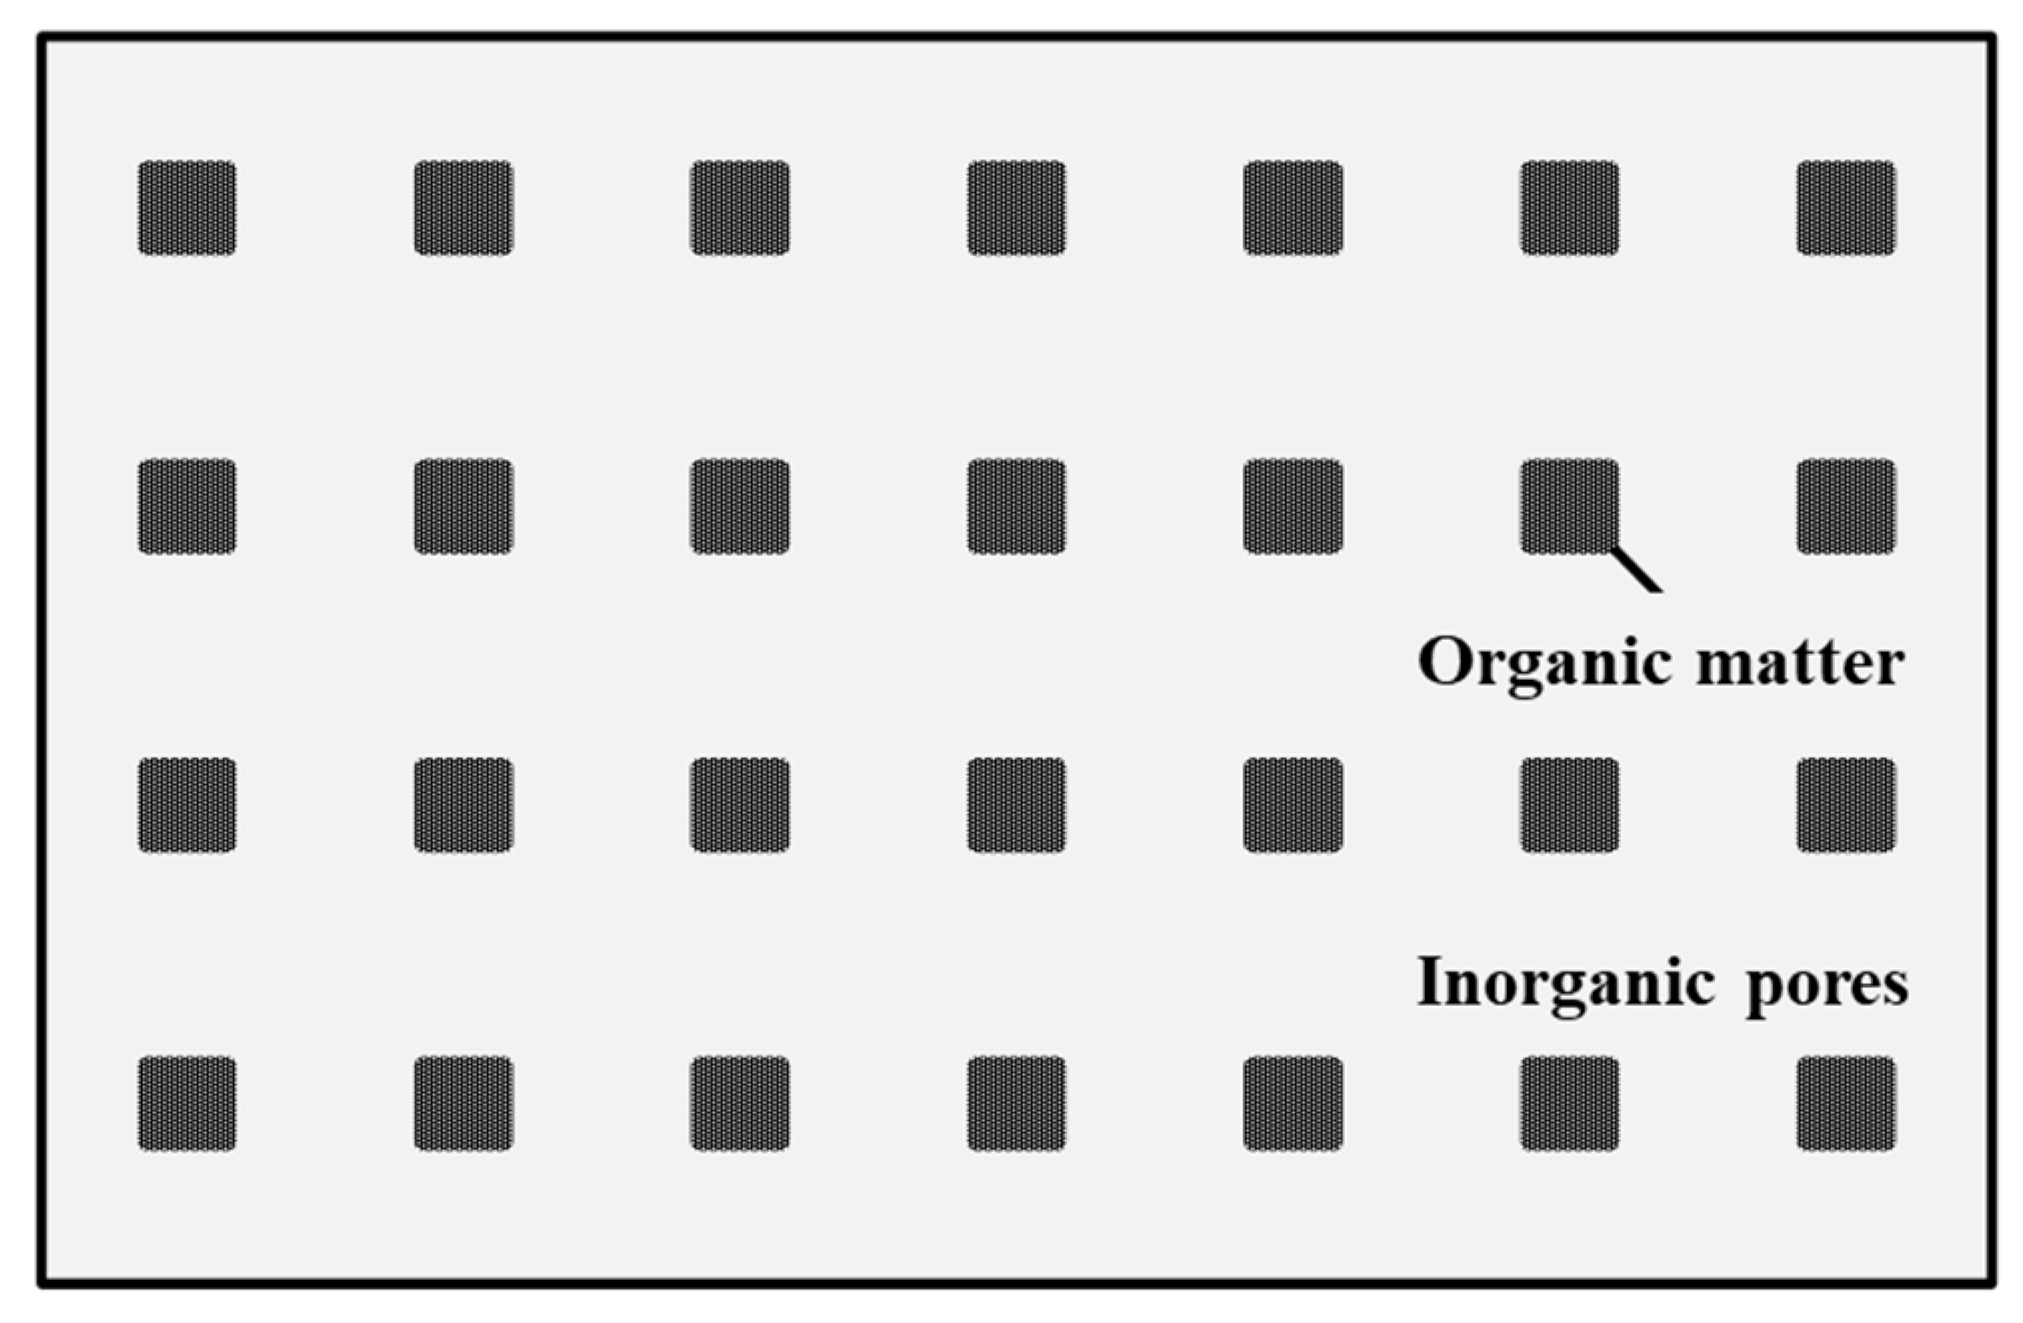
The organic–inorganic dual-medium model is shown in Figure 11, and the flow equations for inorganic pores and organic pores are shown in Equations (1) and (2).
ρ l k im μ l p im q = ρ l c t _ im p im t + R m C s t l = o , w
ρ l k om μ l p om + q + β q m = ρ l c t _ om p om t l = o
q = α ρ l k im μ l p im p om
where q is the cross-flow between inorganic and organic pores, kg/(m3∙s); Cs is adsorption mass per unit volume of clay, kg/m3; Rm is the percentage of clay mass, Fraction; rl is the density of liquid, kg/m3; kim is the permeability of inorganic pores, m2; μL is the viscosity of liquid, Pa∙s; Pim is the pressure of inorganic pores, Pa; ct_im is the compression coefficient of inorganic pores, 1/Pa; t is the time, s; kom is the permeability of organic pores, m2; Pom is the pressure of organic pores, Pa; ct_om is the compression coefficient of organic pores, 1/Pa; qm is the flow of ad/absorbed oil per unit volume, kg/(m3∙s); β is proportion of organic matter, Fraction; α is cross flow coefficient, 1/m2.
The finite-difference method is used to solve the mathematical model of water imbibition, and the numerical solution is fitted to the experimental results. The fitting accuracy is improved by adjusting the inorganic permeability, and the cumulative flow curve with the best fitting-effect is obtained, thus determining the inorganic permeability. The determined inorganic permeability is then substituted into the oil imbibition equation, and the organic permeability is obtained by changing the organic permeability under the best-fitting accuracy.
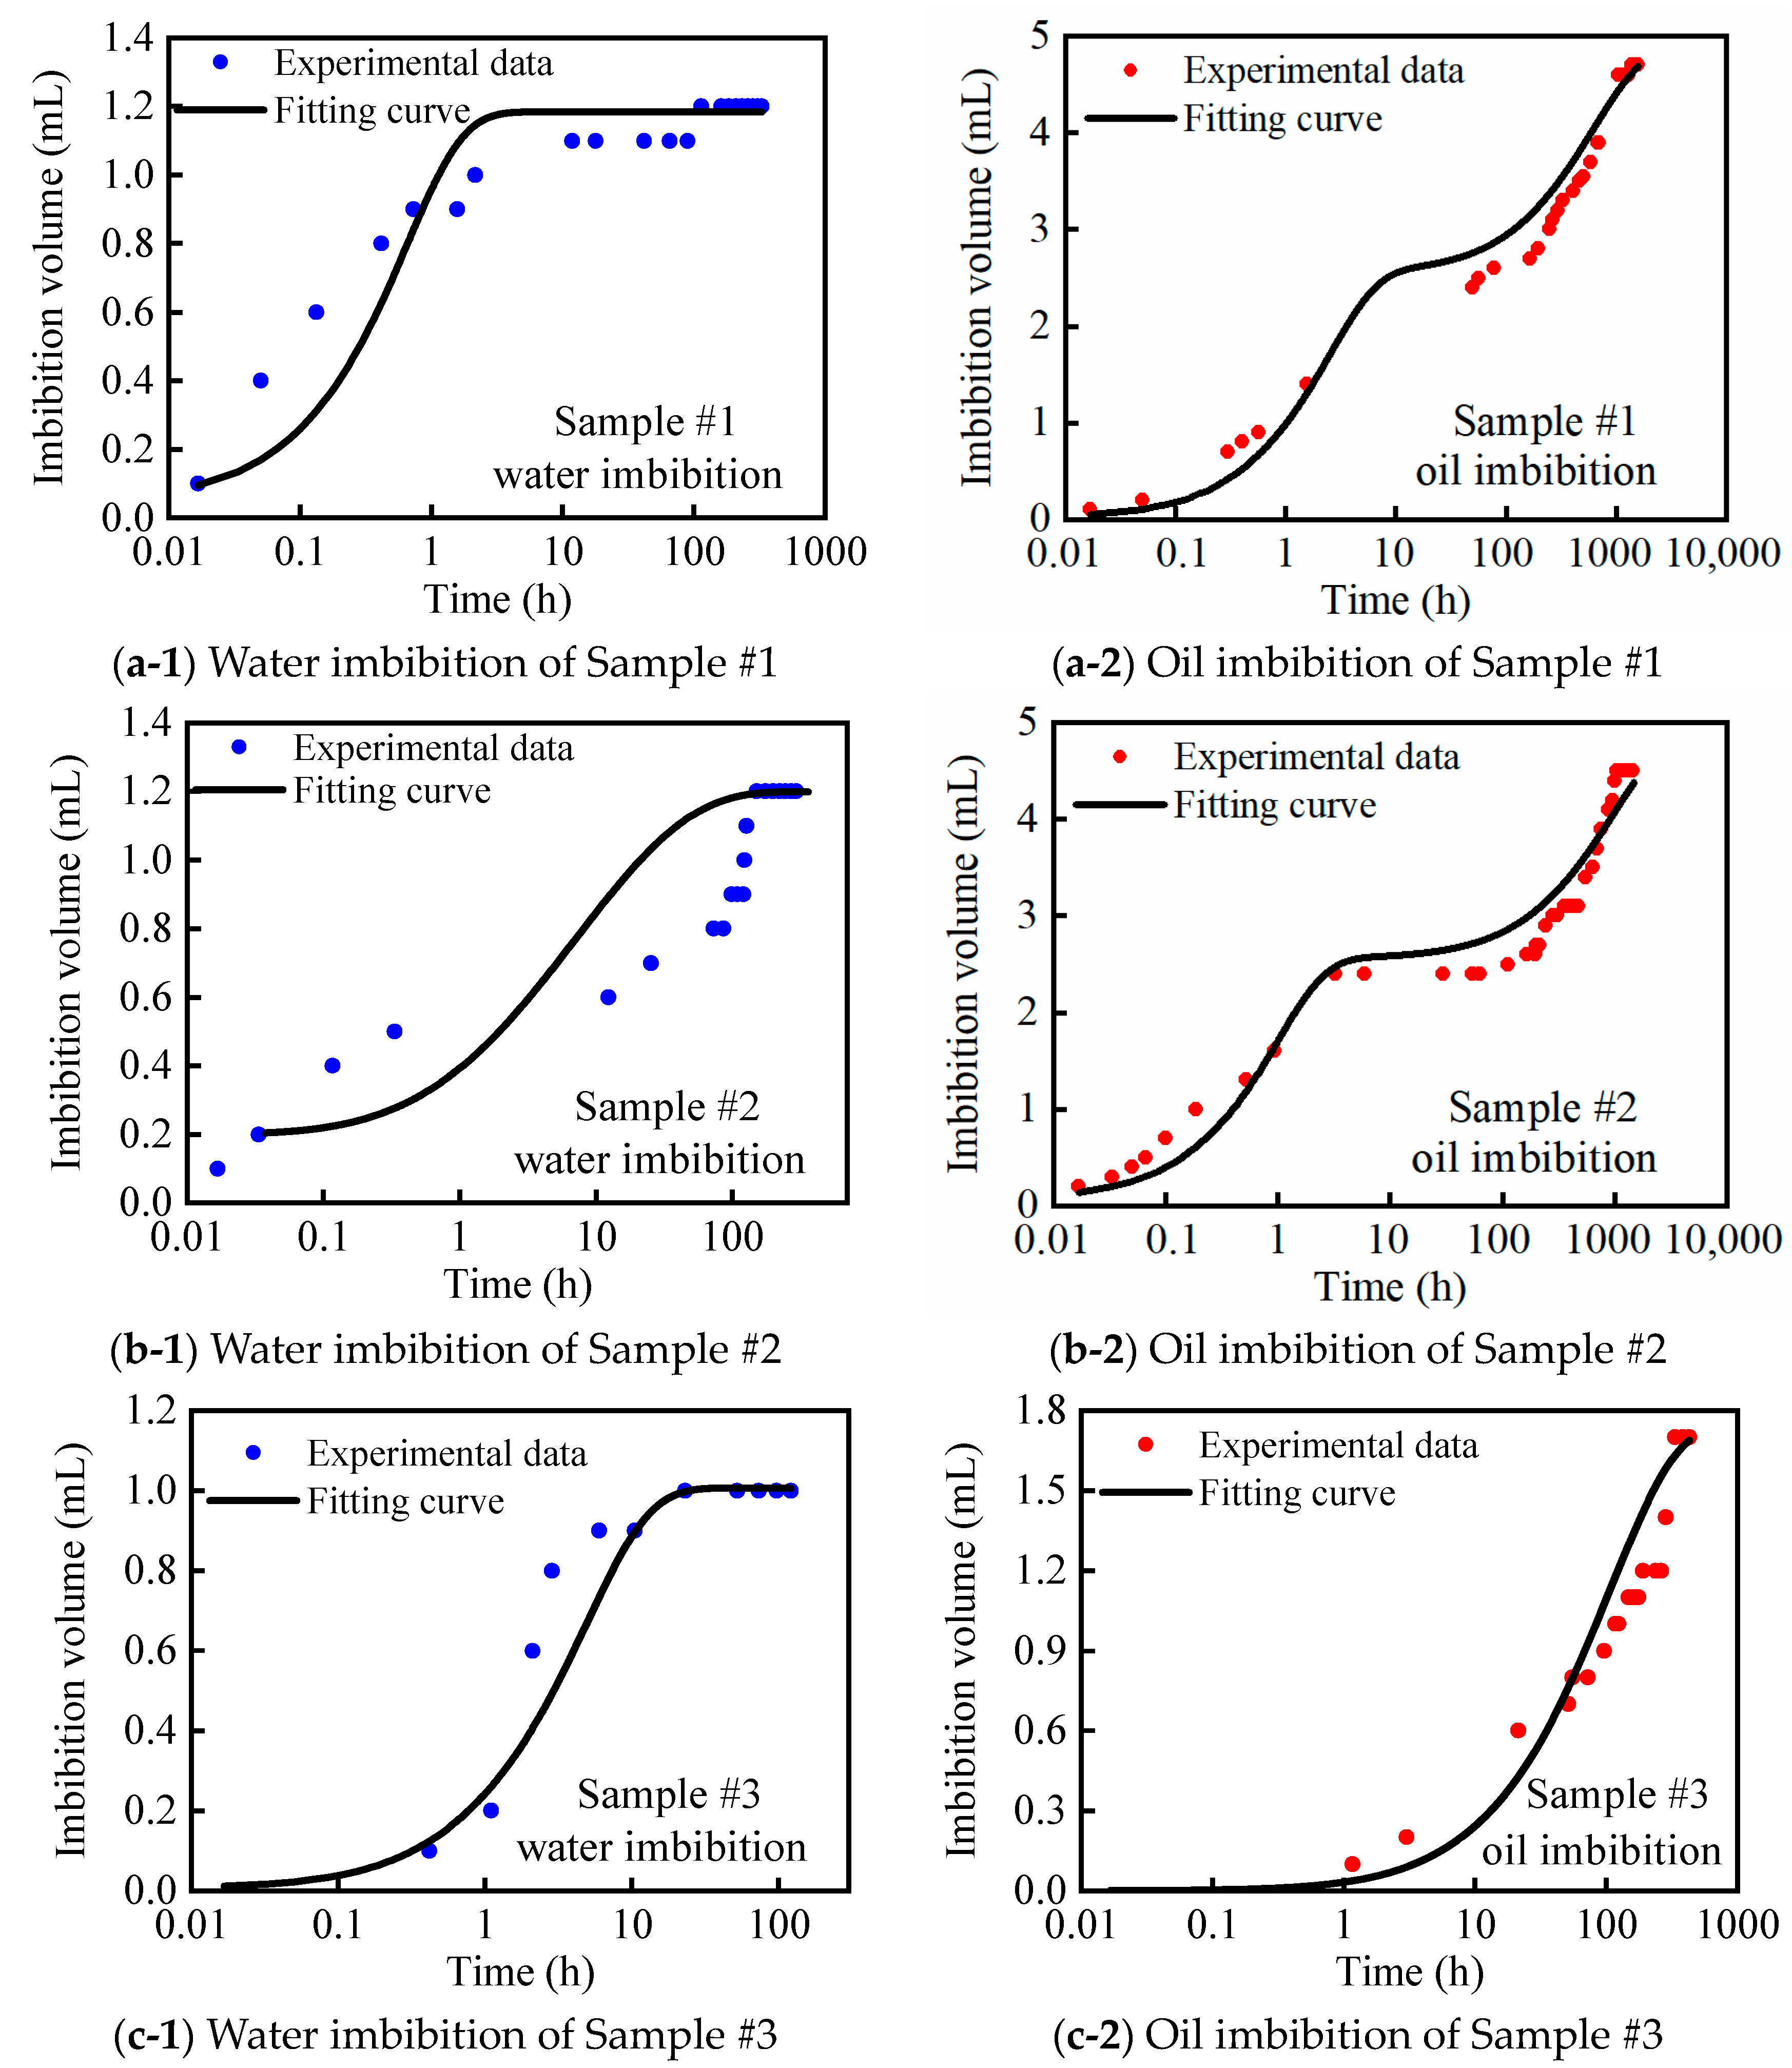
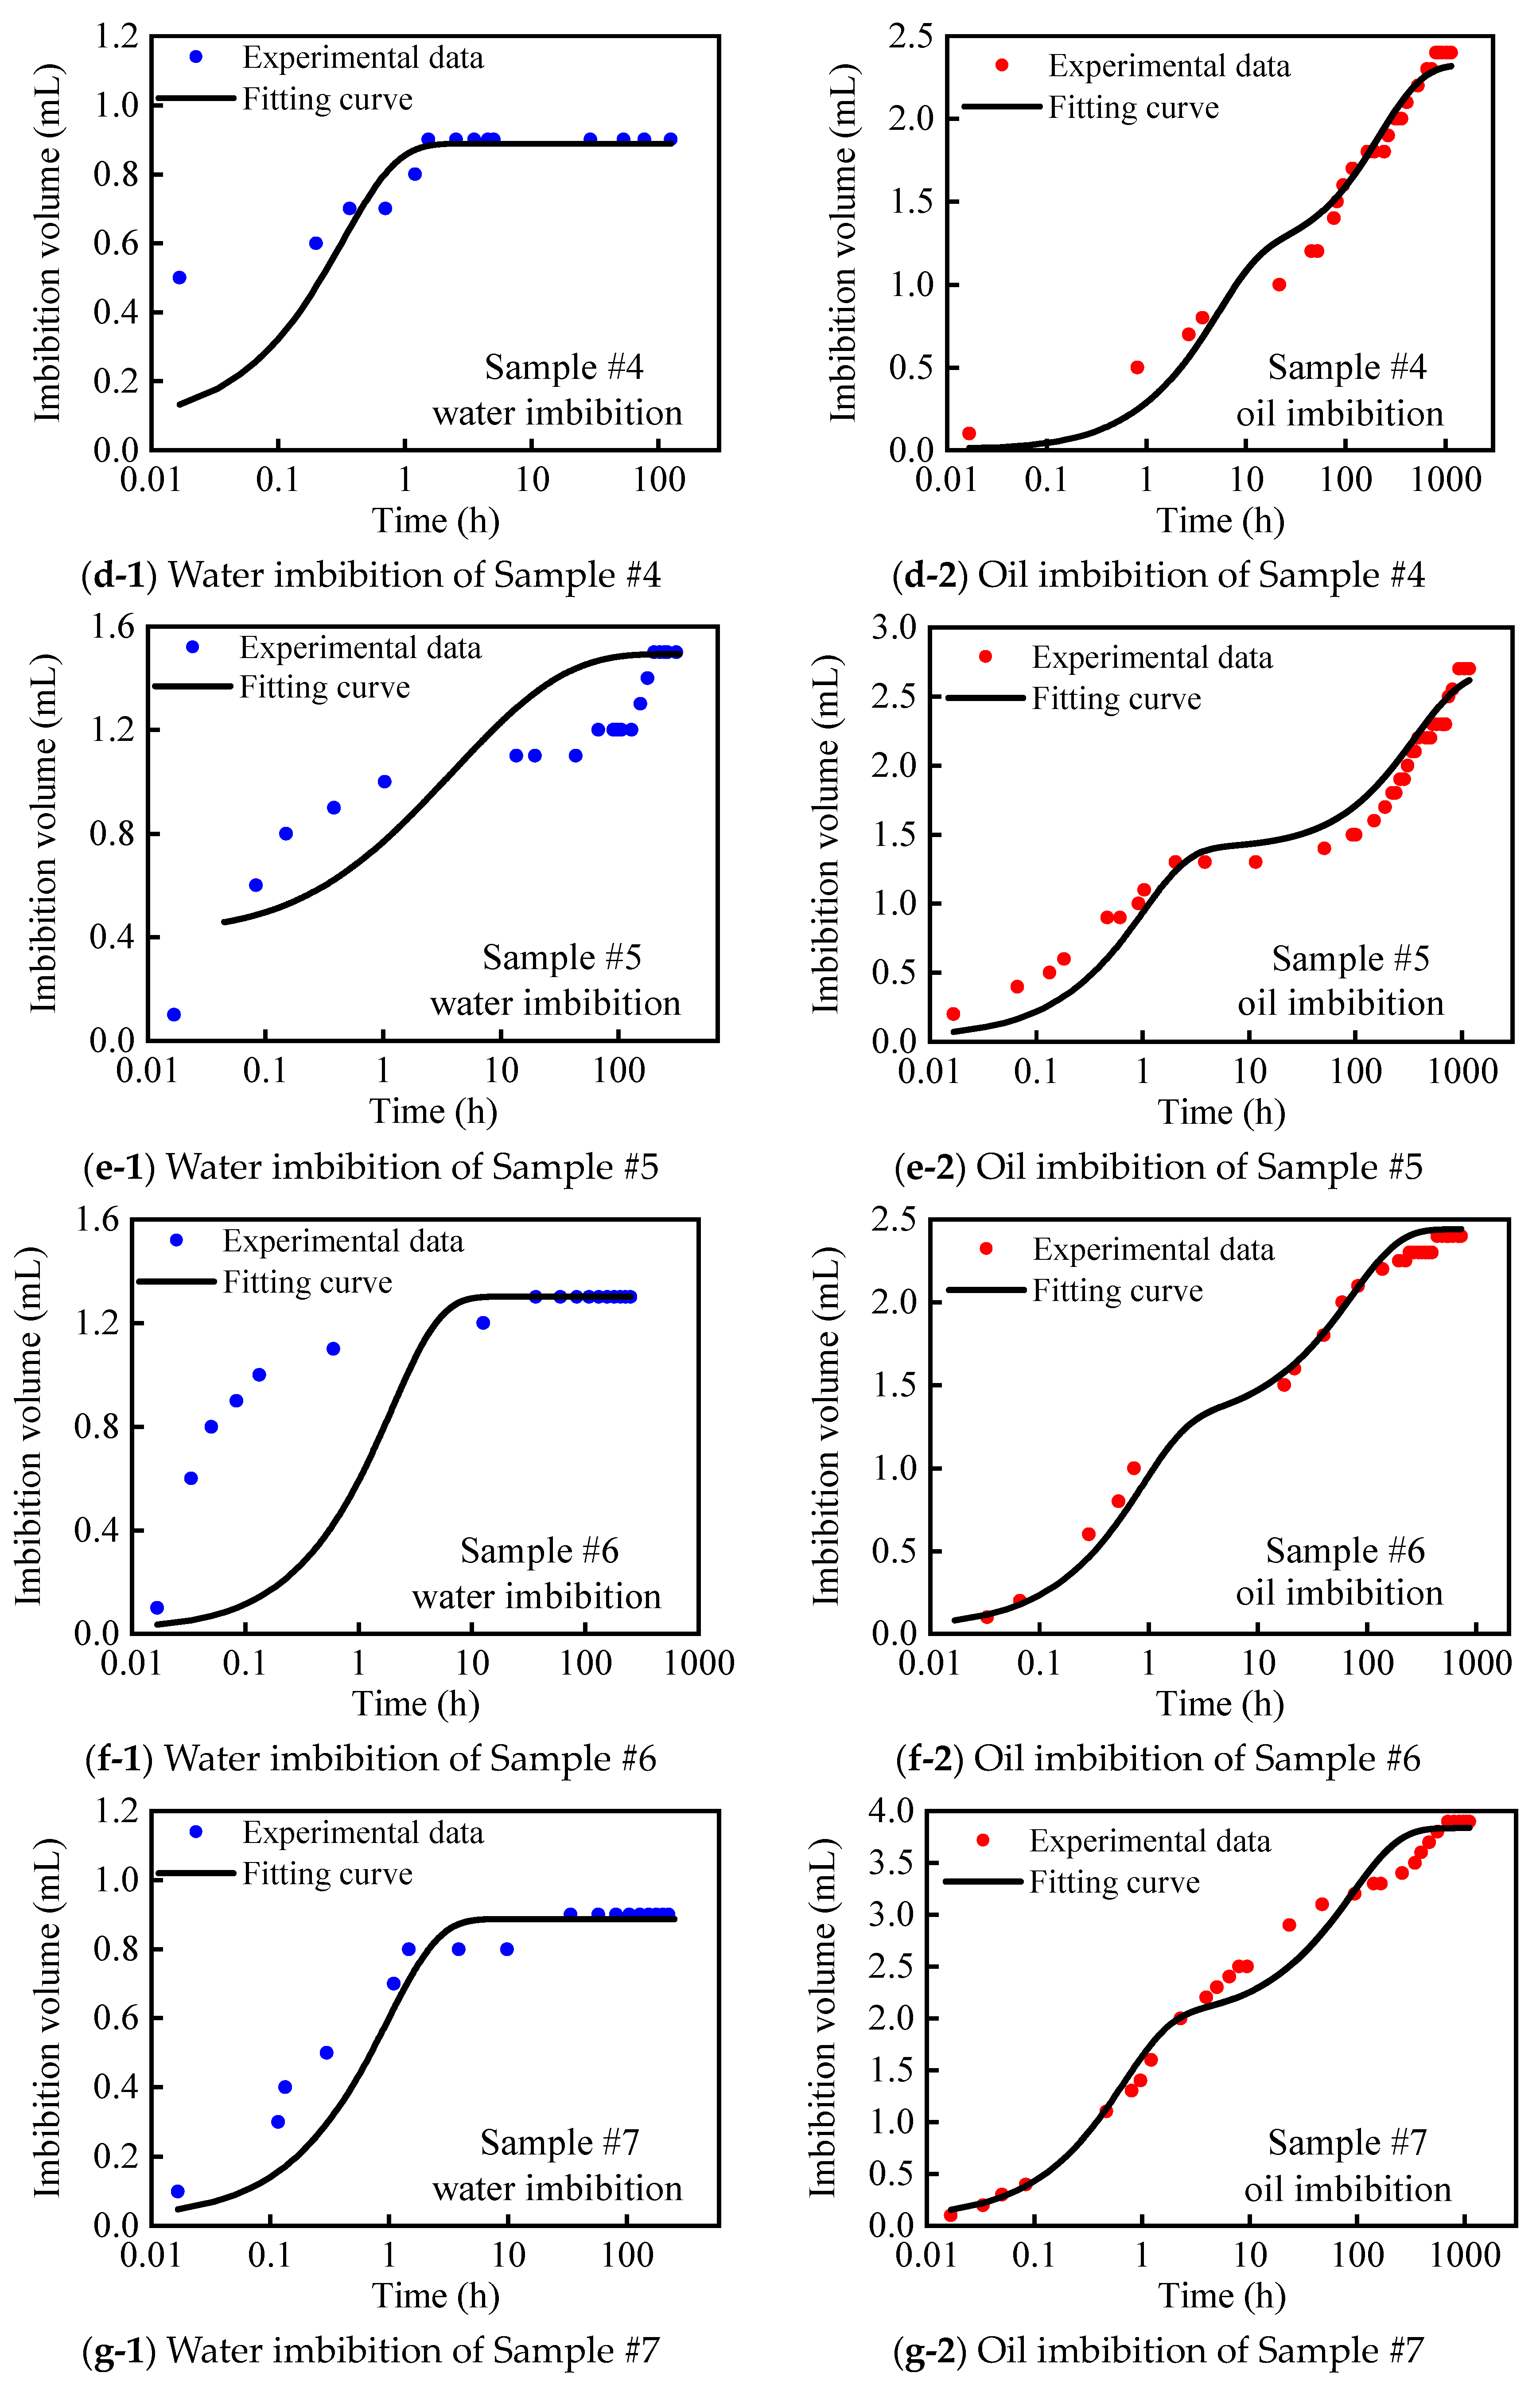
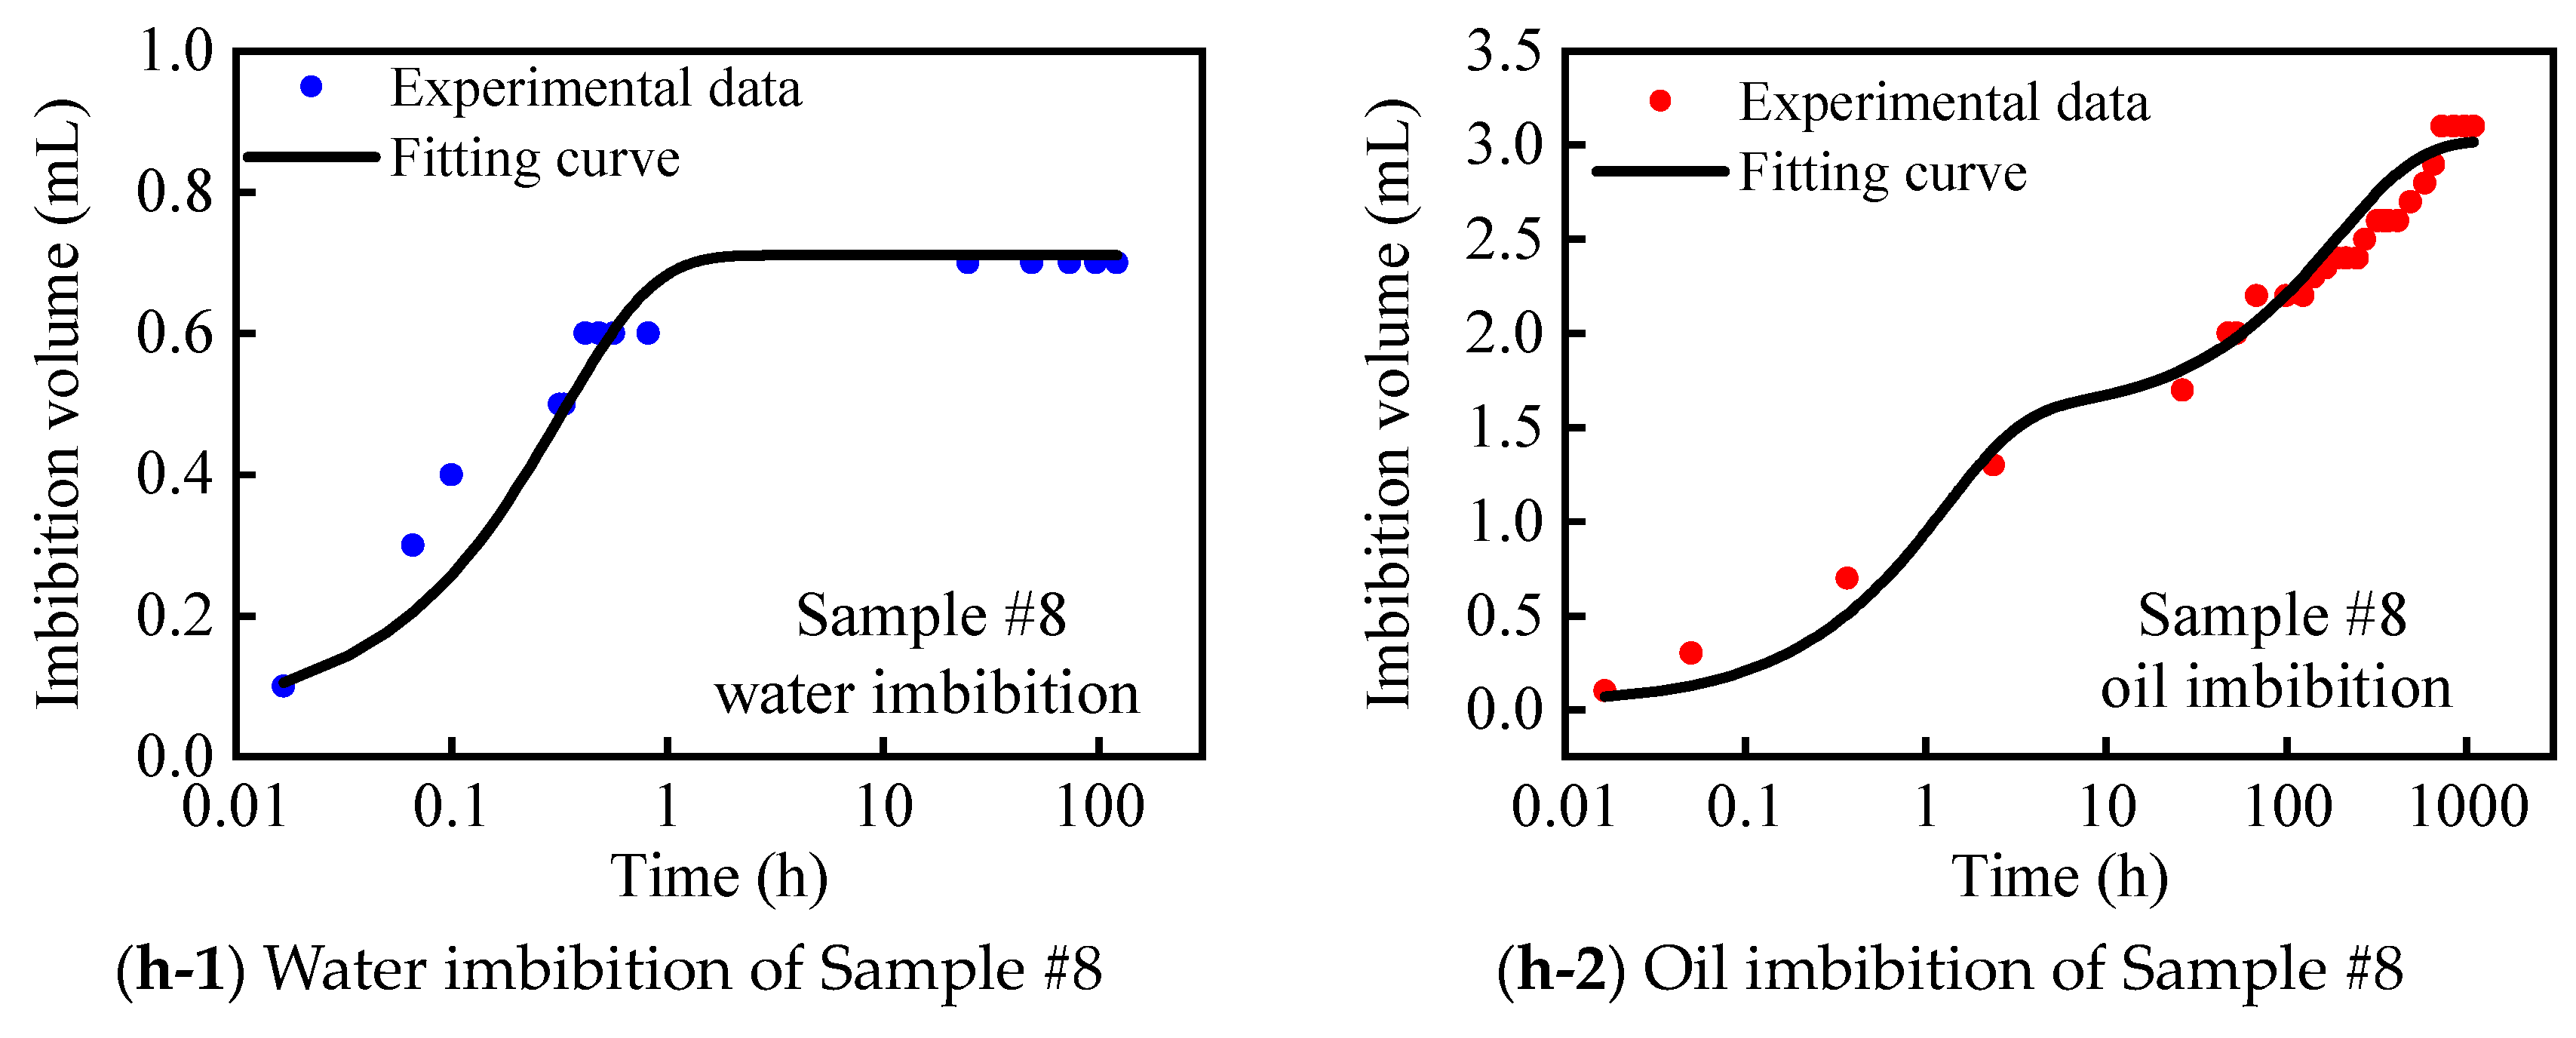
The fitted results of the shale samples are shown in Figure 12. The oil vacuum-imbibition process of all eight samples can be well fitted. With the increase of time, the fitting values have a slight deviation. This is because the slow diffusion of oil molecules into organic matter and clay minerals is the main process at this stage. In the tests, the oil variation caused by diffusion is very small and the measurement error is relatively large, which may lead to a slight deviation between the fitting results and the test results. For the water vacuum-imbibition process of samples #2, #5, and #6, the fitting results are quite different from the test results. The discrepancies between the water imbibition equation and the behavior of Samples #2, #5, and #6 may be due to the following two reasons: (1) The samples used in the vacuum imbibition tests and the mineral tests were selected from different positions of the same layer sample. The heterogeneity of the samples caused differences between the mineral composition of the vacuum imbibition test samples and the mineralogy test samples. The mineral content (Rm) in the model was input based on the test results, and the inaccuracy of the input parameters may have led to large differences between the fitting results and the test results. (2) The water adsorption capacity of clay minerals (Cs) input in the model is derived from the average value of vacuum imbibition test results (as shown in Figure 6). The types of clay minerals in rock samples are not limited to chlorite and illite, which may cause the input water absorption capacity parameters (Cs) to be inconsistent with the actual ones. This may also lead to a large difference between the fitting results and the test results. The inorganic and organic permeabilities fitted from oil- and water-imbibition experiments are shown in Table 4. The order of magnitude of the inorganic permeability is 10−3 to 10−2 mD, and the order of magnitude of the organic permeability is 10−5 to 10−4 mD. The organic permeability is one to three orders of magnitude lower than the inorganic permeability.

4. Conclusions

In this study, eight sets of shale samples and two types of clay minerals were selected to conduct oil and water vacuum-imbibition experiments. The organic and inorganic saturations, porosities, and permeabilities, as well as the content levels of fluids in different occurrence-states were determined.
(1)
Based on the different interactions between oil, water, and gas and the organic and inorganic pores in shale, a fluid saturation method was established to distinguish the contents of each fluid phase. For the shale samples tested, the organic porosities are 1–9%, the inorganic porosities are 2–7%, the organic saturations are 29–69%, and the inorganic saturations are 31–71%. The oil in shale can be divided into inorganic free-oil, organic free-oil, and oil ad/absorbed in the kerogen. A total of 2% to 58% of the organic oil content is ad/absorbed in the kerogen.
(2)
A two-dimensional nuclear magnetic resonance method was used to characterize the occurrence-states of the oil and water in the shale samples. Water was mainly in the forms of free water and structural water, while oil was mainly in the forms of free oil and adsorbed oil. The signal intensity of oil is significantly higher than that of water, indicating that the imbibed oil volume is higher than the imbibed water volume.
(3)
Based on the inorganic–organic coupling mathematical model, by considering ad/absorbed fluid, the organic and inorganic permeabilities of the shale samples were determined. The organic permeability is one to three orders of magnitude lower than that of the inorganic permeability.

Author Contributions

Methodology, J.Z. and Q.X.; resources, F.W. and J.Z.; software, J.Z.; validation, Q.X.; investigation, B.L., S.C., J.Z., Q.X. and Q.S.; writing—original draft preparation, Q.S.; writing—review and editing, F.W. and S.C.; supervision, Q.S.; project administration, B.L.; funding acquisition, Q.S. and B.L. All authors have read and agreed to the published version of the manuscript.

Funding

The authors declare that this study received funding from the Major Project of the China National Petroleum Corporation (2021ZZ10-02), and the Natural Science Foundation of Shandong Province, China (No. ZR2020ME091). The funders were not involved in the study design; the collection, analysis, or interpretation of data; the writing of this article; or the decision to submit it for publication.

Data Availability Statement

The original contributions presented in the study are included in the article; further inquiries can be directed to the corresponding author.

Conflicts of Interest

Author Fenglan Wang was employed by the Daqing Oilfield Co., Ltd. Authors Binhui Li, Sheng Cao, Jiang Zhang, and Quan Xu were employed by the Exploration and Development Research Institute of Daqing Oilfield Co., Ltd. The remaining authors declare that the research was conducted in the absence of any commercial or financial relationships that could be construed as a potential conflict of interest.

Nomenclature

Abbreviations
TOCTotal organic matter content
GYGuye well
BJHBarret–Joyner–Halenda method
NMRNuclear magnetic resonance
T2The transverse relaxation
T1The longitudinal relaxation
SEMScanning electron microscopy
XRDX-ray diffraction
PDIPolydispersity Index
Symbols
qThe cross-flow between inorganic and organic pores, kg/(m3∙s)
CsAdsorption mass per unit volume of clay, kg/m3
RmThe percentage of clay mass, Fraction
rlThe density of liquid, kg/m3
kimThe permeability of inorganic pores, m2
μlThe viscosity of liquid, Pa·s
PimThe pressure of inorganic pores, Pa
ct_imThe compression coefficient of inorganic pores, 1/Pa
tThe time, s
komThe permeability of organic pores, m2
PomThe pressure of organic pores, Pa
ct_omThe compression coefficient of organic pores, 1/Pa
qmThe flow of ad/absorbed oil per unit volume, kg/(m3∙s)
βProportion of organic matter, Fraction
αCross-flow coefficient, 1/m2

References

  1. Liu, X.; Jian, X.; Liang, L. Investigation of pore structure and fractal characteristics of organic-rich Yanchang formation shale in central China by nitrogen adsorption/desorption analysis. Plateau Meteorol. 2015, 22, 62–72. [Google Scholar] [CrossRef]
  2. Jian, X.; Liu, X.; Liang, L. Experimental study on the pore structure characteristics of the Upper Ordovician Wufeng Formation shale in the southwest portion of the Sichuan Basin, China. J. Nat. Gas Sci. Eng. 2015, 22, 530–539. [Google Scholar]
  3. Hensen, E.; Smit, B. Why clays swell. J. Phys. Chem. B 2002, 106, 12664–12667. [Google Scholar] [CrossRef]
  4. Tunega, D.; Gerzabek, M.H.; Lischka, H. Ab Initio Molecular Dynamics Study of a Monomolecular Water Layer on Octahedral and Tetrahedral Kaolinite Surfaces. J. Phys. Chem. B 2004, 108, 5930–5936. [Google Scholar] [CrossRef]
  5. Norrish, K.; Quirk, J. Crystalline Swelling of Montmorillonite: Manner of Swelling of Montmorillonite. Nature 1954, 173, 256–257. [Google Scholar] [CrossRef]
  6. Wang, Z.; Yue, X.; Han, D. Effect of clay mineral and fluid on flow characteristics of the low-permeability cores. Pet. Geol. Recovery Effic. 2007, 14, 89–92. [Google Scholar]
  7. Liang, J.; Fang, Y. Experimenal study of seepage characteristics of tiny-particle clay. Chin. J. Rock Mech. Eng. 2010, 29, 1222–1230. [Google Scholar]
  8. Skipper, N.; Lock, P.; Titiloye, J.; Swenson, Z.; Howells, W.; Fernandez-Alonso, F. The structure and dynamics of 2-dimensional fluids in swelling clays. Chem. Geol. 2006, 230, 182–196. [Google Scholar] [CrossRef]
  9. Wei, J.; Yang, H.; Zhu, J.; Shen, W.; Yuan, P.; He, H.; Chen, M. Molecular dynamic simulation of interlayer micro-structure in orgnaic montmorilionite. Mineral. Petrol. 2009, 29, 33–37. [Google Scholar]
  10. Jiang, J.; Yu, C.; Zhou, Y. The study and aplication of clay swelling model considering wettability. Pet. Geol. Eng. 2016, 30, 87–89, 144. [Google Scholar]
  11. Zou, C.; Yang, Z.; Cui, J.; Zhu, R.; Hou, L.; Tao, S.; Yuan, X.; Wu, S.; Lin, S.; Wang, L.; et al. Formation mechanism, geological characteristics and development strategy of nonmarine shale oil in China. Pet. Explor. Dev. 2013, 40, 14–26. [Google Scholar] [CrossRef]
  12. Zhang, J.; Lin, L.; Li, Y.; Tang, X.; Zhu, L.; Xing, Y.; Jiang, S.; Jing, T.; Yang, S. Classification and evaluation of shale oil. Earth Sci. Front. 2012, 19, 322–331. [Google Scholar]
  13. Wu, X.; Gao, B.; Ye, X.; Bian, R.; Nie, H.; Lu, F. Shale oil accumulation conditions and exploration potential of faulted basins in the east of China. Oil Gas Geol. 2013, 34, 455–462. [Google Scholar]
  14. Fangxing, N.; Xuejun, W.; Xuefeng, H. An analysis on occurrence state and mobility of shale oil in Jiyang depression. Xinjiang Oil Gas 2015, 11, 1–5. [Google Scholar]
  15. Yang, C.; Sheng, G.; Dang, Z. Sorption mechanism of polycyclic aromatic hydrocarbons (PAHs) on kerogen. Environ. Chem. 2007, 26, 472–475. [Google Scholar]
  16. Cai, J. Organo-Clay Complexes in Muddy Sediments and Mudstones; Science Press: Beijing, China, 2004; pp. 53–144. [Google Scholar]
  17. Juanhong, G.; Yanrong, Z.; Yonghe, Y. Evolutional characteristics of the kerogen molecular structure during the low-mature stage: An infrared spectra analysis. Geochimica 2014, 43, 529–537. [Google Scholar]
  18. Qian, M.; Jiang, Q.; Li, M.; Li, Z.; Liu, P.; Ma, Y.; Cao, T. Quantitative characterization of extractable organic matter in lacustrine shale with different occurrences. Pet. Geol. Exp. 2017, 39, 278–286. [Google Scholar]
  19. Jiang, Q.; Li, M.; Qian, M.; Li, Z.; Li, Z.; Huang, Z.; Zhang, C.; Ma, Y. Quantitative characterization of shale oil in different occurrence states and its application. Pet. Geol. Exp. 2016, 38, 842–849. [Google Scholar]
  20. Wang, S.; Feng, Q.; Zha, M.; Lu, S.; Qin, Y.; Xia, T.; Zhang, C. Molecular dynamics simulation of liquid alkane occurrence state in pores and fractures of shale organic matter. Pet. Explor. Dev. 2015, 42, 772–778. [Google Scholar] [CrossRef]
  21. Sang, Q.; Zhang, S.; Li, Y.; Dong, M.; Bryant, S. Determination of organic and inorganic hydrocarbon saturations and effective porosities in shale using vacuum-imbibition method. Int. J. Coal Geol. 2018, 200, 123–134. [Google Scholar] [CrossRef]
  22. Li, S.; Sang, Q.; Dong, M.; Luo, P. Determination of inorganic and organic permeabilities of shale. Int. J. Coal Geol. 2019, 215, 103296. [Google Scholar] [CrossRef]
  23. Barrett, E.P.; Joyner, L.G.; Halenda, P.P. The determination of pore volume and area distributions in porous substances. I. Computations from nitrogen isotherms. J. Am. Chem. Soc. 1951, 73, 373–380. [Google Scholar] [CrossRef]
  24. Li, J.; Huang, W.; Lu, S.; Wang, M.; Chen, G.; Tian, W.; Guo, Z. Nuclear Magnetic Resonance T1-T2 Map Division Method for Hydrogen-Bearing Components in Continental Shale. Energy Fuels 2018, 32, 9043–9054. [Google Scholar] [CrossRef]
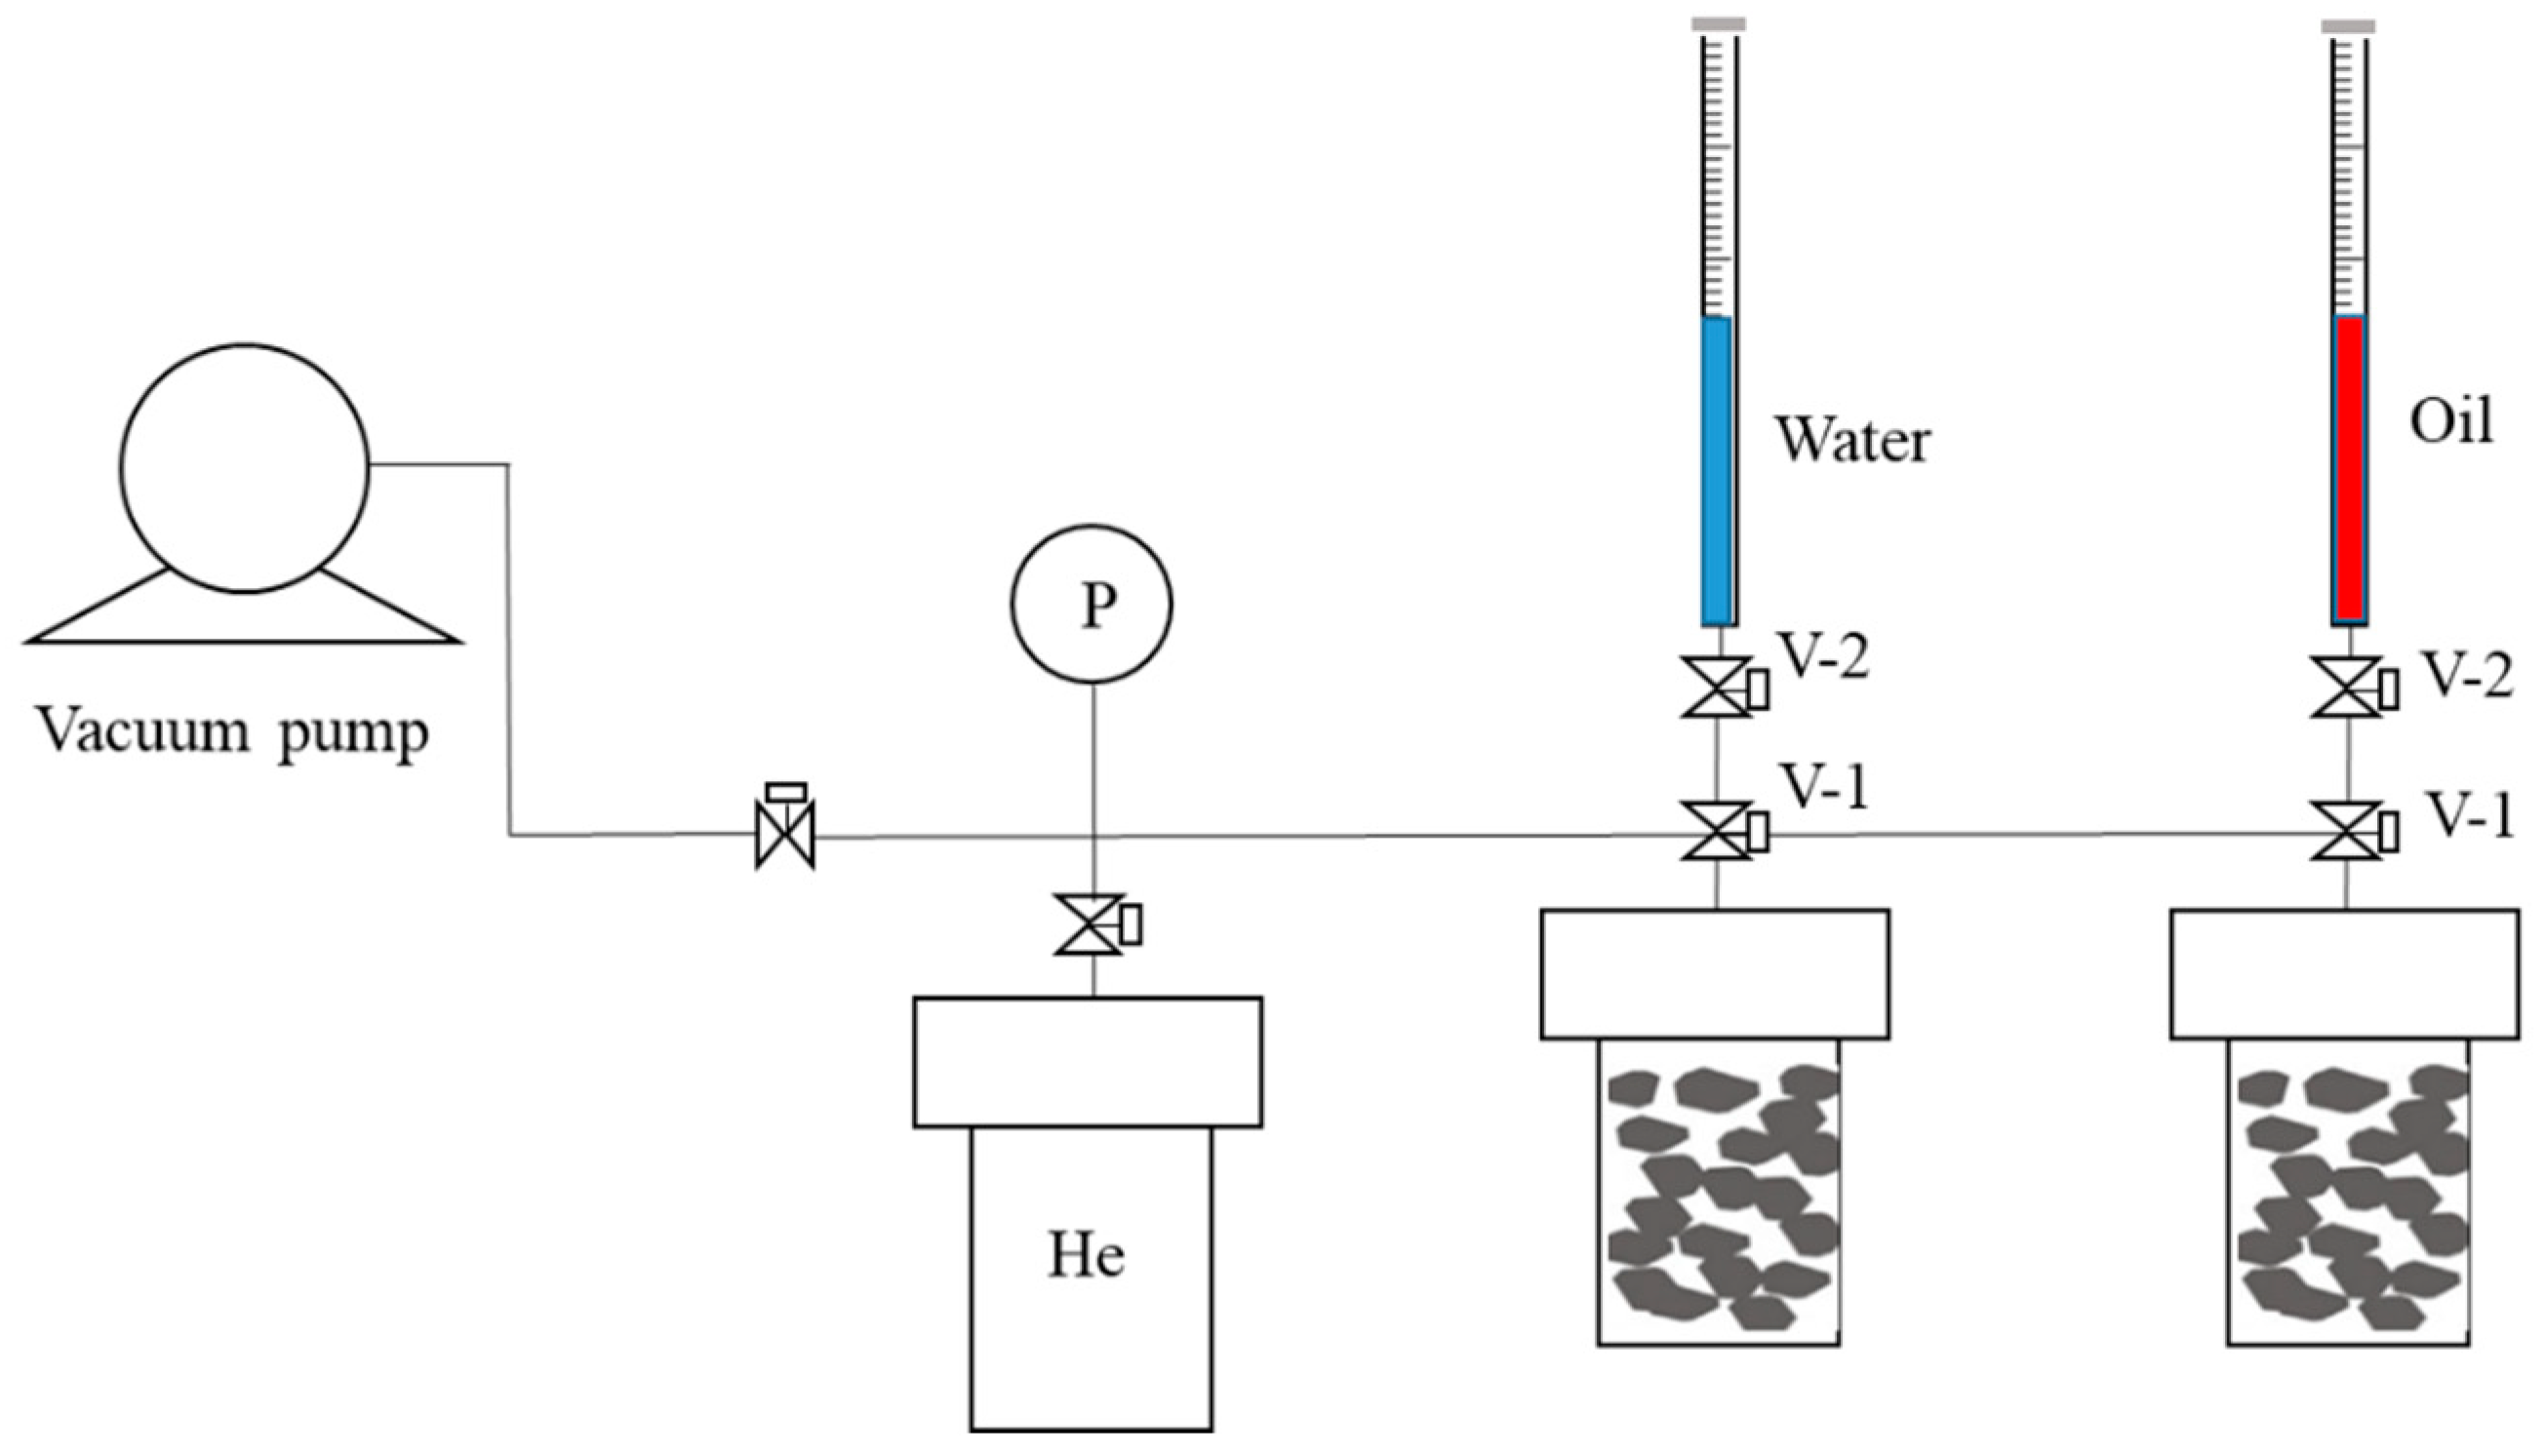
Figure 1. Schematic of the vacuum-imbibition test.
Energies 17 00524 g001
Figure 2. SEM images of shale samples: (a,b) sample #1, Well GY 7, 2406.02 m; (c,d) sample #2, Well GY 10HC, 2588.58 m; (e) sample #4, Well GY 4HC, 2478.2 m; (f,g) sample #5, Well GY 9HC, 2353.9 m; (h,i) sample #7, Well GY 16, 2350.17 m.
Energies 17 00524 g002aEnergies 17 00524 g002b
Figure 3. Pore-size distribution of tested samples: (a) Pore throat radius distribution measured by the mercury injection test. (b) Pore diameter distribution measured by the N2 adsorption test.
Energies 17 00524 g003aEnergies 17 00524 g003b
Figure 4. Vacuum-imbibition curves of water and oil in eight shale samples. The characteristics of the oil and water vacuum-imbibition curves show significant differences, indicating that the flow space and flow capacity of the oil and water are different. Water can only enter inorganic pores, while oil can enter both inorganic pores and organic pores, so oil eventually occupies more pore space than does water. In addition, due to the strong interaction between organic matter and oil, oil molecules can diffuse into the organic matter and combine with the molecular skeleton of kerogen to form ad/absorbed oil. This further increases the imbibition volume of oil, resulting in a significantly higher imbibed volume of oil than water.
Energies 17 00524 g004
Figure 5. Vacuum-imbibition rate curves of water and oil in eight shale samples.
Energies 17 00524 g005aEnergies 17 00524 g005b
Figure 6. Samples of chlorite and illite.
Energies 17 00524 g006
Figure 7. Vacuum-imbibition curves of water and oil in chlorite and illite samples: (a) Chlorite; (b) Illite.
Energies 17 00524 g007
Figure 8. Relationships between (a) inorganic porosity and clay content; (b) inorganic saturation and clay content; (c) adsorbed water in clay and clay content.
Energies 17 00524 g008
Figure 9. Relationship between (a) organic porosity and TOC; (b) organic saturation and TOC; (c) ad/absorbed oil in kerogen and TOC.
Energies 17 00524 g009
Figure 10. T1–T2 map of shale samples: (a) sample #2, dry sample; (b) sample #2, after imbibition of water; (c) sample #2, after imbibition of water; (d) sample #8, dry sample; (e) sample #8, after imbibition of water; (f) sample #8, after imbibition of water.
Energies 17 00524 g010
Figure 11. Organic-inorganic dual medium model.
Energies 17 00524 g011
Figure 12. Fitting results of oil- and water-imbibition curves for the shale samples.
Energies 17 00524 g012aEnergies 17 00524 g012bEnergies 17 00524 g012c
Table 1. Mineralogy data and TOC of samples (wt.%).
NumberSamplesClayQuartzFeldsparCalciteDolomitePyriteAnkeriteBariteTOC
#1GY 750.132.79.07.46.21.95.4-2.5
#2GY 10HC-142.637.09.4-8.52.5--2.0
#3GY 10HC-28.86.1--81.3--3.80.4
#4GY 4HC-18916.419.62.71.758.21.4--2.4
#5GY 9HC-20837.435.416.50.76.43.6--2.1
#6GY 9HC-21041.537.816.7--4.0--2.9
#7GY 16-2441.331.714.8-6.16.1--1.3
#8GY 16-3239.333.618.94.3-3.9--1.0
Table 2. Clay compositions of shale samples (wt.%).
Sample NumberIlliteKaoliniteChloriteIllite/Smectite
#141-2039
#266-727
#3423127-
#439-3724
#564-1026
#668-923
#744-1838
#860-733
#141-2039
Table 3. Organic oil saturation, inorganic oil saturation, organic porosity, and inorganic porosity of different shale samples.
Sample
Number
Bulk
Volume
(cm3)
Oil
Volume in Organic Pores
(mL/g)
Oil
Volume in Inorganic Pores
(mL/g)
Helium
Saturation
Volume
(mL/g)
Organic Saturation
(%)
Inorganic Saturation
(%)
Organic Porosity
(%)
Inorganic Porosity
(%)
Percentage of Organic Pores
(%)
#120.4340.1010.0240.04847.5952.418.862.8275.87
#218.5020.0920.0250.04866.0933.916.815.7254.36
#321.8180.0340.0170.01934.6265.381.413.9426.27
#420.7080.0450.0170.02532.8067.203.722.7957.13
#519.6890.0560.0310.04029.8570.153.116.7231.63
#618.2200.0540.0290.03732.1667.843.066.2233.00
#719.5910.0800.0180.04056.7543.257.332.7772.59
#818.9840.0660.0150.03568.6531.355.713.0165.46
Table 4. Inorganic and organic permeability of the shale samples.
Sample NumberInorganic Permeability
(mD)
Organic Permeability
(mD)
#14.00 × 10−26.00 × 10−5
#22.38 × 10−21.19 × 10−5
#31.33 × 10−31.33 × 10−4
#44.00 × 10−21.00 × 10−5
#54.35 × 10−21.74 × 10−5
#65.71 × 10−24.76 × 10−4
#74.55 × 10−22.12 × 10−4
#83.08 × 10−21.15 × 10−4
Disclaimer/Publisher’s Note: The statements, opinions and data contained in all publications are solely those of the individual author(s) and contributor(s) and not of MDPI and/or the editor(s). MDPI and/or the editor(s) disclaim responsibility for any injury to people or property resulting from any ideas, methods, instructions or products referred to in the content.