Article

CO2–Water–Rock Interaction and Its Influence on the Physical Properties of Continental Shale Oil Reservoirs

1
National Key Laboratory for Multi-Resources Collaborative Green Production of Continental Shale Oil, Daqing 163712, China
2
Exploration and Development Research Institute of Daqing Oilfield Co., Ltd., Daqing 163712, China
3
Heilongjiang Provincial Key Laboratory of Reservoir Physics & Fluid Mechanics in Porous Medium, Daqing 163712, China
4
School of Petroleum Engineering, China University of Petroleum (East China), Qingdao 266580, China
*
Author to whom correspondence should be addressed.
Energies 2024, 17(2), 477; https://doi.org/10.3390/en17020477
Submission received: 15 December 2023 / Revised: 11 January 2024 / Accepted: 16 January 2024 / Published: 18 January 2024

Abstract

:
Shale oil resources are abundant, but reservoirs exhibit strong heterogeneity with extremely low porosity and permeability, and their development is challenging. Carbon dioxide (CO2) injection technology is crucial for efficient shale oil development. When CO2 is dissolved in reservoir formation water, it undergoes a series of physical and chemical reactions with various rock minerals present in the reservoir. These reactions not only modify the reservoir environment but also lead to precipitation that impacts the development of the oil reservoir. In this paper, the effects of water–rock interaction on core porosity and permeability during CO2 displacement are investigated by combining static and dynamic tests. The results reveal that the injection of CO2 into the core leads to reactions between CO2 and rock minerals upon dissolution in formation water. These reactions result in the formation of new minerals and the obstruction of clastic particles, thereby reducing core permeability. However, the generation of fine fractures through carbonic acid corrosion yields an increase in core permeability. The CO2–water–rock reaction is significantly influenced by the PV number, pressure, and temperature. As the injected PV number increases, the degree of pore throat plugging gradually increases. As the pressure increases, the volume of larger pore spaces gradually decreases, resulting in an increase in the degree of pore blockage. However, when the pressure exceeds 20 MPa, the degree of carbonic acid dissolution will be enhanced, resulting in the formation of small cracks and an increase in the volume of small pores. As the temperature reaches the critical point, the degree of blockage of macropores gradually increases, and the blockage of small pores also occurs, which eventually leads to a decrease in core porosity.

1. Introduction

Although shale oil resources are abundant, the heterogeneity of reservoirs is significant, with low porosity and permeability, making their development challenging and resulting in a low degree of primary exploitation. Because of the obvious water sensitivity, waterflood cannot be adopted. Therefore, carbon dioxide (CO2) injection technology serves as a crucial approach to achieving the efficient development of the resource. CO2 flooding has been widely used in conventional reservoirs as an efficient oil displacement technology and a way to reduce greenhouse gases. In recent years, field tests for CO2 injection development in shale oil reservoirs have been gradually initiated. Compared to tight oil reservoirs, shale reservoirs typically contain abundant organic matter called kerogen. Kerogen possesses a strong ability to adsorb and dissolve crude oil, whereas CO2 exhibits a potent capability to extract hydrocarbons from shale formations [1,2]. Laboratory experiments on CO2 huff and puff for various types of shale oil samples (Mancos and Eagle Ford core; diameter: 1.5 inches; length: 2 inches; huff and puff pressure: 850–3500 psi) have demonstrated ultimate recovery rates ranging from 33% to 85%. The ultimate recovery is found to be correlated with shale properties and the operational parameters (soaking time, huff and puff times) of multiple huff and puff cycles [3]. Simultaneously, the interaction between CO2 and kerogen can induce alterations in the specific surface area, porosity, and microstructure of shale [4,5], while CO2 can undergo adsorption and dissolution within kerogen [6].
Once CO2 infiltrates the formation, it initially undergoes a reaction with the reservoir fluid, followed by a series of diverse reactions involving CO2, reservoir fluid, and reservoir rock minerals. CO2 is dissolved in formation water under high-temperature and high-pressure conditions to form carbonic acid, which is mainly divided into two steps of ionization, and the main ionization equations are as follows:
H 2 CO 3 H + + HCO 3
HCO 3 H + + CO 3 2
Shale reservoirs are rich in carbonate and silicate minerals. Carbonate minerals mainly include dolomite, calcite, etc., which are easy to react with carbonic acid solutions and form new secondary minerals under the conditions of high temperatures and high pressure in the formation [7], and the reaction equations are as follows:
CaMg ( CO 3 ) 2 + 2 H + = Ca 2 + + Mg 2 + + 2 HCO 3
CaMg ( CO 3 ) 2 + 2 H 2 CO 3 = Ca 2 + + Mg 2 + + 4 HCO 3
CaMg ( CO 3 ) 2 + 2 H 2 O = Ca 2 + + Mg 2 + + 2 HCO 3 + 2 OH
Most silicate minerals (albite, potassium feldspar, clay minerals other than quartz) are extremely unstable under acidic environmental conditions. They are readily soluble in water and generate secondary minerals [8]. The reaction equations are as follows:
2 KAlSi 3 O 8 + 2 H + + 9 H 2 O = Al 2 Si 2 O 5 ( OH ) 4 + 2 K + + 4 H 4 SiO 4
2 NaAlSi 3 O 8 + 3 H 2 O + 2 CO 2 = Al 2 Si 2 O 5 ( OH ) 4 + 4 SiO 2 + 2 Na + + 2 HCO 3
CaAl 2 Si 2 O 8 + H 2 CO 3 + H 2 O = CaCO 3 + Al 2 SiO 5 ( OH ) 4
( Fe / Mg ) 5 Al 2 Si 3 O 10 ( OH ) 8 + 5 CaCO 3 + 5 CO 2 = 5 Ca [ Fe / Mg ] ( CO 3 ) 2 + Al 2 Si 2 O 5 ( OH ) 4 + 2 H 2 O
The effects of CO2 reaction with different minerals on reservoir properties have been widely reported. Most of these studies focus on siliciclastic and carbonate formations [9,10,11,12,13,14,15,16,17,18,19,20,21]. Ross et al. [9] observed that CO2 reacted with limestone and dolomite in the core, and the core’s permeability increased after the dissolution of the dolomite and limestone. Knet et al. [10] observed that the carbonate minerals and clay minerals in sandstone were dissolved, and the fine particles were deposited into the pore throats through fluid migration. Sayegh et al. [11] observed that detrital particles such as illite and calcite in sandstone dissolved in large quantities and clogged in pores and throats as reservoir fluids migrated. Minerals such as carbonate cements are dissolved, creating a large number of micropores. Qu [12] conducted experiments on the reaction between different minerals and CO2, and the dissolution effect of reservoir minerals (calcite, dolomite, carbonate rock, etc.) gradually increased with the increase in temperature when the temperature conditions changed. Shi et al. [13] analyzed the mineral composition of a sandstone core after CO2 displacement, and the results showed that the carbonate mineral composition in the core increased significantly after CO2 injection. Yu et al. [14] carried out CO2 displacement experiments on a core of saturated formation water under the temperature and pressure conditions of the reservoir, and the experimental results showed that the dissolution reaction of carbonate minerals was the most violent, and the most obvious reaction was calcite among carbonate minerals, followed by flake aluminite minerals and iron dolomite with the lowest degree of dissolution. Wang et al. [15] found that after the temperature rises to a critical temperature, CO2 changes from a gaseous state to a supercritical state, and the minerals in the core are violently dissolved. Secondary minerals are formed on the pore surface inside the core. Xiao et al. [16] evaluated the effect of CO2–water–rock interactions on the characteristics of a carbonate reservoir at high pressure and temperature. With the increase in CO2 pressure, the surface dissolution of calcite appeared more obvious. With the increase in the reaction temperature, the surface dissolution of calcite also appeared more obvious. Liu and Cheng [19] revealed the possible geochemical effects of cement mineral variations on water–rock–CO2 interactions at 180 °C and 18 MPa. The sensitive orders of cement mineral variations due to water–rock–CO2 interactions are carbonates, argillaceous, and siliceous minerals.
The reported results [16,17,18,19,20,21] show that the effects of temperature and pressure on the dissolution reaction and clogging are important. Different temperature and pressure conditions will result in different changes in porosity and permeability. At present, there is no systematic study on the influence of CO2–water–rock reaction on core permeability and porosity under different temperature and pressure conditions. Shale reservoirs are more complex than sandstone and carbonate reservoirs due to their diverse and complex mineral types and strong heterogeneity. Shale reservoirs often comprise organic-rich mudstone layers, carbonate rocks, and sandstone interlayers, which all have diverse mineral types and a higher mineral content compared to sandstone reservoirs. In shale reservoirs, feldspar minerals and carbonate minerals, which are prone to dissolution reactions, coexist with detrital minerals that are prone to migration and clogging. While dissolution reactions can enhance the porosity and permeability of shale reservoirs to some extent, the sediments produced during the reaction are more likely to further clog the already fine pores. Therefore, it is urgent to study the dissolution and scaling laws of CO2 on shale reservoirs and evaluate the effects of dissolution and scaling on the pore structure and porosity parameters of reservoirs, so as to provide reference data for formulating CO2 development plans.
The aim of this paper is to study the impact of CO2–water–rock reactions on the physical properties of shale cores during CO2 displacement. Firstly, a static experiment of CO2–water–rock reaction was carried out by using a high-temperature and high-pressure reactor. By analyzing the changes of different ion concentrations in formation water before and after CO2 injection, the effects of temperature and pressure on precipitation formation were obtained. Additionally, scanning electron microscopy (SEM) was used to observe the dissolution of the pore structure of the rock samples after static experiments. Secondly, dynamic CO2 displacement experiments were carried out. The T2 spectra of the core before and after displacement was obtained using nuclear magnetic resonance technology, and the change in porosity was analyzed. By measuring the changes in permeability before and after core displacement, the influence of inorganic salt precipitation generated by CO2–water–rock reaction on the physical properties of shale cores under different conditions was comprehensively evaluated.

2. Experimental

2.1. Experimental Material

The main mineral composition of the shale rock samples is shown in Table 1. The porosity and permeability of all samples are shown in Table 2. The ion contents of the formation water samples are shown in Table 3. The purity of CO2 used in the tests is greater than 99.8%.

2.2. CO2–Water–Rock Static Reaction

The experimental equipment is shown in Figure 1, including the CO2 cylinder, the CO2–water reaction cylinder, the vacuum pump, the hand pump, and the oven.
Prior to conducting the experiment, the leakage of the reactor was tested and the main ions present in the formation water were determined through an ICP-MS (inductively coupled plasma–mass spectrometry) analysis. Formation water and core samples were added to the reactor. CO2 was injected after evacuation and a hand hump was used to raise the pressure of the entire system to a specified level. The reactor was subsequently placed inside a constant-temperature oven for a defined duration. After the experiment, the gas was slowly released and left undisturbed for a specified duration. Subsequently, the pH meter was employed to measure the variation in the pH value of the formation water prior to and after the CO2–formation water reaction. The concentrations of cations, HCO3, and CO32− in the formation water were determined using the titration and ICP-MS methods. Moreover, the alterations observed in the mineral composition of the core, and the extent of core porosity dissolution subsequent to the reaction, were investigated utilizing the ICP-MS and electron microscopy scanning techniques. We studied the influence of different factors on the amount of precipitation by changing the experimental temperature and pressure.

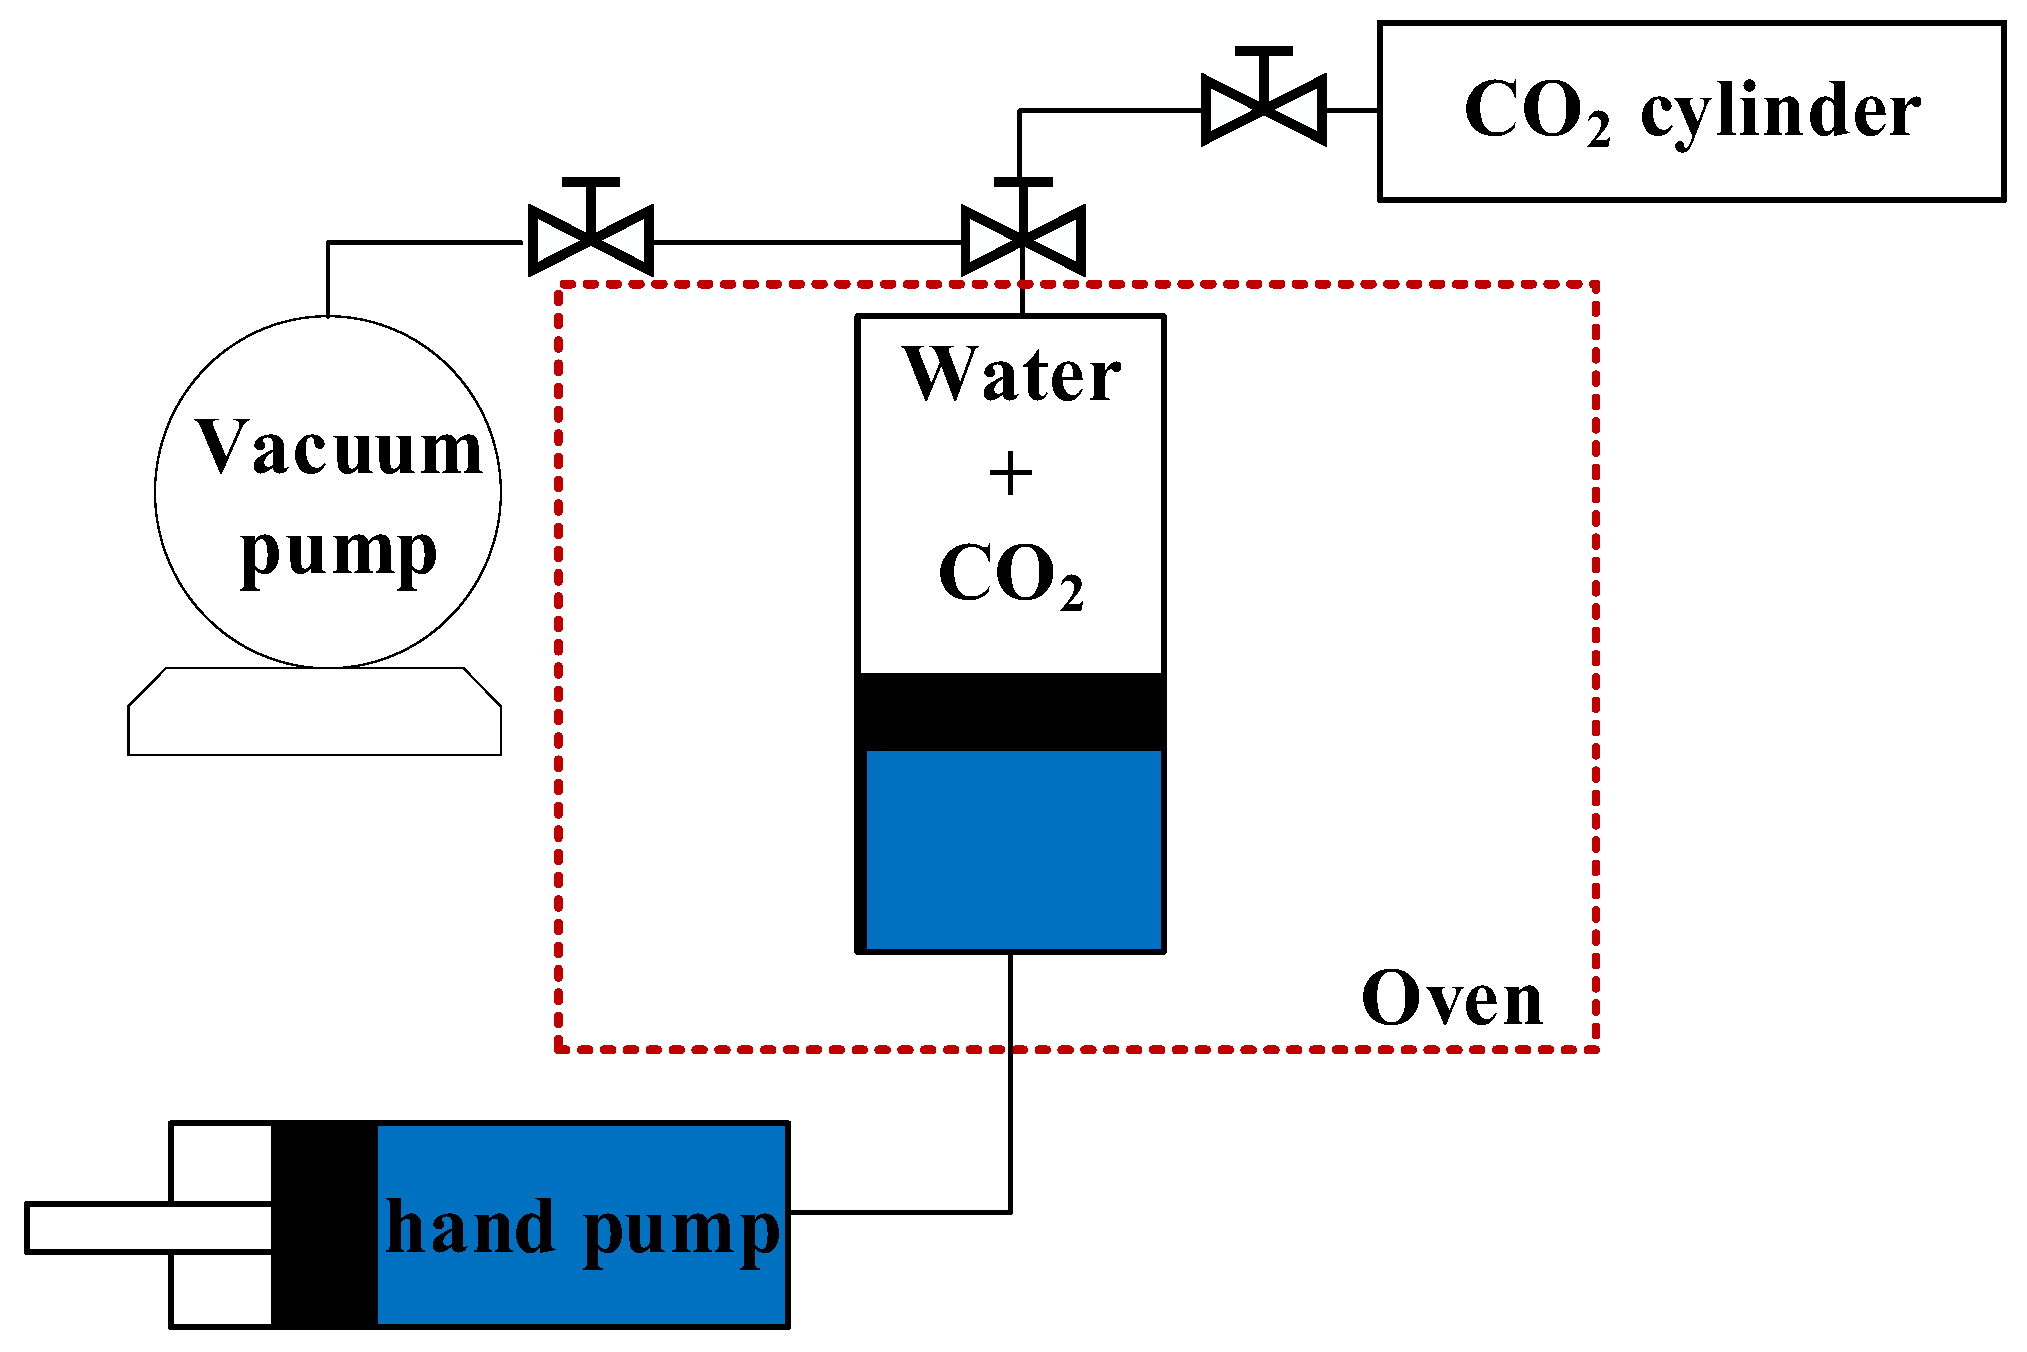
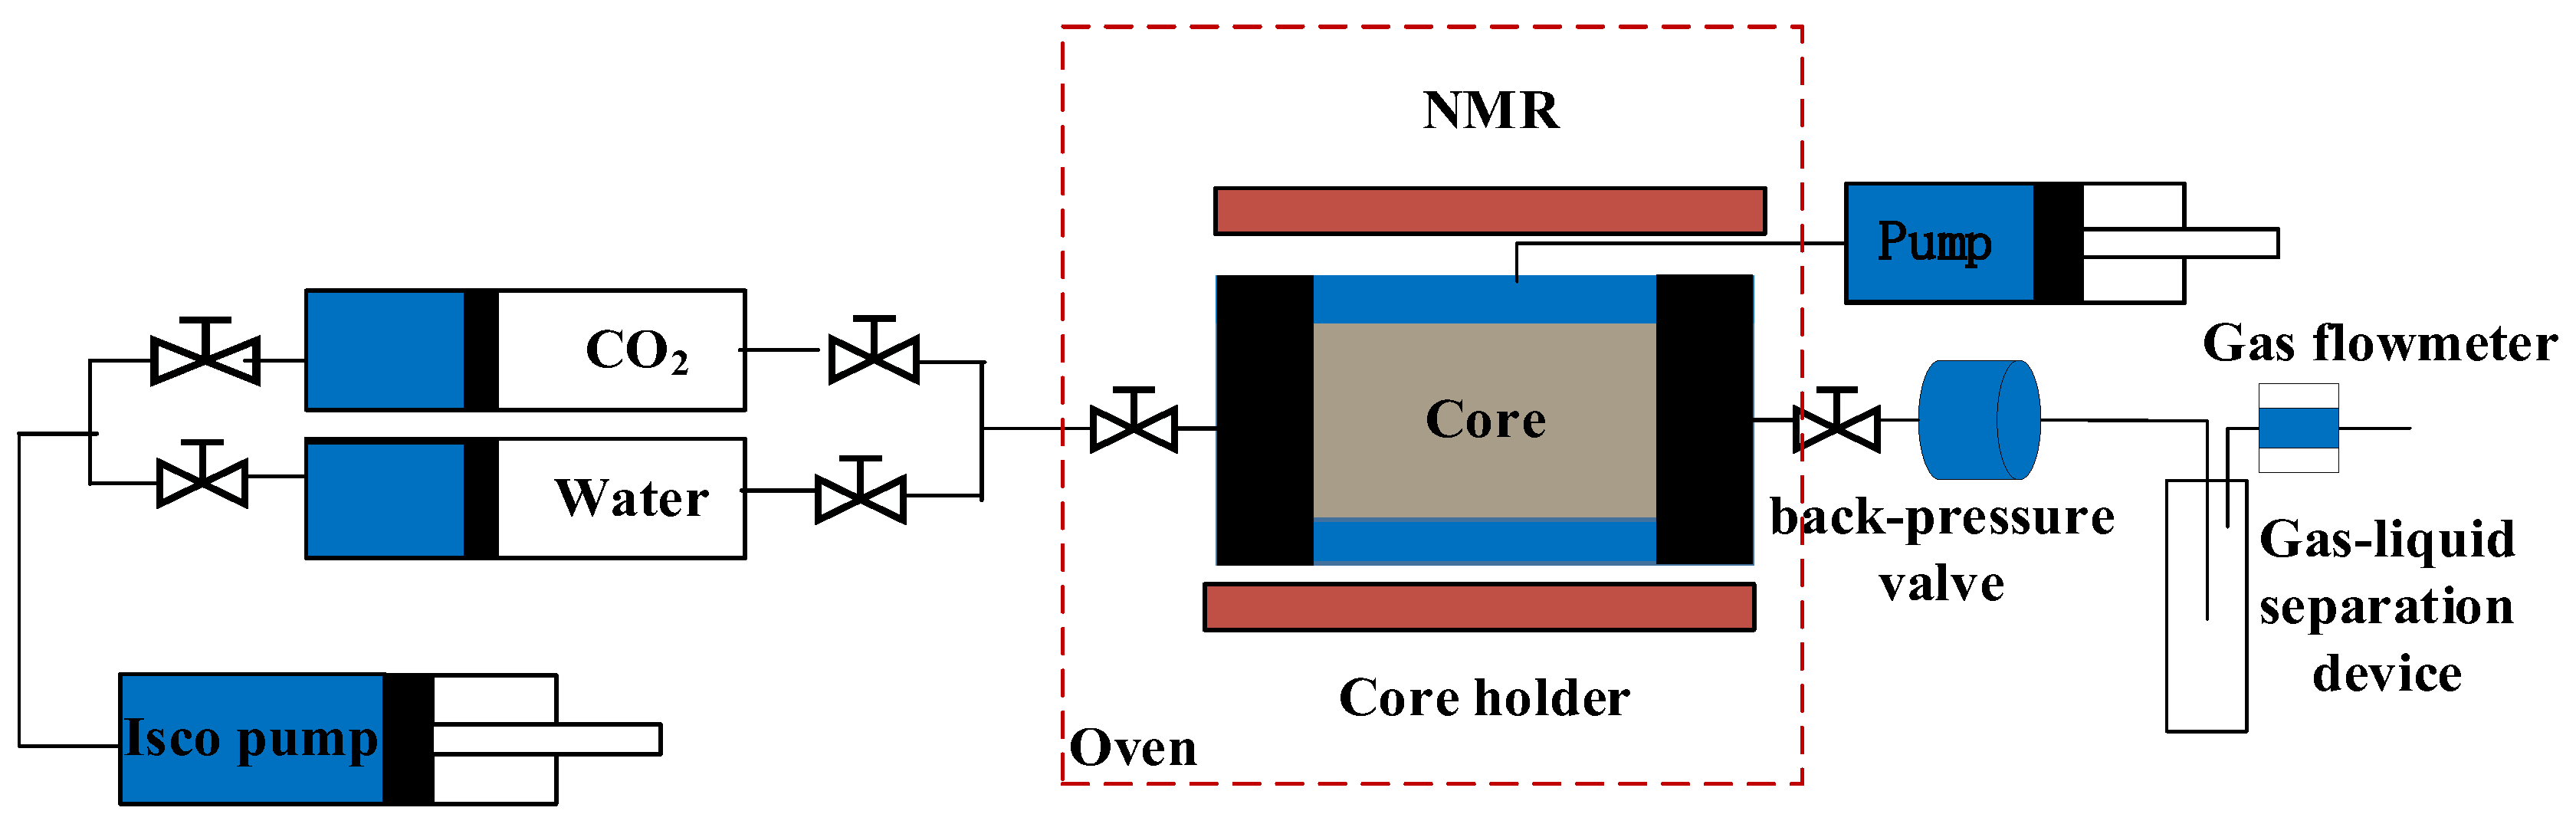
2.3. CO2–Water–Rock Dynamic Displacement Experiment

The experimental equipment is shown in Figure 2, including the high-pressure micro-metering pump, core holder, pressure gauge, electronic balance, thermostat, and nuclear magnetic resonance (NMR) instrument.
The air tightness of the core holder was tested. Through the analysis of the main ions in the formation water before the experiment using the ICP-MS method, it was clear that the cations which are easy to react with CO2 form precipitated cations. After 48 h of drying, the dry weight was weighed and the formation water was saturated through pressure saturation. The porosity was calculated by comparing the mass difference before and after saturation with the total volume of the core, and transverse relaxation time (T2) spectrum sampling was carried out using NMR. The saturated core was placed into the core holder, and the displacement pump conducted CO2 displacement of the formation water in constant-pressure mode, with the pressure difference controlled by the back pressure valve set to 1 MPa. Based on the experimental plan, various experimental conditions were established for displacement, aiming to investigate the influence of CO2 flooding water on reservoir pore physical properties, under varying temperatures (30 °C, 40 °C, 50 °C, 60 °C), displacement pressures (5 MPa, 10 MPa, 15 MPa, 20 MPa), and displacement PV values (25 PV, 50 PV, 75 PV, 100 PV). After completing the displacement, the T2 spectrum of the core’s re-saturated formation water was sampled and the core permeability was tested. The T2 spectrum difference of the saturated water before and after displacement was compared to analyze the changes in the core’s physical properties following the CO2–water–rock reaction.

3. Results and Discussion

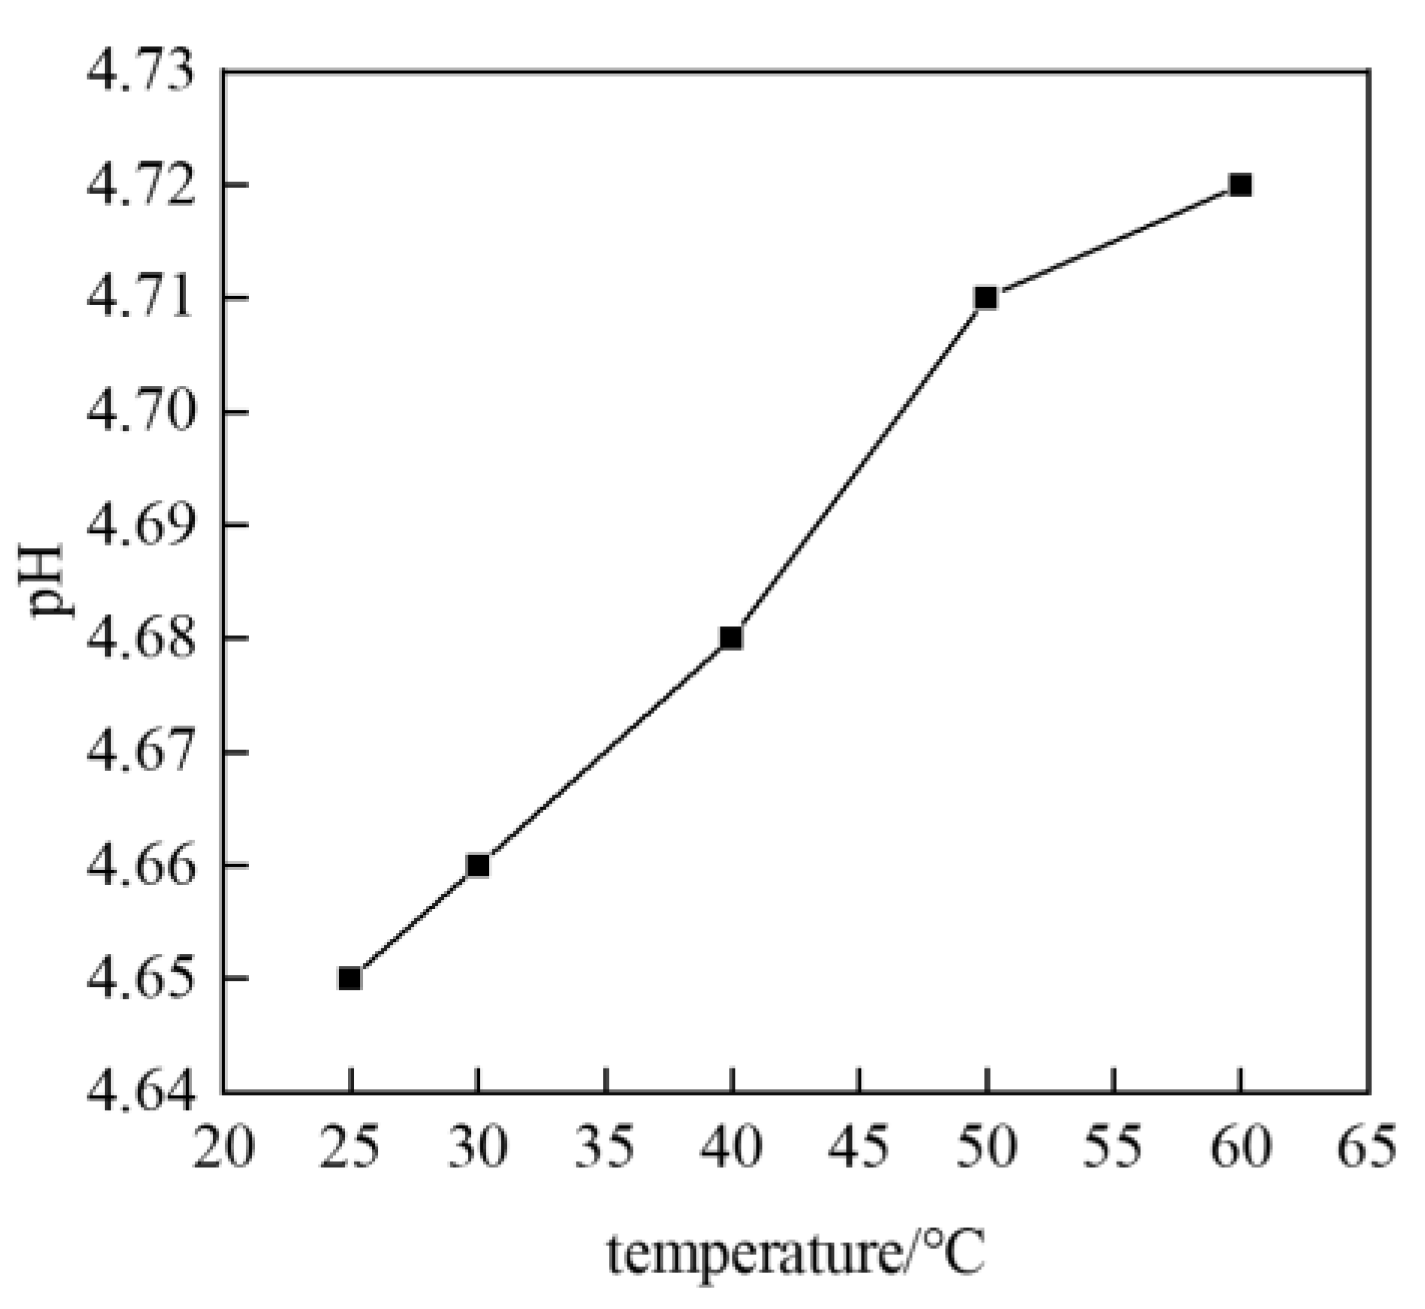
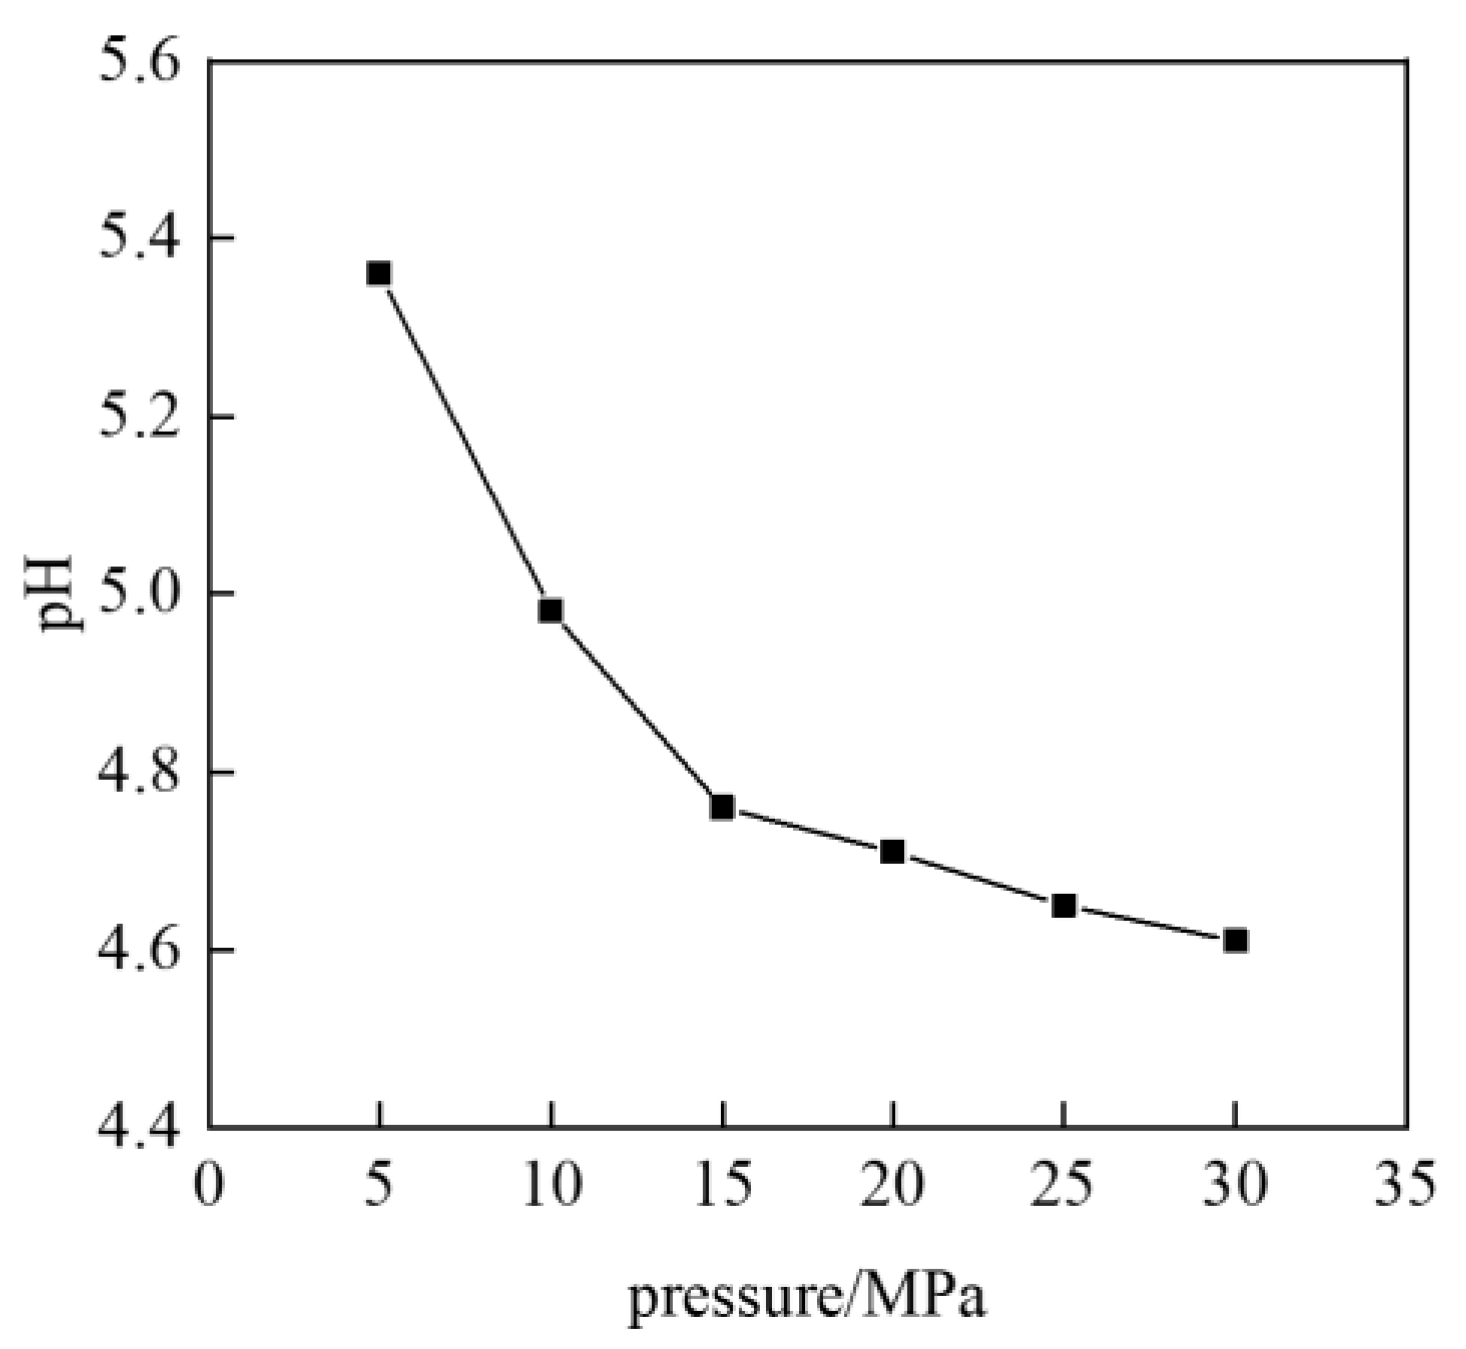
3.1. Influence of Pressure and Temperature Conditions on Formation Water pH Value

Figure 3 shows the influence of different temperatures on the pH value of the produced liquid at 20 MPa. As the solubility of CO2 in the formation water decreases due to the rise in temperature, the CO2 dissolved in the formation water also decreases. The reduction in CO2 results in a decrease in carbonic acid and a subsequent reduction in H+ in the formation water. Simultaneously, elevated temperatures promote the ionization reaction of carbonic acid toward the product, leading to an increase in H+ in the formation water. Consequently, the pH of the resulting liquid increases after the CO2–formation water reaction takes place.
Figure 4 demonstrates the impact of varying pressures on the pH value of the resulting liquid at 60 °C. When pressurizing the high-temperature and high-pressure reactor at a specific temperature, the solubility of CO2 in formation water increases correspondingly, resulting in an elevation in carbonic acid due to the increased dissolution of CO2 in the formation water. The rise in CO2 levels facilitates the ionization reaction towards the product direction, resulting in an increase in the ionized H+ concentration and consequently leading to a decrease in the pH of the formation water. Additionally, the increase in pressure accelerates the rate of the ionization reaction, thus promoting the continuous ionization of H2CO3 and HCO3 into H+ ions and leading to a decrease in the pH value of the formation water. The H+ concentration of the formation water increases under the combined action of the two effects, and the pH value of the formation water enhances towards acidity, gradually decreasing with the increase in pressure.

3.2. Change in Ion Concentration in Formation Water during Static Reaction

Based on the X-ray diffraction (XRD) analysis of the core, it was found that the core contains a higher concentration of minerals such as plagioclase, potassium feldspar, and dolomite, which are more susceptible to reacting with CO2 during injection. In order to verify the reaction of the core under the influence of carbonic acid, the formation water in the original static experiment was replaced with distilled water, the core fragments were placed in a high-temperature and high-pressure reactor, the distilled water was saturated after a vacuum, and the CO2 was injected and left to stand for 40 h. Subsequent to the completion of the experiment, the resulting liquid was collected for ion detection. The changes in ion content within the produced liquid were then analyzed under different influencing factors, as presented in Table 4.
Following the completion of the experiment, the concentration of common cations within the resulting solution was determined utilizing the ICP-MS method. K+, Na+ and Ca2+ could be detected in the produced liquid after the reaction by passing CO2 into the high-temperature and high-pressure reactor. Since the distilled water in the reactor did not contain the above ions, the ions detected in the produced liquid were all generated through the dissolution of reservoir minerals. The presence of Na+ and K+ can primarily be attributed to the dissolution of plagioclase and potassium feldspar, respectively, indicating varying degrees of dissolution for these minerals within the core. Because the mineral content of plagioclase in the core is relatively high, the Na+ concentration in the produced solution increases significantly, while the K+ concentration in the produced solution increases due to the dissolution of potassium feldspar under the action of the acid solution. However, due to the low content of potassium feldspar in the core, the concentration only increases slightly. The presence of Ca2+ in the solution primarily originates from the dissolution of carbonate minerals like dolomite and calcite. Due to the reactivity of carbonate minerals with H+, the concentration of Ca2+ in the resulting solution tends to increase more significantly compared to other ions. Simultaneously, it can be observed that as the pressure increases, the concentrations of Na+, K+, and Ca2+ in the resulting liquid gradually elevate. Under the influence of pressure, the dissolution capacity of rocks gradually amplifies as the pressure increases. When the pressure exceeds the critical level, the dissolution degree further increases. The elevation of temperature additionally serves to stimulate the dissolution of core minerals, particularly after surpassing the critical pressure. High temperatures continue to advance the dissolution reaction within the core. Therefore, the formation’s high-temperature and -pressure conditions are conducive to the dissolution of rock minerals.
The alterations in particle size and PDI (polydispersity index) of formation water before and after the CO2–water–rock static tests were analyzed using a Malvern laser particle size analyzer. The PDI represents whether the particle size distribution is uniform, and the smaller the PDI value, the more uniform the particle size distribution and the more uniform the particle size. On the contrary, the larger the PDI value, the wider the particle size distribution and the more uneven the particle size. The alterations in the particle size and PDI of the formation water were compared before adding core fragment samples and after the formation water reacted with the core samples and supercritical CO2 at a pressure of 20 MPa and temperature of 60 °C. The results are presented in Table 5.
As depicted in Table 5, the average particle size of the formation water prior to the reaction is recorded as 1196 nm, with a PDI of 0.292. Conversely, after the reaction, the average particle size of the formation water increases to 2775 nm, accompanied by a raised PDI of 0.439. Following the reaction, the average particle size of the formation water experienced a significant increase of 1579 nm, while the PDI witnessed a noticeable elevation of 0.147. The uniformity of mineral particles on the surface of rock samples is rather inadequate, rendering them susceptible to dissolution and reaction when exposed to high-temperature and -pressure conditions. Carbonate minerals such as dolomite and calcite exhibit instability under acidic conditions, leading to the release of secondary minerals and crystalline substances from reacting salts into the formation water. Consequently, this process contributes to the increase in particle size in the formation water. After the dissolution of clay cements and other minerals, the cementation weakens and dislodges into the formation water, contributing to an increase in the average particle size and enhancing the particle size heterogeneity in the water.
After conducting the CO2–water–rock static experiment, SEM was utilized to observe the microscopic changes on the core’s surface and the dissolution state. The surface of the core sample was smoothed and then scanned with an electron microscope. The specific results are shown in Figure 5 and Figure 6. Figure 5 clearly illustrates that, prior to the reaction, the surface of the core was smooth and even, devoid of any fine particles. Once the pressure increased to 5 MPa, the rock surface underwent a transformation, becoming rough and experiencing slight acidic corrosion from the carbonic acid. This lead to the emergence of minute pores at the marked locations in the figure. As the pressure increases, mineral dissolution becomes more intense and results in the emergence of more and more micro pores. In addition, the dissolution of minerals causes cemented clay minerals to disintegrate, leading to an increase in debris, as depicted in Figure 5c. When CO2 reaches the supercritical state, the reaction becomes highly efficient. In Figure 5d,e, numerous small irregular particles are observed adhering to the surface of the rock. These particles may be derived from newly formed mineral particles resulting from the reaction between CO2, water, and minerals, or they could be fine particles produced after the dissolution of initially larger minerals. Under intensified dissolution, the small pores formed due to the initial dissolution process also enlarge, forming solution pores with a larger size. However, the surfaces of these solution pores may be partially obstructed by clay particles and newly formed fine particles. At varying temperatures, Figure 6 demonstrates that as the temperature increases, the dissolution process becomes more pronounced. This leads to a gradual augmentation in the number of small pores. After the critical condition of CO2 is reached, the particles on the core surface increase in number, the small pores become larger, large pores such as solution pits appear, and the dissolution effect on the minerals on the rock surface is strong.

3.3. Changes in Core Physical Properties after CO2 Displacement

3.3.1. Effect of Injection PV Number

Table 6 shows core flooding information and displacement conditions. Samples of saturated water, both before and after displacement, were collected and compared by analyzing their respective T2 spectra.
Figure 7 shows the T2 spectra of saturated water before and after 25 PV flooding. From Figure 7, it can be observed that after CO2 flooding of 25 PV in saturated water–rock cores, the quantity of secondary saturated water is significantly lower than that of the initial saturated water. This indicates that, following the 25 PV flooding, the pore throat becomes obstructed by the newly formed minerals resulting from the water–rock reaction of CO2 and the debris generated by the mineral corrosion from carbonic acid formation. The saturation of water before and after CO2 flooding undergoes a significant change between 1 ms to 100 ms, implying that the water–rock reaction of CO2 primarily impacts the intermediate and larger-sized pores during the initial stages of CO2 flooding.
Figure 8 shows the T2 spectra of saturated water before and after 50 PV flooding. After the 50 PV injection, it can be seen from the figure that the pore water saturation at 0.1–1 ms is reduced to a certain extent, which indicates that blockage occurs in the small hole. The saturation of water also exhibited a certain level of change before and after displacement between 10 and 100 ms. This implies that, as the reaction time increased, the debris created through the dissolution process following CO2 injection gradually accumulated in the larger-sized pores, leading to the formation of partial blockages.
Figure 9 shows the T2 spectra of saturated water before and after 75 PV flooding. After injecting 75 PV of fluid, the saturated water volume in the small pores (represented by 1–10 ms) and the saturated water volume in the larger pores (represented by 10–100 ms) decreased significantly. This suggests a more severe pore blockage and a reduction in the pore throat volume. However, the saturated water volume of the small pores (represented by 0.1–1 ms) only decreased slightly, indicating that, with the increasing reaction time, the plugging at mesopores and larger pores decreased, resulting in an increase in pore volume. Nonetheless, CO2 still reacted with water in the small pores, resulting in a certain degree of plugging.
Figure 10 shows the T2 spectra of saturated water before and after 100 PV flooding. As the CO2 flooding time increased, the signal volume after CO2 flooding decreased significantly, revealing a more severe degree of plugging. The most significant change occurred in the region of mesopores and larger pores (represented by 10–100 ms), indicating that rock debris particles generated by CO2–water–rock dissolution were concentrated in the area of larger pores. Conversely, the signal volume in the small and medium pores (represented by 0.1–10 ms) increased, indicating an increase in the saturated water volume. Therefore, it can be inferred that the dissolution caused small cracks in the pore channels, leading to an increase in pore volume in the small and medium pores.
After the reaction between CO2, water, and rock, secondary minerals and stripped particles are formed and migrate with the fluid, blocking the pores and reducing the overall pore volume of the core. Utilizing the principle of nuclear magnetic resonance, the peak area of the T2 curve reflects the signal quantity emitted by hydrogen in the entire core, which corresponds to the amount of saturated water in the core. The T2 spectra of saturated water are measured before and after CO2 flooding to characterize these changes. Figure 11 shows the schematic diagram for calculating the degree of pore plugging.
The figure illustrates the schematic diagram of the degree of core pore plugging. Assuming that the peak area of the T2 spectrum of saturated water before CO2 flooding is represented by S1, and the peak area of the T2 spectrum of saturated water after CO2 flooding is represented by S2; the pore plugging rate (B) can be obtained by comparing the difference in the T2 spectrum before and after saturation, as shown in Equation (10).
B = S 1 S 2 S 1
where B is the pore plugging rate; S1 is the peak area value of saturated water before CO2 flooding; and S2 is the peak area value of saturated water after flooding. Table 7 shows the pore permeability changes of the core before and after CO2 displacement. From the table, it is evident that the permeability of the core decreases after CO2 flooding compared to its initial value, with a reduction ranging from 9% to 18%. Similarly, the porosity of the core also decreases after CO2 flooding, with a reduction ranging from 6% to 17%. With the increase in the PV number, the pore permeability change rate and pore plugging rate still increased significantly, indicating that with the continuous injection of CO2, the precipitation plugging effect generated by the CO2–water–rock reaction was greater than the dissolution effect of CO2 on different minerals.

3.3.2. Effect of Pressure

In this experiment, the CO2 flooding pressure conditions were modified while keeping other conditions constant, as depicted in Table 8. Figure 12 shows the T2 spectra of saturated formation water before and after CO2 flooding under different pressures. It is apparent in Figure 12a that the larger pores are the first to experience blockage, leading to a significant decrease in secondary saturation flag; the smaller and medium-sized pores of the core (0.1~10 ms) show little change in their secondary saturation flag. Figure 12b shows the T2 spectra of saturated formation water before and after CO2 flooding at a pressure of 10 MPa. As the CO2 flooding pressure increased, both the temperature and pressure were higher than the critical conditions of CO2 (31.6 °C, 7.39 MPa). CO2 transitioned from a gaseous state to a supercritical state. In the larger pores, represented by 10–100 ms, the semaphore of the T2 spectrum exhibited a significant reduction following the CO2 flooding. This suggests that the blockage resulting from the water–rock reaction was intensified in these larger pores. As the CO2 flooding pressure increased, the amount of debris generated by dissolution also increased and began to gradually accumulate within the micropores. At the same time, the change rate of the core porosity and permeability also indicates that the CO2–water–rock reaction intensifies with the increase in the CO2 flooding pressure. Figure 12c shows the T2 spectra of saturated formation water before and after CO2 flooding under a pressure of 15 MPa. As the CO2 flooding pressure increases, the peak value of the T2 spectrum measured with saturated water after CO2 flooding shifts towards the left. This shift indicates a reduction in the overall pore diameter of the core, in which the pores become blocked due to the CO2–water–rock reaction. The amount of saturated water in larger pores decreases, which suggests the gradual accumulation of debris generated by dissolution or the formation of new minerals. This accumulation ultimately leads to a decrease in secondary saturated water. The semaphore of small and medium pores increased slightly after displacement, indicating that small fractures were produced by dissolution, the pore volume of small pores increased, and the change rate of the pore permeability did not continue to increase. After the injection pressure rises to 20 MPa, it is obvious from Figure 12d that the CO2–water–rock reaction becomes more and more intense under the influence of the rising pressure, and the signal volume of the T2 spectrum of the core after CO2 flooding becomes less and less, but the secondary saturated water in small and medium pores increases. The observed trend indicates that as the pressure rises, the dissolution process becomes more pronounced, leading to the formation and connection of small fractures with larger pores. Dissolution plays a predominant role in driving the water–rock reaction.
Table 9 shows the pore permeability changes of the core before and after CO2 flooding under different pressure conditions. The table illustrates that the permeability of the core after CO2 flooding was lower than that of the core before CO2 flooding, with a reduction of approximately 10–15%. The porosity of the core after CO2 flooding also exhibited a decrease of around 11–17% when compared to the initial porosity before CO2 flooding. When CO2 was injected into the core, the CO2–water–rock reaction caused the dissolution of some minerals, resulting in the generation of new small pores. During the continuous flooding, the dissolved minerals were transported to the macropores, and some of the pores were blocked. With the increase in the injection pressure, the amount of injected CO2 increases, and the CO2–water–rock reaction becomes more violent, which will lead to more minerals shedding, and there is a greater probability that the macropores will be blocked during the migration process. As the CO2 flooding pressure increases, the rate of change in pore permeability and pore throat plugging initially rises and then declines. This trend suggests that at low pressures, the plugging effect of the CO2–water–rock reaction in larger pores is predominant. However, at high pressures, the CO2–water–rock reaction leads to the generation of new small pores, indicating that dissolution becomes the dominant mechanism.

3.3.3. Effect of Temperature

In this group of experiments, temperature conditions were changed, and other conditions remained the same, as shown in Table 10.
Figure 13 shows the T2 spectra of saturated formation water before and after CO2 flooding at different temperatures. Table 11 shows the pore permeability changes of the core before and after CO2 flooding under different temperature conditions. Figure 13a shows the T2 spectra of saturated formation water before and after CO2 flooding at 30 °C (before reaching the critical temperature of CO2). The reaction between CO2 and formation water rocks in the gas state is still weak, and the water quantity before and after saturation is only slightly decreased, with the change rate of porosity decreasing at 4.58% and permeability decreasing at 5.22%. Only a slight blockage occurs in the larger pores represented by 10–100 ms, resulting in a decrease in the secondary saturated water quantity after displacement. Figure 13b shows the T2 spectra measured for the saturated formation water before and after the core reaction at 40 °C. Compared with 30 °C, the critical temperature of CO2 was reached when the experimental temperature reached 40 °C, and CO2 was in a supercritical state, which intensified the water–rock reaction of CO2. The larger pores represented by 10–100 ms have a certain degree of blockage. Figure 13c shows the T2 spectra measured for the saturated formation water before and after the core reaction at 50 °C. As the temperature increases, the interaction between CO2 and the water–rock reaction is further intensified. Consequently, the secondary saturation of water in small and medium pores decreases significantly, indicating a more severe blockage compared to that at 40 °C. The overall porosity of the core shows a change rate of 12.86%, with a corresponding decrease in permeability of 10.48%. Figure 13d shows the T2 spectra measured for the saturated formation water before and after the core reaction at 60 °C. At 60 °C, the degree of the CO2–water–rock reaction further intensifies, leading to the dissolution of minerals within the core. During the migration, the dissolved particles become lodged in various pore throats, causing a reduction in the secondary water saturation after displacement. This blockage affects both large and small pores to varying degrees. As a result, the overall porosity of the core decreases by 15.2%, with a corresponding decrease in permeability of 15.88%. It is evident that an increase in temperature facilitates and enhances the CO2–water–rock reaction.

3.3.4. Effect of Core Permeability

For cores with different permeability, the experimental temperature is 60 °C, the CO2 flooding pressure is 10 MPa, the pressure difference is controlled at 1 MPa, and the injection PV number is 50. Figure 14 shows the T2 spectra of saturated formation water before and after CO2 flooding with different permeability. It can be seen from the comparison that the core with low permeability is greatly affected by the water–rock reaction, and the secondary saturated water volume decreases more than before the experiment. Considering the small pore radius of cores with low permeability, the migration of secondary minerals formed by the CO2–water–rock reaction and shed clay particles tends to accumulate in these tiny pores, resulting in significantly stronger plugging effects compared to the other two cores.
Table 12 shows the pore permeability changes of the cores with different permeability before and after CO2 flooding. The data presented in the table illustrate that the permeability of the cores decreases after displacement, with a reduction ranging from 2.11% to 10.78%. Similarly, the porosity of the cores also experiences a decrease after CO2 flooding, ranging from 2.74% to 8.84%. As the core permeability decreases, there is a gradual increase in both the pore permeability change rate and pore throat plugging rate, indicating that the plugging effects resulting from the CO2–water–rock reaction’s precipitation have a more significant impact on cores with lower permeability.

4. Conclusions

This paper explores the water–rock reaction conditions and their influence on the core physical properties of continental shale reservoirs through static CO2–water–rock reactions and dynamic CO2 flooding experiments. The main conclusions are as follows:
(1)
CO2 has a notable effect on the pH value of the formation water. To mitigate this influence during CO2 injection for reservoir development purposes, it is necessary to increase the injection pressure to reduce the pH value of the reservoir. By creating an acidic environment, some minerals in the reservoir can be dissolved, and the reservoir’s permeability can be enhanced to some extent.
(2)
As the temperature increased, the solubility of CO2 in the formation water decreased. Consequently, the concentration of CO32− ions decreased, and the amount of carbonate precipitation gradually decreased. Conversely, increasing the pressure promoted the ionization of carbonic acid and bicarbonate, leading to an increase in CO2 solubility. Upon pressure release, the CO2 concentration decreased, resulting in an increase in formation water precipitation.
(3)
The average particle size of the produced liquid increased by 1579 nm, and the PDI increased by 0.147. It is important to note that the core is susceptible to corrosion under high-temperature and -pressure conditions. As the temperature and pressure increased, the degree of dissolution gradually intensified. The concentration of Na+ and K+ ions primarily increased due to the dissolution of plagioclase and potassium feldspar minerals. Furthermore, the concentration of Ca2+ ions primarily increased as a result of the dissolution of dolomite and calcite carbonate minerals.
(4)
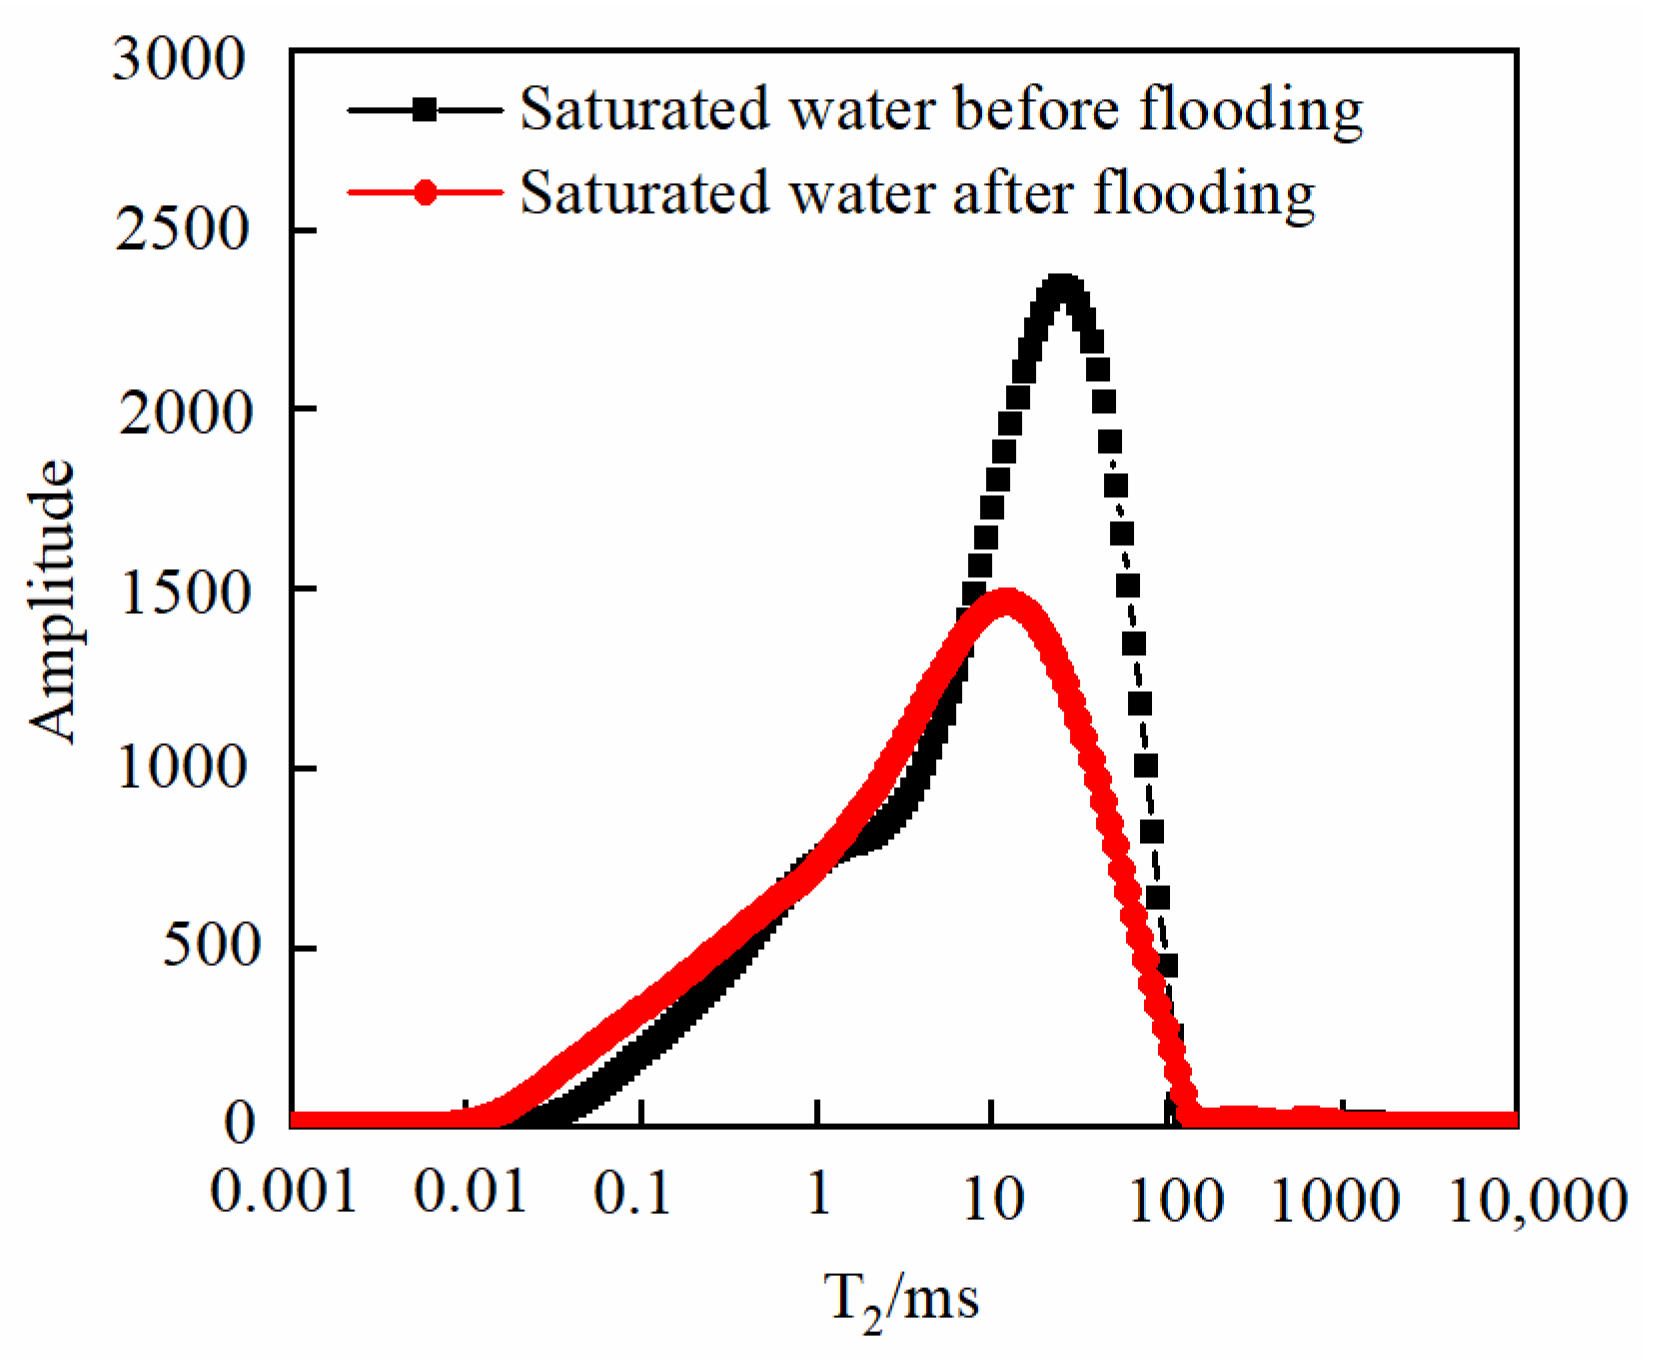
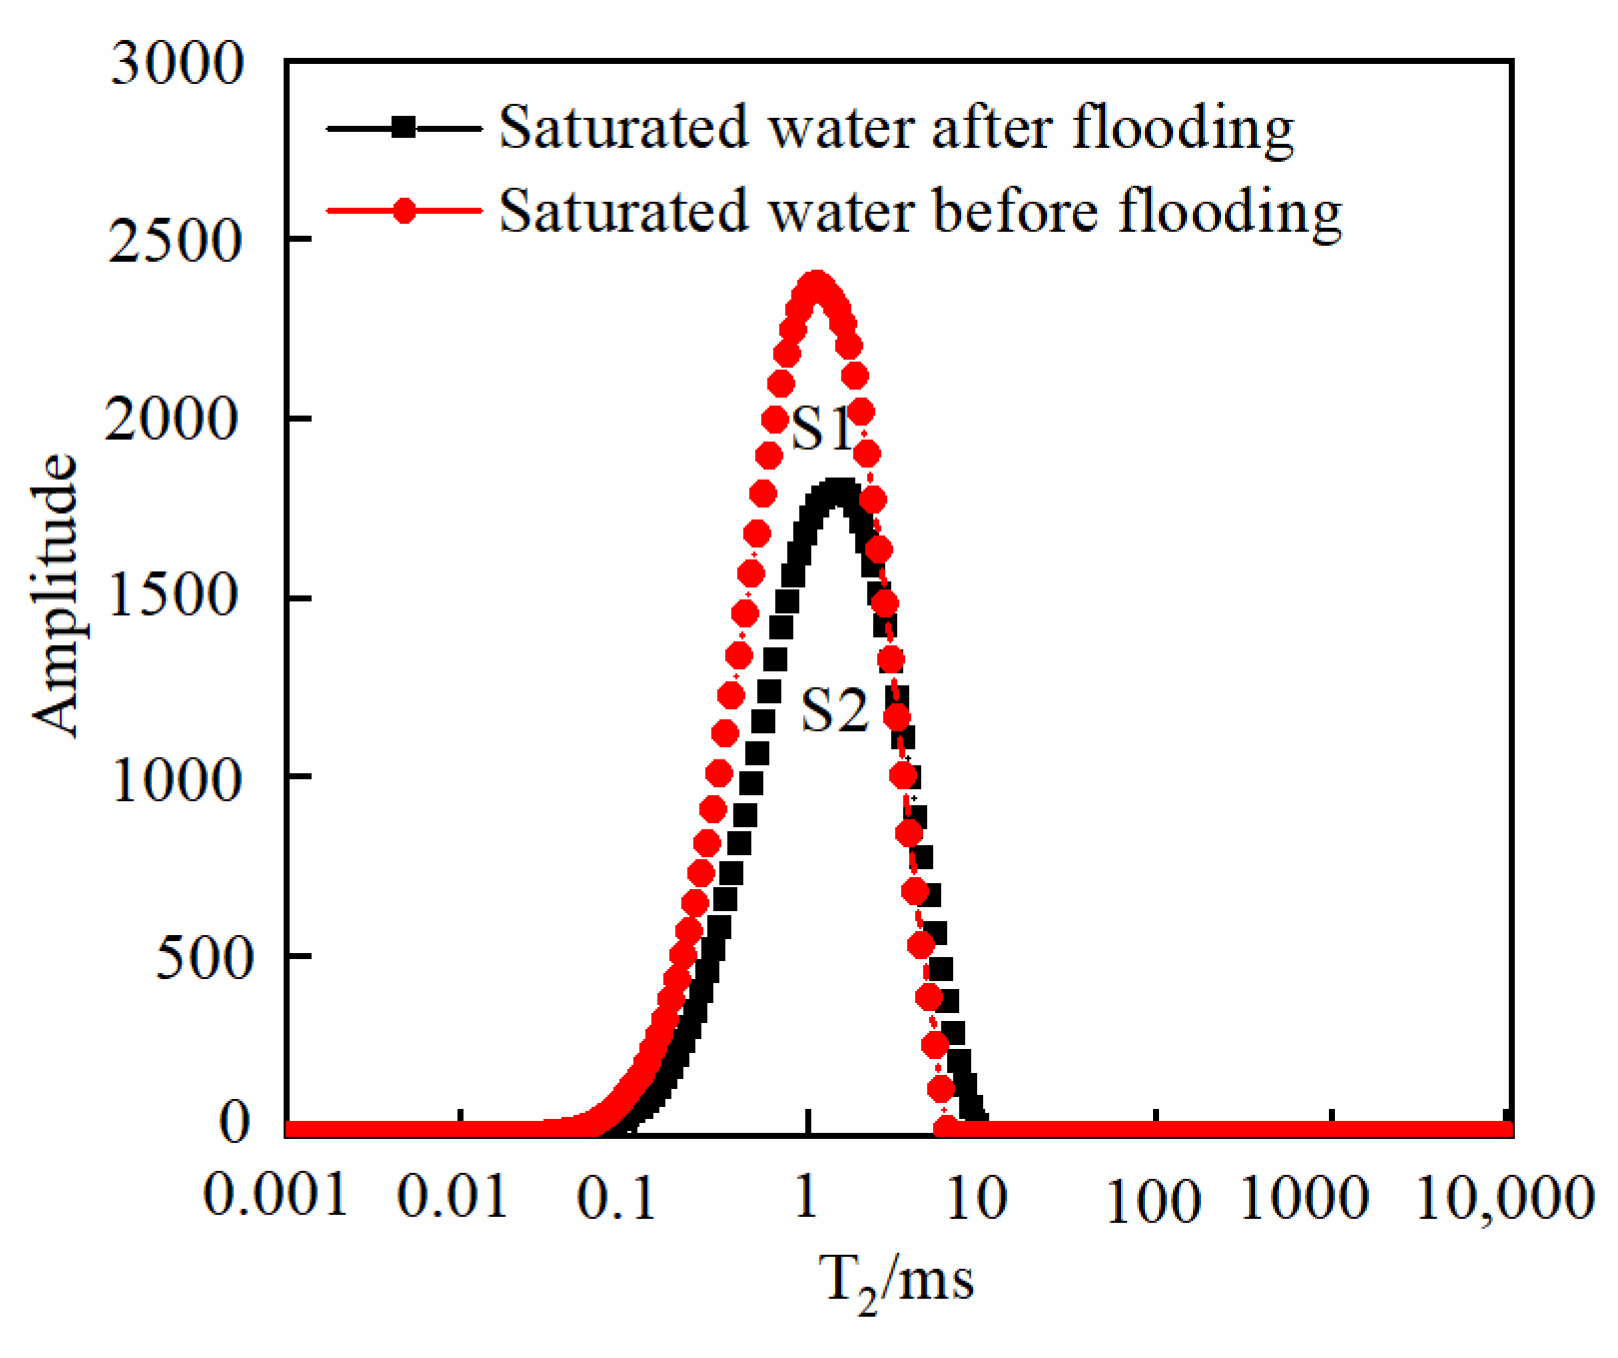
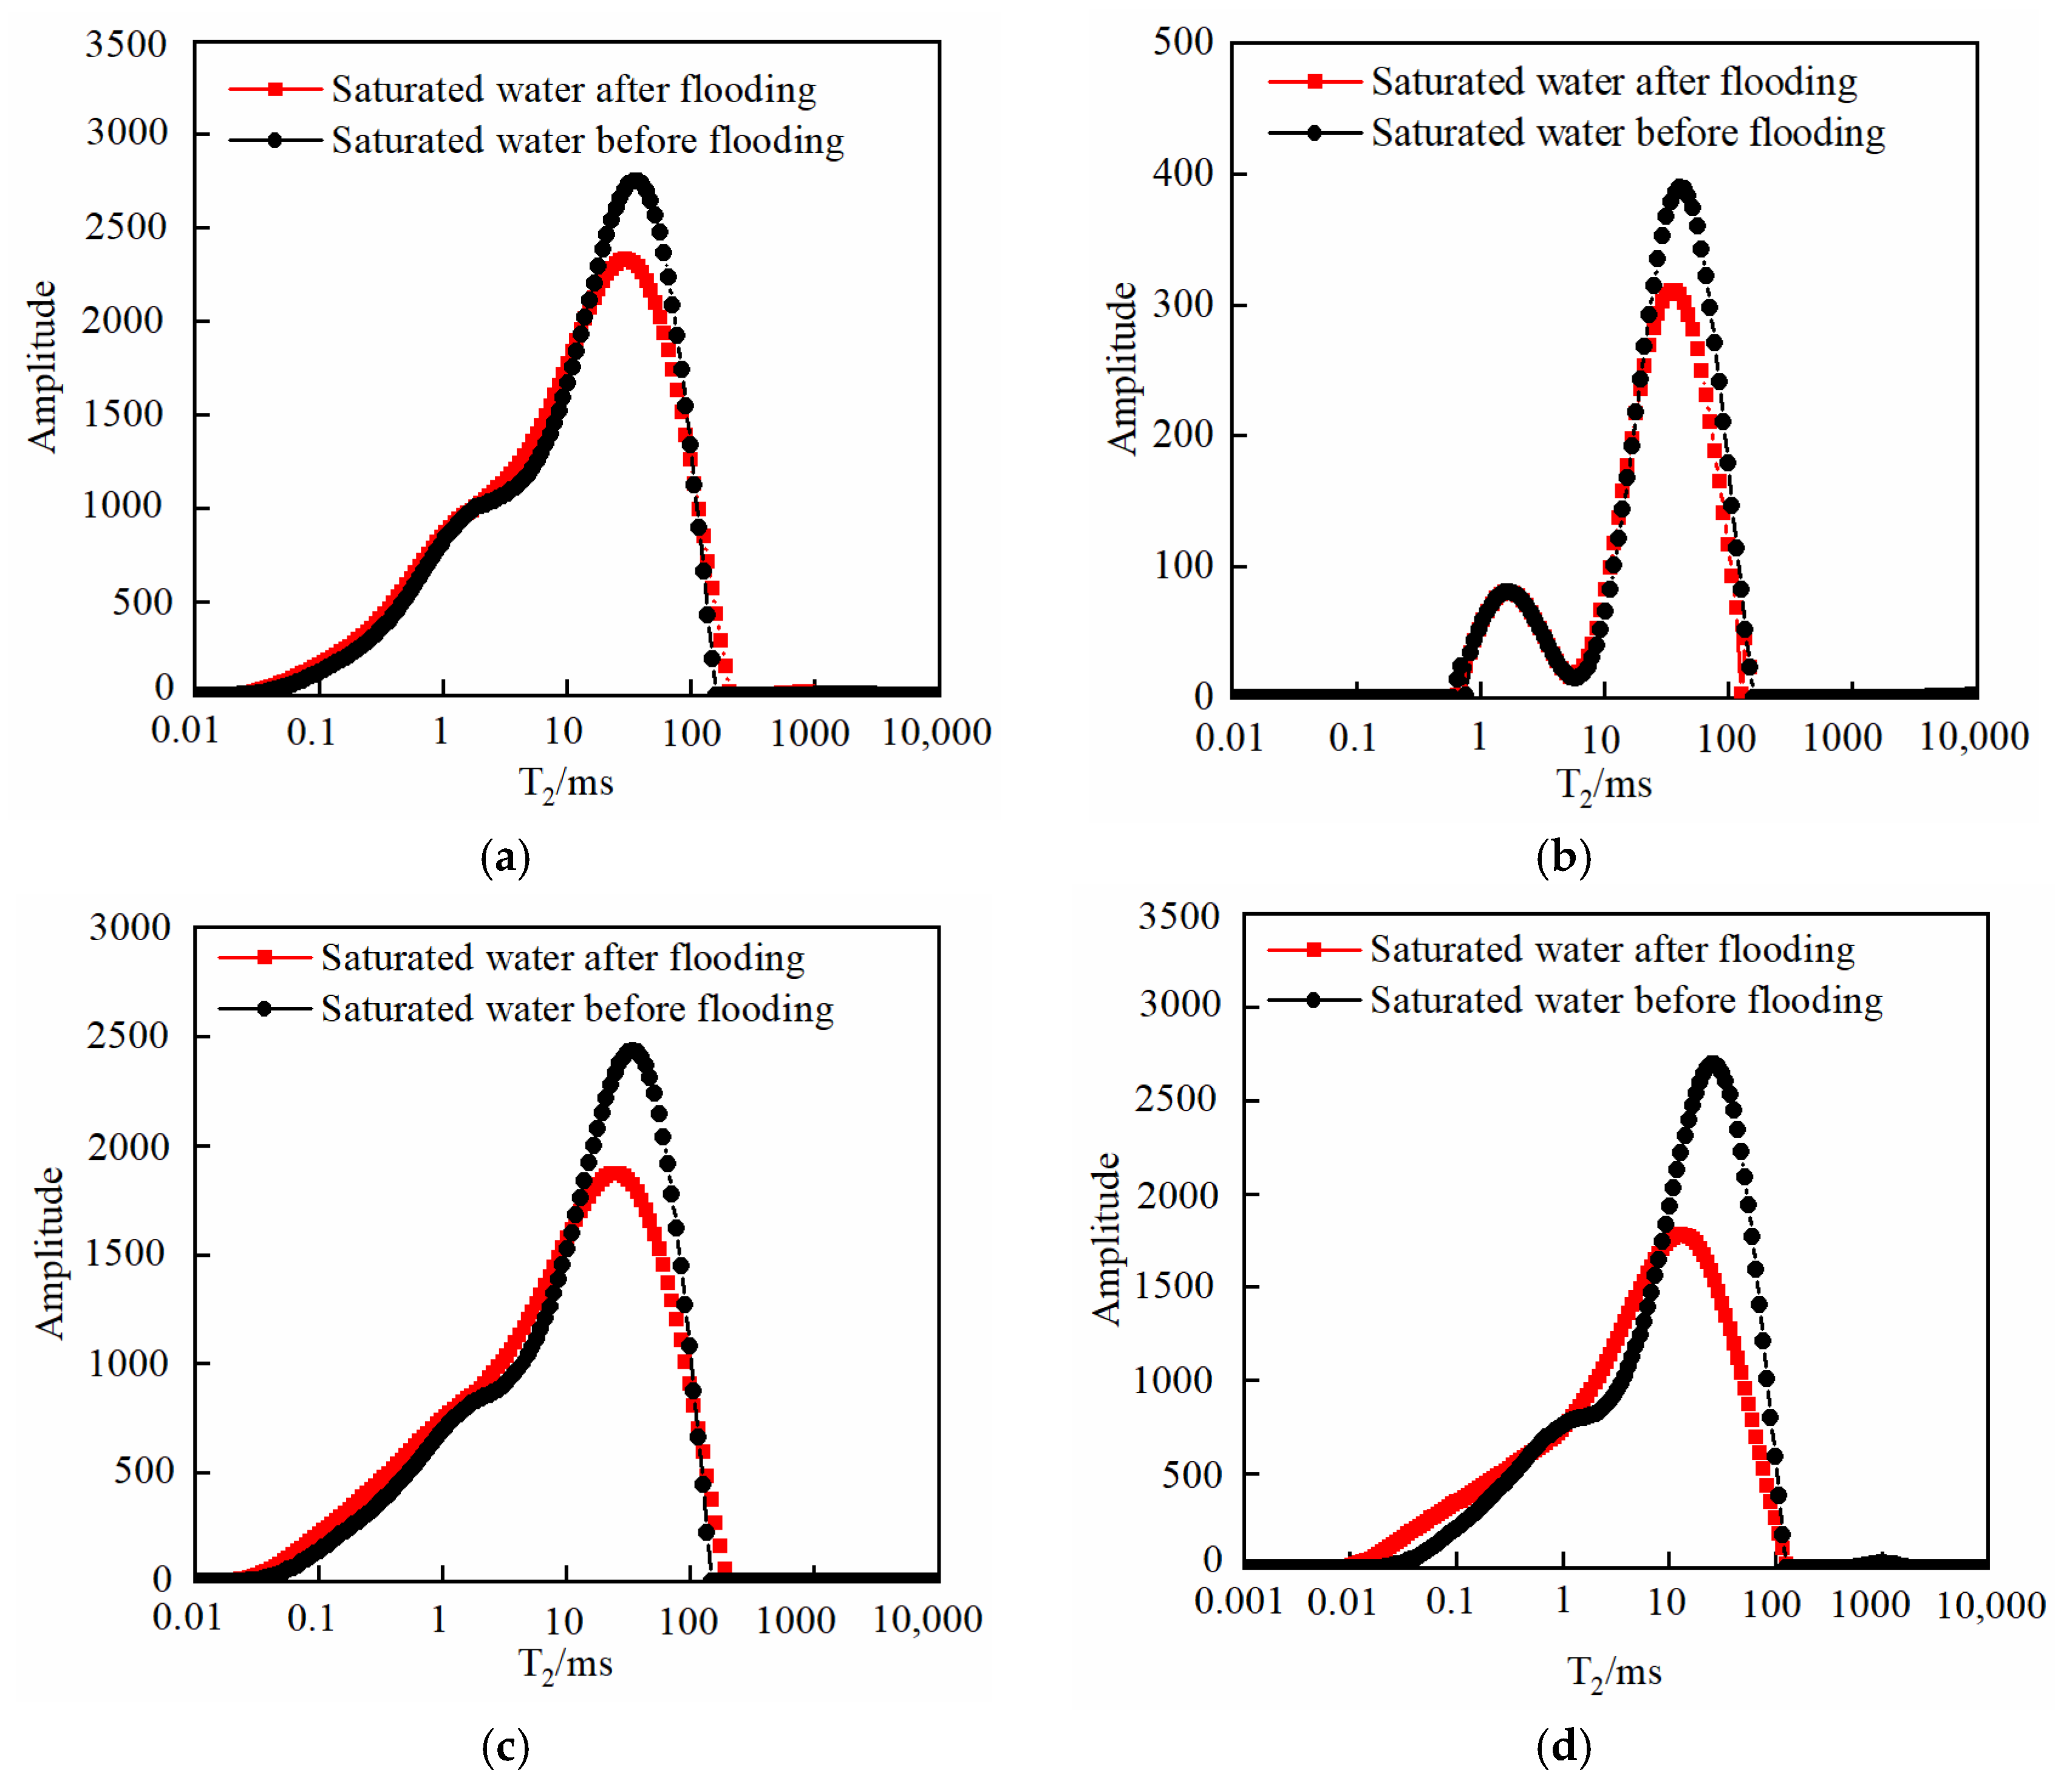
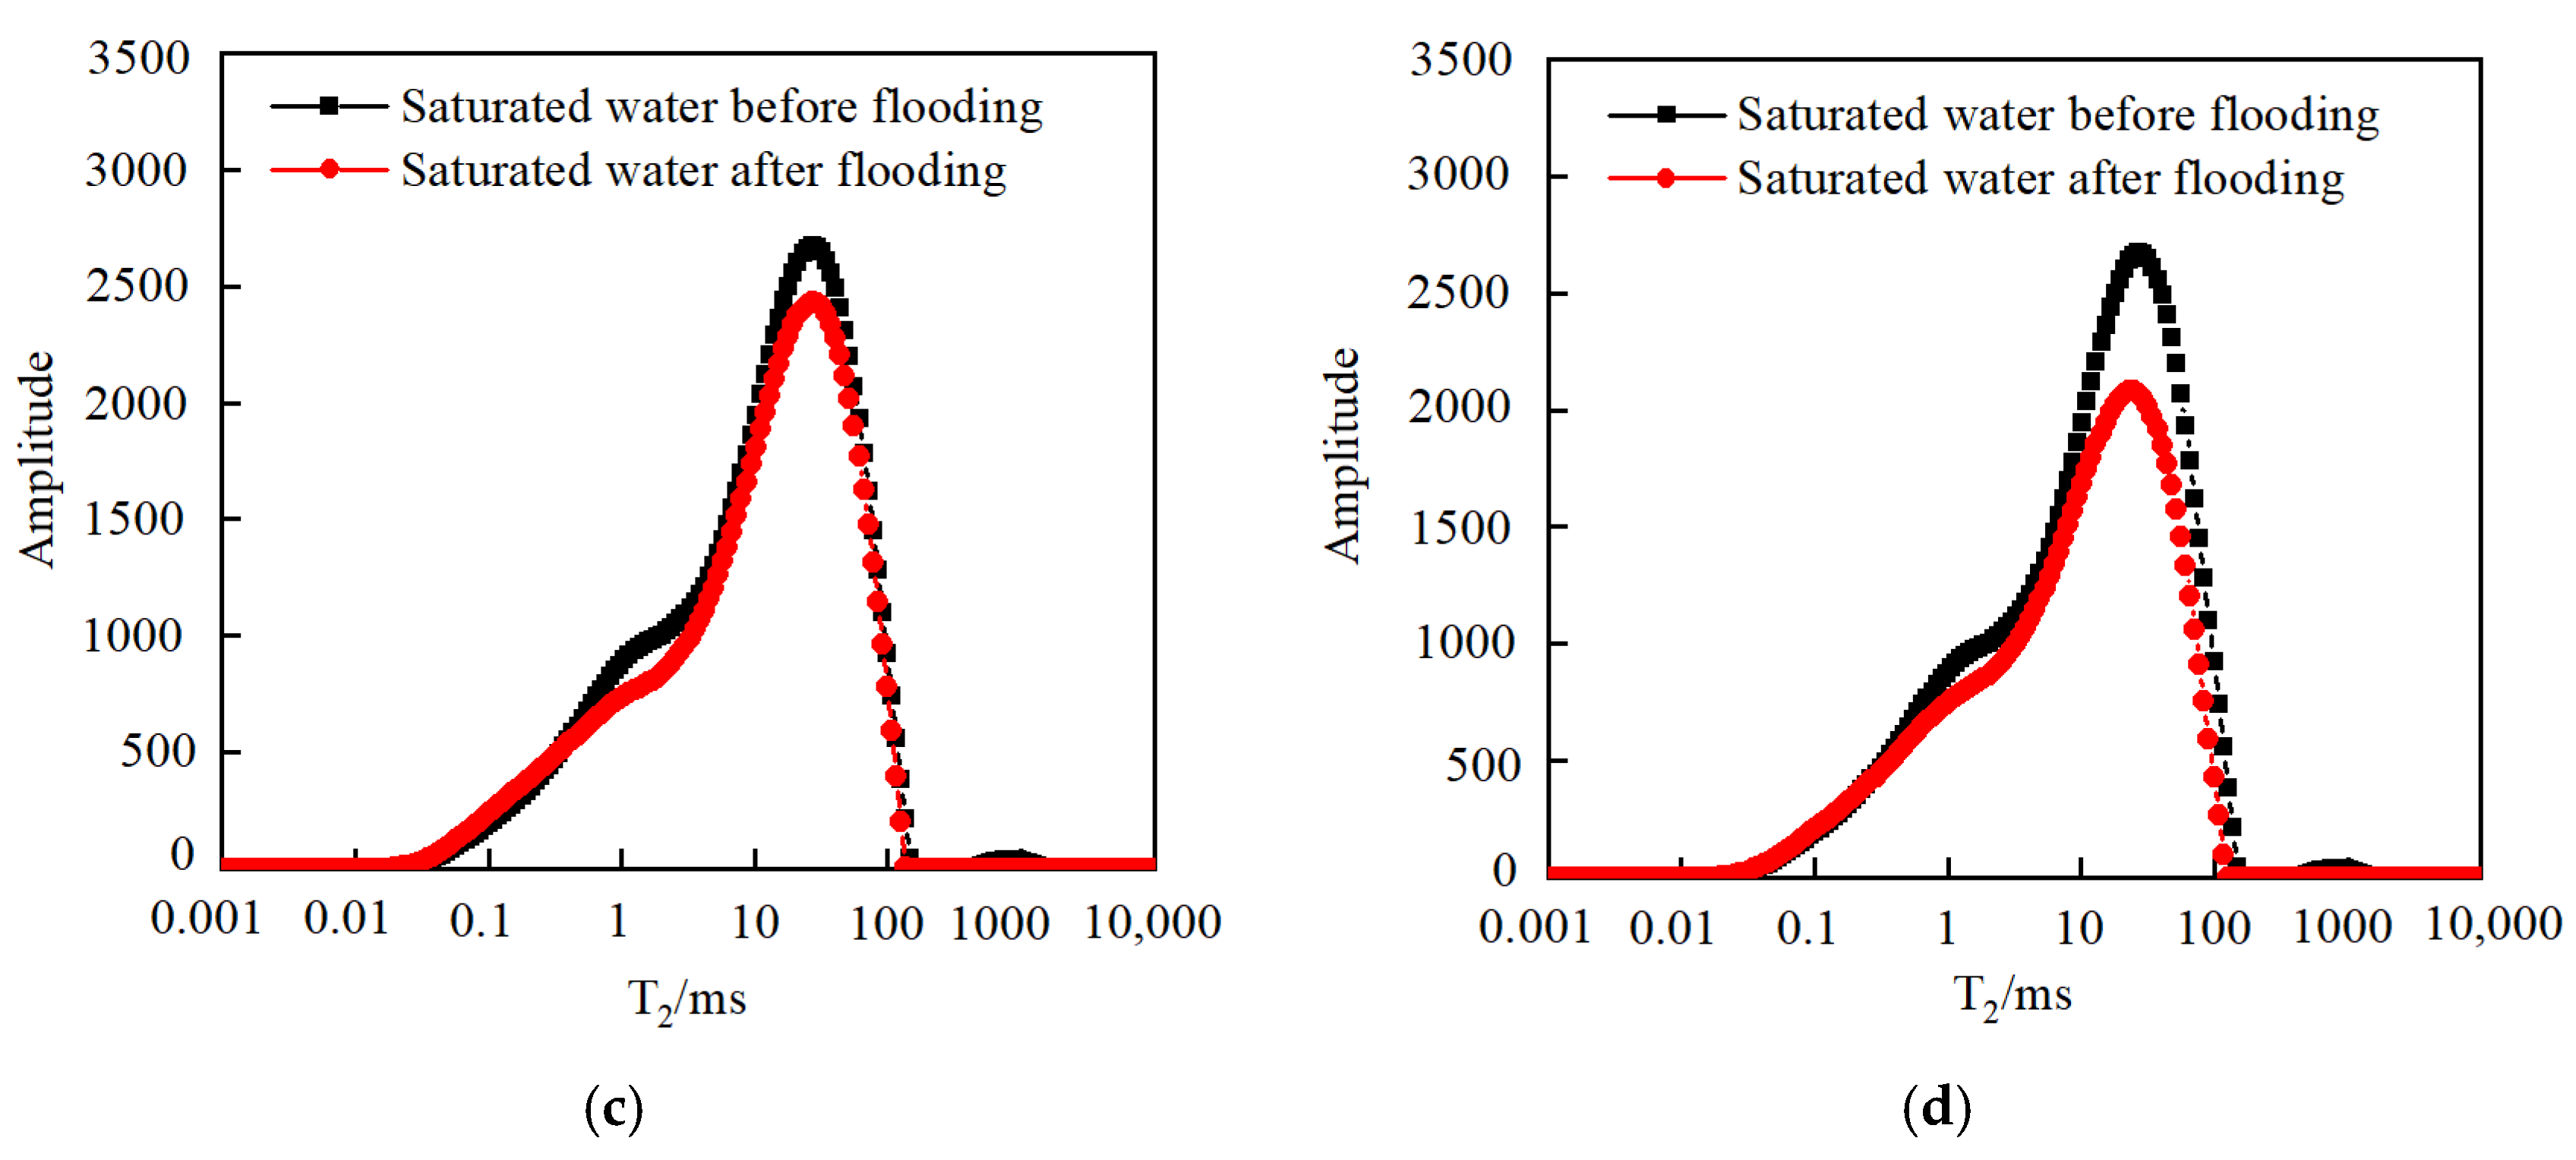
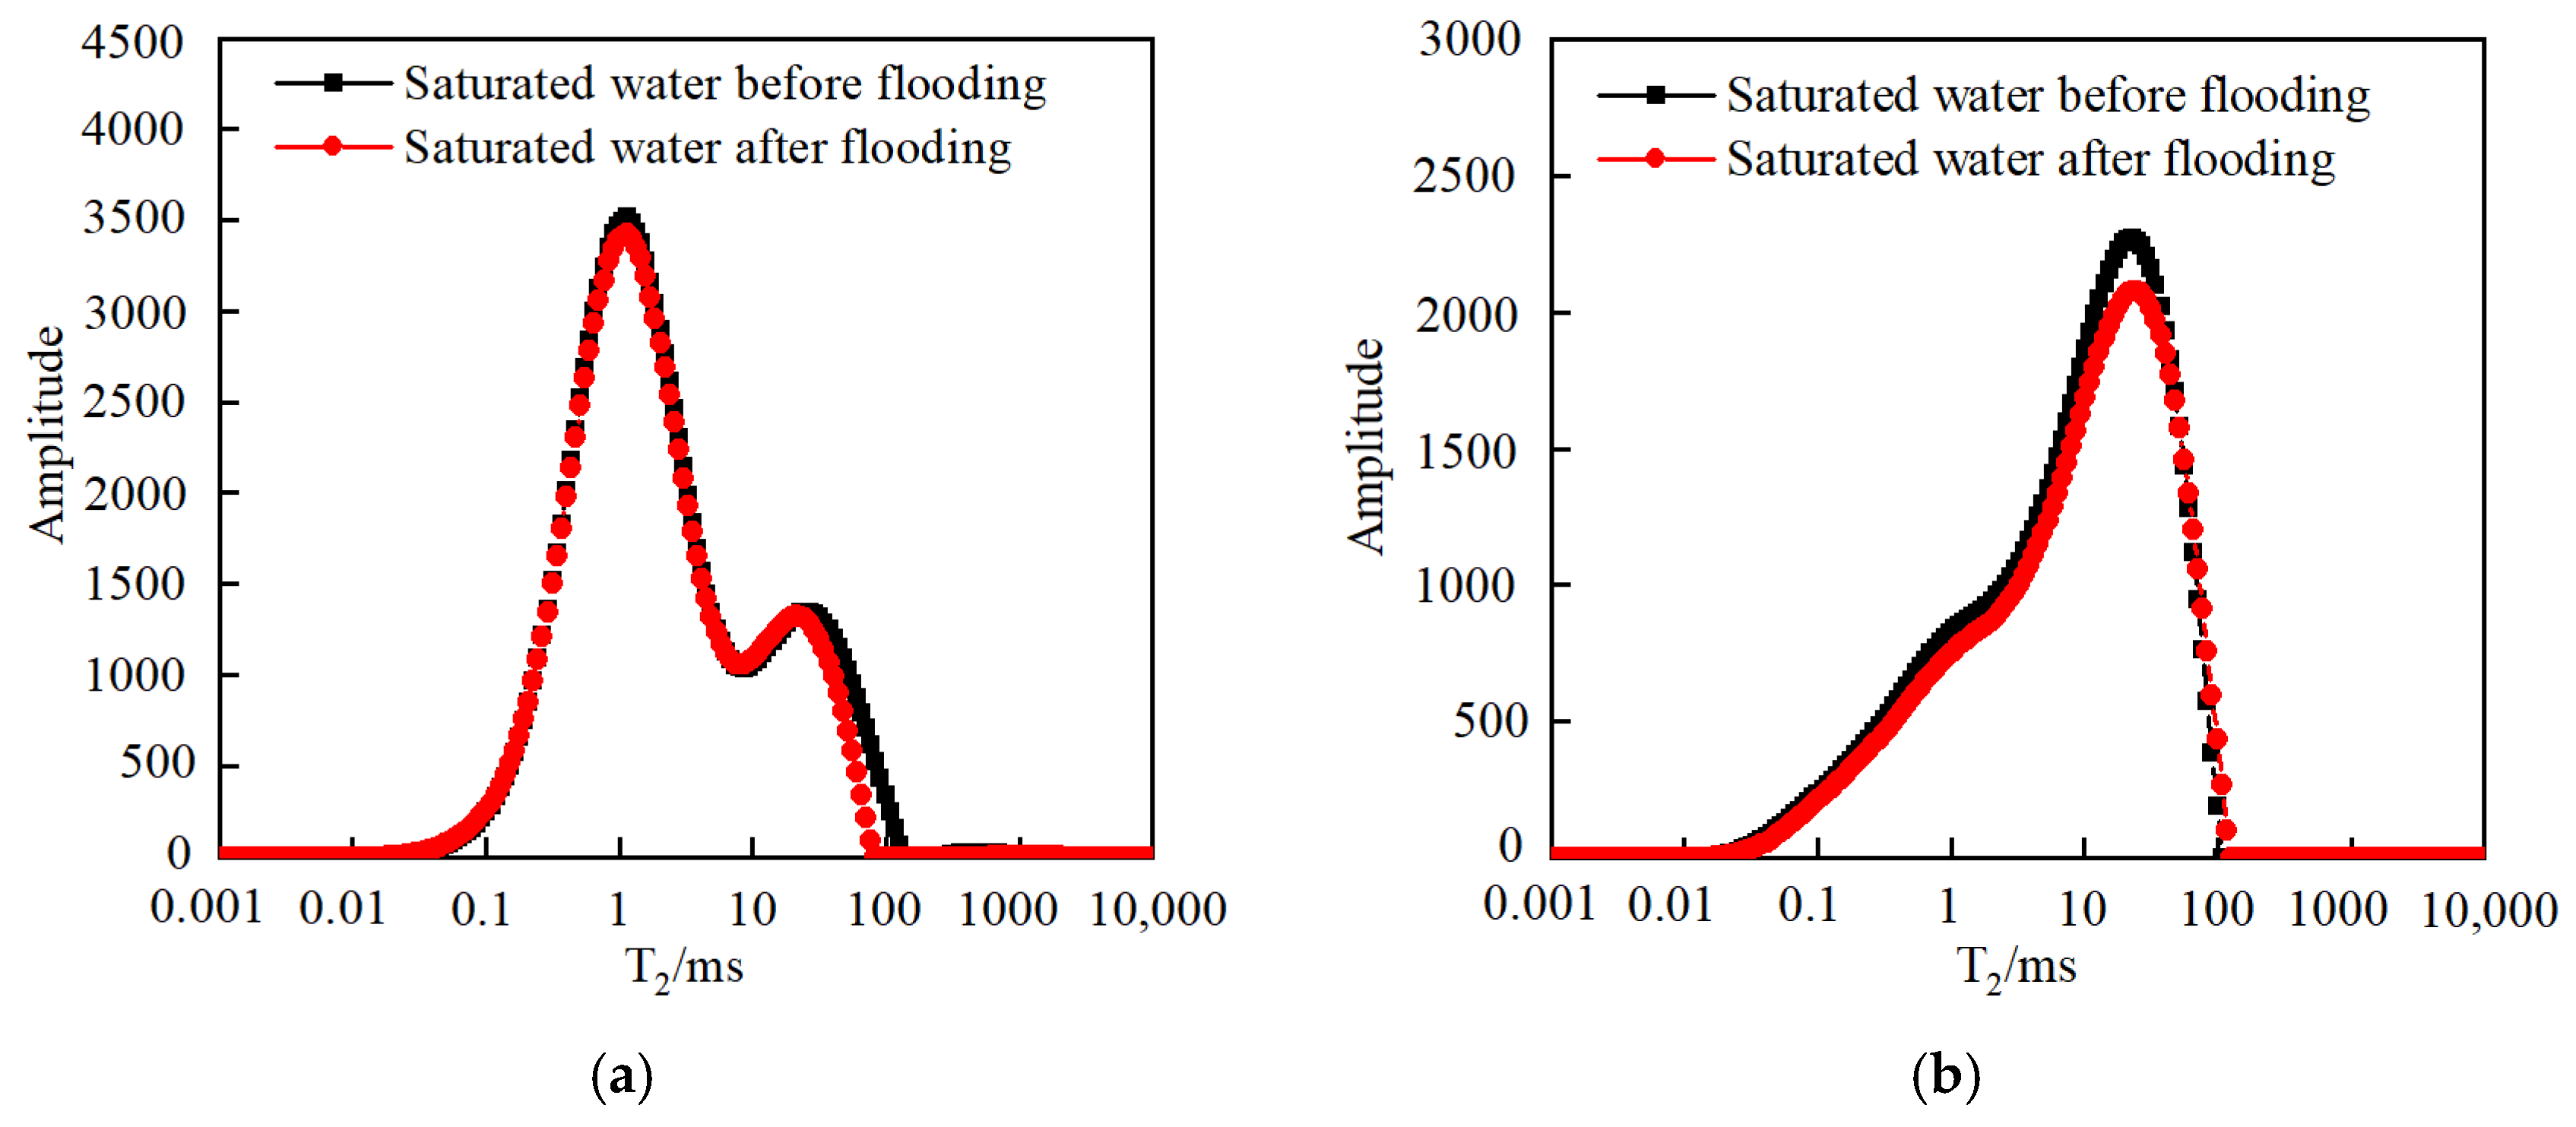
As the injected PV increased, CO2 first entered the macropores, resulting in a decrease in the amount of secondary saturated water within the macropores and an increasing degree of pore throat blockage. As the injected PV continued to increase, the dissolution process led to the formation of small cracks, resulting in an increased amount of secondary saturated water compared to the initial stage, and the volume of small pores increased. Pressure plays a significant role in the CO2–water–rock reaction. When the pressure reaches the supercritical state, the dissolution process intensifies at the pore throat. The resulting debris from dissolution can then block the flow path, leading to a significant reduction in signal within larger pores and causing severe blockage. Temperature also has an effect on the water–rock reaction. As the temperature increases to the critical temperature, the macropores are the first to become blocked, and the degree of blockage in the macropores gradually increases. The small pores are also blocked, leading to a decrease in the porosity of the core.
In this study, the influence of CO2–water–rock reaction on the porosity and permeability of shale cores under different temperature and pressure conditions was quantitatively characterized. The results show that the blockage caused by CO2–water–rock reflection mainly occurs in macropores, and the degree of blockage is higher than that of small pores. Under high-temperature and -pressure conditions, due to the intensification of dissolution, some new small pores can also be generated. These results provide a basic understanding of the development plan and clarify the degree of formation damage caused by CO2 injection in shale reservoirs at different stages of development, which is helpful to determine the CO2 injection pressure and temperature. In addition, the results can also be used to predict the content and stability of CO2 stored in such reservoirs. Shale reservoirs have complex lithologies, and not all samples of lithology are tested due to the long experimental period. Other types of shale core testing require further conduct. The results do not take into account the CO2–crude oil interaction and its effect on porosity and permeability. The above contents will be systematically studied in future studies.

Author Contributions

Methodology, D.D.; resources, D.D.; investigation, S.C., Q.S., G.Z., D.D. and Q.W.; writing—original draft preparation, S.C. and Q.S.; writing—review and editing, G.Z., Y.L., and Q.W.; supervision, Q.S.; project administration, Y.L.; funding acquisition, Q.S. and G.Z. All authors have read and agreed to the published version of the manuscript.

Funding

The authors declare that this study received funding from the Natural Science Foundation of Shandong Province of China (No. ZR2020ME091), and the Major Project of the China National Petroleum Corporation (2021ZZ10-02). The funders were not involved in the study design, collection, analysis, interpretation of data, the writing of this article or the decision to submit it for publication.

Data Availability Statement

The original contributions presented in the study are included in the article, further inquiries can be directed to the corresponding author.

Conflicts of Interest

Authors Sheng Cao, Guozhong Zhao, Yubo Lan, Dapeng Dong and Qingzhen Wang were employed by the company Exploration and Development Research Institute of Daqing Oilfield Co., Ltd. The remaining authors declare that the research was conducted in the absence of any commercial or financial relationships that could be construed as a potential conflict of interest.

Nomenclature

Abbreviations
SEM scanning electron microscopy
ICP-MSinductively coupled plasma–mass spectrometry
T2transverse relaxation time
NMRnuclear magnetic resonance
XRDX-ray diffraction
PDIpolydispersity index
Symbols
PVthe pore volume, dimensionless
Bthe pore plugging rate, fraction
S1the peak area value of saturated water before flooding
S2the peak area value of saturated water after flooding

References

  1. Jarboe, P.; Candela, P.; Zhu, W.; Kaufman, A. Extraction of hydrocarbons from high-maturity Marcellus shale using supercritical carbon dioxide. Energy Fuels 2015, 29, 7897–7909. [Google Scholar] [CrossRef]
  2. Jin, L.; Hawthorne, S.; Sorensen, J.; Pekot, L.; Kurz, B.; Smith, S.; Heebink, L.; Herdegen, V.; Bosshart, N.; Dalkhaa, C.; et al. Advancing CO2 enhanced oil recovery and storage in unconventional oil play—Experimental studies on Bakken shales. Appl. Energy 2017, 208, 171–183. [Google Scholar] [CrossRef]
  3. Gamadi, T.; Sheng, J.; Soliman, M.; Menouar, H.; Watson, M.; Emadibaladehi, H. An Experimental Study of Cyclic CO2 Injection to Improve Shale Oil Recovery, SPE Improved Oil Recovery Symposium; Society of Petroleum Engineers: Tulsa, OK, USA, 2014; pp. 1–9. [Google Scholar]
  4. Jiang, Y.; Luo, Y.; Lu, Y.; Qin, C.; Liu, H. Effects of supercritical CO2 treatment time, pressure, and temperature on microstructure of shale. Energy 2016, 97, 173–181. [Google Scholar] [CrossRef]
  5. Yin, H.; Zhou, J.; Jiang, Y.; Xian, X.; Liu, Q. Physical and structural changes in shale associated with supercritical CO2 exposure. Fuel 2016, 184, 289–303. [Google Scholar] [CrossRef]
  6. Psarras, P.; Holmes, R.; Vishal, V.; Wilcox, J. Methane and CO2 adsorption capacities of kerogen in the Eagle Ford shale from molecular simulation. Acc. Chem. Res. 2017, 50, 1818–1828. [Google Scholar] [CrossRef] [PubMed]
  7. Zhu, Z.; Li, M.; Lin, M.; Peng, B.; Sun, L. Review of the CO2-Water-Rock Interaction in Reservoir. Bulletin of Mineralogy. Petrol. Geochem. 2011, 30, 104–112. [Google Scholar]
  8. Dove, P.M.; Crerar, D.A. Kinetics of quartz dissolution in electrolyte solutions using a hydrothermal mixed flow reactor. Geochim. Cosmochim. Acta 1990, 54, 955–969. [Google Scholar] [CrossRef]
  9. Ross, G.D.; Todd, A.C.; Tweedie, J.A. The Effect of Simulated CO2 Flooding on the Permeability of Reservoir Rocks; Elsevier: Amsterdam, The Netherlands, 1981; Volume 37, pp. 169–174. [Google Scholar]
  10. Bowker, K.A.; Shuler, P.J. Carbon dioxide injection and resultant alteration of the Weber Sandstone, Rangely Field, Colorado. AAPG Bull. 1991, 39, 129–136. [Google Scholar]
  11. Sayegh, S.G.; Krause, F.F.; Girard, M.; DeBree, C. Rock/fluid interactions of carbonated brines in a sandstone reservoir: Pembina Cardium, Alberta, Canada. SPE Form. Eval. 1990, 5, 399–405. [Google Scholar] [CrossRef]
  12. Qu, X. The Experiment Research of CO2-Sandstone Interaction and Application CO2 Gas Reservoir; Jilin University: Changchun, China, 2007. [Google Scholar]
  13. Shi, M. Experiment research of compatibility between CO2 and formation water, reservoir respectively. J. Chongqing Univ. Sci. Technol. 2011, 13, 55–57. [Google Scholar]
  14. Yu, Z.; Yang, S.; Liu, L.; Li, S.; Yang, Y. An experimental study on water-rock interaction during water flooding in formations saturated with CO2. Acta Pet. Sin. 2012, 33, 1032–1042. [Google Scholar]
  15. Wang, G.; Zhao, J.; Zhang, F.; Tao, Y.; Yang, X.; Wang, H. Interactions of CO2-brine-rock in sandstone reservoir. J. Cent. South Univ. 2013, 44, 1167–1173. [Google Scholar]
  16. Cui, G.; Zhang, L.; Tan, C.; Ren, S.; Zhuang, Y.; Enechukwu, C. Injection of supercritical CO2 for geothermal exploitation from sandstone and carbonate reservoirs: CO2–water–rock interactions and their effects. J. CO2 Util. 2017, 20, 113–128. [Google Scholar] [CrossRef]
  17. Siqueira, A.T.; Iglesias, S.R.; Ketzer, M.J. Carbon dioxide injection in carbonate reservoirs—A review of CO2-water-rock interaction studies. Greenh. Gases 2017, 7, 802–816. [Google Scholar] [CrossRef]
  18. Xiao, N.; Li, S.; Lin, M. Experimental Investigation of CO2-Water-Rock Interactions during CO2 Flooding in Carbonate Reservoir. Open J. Yangtze Oil Gas 2017, 2, 108–124. [Google Scholar] [CrossRef]
  19. Liu, N.; Cheng, J. Geochemical effects of cement mineral variations on water–rock–CO2 interactions in a sandstone reservoir as an experiment and modeling study. Greenh. Gases 2019, 9, 789–810. [Google Scholar] [CrossRef]
  20. Ma, B.; Cao, Y.; Zhang, Y.; Eriksson, A.K. Role of CO2-water-rock interactions and implications for CO2 sequestration in Eocene deeply buried sandstones in the Bonan Sag, eastern Bohai Bay Basin, China. Chem. Geol. 2020, 541, 119585. [Google Scholar] [CrossRef]
  21. Ahmat, K.; Cheng, J.; Yu, Y.; Zhao, R.; Li, J. CO2-Water-Rock Interactions in Carbonate Formations at the Tazhong Uplift, Tarim Basin, China. Minerals 2022, 12, 635. [Google Scholar] [CrossRef]
Figure 1. CO2–water reaction: installation diagram of high-temperature and -pressure cylinder.
Energies 17 00477 g001
Figure 2. Image of CO2 displacement experimental device based on NMR technology.
Energies 17 00477 g002
Figure 3. The pH of the system after the reaction of 25% CO2 at 20 MPa.
Energies 17 00477 g003
Figure 4. The pH of the system after 5% CO2 reaction at 60 °C under different pressures.
Energies 17 00477 g004
Figure 5. SEM diagram of core dissolution under different pressures: (a) 0 MPa; (b) 5 MPa; (c) 10 MPa; (d) 15 MPa; (e) 20 MPa. Red box denotes the change on the sample.
Energies 17 00477 g005
Figure 6. SEM diagram of core dissolution under different temperatures: (a) 20 °C; (b) 30 °C; (c) 40 °C; (d) 50 °C; (e) 60 °C. Red box denotes the change on the sample.
Energies 17 00477 g006
Figure 7. Saturated water T2 spectra before and after 25 PV flooding.
Energies 17 00477 g007
Figure 8. Saturated water T2 spectra before and after 50 PV flooding.
Energies 17 00477 g008
Figure 9. Saturated water T2 spectra before and after 75 PV flooding.
Energies 17 00477 g009
Figure 10. Saturated water T2 spectra before and after 100 PV flooding.
Energies 17 00477 g010
Figure 11. Schematic diagram of core pore-plugging calculation.
Energies 17 00477 g011
Figure 12. Saturated water T2 spectra before and after CO2 flooding at different pressures: (a) 5 MPa; (b) 10 MPa; (c) 15 MPa; (d) 20 MPa.
Energies 17 00477 g012
Figure 13. Saturated water T2 spectra before and after CO2 flooding at different temperatures: (a) 30 °C; (b) 40 °C; (c) 50 °C; (d) 60 °C.
Energies 17 00477 g013aEnergies 17 00477 g013b
Figure 14. Saturated water T2 spectra before and after CO2 flooding with different permeability: (a) k = 10−3 mD; (b) k = 10−2 mD; (c) k = 10−1 mD.
Energies 17 00477 g014
Table 1. Main mineral types and contents of shale cores.
NumberPlagioclaseCalciteQuartzClayFeldsparDolomite
#124.02.144.710.711.96.6
#215.06.048.09.712.39.0
#35.013.033.034.09.06.0
#424.06.024.018.016.012.0
#526.72.344.09.010.08.0
#619.06.848.112.09.15.0
#723.23.032.015.06.820.0
#818.69.242.714.08.77.0
#910.47.444.218.04.016.0
#1021.57.741.816.04.09.0
#1121.98.737.415.09.08.0
#1228.06.145.68.26.16.0
#1316.913.046.15.012.07.0
#1423.35.438.410.013.99.0
#1522.55.943.49.011.28.0
Table 2. Porosity and permeability parameters of cores.
NumberLength/cmDiameter/cmPorosity/%Permeability/mD
#14.782.4813.555.40 × 10−2
#24.742.487.731.60 × 10−2
#34.772.4810.252.30 × 10−2
#44.792.469.813.30 × 10−2
#54.862.4915.341.17 × 10−1
#64.762.4812.341.12 × 10−1
#74.752.4712.665.40 × 10−2
#85.752.478.143.30 × 10−2
#95.292.485.533.00 × 10−3
#105.142.4811.341.17 × 10−1
#113.812.4811.671.12 × 10−1
#124.772.4712.898.82 × 10−1
#133.562.485.533.00 × 10−3
#145.042.4711.341.70 × 10−2
#154.322.4712.898.82 × 10−1
Table 3. Ion contents of formation water.
Ion SpeciesIon Content/(mg/L)
Ca2+5683.46
Mg2+421.803
Ba2+169.06
Na+15,030.60
Sr2+443.25
K+292.26
CO32−-
HCO3252
Table 4. Ion content of produced liquid.
Experiment NumberPressure/MPaTemperature/°Cρ(K+)/(mg·L−1)ρ(Na+)/(mg·L−1)ρ(Ca2+)/(mg·L−1)
15602.3417.6480.32
210604.6721.56115.68
315606.2327.83174.36
420607.6837.97220.71
520303.3116.51100.03
620404.3724.88167.28
720505.9630.45190.33
820607.6837.97220.71
Table 5. Particle size and PDI before and after reaction.
Particle Size/nmPDI
13770.296
Pre-reaction10810.284
11300.296
25000.362
Post-reaction28540.423
29710.534
Table 6. CO2 flooding conditions.
Experiment NumberDisplacement
Pressure/MPa
PV NumberDisplacement Pressure
Difference/MPa
Experimental Temperature/°C
11025160
21050160
31075160
410100160
Table 7. Table of changes of porosity and permeability before and after CO2 flooding.
Core NumberPermeability (before)
/mD
Permeability (after)
/mD
Rate of Change
/%
Porosity
(before)
/%
Porosity
(after)
/%
Rate of Change
/%
Pore Throat Blockage Rate/%
#13.30 × 10−24.90 × 10−29.2613.5512.666.567.21
#23.30 × 10−21.40 × 10−212.507.737.127.898.42
#32.30 × 10−22.00 × 10−213.0410.258.8413.7511.66
#43.30 × 10−22.70 × 10−218.189.818.1417.0617.94
Table 8. Core displacement conditions.
Experiment
Number
Displacement
Pressure/MPa
PV NumberDisplacement Pressure
Difference/MPa
Experimental
Temperature/°C
1550160
21050160
31550160
42050160
Table 9. Changes in porosity and permeability before and after CO2 flooding under different pressures.
Core NumberDisplacement Pressure
/MPa
Permeability (before)
/mD
Permeability
(after)
/mD
Rate of Change
/%
Porosity
(before)
/%
Porosity
(after)
/%
Rate of Change
/%
Pore Throat Blockage Rate/%
#551.17 × 10−11.05 × 10−110.2615.3413.5111.938.21
#6101.12 × 10−10.95 × 10−115.2012.3410.1617.678.74
#7155.40 × 10−24.60 × 10−214.8112.6610.4617.3713.41
#8203.30 × 10−22.90 × 10−212.128.146.7816.7113.27
Table 10. Core information and displacement conditions.
Experiment NumberDisplacement Pressure/MpaPV NumberDisplacement Pressure
Difference/Mpa
Experimental Temperature/°C
11050130
21050140
31050150
41050160
Table 11. Changes in porosity and permeability before and after CO2 flooding under different temperatures.
Core NumberExperimental Temperature
/°C
Permeability (before)
/mD
Permeability
(after)
/mD
Rate of Change/%Porosity
(before)
/%
Porosity
(after)
/%
Rate of Change
/%
Pore Throat Blockage Rate/%
#9303.00 × 10−32.90 × 10−35.225.535.284.582.78
#10401.17 × 10−11.05 × 10−110.2111.3410.289.347.84
#11501.12 × 10−11.00 × 10−110.4811.679.9412.8610.22
#12608.82 × 10−17.42 × 10−115.8812.8912.1215.2014.78
Table 12. Changes in porosity and permeability of different core samples before and after CO2 flooding.
Core NumberPermeability (before)
/mD
Permeability (after)
/mD
Rate of Change
/%
Porosity
(before)
/%
Porosity
(after)
/%
Rate of Change
/%
Pore Throat Blockage Rate /%
#133.00 × 10−32.60 × 10−310.785.534.798.849.02
#141.70 × 10−21.60 × 10−25.6611.3410.775.026.84
#158.82 × 10−18.64 × 10−12.112.8912.562.742.07
Disclaimer/Publisher’s Note: The statements, opinions and data contained in all publications are solely those of the individual author(s) and contributor(s) and not of MDPI and/or the editor(s). MDPI and/or the editor(s) disclaim responsibility for any injury to people or property resulting from any ideas, methods, instructions or products referred to in the content.

