Article

Research on the Decision-Making Method for the Passive Design Parameters of Zero Energy Houses in Severe Cold Regions Based on Decision Trees

School of Architecture and Design, China University of Mining and Technology, Xuzhou 221116, China
*
Author to whom correspondence should be addressed.
Energies 2024, 17(2), 506; https://doi.org/10.3390/en17020506
Submission received: 13 December 2023 / Revised: 10 January 2024 / Accepted: 16 January 2024 / Published: 20 January 2024
(This article belongs to the Section G: Energy and Buildings)

Abstract

:
As the field of zero energy building design and research continues to progress, the use of data analysis methods is on the rise. These methods are applied to create assessment criteria, compare performance, and aid in design decision making. Decision trees, as a data-driven approach, offer interpretability and predictability, assisting designers in summarizing their design experience and serving as a foundation for design references. However, the current application of decision tree methods in the zero energy house sector primarily focuses on HVAC systems, lacking a comprehensive exploration from an architectural design perspective. Therefore, this study presents an empirical method for building and applying models based on decision trees, using zero energy house cases in severely cold regions of China as samples. Through an analysis of the interactions among various passive design parameters and the use of EnergyPlus for performance simulations, a decision tree model is established. This model aids in determining the recommended combinations of passive design parameters that meet the criteria of low energy consumption. Moreover, feature weighting highlights the most influential passive design parameters on building energy consumption, including the length of the architectural gestalt plane, the roof shape, and the ground thermal resistance. This research provides valuable methods and guidance for the design and construction of zero energy houses in severely cold regions of China.

1. Introduction

In recent years, global ecological and environmental issues have gained growing prominence on the international stage, prompting discussions about implementing energy conservation, emission reduction measures, and goals for ecological preservation. The severity of climate conditions has emerged as one of the major challenges facing the world today, largely driven by the worsening environmental issues caused by the greenhouse effect, which poses a significant threat to human living conditions and safety. The building sector is responsible for more than 33% of global energy consumption [1] and, in China, energy consumption in the construction industry accounts for approximately 36% of the total consumption [2]. As a result, the construction industry must prioritize energy-efficient and emission-reducing designs. Zero energy buildings are defined as structures that achieve high-performance standards while significantly reducing energy consumption [3]. Compared to traditional buildings, they offer substantial advantages in terms of energy efficiency and the use of renewable energy sources, leading to energy savings ranging from 60% to 75% [4,5]. Zero energy building projects are not only suitable for research on energy conservation and emission reduction in various climate zones but also for a range of building types, including residential, public, and community structures. Moreover, zero energy buildings not only improve building performance but also place a strong emphasis on continuous research and the optimization of comfort for living. Thanks to the benefits of energy conservation and emission reduction, coupled with advancements in construction and renovation techniques and the support of zero energy building research from policies in various countries, these buildings are rapidly gaining global acceptance, resulting in a significant increase in the number of projects. The advantages of zero energy buildings, in the realms of energy conservation and emission reduction, present both opportunities and challenges for building design.
The design strategy for zero energy buildings has evolved into a hybrid approach that combines passive and active techniques [6,7]. Specifically, in the realm of passive design, numerous researchers have conducted comprehensive studies, addressing applications under various climate conditions [8], quantifying the energy implications of passive design [9,10], and exploring economic [11] aspects.
Researchers have extensively explored various passive design methods aimed at reducing the energy consumption of buildings. To begin, the feedback design method based on regulatory standards represents the most conventional approach in traditional design thinking. This method entails designing within established energy efficiency frameworks, with the goal of meeting the design’s adaptable requirements while ensuring compliance with the energy-saving standards specified in regulations [12]. However, regulation-based design primarily addresses basic requirements and, as a result, has limitations in fostering innovation in building design and enhancing energy efficiency. It often falls short in fully considering the unique characteristics of the building and specific climate conditions. Secondly, the feedback design method based on performance simulation leverages software simulations to gather feedback information related to building performance, including energy consumption and comfort [13,14]. Designers can make adjustments to design plans and related data based on simulation results, thereby achieving improved performance. Thirdly, the optimization design method based on intelligent algorithms [15], while holding significant potential for application, places high demands on model establishment and requires the use of various tools. This is particularly notable when dealing with more detailed and multi-objective designs, as it leads to extended computation and feedback times.
In contrast to the methods mentioned earlier, supervised learning aims to build a concise model that generates class label distributions based on predictor features [16,17]. This approach depends on data for modeling and training, enabling the swift creation of multiple design concepts in the initial stages of architectural design, with subsequent ranking based on performance metrics. Supervised learning methods are grounded in real observed data rather than theoretical specifications, allowing for early predictions of building performance and enhancing the efficiency of design decisions [18]. Furthermore, these methods exhibit significant flexibility, adapting to evolving design requirements and performance criteria. They can accommodate new objectives and constraints to meet the constantly changing demands of design.
Decision trees represent a supervised learning method and, as a data-driven modeling technique, have found extensive use in fields such as artificial intelligence, gaming, and finance for classification and prediction [19,20,21]. In the realm of architecture, decision trees prove effective in addressing complex issues related to architectural design and management, with a particular strength in predicting building energy usage to enhance intelligent building performance. Khosravi and colleagues employed decision trees and other regression models to forecast the primary fuel consumption, electricity usage, and cost savings of buildings by scrutinizing the factors influencing building costs and energy consumption. Furthermore, they optimized the decision tree algorithm through metaheuristic methods, thereby improving its predictive accuracy and identifying the most practical features for specific building objectives [22]. Decision trees automatically generate a tree-like structure based on the features and conditions of input data. Each node in this structure represents a decision point, while each branch signifies different decision options. This structure offers a high level of interpretability, enabling architects, engineers, and decision-makers to gain a clear understanding of the decision-making process and the underlying rationales for each decision [23].
In comparison to performance simulation methods, decision trees demonstrate superior computational efficiency. Traditional performance simulations typically involve running numerical models to simulate a building’s energy usage and indoor environment, consuming significant computational resources and time. Conversely, decision tree models are constructed and trained based on existing data, enabling the rapid generation of building performance predictions and resulting in substantial savings of computational resources and time. Mariano-Hernandez and other researchers analyzed a range of methods designed to help decision tree models better accommodate variations in building behavior, serving as tools for enhancing building energy efficiency. Research findings indicate that the continuous retraining of decision tree models and the integration of change detection methods contribute to improving the model’s capacity to adapt to variations in overall building electricity consumption [24]. In their efforts to enhance the sustainability of renovations, Vytautas Martinaitis and his team chose energy efficiency assessment criteria that align with a sustainable approach. They defined and analyzed five key standards, encompassing energy efficiency, environmental impact, economic feasibility, comfort, and sustainability over the lifecycle. To allocate energy efficiency measures into basic and additional energy-efficient measures, they developed a sequential priority and allocation decision tree. The outcomes showed that all data packages generated through this distribution decision tree had higher overall sustainability standard values and smaller value spreads (with only a 12% difference), thereby enhancing decision efficiency [25]. Hosseini and his team utilized a univariate regression algorithm to forecast the factors that impact building energy consumption and determine the most influential factors. This algorithm pinpointed the factors with the greatest impact on building energy consumption and quantified their effects. The research results indicated that a building’s overall height, roof area, surface area, and relative compactness have the most pronounced impact on its energy consumption. The prediction errors for cooling load and heating load were 1.128% and 0.404%, respectively [26]. Smarra and his team introduced a novel predictive control method based on machine learning algorithms, including decision trees and random forests. They named this approach Data-Based Predictive Control (DPC) and applied it in three distinct case studies. The results from these case studies revealed that the DPC method had an average error of just 3% and could improve energy efficiency by as much as 49.2%, clearly demonstrating the effectiveness and efficiency of the DPC method [27].
The decision tree model exhibits a broad range of applicability, making it suitable for diverse building projects, ranging from residential to commercial, and from small individual structures to large building complexes. In order to uncover hidden factors, a novel approach that combines linear and nonlinear models, specifically Multiple Linear Regression (MLR) and Decision Trees (DT), has been introduced. You-Jeong Kim and a team of researchers utilized energy consumption and feature data from 71 apartment units in Seoul, South Korea. They applied MLR and DT models to identify building, system, and occupant characteristics that significantly influence energy consumption for various end uses. The research findings indicate that both models share common determinants, while specific factors, such as the year of the building permit and the performance coefficient of air conditioners, are unique to the decision tree model. These results suggest that, when conducting a comprehensive analysis of relationships and interactions between variables, it is advisable to employ a nonlinear model, such as DT, rather than relying solely on linear models [28]. Another study proposed by Rasiulis and others aimed to select the optimal combination of modernization measures for public buildings, using a decision tree model as an effective tool to facilitate big data analysis. The research findings indicate that the proposed algorithm is highly suitable for evaluating modernization decisions for buildings, assisting decision-makers in choosing alternative solutions with the best performance in terms of energy consumption, installation costs, and other relevant criteria [29]. Furthermore, there is also related research concerning building energy consumption and carbon emissions. In one study, they introduced a novel benchmarking approach to evaluate emissions and cost performance across an entire portfolio, enabling building managers to identify underperforming locations. This research, which considered multi-level and detailed variable selection, including weather characteristics and various regression techniques like MLR, Artificial Neural Networks (ANN), and DT, successfully categorized building cases with varying carbon emission scenarios, demonstrating both high precision and discrimination [30]. Another study proposed a decision support model for selecting one-way slab design parameters. This study aimed to find environmentally friendly and cost-effective solutions while considering the regulatory standards, materials, and manufacturing processes commonly used in Spain. To achieve this, they established decision criteria based on the implicit carbon dioxide emissions and the overall cost of one-way slabs. Three decision trees were developed in the study to formulate practical guidelines for making design decisions for one-way slabs. The final Spanish case study demonstrated the feasibility of reducing implicit carbon dioxide emissions by nearly 2% with an increase in cost of less than 2% [31].
Furthermore, in comparison to other machine learning methods more widely used in the field of zero-energy building research, decision tree methods offer certain advantages. In contrast to artificial neural network methods [32,33], decision tree methods possess high interpretability, and the visual model is simple, intuitive, and easy to understand. Compared to the K-nearest neighbors algorithm [34], the training and prediction processes of decision trees are typically efficient, especially for small to medium-sized datasets. When compared to support vector machine methods [35], decision trees can handle nonlinear relationships, whereas support vector machines often require the use of kernel functions for mapping when dealing with nonlinear problems, adding complexity to the model.
Decision trees offer unique advantages in solving multi-objective optimization problems. They have the capacity to simultaneously consider multiple decision variables and objective functions, thereby assisting decision makers in striking a balance among various objectives. Decision trees can provide comprehensive recommendations for optimizing multi-objective building designs. However, the application of decision trees in the field of architecture is primarily focused on areas such as building energy management [36], operations and maintenance [37], building code assessments [38], sociological analyses of buildings [39], and government recommendations [40]. Researchers in these areas typically play a primary role in building management and operations rather than in building design. Moreover, in specific studies related to buildings, most researchers tend to concentrate on exploring the influence of HVAC systems on building energy performance [41], with only a limited number delving into passive design methods for buildings.
Therefore, considering the knowledge gap in the field of passive design for zero energy houses, and the deficiencies in data quantification and preliminary results prediction, this study introduces a novel framework termed “Case Induction—Sample Expansion—Performance Simulation—Decision Tree Model”. Within this framework, the initial step involves the preliminary induction of collected building cases through data analysis techniques to clarify relevant parameters and data features associated with passive design. Subsequently, sample expansion, based on data features and energy simulations, is conducted using the Latin Hypercube sampling method. To enhance the interpretability and predictability of passive design parameters, the Classification and Regression Trees (CART) model is employed as the predictive model to identify the relationship between building energy flexibility and design parameters. This, in turn, contributes to a better understanding of how buildings respond to changes in operational conditions when energy consumption is the objective, such as alterations in energy-efficient design strategies. The objective of this framework is to select more reliable ranges of passive design parameters and design combinations, thereby guiding the optimization of parameters for zero energy house design.
Furthermore, it is worth mentioning that this study serves as a method framework study. In the subsequent stages, we will consider extensively applying this framework in designs and expanding the research using the analysis of variance method [42].
The innovation in this study can be summarized as follows: (1) it introduces an effective reference framework for the passive design of zero energy houses, providing guidance for designs in the region; (2) it combines performance simulation and decision tree methods to investigate the interactions between building energy consumption and three-dimensional building parameters, as well as variables related to the thermal transmission coefficient of the building envelope, thus enhancing the interpretability of the framework.

2. Research Framework

2.1. Overview of Research Framework

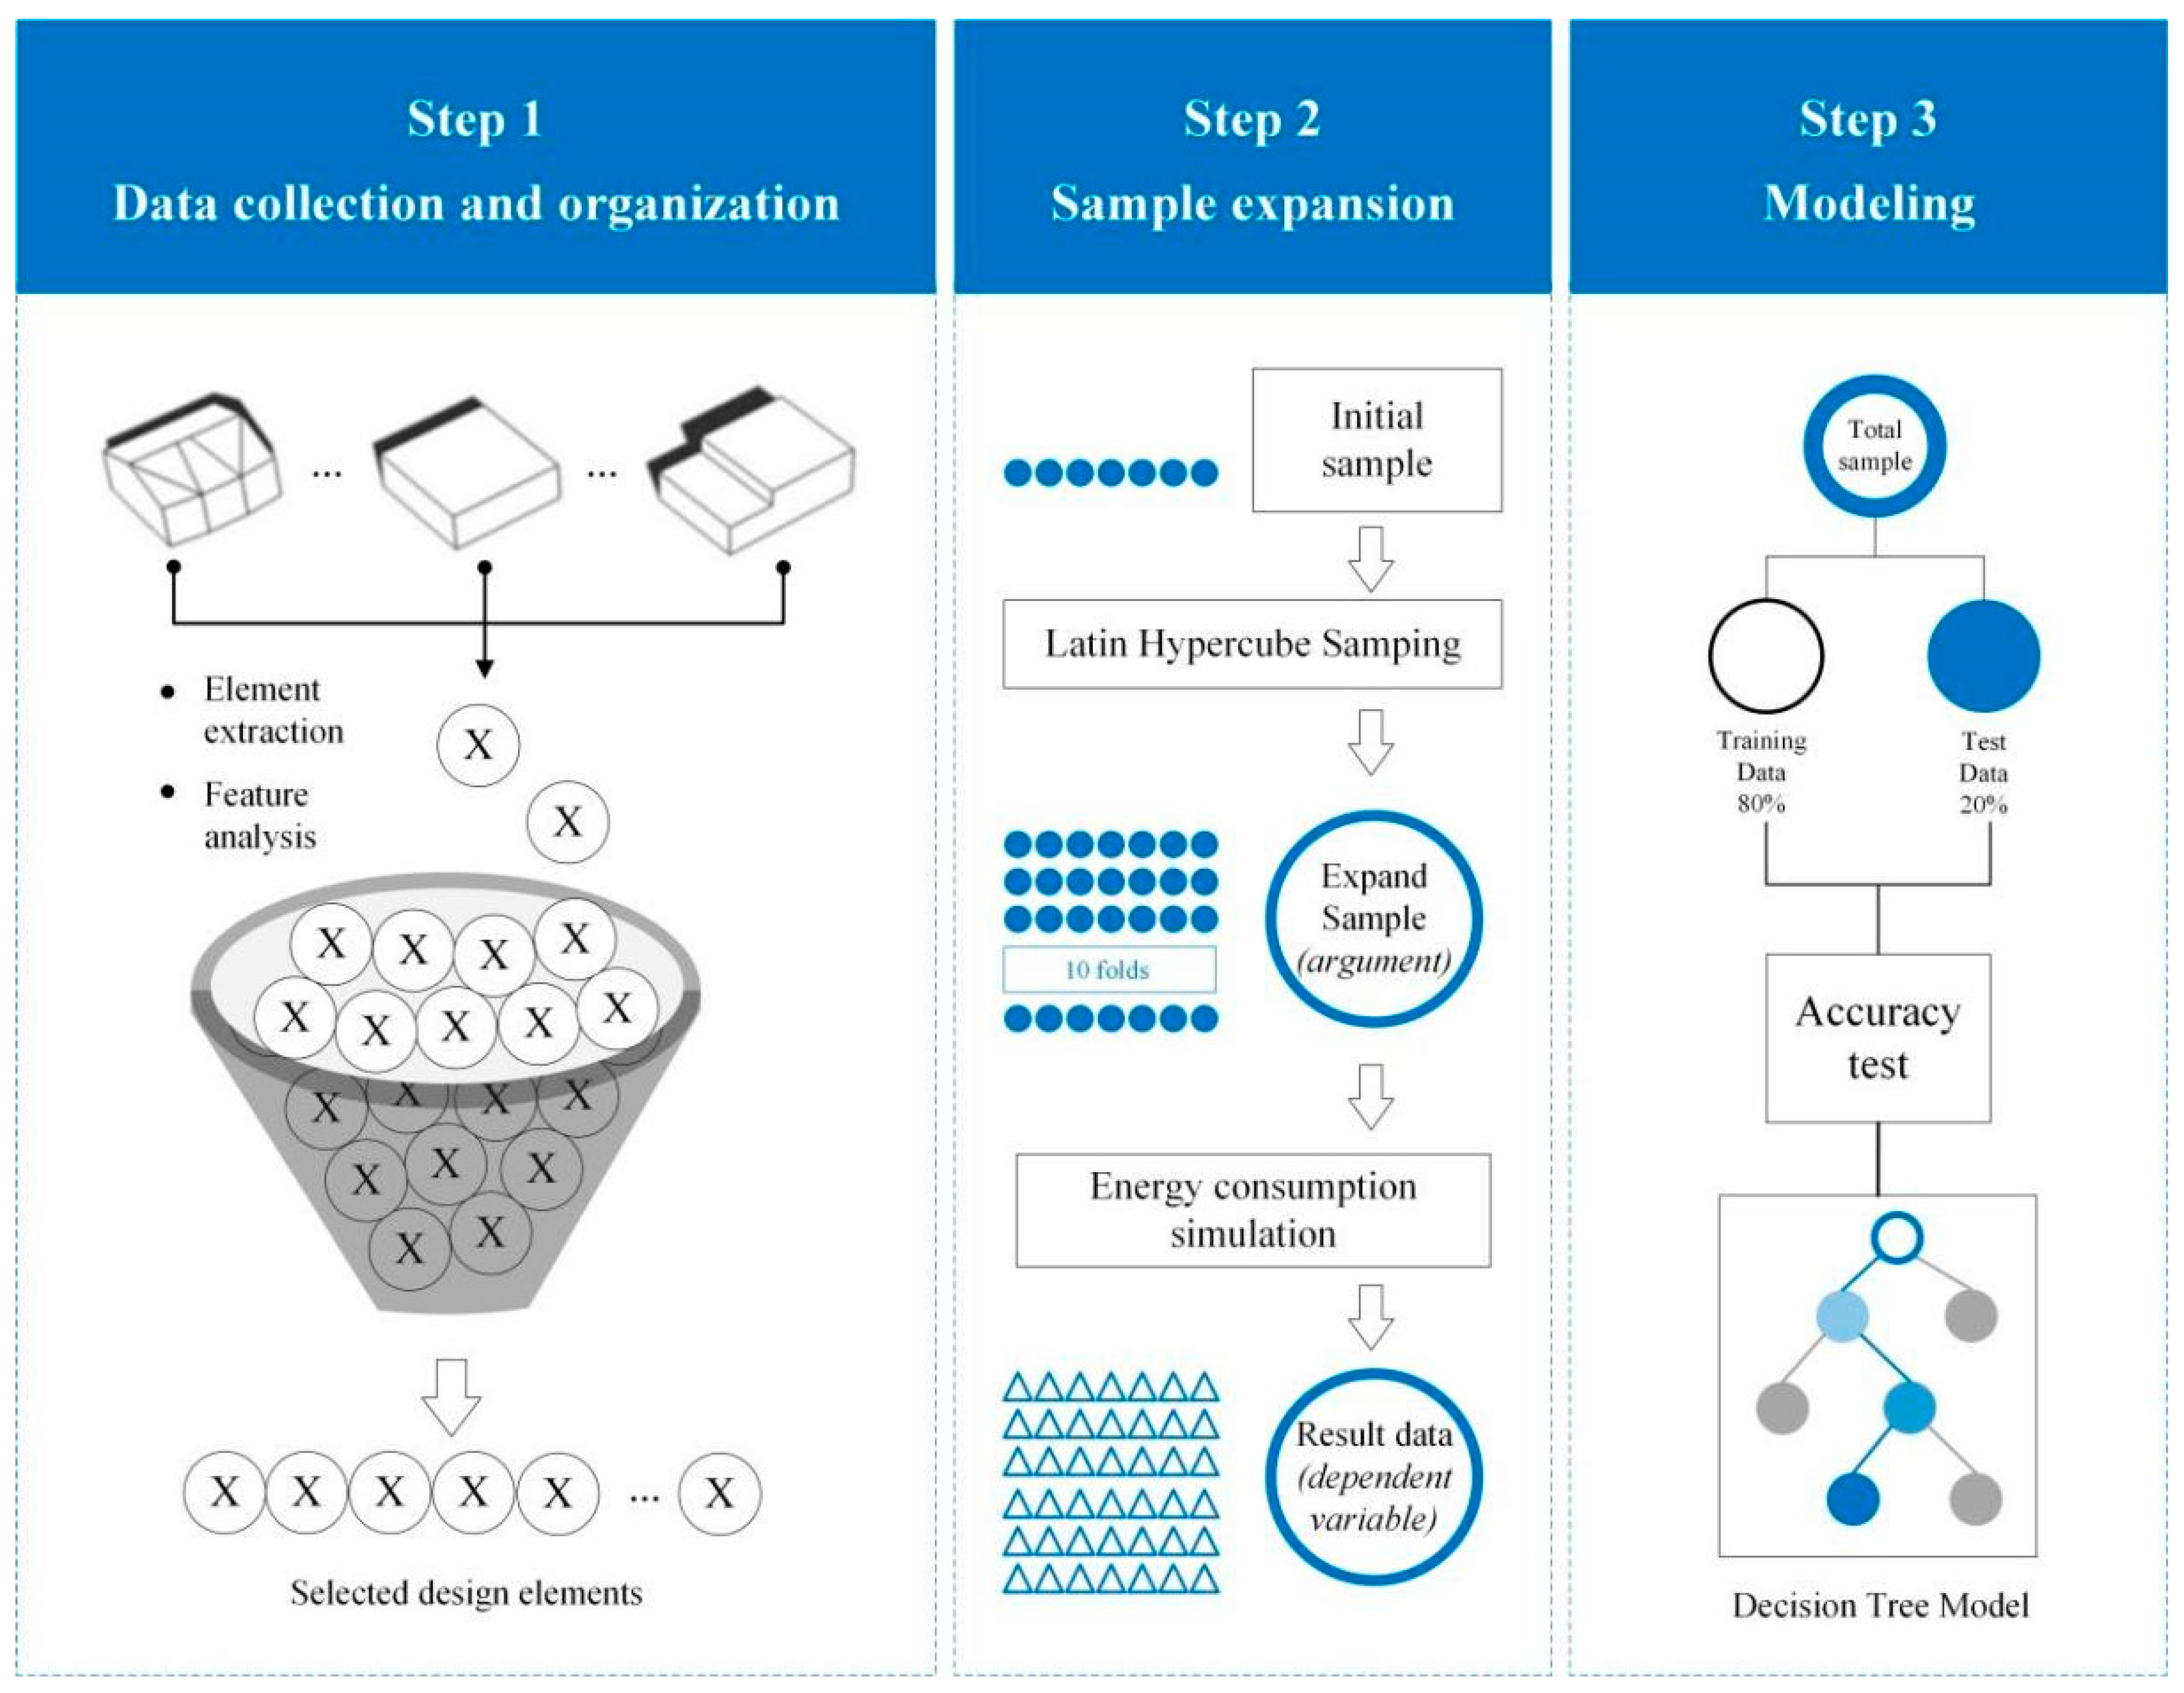
As shown in Figure 1, this study introduces a new framework aimed at exploring the relationship between passive design strategies and the energy performance of zero-energy-oriented rural houses in severe cold regions. This framework comprises three main components: the collection and basic data processing of building information, sample selection and performance simulation with energy performance as the objective, and the modeling and application of decision trees.
The research framework consists of three essential components:
Step 1: Data Compilation and Feature Engineering: In this initial phase, the focus is on consolidating information related to the energy-efficient passive design aspects observed within the study cases. It encompasses the gathering of data concerning building dimensions, an understanding of various architectural design paradigms (including design concepts, functional layouts, and floor plans), and an evaluation of building envelope parameters, all while summarizing the pertinent data characteristics.
Step 2: Sample Expansion and Performance Simulation: During this stage, the inherent data characteristics are leveraged to extend the basic cases to a sample size of 200. This extension is facilitated by employing the Latin Hypercube sampling technique within the simlab software environment. Subsequently, energy performance simulations are conducted on these expanded cases through the use of modeling software Rhino and the energy simulation tool EnergyPlus.
Step 3: Energy Efficiency Prediction Model Based on Decision Trees: In the third step, the dataset is bifurcated into two distinct sets: one designated for training and the other for testing. A predictive energy efficiency model is then developed, relying on a decision tree algorithm referred to as CART. This model delves into the interrelationships that govern building energy consumption concerning passive design variables. Ultimately, the model’s outcomes are presented visually, enabling a comprehensive and in-depth analysis aimed at uncovering valuable insights to guide system design and optimization processes.

2.2. Data-Driven Decision Tree Model

The commonly used decision tree generation algorithms include ID3, CART, and C4.5 [43]. In this study, we employed C4.5 and the open-source data mining software WEKA [44] to construct the decision tree, given its flexibility and wide applicability to various types of data.
CART, a widely-used decision tree algorithm, is suitable for both predictive tasks involving numeric data and classification tasks with categorical data [45]. In both of these tasks, the CART model partitions the target variable into multiple groups using a recursive binary data splitting method based on explanatory variables. The objective of this study was to establish a CART model to quantify the potential impact of various passive design elements on building energy performance. Explanatory variables included data related to passive design parameters of buildings, such as building dimensions, the thermal transmittance of the building envelope, the window-to-wall ratio, and more, while the building energy performance data were used as the target variables for training the CART model. Upon the completion of model training, the results are visualized to provide a clear illustration of the relationships between passive design parameters and building energy performance.
  • Data Classification: Split the dataset into a test set and a training set, with proportions of 20% and 80%, respectively.
  • Model Training: Fit the model to the training set using optimized hyperparameters obtained from the hyperparameter tuning step.
  • Model Evaluation: Evaluate the model using metrics such as accuracy, precision, recall, and F-score, with their calculation formulas as shown below [46,47].
Precision = T P T P + F P
Recall = T P T P + F N
F s c o r e = ( 2 p r e s i s i o n × r e c a l l ) ( p r e c i s i o n + r e c a l l )
Accuracy = T P + T N ( T P + T N + F P + F N )
where TP stands for true positives, TN represents true negatives, FP indicates false positives, and FN denotes false negatives. Comparing the model’s performance across different sets using these criteria helps us assess the likelihood of overfitting or underfitting.
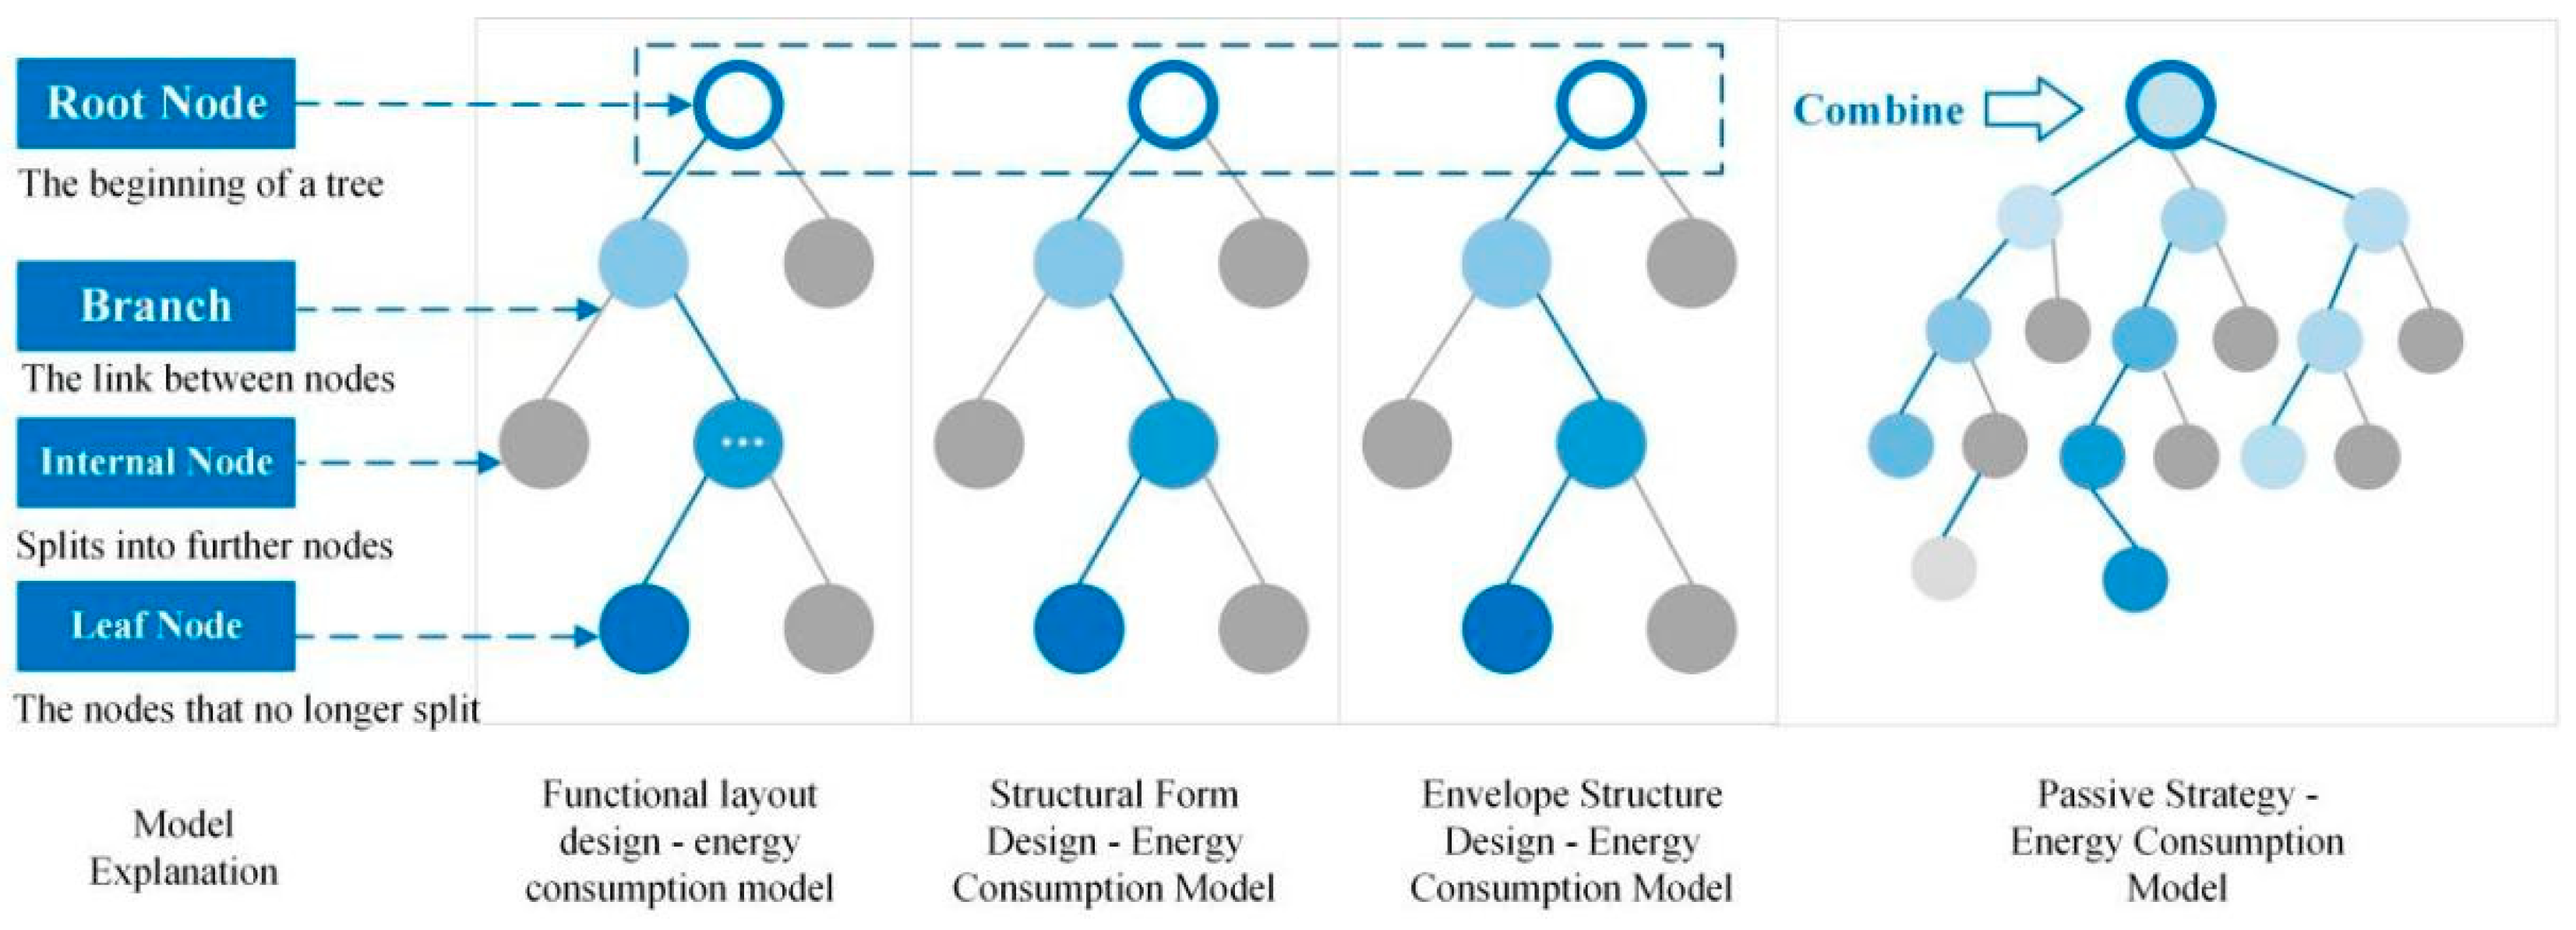
During the training process, all records are initially grouped into a single partition. In each iteration, the algorithm selects a predictor attribute that best separates the target class values within the partition, evaluating the separability of attributes based on specific criteria. Once a predictor attribute is chosen, the algorithm further divides the partition into subpartitions to ensure that each subpartition contains records with the same attribute values. The decision tree algorithm iteratively splits partitions and stops the iteration under any of the following termination conditions (for a detailed decision tree process, see Figure 2, and for an explanation of the decision tree model, refer to Figure 3):
  • All records within a partition share the same target class value, leading to the assignment of a label to the leaf node corresponding to that target class value.
  • No additional predictor variable attributes are available to further partition the partition. In this case, the leaf node is labeled with the most common target class value within that partition.
  • There are no more records for a specific value of an attribute. In this scenario, a terminal node is created, and the class label for that node is set to the most common class value in the parent partition.
In this study, to assess the influence of various passive design strategies on energy consumption, passive energy-saving design strategies are categorized into three secondary types: functional layout design, structural form design, and building envelope parameter design. This research examines their impacts on energy consumption from these three perspectives, constructs decision tree models, and ultimately combines all passive design strategies to establish a comprehensive design strategy. Designers can choose the most suitable strategy based on their specific design preferences.

3. Case Application and Analysis

3.1. Materials and Data

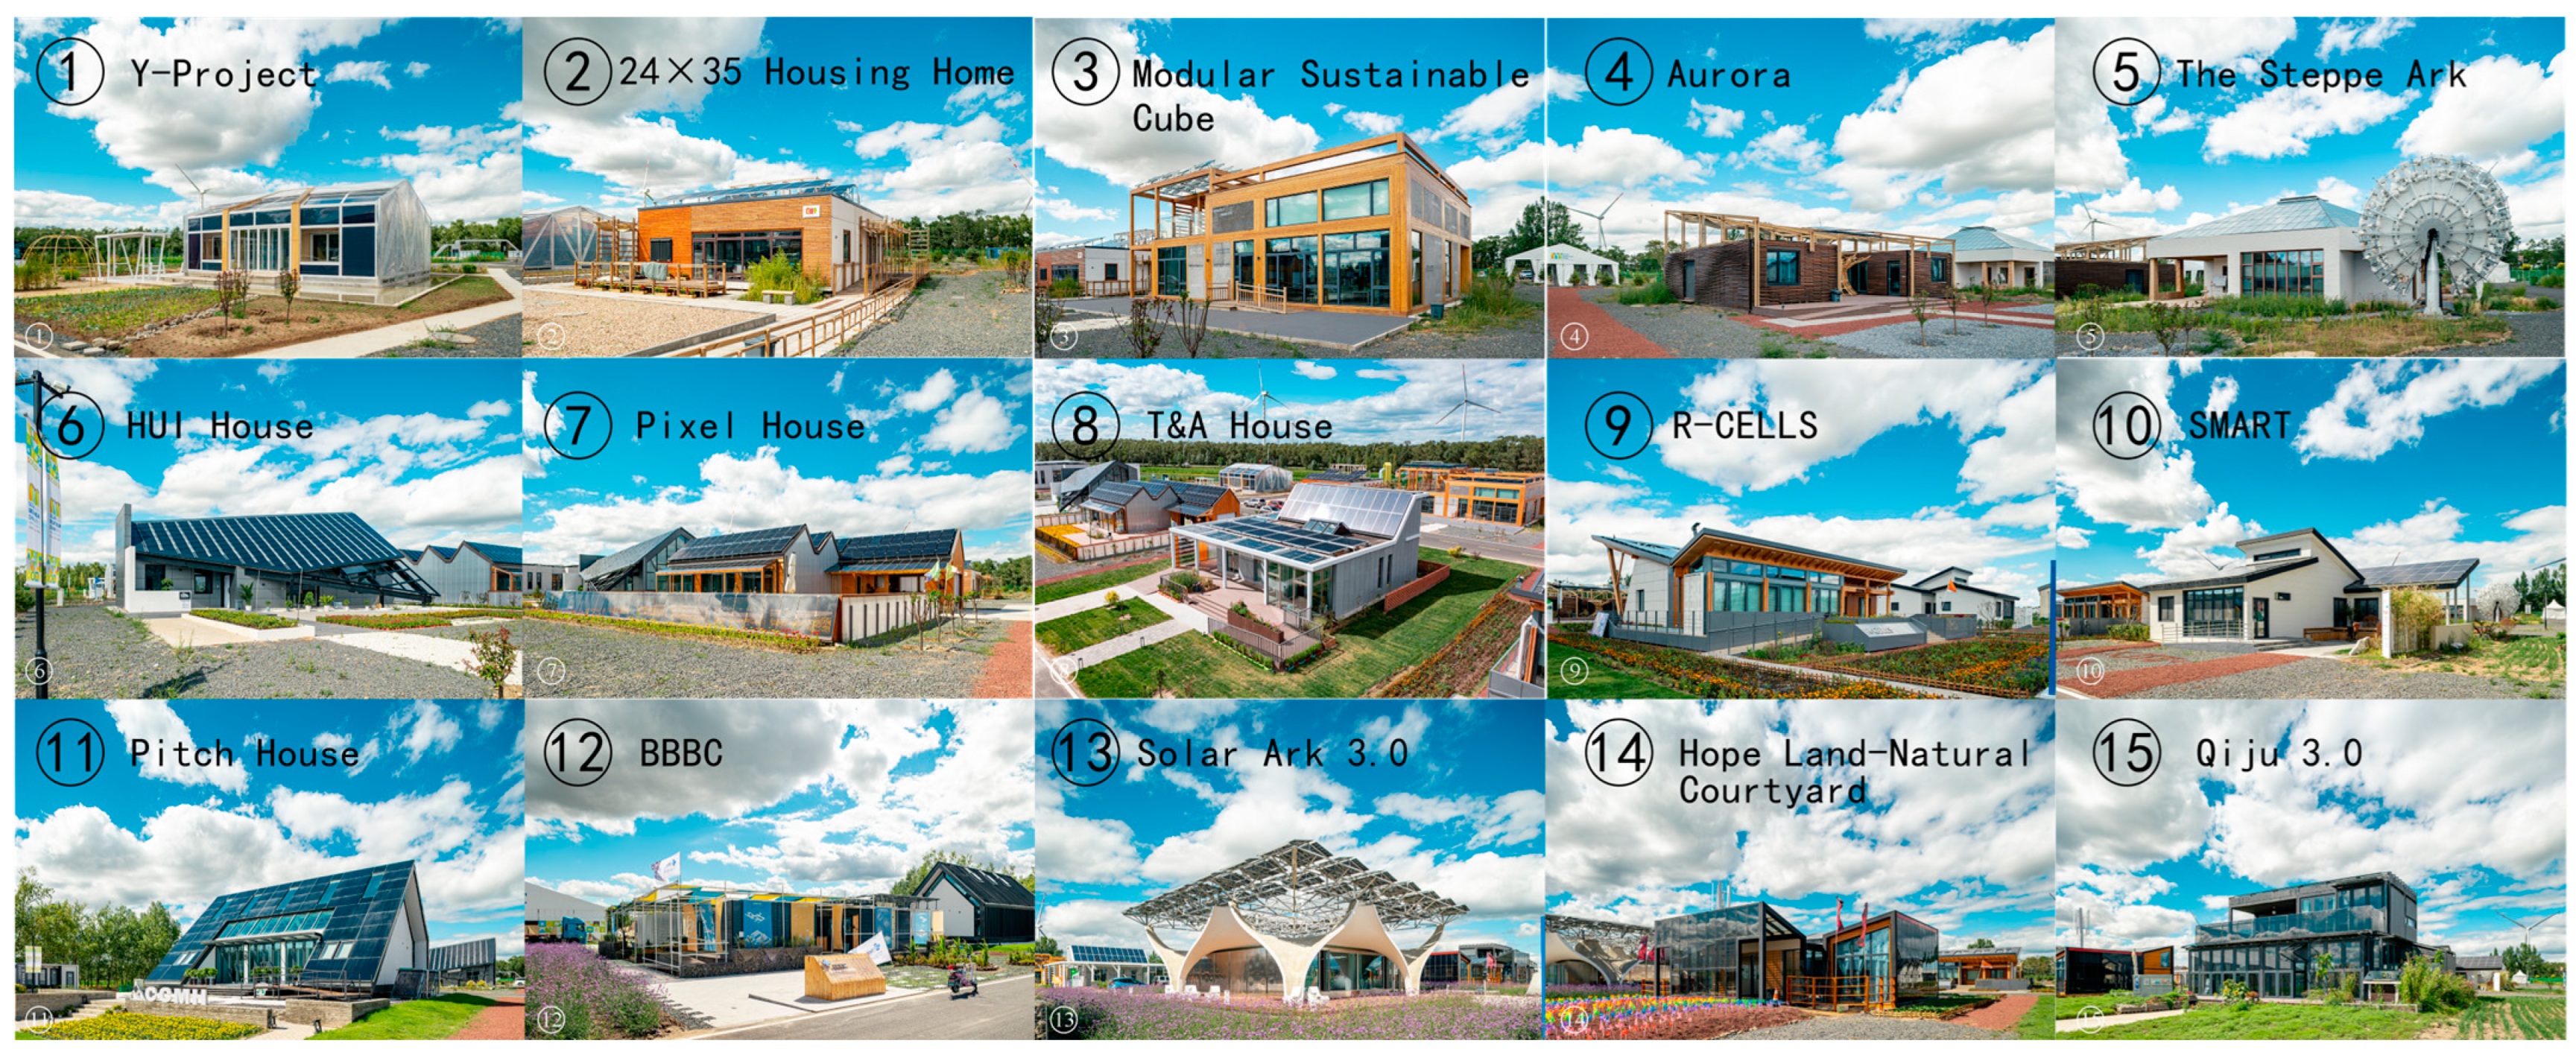
The third SDC Competition [48] was successfully held in De Sheng Village, Zhangbei County, Zhangjiakou City, China in 2021. Sponsored by the U.S. Department of Energy’s Solar Decathlon (SD), the competition’s primary objective is to seamlessly incorporate the principles of clean energy, energy efficiency, and environmental sustainability into architectural designs, with the aim of crafting versatile, comfortable, sustainable, and habitable living spaces. The competition process encompasses global scheme solicitation, rigorous screening, team training, and mid-term evaluations, ultimately resulting in the selection of 15 residential prototype designs (refer to Figure 4). These participating teams collaborate with a multitude of companies and organizations, introducing innovations from diverse domains. These innovations range from photovoltaic building integration, modular design, wind–solar–hydrogen–geothermal multi-energy complementary systems to integrated power generation and energy storage systems, green circular zero-emission technologies, smart home features, and IoT applications. These inventive solutions are designed to cater to a wide array of use cases, including retirement communities, cultural tourism initiatives, emergency facilities, urban revitalization projects, and rural development, all of which collectively contribute to the establishment of more eco-friendly, healthier, and more convenient lifestyles through the continuous advancement of technology and engineering.
This study chose 15 architectural cases from the third China Solar Decathlon Competition in 2022. These cases share the same climate conditions and adhere to specific regulations, making them a reliable dataset. These 15 zero energy house cases have been meticulously summarized and can provide trustworthy design parameters for zero energy house design in the region. The competition’s objective is to create environmentally friendly, energy-efficient homes for rural families, typically with a building area of around 150–200 square meters.
In this competition, all participating entries share a collective focus on regional adaptability, public accessibility, and the incorporation of prefabricated design concepts, all aimed at enhancing the energy efficiency of buildings. To achieve this objective, nearly all participating structures feature regular geometric shapes, such as common layouts like rectangles, U-shapes, and L-shapes. Primary functional spaces and auxiliary areas are divided in a tripartite or semi-enclosed manner or arranged in a grid formation to promote spatial homogeneity and offer increased layout flexibility. Regarding building structures, all sample cases employ prefabricated wooden or steel frames and are assembled using modular design principles, resulting in a significant reduction in construction time. Readers can find additional key technical highlights of this competition in Table 1.
The building parameter data utilized in this study were collected through on-site inspections of various construction projects and from publicly available data sources. Additionally, our research team conducted a thorough and in-depth analysis of the competition data in another related study [49]. It is important to note that, due to the time-sensitive nature of the competition’s scoring criteria, the scores are primarily relevant to this specific competition edition. In this study, we have shifted our focus away from using scores as the primary evaluation metric and foundation. Instead, we concentrate on more universally applicable performance objectives, with building energy consumption as the primary research target to support our decision tree experiments and modeling process.
To systematically summarize and thoroughly investigate the potential application of passive design elements in the field of building energy conservation, this study categorizes these elements into three primary secondary strategies: form elements, size parameters, and building envelope parameters (see Table 2). For a more detailed breakdown of these strategies, the dependent variables in this study comprise 15 variables, as outlined below. Among them, four are categorical variables, including functional form and plan form, while the remaining eleven are numerical variables related to the building’s shape and dimensions. The classification of categorical variables is derived from case classification and summarization, with threshold ranges determined based on statistical counts of different types. For example, functional form includes three distinct types: tripartite, grid, and semi-enclosed. The classification formats and sample percentages of other categorical variables can be found in Figure 5.
In the realm of feature engineering, this study begins by classifying and categorizing various features for categorical data through typology. Subsequently, feature engineering is executed using label encoding. Numerical data are acquired through thorough research and from officially published sources, with the cases representing completed samples devoid of missing values and outliers.
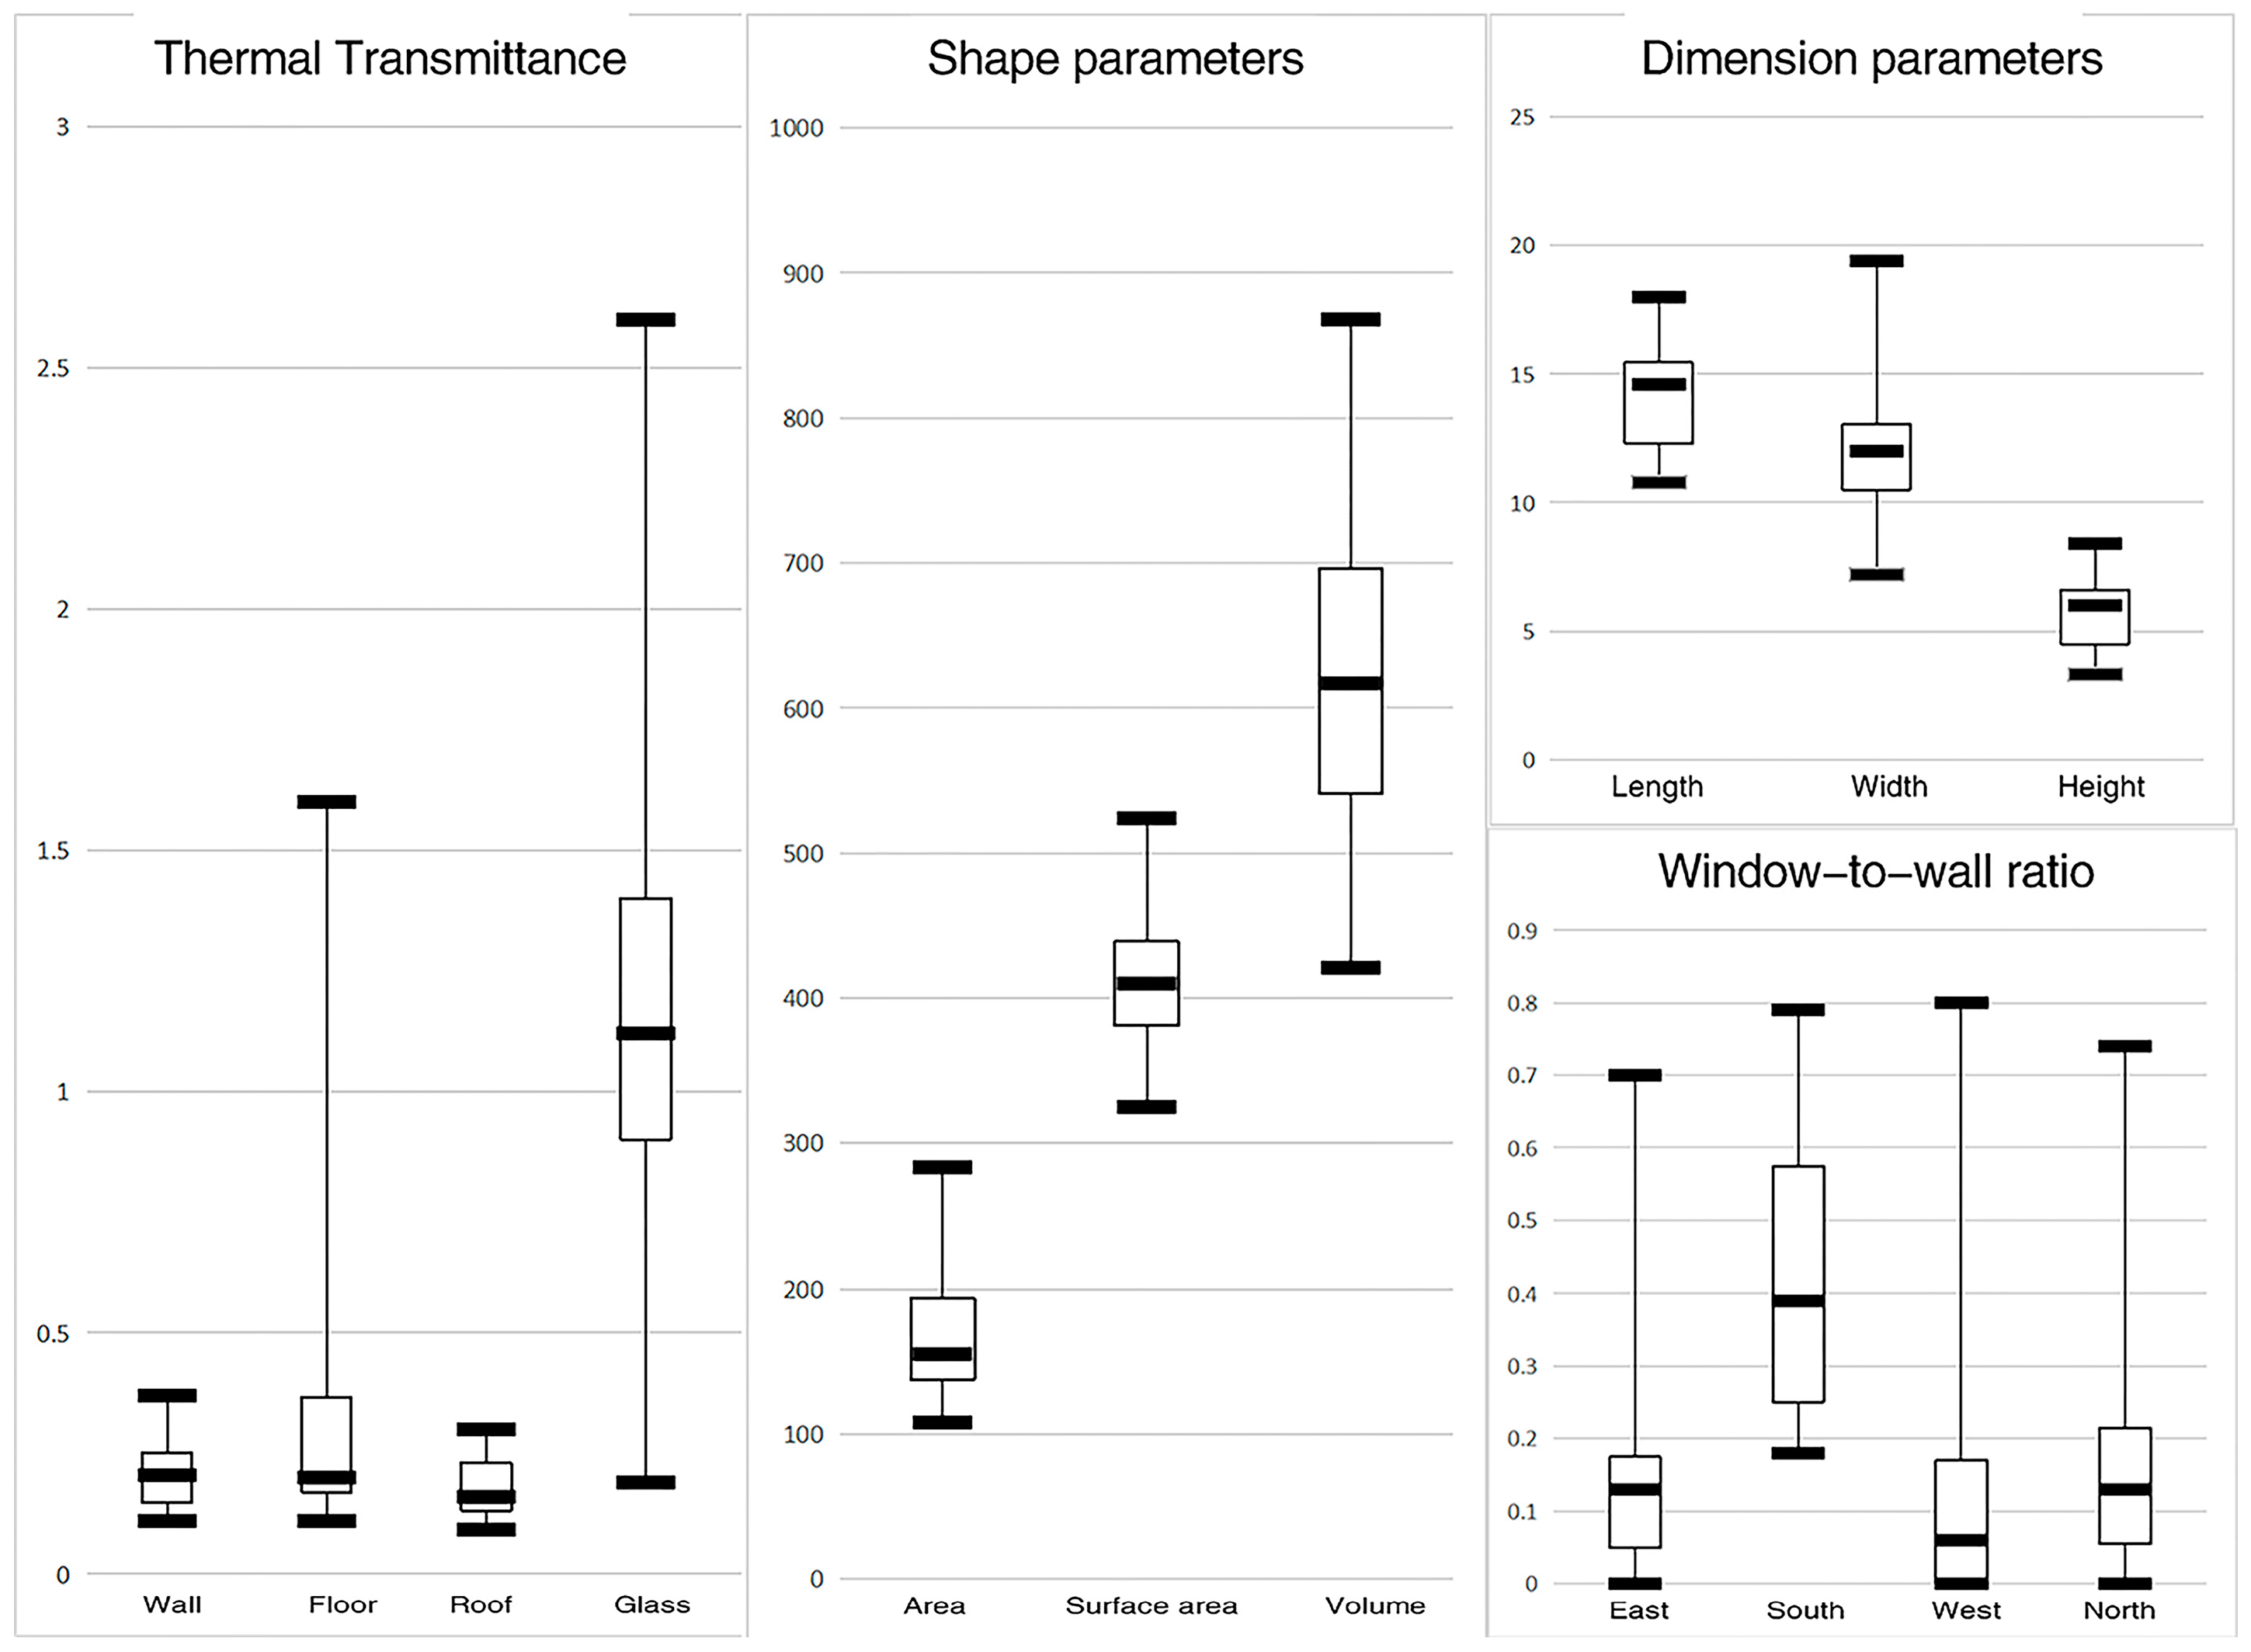
Based on the statistical summaries of various parameters for the 15 buildings (see Figure 5 and Figure 6), it is evident that these buildings commonly exhibit a larger south-facing window-to-wall ratio, while maintaining relatively conservative values for the external wall heat transfer coefficient. Moreover, there is a degree of flexibility in the selection of glass materials in the designs, reflecting their suitability for buildings in cold climate regions. However, when considering the competition ranking results [49], it becomes essential to consider the comprehensive scores of multiple indicators. Despite some buildings having higher energy consumption, they still achieve favorable rankings in the competition. This indicates that competition outcomes are influenced by multiple factors and cannot be solely attributed to the energy consumption levels of the buildings. Therefore, this study primarily focuses on the buildings’ energy performance as an evaluation metric to comprehensively examine the impact of their passive design strategies. To delve deeper into the interactions between different passive design elements and their effects on building energy consumption, this study conducted sample expansion and utilized CART to establish decision tree models, with the aim of revealing potential quantitative relationships between independent and dependent variables.
In fact, these 15 design elements are mainly categorized into three aspects: the geometric parameters of the building, the functional forms of the building, and the structural properties of the building. Designs at these three levels encompass the major architectural features of the region. Due to the design being conducted under uniform climatic conditions, there is a certain degree of similarity in the geometric, functional, and structural aspects.
Firstly, concerning building form, to avoid thermal losses caused by irregular shapes, the buildings take the form of complete and enclosed geometric blocks. The building interfaces have regular and smooth surfaces, predominantly featuring flat roofs and dual-sloped roofs facing north and south, with slopes ranging mostly between 15–20 degrees and 45–60 degrees. Secondly, the envelope structure employs external insulation to mitigate the impact of condensation caused by temperature differences. The frames mainly consist of light steel frames and wooden frames, while materials primarily include high-performance insulation materials such as SIPs panels, polystyrene boards, and extruded boards for thermal insulation. The meticulous treatment of gaps is achieved through the use of polyurethane sprayed foam, among other methods. The glass used is mainly double-layer insulated glass, low-e glass, or photovoltaic glass. Regarding the window-to-wall ratio, the south-facing side generally has a larger ratio, while the ratios on the other three sides are more flexible, mostly adopting conventional side windows. Finally, in terms of functional forms, despite varying combinations, the buildings generally exhibit a dominance of public spaces, with well-defined hierarchies for private and auxiliary spaces.

3.2. Sample Collection

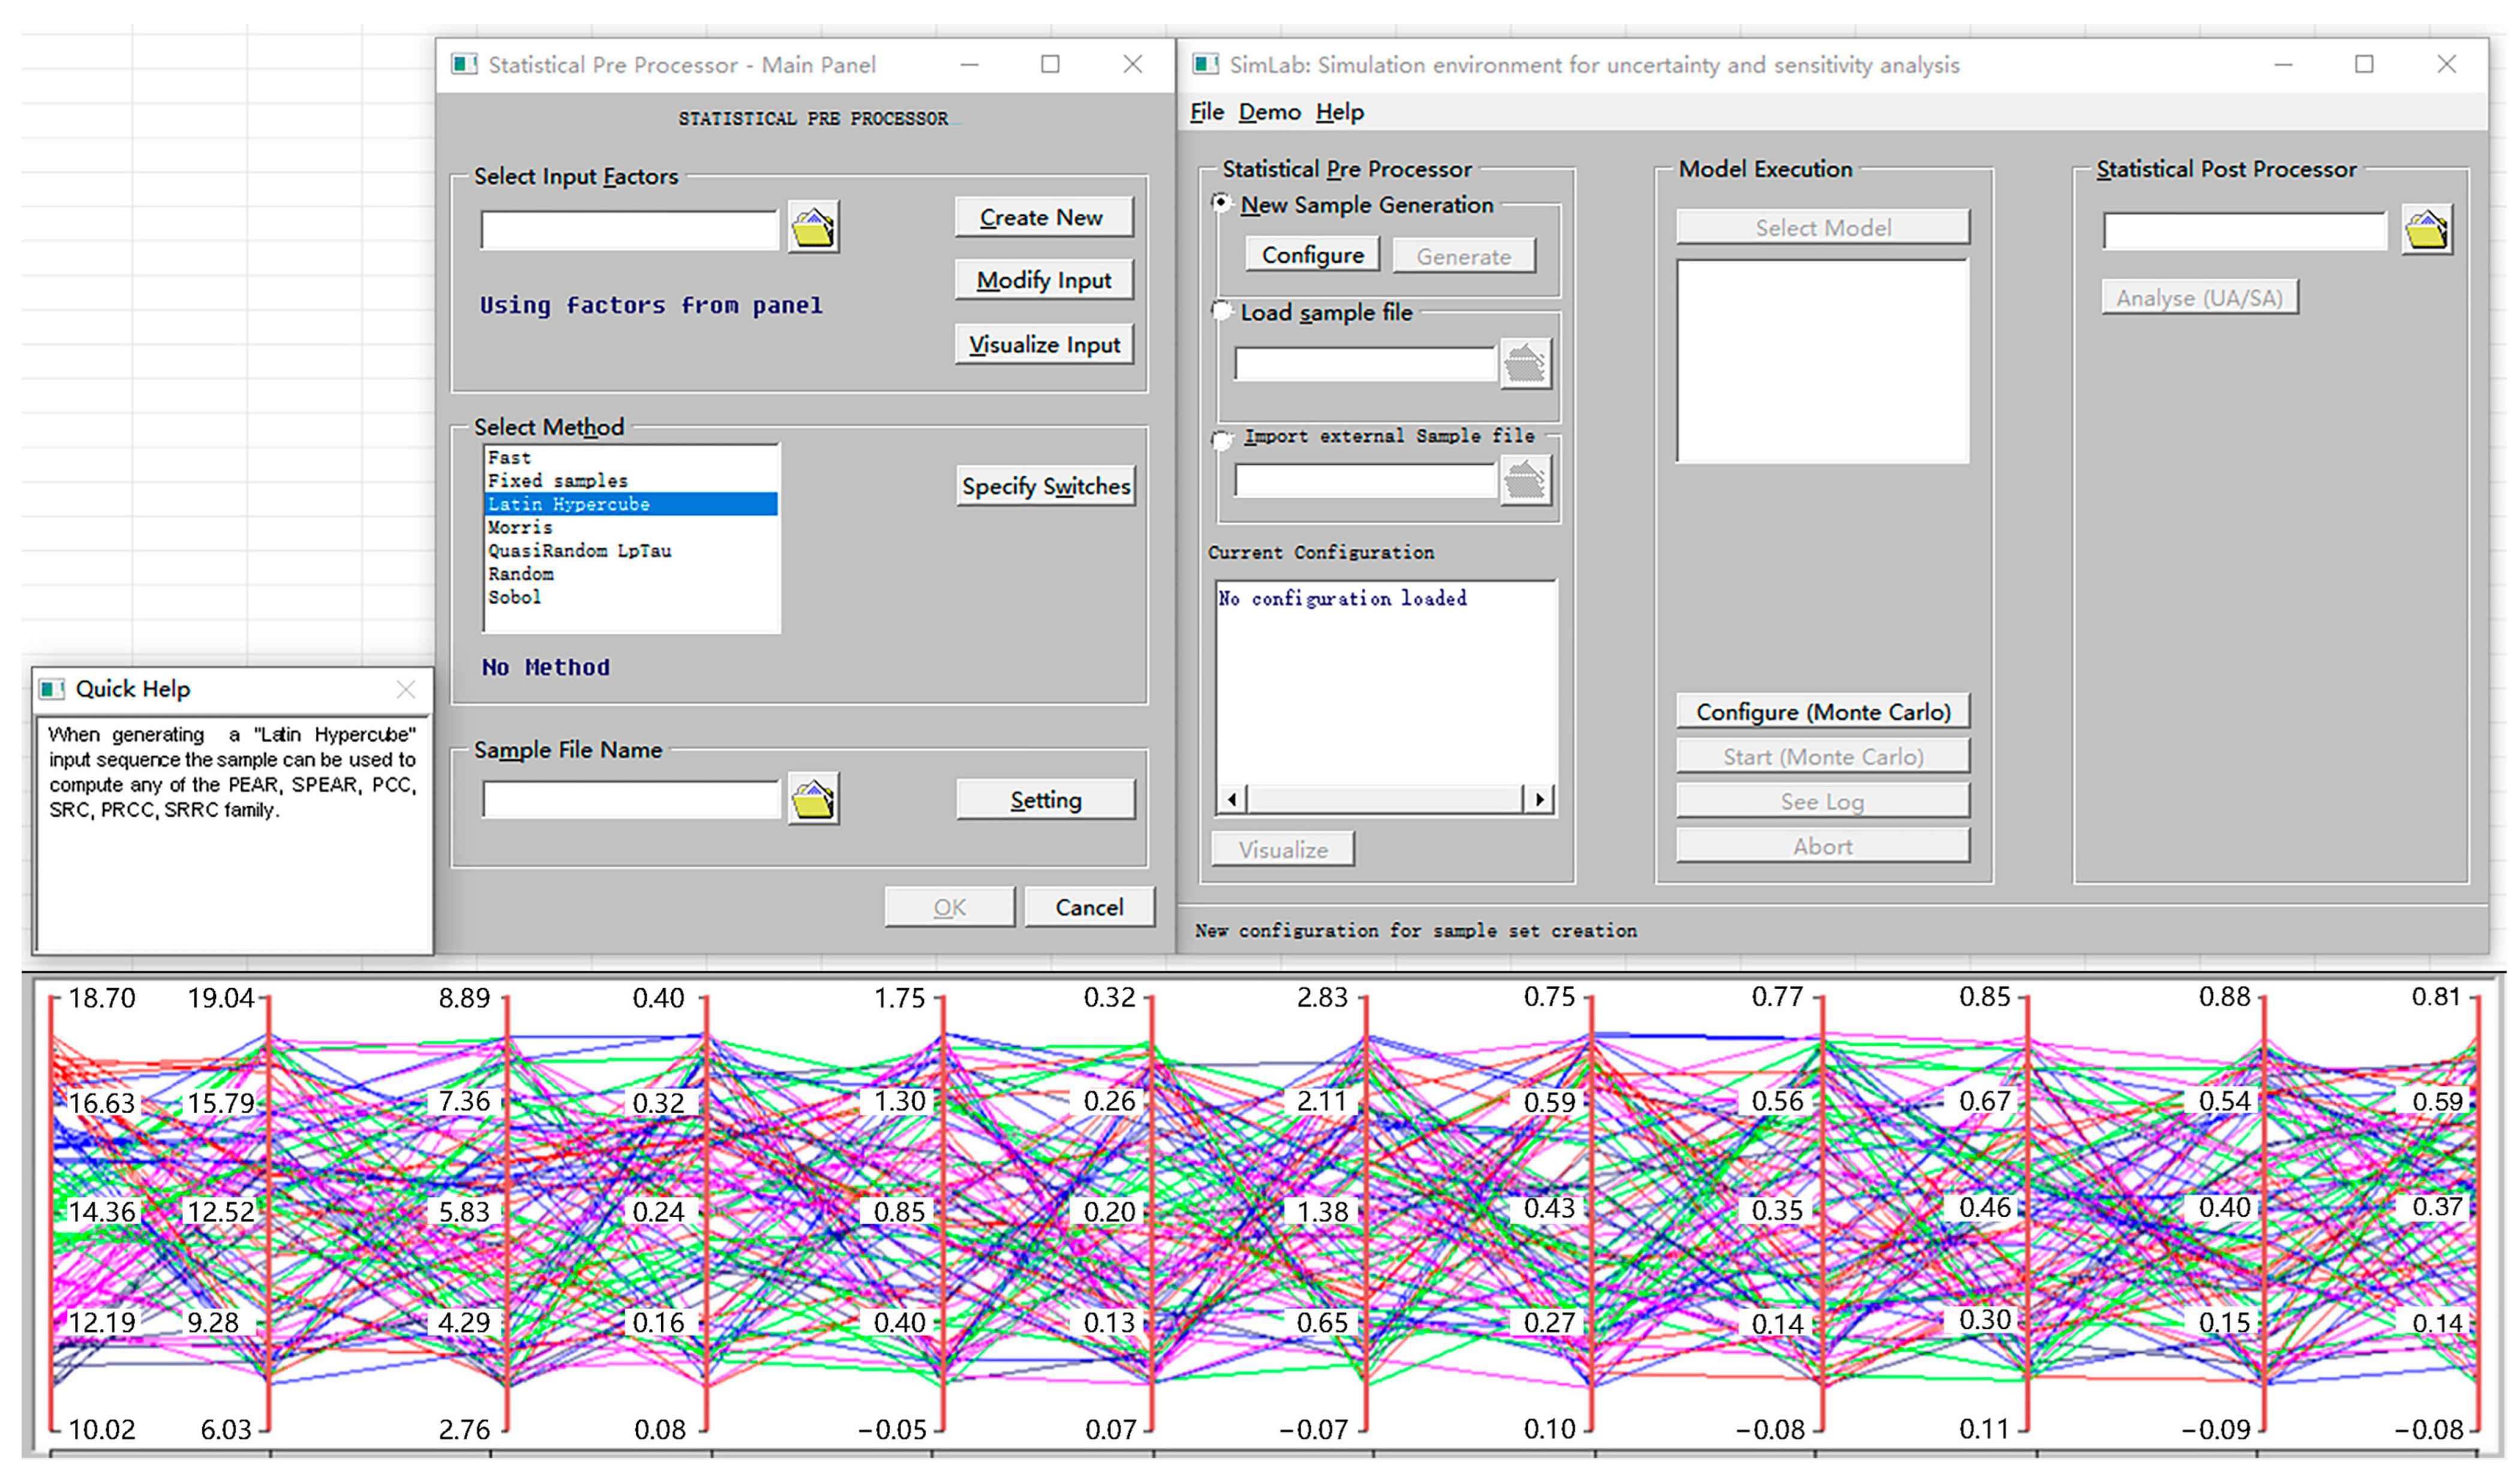
When the well-organized sample data are acquired, Simlab software is employed for data collection and sample expansion. Given that this study involves 15 independent variables and aims to ensure the accuracy and effectiveness of the results, the initial 15 samples were expanded to 200 samples using Latin hypercube sampling [50] (see Figure 7). Research on decision trees has shown that maintaining an adequately sized sample is essential to avoid overfitting. Therefore, by appropriately increasing the sample size to maintain a balanced ratio of samples to variables, the growth of the decision tree model can be facilitated to a certain extent, thereby ensuring the reliability of its results. As a result, post-sampling, a total of 200 samples are obtained, each encompassing all 15 independent variables within the original sample’s threshold range.

3.3. Performance Evaluation

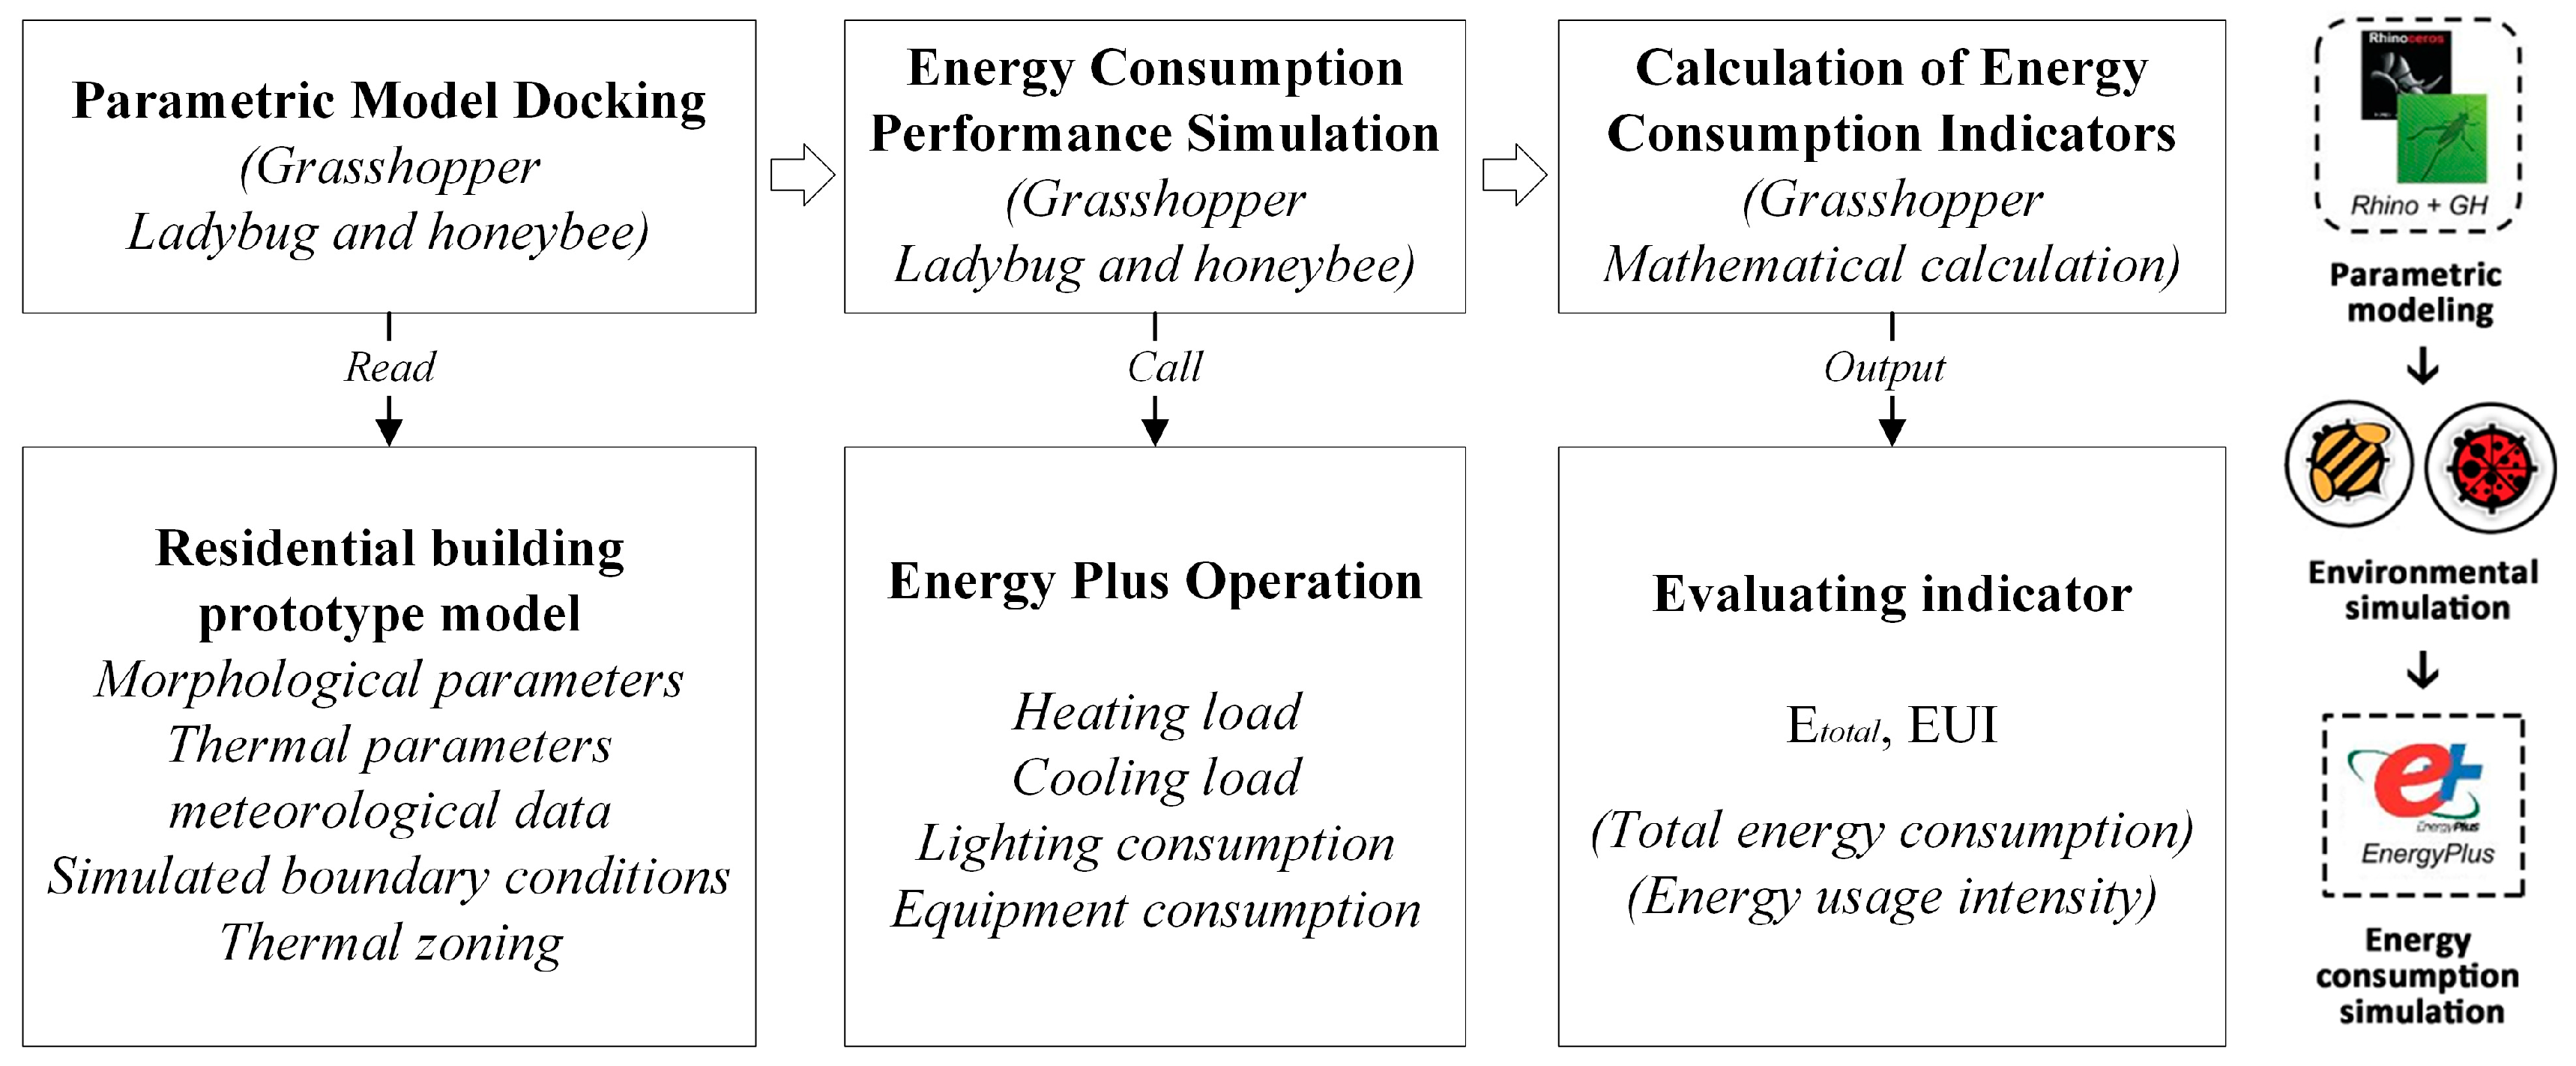
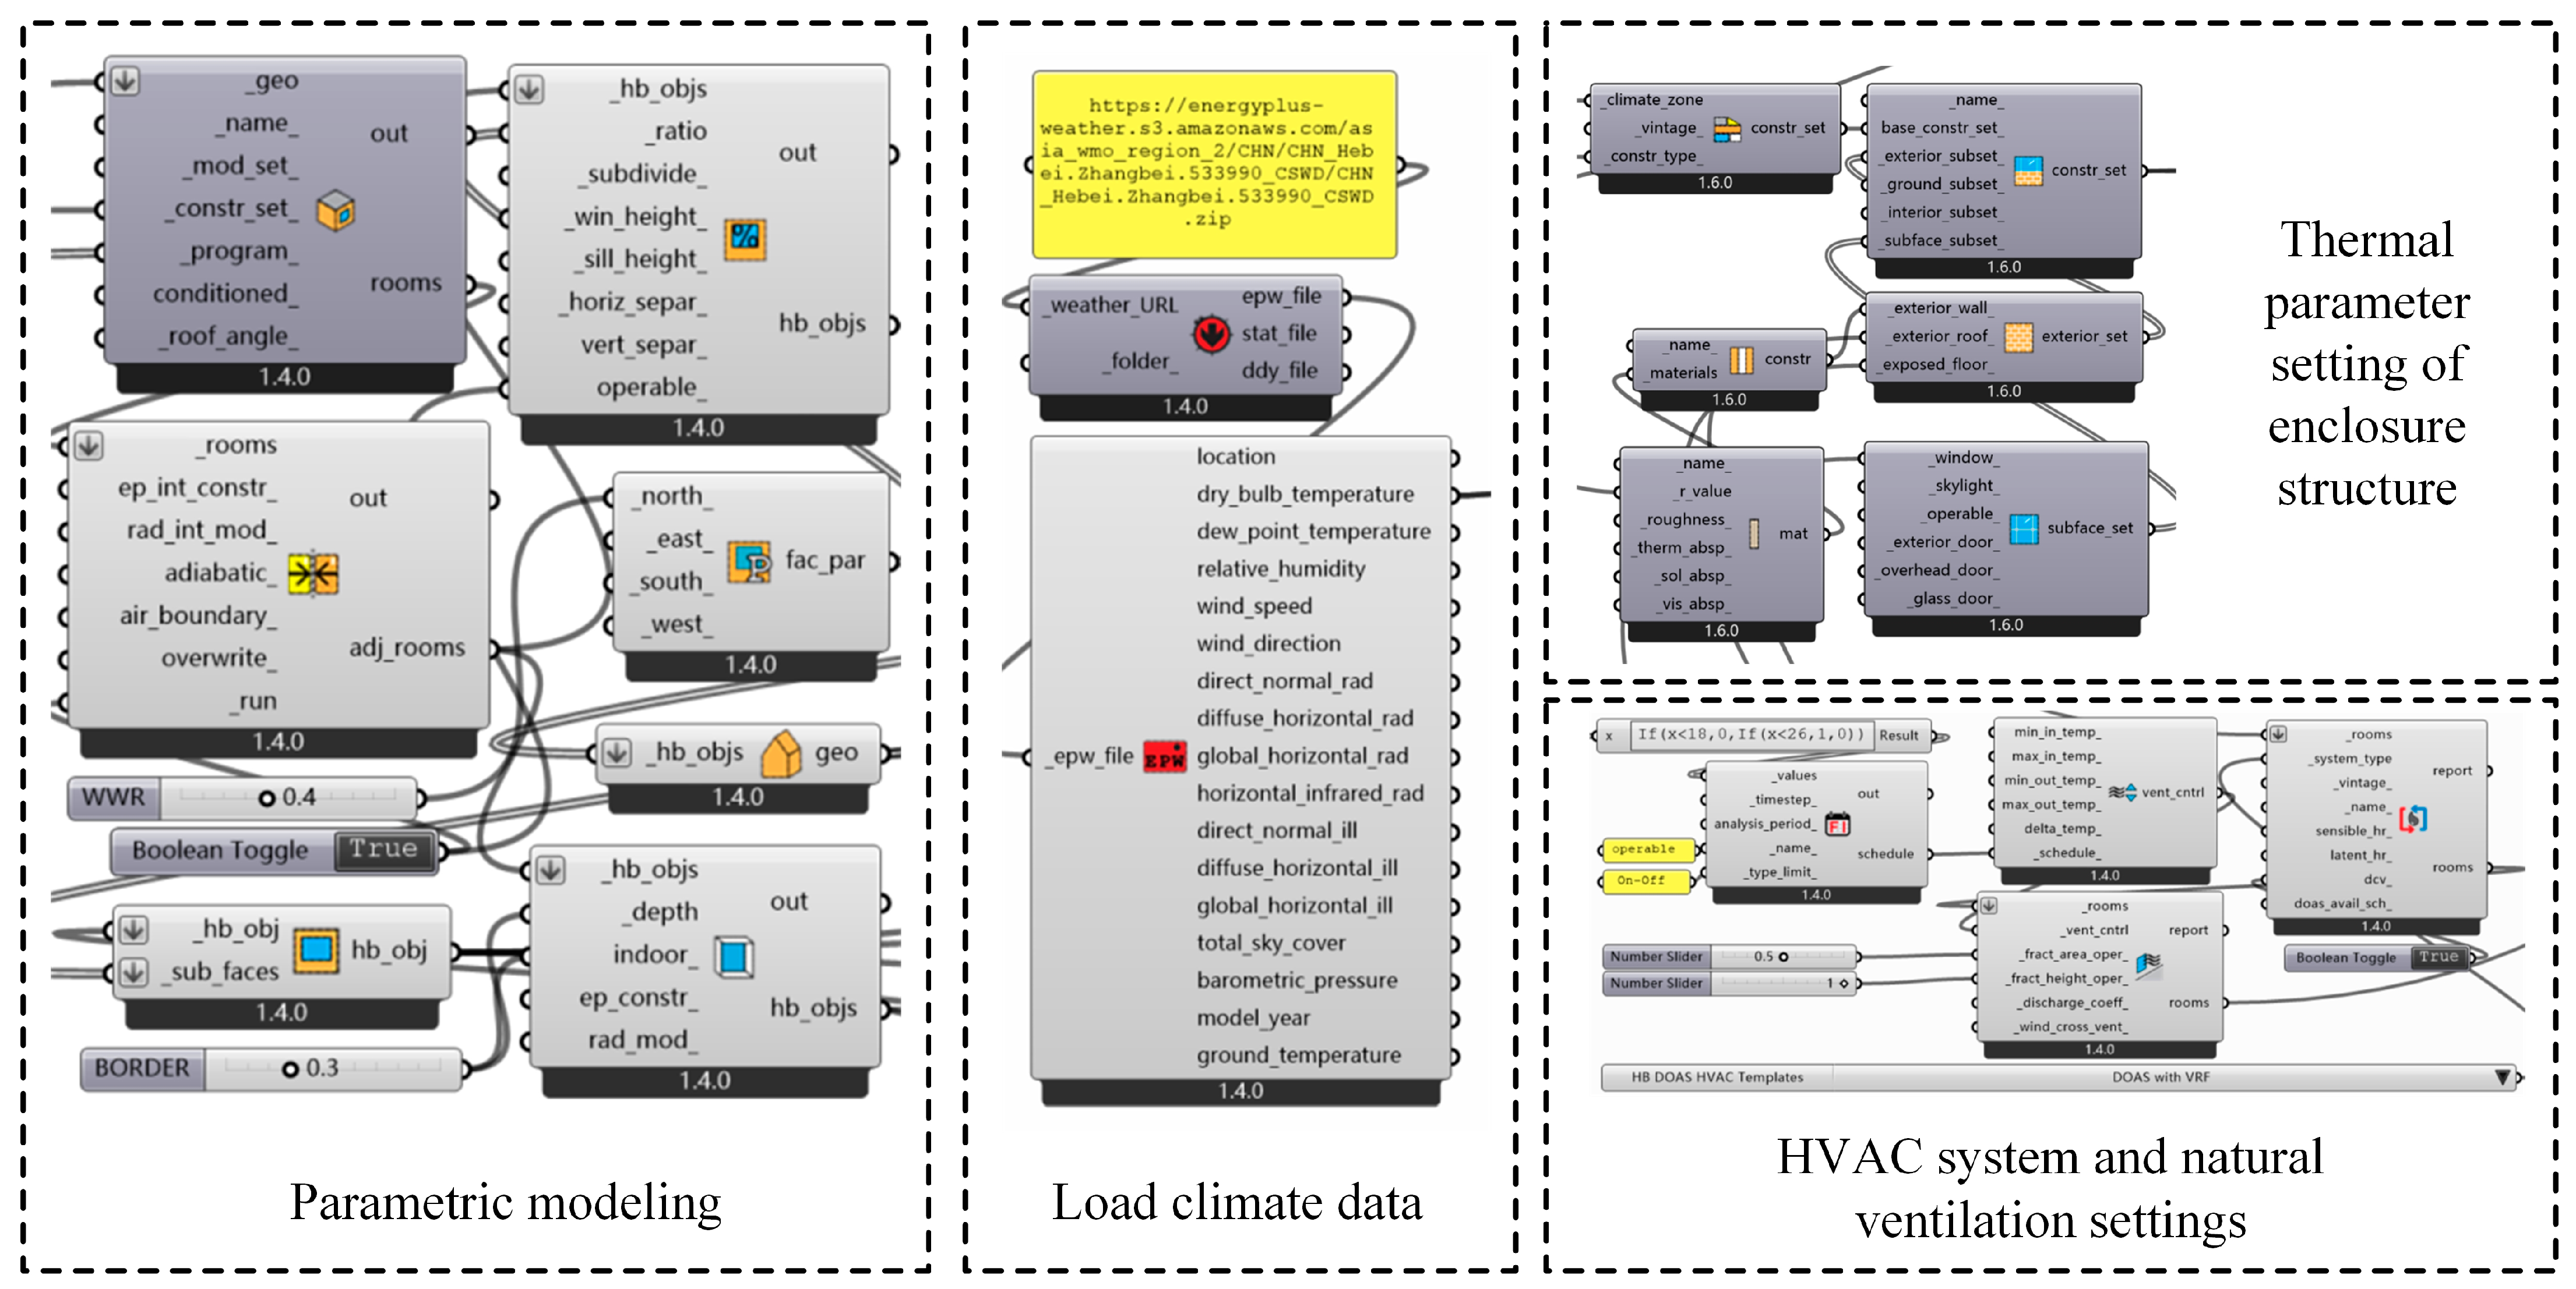
To obtain energy performance data for the expanded set of 200 samples, this study employed parametric modeling using the Grasshopper tool within Rhino. The modeling process includes architectural form modeling, building envelope modeling, climate zone solar modeling, HVAC system modeling, and the final energy consumption simulation using EnergyPlus (refer to Figure 8).
Since this study aims to explore the impact of passive design on energy consumption, geometric prototypes were used for the architectural forms in the modeling. Furthermore, in the HVAC system section, the same HVAC system conditions were used in the simulation for each sample. Similarly, the same sky model was applied. The modeling process in Rhino is illustrated in Figure 9.

4. Analysis and Results

4.1. Target Variable

To demonstrate the energy performance of the buildings, the model’s target variable is represented as Energy Use Intensity (EUI), defined as the ratio of annual total energy consumption to the total building area. Therefore, before classification and prediction, a hierarchical structure for constructing EUI is established. Due to the relatively small size of the database, two descending levels, namely high-level and low-level, corresponding to low energy consumption and high energy consumption, are considered suitable and meaningful. Based on the performance simulation statistics of the expanded samples, building EUI falls within the range of 45–55 kWh/m2 for low and 55–65 kWh/m2 for high.
The energy consumption formula and EUI formula are as follows:
ETOTAL = EHEAT + ECOOL + ELIGHT + EQUIP
where ETOTAL represents the annual total energy consumption of the building, measured in kWh; EHEAT stands for heating energy consumption, measured in kWh; ECOOL represents cooling energy consumption, measured in kWh; ELIGHT indicates lighting energy consumption, measured in kWh; and EQUIP denotes equipment energy consumption, measured in kWh.
E U I = E TOTAL A
where EUI represents the building energy use intensity (kWh/m2); The ETOTAL represents the total building energy consumption (kWh); and A stands for the building area (m2).

4.2. Development of Decision Tree Model

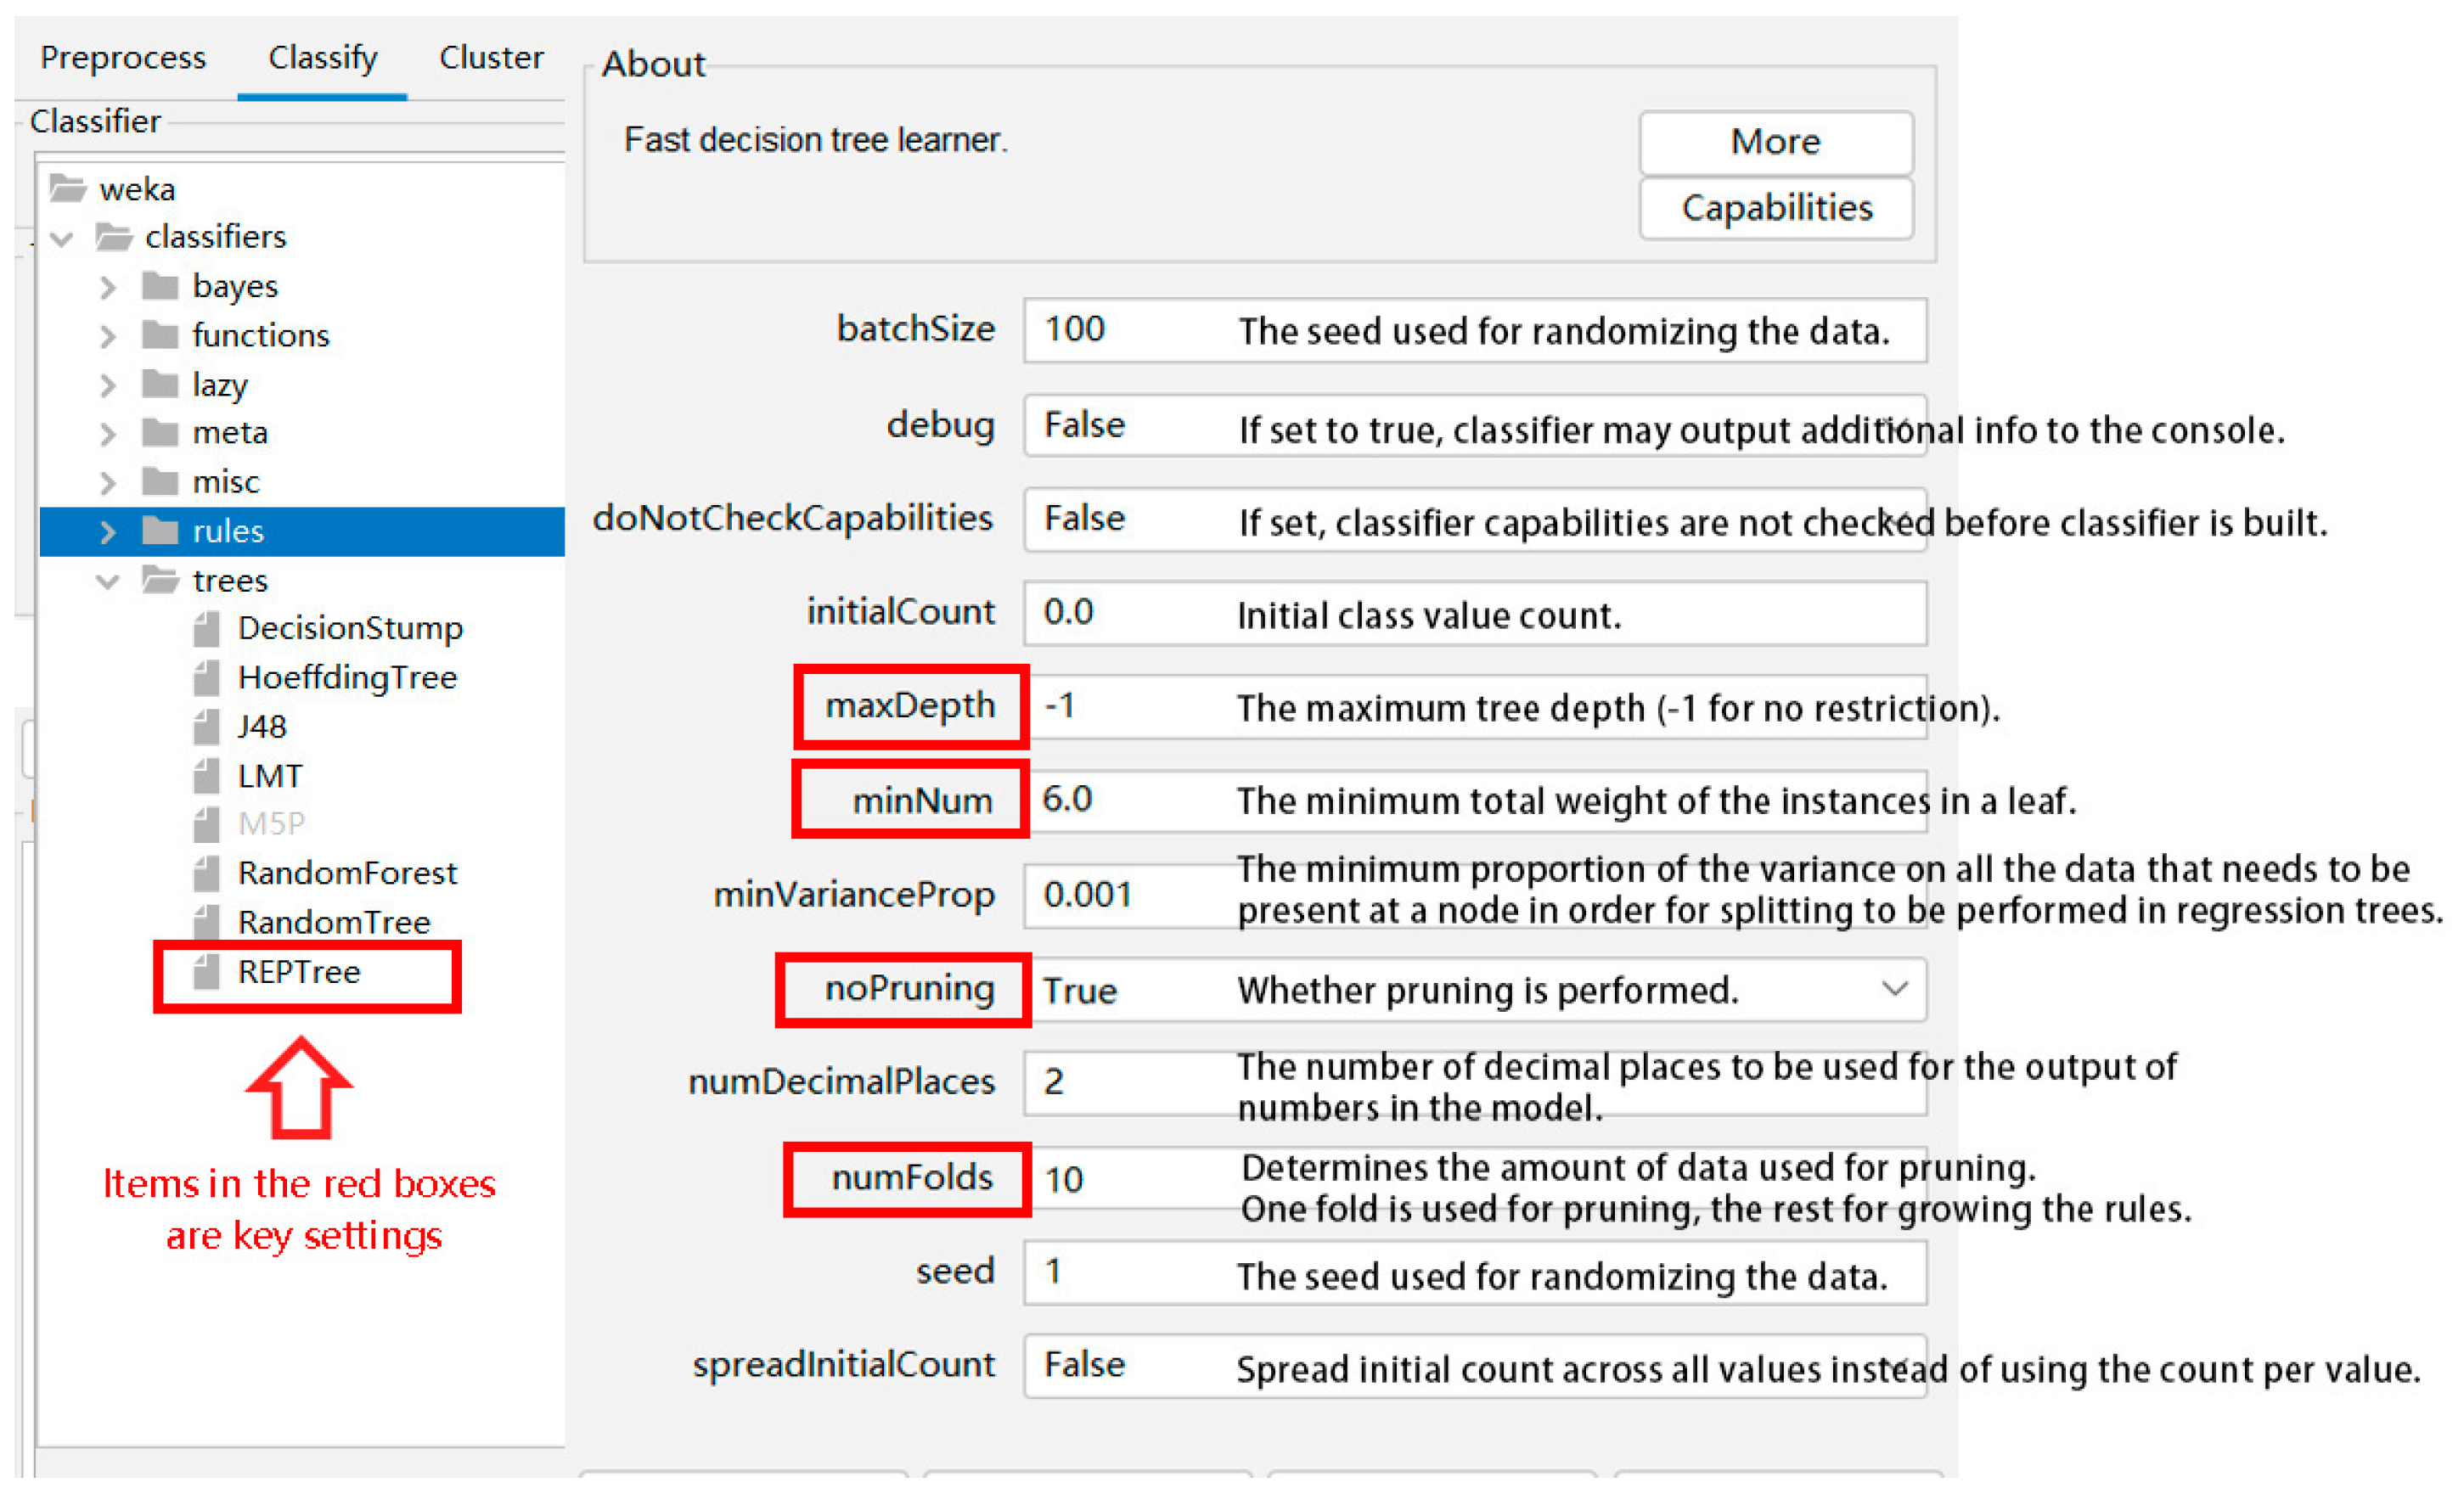
During the development of the decision tree model, two crucial aspects are the division of the training set ratio and the setting of decision tree parameters. The division of the training set ratio applied the most common proportion, with 80% assigned to the training set and 20% to the testing set. REPtree is chosen as the classifier, and four key parameters are set:
(1)
maxDepth: This determines the maximum depth of the decision tree. By default, it is −1, meaning the algorithm will automatically control the depth.
(2)
noPruning: Pruning automatically trims leaf nodes that do not contain much information, making the decision tree simpler and more understandable.
(3)
numFolds: This specifies the data multiplier to be used for pruning the decision tree. The remainder will be used to formulate rules.
(4)
minNum: The minimum number of instances for each leaf. If not specified, the tree will continue to split until all leaf nodes have only one associated class.
By setting and adjusting the above parameters, the decision tree model is pruned and standardized until satisfactory results are achieved. In this study, the final settings, after multiple adjustments, are presented in Figure 10.

4.3. Decision Tree Results and Model Interpretation

Through pruning and adjustments, each decision tree model for EUI associated with the secondary elements exhibits an accuracy level of approximately 70%, signifying a suboptimal model performance (Table 3, Table 4, Table 5 and Table 6). This outcome implies that the consideration scope for each secondary element is not comprehensive enough to establish a more precise model. Nevertheless, these models still offer some valuable reference and can aid in local element design decisions.
Based on the analysis, if design decisions solely revolve around form elements within passive design, it is advisable, in this region, to prioritize the impact of roof form, plan form, functional structure, and frame form on building energy consumption in order of their significance. Concerning the geometric parameters, adjustments should be made in the sequence of length, height, and width. Given the high-latitude location of the area, modifying a building’s length and height proves beneficial in reducing the impact of its shape on energy consumption and maximizing solar radiation utilization. Interestingly, concerning building envelope parameters, the external wall garners the lowest score in the importance ranking. Moreover, in the context of window-to-wall ratio parameters, the south-facing window-to-wall ratio is less significant than its west-facing counterpart. This result may be attributed to regional characteristics.
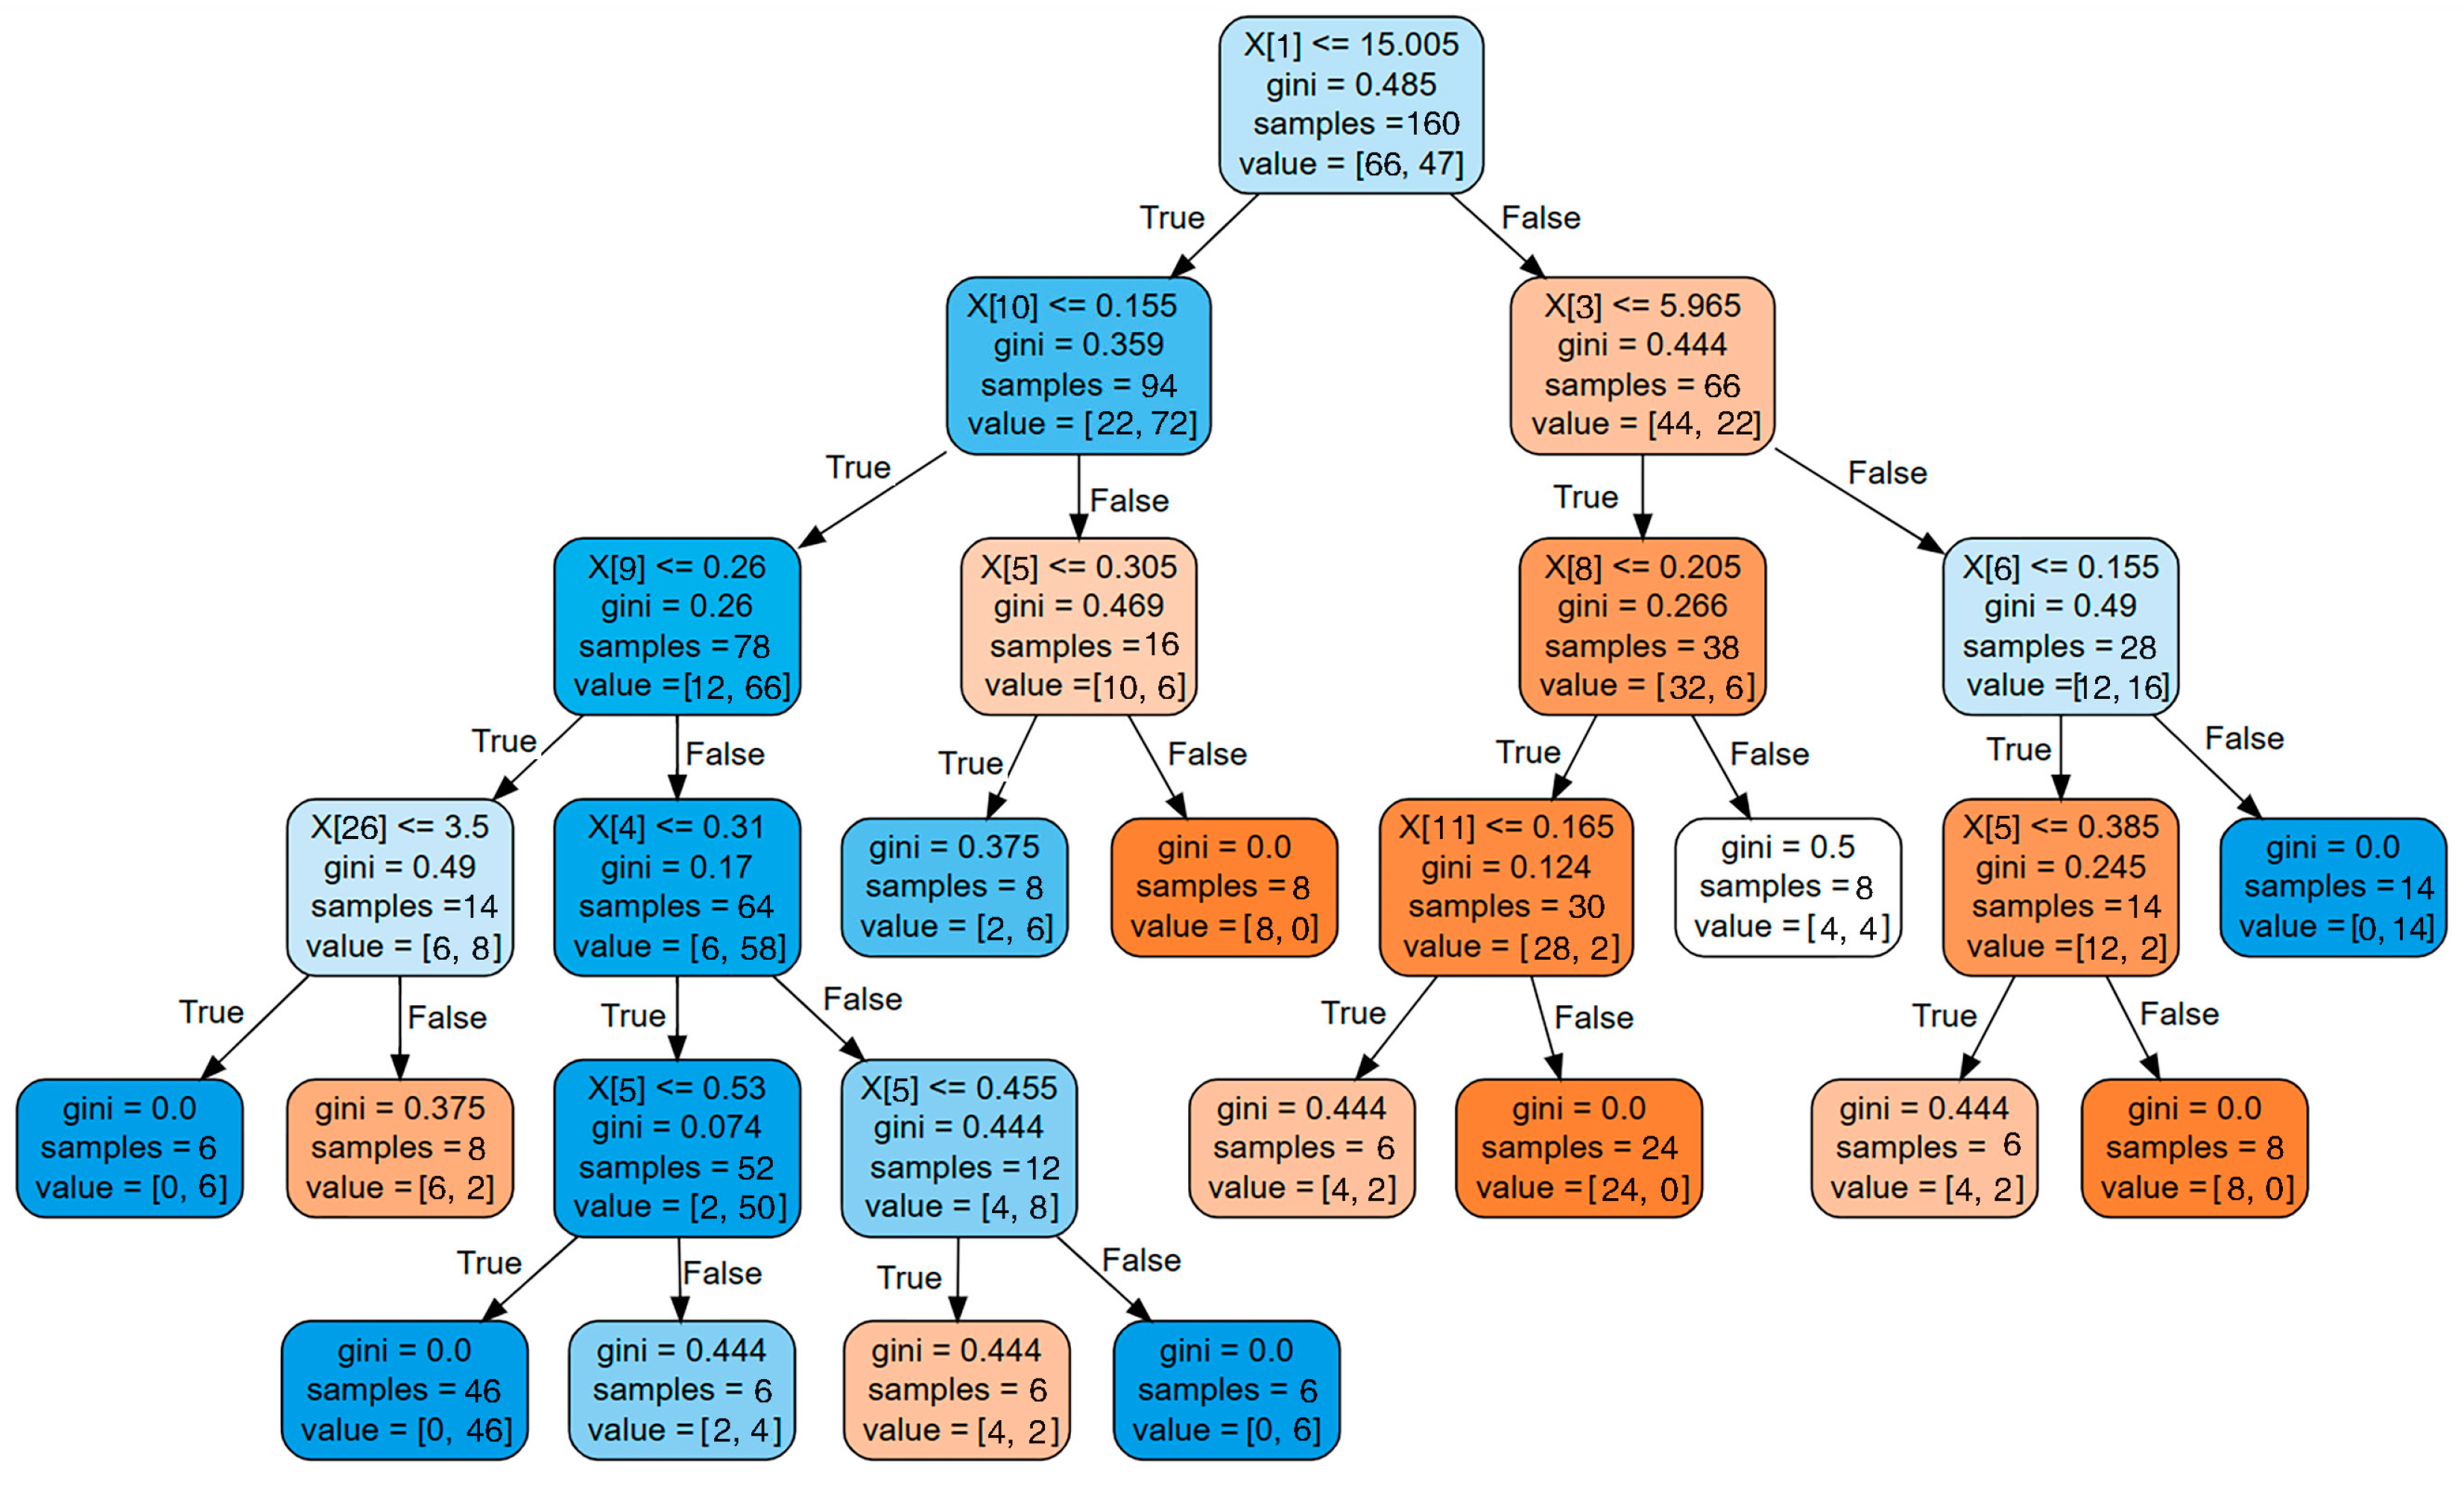
The decision tree for classifying building EUI levels is presented in Figure 11. This decision tree was constructed based on a training dataset that includes 200 data records, incorporating the 15 attributes from Table 2. The decision tree comprises a total of 27 nodes, including 14 leaf nodes. Each node provides information such as its node number, the number of samples it contains, and details regarding the classification outcome (EUI = HIGH or EUI = LOW). In the figure, blue nodes represent EUI = LOW, while orange nodes represent EUI = HIGH. The shade of the node color indicates the purity of the classification outcomes for the samples within that node, reflecting the confidence in its classification strategy. Therefore, this decision tree model includes 14 leaf nodes, with 7 nodes considered as reliable decision criteria.
The primary advantage of decision trees lies in their interpretability and ease of use, particularly in creating decision rules. By utilizing decision trees, decision rules can be easily generated by following the path from the root node to the leaf node. Since each leaf node corresponds to a decision rule, considering all leaf nodes allows us to obtain a complete set of decision rules equivalent to the rules of the entire decision tree. Therefore, we transform the decision tree with the high-purity nodes mentioned above into a set of decision rules, as shown in Table 7. By employing these rules in passive design, it becomes possible to rapidly predict the initial EUI levels, thereby enhancing design efficiency.
In the actual design process, these seven decision rules can serve as a reference for combining and selecting various passive design strategies. Given the relatively large sample sizes and high data purity associated with these rules, the optimal decision rules for EUI = HIGH and EUI = LOW scenarios are Rule 5 (EUI = HIGH) and Rule 2 (EUI = LOW), respectively. Specifically, for achieving low energy consumption, design decisions should consider the following features: building length less than 15 m, west-facing window-to-wall ratio below 0.155, south-facing window-to-wall ratio above 0.26, external wall heat transfer coefficient below 0.31, and ground heat transfer coefficient above 0.455. Adhering to these design criteria will result in a building falling within the EUI range of 45–55 kWh/m2.
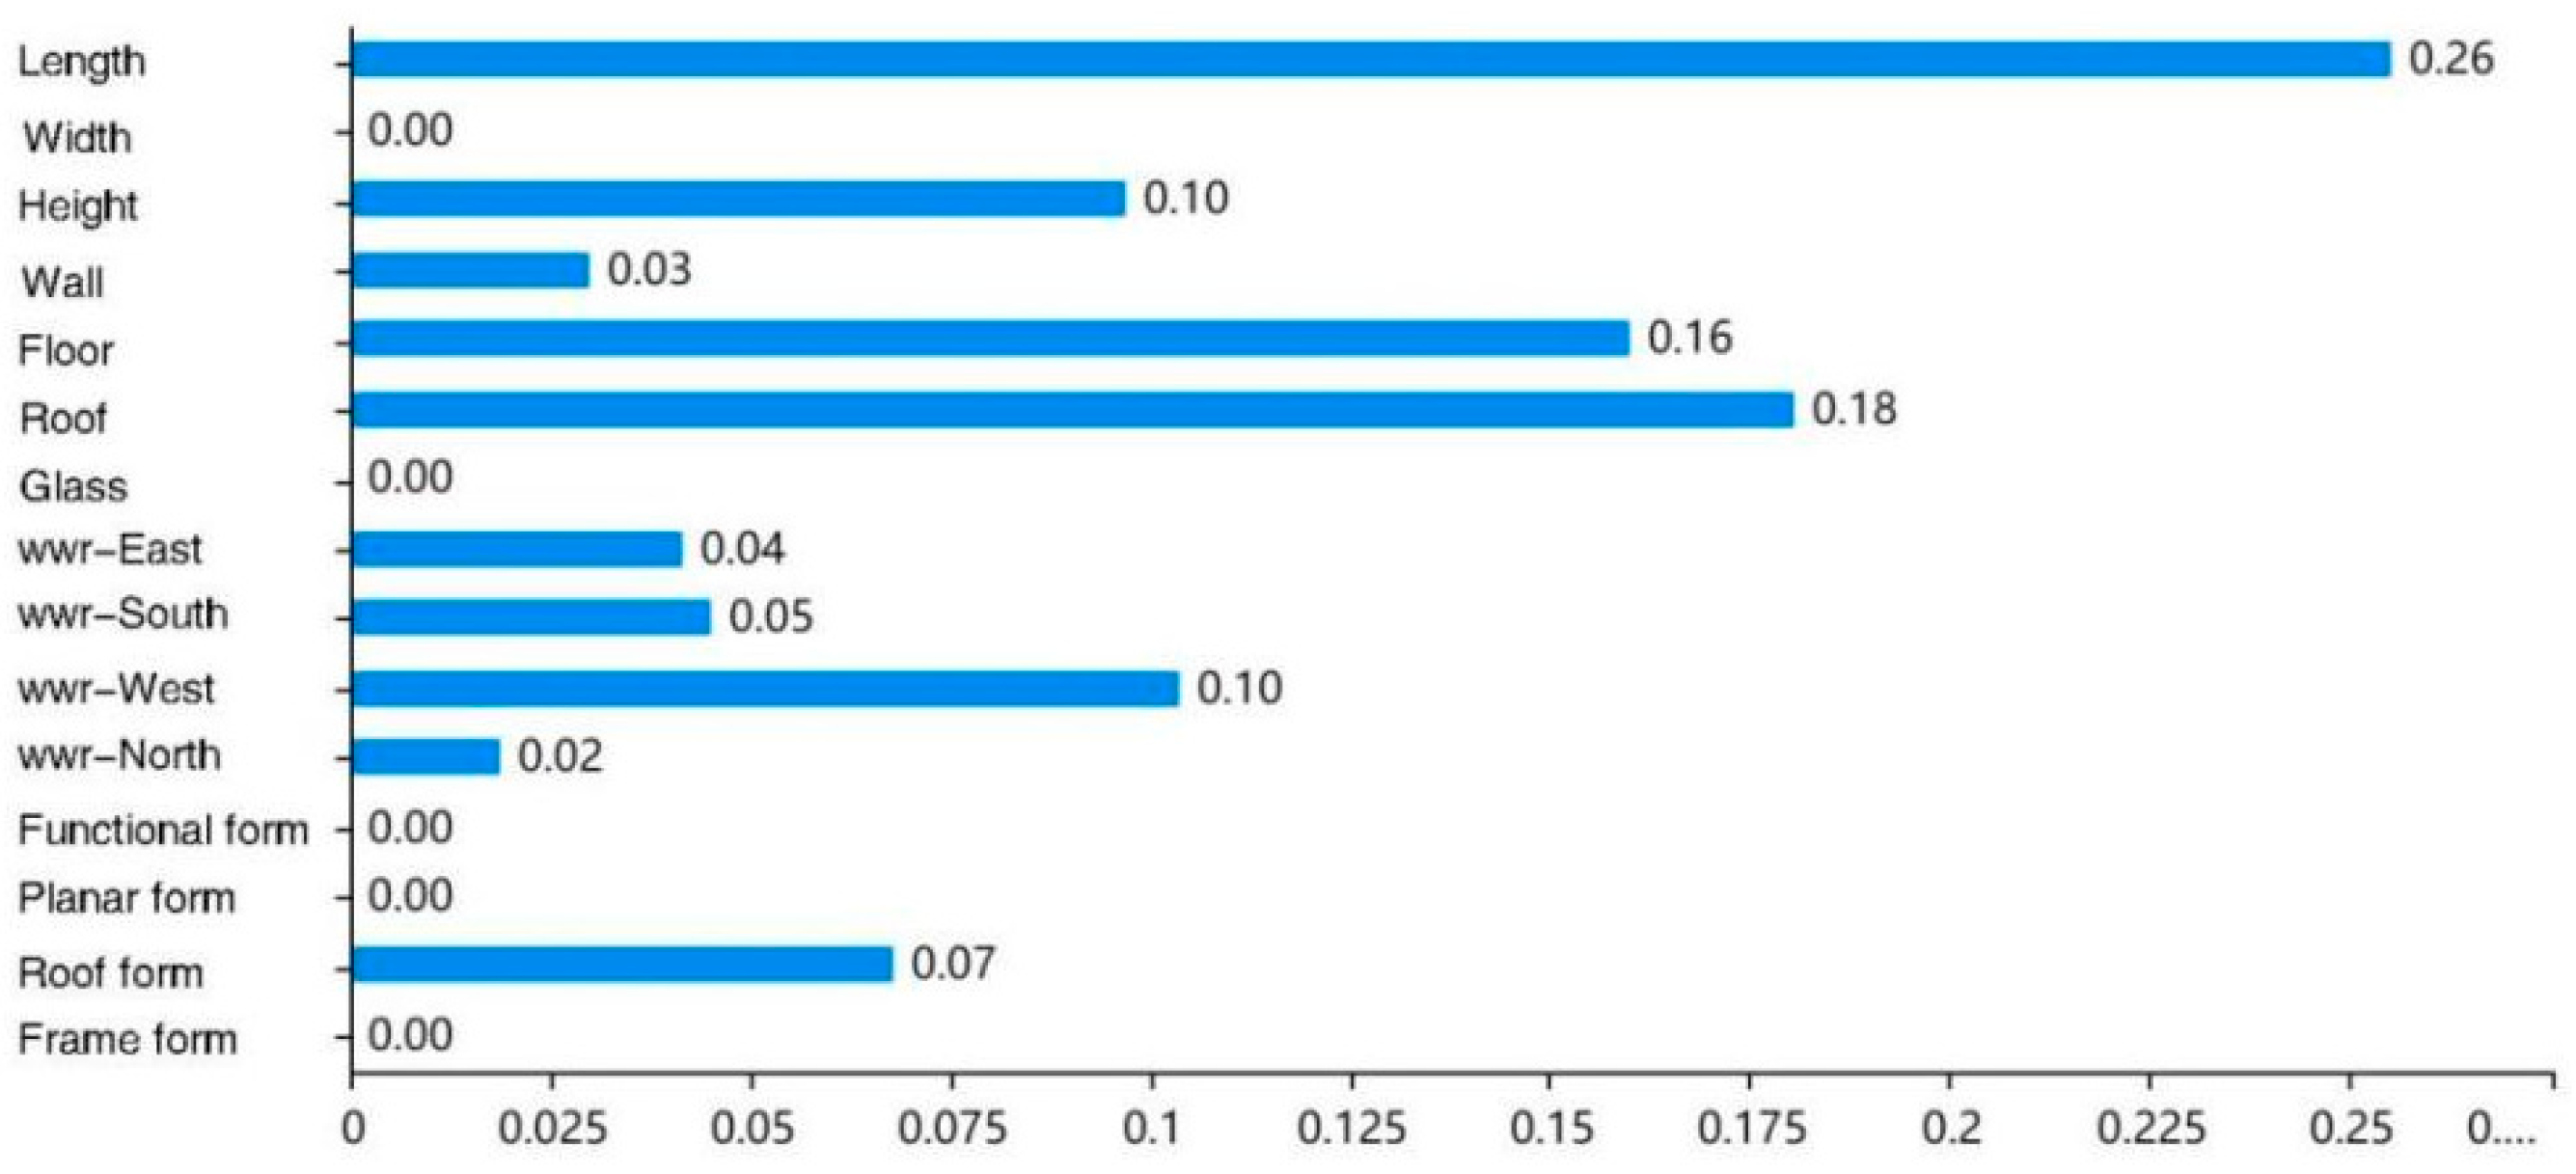
Additionally, this study provides feature importance weights for the global decision tree model (see Figure 12). Upon analyzing the decision tree model and the weight data, it becomes evident that the feature importance weight chart of the global decision tree model exhibits some differences compared to the feature weight chart obtained from the local decision tree. In the global decision tree model, building length, roof, and ground elements carry the highest weight proportions among all the features, while the weights for building width, glass doors and windows, functional plan, and frames are nearly negligible. This suggests that the data results obtained through supervised learning display variances compared to empirical features. These variances do not diminish the importance of low-weight features but arise from the decision tree analysis, which makes their significance relatively less prominent when combined. Conversely, due to distinct feature combinations, variations exist between local and global analysis results. In practical applications of passive design strategies, energy-efficient design can be guided based on the following weight ranking.
In guiding the design process, it is essential to recognize that architectural design involves a comprehensive regulatory process. This implies that a change in one element may have a cascading effect on other elements. When addressing such influences, decision-making can follow the priority sequence outlined above. Thus, decisions can be made step by step, or alternative solutions can be determined based on the established priorities. For instance, increasing the length of the building footprint, which alters the building’s spatial volume, may necessitate changes in the heat transfer coefficient of the building roof. Material and construction conditions may impose specific requirements on the heat transfer coefficient of the building roof. In such cases, if the design prioritizes energy efficiency, the adjustment of building length should take precedence in decision-making.
According to Table 8, within the entire sample dataset, the proportion of accurate classifications reaches as high as 93.5%. To visualize the classification performance, a confusion matrix is employed, where the number of correctly classified records is presented along the main diagonal, running from the top-left to the bottom-right. Any incorrect classifications are located outside the main diagonal. Notably, records categorized as “LOW EUI” were misclassified as “HIGH EUI” only seven times, while records belonging to the “HIGH EUI” category were misclassified as “LOW EUI” just six times. These results indicate a higher susceptibility to misclassification for “LOW EUI” compared to “HIGH EUI”. This tendency may be influenced by the predominance of “LOW EUI” samples in the data records, making the decision tree more sensitive to them.
According to the description provided earlier, the accuracy, precision, recall, and F-Score will be used for assessing the decision tree model, and the evaluation results are presented in Table 9. Based on the data, it is evident that the evaluation values of the decision tree model consistently exceed 80%, indicating that the model is highly reliable.
The framework proposed in this study, based on decision trees for passive design parameter decisions in zero-energy residences in cold regions, demonstrates more regional specificity compared to feedback design methods based on design specifications. However, due to its focus on only a subset of passive design strategies, the content covered by this method is not comprehensive enough. Additionally, our research framework can optimize the stages of feedback design methods based on performance simulation, enabling rapid preliminary predictions. However, these predictions are limited to simple models, making it relatively challenging to address complex models and intricate issues. In comparison to optimization design methods based on intelligent algorithms, our framework can provide design solutions with guidance more quickly, but its precision is not as high as that achieved by intelligent algorithm optimization. In summary, the method proposed in this study is suitable for making fundamental decisions and designs rapidly in the early stages of scenario design and optimization. However, when dealing with complex models and multi-objective problems, it is still necessary to consider other methods.

5. Conclusions

This study presents an innovative framework that, based on real-world cases, utilizes sample expansion and performance simulation. It employs a CART model for the quantitative analysis of passive design parameters for rural residential buildings in Zhangbei, Zhangjiakou region. The aim is to guide energy-efficient design. This framework can provide effective guidance for architectural design and optimization.
Through a comprehensive analysis, this paper summarizes 15 key passive design elements, encompassing typological and design factors. The study reveals that architectural designs in the Zhangbei area of Zhangjiakou exhibit relatively consistent characteristics. Concerning architectural forms, there is a predominant use of centralized square plans and regular shapes. Roof forms primarily consist of flat roofs and gable roofs, with slopes concentrated around 14–20 degrees and approximately 45 degrees. In terms of the building envelope, materials with relatively high thermal transmittance values are utilized, with values ranging from 0.25 to 0.5. As for window-to-wall ratios, the south-facing window-to-wall ratio is relatively high, falling within the range of 0.3–0.6, while the window-to-wall ratios on the other three facades range from 0.1 to 0.3.
Through the construction of the CART model, this study successfully established a decision tree model with building energy efficiency as the dependent variable, achieving an accuracy rate of 93% and demonstrating excellent interpretability. CART analysis results reveal that building height is the most significant influencing factor for the energy efficiency of rural residential buildings in the Zhangbei area of Zhangjiakou. Therefore, when designing with energy efficiency as the objective, building length, roof and ground heat transfer coefficients, and the west-facing window-to-wall ratio should be prioritized as design parameters.
Furthermore, the decision tree model provides specific numerical recommendations for these design elements. For instance, by incorporating design elements such as a building length of less than 15 m, a west-facing window-to-wall ratio below 0.155, a south-facing window-to-wall ratio above 0.26, an external wall heat transfer coefficient below 0.31, and a ground heat transfer coefficient above 0.455, buildings within the range of 45–55 kWh/m2 for EUI can be achieved. Therefore, the decision tree model not only assists in determining the importance ranking of design strategies but also offers precise numerical recommendations for designing strategies based on specific objectives, thus enhancing architectural design efficiency.
The contribution of the decision tree model encompasses aspects of design orientation, the design process, and design solutions.
Firstly, in terms of design orientation—taking energy consumption as an example—the decision tree model offers a concise checklist for reference. For instance, if the design conditions align with those in Table 7, the decision tree model facilitates an estimation of whether the building’s energy consumption falls within the high or low energy consumption range. This significantly enhances the design efficiency compared to energy consumption results obtained through simulation.
Secondly, in the design process, the direct application of relevant strategy data from the decision tree model can position the energy consumption of the designed building within a specified range. This approach, as opposed to the iterative process of “design–simulation–optimize design–simulation”, can streamline certain steps, thereby enhancing the efficiency of energy-efficient design.
Thirdly, in terms of design solutions, the decision tree model furnishes an empirical model for zero-energy houses in cold regions. Designers can gain initial insights into the region and directly reference and apply the model, saving time on research, data retrieval, and independent deconstruction. This facilitates the efficient design of zero-energy houses in cold regions.
In addition, this study has limitations in the following aspects:
(1)
The sample size and model complexity have certain limitations. The original sample size of 15 cases is relatively small, and, as a methodological study, the 15 passive design elements chosen in this article are limited. It may be relatively challenging when dealing with complex models involving in-depth design.
(2)
The decision tree model established in this method is oriented towards energy efficiency goals. More targeted decision tree models can be established based on different design objectives.
(3)
This study primarily serves as a methodological investigation, emphasizing the explanation of the method framework and process research. Subsequently, we will expand and refine this research through applied research in design to explore the practical application of the method.
Author Contributions

Conceptualization, Y.C. and G.Y.; methodology, Y.C.; software, Z.D.; validation, G.Y.; formal analysis, Z.D. and C.H.; investigation, G.Y.; resources, G.Y.; data curation, Y.C.; writing—original draft preparation, Y.C.; writing—review and editing, Y.C.; visualization, Y.C. and C.H.; supervision, G.Y.; project administration, Z.D.; funding acquisition, C.H. All authors have read and agreed to the published version of the manuscript.

Funding

This research was funded by the Graduate Innovation Program of China University of Mining and Technology, grant number [2023WLJCRCZL297] and by the Postgraduate Research & Practice Innovation Program of Jiangsu Province, grant number [SJCX23_1262].

Data Availability Statement

The data presented in this study are available on request from the corresponding author. The data are not publicly available as they are part of an ongoing study.

Conflicts of Interest

The authors declare no conflict of interest.

References

  1. Liu, C.; Xu, W.; Li, A.; Sun, D.; Huo, H. Energy Balance Evaluation and Optimization of Photovoltaic Systems for Zero Energy Residential Buildings in Different Climate Zones of China. J. Clean. Prod. 2019, 235, 1202–1215. [Google Scholar] [CrossRef]
  2. Zhang, X.; Wang, A.; Tian, Z.; Li, Y.; Zhu, S.; Shi, X.; Jin, X.; Zhou, X.; Wei, S. Methodology for Developing Economically Efficient Strategies for Net Zero Energy Buildings: A Case Study of a Prototype Building in the Yangtze River Delta, China. J. Clean. Prod. 2021, 320, 128849. [Google Scholar] [CrossRef]
  3. D’Oca, S.; Hong, T.; Langevin, J. The Human Dimensions of Energy Use in Buildings: A Review. Renew. Sustain. Energy Rev. 2018, 81, 731–742. [Google Scholar] [CrossRef]
  4. Mavromatidis, G.; Orehounig, K.; Richner, P.; Carmeliet, J. Corrigendum to “A Strategy for Reducing CO2 Emissions from Buildings with the Kaya Identity-A Swiss Energy System Analysis and a Case Study”. Energy Policy 2016, 98, 470. [Google Scholar] [CrossRef]
  5. Liu, Z.; Zhou, Q.; Tian, Z.; He, B.; Jin, G. A Comprehensive Analysis on Definitions, Development, and Policies of Nearly Zero Energy Buildings in China. Renew. Sustain. Energ. Rev. 2019, 114, 109314. [Google Scholar] [CrossRef]
  6. Sun, X.; Gou, Z.; Lau, S.S.-Y. Cost-Effectiveness of Active and Passive Design Strategies for Existing Building Retrofits in Tropical Climate: Case Study of a Zero Energy Building. J. Clean. Prod. 2018, 183, 35–45. [Google Scholar] [CrossRef]
  7. Li, J.; Xu, W.; Cui, P.; Qiao, B.; Wu, S.; Zhao, C. Research on a Systematical Design Method for Nearly Zero-Energy Buildings. Sustainability 2019, 11, 7032. [Google Scholar] [CrossRef]
  8. Elnagar, E.; Köhler, B. Reduction of the Energy Demand with Passive Approaches in Multifamily Nearly Zero-Energy Buildings under Different Climate Conditions. Front. Energy Res. 2020, 8, 545272. [Google Scholar] [CrossRef]
  9. Rodriguez-Ubinas, E.; Montero, C.; Porteros, M.; Vega, S.; Navarro, I.; Castillo-Cagigal, M.; Matallanas, E.; Gutierrez, A. Passive Design Strategies and Performance of Net Energy Plus Houses. Energy Build. 2014, 83, 10–22. [Google Scholar] [CrossRef]
  10. Wang, S.; Shi, F.; Zhang, B.; Zheng, J. The Passive Design Strategies and Energy Performance of a Zero-Energy Solar House: Sunny Inside in Solar Decathlon China 2013. J. Asian Archit. Build. Eng. 2016, 15, 543–548. [Google Scholar] [CrossRef]
  11. Lee, S.; Park, S. A Study on Economic Evaluation of Design Elements of Zero-Energy Buildings According to Energy Consumption and Production. Appl. Sci. 2023, 13, 7309. [Google Scholar] [CrossRef]
  12. Borrallo-Jiménez, M.; LopezDeAsiain, M.; Esquivias, P.M.; Delgado-Trujillo, D. Comparative Study between the Passive House Standard in Warm Climates and Nearly Zero Energy Buildings under Spanish Technical Building Code in a Dwelling Design in Seville, Spain. Energy Build. 2022, 254, 111570. [Google Scholar] [CrossRef]
  13. Cillari, G.; Fantozzi, F.; Franco, A. Passive Solar Solutions for Buildings: Criteria and Guidelines for a Synergistic Design. Appl. Sci. 2021, 11, 376. [Google Scholar] [CrossRef]
  14. Lee, S.; Park, S. Zero-Energy Building Integrated Planning Methodology for Office Building Considering Passive and Active Environmental Control Method. Appl. Sci. 2021, 11, 3686. [Google Scholar] [CrossRef]
  15. Alghamdi, A.S. Performance Enhancement of Roof-Mounted Photovoltaic System: Artificial Neural Network Optimization of Ground Coverage Ratio. Energies 2021, 14, 1537. [Google Scholar] [CrossRef]
  16. Kotsiantis, S.B.; Zaharakis, I.D.; Pintelas, P.E. Machine Learning: A Review of Classification and Combining Techniques. Artif. Intell. Rev. 2006, 26, 159–190. [Google Scholar] [CrossRef]
  17. Xu, W.; Peng, H.; Zeng, X.; Zhou, F.; Tian, X.; Peng, X. A Hybrid Modelling Method for Time Series Forecasting Based on a Linear Regression Model and Deep Learning. Appl. Intell. 2019, 49, 3002–3015. [Google Scholar] [CrossRef]
  18. Cholewa, T.; Siuta-Olcha, A.; Smolarz, A.; Muryjas, P.; Wolszczak, P.; Anasiewicz, R.; Balaras, C.A. A Simple Building Energy Model in Form of an Equivalent Outdoor Temperature. Energy Build. 2021, 236, 110766. [Google Scholar] [CrossRef]
  19. Blockeel, H.; Devos, L.; Frénay, B.; Nanfack, G.; Nijssen, S. Decision Trees: From Efficient Prediction to Responsible AI. Front. Artif. Intell. 2023, 6, 1124553. [Google Scholar] [CrossRef]
  20. Ouyang, X.; Zhou, T. Imperfect-Information Game AI Agent Based on Reinforcement Learning Using Tree Search and a Deep Neural Network. Electronics 2023, 12, 2453. [Google Scholar] [CrossRef]
  21. Shan, R.; Xiao, X.; Che, J.; Du, J.; Li, Y. Data Mining Optimization Software and Its Application in Financial Audit Data Analysis. Mob. Inf. Syst. 2022, 2022, 6851616. [Google Scholar] [CrossRef]
  22. Zeng, A.; Ho, H.; Yu, Y. Prediction of Building Electricity Usage Using Gaussian Process Regression. J. Build. Eng. 2020, 28, 101054. [Google Scholar] [CrossRef]
  23. Yu, Z.; Haghighat, F.; Fung, B.C.M.; Yoshino, H. A Decision Tree Method for Building Energy Demand Modeling. Energy Build. 2010, 42, 1637–1646. [Google Scholar] [CrossRef]
  24. Mariano-Hernández, D.; Hernández-Callejo, L.; Solís, M.; Zorita-Lamadrid, A.; Duque-Pérez, O.; Gonzalez-Morales, L.; García, F.S.; Jaramillo-Duque, A.; Ospino-Castro, A.; Alonso-Gómez, V.; et al. Analysis of the Integration of Drift Detection Methods in Learning Algorithms for Electrical Consumption Forecasting in Smart Buildings. Sustainability 2022, 14, 5857. [Google Scholar] [CrossRef]
  25. Mikučionienė, R.; Martinaitis, V.; Keras, E. Evaluation of Energy Efficiency Measures Sustainability by Decision Tree Method. Energy Build. 2014, 76, 64–71. [Google Scholar] [CrossRef]
  26. Hosseini, S.; Fard, R.H. Machine Learning Algorithms for Predicting Electricity Consumption of Buildings. Wirel. Pers. Commun. 2021, 121, 3329–3341. [Google Scholar] [CrossRef]
  27. Smarra, F.; Di Girolamo, G.D.; De Iuliis, V.; Jain, A.; Mangharam, R.; D’Innocenzo, A. Data-Driven Switching Modeling for MPC Using Regression Trees and Random Forests. Nonlinear Anal. Hybrid Syst. 2020, 36, 100882. [Google Scholar] [CrossRef]
  28. Kim, Y.-J.; Lee, S.-J.; Jin, H.-S.; Suh, I.-A.; Song, S.-Y. Comparison of Linear and Nonlinear Statistical Models for Analyzing Determinants of Residential Energy Consumption. Energy Build. 2020, 223, 110226. [Google Scholar] [CrossRef]
  29. Rasiulis, R.; Ustinovichius, L.; Vilutienė, T.; Popov, V. Decision model for selection of modernization measures: Public building case. J. Civ. Eng. Manag. 2015, 22, 124–133. [Google Scholar] [CrossRef]
  30. Gulliford, M.J.S.; Orlebar, R.H.; Bird, M.H.; Acha, S.; Shah, N. Developing a Dynamic Carbon Benchmarking Method for Large Building Property Estates. Energy Build. 2022, 256, 111683. [Google Scholar] [CrossRef]
  31. Fernandez-Ceniceros, J.; Fernandez-Martinez, R.; Fraile-Garcia, E.; Martinez-de-Pison, F.J. Decision Support Model for One-Way Floor Slab Design: A Sustainable Approach. Autom. Constr. 2013, 35, 460–470. [Google Scholar] [CrossRef]
  32. Tariq, R.; Torres-Aguilar, C.E.; Sheikh, N.A.; Ahmad, T.; Xamán, J.; Bassam, A. Data Engineering for Digital Twining and Optimization of Naturally Ventilated Solar Façade with Phase Changing Material under Global Projection Scenarios. Renew. Energy 2022, 187, 1184–1203. [Google Scholar] [CrossRef]
  33. Tariq, R.; Bassam, A.; Orozco-del-Castillo, M.G.; Ricalde, L.J.; Carvente, O. Sustainability Framework of Intelligent Social Houses with a Synergy of Double-Façade Architecture and Active Air Conditioning Systems. Energy Convers. Manag. 2023, 288, 117120. [Google Scholar] [CrossRef]
  34. Hong, G.; Choi, G.-S.; Eum, J.-Y.; Lee, H.S.; Kim, D.D. The Hourly Energy Consumption Prediction by KNN for Buildings in Community Buildings. Buildings 2022, 12, 1636. [Google Scholar] [CrossRef]
  35. Ma, Z.; Ye, C.; Li, H.; Ma, W. Applying Support Vector Machines to Predict Building Energy Consumption in China. Energy Procedia 2018, 152, 780–786. [Google Scholar] [CrossRef]
  36. Jeong, K.; Hong, T.; Chae, M.; Kim, J. Development of a Decision Support Model for Determining the Target Multi-Family Housing Complex for Green Remodeling Using Data Mining Techniques. Energy Build. 2019, 202, 109401. [Google Scholar] [CrossRef]
  37. Lin, M.; Afshari, A.; Azar, E. A Data-Driven Analysis of Building Energy Use with Emphasis on Operation and Maintenance: A Case Study from the UAE. J. Clean. Prod. 2018, 192, 169–178. [Google Scholar] [CrossRef]
  38. Motaghifard, A.; Omidvari, M.; Kazemi, A. Forecasting of Safe-Green Buildings Using Decision Tree Algorithm: Data Mining Approach. Environ. Dev. Sustain. 2023, 25, 10323–10350. [Google Scholar] [CrossRef]
  39. Namazkhan, M.; Albers, C.; Steg, L. A Decision Tree Method for Explaining Household Gas Consumption: The Role of Building Characteristics, Socio-Demographic Variables, Psychological Factors and Household Behaviour. Renew. Sustain. Energy Rev. 2020, 119, 109542. [Google Scholar] [CrossRef]
  40. Capozzoli, A.; Grassi, D.; Causone, F. Estimation Models of Heating Energy Consumption in Schools for Local Authorities Planning. Energy Build. 2015, 105, 302–313. [Google Scholar] [CrossRef]
  41. Pachauri, N.; Ahn, C.W. Regression Tree Ensemble Learning-Based Prediction of the Heating and Cooling Loads of Residential Buildings. Build. Simul. 2022, 15, 2003–2017. [Google Scholar] [CrossRef]
  42. Albooyeh, A.; Soleymani, P.; Taghipoor, H. Evaluation of the Mechanical Properties of Hydroxyapatite-Silica Aerogel/Epoxy Nanocomposites: Optimizing by Response Surface Approach. J. Mech. Behav. Biomed. Mater. 2022, 136, 105513. [Google Scholar] [CrossRef] [PubMed]
  43. Strobl, C.; Malley, J.; Tutz, G. An Introduction to Recursive Partitioning: Rationale, Application, and Characteristics of Classification and Regression Trees, Bagging, and Random Forests. Psychol. Methods 2009, 14, 323–348. [Google Scholar] [CrossRef] [PubMed]
  44. Weka 3-Data Mining with Open Source Machine Learning Software in Java. Available online: https://www.cs.waikato.ac.nz/ml/weka/ (accessed on 3 November 2023).
  45. Yu, S.; Li, X.; Wang, H.; Zhang, X.; Chen, S. C_CART: An Instance Confidence-Based Decision Tree Algorithm for Classification. Intell. Data Anal. 2021, 25, 929–948. [Google Scholar] [CrossRef]
  46. Zhou, H.; Zhang, J.; Zhou, Y.; Guo, X.; Ma, Y. A Feature Selection Algorithm of Decision Tree Based on Feature Weight. Expert Syst. Appl. 2021, 164, 113842. [Google Scholar] [CrossRef]
  47. Reddy, B.H.; Karthikeyan, P.R. Classification of Fire and Smoke Images Using Decision Tree Algorithm in Comparison with Logistic Regression to Measure Accuracy, Precision, Recall, F-Score. In Proceedings of the 2022 14th International Conference on Mathematics, Actuarial Science, Computer Science and Statistics (MACS), Karachi, Pakistan, 12 November 2022; IEEE: New Hoboken, NJ, USA, 2022; pp. 1–5. [Google Scholar]
  48. Solar Decathlon China. Available online: https://scoring.sdchina.org.cn/ (accessed on 10 November 2022).
  49. Yao, G.; Chen, Y.; Lin, Y.; Wang, Y. Energy-Saving Design Strategies of Zero-Energy Solar Buildings—A Case Study of the Third Solar Decathlon China. Buildings 2023, 13, 405. [Google Scholar] [CrossRef]
  50. Iordanis, I.; Koukouvinos, C.; Silou, I. Classification Accuracy Improvement Using Conditioned Latin Hypercube Sampling in Supervised Machine Learning. In Proceedings of the 2022 12th International Conference on Dependable Systems, Services and Technologies (DESSERT), Athens, Greece, 9 December 2022; IEEE: New Hoboken, NJ, USA, 2022; pp. 1–5. [Google Scholar] [CrossRef]
Figure 1. Research framework diagram.
Energies 17 00506 g001
Figure 2. The main process of the decision tree model.
Energies 17 00506 g002
Figure 3. Decision tree branch description.
Energies 17 00506 g003
Figure 4. Sample case photos.
Energies 17 00506 g004
Figure 5. Classification of type variables and their proportion in the sample.
Energies 17 00506 g005
Figure 6. Data parameter box diagram.
Energies 17 00506 g006
Figure 7. Data sampling interface of simlab software.
Energies 17 00506 g007
Figure 8. Performance evaluation roadmap.
Energies 17 00506 g008
Figure 9. Rhino modeling screenshot.
Energies 17 00506 g009
Figure 10. Decision tree settings in WEKA software.
Energies 17 00506 g010
Figure 11. Global decision tree model.
Energies 17 00506 g011
Figure 12. Global decision tree feature weight graph.
Energies 17 00506 g012
Table 1. Technical highlights table.
StrategiesHighlights
Green humanistic designSustainable Development Goals, urban high-density housing, new rural construction, epidemic and postdisaster emergency response, Winter Olympics services, aging housing, grassland culture, indoor nature
Modularization and rapid constructionIntegrated design units, multifunctional transformation space and courtyard, wall construction and HVAC integration system, core technology tube
New materialsETFT film, SST exterior wall, SIPs exterior wall, composite bamboo components, waste compression polymer wall, polycarbonate ceiling
Renewable energy utilizationSolar, wind, hydrogen, geothermal
Integrated systemwind power and photovoltaic complementary integration system, integrated wall and water treatment system integration, DC electrical and household energy storage integration system, Stirling motor solar power generation system
Smart InternetIntelligent interactive home, intelligent interactive office, virtual tourism and cultural experience, prefabrication and customization of houses based on online menus, health management system, intelligent interconnection between electric vehicles and houses
Table 2. Summary table of passive design strategies.
Sub-StrategyDesign ElementsVariableData TypeRange
Passive
Design
Strategy
Dimension parametersPlanar Gestalt Shape LengthX1Numerical Data 10.8–18
Planar Gestalt WidthX2Numerical Data 7.2–19.4
Height X3Numerical Data 3.3–8.4
Envelope structure parametersHeat transfer coefficient—wallX4Numerical Data 0.11–0.37
Heat transfer coefficient—floorX5Numerical Data 0.11–1.6
Heat transfer coefficient—roofX6Numerical Data 0.19–2.6
Heat transfer coefficient—glassX7Numerical Data 0.19–2.6
Window-to-wall ratio—eastX8Numerical Data 0–0.7
Window-to-wall ratio—southX9Numerical Data 0.18–0.79
Window-to-wall ratio—westX10Numerical Data 0–0.8
Window-to-wall ratio—northX11Numerical Data 0–0.74
Form factor Functional form X12Classification data1–3
Planar formX13Classification data1–4
Roof form X14Classification data1–7
Framework form X15Classification data1–2
Table 3. Dimension parameters feature weight.
Sub-StrategyDesign ElementsWeight Value
Dimension parametersLength (X1)0.564
Width (X2)0.088
Height (X3)0.348
Table 4. Envelope structure parameters feature weight.
SchemeDesign ElementsWeight Value
Envelope structure parametersHeat transfer coefficient—wall (X4)0.016
Heat transfer coefficient—floor (X5)0.151
Heat transfer coefficient—roof (X6)0.173
Heat transfer coefficient—glass (X7)0.145
Window-to-wall ratio—east (X8)0.092
Window-to-wall ratio—south (X9)0.156
Window-to-wall ratio—west (X10)0.267
Window-to-wall ratio—north (X11)0.000
Table 5. Form factor feature weight.
Sub-StrategyDesign ElementsWeight Value
Form factorPlanar form (X12)0.116
Roof form (X13)0.287
Framework (X14)0.499
Framework form (X15)0.098
Table 6. Sub-strategy model evaluation data table.
Parameter NameDimension ParametersEnvelope Structure ParametersForm Factor
Accuracy77.500%80.00065.000
Precision71.216%78.90663.929
Recall77.500%80.00065.000
F-score0.7420.7920.643
Table 7. Decision rule table for leaf nodes.
NumberDecision Rule
1If X1 ≤ 15.005 and X10 ≤ 0.155, and X9 ≤ 0.26 and X14 ≤ 3.5, then EUI is LOW
2If X1 ≤ 15.005 and X10 ≤ 0.155, and X9 > 0.26, and X4 ≤ 0.31 and X5 ≤ 0.53, then EUI is LOW
3If X1 ≤ 15.005 and X10 ≤ 0.155, and X9 ≤ 0.26, and X4 > 0.31 and X5 > 0.455, then EUI is LOW
4If X1 ≤ 15.005 and X10 ≥ 0.155, and X5 > 0.305, then EUI is HIGH
5If X1 > 15.005, X3 ≤ 5.965, X8 ≤ 0.205, and X11 > 0.165, then EUI is HIGH
6If X1 > 15.005, X3 > 5.965, X6 ≤ 0.155, and X5 > 0.385, then EUI is HIGH
7If X1 > 15.005, X3 > 5.965, and X6 > 0.155, then EUI is LOW
Table 8. Global decision tree confusion matrix.
a = HIGHb = LOW
377a = HIGH
6150b = LOW
Table 9. Sub-strategy model evaluation data table.
ClassTP RateFP RatePrecisionRecallF-Score
HIGH0.8410.0380.860.8410.851
LOW0.9620.1590.9550.9620.958
Average0.9350.1330.9350.9350.935
Disclaimer/Publisher’s Note: The statements, opinions and data contained in all publications are solely those of the individual author(s) and contributor(s) and not of MDPI and/or the editor(s). MDPI and/or the editor(s) disclaim responsibility for any injury to people or property resulting from any ideas, methods, instructions or products referred to in the content.