Review

Electric Vehicles—An Overview of Current Issues—Part 2—Infrastructure and Road Safety

1
Faculty of Transport, Warsaw University of Technology, Koszykowa 75, 00-662 Warsaw, Poland
2
Department of Mechanical Engineering, Institute of Vehicles and Transportation, Military University of Technology (WAT), Street gen. Sylwestra Kaliskiego 2, 00-908 Warsaw, Poland
3
Department of Automotive Engineering and Transport, Faculty of Mechatronics and Mechanical Engineering, Kielce University of Technology, Ave. Tysiąclecia Państwa Polskiego 7, 25-314 Kielce, Poland
*
Author to whom correspondence should be addressed.
Energies 2024, 17(2), 495; https://doi.org/10.3390/en17020495
Submission received: 14 September 2023 / Revised: 20 October 2023 / Accepted: 15 January 2024 / Published: 19 January 2024
(This article belongs to the Section E: Electric Vehicles)

Abstract

:
The electrification of road transport is developing dynamically around the world. Many automotive companies are introducing electric vehicles to the market, and their popularity is constantly growing. The increasing popularity of electric vehicles is caused by individual countries’ governments encouraging people to switch to electric vehicles and their lower operating costs. In 2022, the number of electric vehicles in China will exceed 10 million. Europe and the USA rank second and third in global electric car stock, respectively. The number of available electric vehicle models is constantly growing, remaining approximately 2.5 times smaller than the case of vehicles with an internal combustion engine. Among others, a significant limitation to the popularity of electric cars is users’ fear of range and the density of the charging infrastructure network. This paper presents the objectives regarding public areas and charging stations around the European Union’s comprehensive and core transport network. It is worth noting that the vehicle and charging point’s charging connectors vary depending on the geographical region. Therefore, the currently used charging connectors for different regions are presented. Charging time depends significantly on the charging current, the power of the charging point, and the devices installed in the vehicle. The paper analyzes the limitations of charging power resulting from the onboard charger’s power and the charging point’s power. It presents the charging time of selected electric vehicles. The second aspect that is also the subject of user concerns and discussed in this article is issues related to the safety of electric vehicles. General safety indicators of such vehicles based on Euro-NCAP tests are characterized. Attention was also paid to more detailed problems related to active and passive safety and functional safety analyses. The issue of the fire hazard of electric vehicles was discussed together with modern experiences regarding post-accident procedures in the event of fires.

1. Introduction

The use of electric drive-in motor vehicles is not a new idea. The pioneer of electric vehicles was Thomas Devenport, who, in 1834, built a small car powered by a voltaic battery [1]. The development of the lead-acid battery in 1859 by Gaston Planté and the construction of the generator in 1866 by Warner von Siemens significantly impacted the development of motor vehicles. The first efficient electric vehicle was a tricycle developed by Percy and Ayton in 1882, powered by batteries weighing about 45 kg. The operation of electric vehicles at that time, compared to steam vehicles, revealed several advantages, the most important of which include quiet operation, ease of operation and driving, good dynamics, ease of installing the engine (with smaller dimensions compared to steam vehicles), and simplification of the drive system. At the end of the 19th century, electric carriages and small two-seater electric vehicles with a range of about 48 km appeared in some European cities. In 1898, an electric vehicle set a new speed record of 63.2 km/h. Electric vehicles of the time did not replace horse-drawn vehicles. The main reason was the short range of vehicles, high production costs, and the need to charge batteries with a vast mass frequently.
Electrically powered vehicles are gaining an increasing share of the passenger and commercial vehicle market. Electric vehicles include battery electric cars (BEV), vehicles in which an internal combustion engine works with an electric drive (HEV—hybrid electric vehicles, PHEV—plug-in hybrid electric vehicles), or vehicles equipped with fuel cells or electrochemical batteries (FCLE). The electric drive technology faces many challenges, but its future can be optimistic. New electric vehicle drive system technologies can significantly affect intelligent and sustainable transport development and reduce energy consumption and exhaust emissions under various road conditions [2,3,4].
This study presents the electric drives used in motor vehicles. Both the advantages of these drives and the risks arising at the stages of production, operation, and recycling of the car are indicated.
The study was divided into two parts. In Part 1, the environmental impact of EVs was assessed. Attention was focused on the entire life cycle of the vehicle, i.e., from obtaining materials through the production of assemblies and the vehicle, its operation, and disposal. The production processes of electric and conventional vehicles were compared mainly in terms of CO2 emissions. In addition, attempts were made to answer the question of how ecological is an electric vehicle. In response to this question, an analysis of the share of individual energy sources in electricity production was made, and an analysis of the energy mix was carried out for the countries of the European Union. Issues related to the recycling of EV batteries and the possibility of their reuse were discussed.
The article presented here is the 2nd part of a study with the general title “EV cars—an overview of current issues”, which deals with other issues: infrastructure and road safety.
Section 2 presents data on the number of EVs worldwide and detailed data from the EU. Indicators for the share of electric cars among the total number of passenger cars were determined. Commonly used types of connectors for charging electric vehicles, cases of connections, and charging modes were presented. Limitations on AC charging resulting from the onboard charger and charging point were analyzed. Data on the charging infrastructure along the trans-European transport network are presented.
Section 3 deals with the safety of electric vehicles. Scientific papers and selected international regulations were analyzed. An attempt was made to find an answer to the question of whether electric vehicles are more likely to catch fire than their conventional counterparts. Current problems related to the safety of high-voltage accumulator batteries were pointed out. Issues related to the procedure in the event of an electric vehicle fire and reviews of the solutions used by manufacturers and fire services that facilitate extinguishing an electric vehicle are also presented.

2. Infrastructure and its Availability across Countries

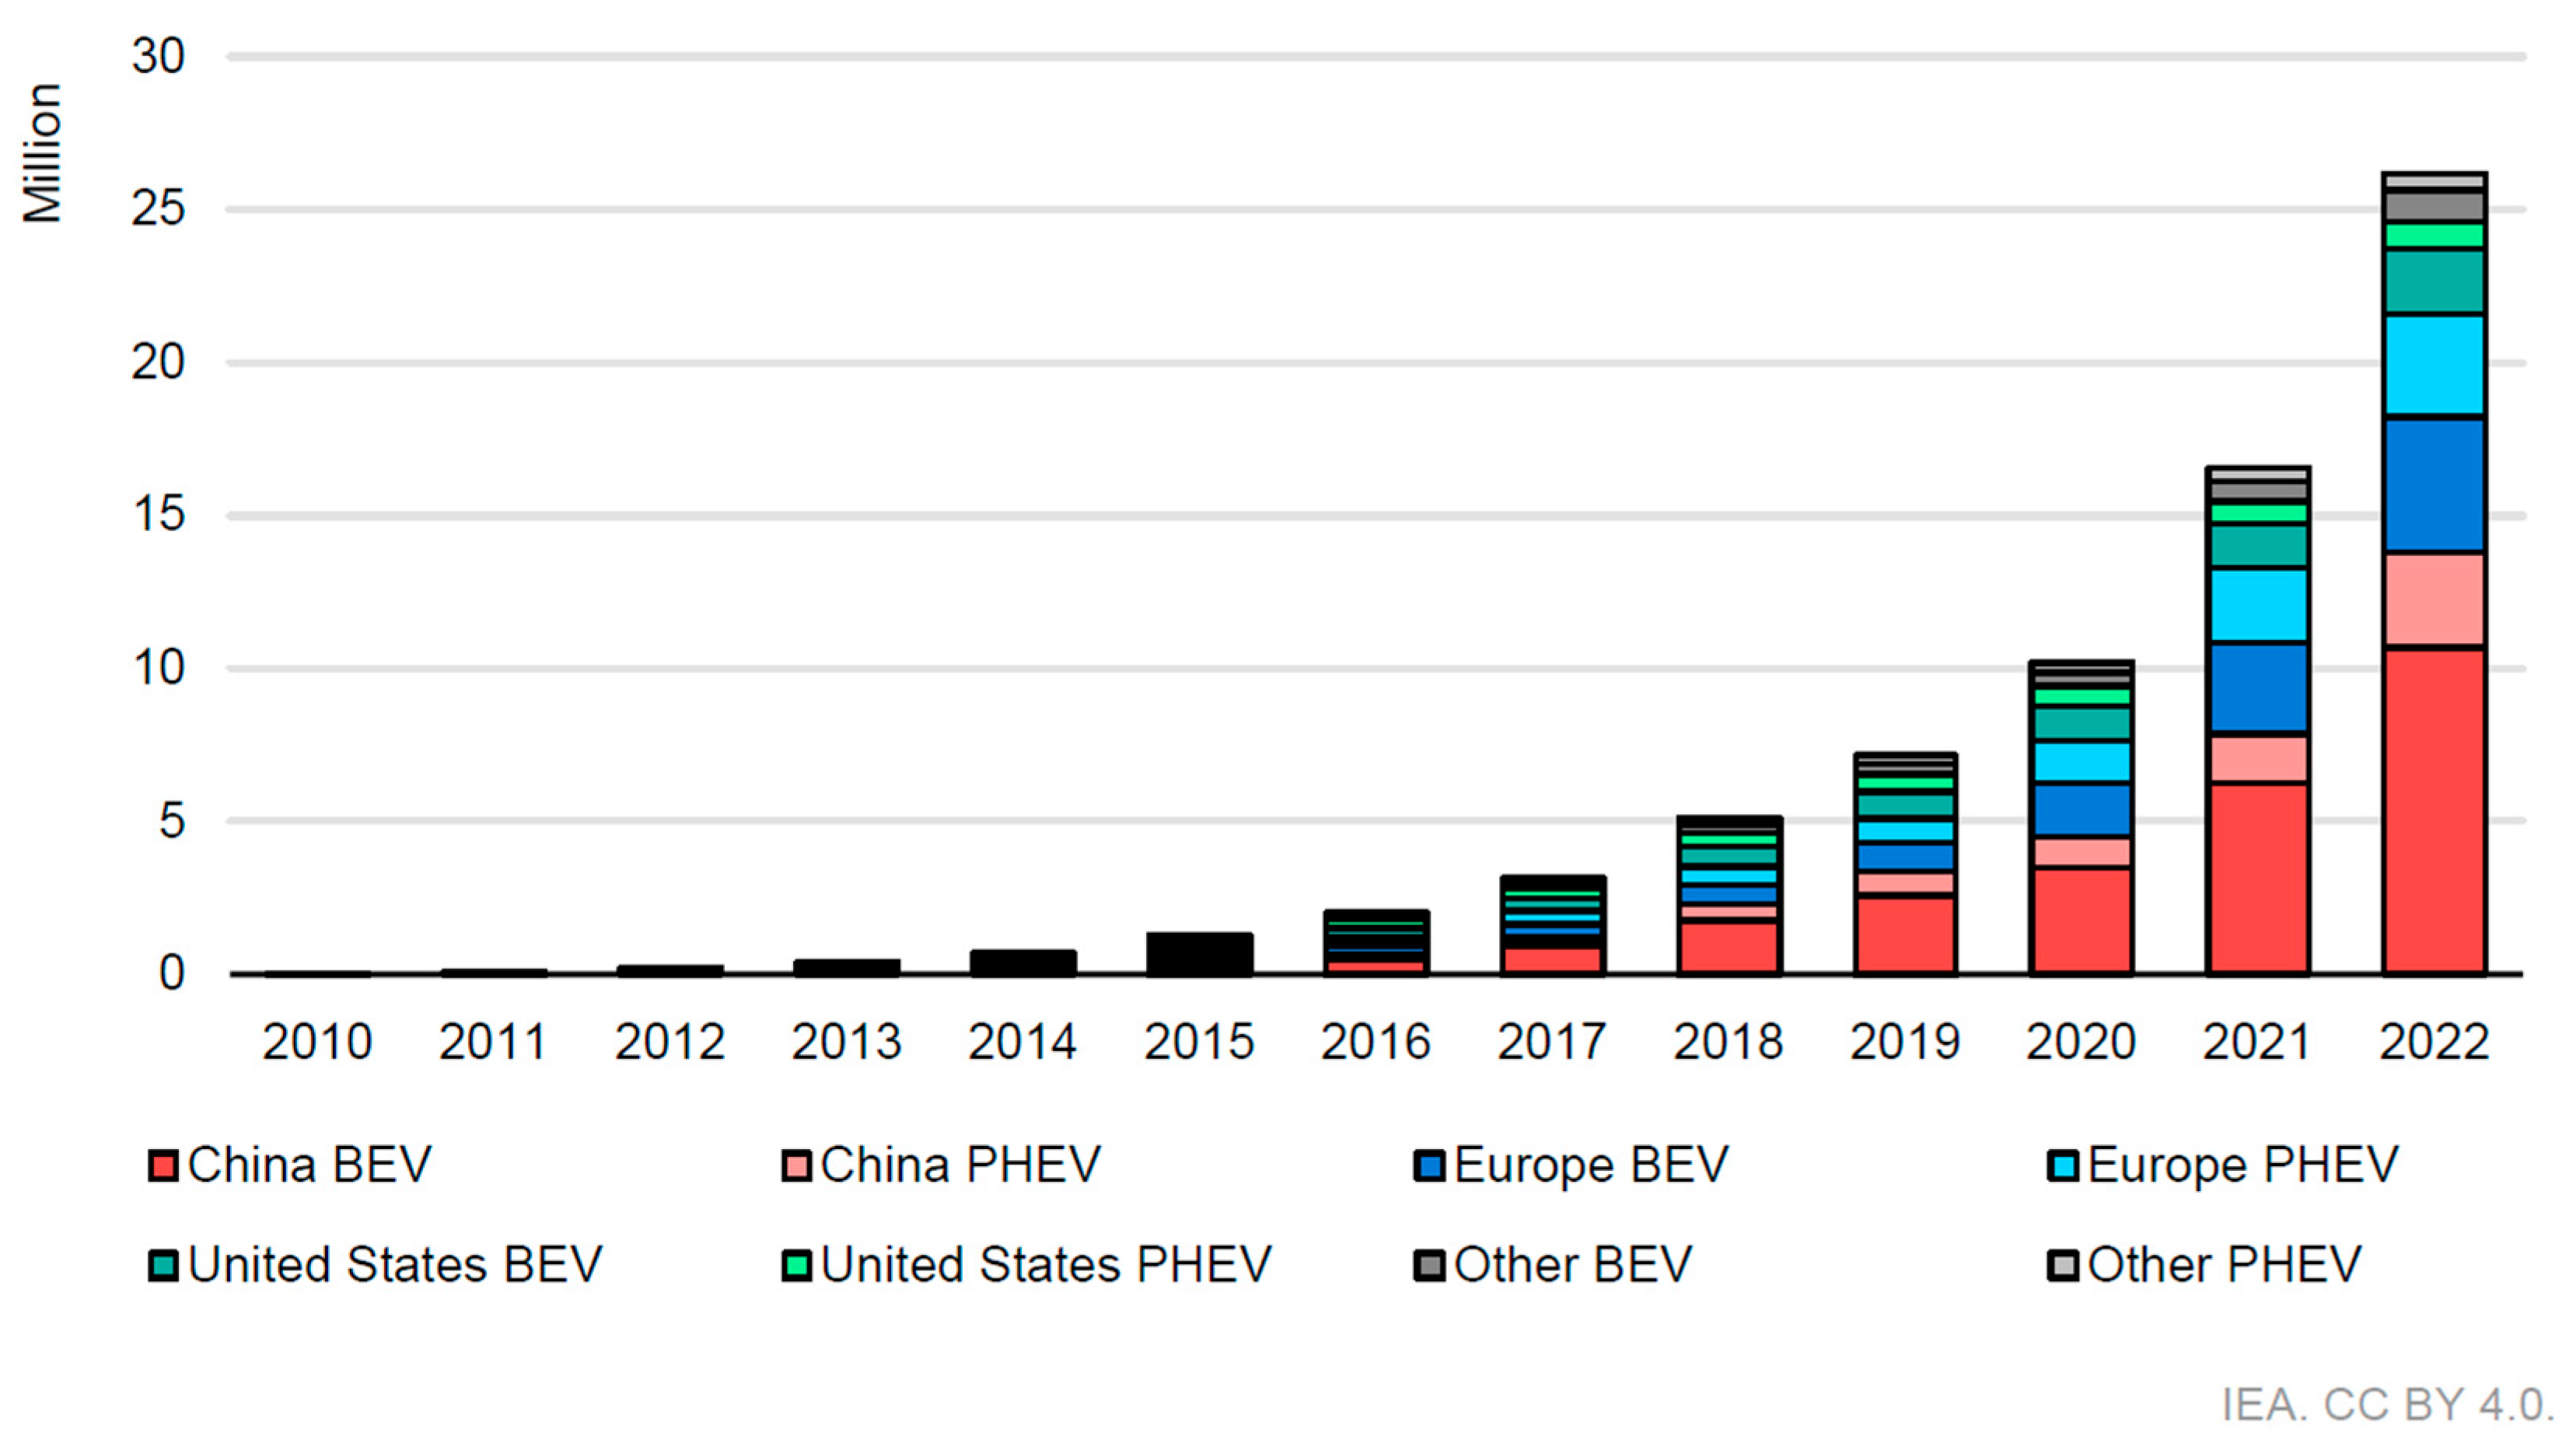
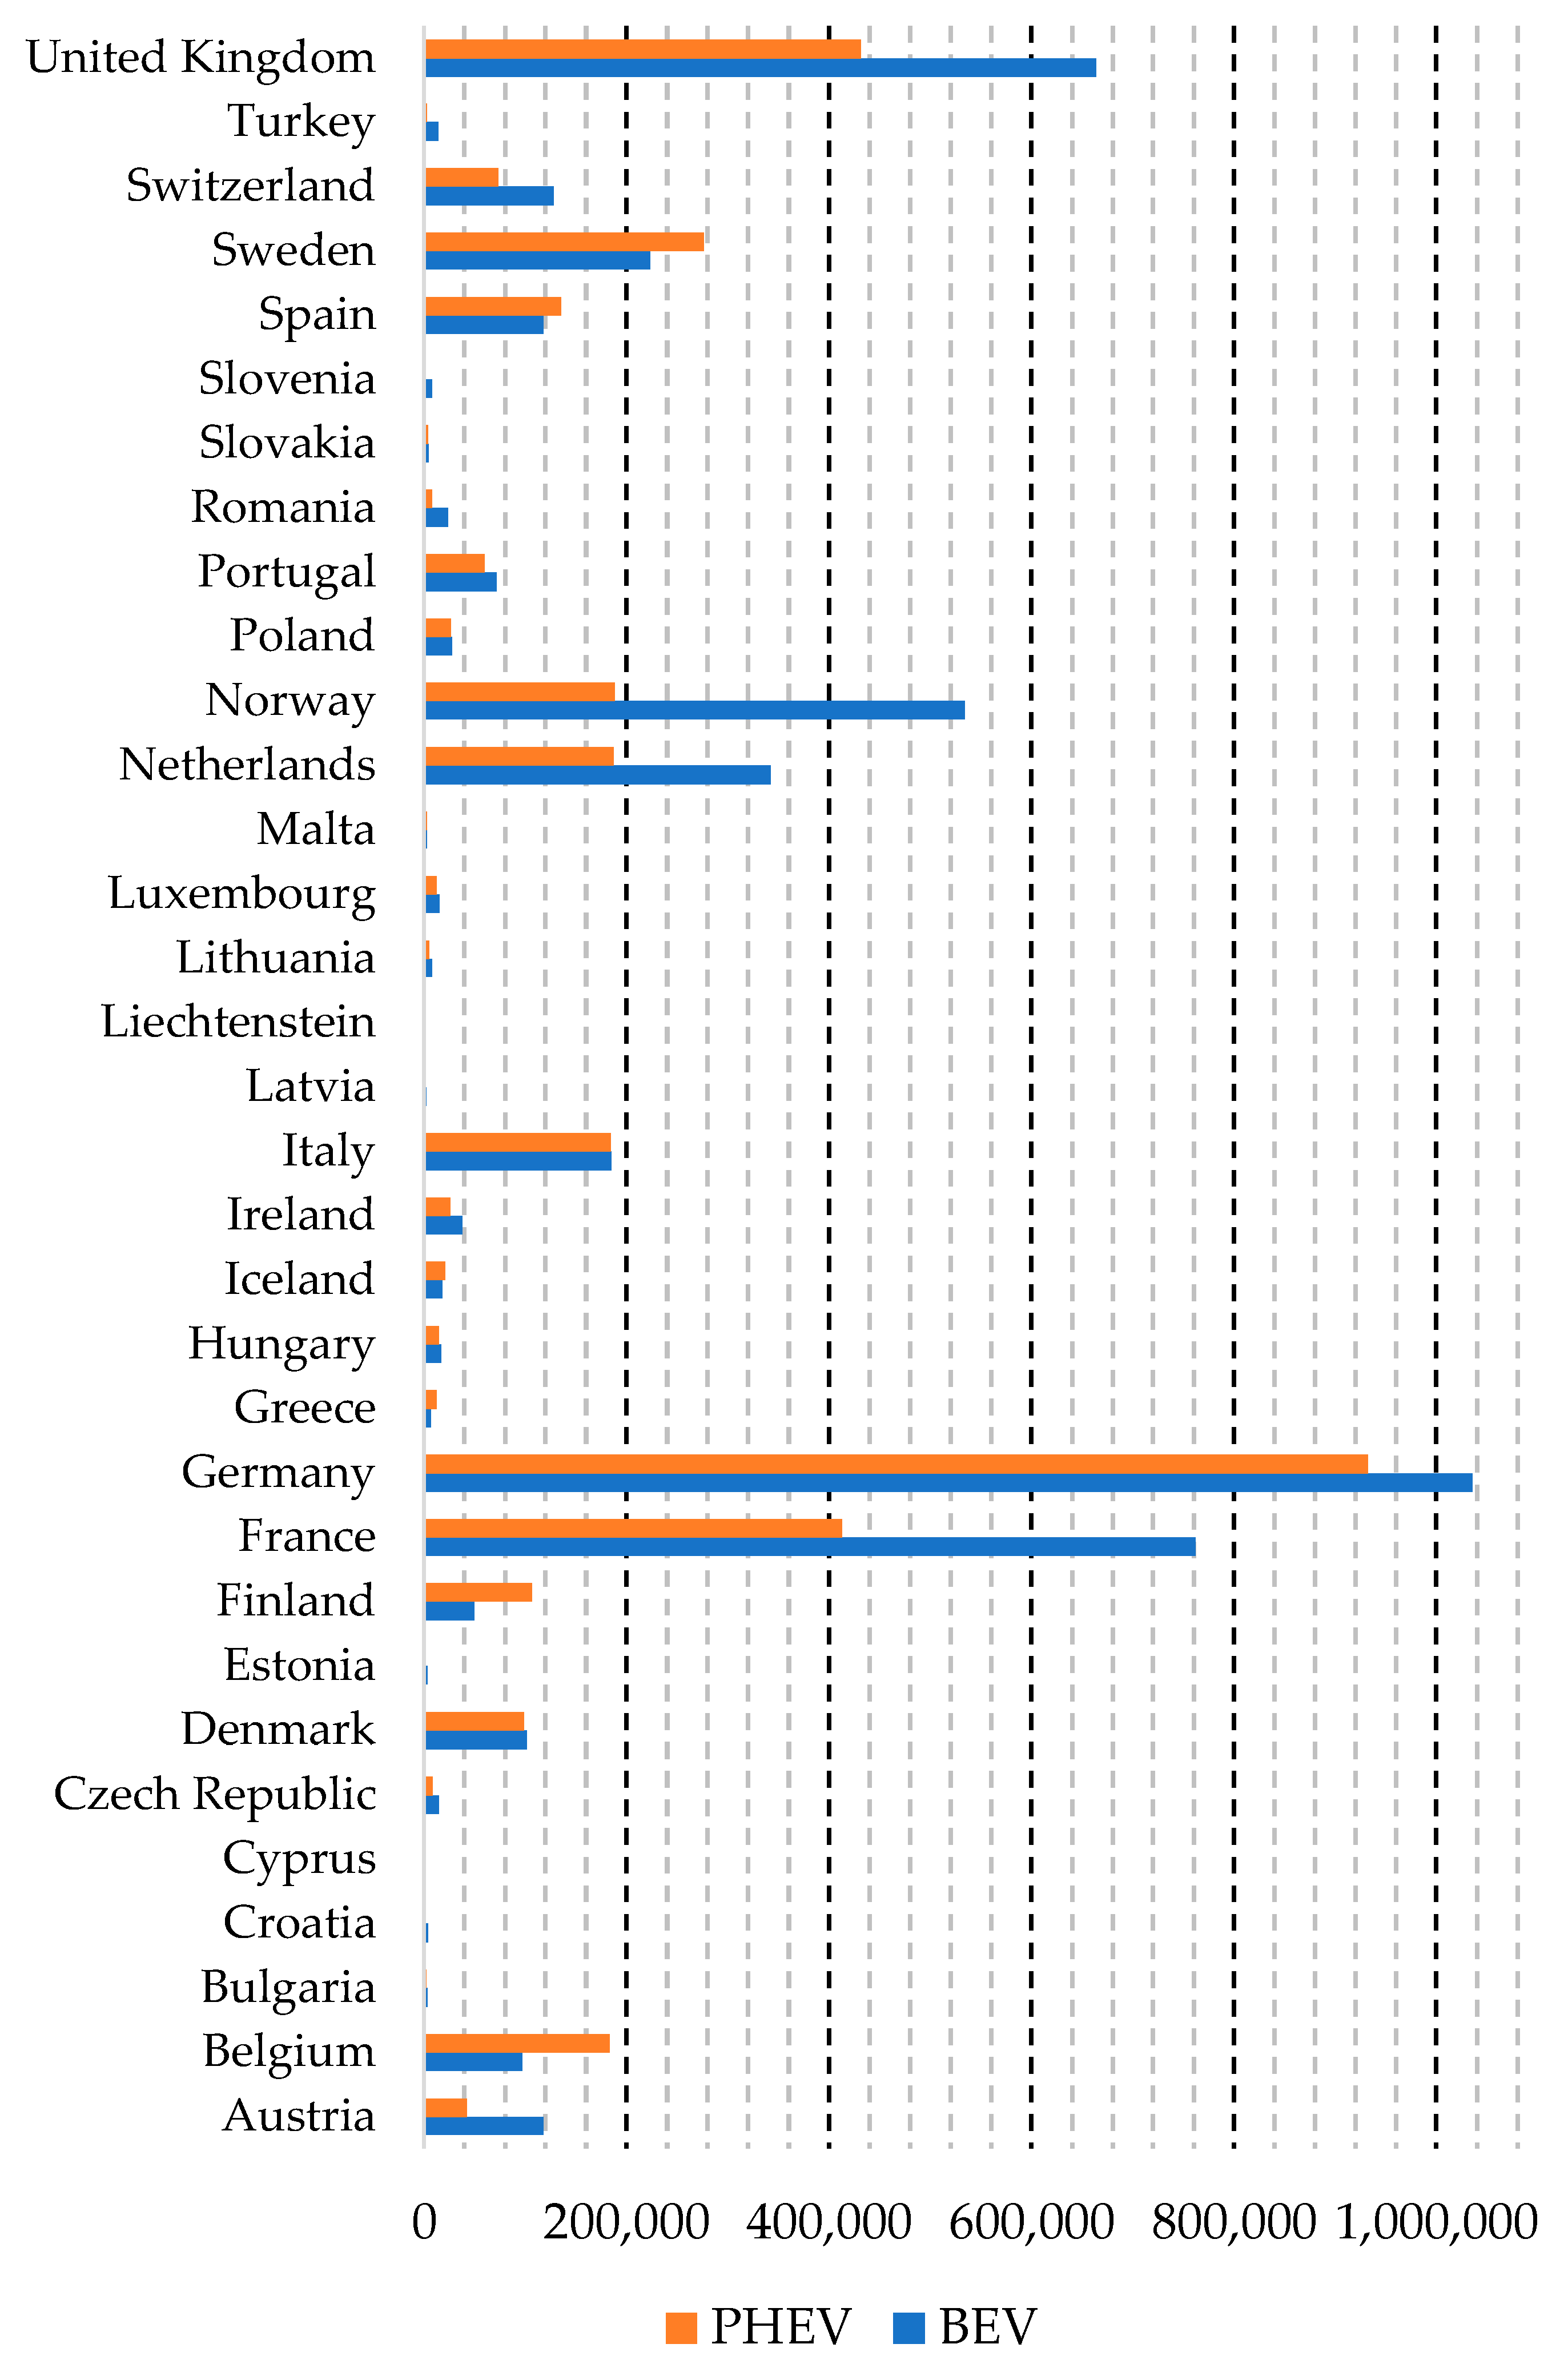
2.1. Statistical Data on the Number of Electric Vehicles Worldwide and in the EU

The Electric Vehicles Initiative (EVI) is one of many global initiatives that is dedicated to accelerating the adoption and deployment of electric vehicles worldwide. Sixteen countries have joined EVI: Canada, Chile, China, Finland, France, Germany, India, Japan, the Netherlands, New Zealand, Norway, Poland, Portugal, Sweden, the United Kingdom, and the United States (countries with a co-chair status are underlined) [5,6]. The European Commission is also involved in the activities of the EVI. The EVI publishes an annual report on the current status of electric vehicles compared to historical data, and presents forecasts for the coming years. EVI provides two free online tools: Global EV Data Explorer (electric vehicle statistics and forecasts) and Global EV Policy Explorer (policy statistics to support the deployment of electric vehicles). According to the Global EV Outlook 2023 [6], over 26 million electric light-duty vehicles (ELDVs) were on the road in 2022 (Figure 1), up 60% relative to 2021 and more than five times the stock in 2018. Additionally, global battery electric vehicles (BEVs) make up a significant share of total sales compared to plug-in hybrid electric vehicles (PHEVs).
Since 2017, the share of ELDVs in China has been constantly on the rise. In 2022, there were more than 10 million BEVs in China, more than the total number of these vehicles in use worldwide in 2020. Europe is the second largest market for electric vehicles. The United States ranks third.
In China in 2022, 4.4 million BEVs and 1.5 million PHEVs were sold in the ELDV segment, which accounted for nearly 60% of all new EV registrations worldwide [6]. In 2022, the share of electric cars among total domestic car sales reached 29% in China, reaching its 2025 national target of a 20% sales share for so-called new energy vehicles (NEVs = BEVs, PHEVs and fuel cell electric vehicles).
In the EVI annual report, Europe accounts for the European Union countries, Norway, United Kingdom, Iceland, Israel, Switzerland, and Turkey [6,7]. The EV share of new passenger car sales in 2022 reached 21% and 29% in EU-27 and Europe, respectively. Back in 2018, the EV share was only 1.9% and 2.3%, respectively [6]. A significant increase in sales of passenger EVs has been observed since 2020, when 750,000 BEVs and 630,000 PHEVs were sold. In 2022, these figures increased to 1.6 million BEVs and 1.0 million PHEVs. A total of 800,000 BEVs and 190,000 PHEVs were sold in the USA in 2022, which accounted for a 7.7% share of the total sales of new passenger cars [6].
The number of EV models available was also growing (Figure 2); there were 500 different models in 2022, four times the number than in 2016 [6]. This trend reflects the level of maturity of the EV market and the manufacturers’ response to the growing customer demand and national and international regulations. The number of internal combustion engine (ICE) vehicle models has been steadily decreasing since 2016, but is still several times higher than the number of EV models. Globally, consumers most often choose large vehicles (SUVs) from among the available EVs and ICE passenger cars. Electric two- and three-wheelers prevail only in emerging markets and developing economies [6]. As forecasted in [6], EV sales are projected to reach approx. 20–30 million by 2025 and at least twice that number by 2030.
The construction and density of the EV charging infrastructure per EV registered in the given country significantly restricts the popularity of electric vehicles. At the same time, the number and share of electric vehicles vary significantly across countries (refer to Figure 3) and are apparently closely correlated with governmental policies, the wealth of potential customers, EV range, and the diversity and availability of EV service and charging infrastructure (refer to Table 1).
Table 1 lists the number of passenger EVs and the total number of cars (TPCs) in Europe. Places where the EV to TPC ratio exceeds 1% are marked orange. Norway is the European leader in passenger electric vehicles by stock share.

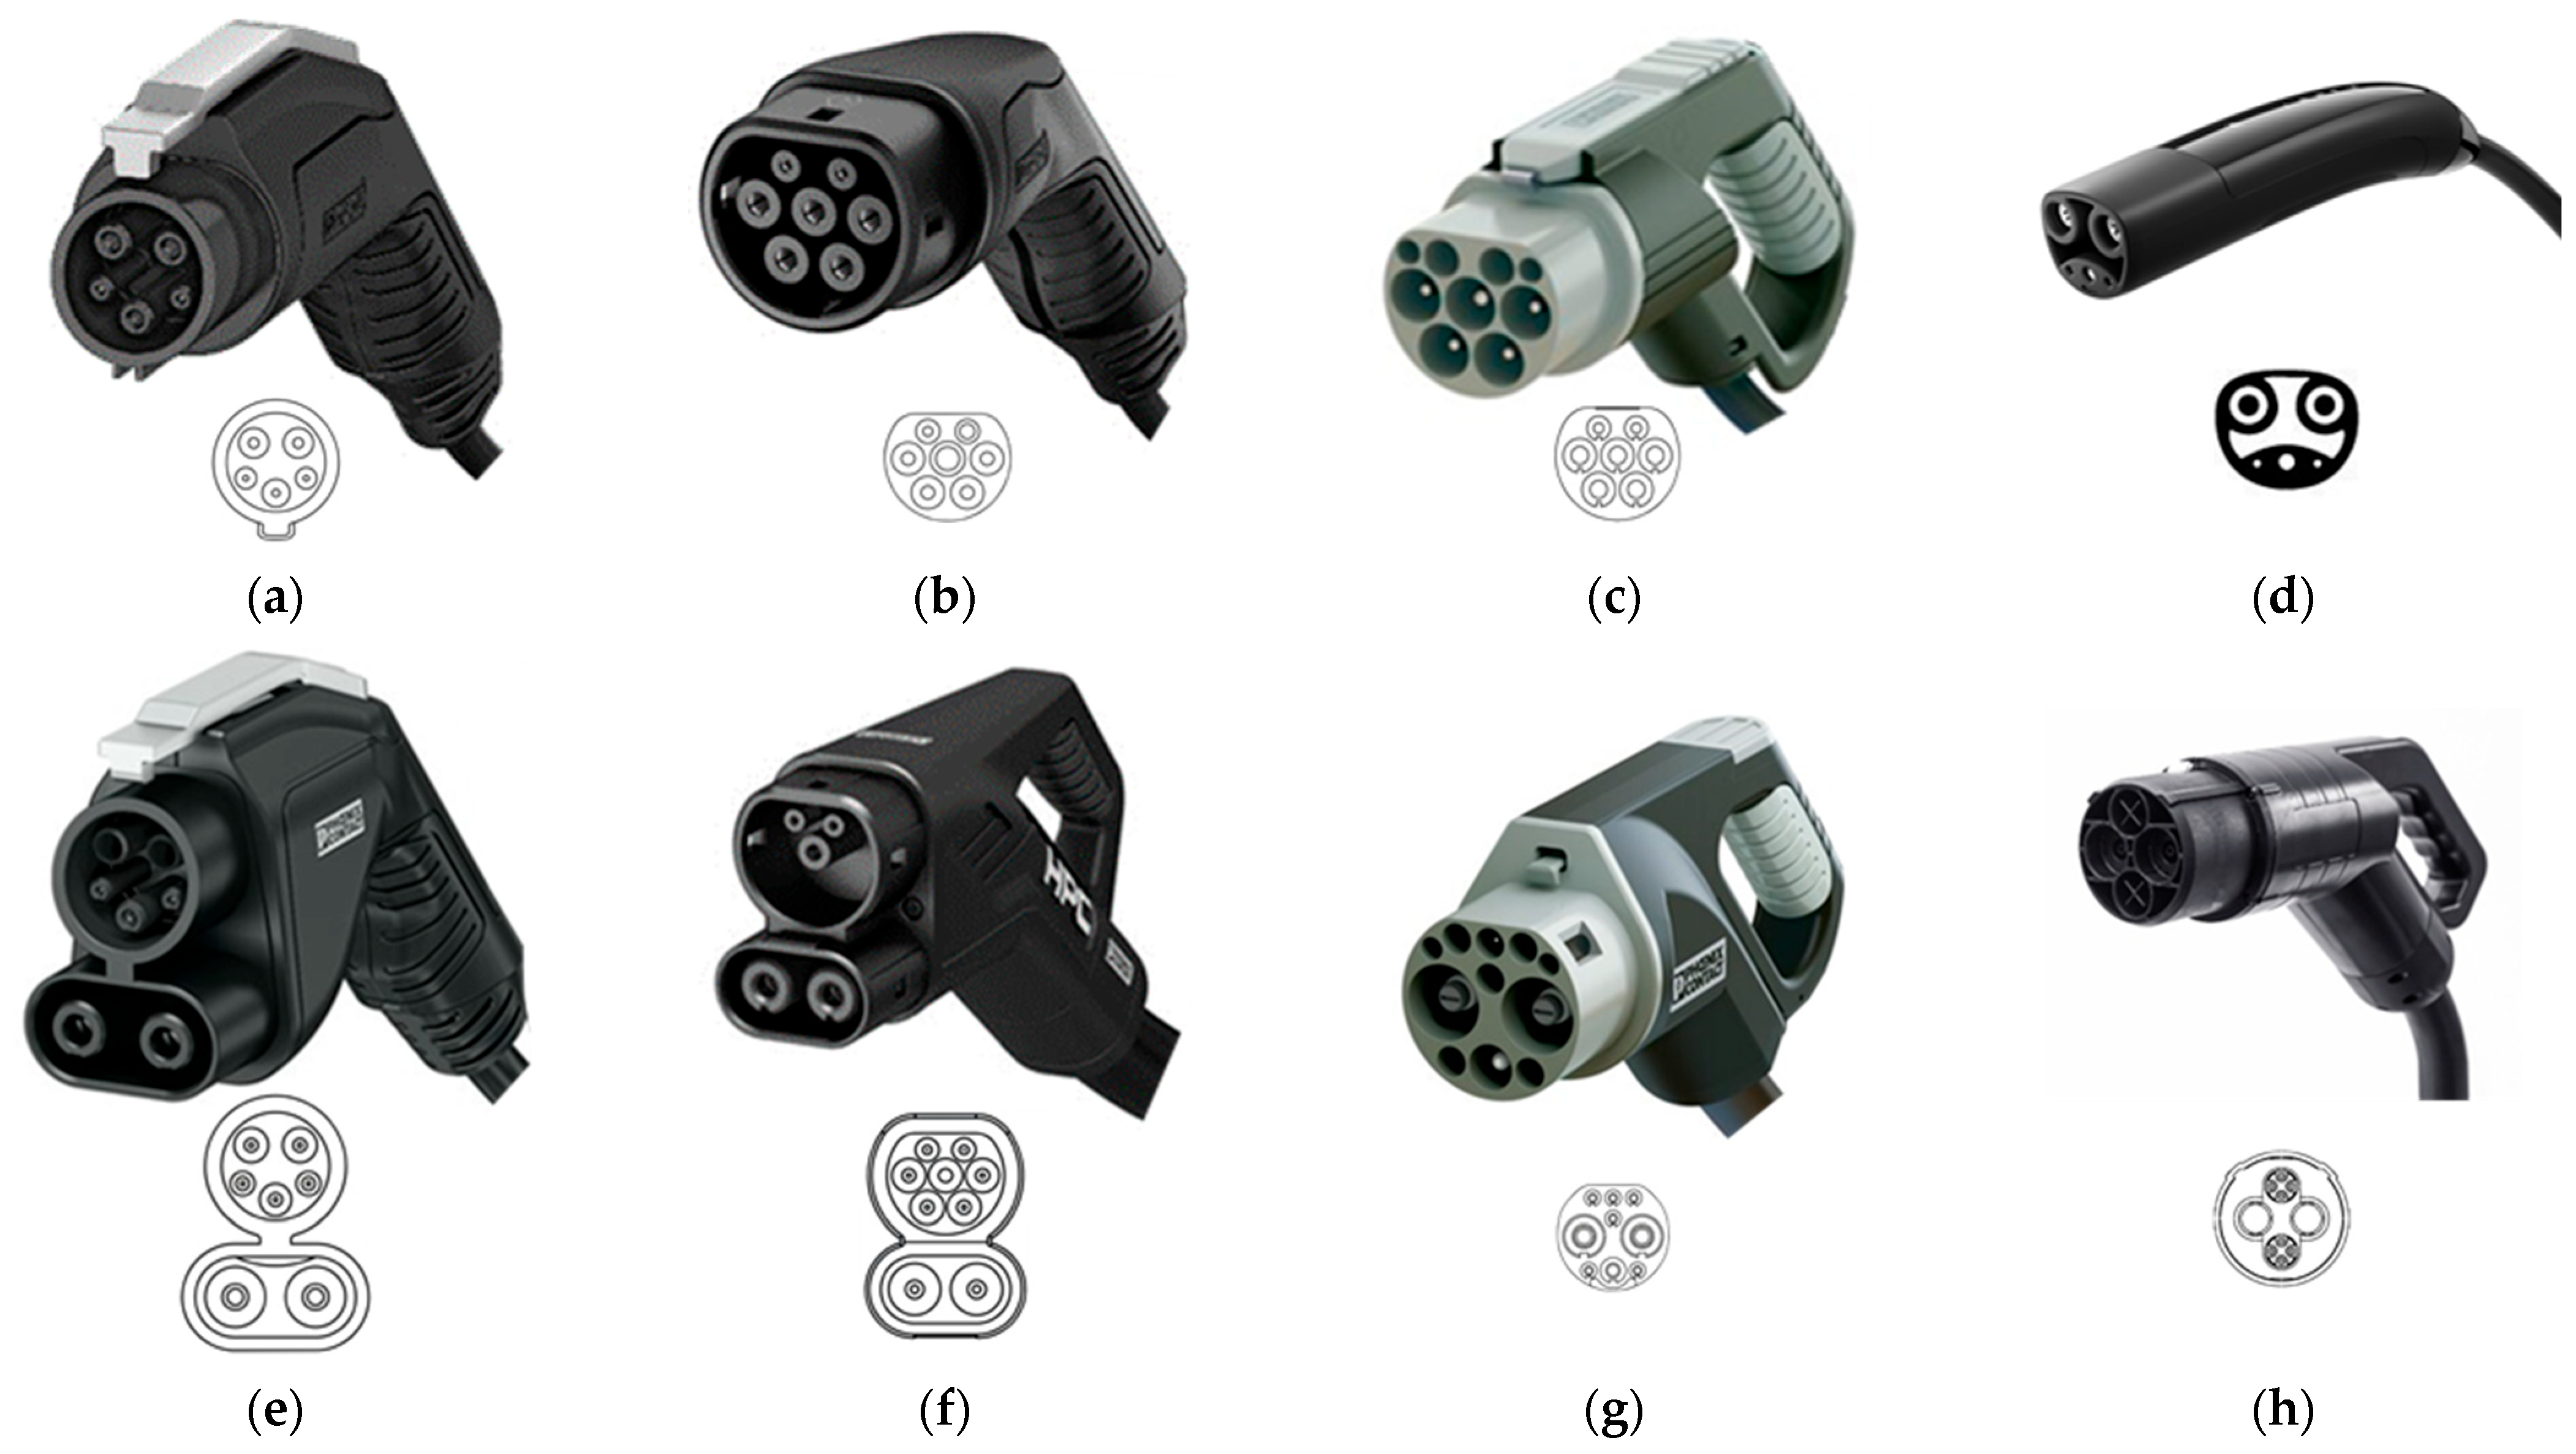
2.2. General Characteristics of Home EV Chargers and Public EV Recharging Stations

There are several ways to charge EV batteries. Based on the charging method, there are inductive and conductive charging. Due to the movement of the vehicle, charging takes place when the vehicle is stationary (stationary charging stations) or while it is moving (electric road systems—ERS). Stationary charging stations will be discussed later. ERS solutions are installed near the roadway or directly on it. Several pilot programs of conductive ERS can be found [9]. The advantage of this solution is the ability to charge the vehicle while it is moving, which allows the use of a smaller battery. Reducing the weight of the battery translates into no restrictions on the load capacity of vehicles (especially important for trucks).
EV batteries can be charged with alternating current (AC) or direct current (DC) [10]. Regrettably, stationary station EVs connectors vary by geographic region and even by model, which makes it impossible to charge an EV at any recharging point across the world. Currently, the following types of EV charging connectors are available (Figure 4) [11,12,13,14,15,16,17]:
  • Type 1—single-phase AC charging (250 V, 32 A) connector popular mainly in the USA and Japan;
  • Type 1 Combo (combined charging system—CCS 1)—DC charging, Type 1 (AC) connector extended with two additional direct current (DC) contacts; this charging connector is popular mainly in the USA;
  • Type 2—single-phase AC charging (250 V, 13 A or 20 A or 32 A or 63 A or 70 A) or three-phase (480 V, 13 A or 20 A or 32 A or 63 A) connector popular mainly in Europe;
  • Type 2 Combo (CCS 2)—DC charging, Type 2 (AC) connector extended with two additional direct current (DC) contacts, short-term charging power up to 500 kW; this connector is popular mainly in Europe;
  • Type 3—single-phase (250 V, 16 A or 32 A) or three-phase (480 V, 32 A or 63 A) AC charging, currently not used and replaced in Europe by Type 2/Combo,
  • CHadeMO—DC charging, bi-directional energy flow (implementation of the V2G—vehicle to grid standard), charging standard used in various means of transport, output power for wheeled vehicles: 10 kW ÷ 400 kW (150 V ÷ 1000 V), the latest CHAdeMO (3.0) “ChaoJi” protocol provides for charging at up to 900 kW (600 A × 1.5 kV), developed jointly by CHAdeMO and the China Electricity Council (CEC); this connection is prevalent in Japan;
  • GB/T—connector popular mainly in China;
  • Tesla—a proprietary standard of EV connectors used by Tesla; the same connector is used for AC and DC charging; since the end of 2018, vehicles introduced to the EU market are equipped with the European CCS 2 socket.
Figure 4. Types of electric vehicle plugs [18,19,20,21,22]: (a) Type 1; (b) Type 2; (c) GB/T (AC); (d) Tesla inlet (USA); (e) CCS 1; (f) CCS 2; (g) GB/T (DC); (h) CHadeMO.
Energies 17 00495 g004
According to the international standard [23], the following methods are used for connecting an EV to the power grid for charging (Figure 5):
  • Case A—a cable is permanently connected to the vehicle;
  • Case B—a cable that is detachable at both ends;
  • Case C—a cable that is permanently connected to the EV recharging station.
Figure 5. Cases of connections (based on [23]): (a) case A; (b) case B; (c) case C.
Energies 17 00495 g005
The methods of charging electric cars are described in detail in [23]; the following solutions are listed (Figure 6):
  • Mode 1—charging from a standard single-phase AC socket (not more than 250 V, 16 A) or three-phase AC socket (not more than 480 V, 16 A) without an additional protection device;
  • Mode 2—charging from a standard single-phase AC socket (not more than 250 V, 32 A) or three-phase AC socket (not more than 480 V, 32 A) with an additional protection device (e.g., in-cable control box, ICCB) placed between the power socket and the EV (e.g., control and protection devices);
  • Mode 3—charging using a power supply device with an AC output dedicated to EV charging with appropriate protective devices; the device must be equipped with a grounding wire;
  • Mode 4—charging using a power supply device with a DC output dedicated to EV charging with appropriate protective devices; the device must be equipped with a grounding wire.
  • Mode 1 charging is currently not supported by vehicle manufacturers. In this mode, vehicles are charged without additional protection and the leads connected to the electrical outlet are always live. Charging is slow and limited to domestic electric installations. Mode 1 charging is banned in the United States, Israel and the United Kingdom [23].
  • Mode 2 uses the electric vehicle supply equipment (EVSE), which supplies AC to the EV onboard charger (OBC). The OBC converts the AC main current into DC and sends it to the battery. Mode 2 in the United States of America and Canada is limited to 250 V. In Switzerland, mode 2 charging is limited to 16 A and 250 V (in single-phase systems). Some European countries apply charging current limitations during charging (using charging devices equipped with a household plug) for more than 2 h. Modes 1 and 2 are prohibited to use in public places in Italy. No voltage and current limits are set in international standard for modes 3 and 4.
Figure 6. Charging modes (based on [23]): (a) mode 1; (b) mode 2; (c) mode 3; (d) mode 4.
Energies 17 00495 g006
The EV charging speed depends on the specification of the OBC, the recharging point and the cable used. Table 2 lists the parameters of the most common OBC and the power of home EV recharging points. The OBC with the highest power (22 kW) reduces the charging time and is the most universal solution, i.e., recharging points with lower power can be freely used (which means that there are no restrictions on the electrical installation of the recharging point—the number of phases or the current).
The location of charging stations, especially in cities and suburban areas, requires many factors to be taken into account, which include [28] the cyclical variability and load of the charging point, demand control, optimal power flow, vehicle characteristics, owner satisfaction, charging behavior, energy network costs, regulation of energy prices according to the time of its use on the market, and charging speed. The above factors, including mainly the charging speed, charging behavior of vehicle owners, and charging a large number of electric vehicles, will cause problems with energy quality and harmonic distortions, which cause a load on electrical network devices [29].
The requirements and the state of the charging infrastructure around the EU transport network will be discussed below.

2.3. Distribution of EV Recharging Points/Recharging Stations in the European Union

The development of charging infrastructure is crucial in facilitating the widespread use of EVs. The number of public AC and DC recharging points is shown in Figure 7 and Figure 8. The data are presented according to the categorization of the regulation for the deployment of alternative fuels infrastructure (AFIR). Medium-speed AC recharging points are the most common type of public EV recharging stations. Fast and ultra-fast-level 1 prevail among DC recharging points.
Guidelines for the development of the Trans-European Transport Network (TEN-T) with recharging points are set out in [30]. By the end of 2025 and 2030, the recharging pool power is planned to reach 300 kW and 600 kW for light-duty vehicles and 1400 kW and 3500 kW for heavy-duty vehicles, respectively (Table 3). The power output offered by recharging stations for light-duty vehicles and heavy-duty vehicles is scheduled to reach 150 kW and 350 kW, respectively.
Table 4 lists data from an interactive TENtec map [32], which is the information system of the European Commission used to coordinate and support the TEN-T policy. It provides information on the locations and addresses of recharging stations, access type (public or semi-public), and connectors (plug type, power in kW, and power type—AC or DC). To analyze the development of EV charging infrastructure, the following filter categories can be used: power (50 kW ≤ p < 150 kW, 150 kW ≤ p < 350 kW, p ≥ 350 kW), connector type (Type 2, CCS, CHAdeMO, Tesla, or other), accessibility (public, semi-public), and buffer zones around TEN-T roads (1 km, 2 km, and 8 km). Data from the interactive map [32] presented in Table 4 were classified into two main categories, i.e., 1 km and 8 km buffer zones around TEN-T roads were analyzed. Within each category, subcategories were analyzed that included charging connectors for the European market (Type 2 and CCS) and three different levels of recharging point power, while the type of connector was not considered. Colors indicate the five countries with the highest number of recharging points in the analyzed subcategories. Yellow and orange designate the countries with the highest number of recharging points in the analyzed subcategory within the 1 km and 8 km buffer zones, respectively.
Table 5 compares three ratios for passenger EVs and recharging points. The number of recharging points is taken from Table 4 for an 8 km buffer zone along the TEN-T; the number of passenger EVs is taken form Table 1. The capacity of BEV batteries is typically higher than that of PHEVs; hence, the BEV charging time also depends on the power of the recharging point. Ratio 3 was designed to reflect the number of passenger BEVs in relation to recharging points offering a more efficient CCS type connector.
France, Germany, Italy, the Netherlands and Sweden are among the top five EU countries with the highest number of passenger EVs (marked in green in Table 5). Other countries where the number of passenger BEVs or PHEVs exceeded 100,000 are marked in orange. Ratio 3, to some extent, reflects the development of the fast EV charging infrastructure along the TEN-T with the ever-increasing number of electric vehicles. The value of this ratio for EU-27 was strongly influenced by countries with more than 100 EVs per recharging point. As for charging points equipped with Type 2 and CCS connectors, there are approx. 17 EVs per recharging point in Germany (the country with the highest number of EVs), and as for CCS recharging points, there are approximately 86 EVs per recharging point. Interesting results were obtained for the Netherlands, where there is a significant development of the charging infrastructure equipped with Type 2 connectors and a much smaller share of points equipped with CCS connectors.

2.4. EV Charging Time

The EV charging time depends on the charging method (AC or DC), type of recharging points (public or private), battery capacity, and OBC. With publicly accessible chargers, specifically DC chargers, an EV battery can be recharged faster compared to a private/home recharging point. Table 6 summarizes the charging time of selected EVs using AC and DC recharging points. The initial and final state of charge (SoC) are set at 20% and 80%, respectively. Charging the EVs at a DC recharging point takes about 0.5 h, and the EV charging time at the DC recharging point mainly depends on the vehicle specifications. For example, the battery capacity of Tesla 3 and Renault Zoe is similar, but the average charging power of Tesla 3 is more than twice as high as that of Renault, which translates into shorter charging times. Charging times at AC recharging points are longer because they are limited by the OBC and the power of the recharging point. The charging time attributed to OBC-related limitations is marked in orange. EVs with a charging time of more than 10 h are marked grey. A 10 h charging period is based on the assumption that EVs are not used from 8 PM to 6 AM and can be then connected to the AC recharging point. Table 6 lists the estimated distance that can be driven with a battery charged to SoC of 60%. The choice of the charging method and the power of the recharging point depend on the vehicle use model, e.g., commuting, etc.
The times presented in Table 6 assume full efficiency of the charging point. However, it should be noted that the failure of charging station components may lead to a reduction in the charging power available to the EV or its complete loss [33]. The available power of the charging point also decreases when charging more EVs (i.e., using all available charging point connectors). Limiting the available charging power will translate into the declared charging time and customer (EV driver) satisfaction.

3. Safety of EVs

Electric vehicles have their supporters and opponents. Supporters mainly present advantages, while opponents focus on disadvantages and potential threats. The media plays an important role here, publicizing every collision or accident involving an electric vehicle. Reporting immediately after a collision or accident occurs subjectively provides information about potential causes, reducing or increasing fears about the widespread use of electric vehicles. The global introduction of electric vehicles requires research in various areas, including electrical network safety road and vehicle safety (including fire safety).
Research about road transport safety for various types of vehicles (including the purpose and number of users) and an assessment of the quality of road infrastructure will enable a detailed risk analysis of the effects of introducing electric vehicles (to draw targeted and confirmed conclusions). Selected issues related to vehicle safety are presented below, including fire hazards.

3.1. Review of EV Safety Issues

Before being allowed to operate, all vehicle models must pass tests, the effect of which is to check whether they meet the minimum level of safety (type-approval tests). Their specificity may differ slightly from the area of use, resulting from the legal regulations in a given country. The basic ones may be those resulting from the UN (UNECE) technical regulations applied to the broad automotive sector, addressing the safety and environmental performance of wheeled vehicles, their subsystems and parts (see [34]). It is also worth paying attention to the regulations dedicated to cars equipped with electric drives, such as UN ECE R100 or the American FMVSS 305. A comparison of legal rules in different economic areas is provided in studies [35,36]. Additionally, in [37], we find an overview of various EV safety issues. It compares, among others, the main differences and similarities of regulations in 7 regions (USA, EU, Japan, China, India, South Korea, and Australia), differences in the safety issues of EVs and ICEVs (with an indication of the risks associated with the electrical installation).
Tests based on regulations enforce compliance with a certain level of safety by each type of vehicle. Still, they do not provide information that would allow for a clear and unambiguous comparison of the safety level of cars. Here, various consumer tests can come in handy, such as x-NCAP (New Car Assessment Programme), which dates back to the late 1970s (US-NCAP). These tests allow objective, quantitative, and qualitative assessments of the safety level of cars according to specific procedures (mainly crash tests) and car equipment with systems that increase their safety. With the wider prevalence of EVs, the results of safety tests and such vehicles began to appear. Specific aspects of EV cars are taken into account in research procedures (see [38] for information on the differences in research methodology in the field of electrical safety between different organizations (US-NCAP, Euro-NCAP, Japan-NCAP, and C-NCAP)).
Here, Euro-NCAP tests [39] were used for comparison. Figure 9 presents the results of 291 trials from 2017–2023, of which 48 concerned vehicles equipped with an electric motor (BEV or HEV version). These results indicate that (at the level of averaged indicators) there are no grounds to conclude that electric cars are less safe for road users (drivers, passengers, and other users), and in the category of vehicle equipment with additional systems that improve safety, there is even a visible advantage of EVs over ICEVs. In the following years, the average rating increased, precisely in the category of additional safety systems and protection of unprotected road users. The improvement in passive safety is somewhat less pronounced.
When reviewing the literature in this area, we will find many studies. The review below is limited to those dedicated to EVs, not universal vehicle safety issues. Scientific work related to the safety of electric vehicles has been ongoing since the beginning of the broader appearance of such cars on the automotive market. Already in the 1990s, attention was paid to safety risks, e.g., [40] chemical risks (including those leading to fires), electrical risks, and risks related to passive and active safety (mass increase). Fundamental but EV-specific safety issues are the subject of article [41], which focuses on the risks associated with electrical installation and battery charging.
In [42], simulation studies of the impact of the EV car body structure are discussed to minimize accelerations and the risk of the battery pack entering the safety zone of the vehicle (cabin) using the tests proposed in FMVSS 305. In [43], simulation methods (also finite element analysis) analyze the impact of the body structure of a small EV for tests used in Euro-NCAP. In [44], a similar analysis is presented for ATV vehicles (all-terrain vehicles). In [45], the authors (using Euro-NCAP tests) formulate recommendations for the design of electric lightweight vehicles to give best-in-class occupant protection. In [46], comparative studies (using simulation methods) of passive safety in terms of the effectiveness of several rear seat restraint configurations, with a focus on the restraint performance of a real-time adaptive (RTA) retractor system, are presented. It has been shown that there are no significant differences in occupant protection between ICEVs and EVs. Similar (simulation) methods were used in [47,48] to examine the structure corresponding to an EV car for a frontal impact regarding energy absorption. The benefits of using advanced high-strength steels (AHSS) in such vehicles have been pointed out [47].
In [49], the conditions of EV safety tests are analyzed in terms of protecting people inside the vehicle in frontal, side, and rear collisions, and specific aspects for such vehicles in the electrical aspect are indicated. Similar issues are considered in [50,51,52]. The work [53] also paid attention not only to the technical side of crash tests for EV assessments but also to the safety of employees and research infrastructure, proposing a set of appropriate procedures for this purpose.
In [54], the assistance systems used in EVs, which mainly work for active safety, are reviewed. The sensors, algorithms and systems using them in ADAS (advanced driver assistance systems) were indicated. In [52], the concept of ACC (adaptive cruise control) for EVs is considered not only in terms of safety but also in energy consumption optimization. In a similar context (safety vs. energy consumption), additional solutions are proposed, such as a driver assistance system when driving in mountainous terrain—see [55]. In [56], the subject of the implementation of basic ABS/ESC safety systems in light EVs was dealt with, taking into account the issues of energy recovery during braking. The functioning of the primary system supporting active safety, which is ABS, was dealt with in works [57] for BEVs and [58] for HEVs. In both cases, attention was paid to the advantages of using RBS (regenerative brake system) on the safety of the braking process.
In [59], the authors addressed the subject of EV motion dynamics and stability in the post-crash motion phase with the use of active safety systems (the paper considers steering angle and wheel torque control to maintain sufficiently small values of yaw movements—yaw angle and yaw velocity). Many similar publications propose or analyze vehicle control systems to assist or replace the driver in dangerous situations (e.g., [60,61,62], where EV control models are proposed to maintain vehicle stability in regular traffic). In [63], an EV with motors placed in wheel hubs is analyzed, and the benefits of such a solution without negative impacts on safety and comfort are indicated.
Paper [64] analyzes the problem famous in the media related to the fact that EVs are relatively quiet compared to ICEVs, which may be dangerous to pedestrians (lower informativeness of the EV). The solution used is an additive noise component. Findings suggest that although mean detection distances trend higher for vehicles with this additive noise component, they are not significantly different from traditional EVs at speeds of 10 kph. Moreover, all EVs were detected at significantly shorter distances relative to the ICE vehicle. However, these differences became indistinguishable at an approach speed of 20 kph, likely due to the additional road noise produced by tires at higher travel speeds. The same issue is the subject of [65], where attention is focused on properly selecting the additional sound generated by the EV.
Interesting studies are presented in [66]. Using simulation studies of complex models of tire-road surface contact, they suggest that an improvement in road traffic safety on wet surfaces can be expected with the popularization of EVs. They justify this with a lower probability of aquaplaning (even approximately 50%) and a two-fold reduction in the number of accidents related to this phenomenon if all cars were electric. The authors associate this effect primarily with the greater weight of EVs (here—as a confirmation, the data provided in [36] can be quoted—the average weight of newly registered cars in Germany in 2019 was approx. 1550 kg compared to 1445 kg in 2007).
A slightly different safety issue considered in the literature is the safety of the electrical installation itself, including the one “outside the vehicle” (charging stations). In the paper [67], the causes of events related to the functioning of the EV charging system (such as battery explosion/ignition, overcharging, short circuits, and leaks) at the charging point are analyzed. A similar problem is dealt with in [68,69,70].
Another area is functional safety analysis. Here, an example can be the work [68] in which such an analysis of motor control systems was carried out, and a three-level safety monitoring system was proposed for the control system of a 380 V drive unit. A similar issue is analyzed in [71]. In [72,73], car interference and electromagnetic compatibility (EMC) were taken up. In [74,75], the concepts of functional analysis of HEV vehicle safety are presented. In [76,77], attention is focused on the design of vehicle control systems and their systems. The functional safety of a BMS (battery management system) is discussed in [36,78]. Other examples of this type of analysis of EVs and their assemblies can be found, for instance, in [79,80,81].
In [82], an attempt was made to systematize the safety hazards associated with Evs (BEVs and HEVs) at a general level, dividing them into four areas: vehicle electrical systems, system failures, battery charging or discharging processes, and the skills and knowledge of personnel operating such vehicles. Based on a review of the literature on each of the aspects mentioned above, they indicated the factors shaping the safety and risks associated with the operation of EVs.
In the context of the safety of EVs, it is also worth paying attention to aspects other than those mentioned above. According to the information provided in [83], based on data from insurance companies, EV cars are relatively more often involved in road accidents than their conventional counterparts. The data provided in [83] indicate that drivers of EVs are involved in collisions up to 50% more often than drivers of internal combustion vehicles. The authors attribute this to the different traction properties of EV cars, to which drivers have not yet adapted their skills and awareness (e.g., very high torque values at low speeds leading to excessive acceleration and loss of stability). This effect can be considered temporary and related not so much to the vehicle as to its user. However, another aspect can be pointed out. Although the Euro-NCAP test results cited above do not indicate a differentiation in the level of safety, it can be assumed that in the case of a collision between two vehicles of a similar class, ICEVs and EVs, the damage (material and health) may be lower in the case of EVs, which is related to the mass incompatibility of both vehicles (significantly higher weight of the EV car). The data in [83] confirm this. Interesting information is also provided by [36]. The ADAC (Allgemeiner Deutscher Automobil-Club) data presented there shows a solid upward trend in vehicle electrical system failures, which accounted for over 50% of all recorded vehicle failures in 2019.

3.2. Problems in Cases of Accidents, including Fire

Tests, such as the previously cited NCAP, are general safety assessment methods that do not highlight some new risks associated with using predominantly powerful battery packs (LIBs). Media reports of spectacular fires of electric vehicles lead to some fear among users about the high risk of such an effect. So the question is, are electric cars really more at risk of fire? Here, we can use the analyzes presented in [84], in which data from the American governmental agencies NTSB (National Transportation Safety Board), BTS (Bureau of Transportation Statistics), and the Recalls.gov website were used. The data (Table 7) indicate that the largest number of fires is in the case of conventional vehicles, which is, of course, related to the actual quantitative dominance of such cars. However, if we relate this data to the sales of new vehicles, it turns out that the car fire rate is the highest for HEVs, roughly twice as low for ICEVs. For BEV cars, it is the lowest and about 60 times lower than conventional vehicles. Similar qualitative conclusions can also be found in other sources (e.g., in [85], the so-called fire risk coefficient for ICEVs of 0.04 was defined for Poland, with the corresponding one for BEV/HEV cars at the level of 0.03, see also [83]).
In [84], service calls related to fire hazards were also analyzed. Both in the cases of BEVs and HEVs, they mainly concerned faults related to batteries, unlike ICEVs, where the calls mainly concerned problems with fuel leaks, electrical shorts, and anti-lock braking systems (ABS).
Such studies indicate that in the case of an EV, the risk of fire is lower, and if an event occurs, it is primarily related to its battery (see, e.g., [86]). Experience shows that fires of lithium-ion batteries (LIBs) in electric cars are much more difficult to extinguish than fires in conventional cars (see also [87]). This topic is the subject of many analyses and studies found in the literature.
In [88], there is an extensive review of recent battery fires in EVs, as well as the related fire-safety issues and fire-protection strategies. In [89], failures of EV batteries were critically reviewed. The leading causes of failure are a too low voltage (including a single cell—see [86]), battery ageing, and just thermal runaway (TR). In the latter case, problems related to overcharging, improper heat dissipation, and an excessive increase in internal resistance are pointed out. In [90], the issues of battery integration and its management systems regarding efficiency, reliability, and safety are considered. The limits of the safe use of LIBs are indicated in terms of the problems mentioned above.
The authors of [91] proposed an interesting real-time battery management system (BMS) for electric vehicles. The Internet of Things (IoT) was used to monitor and regulate the discharge/charge process of the batteries to extend their life and reduce the risk of damage and possible fire. Another project of a system based on the Internet of Things for detecting the dangerous temperature of electric vehicles and early warning of the threat during their charging is also presented in [92].
In [93], the TR process is analyzed. In addition to the problematic, sudden increase in temperature, dangerous chemical reactions occurring during this process are also indicated, including the formation of a large amount of gases (carbon oxides and ethene) and carbonates in the electrolyte. Various reasons are given that can lead to thermal runaway and, as a result, a fire, which should be considered when creating protections that reduce the risk of the phenomenon (see, e.g., [94]). In [95], three mechanisms of TR formation were indicated—mechanical (as a result of, e.g., collision), electrical (e.g., overcharging and resulting short circuits) and thermal (associated with improper battery management—incorrect cooling and thermal impact of the environment). A comprehensive safety management strategy is also presented here. The problem of the thermal stability of LIBs is also the subject of the analysis in [96]. The authors of [97] modelled the TR phenomenon and performed a series of simulation studies for LIBs. Particular attention was paid here to the highly flammable and toxic gases that accompany this process and simultaneously lead to its escalation by the additional heating of the adjacent cells. It was emphasized that an appropriate insulation system and a properly designed degassing system could significantly delay and even prevent the TR phenomenon.
There are also works related to forecasting the occurrence of dangerous phenomena (e.g., fire hazards). An example of this can be [98], where typical battery fault diagnosis methods are presented (with their advantages and disadvantages) and a proposal for an alternative real-time fault diagnosis and isolation using the normalized discrete wavelet decomposition. The aforementioned work [93] proposed an early warning system for the risk of LIB failure in electric vehicles. Connectors available in the car were used for comprehensive monitoring of EV batteries. Cloud computing technology was used for both data synchronization and distribution.
The authors of [99] analyze the TR process and identify critical time points of failure signals based on standardly recorded battery operation parameters (voltage, cell temperature, etc.). It has been found that the cause of the fire is often a battery internal short circuit (ISC) resulting from overcharging the battery (even by only 10%). For early detection of an ISC online, a method based on the voltage difference of individual cells is proposed here, which is simple and reliable to be implemented in a typical BMS. The detection of LIB insulation shorts in electric vehicles was also discussed in [100]. Relative entropy was used here as a measure of voltage drop disturbances. It has been shown that such a short can be identified from the cloud server level, and this concept is superior to the correlation coefficient method. The weighted entropy method (EWM) in conjunction with the fuzzy analytical hierarchical process (FAHP) and the game theory was also proposed in [101] as a way to assess the inconsistency of parameters (voltage, temperature, internal resistance, and amount of electricity) of individual battery cells and resulting from this fire hazard.
An interesting proposal for detecting thermal anomalies and, as a result, identifying problematic batteries that may eventually succumb to TR and fire is presented in [102]. The authors of this paper propose the use of a method comparing the similarity of time courses of temperature. Based on their shapes, the measurement results are continuously grouped into clusters, and the anomaly is detected by monitoring deviations in the clusters. Unlike model-based and other advanced approaches, the proposed concept is robust to data loss and does not require extensive reference data for various packet configurations. Preliminary experimental results have shown that this method can not only be more accurate than an onboard BMS but can also detect unforeseen anomalies at an early stage (even 90 min before the BMS).
A quick and timely prediction of the occurrence of TR is essential but hampered by the small amount of battery health information available (only voltage and temperature) and the high degree of complexity of the factors affecting the actual performance of electric vehicles (environment, driving behavior, weather, etc.). To solve this problem, the authors of paper [103] (see also [104]) combined several data-based methods and proposed to perform the TR forecast in two stages. The first step is to predict the temperature using a machine learning algorithm using a gradient-enhancing structure (XGBoost). In the second step, abnormalities are detected using principal component analysis (PCA) and density-based spatial clustering of applications with noise (DBSCAN). XGBoost is modified and trained with data from real electric vehicles to account for factors found in various operating conditions. The test results indicate that the method allows for an accurate 5 min temperature forecast and enables a 35 min TR forecast.
Paper [105] presents research on the process of a battery fire depending on external heating and the battery’s SoC (state of charge), indicating the very high impact of the degree of charge on this process. The fire formation process is also the subject of research in [106,107,108,109,110].
In the work [111], attention was paid to the quality of production of batteries and their components, and thus the critical roles of producers and suppliers. The authors of the article [112] presented a case study of the recall of thousands of GM and Hyundai electric cars from the market due to malfunctions in the operation of LG Chem batteries, posing risks of fire and explosion. A very important issue is raised here: EV manufacturers and battery suppliers, instead of finding the cause of dangerous events, usually limit themselves to implementing subsequent software updates in the controller as the primary countermeasure. This, of course, results from the desire to avoid substantial financial losses related to the withdrawal of BEVs/HEVs from the market. Modifying the software in the battery controller, at best, only reduces the probability of failure but does not eliminate the safety risk.
A slightly different problem, according to the authors of the paper [113], is the risks resulting from errors during the operation of BEVs/HEVs, especially immediately after a road accident or even a collision. A high short-circuit current can cause a fire not only during the transport of a damaged vehicle and repair but also in later operation. Fortunately, no serious incidents of this type are recorded, despite the potential threats. However, with the increase in the number of vehicles and the aging of cars, repair activities are becoming more frequent, which may result in a deterioration of statistics.
A completely separate issue is the fire hazards of EVs in closed facilities. In [114], the potential danger in standard indoor car parks was considered, e.g., when charging electric vehicles. Through appropriate simulations, it was investigated how a fire, even in a single electric vehicle, can lead to temperatures above 300 °C, where steel begins to lose its ability to effectively carry static loads and the structural integrity and stability of the garage is compromised. Based on the analysis carried out here, however, it has been shown that electric vehicles do not pose a more significant threat to people than the classic ICEVs.
A comprehensive review of literature sources on the problems, strategies and standards of LIB testing, as well as concerns regarding their safety, is presented in [115]. Many practical answers to questions related to LIB safety can also be found in articles [116,117] and report [118]. The specifics of LIB testing in crash test conditions are discussed in works [119,120,121]. The first two indicate the importance of the crash pulse test. In contrast, [121] shows the great importance of the geometric location of the LIB in the vehicle on the effects of a collision (here, simulation tests of a collision with a pole were used).
An effective solution to problems with BEV/HEV fires can be the use of graphene batteries. According to the information contained in [122], they are non-flammable and have a high level of safety that can be achieved. At the same time, they store more energy, charge faster, have a longer life, and do not harm the environment, like their lithium-ion counterparts.
As mentioned, lithium-ion battery fires are much more difficult to extinguish than conventional car fires. Batteries are essentially their own fuel source, can burn for hours, and are extremely difficult for firefighters to cool down. Even if an electric vehicle fire appears to have been extinguished, it may flare up again, which is why it is so important for firefighting services to carry out extinguishing operations in a skillful manner.
EVs catch fire less often than ICEVs, but the duration and intensity of fires can make them much more difficult to extinguish due to the use of lithium-ion batteries (a comparison of vehicle fires with LIBs and ICEVs can be found, e.g., in [123]). Lithium-ion batteries are very difficult to maintain at low temperatures. Even if the batteries appear to be off for 24 h, they can generate enough heat to ignite again.
Lithium-ion high-voltage (HV) battery fires, however, are somewhat less of a threat to EV/HEV travelers than those that may be involved in ICEVs. The point here is the dynamics of fire development, which in the case of such energy storage tanks is much lower than, for example, large petrol tanks. Current regulations and standards (according to [116]) require the HV cell failure alarm to be generated by the vehicle’s on-board warning system at least 5 min before a full fire. This is enough time for all people to leave the vehicle (even a bus). Of course, the problem becomes much more serious in the event of a road accident or collision. Then, the alarm systems may not work at all, and the time from the event to the fire may be much shorter. In addition, the occupants of the vehicle may be trapped in it. As a result, most manufacturers aim to design HV batteries to resist fire release for 1 h or more. Then, waiting for the rescue services and releasing the injured should end earlier.
According to one source [124], the average duration of firefighting operations in electric vehicle fires in recent years has been approx. 1.5 h. However, there are known cases where a car fire lasted more than 4.5 h, and the longest one in Poland required the continuous intervention of firefighting services for 21 h [125].
When fighting EV/HEV fires, the most effective way to cool HV batteries is to place the entire vehicle in a suitable container with water or foam. As shown in [126], approximately 0.63 m3/kWh of water or 0.74 m3/kWh of foam should be used to control the fire. Another way to control the fire more easily is to use a special firefighting cloth. The situation is greatly simplified when the car has the so-called “fireman access”, i.e., a valve in the battery housing to which water is pumped. For example, Renault has such a solution, where according to the manufacturer, the fire can be controlled in 5 min [124]. For buses, it is proposed to use automatic systems to extinguish batteries after the BMS detects a fire hazard. In the work [127], for example, the high efficiency of the extinguishing agent in the form of perfluorohexanone, injected under pressure into the battery housing, was demonstrated.
Specific safety tips for drivers and passengers involved in EV/HEV accidents can be found in the literature. To prevent additional hazards and reduce the risk of serious injury, the U.S. Fire Administration (see [128]) recommends, among other things, that all first responders be informed that the vehicle is electric; assume that the vehicle is fully powered, even after an accident; roll down the windows before turning off the engine; remove the ignition key and secure it at a distance of at least approximately 5 m from the vehicle; do not touch the battery, exposed electrical components, engine compartment or any wires under the engine cover; and keep a safe distance from any electric vehicle that has been seriously damaged.
According to the authors of paper [129], it is important to check whether the battery in a burning EV/HEV is on fire or not. Self-intensifying exothermic processes in the battery can lead to the release of toxic substances in the form of hydrocarbons (HCs), carbon monoxide (CO), and especially hydrogen fluoride (HF). These substances are dangerous to humans not only when inhaled but also when in contact. If the hydrocarbons are released by opening the cell, they can ignite immediately or, even worse, accumulate in the open space and ignite later. If the mixture of these gases is above the explosive threshold, any spark from the HV system can lead to a flame out and explosion when the system does not have a dedicated venting mechanism. Of course, carbon monoxide can lead to the suffocation of vehicle occupants and emergency services if they do not use respiratory masks; HF is a very toxic, corrosive and highly reactive substance, causing serious damage to health and even death, see also [130].
In the case of post-accident hybrid and electric vehicles that have not yet been repaired, it is recommended (see [128]) to contact an authorized service center or vehicle manufacturer (persons without appropriate training should not attempt to repair a damaged electric vehicle); report any fluid leaks, gurgling, sparks or smoke coming from the HV battery; not store a severely damaged electric vehicle inside a building or less than 15 m from any flammable materials; and note that damage to the EV/HEV HV system may result in the delayed release of toxic fumes or flammable gases.
The NTSB (USA) [118] identified two major issues related to EV/HEV crash safety. The first is the inadequacy of EV/HEV manufacturers’ guidelines for emergency responses to reduce the risk to emergency services (firemen and roadside assistance) posed by lithium-ion battery fires. The second problem is gaps in safety standards and research related to high-voltage lithium-ion batteries involved in high-speed and high-severity crashes. The NTSB, based on its own findings, issues safety recommendations not only to the National Highway Traffic Safety Administration but also to manufacturers of EVs/HEVs with high-voltage lithium-ion batteries and to six professional organizations that represent or conduct training programs for emergency services. The report [118] formulated several dozen detailed conclusions in the field of fire safety, the content of which largely coincides with the previously described problems and recommendations for dealing with failure of the HV system and/or battery. It was also noted that manufacturers do not always provide adequate information on risk mitigation procedures. It has been pointed out that the existing standards deal with damage caused by high-voltage lithium-ion battery systems in crashes, but they do not take into account serious accidents at high speed, resulting in damage to the batteries. Report [118] also includes comments on extinguishing agents. In short, water or other standard means should be used; the demand for water is approx. 10 m3, but there are cases of a need to use even 76 m3; too little water can lead not only to insufficient cooling, but also to toxic gas emissions; prolonged and continuous application of water to the local area leads to faster extinguishing of the fire; and water should be applied even when no flame is visible.
In turn, the authors of the paper [131], based on fire tests in road tunnels with the participation of vehicles with lithium-ion batteries, point out that sometimes the rate of heat release from an EV can be higher than that of an ICEV, depending on the extent to which the battery is involved in the fire (see also [130]). Attention was also drawn to the ineffectiveness of alternative methods of extinguishing fires using fire blankets in the event of a battery fire, the beneficial effects of using a fire lance to inject the water directly into the battery housing (the fire can be put out in a very short time with a small amount of water, but the use of such a lance requires close approach to the vehicle and well-trained firefighters), and the possibility of contamination of the site (here see also [132]). In the context of EV fires in tunnels, on the one hand, the need to introduce significant changes to the safety standards for such infrastructure elements due to EVs was noticed, but on the other—a higher risk of damage to tunnels in fires of electric trucks (due to higher temperatures).

4. Conclusions

The continuous increase in the popularity of EVs in all countries and the information about the future limitation of registration of cars with internal combustion engines in EU countries means that electric motors are now treated as the primary type of drive in future vehicles. Various incentives and financial subsidies applied by governments to facilitate the purchase of EVs stimulate the growth of sales of these cars and contribute to increasing their share in the automotive market. Many publications have been written about the indisputable advantages of the electric drive. However, considering local conditions, some problems may arise during their use.
The aim of this work, which discusses issues related to EVs and their use in many aspects, is to indicate both the benefits and some risks resulting from using these vehicles. The work was divided into two parts. The first one (Part 1—environmental protection) indicated ecological issues related to the entire life cycle of an EV, including recycling. In the second part presented here (Part 2—infrastructure and road safety), the attention was focused on two broad areas: infrastructure and the issue of EV safety.
In 2022, the total number of ELDVs in the world exceeded 26 million and has increased five-fold in the last 5 years. Following the dynamic increase in the number of electric cars, the development of their charging infrastructure must keep up with the need to ensure the appropriate density of its distribution on roads and to shorten the time of charging the EV battery. However, the variety of solutions used in EVs is not conducive to ensuring an appropriate density of charging stations; unfortunately, the connectors fitted to an EVs vary depending on the geographic region and car model, which excludes the possibility of charging the EV’s battery at any charging point in the world.
Moreover, the charging time of EVs depends on the charging method (AC or DC), location of the charging point (public or private), battery capacity, and OBC.
Public chargers (mainly DC) allow faster charging of the vehicle battery compared to a private/home charging point, but as shown (Table 6), charging an EV at a DC fast charging point takes about 0.5 h, assuming the initial and the final SoC are 20% and 80%, respectively. Compared to the refueling time of an ICEV car (which is several minutes), this is still too much and significantly extends the journey time of the BEV.
The main general problems of EV safety issues are chemical and electrical risks (including those leading to vehicle fires). Regarding the overall level of EV safety, EV cars are in no way inferior to classic ICEVs. Data from safety assessment tests (Euro-NCAP) make this clear. The rating indices for vehicles with both types of energy sources are similar. In the case of additional safety-enhancing equipment (driver assistance systems and crash-avoidance technologies), they are even higher for EVs.
Research on the occurrence of car fires also quite clearly indicates that the risk of such an effect in the case of EVs is lower than in the case of ICEVs. On the other hand, the course of the thermal runaway phenomenon and the duration of a high-voltage battery fire are slightly different than in the case of ICEV fires, and the extinguishing process is more complicated.
Since the beginning of the broader appearance of the EV (BEV or HEV), a lot of research has been carried out in the field of safety in various areas of engineering knowledge: passive safety, active safety, post-accident safety, vehicle control systems, battery design and management, battery operation, firefighting procedures, material science, etc. This provides the basis for further development and improvement of EV safety.
It seems (based on available publications) that we currently do not have a complete, multi-faceted review of the risks associated with the appearance of EVs on the roads. The rapid introduction of electric vehicles requires an urgent need to research to assess the effects from the risk point of view separately for different types of vehicles, depending on their purpose, number of users, and road infrastructure. Research with a broad risk analysis is needed here, allowing for identifying well-documented threats related to the operation of EVs, including fire hazards.
Finally, it should be noted that the observations formulated in this work are based mainly on conclusions developed in numerous research works. They do not fully exhaust the problems mentioned and require further research to confirm them fully. However, they constitute a synthetic review of current issues that are the subject of research and scientific activity in the field of EVs.

Author Contributions

Conceptualization, Methodology, Validation, formal analysis, Investigation, writing—original draft preparation, writing—review and editing, visualization: M.G., J.J., R.S.J., E.M.S., P.Z. and M.Ż. All authors have read and agreed to the published version of the manuscript.

Funding

This research received no external funding.

Data Availability Statement

Data are contained within the manuscript.

Conflicts of Interest

The authors declare no conflicts of interest.

References

  1. Zieliński, A. Samochody Osobowe. Dzieje Rozwoju; WKŁ: Warsaw, Poland, 2009. (In Polish) [Google Scholar]
  2. Szumska, E.; Jurecki, R.; Pawełczyk, M. Evaluation of the use of hybrid electric powertrain system in urban traffic conditions. Eksploat. I Niezawodn.—Maint. Reliab. 2020, 22, 154–160. [Google Scholar] [CrossRef]
  3. Szumska, E.; Jurecki, R. The Analysis of Energy Recovered during the Braking of an Electric Vehicle in Different Driving Conditions. Energies 2022, 15, 9369. [Google Scholar] [CrossRef]
  4. Jackowski, J.; Łęgiewicz, J.; Wieczorek, M. Samochody Osobowe i Pochodne; WKŁ: Warsaw, Poland, 2011. (In Polish) [Google Scholar]
  5. Electric Vehicles Initiative. Available online: https://www.iea.org/programmes/electric-vehicles-initiative (accessed on 11 July 2023).
  6. International Energy Agency. Global EV Outlook. 2023. Available online: https://iea.blob.core.windows.net/assets/dacf14d2-eabc-498a-8263-9f97fd5dc327/GEVO2023.pdf (accessed on 4 July 2023).
  7. Global EV Data Explorer. Available online: https://www.iea.org/data-and-statistics/data-tools/global-ev-data-explorer (accessed on 12 June 2023).
  8. European Alternative Fuels Observatory. Road. Available online: https://alternative-fuels-observatory.ec.europa.eu/transport-mode/road (accessed on 4 June 2023).
  9. Hellgren, M.; Honeth, N. Efficiency of an AC Conductive In-Road Charging System for Electric Vehicles-Analysis of Pilot Project Data. SAE Int. J. Electrified Veh. 2020, 9, 27–40. [Google Scholar] [CrossRef]
  10. Bazarnik, W. Domowa Stacja Ładowania Samochodów Elektrycznych—Wszystko. co Powinieneś o Niej Wiedzieć. Available online: https://blog.swiatbaterii.pl/domowa-stacja-ladowania-samochodow-elektrycznych-wszystko-co-powinienes-o-niej-wiedziec/ (accessed on 12 July 2023). (In Polish).
  11. European Alternative Fuels Observatory. Recharging Systems. Available online: https://alternative-fuels-observatory.ec.europa.eu/general-information/recharging-systems (accessed on 13 July 2023).
  12. Netherlands Enterprise Agency. Electric Vehicle Charging. Definitions and Explanation. Version: January 2019. Available online: https://nklnederland.nl/wp-content/uploads/2021/12/Electric_Vehicle_Charging_-_Definitions_and_Explanation_-_january_2019.pdf (accessed on 13 July 2023).
  13. Urząd Dozoru Technicznego. Typy Ładowania. Available online: https://www.udt.gov.pl/typy-ladowania (accessed on 13 July 2023). (In Polish)
  14. CHAdeMO. High Power (ChaoJi). Available online: https://www.chademo.com/technology/high-power (accessed on 13 July 2023).
  15. CHAdeMO. Protocol Development. Available online: https://www.chademo.com/technology/protocol-development (accessed on 13 July 2023).
  16. TU Delf. Electric Cars: Technology. Lecture Notes: Lecture 3.3. Available online: https://ocw.tudelft.nl/wp-content/uploads/eCARS2x_Lecture_Notes_L3-3.pdf (accessed on 13 July 2023).
  17. IEC 62196-2; Plugs. Socket-Outlets. Vehicle Connectors and Vehicle Inlets—Conductive Charging of Electric Vehicles—Part 2: Dimensional Compatibility Requirements for AC Pin and Contact-Tube Accessories. Edition 2.0. 2016-02. IEC: Geneva, Switzerland, 2016.
  18. Phoenix Contact. Charging Sockets for Electric Cars and Utility Vehicles. Available online: https://www.phoenixcontact.com/en-us/products/charging-technology-for-e-mobility/vehicle-charging-inlets?#se-result (accessed on 17 July 2023).
  19. Phoenix Contact. DC Charging Cables for Fast Charging Stations. Available online: https://www.phoenixcontact.com/en-us/products/charging-technology-for-e-mobility/dc-charging-cables?#se-result (accessed on 17 July 2023).
  20. Phoenix Contact. AC Charging Cables for Electric Cars. Charging Stations and Home Charging Points. Available online: https://www.phoenixcontact.com/en-in/products/charging-technology-for-e-mobility/ac-charging-cables (accessed on 17 July 2023).
  21. Electway Electric. Battery Charger. Available online: https://www.electway.net/product/Battery_charger_1.html (accessed on 18 July 2023).
  22. Congress: Tesla Superchargers and Plugs Should be the U.S. Standard for Evs. Available online: https://www.change.org/p/congress-tesla-superchargers-and-plugs-should-be-the-u-s-standard-for-evs (accessed on 2 August 2023).
  23. IEC 61851-1; Electric Vehicle Conductive Charging System—Part 1: General Requirements. Edition 3.0. 2017-02. IEC: Geneva, Switzerland, 2017.
  24. EVEXPERT. Product Selection by Electric Car. Available online: https://www.evexpert.eu/c/product-selection-by-electric-car (accessed on 19 July 2023).
  25. Electric Vehicle Database. Available online: https://ev-database.org/ (accessed on 19 July 2023).
  26. MINIVOLT. Samochody Elektryczne—Dane Techniczne i Ładowanie. Available online: https://www.milivolt.pl/category/samochody/ (accessed on 19 July 2023). (In Polish).
  27. Bezszelestni.pl. Ładowanie AC Auta Elektrycznego—Na Czym Polega? Available online: https://bezszelestni.pl/ladowanie-ac-auta-elektrycznego-na-czym-polega-wychowanieelektromobilne/ (accessed on 19 July 2023). (In Polish).
  28. Wang, H.; Tang, J.; Guo, D.; Tan, G. Optimal Planning of Charging Stations Based on Charging Behavior of Electric Vehicles and Charging Selection. SAE Int. J. Sustain. Transp. Energy Environ. Policy 2021, 2, 3–24. [Google Scholar] [CrossRef]
  29. Hamadi, A.; Alam, M.; Arefifar, S. Analyzing the Impact of Electric Vehicles Charging Stations on Power Quality in Power Distribution Systems; SAE Technical Paper 2021, 2021-01-0199; SAE International: Warrendale, PA, USA, 2021. [Google Scholar] [CrossRef]
  30. Proposal for a Regulation of the European Parliament and of the Council Concerning Batteries and Waste Batteries. Repealing Directive 2006/66/EC and Amending Regulation (EU) No 2019/1020. Available online: https://eur-lex.europa.eu/legal-content/EN/TXT/?uri=CELEX%3A52020PC0798&qid=1608192505371 (accessed on 16 June 2023).
  31. EU Guidelines for the Development of the Trans-European Transport Network. Available online: https://eur-lex.europa.eu/en/legal-content/summary/eu-guidelines-for-the-development-of-the-trans-european-transport-network.html (accessed on 28 July 2023).
  32. Mobility And Transport TENtec Interactive Map Viewer. Available online: https://ec.europa.eu/transport/infrastructure/tentec/tentec-portal/map/maps.html (accessed on 25 July 2023).
  33. Zhang, J.; Wozniak, C. EV Charge Station System Reliability Modeling and Analysis; SAE Technical Paper, 2017-01-0198; SAE International: Warrendale, PA, USA, 2017. [Google Scholar] [CrossRef]
  34. UNECE Transport Vehicle Regulations. Available online: https://unece.org/transport/vehicle-regulations (accessed on 18 July 2023).
  35. Xu, K.; Wang, X.; Meng, X.; Liu, G.; Wen, B.; Zhou, R. Comparative research on standards and regulations of electric vehicle post crash safety requirement. In Proceedings of the 2014 IEEE Conference and Expo Transportation Electrification Asia-Pacific (ITEC Asia-Pacific), Beijing, China, 31 August–3 September 2014; pp. 1–4. [Google Scholar] [CrossRef]
  36. Kilian, P.; Köhler, A.; Van Bergen, P.; Gebauer, C.; Pfeufer, B.; Koller, O.; Bertsche, B. Principle Guidelines for Safe Power Supply Systems Development. IEEE Access 2021, 9, 107751–107766. [Google Scholar] [CrossRef]
  37. Gong, C.; Liu, J.; Han, Y.; Hu, Y.; Yu, H.; Zeng, R. Safety of Electric Vehicles in Crash Conditions: A Review of Hazards to Occupants. Regulatory Activities. and Technical Support. IEEE Trans. Transp. Electrif. 2022, 8, 3870–3883. [Google Scholar] [CrossRef]
  38. Zhang, Z.; He, S.; Wang, K. Research on the Crash Test’s Safety in NCAP of Electrical Vehicle. In Proceedings of the 2017 9th International Conference on Measuring Technology and Mechatronics Automation (ICMTMA), Changsha, China, 14–15 January 2017; pp. 310–315. [Google Scholar] [CrossRef]
  39. The European New Car Assessment Programme. Available online: https://www.euroncap.com/en (accessed on 17 July 2023).
  40. Karner, D.B. Current events in vehicle battery safety. In Proceedings of the Tenth Annual Battery Conference on Applications and Advances, Long Beach, CA, USA, 10–13 January 1995; pp. 167–169. [Google Scholar] [CrossRef]
  41. Freschi, F.; Mitolo, M.; Tommasini, R. Electrical safety of electric vehicles. In Proceedings of the 2017 IEEE/IAS 53rd Industrial and Commercial Power Systems Technical Conference (I&CPS), Niagara Falls, ON, Canada, 7–11 May 2017; pp. 1–5. [Google Scholar] [CrossRef]
  42. Hu, P.; Jiang, Z.; Qi, C.; Guo, R.; Han, X.; An, W. Front crash simulation and design improvement of a pure electric vehicle. In Proceedings of the 2011 International Conference on Electrical and Control Engineering, Yichang, China, 16–18 September 2011; pp. 1085–1088. [Google Scholar] [CrossRef]
  43. Romo, J.; Cañibano, E.; Merino, J.C. Lightweighting and passive safety for urban electric vehicle. In Proceedings of the 2017 Electric Vehicles International Conference (EV), Bucharest, Romania, 5–6 October 2017; pp. 1–5. [Google Scholar] [CrossRef]
  44. Vora, K.C.; Agrewale, M.R.B.; Desai, M.M.; Mishra, H.; Narkar, O. Development analysis and testing of an electric all-terrain vehicle. In Proceedings of the 2017 IEEE Transportation Electrification Conference (ITEC-India), Pune, India, 13–15 December 2017; pp. 1–6. [Google Scholar] [CrossRef]
  45. Molinero Fresnillo, R.; Core Almarza, E.; Zink, L.; Edwards, M.J.; Holtz, J.; Steen Pedersen, M.; Torres Heras, R. Passive safety strategy for electric lightweight vehicles with multimaterial body and centered driver position—Opportunities and limitations. In Proceedings of the 25th International Technical Conference on the Enhanced Safety of Vehicles, Detroit, MI, USA, 5–8 June 2017; pp. 1346–1360. [Google Scholar]
  46. Van Poppel, J.; Stern, A.R.; Fortenbaugh, D. A parametric study of an adaptive load-limiting restraint system with weight sensing considerations. In Proceedings of the 26th International Technical Conference on the Enhanced Safety of Vehicles, Eindhoven, The Netherlands, 10–13 June 2019; pp. 258–279. [Google Scholar]
  47. Chen, G.; Shi, M.F.; Tyan, T. Optimization of front end structures for IIHS small overlap frontal crash test. In Proceedings of the 26th International Technical Conference on the Enhanced Safety of Vehicles, Eindhoven, The Netherlands, 10–13 June 2019; pp. 955–964. [Google Scholar]
  48. Wei, X.; Ma, Z.; Zhu, X.; Zheng, Y. An Analysis of the Safety of Low-Speed Electric Vehicles in the Event of a Frontal Collision; SAE Technical Paper 2021-01-5011; SAE International: Warrendale, PA, USA, 2021. [Google Scholar] [CrossRef]
  49. Zhang, X.; Wang, K.; Zhao, Y. Electrical vehicle crash test technique research. In Proceedings of the 2011 International Conference on Electronic & Mechanical Engineering and Information Technology, Harbin, China, 12–14 August 2011; pp. 4393–4396. [Google Scholar] [CrossRef]
  50. Wang, Z.; Shi, S.; Liu, P. Research Progress on Collision Safety of Electric Vehicles. In Proceedings of the 2011 Third International Conference on Measuring Technology and Mechatronics Automation, Shanghai, China, 6–7 January 2011; pp. 153–156. [Google Scholar] [CrossRef]
  51. Ruina, D.; He, C.; Qiang, Z.; Keqiang, L.; Yusheng, L. ACC of electric vehicles with coordination control of fuel economy and tracking safety. In Proceedings of the 2012 IEEE Intelligent Vehicles Symposium, Madrid, Spain, 3–7 June 2012; 2012; pp. 240–245. [Google Scholar] [CrossRef]
  52. Guirong, Z.; Henghai, Z. Research of the electric vehicle safety. In Proceedings of the World Automation Congress 2012, Puerto Vallarta, Mexico, 24–28 June 2012; pp. 1–4. [Google Scholar]
  53. Fornells, A.; Parera, N. Safety Protocol for Crash Tests Involving Electric and Hybrid Vehicles; SAE Technical Paper 2017-26-0010; SAE International: Warrendale, PA, USA, 2017. [Google Scholar] [CrossRef]
  54. Haque, T.S.; Rahman, M.H.; Islam, M.R.; Razzak, M.A.; Badal, F.R.; Ahamed, M.H.; Moyeen, S.I.; Das, S.K.; Ali, M.F.; Tasneem, Z.; et al. A Review on Driving Control Issues for Smart Electric Vehicles. IEEE Access 2021, 9, 135440–135472. [Google Scholar] [CrossRef]
  55. Feng, J.; Tian, Z.; Cui, J.; Zhou, F.; Tan, G. Downhill Safety Assistant Driving System for Battery Electric Vehicles on Mountain Roads; SAE Technical Paper 2019-01-2129; SAE International: Warrendale, PA, USA, 2019. [Google Scholar] [CrossRef]
  56. Vavilapalli, K.R.; Abhijith, V.P.; Chandrashekhar, A.L.A. Implementation of ABS/ESC systems for light weight electric vehicle. In Proceedings of the 2017 IEEE Transportation Electrification Conference (ITEC-India), Pune, India, 13–15 December 2017; pp. 1–6. [Google Scholar] [CrossRef]
  57. Savitski, D.; Ivanov, V.; Shyrokau, B.; De Smet, J.; Theunissen, J.; Shyrokau, B. Experimental Study on Continuous ABS Operation in Pure Regenerative Mode for Full Electric Vehicle. SAE Int. J. Passeng. Cars Mech. Syst. 2015, 8, 364–369. [Google Scholar] [CrossRef]
  58. Mohamed, E.; Abouel-Seoud, S.; Elsayed, M. Performance Analysis of the ABS Control on Parallel Hybrid Electric Vehicle Equipped with Regenerative Braking System. SAE Int. J. Passeng. Cars Electron. Electr. Syst. 2015, 8, 477–491. [Google Scholar] [CrossRef]
  59. Wang, C.; Yu, H.; Zhang, L.; Wang, Z.; Wang, Q.; Cao, D. Post-Impact Stability Control for Four-Wheel- Independently-Actuated Electric Vehicles. In Proceedings of the 2020 Chinese Automation Congress (CAC), Shanghai, China, 6–8 November 2020; pp. 7197–7202. [Google Scholar] [CrossRef]
  60. Guodong, Y.; Qi, C.; Ahmed, Q.; Xianjian, J.; Chentong, B. Yaw stability of four-wheel-drive electric vehicle based on multi-model predictive control. In Proceedings of the 2015 34th Chinese Control Conference (CCC), Hangzhou, China, 28–30 July 2015; pp. 8159–8164. [Google Scholar] [CrossRef]
  61. Zhao, H.; Chen, W.; Zhao, J.; Zhang, Y.; Chen, H. Modular Integrated Longitudinal. Lateral. and Vertical Vehicle Stability Control for Distributed Electric Vehicles. IEEE Trans. Veh. Technol. 2019, 68, 1327–1338. [Google Scholar] [CrossRef]
  62. Dehkordi, S.G.; Cholette, M.E.; Larue, G.S.; Rakotonirainy, A.; Glaser, S. Energy Efficient and Safe Control Strategy for Electric Vehicles Including Driver Preference. IEEE Access 2021, 9, 11109–11122. [Google Scholar] [CrossRef]
  63. Van Schalkwyk, D.J.; Kamper, M.J. Effect of Hub Motor Mass on Stability and Comfort of Electric Vehicles. In Proceedings of the 2006 IEEE Vehicle Power and Propulsion Conference, Windsor, UK, 6–8 September 2006; pp. 1–6. [Google Scholar] [CrossRef]
  64. Neurauter, M.L.; Roan, M.; Song, M.; Harwood, L.; Moore, D.; Glaser, D. Electric vehicle detectability by the vision impaired: Quantifying impact of vehicle generated acoustic signatures on minimum detection distances. In Proceedings of the 25th International Technical Conference on the Enhanced Safety of Vehicles, Detroit, MI, USA, 5–8 June 2017. [Google Scholar]
  65. Garrott, W.R.; Hoover, R.L. Selection of NHTSA’s sound analysis code. In Proceedings of the 25th International Technical Conference on the Enhanced Safety of Vehicles, Detroit, MI, USA, 5–8 June 2017. [Google Scholar]
  66. Aboelsaoud, M.; Taha, A.A.; Elazm, M.A.; Elgamal, H. Comparative analysis of Hydroplaning in Electric and ICE Vehicles. In Proceedings of the 2022 IEEE 2nd International Maghreb Meeting of the Conference on Sciences and Techniques of Automatic Control and Computer Engineering (MI-STA), Sabratha, Libya, 23–25 May 2022; pp. 59–63. [Google Scholar] [CrossRef]
  67. Zhang, K.; Yin, Z.; Yang, X.; Yan, Z.; Huang, Y. Quantitative assessment of electric safety protection for electric vehicle charging equipment. In Proceedings of the 2017 International Conference on Circuits. Devices and Systems (ICCDS), Chengdu, China, 5–8 September 2017; pp. 89–94. [Google Scholar] [CrossRef]
  68. Linru, J.; Yuanxing, Z.; Taoyong, L.; Xiaohong, D.; Jing, Z. Analysis on Charging Safety and Optimization of Electric Vehicles. In Proceedings of the 2020 IEEE 6th International Conference on Computer and Communications (ICCC), Chengdu, China, 11–14 December 2020; pp. 2382–2385. [Google Scholar] [CrossRef]
  69. Wang, B.; Dehghanian, P.; Wang, S.; Mitolo, M. Electrical Safety Considerations in Large-Scale Electric Vehicle Charging Stations. IEEE Trans. Ind. Appl. 2019, 55, 6603–6612. [Google Scholar] [CrossRef]
  70. Ganesh, V.; Ajay Krishna, V.M.; Ajit Ram, R.R. Safety Feature in Electric Vehicle at Public Charging Station. In Proceedings of the 2021 7th International Conference on Electrical Energy Systems (ICEES), Chennai, India, 11–13 February 2021; pp. 156–161. [Google Scholar] [CrossRef]
  71. Sabbella, R.R.; Arunachalam, M. Functional Safety Development of Motor Control Unit for Electric Vehicles. In Proceedings of the 2019 IEEE Transportation Electrification Conference (ITEC-India), Bengaluru, India, 17–19 December 2019; pp. 1–6. [Google Scholar] [CrossRef]
  72. Alexandersson, S. Functional safety and EMC for the automotive industry. In Proceedings of the 2008 IEEE International Symposium on Electromagnetic Compatibility, Detroit, MI, USA, 18–22 August 2008; pp. 1–6. [Google Scholar] [CrossRef]
  73. Wang, S. Improve vehicle’s function safety with an approach investigating vehicle’s electromagnetic interference with its function safety. In Proceedings of the 2011 IEEE Vehicle Power and Propulsion Conference, Chicago, IL, USA, 6–9 September 2011; pp. 1–7. [Google Scholar] [CrossRef]
  74. Tao, C. Functional safety concept design of hybrid electric vehicle following ISO 26262. In Proceedings of the 2014 IEEE Conference and Expo Transportation Electrification Asia-Pacific (ITEC Asia-Pacific), Beijing, China, 31 August–3 September 2014; pp. 1–6. [Google Scholar] [CrossRef]
  75. Mader, R.; Martin, H.; Obendrauf, R.; Prinz, P.; Winkler, B.; Grießnig, G. A framework for model-based safety requirements round-trip engineering. In Proceedings of the 10th IET System Safety and Cyber-Security Conference 2015, Bristol, UK, 21–22 October 2015; pp. 1–6. [Google Scholar] [CrossRef]
  76. Yanwen, L.; Xiyang, W. Functional Safety Analysis for the Design of VCU Used in Pure Electric Vehicles. In Proceedings of the 2017 4th International Conference on Information Science and Control Engineering (ICISCE), Changsha, China, 21–23 July 2017; pp. 1004–1008. [Google Scholar] [CrossRef]
  77. Wu, Z.; Lu, K.; Zhu, Y.; Lei, X.; Duan, L.; Zhao, J. Functional Safety and Secure CAN in Motor Control System Design for Electric Vehicles; SAE Technical Paper 2017-01-1255; SAE International: Warrendale, PA, USA, 2017. [Google Scholar] [CrossRef]
  78. Shankar Kumar, M.N.; Balakrishnan, K. Functional Safety Development of Battery Management System for Electric Vehicles. In Proceedings of the 2019 IEEE Transportation Electrification Conference (ITEC-India), Bengaluru, India, 17–19 December 2019; pp. 1–6. [Google Scholar] [CrossRef]
  79. Christiaens, S.; Ogrzewalla, J.; Pischinger, S. Functional Safety for Hybrid and Electric Vehicles; SAE Technical Paper 2012-01-0032; SAE International: Warrendale, PA, USA, 2012. [Google Scholar] [CrossRef]
  80. Batchu, S. Functional Safety in Inverter Hardware; SAE Technical Paper 2016-28-0166; SAE International: Warrendale, PA, USA, 2016. [Google Scholar] [CrossRef]
  81. Moure, C.; Kersting, K. Development of Functional Safety in a Multi-Motor Control System for Electric Vehicles; SAE Technical Paper 2012-01-0028; SAE International: Warrendale, PA, USA, 2012. [Google Scholar] [CrossRef]
  82. Zakrzewicz, W.; Sys, E.; Mrowicki, A.; Siczek, K.; Kubiak, P. Safety issues for electric and hybrid vehicles. In Proceedings of the 2020 XII International Science-Technical Conference Automotive Safety, Kielce, Poland, 21–23 October 2020; pp. 1–7. [Google Scholar] [CrossRef]
  83. Electric Cars Involved in More Accidents than Regular Vehicles. Study Shows. The Brussels Times. Sunday. 11 September 2022. Available online: https://www.brusselstimes.com/287315/electric-cars-involved-in-more-accidents-than-regular-vehicles-study-shows (accessed on 17 July 2023).
  84. Bodine, R.; Brennan, R. Gas vs. Electric Car Fires. 2023 Findings. Available online: https://www.autoinsuranceez.com/gas-vs-electric-car-fires/ (accessed on 18 July 2023).
  85. Zakazy WJAZDU dla Samochodów Elektrycznych „Bo Pożar” to Idiotyczne Sianie Paniki. Available online: https://spidersweb.pl/autoblog/pozary-samochodow-elektrycznych-w-polsce-bzdura/ (accessed on 17 July 2023). (In Polish).
  86. Dong, H.; Fan, J.; Wang, J.; Ren, Y.; Sun, W.; Yuan, R. Fault analysis of power battery based on voltage data record of realworld fired electric vehicles. In Proceedings of the 3rd International Conference on Computer Information and Big Data Applications (CIBDA 2022), Wuhan, China, 25–27 March 2022; pp. 1–10. [Google Scholar]
  87. Schei Blikeng, L.; Hegén Agerup, S. Fire in Electric Cars; SAE Technical Paper 2015-01-1382; SAE International: Warrendale, PA, USA, 2015. [Google Scholar] [CrossRef]
  88. Sun, P.; Bisschop, R.; Niu, H.; Huang, X. A Review of Battery Fires in Electric Vehicles. Fire Technol. 2020, 56, 1361–1410. [Google Scholar] [CrossRef]
  89. Meghana, N.; Pushparaju, M.; Kavitha, M.; Kalyan Chakravarthy, N.S.; Reddy, D.M. A Critical Review on Electric Vehicle Battery Failures and Causes. In Proceedings of the 2022 IEEE 2nd International Conference on Sustainable Energy and Future Electric Transportation (SeFeT), Hyderabad, India, 4–6 August 2022; pp. 1–5. [Google Scholar] [CrossRef]
  90. Chet Sandberg, P.E. Integrating battery energy storage with a BMS for reliability. efficiency. and safety in vehicles. In Proceedings of the 2012 IEEE Transportation Electrification Conference and Expo (ITEC), Dearborn, MI, USA, 18–20 June 2012; pp. 1–3. [Google Scholar] [CrossRef]
  91. Sasirekha, P.; Sneka, E.; Velmurugan, B.; Sahul Hameed, M.; Sivasankar, P. A Battery Monitoring System based on IoT for Electric Vehicles. In Proceedings of the 2023 5th International Conference on Smart Systems and Inventive Technology (ICSSIT), Tirunelveli, India, 23–25 January 2023. [Google Scholar] [CrossRef]
  92. Wang, J.; Wang, C.; Deng, H.; Huang, H.; Li, L. Electric Vehicle Charging Detection and Early Warning System Based on Internet of Thing. In Proceedings of the 2020 7th International Conference on Information, Cybernetics, and Computational Social Systems (ICCSS), Guangzhou, China, 13–15 November 2020; pp. 650–654. [Google Scholar] [CrossRef]
  93. Li, Z.; Chenglong, L. Research on Fire Performance Test Technology of Electric Vehicle Power Battery System. In Proceedings of the 2022 2nd International Signal Processing. Communications and Engineering Management Conference (ISPCEM), Montreal, ON, Canada, 25–27 November 2022; pp. 340–344. [Google Scholar] [CrossRef]
  94. Zhou, Y.; Zhu, X.; Wang, Z.; Shan, T.; Zhang, J.; Sun, Z. Safety assessment of thermal runaway behavior of lithium-ion cells with actual installed state. Appl. Therm. Eng. 2023, 229, 120617. [Google Scholar] [CrossRef]
  95. Zhang, J.; Zhang, L.; Sun, F.; Wang, Z. An Overview on Thermal Safety Issues of Lithium-ion Batteries for Electric Vehicle Application. IEEE Access 2018, 6, 23848–23863. [Google Scholar] [CrossRef]
  96. Song, L.; Zheng, Y.; Xiao, Z.; Wang, C.; Long, T. Review on Thermal Runaway of Lithium-Ion Batteries for Electric Vehicles. J. Electron. Mater. 2022, 51, 30–46. [Google Scholar] [CrossRef]
  97. Citarella, M.; Schiffbänker, P.; Suzzi, D.; Maier, G.; Brunnsteiner, B.; Schneider, J. Computational Modelling of Thermal Runaway Propagation in Lithium-Ion Battery Systems. In Proceedings of the 2019 IEEE Transportation Electrification Conference (ITEC-India), Bengaluru, India, 17–19 December 2019; pp. 1–5. [Google Scholar] [CrossRef]
  98. Hong, J.; Wang, Z.; Qu, C.; Ma, F.; Xu, X.; Yang, J.; Zhang, J.; Zhou, Y.; Shan, T.; Hou, Y. Fault Prognosis and Isolation of Lithium-Ion Batteries in Electric Vehicles Considering Real-Scenario Thermal Runaway Risks. IEEE J. Emerg. Sel. Top. Power Electron. 2023, 11, 88–99. [Google Scholar] [CrossRef]
  99. Gao, W.; Li, X.; Ma, M.; Fu, Y.; Jiang, J.; Mi, C. Case Study of an Electric Vehicle Battery Thermal Runaway and Online Internal Short-Circuit Detection. IEEE Trans. Power Electron. 2021, 36, 2452–2455. [Google Scholar] [CrossRef]
  100. Sun, Z.; Wang, Z.; Liu, P.; Zhang, Z.; Wang, S.; Dorrell, D.G. Relative Entropy based Lithium-ion Battery Pack Short Circuit Detection for Electric Vehicle. In Proceedings of the 2020 IEEE Energy Conversion Congress and Exposition (ECCE), Detroit, MI, USA, 11–15 October 2020. [Google Scholar] [CrossRef]
  101. Xu, G.; Han, Q.; Chen, H.; Xia, Y.; Liu, Z.; Tian, S. Safety warning analysis for power battery packs in electric vehicles with running data. J. Energy Storage 2022, 56, 105878. [Google Scholar] [CrossRef]
  102. Li, X.; Li, J.; Abdollahi, A.; Jones, T. Data-driven Thermal Anomaly Detection for Batteries using Unsupervised Shape Clustering. In Proceedings of the 2021 IEEE 30th International Symposium on Industrial Electronics (ISIE), Kyoto, Japan, 20–23 June 2021. [Google Scholar] [CrossRef]
  103. Li, D.; Zhang, Z.; Wang, Z.; Liu, P.; Liu, Z.; Lin, N. Timely Thermal Runaway Prognosis for Battery Systems in Real-World Electric Vehicles Based on Temperature Abnormality. IEEE J. Emerg. Sel. Top. Power Electron. 2023, 11, 120–130. [Google Scholar] [CrossRef]
  104. Liu, P.; Wang, J.; Wang, Z.; Zhang, Z.; Wang, S.; Dorrell, D.G. High-dimensional data abnormity detection based on improved Variance-of-Angle (VOA) algorithm for electric vehicles battery. In Proceedings of the 2019 IEEE Energy Conversion Congress and Exposition (ECCE), Baltimore, MD, USA, 29 September–3 October 2019. [Google Scholar] [CrossRef]
  105. Chen, M.; Dongxu, O.; Cao, S.; Liu, J.; Wang, Z.; Wang, J. Effects of heat treatment and SOC on fire behaviors of lithium-ion batteries pack. J. Therm. Anal. Calorim. 2019, 136, 2429–2437. [Google Scholar] [CrossRef]
  106. Wang, Z.; Ouyang, D.; Chen, M.; Wang, X.; Zhang, Z.; Wang, J. Fire behavior of lithium-ion battery with different states of charge induced by high incident heat fluxes. J. Therm. Anal. Calorim. 2019, 136, 2239–2247. [Google Scholar] [CrossRef]
  107. Li, H.; Peng, W.; Yang, X.; Chen, H.; Sun, J.; Wang, Q. Full-Scale Experimental Study on the Combustion Behavior of Lithium Ion Battery Pack Used for Electric Vehicle. Fire Technol. 2020, 56, 2545–2564. [Google Scholar] [CrossRef]
  108. Han, Z.; Zhang, X.; Yu, Y.; Du, Z.; Hwang, H.Y.; Liu, L.; Deng, L. Experimental Investigation of Fire Extinguishing of a Full-Size Battery Box with FK-5-1-12. Fire Technol. 2023, 59, 1269–1282. [Google Scholar] [CrossRef]
  109. Höhne, C.C.; Gettwert, V.; Frank, F.; Kilian, S.; Menrath, A. Bench-scale fuel fire test for materials of rechargeable energy storage system housings. J. Therm. Anal. Calorim. 2023, 148, 305–313. [Google Scholar] [CrossRef]
  110. Anderson, J.; Larsson, F.; Andersson, P.; Mellander, B.E. Thermal modeling of fire propagation in lithium-ion batteries. In Proceedings of the 24th International Technical Conference on the Enhanced Safety of Vehicles, Gothenburg, Sweden, 8–11 June 2015; pp. 204–279. [Google Scholar]
  111. Singh, A.; Jana, M.; Basu, S. Role of OEM’s and Cell Manufacturer’s for Safety in Electric Vehicles. In Proceedings of the 2021 IEEE Transportation Electrification Conference (ITEC-India), New Delhi, India, 16–19 December 2021; pp. 1–5. [Google Scholar] [CrossRef]
  112. Aalund, R.; Diao, W.; Kong, L.; Pecht, M. Understanding the Non-Collision Related Battery Safety Risks in Electric Vehicles a Case Study in Electric Vehicle Recalls and the LG Chem Battery. IEEE Access 2021, 9, 89527–89532. [Google Scholar] [CrossRef]
  113. Linja-aho, V. Assessing the Electrical Risks in Electric Vehicle Repair. In Proceedings of the 2022 IEEE IAS Electrical Safety Workshop (ESW), Jackonwille, FL, USA, 7–11 March 2022. [Google Scholar] [CrossRef]
  114. La Scala, A.; Sabbà, M.F.; Foti, D. Fire Hazard of Electric Vehicles in Enclosed Structures. In Proceedings of the 2022 AEIT International Annual Conference (AEIT), Rome, Italy, 3–5 October 2022. [Google Scholar] [CrossRef]
  115. Chen, Y.; Kang, Y.; Zhao, Y.; Wang, L.; Liu, J.; Li, Y.; Liang, Z.; He, X.; Li, X.; Tavajohi, N.; et al. A review of lithium-ion battery safety concerns: The issues. strategies. and testing standards. J. Energy Chem. 2021, 59, 83–99. [Google Scholar] [CrossRef]
  116. Huang, W.; Feng, X.; Han, X.; Zhang, W.; Jiang, F. Questions and Answers Relating to Lithium-Ion Battery Safety Issues. Cell Rep. Phys. Sci. 2021, 2, 100285. [Google Scholar] [CrossRef]
  117. Murray, K.; Lele, S. Electric Vehicle Battery Safety and Compliance; SAE Technical Paper 2023-01-0597; SAE International: Warrendale, PA, USA, 2023. [Google Scholar] [CrossRef]
  118. Safety Risks to Emergency Responders from Lithium-Ion Battery Fires in Electric Vehicles; Safety Report NTSB/SR-20/01 PB2020-101011; National Transportation Safety Board: Washington, DC, USA, 2020.
  119. Barbat, S.; Mehall, M.; Nayak, R.; Nusholtz, G.; Olds, N.; Shi, Y.; Stanko, W.; Tai Wang, J.; Weerappuli, P.; Xu, L.; et al. Crash Test Pulses for Advanced Batteries; SAE Technical Paper 2012-01-0548; SAE International: Warrendale, PA, USA, 2012. [Google Scholar] [CrossRef]
  120. Nusholtz, G.S.; Shi, Y.; Xu, L.; Olds, N.M.; Barbat, S.; Mehall, M.; Stanko, W.; Weerappuli, P.; Nayak, R.; Tai Wang, J.; et al. Idealized Vehicle Crash Test Pulses for Advanced Batteries; SAE Technical Paper 2013-01-0764; SAE International: Warrendale, PA, USA, 2013. [Google Scholar] [CrossRef]
  121. Chen, P.; Xia, Y.; Zhou, Q. Safety Comparison of Geometric Configurations of Electric Vehicle Battery under Side Pole Impact; SAE Technical Paper 2022-01-0265; SAE International: Warrendale, PA, USA, 2022. [Google Scholar] [CrossRef]
  122. Electric Vehicles and the Untold Secret: Are They Actually Worse for the Environment and Dangerous than Gas? Available online: https://www.miamiherald.com/contributor-content/article272574443.html (accessed on 27 July 2023).
  123. Takahashi, M.; Takeuchi, M.; Maeda, K.; Nakagawa, S. Comparison of Fires in Lithium-Ion Battery Vehicles and Gasoline Vehicles. SAE Int. J. Passeng. Cars Electron. Electr. Syst. 2014, 7, 213–220. [Google Scholar] [CrossRef]
  124. Lubczański, M. Nie Tylko Kontenery Gaśnicze, tak Można Ugasić Elektryka. Available online: https://e.autokult.pl/nie-tylko-kontenery-gasnicze-tak-mozna-ugasic-elektryka.6883395986590624a (accessed on 27 July 2023). (In Polish).
  125. Jej Elektryk Splonal w Garazu Teraz ma Problem. Available online: https://www.o2.pl/informacje/jej-elektryk-splonal-w-garazu-teraz-ma-problemy-6915686180911840a (accessed on 27 July 2023). (In Polish).
  126. Cui, Y.; Liu, J.; Han, X.; Sun, S.; Cong, B. Full-scale experimental study on suppressing lithium-ion battery pack fires from electric vehicles. Fire Saf. J. 2022, 129, 103562. [Google Scholar] [CrossRef]
  127. Yu, D.; Li, Y.; Zhang, S.; Dong, H.; Han, G.; Xian, X. Fire Extinguishing Test of Lithium-Ion Battery Case in Electric Bus. In Proceedings of the 2019 9th International Conference on Fire Science and Fire Protection Engineering (ICFSFPE), Chengdu, China, 18–19 October 2019. [Google Scholar] [CrossRef]
  128. Do Electric Vehicles Pose Additional Hazards in a Crash. Available online: https://ankinlaw.com/do-electric-vehicles-pose-additional-hazards-in-a-crash (accessed on 27 July 2023).
  129. Geisbauer, C.; Wöhrl, K.; Lott, S.; Nebl, C.; Schweiger, H.-G.; Goertzb, R.; Kubjatko, T. Scenarios Involving Accident-Damaged Electric Vehicles. Transp. Res. Procedia 2021, 55, 1484–1489. [Google Scholar] [CrossRef]
  130. Kang, S.; Kwon, M.; Choi, J.Y.; Choi, S. Full-scale fire testing of battery electric vehicles. Appl. Energy 2023, 332, 120497. [Google Scholar] [CrossRef]
  131. Sturm, P.; Fößleitner, P.; Fruhwirt, D.; Galler, R.; Wenighofer, R.; Heindl, S.F.; Krausbar, S.; Heger, O. Fire tests with lithium-ion battery electric vehicles in road tunnels. Fire Saf. J. 2022, 134, 103695. [Google Scholar] [CrossRef]
  132. Held, M.; Tuchschmid, M.; Zennegg, M.; Figi, R.; Schreiner, C.; Mellert, L.D.; Welte, U.; Kompatscher, M.; Hermann, M.; Nachef, L. Thermal runaway and fire of electric vehicle lithium-ion battery and contamination of infrastructure facility. Renew. Sustain. Energy Rev. 2022, 165, 112474. [Google Scholar] [CrossRef]
Figure 1. Global electric car stock in selected regions, 2010–2022 License: CC BY 4.0 [6]. Notes: BEV = battery electric vehicle; PHEV = plug-in hybrid electric vehicle. Electric car stock in this figure refers to passenger light-duty vehicles. In “Europe”, European Union countries, Norway, the United Kingdom, Iceland, Israel, Switzerland, and Turkey. Main markets in “Other” include Australia, Brazil, Canada, Chile, Mexico, India, Indonesia, Japan, Malaysia, New Zealand, South Africa, Korea, and Thailand.
Energies 17 00495 g001
Figure 2. Car model availability by powertrain, (a) 2010–2022. (b) Breakdown of available cars by powertrain and segment in 2022 (right); license: CC BY 4.0 [6]. Notes: Small cars include A and B segments. Medium cars include C and D segments. Crossovers are a type of sports utility vehicle (SUV) built on a passenger car platform. Large cars include E and F segments and multi-purpose vehicles.
Energies 17 00495 g002
Figure 3. Number of BEV and PHEV passenger cars (M1&N1) in selected European countries in 2022 (data from [8]).
Energies 17 00495 g003
Figure 7. Total number of publicly accessible AC recharging points in EU-27, according to the AFIR categorization [8].
Energies 17 00495 g007
Figure 8. Total number of publicly accessible DC recharging points in EU-27, according to the AFIR categorization [8].
Energies 17 00495 g008
Figure 9. Euro-NCAP car safety assessment: (a) EVs vs. ICEVs; (b) EV rating trends. 5*—percentage of vehicles with the highest overall rating (5 stars). AOP—adult occupant protection. ChOP—child occupant protection. VRU—vulnerable road user protection. SA—safety assist (evaluation of driver-assistance and crash-avoidance technologies).
Energies 17 00495 g009
Table 1. Total EVs (M1&N1) and passenger cars in selected European countries in 2022 (data form [8]).
KrajBEVsPHEVsEVsTPCsBEVs/TPCs
[%]
PHEVs/TPCs
[%]
EVs/TPCs
[%]
Austria117,91942,289160,2085,677,6142.080.742.82
Belgium96,983183,122280,1056,868,8951.412.674.08
Bulgaria3142189750393,162,1640.100.060.16
Croatia4150163457842,009,4470.210.080.29
Cyprus5666621228711,8740.080.090.17
CzechRepublic14,798872023,5186,904,1040.210.130.34
Denmark10,145798,187199,6443,163,6313.213.106.31
Estonia30246443668962,4630.310.070.38
Finland49,287106,276155,5634,084,5841.212.603.81
France761,494412,6931,174,18745,527,4391.670.912.58
Germany1,034,947932,1521,967,09952,000,3251.991.793.78
Greece643412,28318,7176,600,5300.100.190.29
Hungary16,85614,66931,5254,622,5700.360.320.68
Iceland18,29220,70038,992307,4605.956.7312.68
Ireland37,94025,52363,4632,766,4301.370.922.29
Italy185,086184,142369,22844,256,4330.420.420.84
Latvia21305692699837,4350.250.070.32
Liechtenstein3746443833,8811.100.191.29
Lithuania7561494912,5101,729,5290.440.290.73
Luxembourg15,32812,83428,162490,1423.132.625.75
Malta276227195481355,7890.780.761.54
Netherlands341,988187,074529,0629,950,8433.441.885.32
Norway533,911188,029721,9403,596,23414.855.2320.08
Poland27,56426,41653,98029,584,7560.090.090.18
Portugal71,60759,738131,3457,064,4761.010.851.86
Romania23,644832931,9738,702,4340.270.100.37
Slovakia4705421589202,831,7790.170.150.32
Slovenia7914154694601,299,3610.610.120.73
Spain118,100135,008253,10829,006,5650.410.470.88
Sweden223,677276,580500,2575,635,6583.974.918.88
Switzerland128,15872,982201,1405,236,8792.451.393.84
Turkey14,217234616,56318,819,3140.080.010.09
United
Kingdom
663,761431,0601,094,82137,251,5801.781.162.94
EU 273,281,0632,744,8706,025,933286,807,2701.140.962.10
Legend:
.....—countries where EV to TPC ratio exceeds 1%,
.....—union of countries where EV to TPC ratio exceeds 1%.
Table 2. AC charging power of EVs, including the powers of the recharging point and OBC [24,25,26,27].
Onboard Charger
3.7 kW
one-phase,
16 A
7.4 kW
one-phase,
32 A
11 kW
three-phase, 16 A
22 kW
three-phase, 32 A
Charging Point2.3 kW
one-phase,
10 A
2.3 kW (a)2.3 kW (a)2.3 kW (a)2.3 kW (a)
3.7 kW
one-phase,
16 A
3.7 kW (b)3.7 kW (a)3.7 kW (a) (1)3.7 kW (a)
7.4 kW
one-phase,
32 A
3.7 kW (d)7.4 kW (b)3.7 kW (c) (2)7.4 kW (a)
11 kW
three-phase,
16 A
3.7 kW (d)3.7 kW (c) (3)11 kW (b)11 kW (a)
22 kW
three-phase,
32 A
3.7 kW (d)7.4 kW (d) (4)11 kW (d)22 kW (b)
Legend:
(a)- limitations related to the recharging point,
(b)- no restrictions,
(c)- limitations related to the recharging point and the OBC,
(d)- OBC-related limitations (the vehicle cannot charge faster),
(1)- on-board charger that only accepts single-phase charging, which is a limitation attributed to the AC recharging point: 1 230   V 16   A 3.7   k W ,
(2)- on-board charger that only accepts single-phase charging and a 16 A current due to the its OBC limitations: 1 230   V 16   A 3.7   k W ,
(3)- on-board charger that only accepts a single phase offered by a three-phase recharging point, which has the ability to supply AC at 16 A: 1 230   V 16   A 3.7   k W ,
(4)- on-board charger that only accepts a single phase offered by a three-phase recharging station, which has the ability to supply AC at 32 A: 1 230   V 32   A 7.4   k W .
Table 3. Objectives regarding publicly accessible recharging pools and recharging stations (based on [30]).
Transportation NetworkDistance (1) along the TEN-T NetworkMinimum Power Output (2)
Recharging Pools (3)Recharging Stations (4)
(Number × Power)
Light-duty vehicles
Core network60 km300 kW 2025
600 kW 2030
1 × 150 kW 2025
2 × 150 kW 2030
Comprehensive network60 km300 kW 2030
600 kW 2035
1 × 150 kW 2030
2 × 150 kW 2035
Heavy-duty vehicles
Core network60 km1400 kW 2025
3500 kW 2030
1 × 350 kW 2025
2 × 350 kW 2030
Comprehensive network100 km1400 kW 2030
3500 kW 2035
1 × 350 kW 2030
2 × 350 kW 2035
Legend:
(1)- maximum distance between recharging pools in each direction of travel,
(2)- theoretical maximum output power distributed among individual recharging pools,
(3)- at least one recharging station per location,
(4)- recharging station(s) with individual output power,
2025- reaching the target by 31 December 2025,
2030- reaching the target by 31 December 2030,
2035- reaching the target by 31 December 2035,
Comprehensive transport network—is a transport network for ensuring accessibility and connectivity of all EU regions [31],
Core network—the transport network consists of those parts of the comprehensive network that are of the highest strategic importance for achieving the objectives for the development of the TEN-T.
Table 4. Recharging points by connector type and power category (data from [32]).
Buffer zones around TEN-T roads of public and semi-public e-charging points
1 km8 km
KrajType 2CCS50 kW ≤ p < 150 kW150 kW ≤ p < 350 kWp ≥ 350 kWType 2CCS50 kW ≤ p < 150 kW150 kW ≤ p < 350 kWp ≥ 350 kW
Austria225196127052613298731888652956146
Belgium74758901586146828,6951646447976101
Bulgaria1871616952316183111428249
Croatia1531437846105062401326420
Cyprys921046017313560
Czechia5403402337720207983264714720
Denmark25737501065964811,201124023194548
Estonia14546281442065734194
Finland22621015265704226211151956589926
France12,91363761400373371540,44610,42928655591769
Germany66206045827454558946,86011,94725848032862
Greece484541831010536520370
Hungary409181836920199341516612120
Ireland500174588530181828715110430
Italy48082068707119212423,159425021101749239
Latvia150836282282142106212
Lithuania36212285288774190142328
Luxembourg17832012209235761932
Malta720000960000
The Netherlands25,5942028323161666108,3622846572205183
Poland5383902664932244294763213535
Portugal818359276892642111231102424226
Romania662383214541613627043929728
Slovakia42621712166712315053271139
Slovenia31414968343111212021003632
Spain6048179299658312717,59433572064882144
Sweden73252350477170018220,06530157412069220
Legend:
- five countries with the highest number of recharging points in the analyzed subcategories in 1 km and 8 km buffer zone: .....—type 2, .....—CCS, .....—50 kW ≤ p < 150 kW, .....—150 kW ≤ p < 350 kW,
.....p ≥ 350 kW,
- one country with the highest number of recharging points in the analyzed subcategories: .....—in 1 km buffer zone, .....—in 8 km buffer zone.
Table 5. EVs per recharging point ratio along the TEN-T.
CountryRatio 1Ratio 2Ratio 3CountryRatio 1Ratio 2Ratio 3
Austria10.03.662.5Italy6.86.743.5
Belgium3.26.058.9Latvia5.01.315.0
Bulgaria3.42.010.1Lithuania7.85.139.8
Croatia5.62.217.3Luxembourg15.613.1268.9
Cyprus3.03.643.5Malta28.828.3NaN
Czech Republic5.13.017.8Netherlands3.11.7120.2
Denmark8.27.981.8Poland8.17.829.1
Estonia11.52.453.1Portugal13.211.058.2
Finland6.413.732.4Romania11.44.033.6
France15.08.173.0Slovakia2.72.49.3
Germany17.615.986.6Slovenia6.01.239.2
Greece5.81199.0Spain5.66.435.2
Hungary7.06.140.6Sweden9.712.074.2
Ireland18.012.1132.2EU 279.07.460.6
Legend:
-
Ratio 1—BEV/(Type 2 + CCS),
-
Ratio 2—PHEV/(Type 2 + CCS),
-
Ratio 3—BEV/CCS. UE 27—mean value for each ratio,
.....—countries where the number of passenger BEVs or PHEVs exceeded 100,000,
.....—top five EU countries with the highest number of passenger EVs.
Table 6. Charging time of selected EVs with AC and DC recharging points (data for EVs [25]).
EVBattery Capacity [kWh]OBC (AC Charging) [kW]Energy Consumption [Wh/km]Time for AC Charging * [h:min] by Charging Point of PowerDC Charging Power [kW]Time for DC Charging * [h:min]Driving Distance ***
[km]
2.3 kW3.7 kW7.4 kW11.0 kW22.0 kWMax. **Ave.
Dacia Spring26.87.41526:594:212:102:102:1034290:33105
VW ID.576.611.017919:5812:256:124:104:101431250:22256
Kia Niro EV64.811.016816:5410:305:153:313:3180700:33231
Audi Q4
e-tron
76.611.018919:5812:256:124:104:101431250:22243
Cupra Born58.011.016615:079:244:423:093:09124820:25209
Hyundai Kona Electric39.211.015710:136:213:102:082:0844370:38149
Tesla 357.511.014215:009:194:393:083:081701000:21242
Renault Zoe54.722.016514:168:524:262:581:2946410:48198
Legend:
* estimated charging time from 20% to 80% of battery capacity,
** EV limitations,
*** estimated driving distance for 60% battery consumption,
.....— AC charging above 10 h,
.....— limitation due to the OBC.
Table 7. Car fire statistics [84].
Car TypeFire Number (Total)Fire Number per 100k Sales
HEV16,0513474.5
ICEV199,5331529.9
EV5225.1
Disclaimer/Publisher’s Note: The statements, opinions and data contained in all publications are solely those of the individual author(s) and contributor(s) and not of MDPI and/or the editor(s). MDPI and/or the editor(s) disclaim responsibility for any injury to people or property resulting from any ideas, methods, instructions or products referred to in the content.

