
Scenario Development for Evaluating Carbon Capture and Utilization Concepts Using Steel Mill Exhaust Gases with Linear Optimization Models †

Abstract
1. Introduction
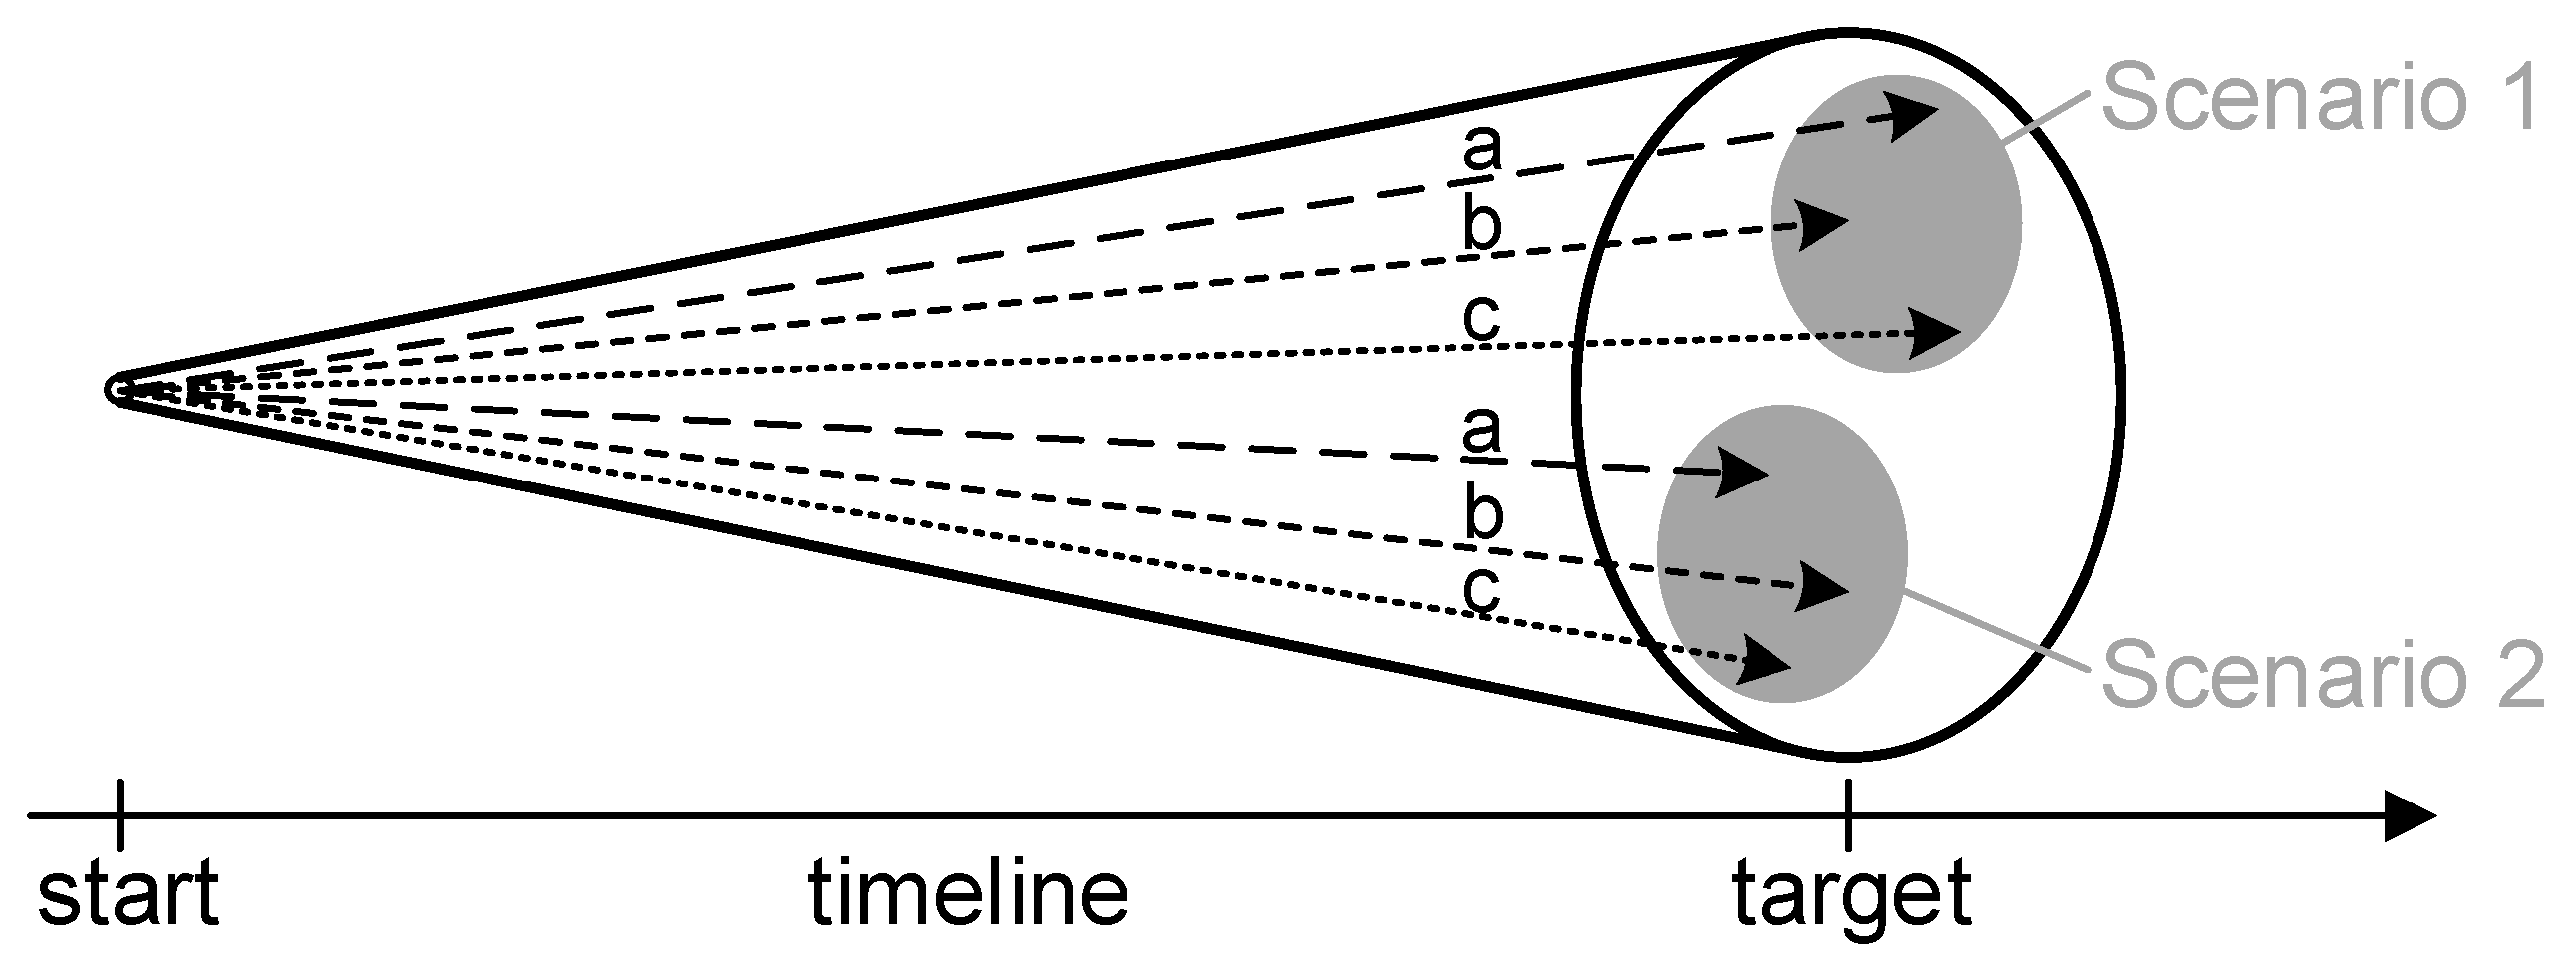
2. Scope and Characteristics of Scenarios in an MILP Model
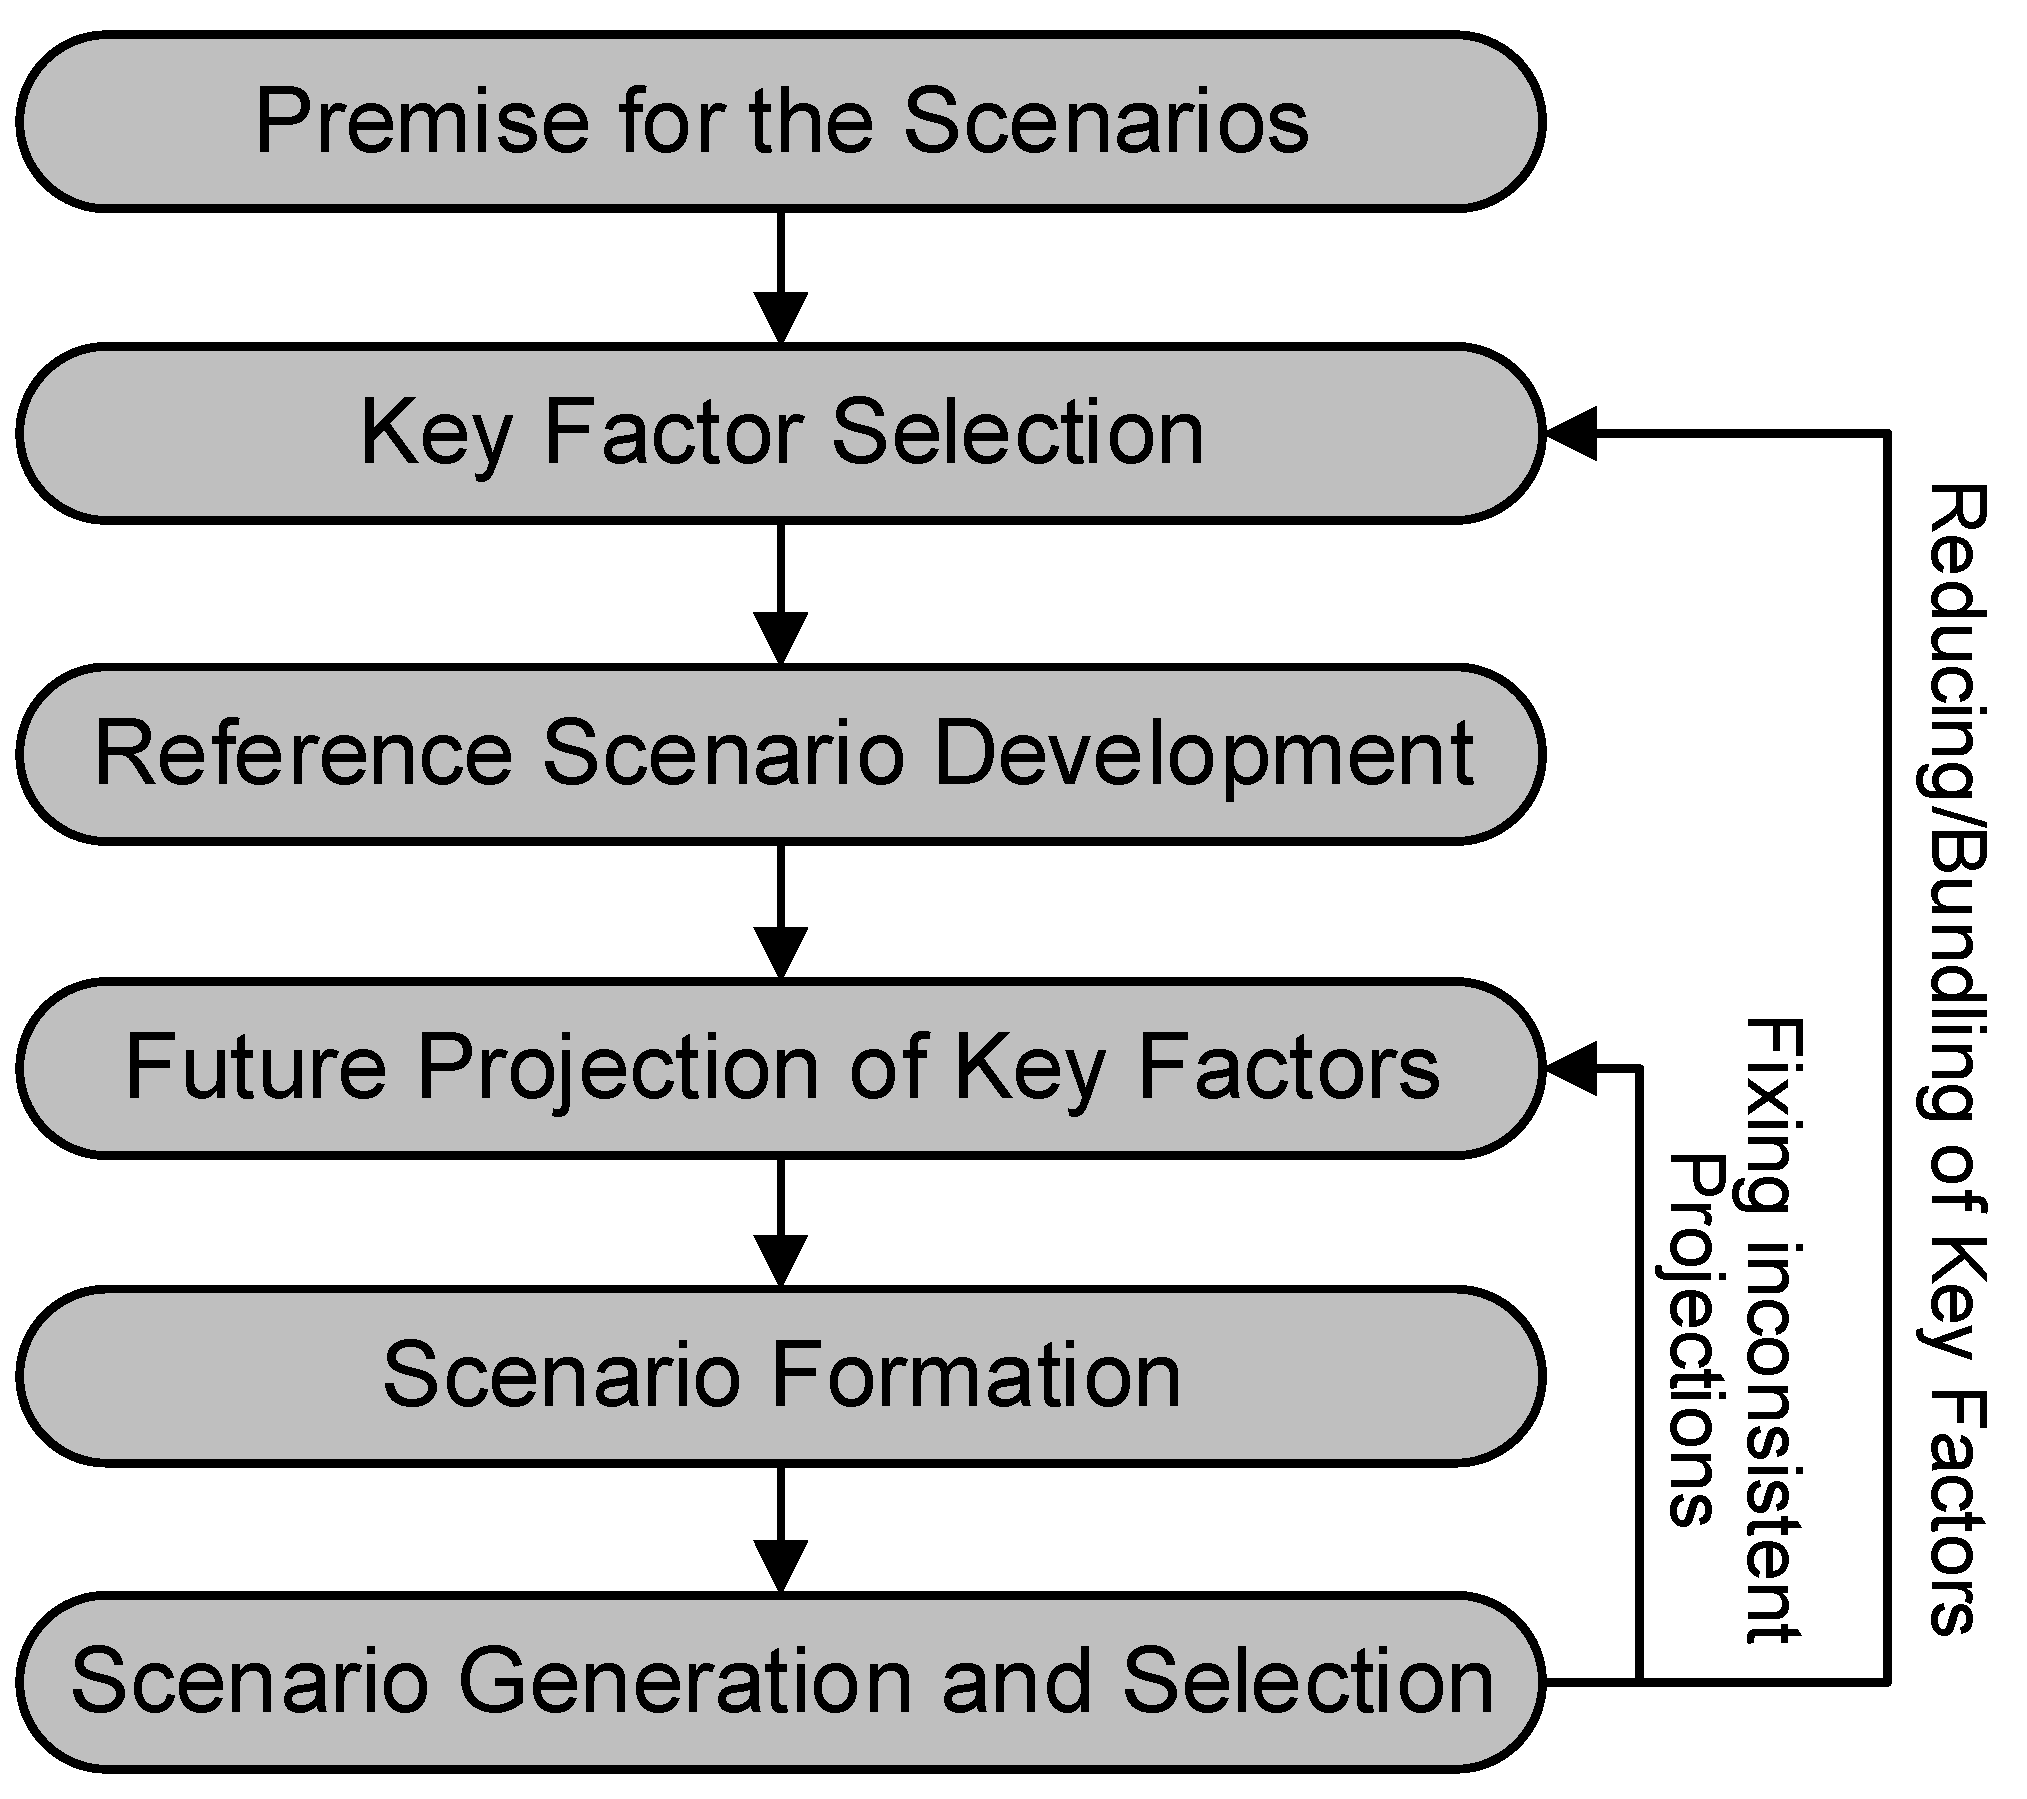
3. Scenario Development Framework and Process
3.1. Premise for the Scenarios
3.2. Key Factor Selection
3.3. Reference Scenario Development
3.4. Future Projection of Key Factors
3.5. Scenario Formation
3.5.1. CO2 Reduction and RE Share Target (RE-Boom)
3.5.2. Technical Improvement and Market Booming (Market-Boom)
3.5.3. Energy and Market Crisis (Crisis)
3.5.4. Hydrogen booming (H2-Boom)
3.6. Scenario Generation and Selection
4. Results
4.1. Five Final Scenarios
4.2. Evaluation of the Scenarios
4.2.1. Plausibility
4.2.2. Differentiation
5. Conclusions
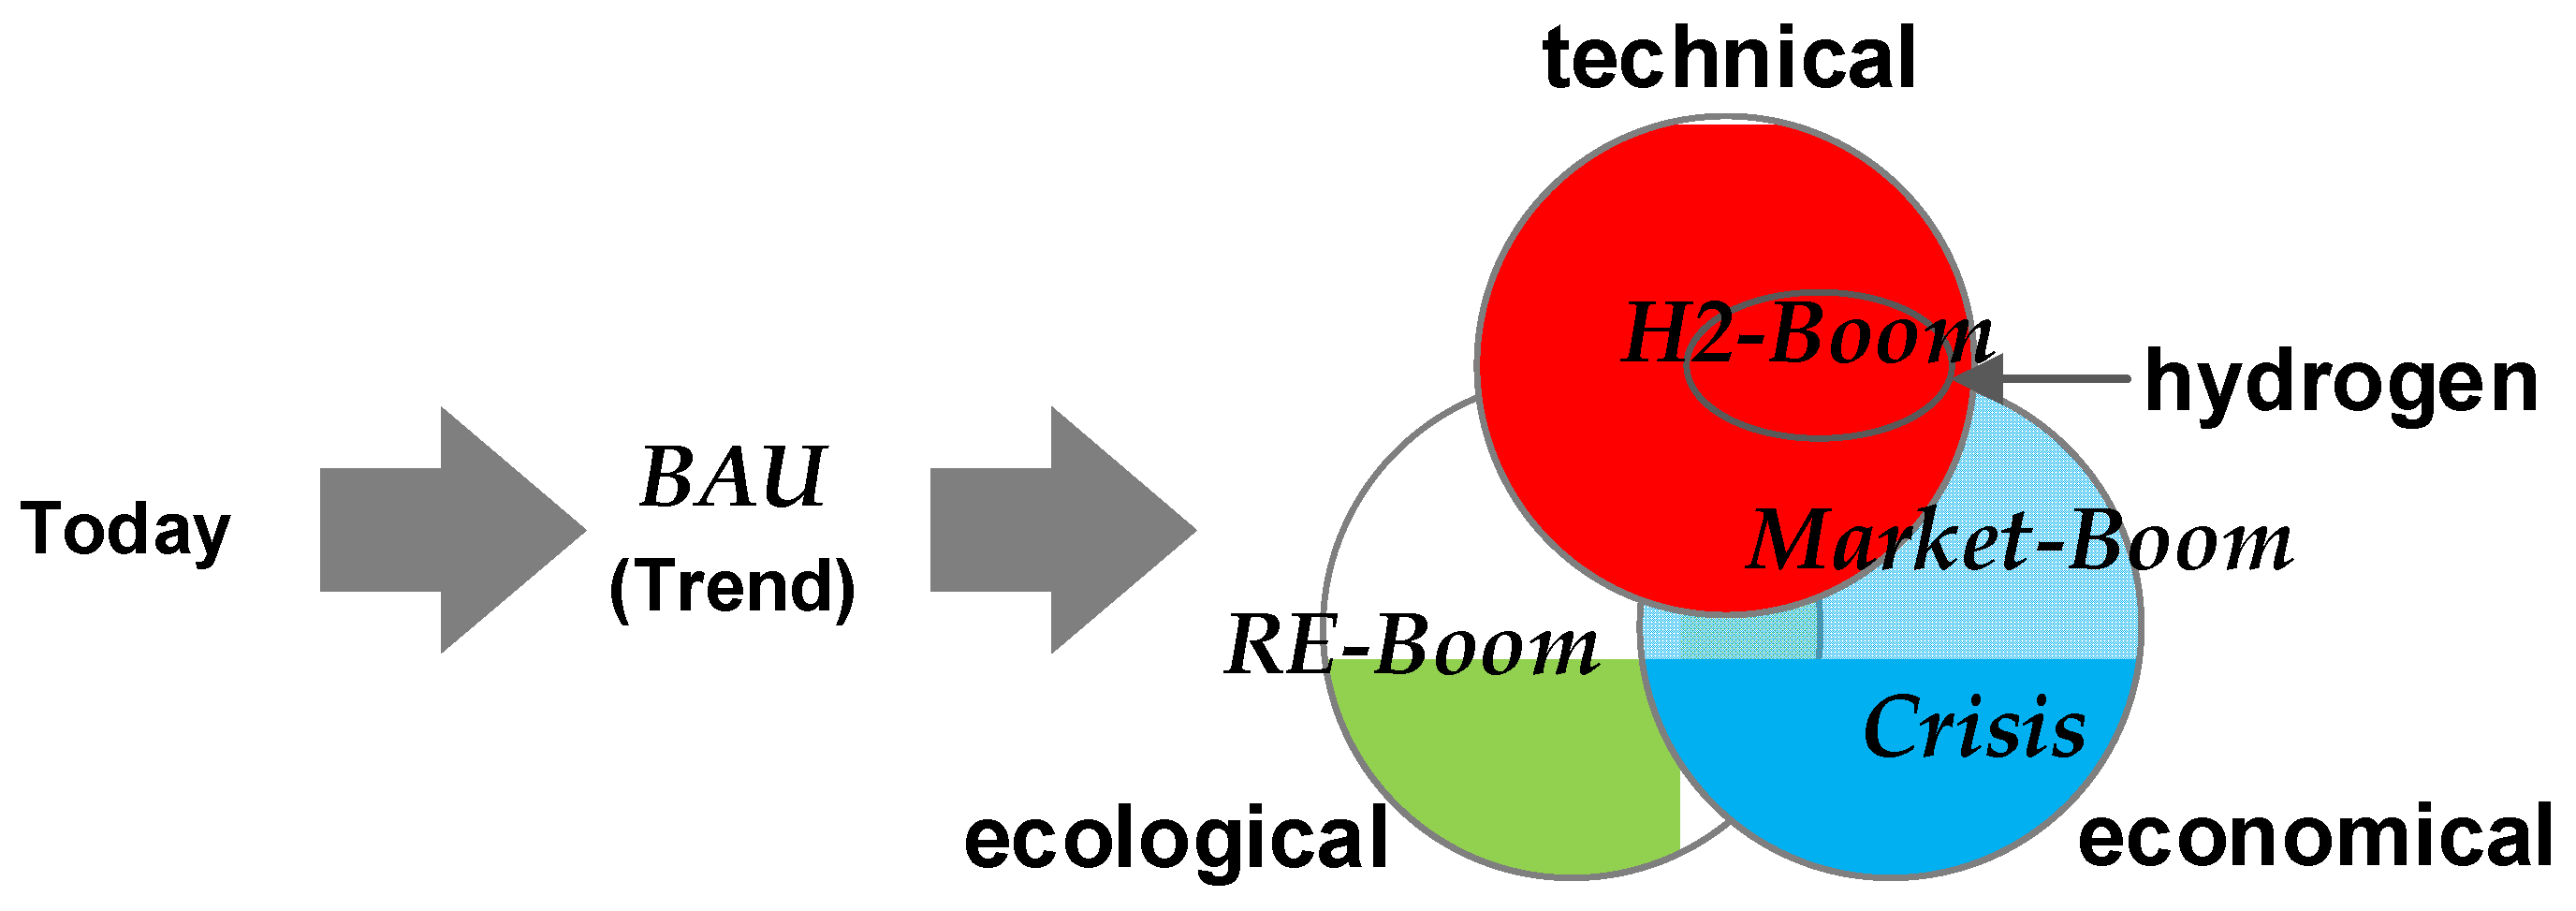
- CO2 Reduction and RE Share Target (RE-Boom): This scenario envisions the most favorable ecological conditions, emphasizing CO2 reduction and a high renewable energy (RE) share.
- Technical Improvement and Market Booming (Market-Boom): Here, the focus is on achieving optimal economic and technical conditions, with an emphasis on technical advancements and a thriving chemical market.
- Energy and Market Crisis (Crisis): The Crisis scenario represents the most adverse economic situation, depicting a scenario of energy and market crisis.
- Hydrogen Booming (H2-Boom): This scenario exclusively highlights the most advantageous conditions for hydrogen generation, considering both technical and economic aspects of the plants and market.
6. Outlook
Author Contributions
Funding
Data Availability Statement
Acknowledgments
Conflicts of Interest
Nomenclature
| Capital expenditures (CAPEX) of the plants, MEUR | |
| Carbon footprint of power supply, gCO2/kWhel | |
| Economy of Scale degression coefficient, - | |
| Renewable energy share, % | |
| Capacity of the plant, kg/s | |
| Scaling factor for investment costs, - | |
| Subscripts and Superscripts | |
| 0 | Reference year index of data source |
| a,b | Index for reference year (2025) before (a) and after (b) scaling with degression coefficient |
| lin | Linearized function |
| min/max Minimum and Maximum value | |
| s,t | Index for scenario number and time series |
References
- Lee, H.; Calvin, K.; Dasgupta, D.; Krinner, G.; Mukherji, A.; Thorne, P.W.; Trisos, C.; Romero, J.; Aldunce, P.; Barrett, K.; et al. IPCC, 2023: Climate Change 2023: Synthesis Report. Contribution of Working Groups I, II and III to the Sixth Assessment Report of the Intergovernmental Panel on Climate Change; Core Writing Team, Lee, H., Romero, J., Eds.; IPCC: Geneva, Switzerland, 2023. [Google Scholar]
- Bampaou, M.; Panopoulos, K.; Seferlis, P.; Sasiain, A.; Haag, S.; Wolf-Zoellner, P.; Lehner, M.; Rog, L.; Rompalski, P.; Kolb, S.; et al. Economic Evaluation of Renewable Hydrogen Integration into Steelworks for the Production of Methanol and Methane. Energies 2022, 15, 4650. [Google Scholar] [CrossRef]
- Heidari, A.; Niknahad, N.; Iljana, M.; Fabritius, T. A Review on the Kinetics of Iron Ore Reduction by Hydrogen. Materials 2021, 14, 7540. [Google Scholar] [CrossRef] [PubMed]
- Holappa, L. A General Vision for Reduction of Energy Consumption and CO2 Emissions from the Steel Industry. Metals 2020, 10, 1117. [Google Scholar] [CrossRef]
- Li, P.; Wang, Y.; Feng, J.; Tan, H.; Li, L. Effect of Carbon-Containing Solid Waste from Calcium Carbide Production on Combustion and Slagging Characteristics of Zhundong Coal Blend. Combust. Sci. Technol. 2023, 1–16. [Google Scholar] [CrossRef]
- Wang, B.; Li, S.; Sun, D.; Bian, J.; Zhao, H.; Li, H.; Zhang, Y.; Ju, F.; Ling, H. Emission characteristics of benzene series in FCC flue gas. Chemosphere 2023, 328, 138561. [Google Scholar] [CrossRef] [PubMed]
- Draxler, M.; Schenk, J.; Bürgler, T.; Sormann, A. The Steel Industry in the European Union on the Crossroad to Carbon Lean Production—Status, Initiatives and Challenges. Berg. Huettenmaenn. Monatsh. 2020, 165, 221–226. [Google Scholar] [CrossRef]
- Ghanbari, H.; Helle, M.; Saxén, H. Optimization of an Integrated Steel Plant with Carbon Capturing and Utilization Processes. IFAC-PapersOnLine 2015, 48, 12–17. [Google Scholar] [CrossRef]
- Bampaou, M.; Panopoulos, K.; Seferlis, P.; Voutetakis, S.; Matino, I.; Petrucciani, A.; Zaccara, A.; Colla, V.; Dettori, S.; Annunziata Branca, T.; et al. Integration of Renewable Hydrogen Production in Steelworks Off-Gases for the Synthesis of Methanol and Methane. Energies 2021, 14, 2904. [Google Scholar] [CrossRef]
- Jacobasch, E.; Herz, G.; Rix, C.; Müller, N.; Reichelt, E.; Jahn, M.; Michaelis, A. Economic evaluation of low-carbon steelmaking via coupling of electrolysis and direct reduction. J. Clean. Prod. 2021, 328, 129502. [Google Scholar] [CrossRef]
- Kolbe, N.; Cesário, F.; Ahrenhold, F.; Suer, J.; Oles, M. Carbon Utilization Combined with Carbon Direct Avoidance for Climate Neutrality in Steel Manufacturing. Chem. Ing. Tech. 2022, 94, 1548–1552. [Google Scholar] [CrossRef]
- Hong, W.Y. A techno-economic review on carbon capture, utilisation and storage systems for achieving a net-zero CO2 emissions future. Carbon Capture Sci. Technol. 2022, 3, 100044. [Google Scholar] [CrossRef]
- Shreyash, N.; Sonker, M.; Bajpai, S.; Tiwary, S.K.; Khan, M.A.; Raj, S.; Sharma, T.; Biswas, S. The Review of Carbon Capture-Storage Technologies and Developing Fuel Cells for Enhancing Utilization. Energies 2021, 14, 4978. [Google Scholar] [CrossRef]
- Regufe, M.J.; Pereira, A.; Ferreira, A.F.P.; Ribeiro, A.M.; Rodrigues, A.E. Current Developments of Carbon Capture Storage and/or Utilization–Looking for Net-Zero Emissions Defined in the Paris Agreement. Energies 2021, 14, 2406. [Google Scholar] [CrossRef]
- Tadjer, A.; Bratvold, R.B. Managing Uncertainty in Geological CO2 Storage Using Bayesian Evidential Learning. Energies 2021, 14, 1557. [Google Scholar] [CrossRef]
- Ghiat, I.; Al-Ansari, T. A review of carbon capture and utilisation as a CO2 abatement opportunity within the EWF nexus. J. CO2 Util. 2021, 45, 101432. [Google Scholar] [CrossRef]
- Chen, J.; Xu, Y.; Liao, P.; Wang, H.; Zhou, H. Recent Progress in Integrated CO2 Capture and Conversion Process Using Dual Function Materials: A State-of-the-Art Review. Carbon Capture Sci. Technol. 2022, 4, 100052. [Google Scholar] [CrossRef]
- Sun, S.; Sun, H.; Williams, P.T.; Wu, C. Recent advances in integrated CO2 capture and utilization: A review. Sustain. Energy Fuels 2021, 5, 4546–4559. [Google Scholar] [CrossRef]
- Deerberg, G.; Oles, M.; Schlögl, R. The Project Carbon2Chem®. Chem. Ing. Tech. 2018, 90, 1365–1368. [Google Scholar] [CrossRef]
- Leitner, W.; Franciò, G.; Scott, M.; Westhues, C.; Langanke, J.; Lansing, M.; Hussong, C.; Erdkamp, E. Carbon2Polymer—Chemical Utilization of CO2 in the Production of Isocyanates. Chem. Ing. Tech. 2018, 90, 1504–1512. [Google Scholar] [CrossRef]
- van Beek, M.; Sadlowski, M. Transient Optimization of Coproduction Systems for Steel and Value-Added Chemicals. Chem. Ing. Tech. 2020, 92, 1431–1443. [Google Scholar] [CrossRef]
- Uribe-Soto, W.; Portha, J.-F.; Commenge, J.-M.; Falk, L. A review of thermochemical processes and technologies to use steelworks off-gases. Renew. Sustain. Energy Rev. 2017, 74, 809–823. [Google Scholar] [CrossRef]
- Ramírez-Santos, Á.A.; Castel, C.; Favre, E. A review of gas separation technologies within emission reduction programs in the iron and steel sector: Current application and development perspectives. Sep. Purif. Technol. 2018, 194, 425–442. [Google Scholar] [CrossRef]
- Luca, A.-V.; Petrescu, L. Membrane technology applied to steel production: Investigation based on process modelling and environmental tools. J. Clean. Prod. 2021, 294, 126256. [Google Scholar] [CrossRef]
- Dunstan, M.T.; Donat, F.; Bork, A.H.; Grey, C.P.; Müller, C.R. CO2 Capture at Medium to High Temperature Using Solid Oxide-Based Sorbents: Fundamental Aspects, Mechanistic Insights, and Recent Advances. Chem. Rev. 2021, 121, 12681–12745. [Google Scholar] [CrossRef]
- Schlüter, S.; Hennig, T. Modeling the Catalytic Conversion of Steel Mill Gases Using the Example of Methanol Synthesis. Chem. Ing. Tech. 2018, 90, 1541–1558. [Google Scholar] [CrossRef]
- Deng, L.; Adams, T.A. Methanol Production from Coke Oven Gas and Blast Furnace Gas. In 13th International Symposium on Process Systems Engineering (PSE 2018); Eden, M.R., Ierapetritou, M.G., Towler, G.P., Eds.; Computer-Aided Chemical Engineering 44; Elsevier: Amsterdam, The Netherlands; Boston, MA, USA; Heidelberg, Germany, 2018; pp. 163–168. [Google Scholar]
- Voß, J.M.; Daun, T.; Geitner, C.; Schlüter, S.; Schulzke, T. Operating Behavior of a Demonstration Plant for Methanol Synthesis. Chem. Ing. Tech. 2022, 94, 1489–1500. [Google Scholar] [CrossRef]
- Xu, D.; Wang, Y.; Ding, M.; Hong, X.; Liu, G.; Tsang, S.C.E. Advances in higher alcohol synthesis from CO2 hydrogenation. Chem 2021, 7, 849–881. [Google Scholar] [CrossRef]
- Peters, M.; Menne, A.; Gielisch, H. Synthesis of Sustainable Fuels and Intermediates from Ethanol and Methanol. Chem. Ing. Tech. 2022, 94, 1501–1508. [Google Scholar] [CrossRef]
- Schlüter, S.; Geitner, C. Simulation of Methanol and Urea Production from Catalytic Conversion of Steel Mill Gases. Chem. Ing. Tech. 2020, 92, 1403–1415. [Google Scholar] [CrossRef]
- Büker, K.; von Morstein, O.; Yildirim, Ö.; Frey, A.; Voss, C.; Geisbauer, A. Practical Aspects of Converting Steel Mill Gases to Chemical Feedstocks. Chem. Ing. Tech. 2022, 94, 1452–1457. [Google Scholar] [CrossRef]
- Arvola, J.; Harkonen, J.; Mottonen, M.; Haapasalo, H.; Tervonen, P. Combining Steel and Chemical Production to Reduce CO2 Emissions. Low Carbon Econ. 2011, 2, 115–122. [Google Scholar] [CrossRef][Green Version]
- Kenkel, P.; Wassermann, T.; Rose, C.; Zondervan, E. A generic superstructure modeling and optimization framework on the example of bi-criteria Power-to-Methanol process design. Comput. Chem. Eng. 2021, 150, 107327. [Google Scholar] [CrossRef]
- Sadlowski, M.; van Beek, M. Integration und Strukturelle Optimierung Verschiedener Chemischer Syntheserouten zur Abgasnutzung Bestehender Stahlproduktionsanlagen; Democratization of the Energy System 7; Internationale Energiewirtschaftstagung (IEWT); TU Wien: Vienna, Austria, 2019. [Google Scholar]
- Ioannou, A.; Angus, A.; Brennan, F. Risk-based methods for sustainable energy system planning: A review. Renew. Sustain. Energy Rev. 2017, 74, 602–615. [Google Scholar] [CrossRef]
- Schomaker, R.M.; Sitter, A. Die PESTEL-Analyse—Status quo und innovative Anpassungen. Der Betriebswirt 2020, 61, 3–21. [Google Scholar] [CrossRef]
- Kosow, H.; Gaßner, R. Methoden der Zukunfts-und Szenarioanalyse: Überblick, Bewertung und Auswahlkriterien; DIE Studies 39; Institut für Zukunftsstudien und Technologiebewertung: Bonn, Germany, 2008. [Google Scholar]
- Gausemeier, J.; Fink, A.; Schlake, O. Szenariomanagement: Planen und Führen mit Szenarien; Paderborner Universität: München, Germany, 1996. [Google Scholar]
- Reibnitz, U.; von Hammond, P. Scenario Techniques; McGraw-Hill: Hamburg, Germany, 1988. [Google Scholar]
- Greeuw, S.C.; van Asselt, M.; Grosskunth, J.; Storms, C.; Rijkens-Klomp, N.; Rothman, D.; Rotmans, J. Cloudy Crystal Balls. An Assessment of Recent European and Global Scenario Studies and Models; Environmental Issues Series No. 17; European Environment Agency: Copenhagen, Denmark, 2000. [Google Scholar]
- Sadlowski, M.; Lim, C.E. Multi-Criteria Scenario Development for Linear Optimization Models Utilizing Carbon-Containing Exhaust Gases. In Proceedings of the 36th International Conference on Efficiency, Cost, Optimization, Simulation and Environmental Impact of Energy Systems (ECOS 2023), Las Palmas de Gran Canaria, Spain, 25–30 June 2023; Smith, J.R., Ed.; Curran Associates Inc.: Red Hook, NY, USA, 2023; pp. 1363–1374. [Google Scholar]
- Stießel, S. Entwicklung eines Referenzmodells zur Multikriteriellen Bewertung von Cross-Industriellen Systemen. Ph.D. Dissertation, Ruhr-Universität Bochum, Bochum, Germany, 2020. [Google Scholar]
- Sadlowski, M.; van Beek, M. Ecologic Potential for Flexible Methanol Production from Steel Mill Off-gases. Chem. Ing. Tech. 2020, 92, 1416–1424. [Google Scholar] [CrossRef]
- Polley, R.; Apel, K. The Dominance and Monopolies Review: Germany. Available online: https://thelawreviews.co.uk/title/the-dominance-and-monopolies-review/germany (accessed on 8 December 2023).
- Bundesministerium der Justiz. Competition Act. Available online: https://www.gesetze-im-internet.de/englisch_gwb/englisch_gwb.html (accessed on 8 December 2023).
- Vreys, K.; Lizin, S.; van Dael, M.; Tharakan, J.; Malina, R. Exploring the future of carbon capture and utilisation by combining an international Delphi study with local scenario development. Resour. Conserv. Recycl. 2019, 146, 484–501. [Google Scholar] [CrossRef]
- Raths, S.; Koopmann, S.; Müller, C.; Meinerzhagen, A.; Falke, T.; Cramer, M.; Kulms, T.; Beulertz, D. (Eds.) The Energy System Development Plan; Blueprints for the New Energy Age 17; Institute of Electrical and Electronics Engineers Inc.: Bonn, Germany, 2015. [Google Scholar]
- Agora Energiewende. German Net Power Generation, Consumption, and Exports; Agora Energiewende: Berlin, Germany, 2020. [Google Scholar]
- European Commission, Directorate General for Energy; European Commission, Directorate General for Climate Action; European Commission, Directorate General for Mobility and Transport. EU Reference Scenario 2020: Energy, Transport and GHG Emissions: Trends to 2050; European Commission: Brussels, Belgium, 2021. [Google Scholar]
- Henze, V. Carbon Offset Prices Could Increase Fifty-Fold by 2050. Surging Demand and Unanswered Questions on Supply Could Push Offset Prices to Unsustainable Highs or Ill-Fated Lows. 2022. Available online: https://about.bnef.com/blog/carbon-offset-prices-could-increase-fifty-fold-by-2050/ (accessed on 17 January 2024).
- IEA. Global Hydrogen Review 2021: Paris. 2021. Available online: https://www.iea.org/reports/global-hydrogen-review-2021 (accessed on 8 December 2023).
- IEA. The Future of Petrochemicals: Paris. 2018. Available online: https://www.iea.org/reports/the-future-of-petrochemicals (accessed on 7 August 2022).
- Fraunhofer ISE. Annual Electricity Spot Market Prices in Germany: Freiburg. 2022. Available online: https://energy-charts.info/?l=en&c=DE (accessed on 8 December 2023).
- Statistical Office of the European Union. Statistics on the Production of Goods (Prodcom). 2022. Available online: https://ec.europa.eu/eurostat/de/web/prodcom (accessed on 8 December 2023).
- Trading Economics. EU Carbon Permits: EU CO2 Certificate Price from 24 February 2023. Available online: https://tradingeconomics.com/commodity/carbon (accessed on 8 December 2023).
- Prognos; Öko-Institut; Wuppertal Institut. Towards a Climate-Neutral Germany. Executive Summary Conducted for Agora Energiewende, Agora Verkehrswende and Stiftung Klimaneutralität; Agora Energiewende: Berlin, Germany, 2020. [Google Scholar]
- Umweltbundesamt. Indicator: Greenhouse Gas Emissions. 2023. Available online: https://www.umweltbundesamt.de/en/data/environmental-indicators/indicator-greenhouse-gas-emissions (accessed on 8 December 2023).
- Procurement Resource. Chemicals Price Trend. 2021. Available online: https://www.procurementresource.com/resource-center/ (accessed on 8 December 2023).
- Luyben, W.L. Chemical Reactor Design and Control; John Wiley & Sons: San Francisco, CA, USA, 2007. [Google Scholar]
- Nel Hydrogen Electrolysers. The World’s Most Efficient and Reliable Electrolysers. 2018. Available online: http://www.silpac.com.cn/download/Electrolysers-Brochure-Rev-C.pdf (accessed on 17 January 2024).
- IEA. The Future of Hydrogen. 2019. Available online: https://www.iea.org/reports/the-future-of-hydrogen (accessed on 8 December 2023).
- Towler, G.; Sinnott, R. Chemical Engineering Design: Principles, Practice and Economics of Plant and Process Design; Butterworth-Heinemann: Oxford, UK, 2021. [Google Scholar]
- Bejan, A.; Tsatsaronis, G.; Moran, M.J. Thermal Design and Optimization; A Wiley-Interscience Publication; Wiley: New York, NY, USA, 1996. [Google Scholar]
- Zauner, A.; Böhm, H.; Rosenfeld, D.; Tichler, R. Innovative Large-Scale Energy Storage Technologies and Power-to-Gas Concepts after Optimization. Available online: https://ec.europa.eu/research/participants/documents/downloadPublic?documentIds=080166e5c58ae3ff&appId=PPGMS (accessed on 7 December 2023).
- Geldermann, J. Anlagen-und Energiewirtschaft: Kosten-und Investitionsschätzung Sowie Technikbewertung von Industrieanlagen; Franz Vahlen: Munich, Germany, 2014. [Google Scholar]
- Weimer-Jehle, W. ScenarioWizard 4.4: Constructing Consistent Scenarios Using Cross-Impact Balance Analysis; University of Stuttgart: Stuttgart, Germany, 2021. [Google Scholar]
- Weimer-Jehle, W.; Key Figures Used in the Analysis of CIB Scenarios. Cross-Impact Balance Analysis—Guideline No. 4. 2018. Available online: https://cross-impact.de/deutsch/CIB_d_ScW.htm (accessed on 17 January 2024).
- Ambrose, T. EU Carbon Permit Prices Crash after Russian Invasion of Ukraine. 2022. Available online: https://www.theguardian.com/environment/2022/mar/02/eu-carbon-permit-prices-crash-after-russian-invasion-of-ukraine (accessed on 17 January 2024).
- Agora Verkehrswende, Agora Energiewende and Frontier Economics. The Future Cost of Electricity-Based Synthetic Fuels; Frontier Economics Ltd.: London, UK, 2018. [Google Scholar]
- Fernleitungsnetzbetreiber. Antragsentwurf Wasserstoff-Kernnetz (15 November 2023). Available online: https://fnb-gas.de/wasserstoffnetz-wasserstoff-kernnetz/ (accessed on 8 December 2023).


| Parameters | Premise |
|---|---|
| Time Horizon | 25 years (5 years construction + 20 years operating life span) |
| Target year | 2040 (middle of operating life span) |
| Maximum generation | 40% of the market volume [45,46] |
| Market boundary | Perfect European market model |
| Discount rate | 2% annually for the whole life span |
| Technical parameters | Given from previous studies and project work |
| Class | Key Factor | Current Value | Source | BAU-Value | Unit |
|---|---|---|---|---|---|
| Input | a. Electricity price | 41.3 | [54,55] | 47.4 | EUR /MWhel |
| b. Natural gas price | 31.4 | [55] | 46.7 | EUR /MWhth | |
| c. Coal price | 7.5 | [55] | 11.8 | EUR /MWhth | |
| d. H2 price | 3000 | [16] | 2400 | EUR /t | |
| e. CO2 certificate price | 102 | [56] | 146 | EUR /t | |
| f. CF and RE share (German grid) | 373.4 | [57,58] | 109.0 | gCO2/kWhel | |
| Output | g. CO2 emission allowance | 100 | - | 100 | % |
| h. O2 price | 50 | [43] | 74.3 | EUR /t | |
| i. Methanol price | 342.0 | [55] | 401.6 | EUR /t | |
| j. Urea price | 256.3 | [55] | 428.2 | EUR /t | |
| k. Ammonia price | 182.9 | [59] | 305.5 | EUR /t | |
| l. Acetic acid price | 605.9 | [59] | 711.5 | EUR /t | |
| m. Methanol market vol. | 2.2 | [55] | 3.9 | Mt/a | |
| n. Urea market vol. | 4.4 | [55] | 5.4 | Mt/a | |
| o. Ammonia market vol. | 12.5 | [55] | 15.3 | Mt/a | |
| p. Acetic acid market vol. | 1.2 | [55] | 2.1 | Mt/a | |
| Technology | q. Conversion efficiency | 1.0 | [44,60] | 1.0 | - |
| r. Energy efficiency | 1.0 | [44,60] | 1.0 | - | |
| s. H2 efficiency | 1.0 | [61,62] | 1.0 | - | |
| t. Steel mill energy demand | 1.0 | - | 1.0 | - | |
| u. Part load range | 1.0 | - | 1.0 | - | |
| v. Dynamic operation | 1.0 | - | 1.0 | - | |
| Expenditure | w. Investment cost (2025) | - | [63,64] | 1.0 | - |
| x. Operating cost | 1.0 | [63,64] | 1.0 | - |
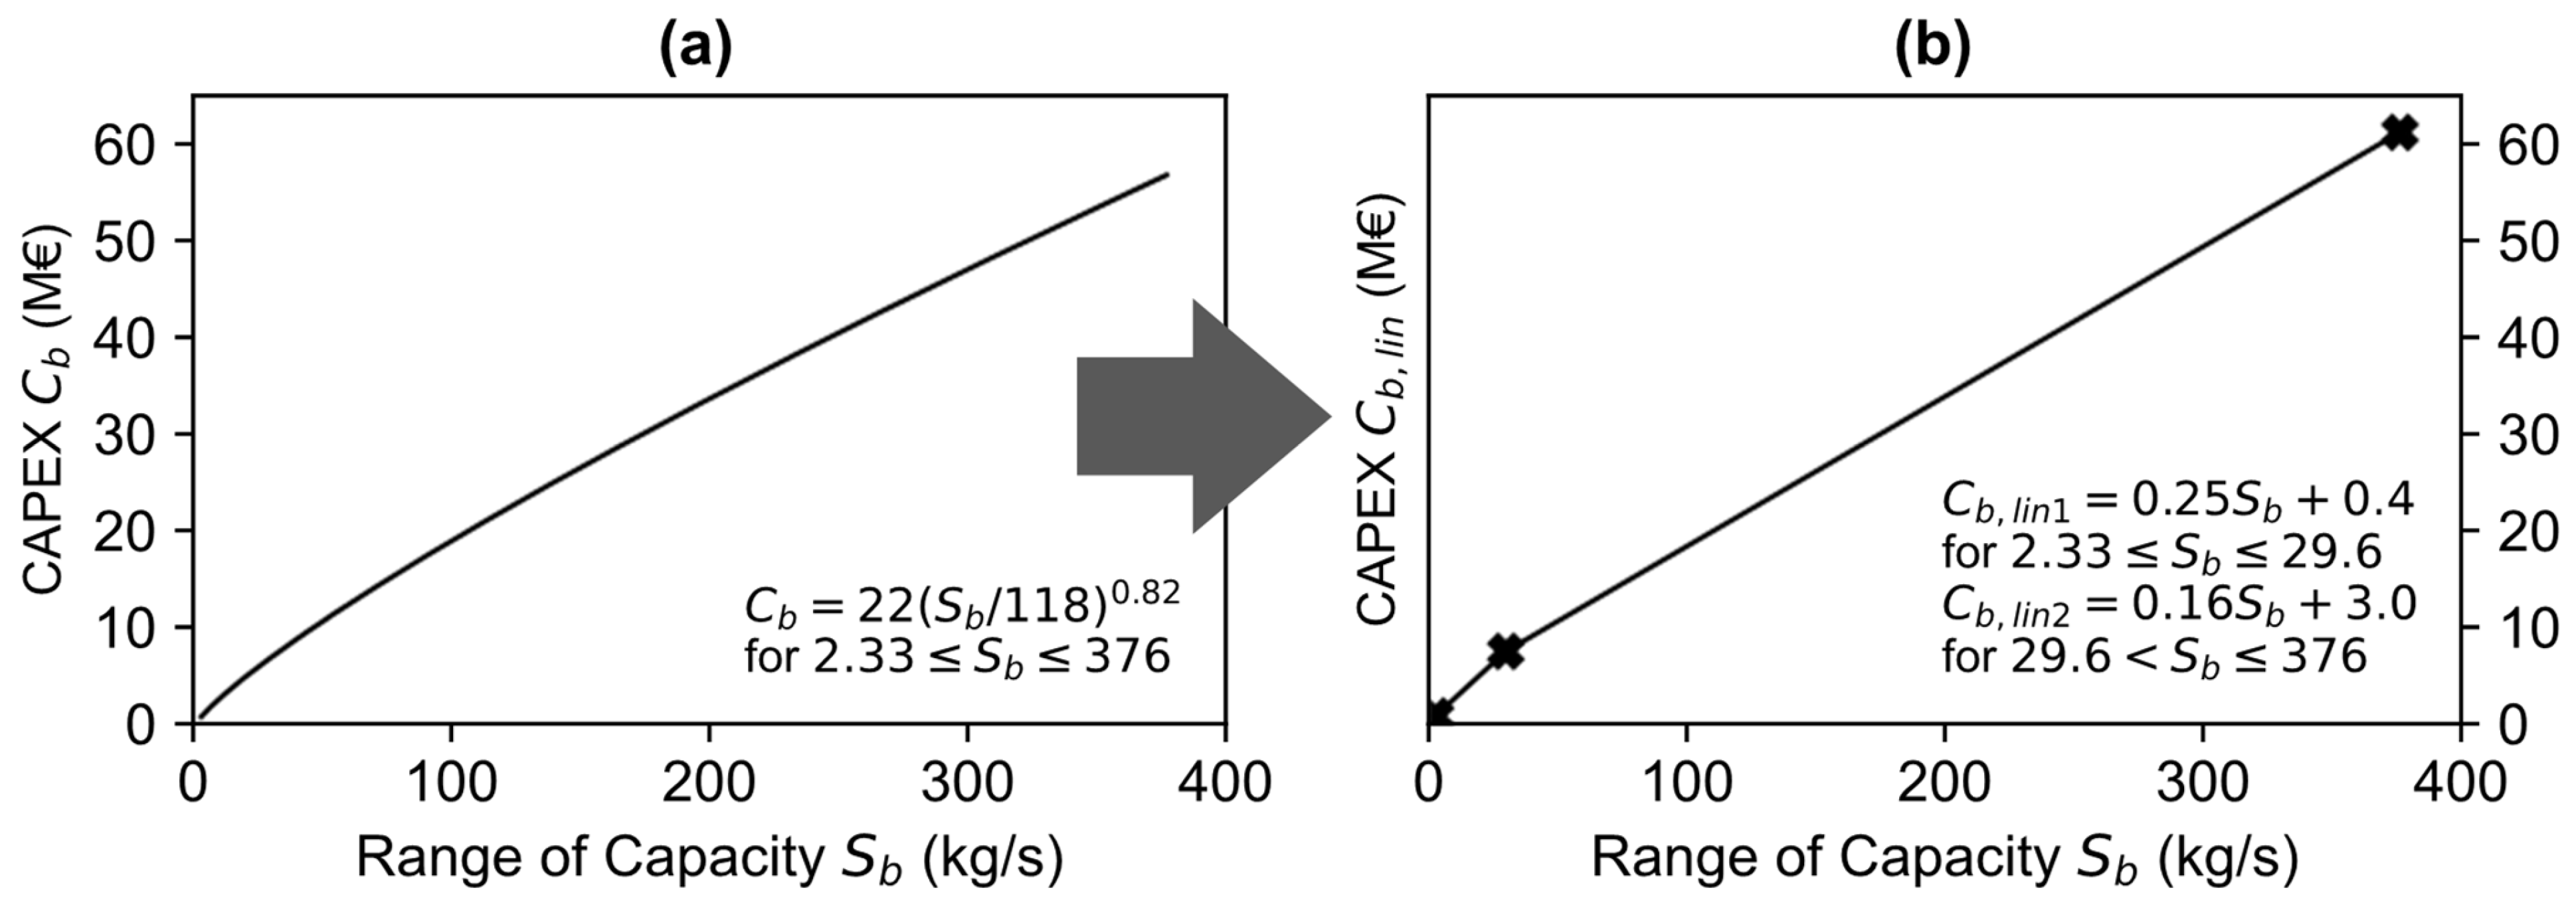
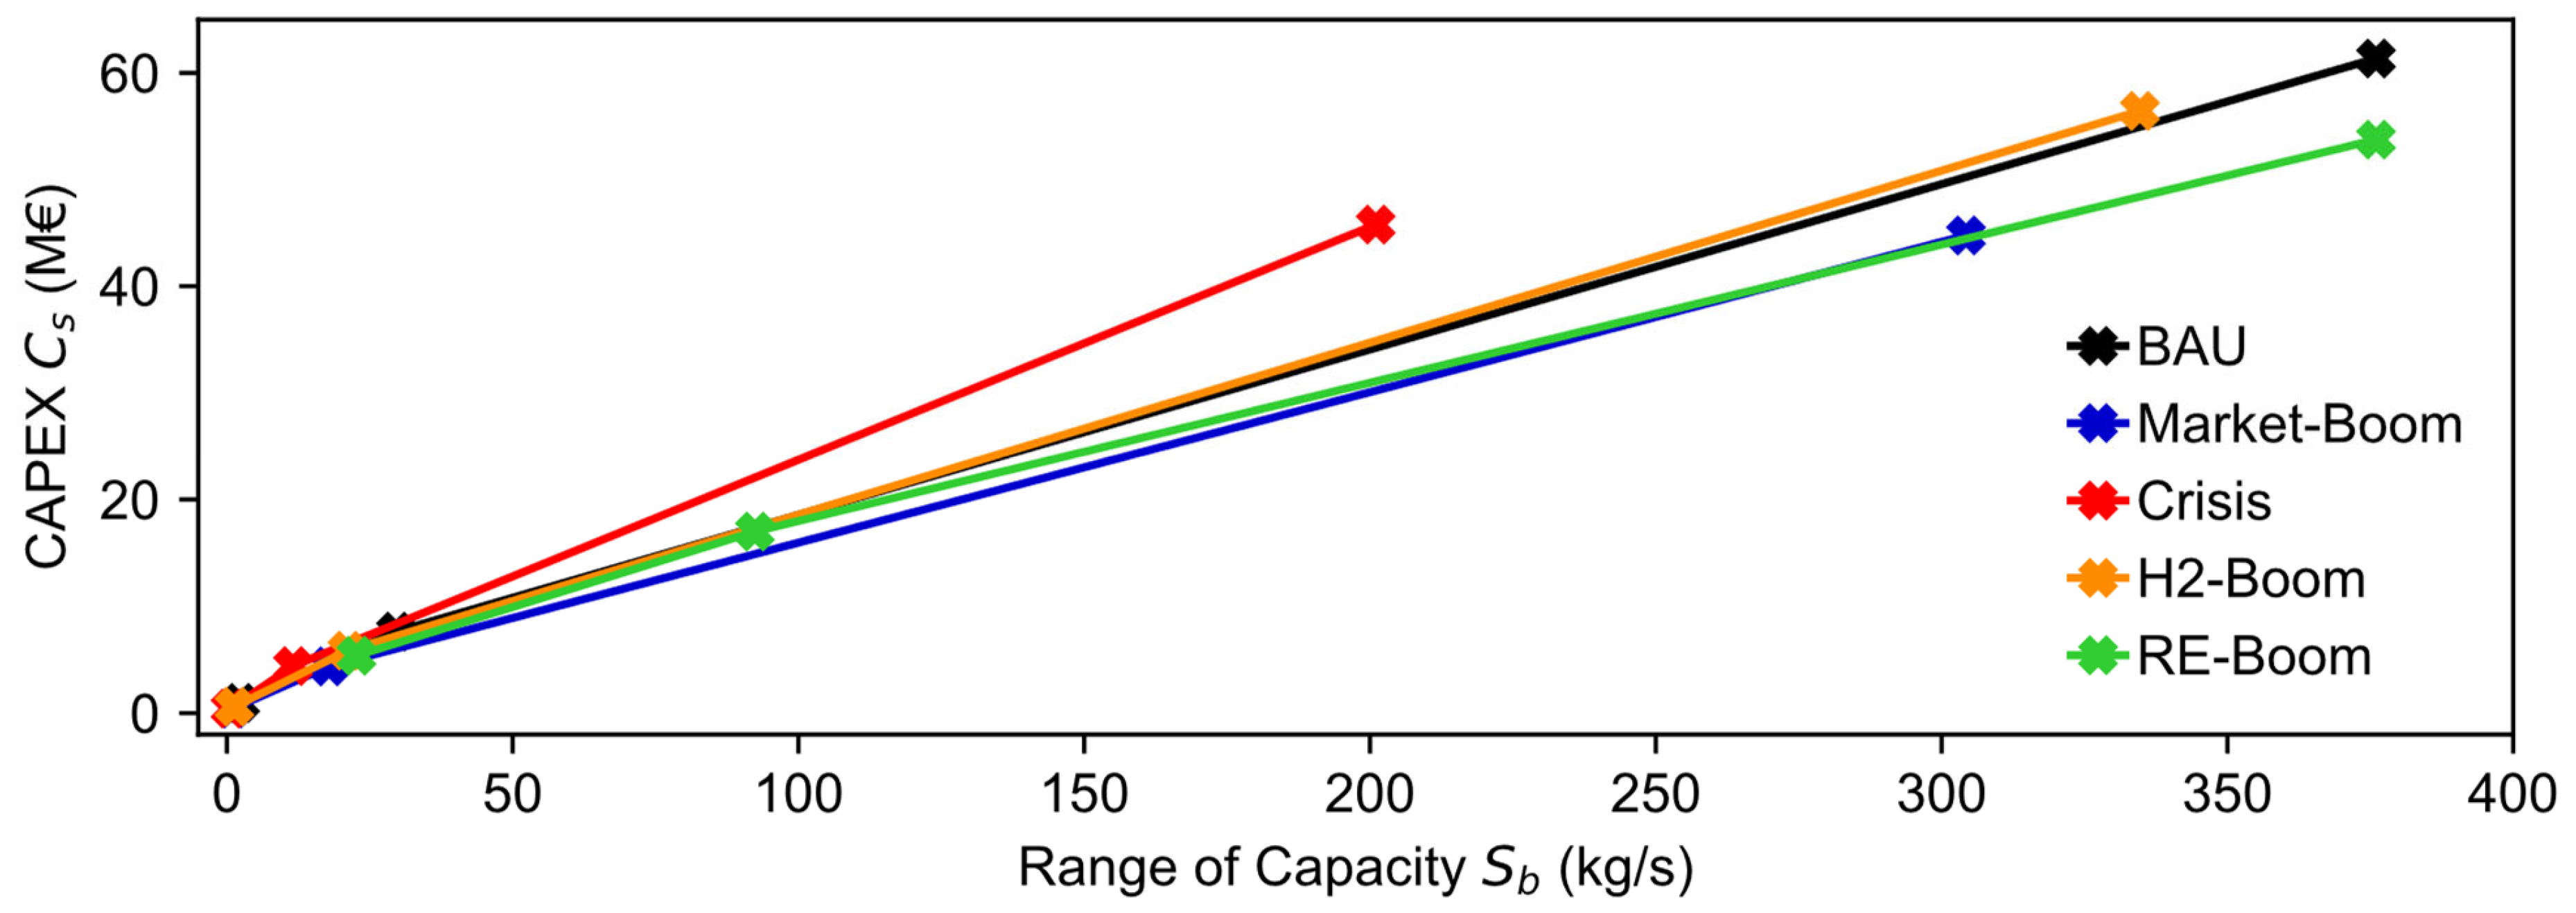
| Final Product | Sbmin, kg/s | Sbmax, kg/s | Cbmin, MEUR | Cbmax, MEUR | Market Volume, Mt/a |
|---|---|---|---|---|---|
| Acetic acid | 2.33 | 39 | 0.88 | 8.8 | 2.1 |
| Urea | 5.2 | 86 | 1.7 | 17 | 3.9 |
| Methanol | 7.2 | 120 | 2.2 | 22 | 5.4 |
| Ammonia | 22.7 | 376 | 5.7 | 57 | 15.3 |
| Unit | CAPEX (Current) | CAPEX (BAU Scenario) | Future Situation | CAPEX (Future) | Rate * |
|---|---|---|---|---|---|
| ALK | 1.0 | 0.86 | Pessimistic | 1.0 | 1.16 |
| Regular | 0.79 | 0.92 | |||
| Optimistic | 0.72 | 0.84 | |||
| PEM | 1.0 | 0.775 | Pessimistic | 1.0 | 1.29 |
| Regular | 0.66 | 0.85 | |||
| Optimistic | 0.55 | 0.71 |
| Fixed Factor | Projection |
|---|---|
| e. CO2 certificate price | Highly increasing (↑↑) |
| f. CF and RE share | Highly decreasing (↓↓) |
| g. CO2 emission allowance | Highly decreasing (↓↓) |
| m. Methanol market vol. | Highly increasing (↑↑) |
| n. Urea market vol. | Highly increasing (↑↑) |
| o. Ammonia market vol. | Highly increasing (↑↑) |
| p. Acetic acid market vol. | Highly increasing (↑↑) |
| Fixed Factor | Projection |
|---|---|
| h. O2 price | Highly increasing (↑↑) |
| i. Methanol price | Highly increasing (↑↑) |
| j. Urea price | Highly increasing (↑↑) |
| k. Ammonia price | Highly increasing (↑↑) |
| l. Acetic acid price | Highly increasing (↑↑) |
| m-p. Market volumes | Moderately increasing (↑) |
| q. Conversion eff. | Highly increasing (↑↑) |
| r. Energy efficiency | Highly increasing (↑↑) |
| s. Hydrogen efficiency | Moderately increasing (↑) |
| t. Steel mill energy demand | Highly decreasing (↓↓) |
| u. Part load range | Highly increasing (↑↑) |
| v. Dynamic operation | Highly increasing (↑↑) |
| Fixed Factor | Projection |
|---|---|
| a. Electricity Price | Highly increasing (↑↑) |
| b. Natural Gas price | Highly increasing (↑↑) |
| c. Coal Price | Highly increasing (↑↑) |
| h. O2 price | Highly decreasing (↓↓) |
| i. Methanol price | Highly decreasing (↓↓) |
| j. Urea price | Highly decreasing (↓↓) |
| k. Ammonia price | Highly decreasing (↓↓) |
| l. Acetic acid price | Highly decreasing (↓↓) |
| Fixed Factor | Projection |
|---|---|
| d. H2 price | Highly decreasing (↓↓) |
| q. Conversion efficiency | Constant (-) |
| r. Energy efficiency | Constant (-) |
| s. Hydrogen efficiency | Highly increasing (↑↑) |
| u. Part load range (only H2) | Moderately increasing (↑) |
| v. Dynamic operation (only H2) | Moderately increasing (↑) |
| Key Factors with Units | BAU | RE-Boom | Market-Boom | Crisis | H2-Boom | |||||
|---|---|---|---|---|---|---|---|---|---|---|
| QLT | QNT | QLT | QNT | QLT | QNT | QLT | QNT | QLT | QNT | |
| a. Electricity price (EUR /MWhel) | (↑) | 47.38 | (↓↓) | 20.66 | (-) | 41.32 | (↑↑) * | 72.31 | (-) | 41.32 |
| b. NG price (EUR /MWhth) | (↑) | 46.72 | (↓↓) | 15.68 | (-) | 31.35 | (↑↑) * | 69.63 | (-) | 31.35 |
| c. Coal price (EUR /MWhth) | (↑) | 11.82 | (↓) | 5.62 | (-) | 7.49 | (↑↑) * | 18.67 | (-) | 7.49 |
| d. H2 price (EUR /t) | (↓) | 2400 | (↓) | 2400 | (-) | 3000 | (↑↑) | 3900 | (↓↓) * | 1500 |
| e. CO2 certificate price (EUR /t) | (↑) | 146 | (↑↑) * | 255 | (↑) | 146 | (↑↑) | 255 | (↑) | 146 |
| f. CF and RE share (gCO2/kWhel) | (↓) | 109 | (↓↓) * | 0 | (↓) | 109 | (↓↓) | 0 | (↓) | 109 |
| g. CO2 emission allowance (%) | (-) | 100 | (↓↓) * | 80 | (-) | 100 | (-) | 100 | (↓) | 90 |
| h. O2 price (EUR /t) | (↑) | 74.3 | (↓) | 25.7 | (↑↑) * | 110.4 | (↓↓) * | 13.2 | (-) | 50.0 |
| i. Methanol price (EUR /t) | (↑) | 401.6 | (↓) | 282.4 | (↑↑) * | 471.7 | (↓↓) * | 233.1 | (-) | 342.0 |
| j. Urea price (EUR /t) | (↑) | 428.2 | (↓) | 192.2 | (↑↑) * | 715.4 | (↓↓) * | 128.2 | (-) | 256.3 |
| k. Ammonia price (EUR /t) | (↑) | 305.5 | (↓) | 137.1 | (↑↑) * | 510.4 | (↓↓) * | 91.4 | (-) | 182.9 |
| l. Acetic Acid price (EUR /t) | (↑) | 711.5 | (↓) | 500.2 | (↑↑) * | 835.5 | (↓↓) * | 413.0 | (-) | 605.9 |
| m. Methanol market vol. (Mt/a) | (↑) | 3.85 | (↑↑) * | 13.36 | (-) | 2.2 | (↓↓) | 1.1 | (-) | 2.2 |
| n. Urea market vol. (Mt/a) | (↑) | 5.39 | (↑↑) * | 25.97 | (-) | 4.4 | (↓↓) | 2.64 | (-) | 4.4 |
| o. Ammonia market vol. (Mt/a) | (↑) | 15.31 | (↑↑) * | 18.75 | (-) | 12.5 | (↓↓) | 7.51 | (-) | 12.5 |
| p. Acetic Acid market v. (Mt/a) | (↑) | 2.1 | (↑↑) * | 3.42 | (-) | 1.2 | (↓↓) | 0.6 | (-) | 1.2 |
| q. Conversion efficiency (-) | (-) | 1.0 | (↑) | 0.95 | (↑↑) * | 0.9 | (-) | 1.0 | (-) * | 1.0 |
| r. Energy efficiency (-) | (-) | 1.0 | (↑) | 0.95 | (↑↑) * | 0.9 | (-) | 1.0 | (-) * | 1.0 |
| s. H2 efficiency (-) | (-) | 1.0 | (↑) | 0.95 | (↑) * | 0.95 | (-) | 1.0 | (↑↑) * | 0.9 |
| t. Steel mill energy demand (-) | (-) | 1.0 | (↓) | 0.9 | (↓↓) * | 0.8 | (-) | 1.0 | (-) | 1.0 |
| u. Part load range (-) | (-) | 1.0 | (↑) | 1.5 | (↑↑) * | 2.0 | (-) | 1.0 | (↑) * | 2.0 (H2) |
| v. Dynamic operation (-) | (-) | 1.0 | (↑) | 1.5 | (↑↑) * | 2.0 | (-) | 1.0 | (↑) * | 2.0 (H2) |
| w. Investment costs s-factors (-) | (-) | 1.0 | (↓) | var 1 | (↓) | var 1 | (↑) | var 1 | (↓) | var 1 |
| x. Operating cost (-) | (-) | 1.0 | (↓) | 0.75 | (↓) | 0.5 | (↑) | 1.5 | (↓) | 0.75 |
| Scenario | ALK | PEM | MP | Other Components |
|---|---|---|---|---|
| BAU | 1.0 | 1.0 | 1.0 | 1.0 |
| RE-Boom | 0.92 | 0.85 | 0.92 | 0.92 |
| Market-Boom | 0.92 | 0.85 | 0.92 | 0.85 |
| Crisis | 1.16 | 1.29 | 1.16 | 1.23 |
| H2-Boom | 0.84 | 0.71 | 0.84 | 1.0 |
Disclaimer/Publisher’s Note: The statements, opinions and data contained in all publications are solely those of the individual author(s) and contributor(s) and not of MDPI and/or the editor(s). MDPI and/or the editor(s) disclaim responsibility for any injury to people or property resulting from any ideas, methods, instructions or products referred to in the content. |
© 2024 by the authors. Licensee MDPI, Basel, Switzerland. This article is an open access article distributed under the terms and conditions of the Creative Commons Attribution (CC BY) license (https://creativecommons.org/licenses/by/4.0/).
Share and Cite
Sadlowski, M.; Lim, C.E. Scenario Development for Evaluating Carbon Capture and Utilization Concepts Using Steel Mill Exhaust Gases with Linear Optimization Models. Energies 2024, 17, 496. https://doi.org/10.3390/en17020496
Sadlowski M, Lim CE. Scenario Development for Evaluating Carbon Capture and Utilization Concepts Using Steel Mill Exhaust Gases with Linear Optimization Models. Energies. 2024; 17(2):496. https://doi.org/10.3390/en17020496
Chicago/Turabian StyleSadlowski, Matthias, and Chae Eon Lim. 2024. "Scenario Development for Evaluating Carbon Capture and Utilization Concepts Using Steel Mill Exhaust Gases with Linear Optimization Models" Energies 17, no. 2: 496. https://doi.org/10.3390/en17020496
APA StyleSadlowski, M., & Lim, C. E. (2024). Scenario Development for Evaluating Carbon Capture and Utilization Concepts Using Steel Mill Exhaust Gases with Linear Optimization Models. Energies, 17(2), 496. https://doi.org/10.3390/en17020496