1. Introduction
Variable speed drives are commonly used in multiple fields such as transportation, wind power, and industrial machinery, requiring high reliability. Stator insulation failure has been reported as the second most frequently occurring fault in induction machines [
1,
2,
3]. The exposition of the machine windings to high rates of voltage change (
) due to switches commutation has been early reported to have adverse effects on the insulation [
4], which are worsened with the use of new fast switching wide-bandgap devices [
5,
6,
7,
8,
9].
The better-established insulation monitoring methods are offline, most of them being specific for high-voltage machines [
2,
3,
10,
11]. These include insulation resistance, high potential, capacitance, dissipation factor, and partial discharge among others. A main drawback is that the machine has to be removed from service; also, some of these tests are invasive.
A number of methods have also been proposed for insulation monitoring of inverter-fed low-voltage machines. Especially appealing are methods that use the phase current as a vast majority of modern drives include current sensors for control and protection purposes. These methods are often referred to as
Motor Current Signature Analysis (MCSA) [
12,
13,
14,
15,
16], but noting that many forms of signal processing are possible [
17,
18]. A concern with these methods is their capability to detect insulation faults at an early stage. Current sensors are selected according to the control needs, and might not comply with the bandwidth and sensitivity requirements to detect incipient faults. It is noted in this regard that for the experimental verification, it is a common practice to add external resistors to the test machine to emulate the fault [
13,
14,
15,
17,
18,
19]; there is no evidence that these kinds of artificial faults will produce similar effects to those due to the actual insulation degradation.
The use of the common mode current has been explored as a means to detect insulation degradation at early stages. While the method is well established for high-voltage, line-connected machines [
2,
3,
20,
21,
22], its application to low-voltage, inverter-fed machines are less mature [
7,
8,
9,
10,
23,
24,
25,
26,
27,
28,
29].
This paper presents a case study on the use of the high-frequency common mode current to monitor the stator insulation condition. Although this paper will focus on the case of an induction machine, the conclusions might be extended to other types of AC machines with similar stator designs as permanent magnet and synchronous reluctance machines. Aging was accelerated by performing a sequence of experiments in which the machine was forced to operate at temperatures above its insulation class. Insulation degradation occurred progressively, and without adding exogenous elements. Methods for the signal processing capable of detecting the degradation at early stages will be discussed.
The main contributions of the presented paper are: (1) insulation degradation is performed progressively, without artificially provoking the fault and without any exogenous elements (e.g., external resistors or capacitors) following, therefore, a process closer to that occurring in real-world conditions; (2) it has been confirmed that the high-frequency behavior of the zero sequence current is sensitive to insulation degradation even at incipient stages (when the DC insulation resistance is still very high); (3) it has been shown that the behavior of the zero sequence current during the degradation process differs significantly from the behavior observed using artificially induced faults; (4) consequently, it has been shown that signal processing methods and metrics developed based on results obtained using such artificially induced faults might fail in real-world implementations.
This paper is organized as follows: common mode current modeling is presented in
Section 2;
Section 3 describes test-bench and experiments; common mode current measurement is addressed in
Section 4; motor degradation is discussed in
Section 5; signal processing and results are presented in
Section 6; finally, conclusions are summarized in
Section 7.
2. Common Mode Current Modeling
Two main approaches have been proposed in the literature for the use of the common mode current for stator winding insulation assessment. The first requires a finite resistance between winding and magnetic core; the second is based on the analysis of HF common mode current resulting from the voltage pulses applied by the inverter. Both are discussed, with the second being the approach used in this paper.
2.1. Modeling Using an Equivalent RC Circuit
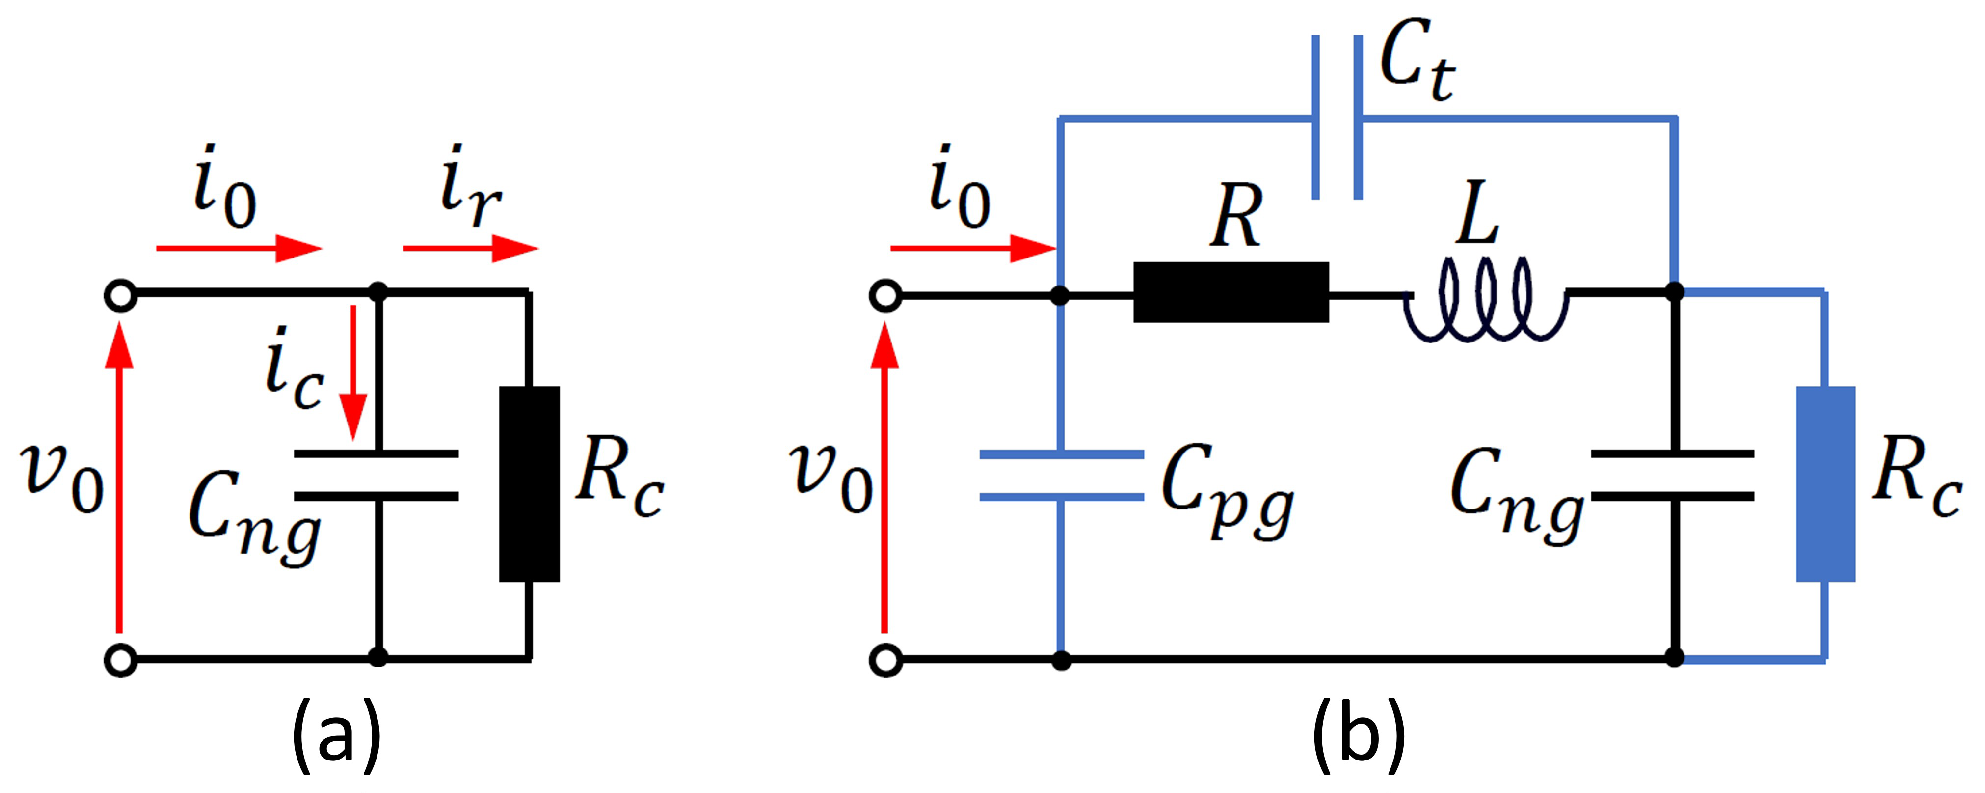
For ground-wall insulation, the model in
Figure 1a has been widely used [
2,
3,
7,
10,
20,
21,
22,
23,
24,
29]. The
Dissipation Factor (
DF) or alternatively the
Power Factor (
PF) can be used (
1). These methods are especially indicated for machines with voltage ratings of 6 kV and higher [
21,
22].
Detection of ground-wall insulation faults of inverter-fed machines has been reported too. However, in the experiments provided in most of these works, the fault was induced artificially. Capacitors [
7] or resistors [
2,
10,
24] were inserted between the neutral of the machine and ground (frame). Capacitors connected to winding taps were used in [
6,
30] to emulate changes in the inter-turn capacitance, but noting that in these works the phase current transients instead of common mode current were analyzed. In all the cases, the test machine voltage was in the range of hundreds of volts.
A concern for these reports is to what extent conclusions obtained from the analysis of faults induced artificially can be extended to the real faults. A further concern is the sensitivity required by the current sensors used to measure the leakage current in low-voltage machines [
7,
20,
29,
30].
2.2. Common Mode Voltage Excitation
Common mode voltage pulses applied by the inverter provide a useful form of
HF excitation for methods using the
HF components of the common mode current. The common mode voltage applied by the inverter is defined as (
2).
The output voltage of a two-level inverter can take only two possible values with respect to the midpoint of the inverter:
and
. It is deduced from (
2) that
can take four possible values,
. Use of (
2) is simplified if the phase voltage commands are zero (
3), as in this case all phases will switch simultaneously.
For inverters using
PWM/
SVM, the three-phase voltages and the common mode voltage will be a square wave signal (
duty) varying between
and
in this case [see voltage wave shape in
Section 3 Figure 5a] at the switching frequency of the inverter. All the results shown in this paper will be obtained with this type of voltage excitation. One possible disadvantage of this approach is that the method could not be considered
online, as it is unusual that the inverter operates with zero voltage command. However, this is not considered a drawback. On one hand, the type of fault being detected develops very slowly, with continuous monitoring not being required. In addition, operating with a voltage command equal to zero is easy to achieve after the turn-on of the drive. Furthermore, in this case, the machine would be at (or close to) ambient temperature, mitigating the influence of temperature discussed later.
2.3. Modeling Using an Equivalent Resonant Circuit
The use of the
HF components of the common mode current for diagnostic purposes has been analyzed in [
8,
25,
26,
27,
28]. Modeling of the oscillations of the common mode current using equivalent circuits with passive elements requires the presence of a resonant
LC network. Several models of this type have been proposed in the literature. The simplest circuit consists of an
RLC network [
28]. This would correspond to the circuit in black in
Figure 1b (i.e.,
and
). The corresponding transfer function is (
4) in this case.
The ground-wall resistance
can be included in the model, the resulting transfer function being (
5).
This model has been used in [
27], and with a slightly different arrangement in [
25,
26,
31]. It is noted that [
26,
27,
31] used distributed parameters, while in [
25], lumped parameters are used. In all the experiments performed during this research, it was not possible to detect any
zero currents between windings and magnetic core. However, the sensors and acquisition being used were not specific for the detection of small leakage currents (see
Section 4); also, the voltage being applied was relatively small (hundred volts). Consequently, for the analysis presented in this paper, the model in (
5) would not add any benefits compared to (
4). However, the fact that it includes a zero was found useful for the identification-based analysis presented in
Section 6.1.
The model in
Figure 1b including capacitors
and
has been used in [
8,
32]. It is noted that [
8,
32] used distributed parameters. The fact that the common mode current can flow through a purely capacitive path results in an improper transfer function, i.e., with more zeros than poles. Therefore, model identification discussed in
Section 6.1 cannot be applied in this case. Consequently, this model will not be considered. Further discussion on the use of the models presented in this section for insulation assessment is presented in
Section 6.1.
3. Test Bench and Experiments Description
One objective for the research presented in this paper was that insulation degradation followed a similar process to that occurring in real-world conditions. The use of thermal chambers to achieve accelerated aging has been reported [
9,
27,
29,
33]. In [
29], the recommendations from IEEE Std 117-2015 [
34] were followed. The test conditions applied to Class F motors in [
27] were significantly more aggressive than those recommended in [
34]. Maximum temperatures of
C and
C are reported in [
9,
33], respectively, but details on the exposure times are not provided.
Regardless of the benefits of using a thermal chamber, drawbacks must also be considered. Feeding motors operated in a thermal chamber can be extremely challenging. In addition, the thermal chamber results in temperature distribution within the motor, which can be rather different from the temperature distribution in real operating conditions. Although a climatic chamber is available for motor testing, its use was disregarded.
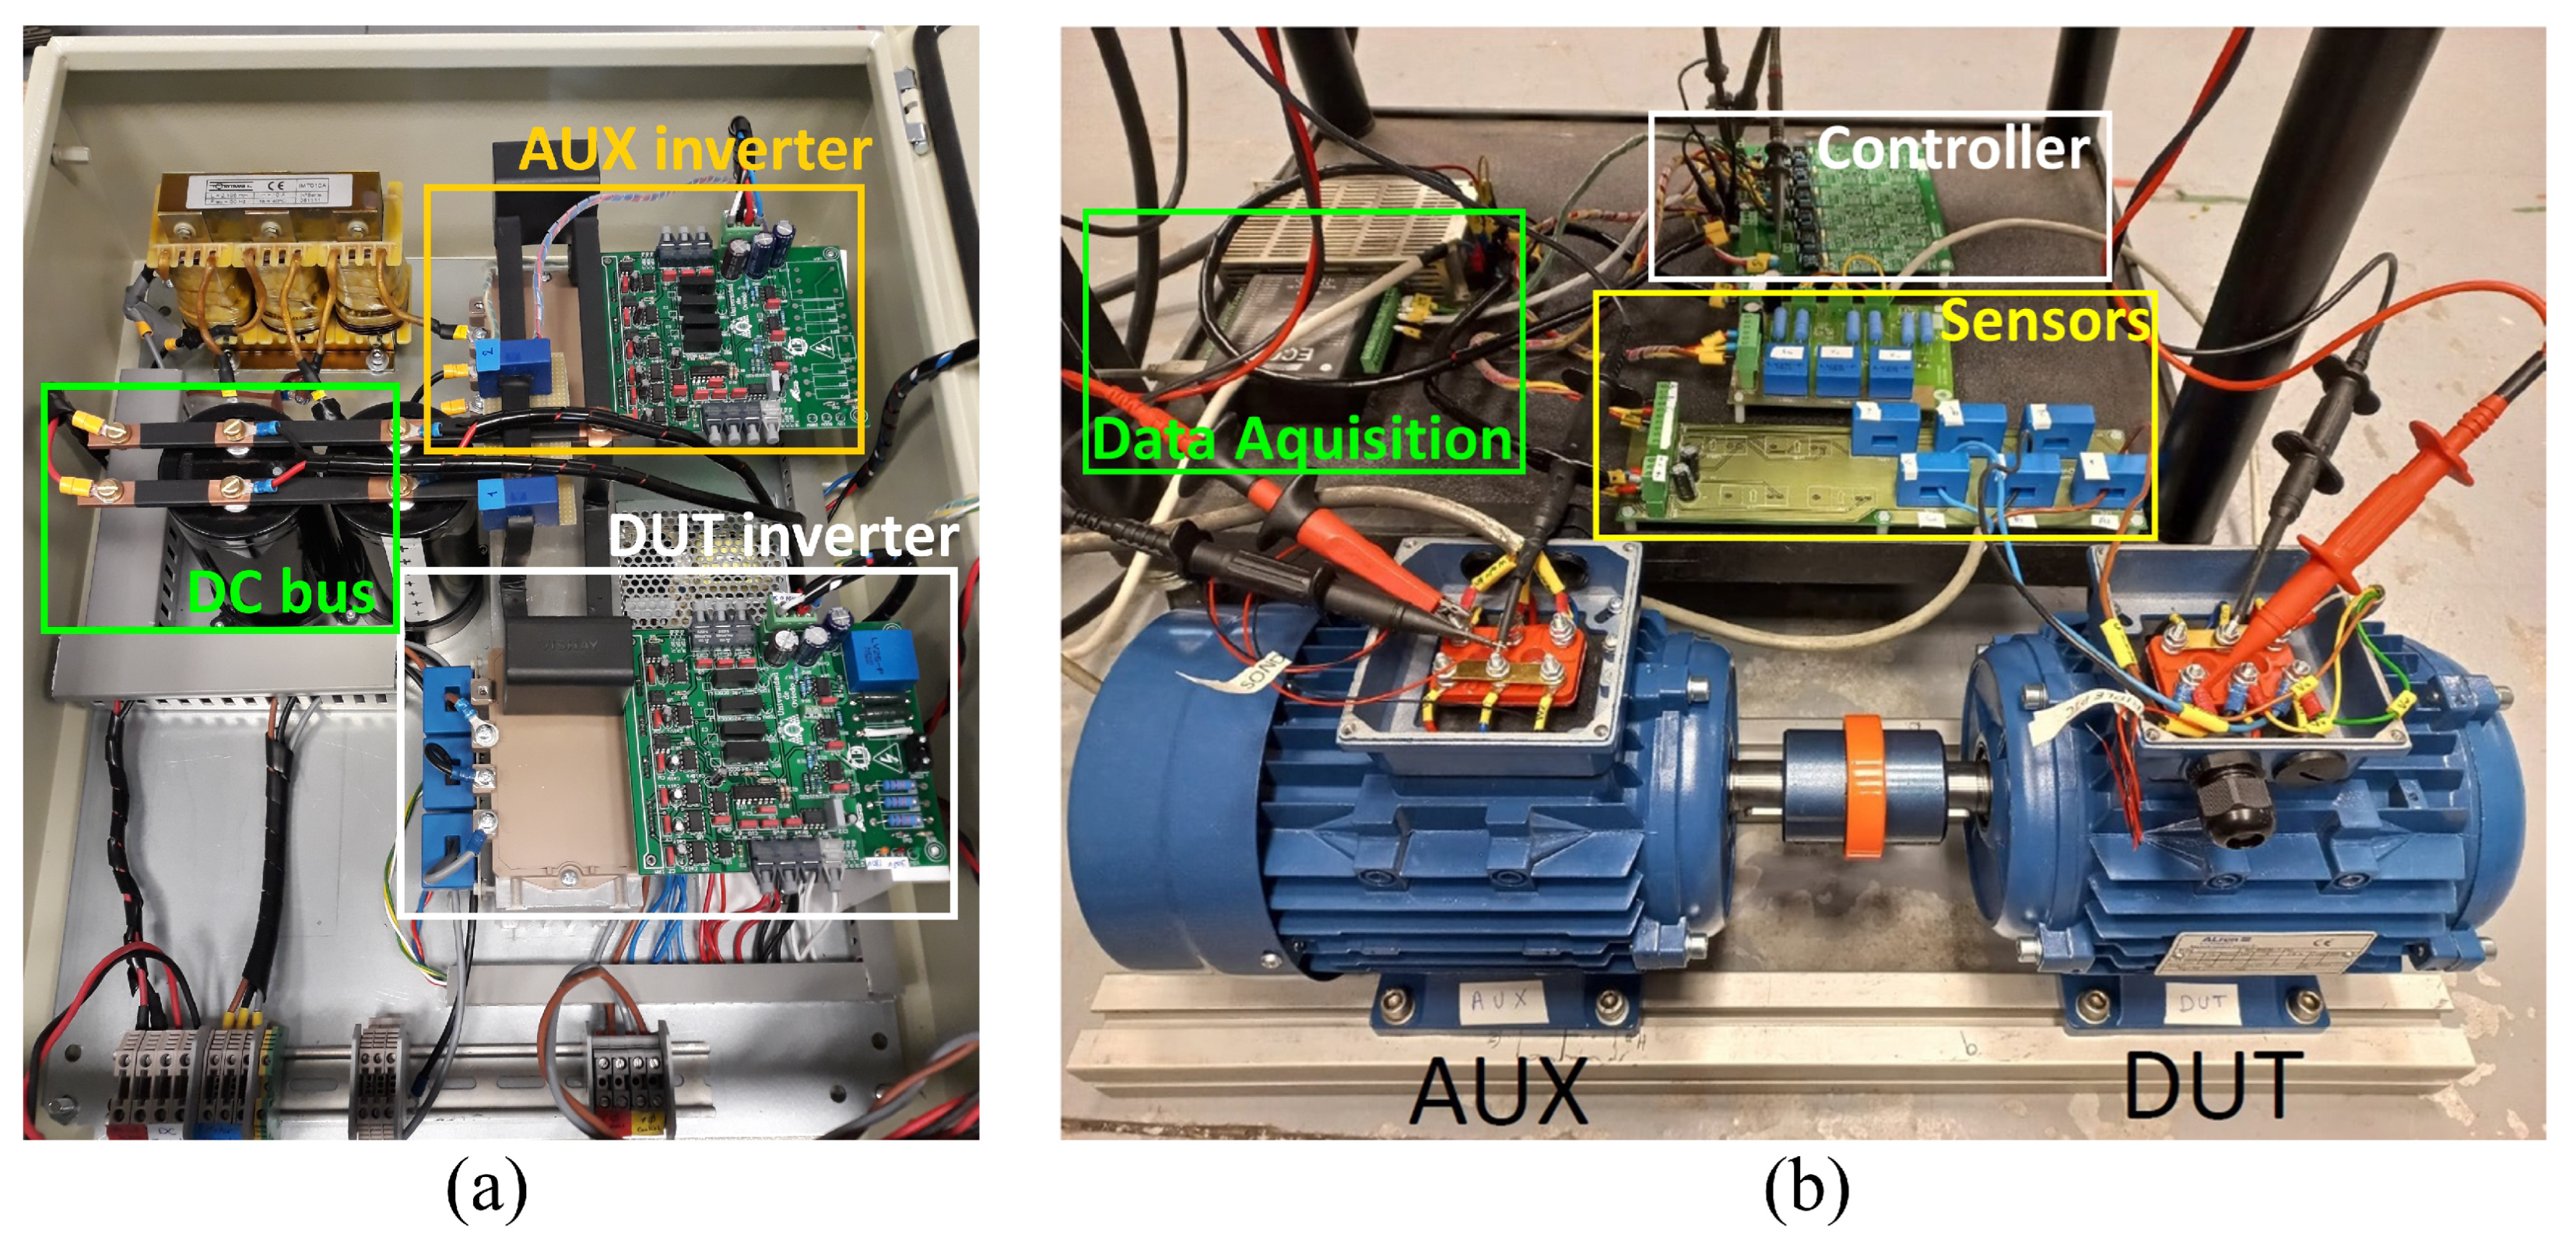
3.1. Test Machine and Three-Phase Inverter
The main test bench consists of two identical induction machines, denoted as
Device Under Test (
DUT) and
Auxiliary (
AUX) motors (see
Figure 2 and
Figure 3). Main motor parameters are shown in
Figure 3. Further details can be found in
Section 5. The
DUT fan was removed; consequently, it reached higher temperatures than
AUX. Both motors are fed by two three-phase inverters connected back-to-back (see
Figure 2 and
Figure 3), equipped with 600 V
IGBTs. The
dc-link voltage was limited to 400 V. Phase currents and voltages of both machines were measured using Hall-effect current and voltage sensors of 100 kHz bandwidth. Signals from these sensors were sampled and 750 kHz with 16-bit resolution. A 1024-line encoder is used to measure the speed. Five type-
K thermocouple temperature sensors were installed: two inserted into the end-windings of
DUT motor (see
Section 4), two attached to
DUT and
AUX frames, and one for ambient temperature. Temperatures were sampled at 1 Hz. For some of the initial experiments, temperature sensors were not operational (0
C in Figure 7).
The common mode current resonance frequency was found to occur at ≈3 MHz. Consequently, the current sensor bandwidths and sampling frequencies described above are inadequate to capture this signal. A second concern with the three-phase inverter was that maximum
dc link voltage was limited to 400 V. Higher voltages are desirable to evaluate the influence of the
dc voltage on the
HF common mode current. To overcome these limitations, a
Full-Bridge (
FB) and dedicated sensorization were developed, they are described in
Section 3.2 and
Section 4, respectively.
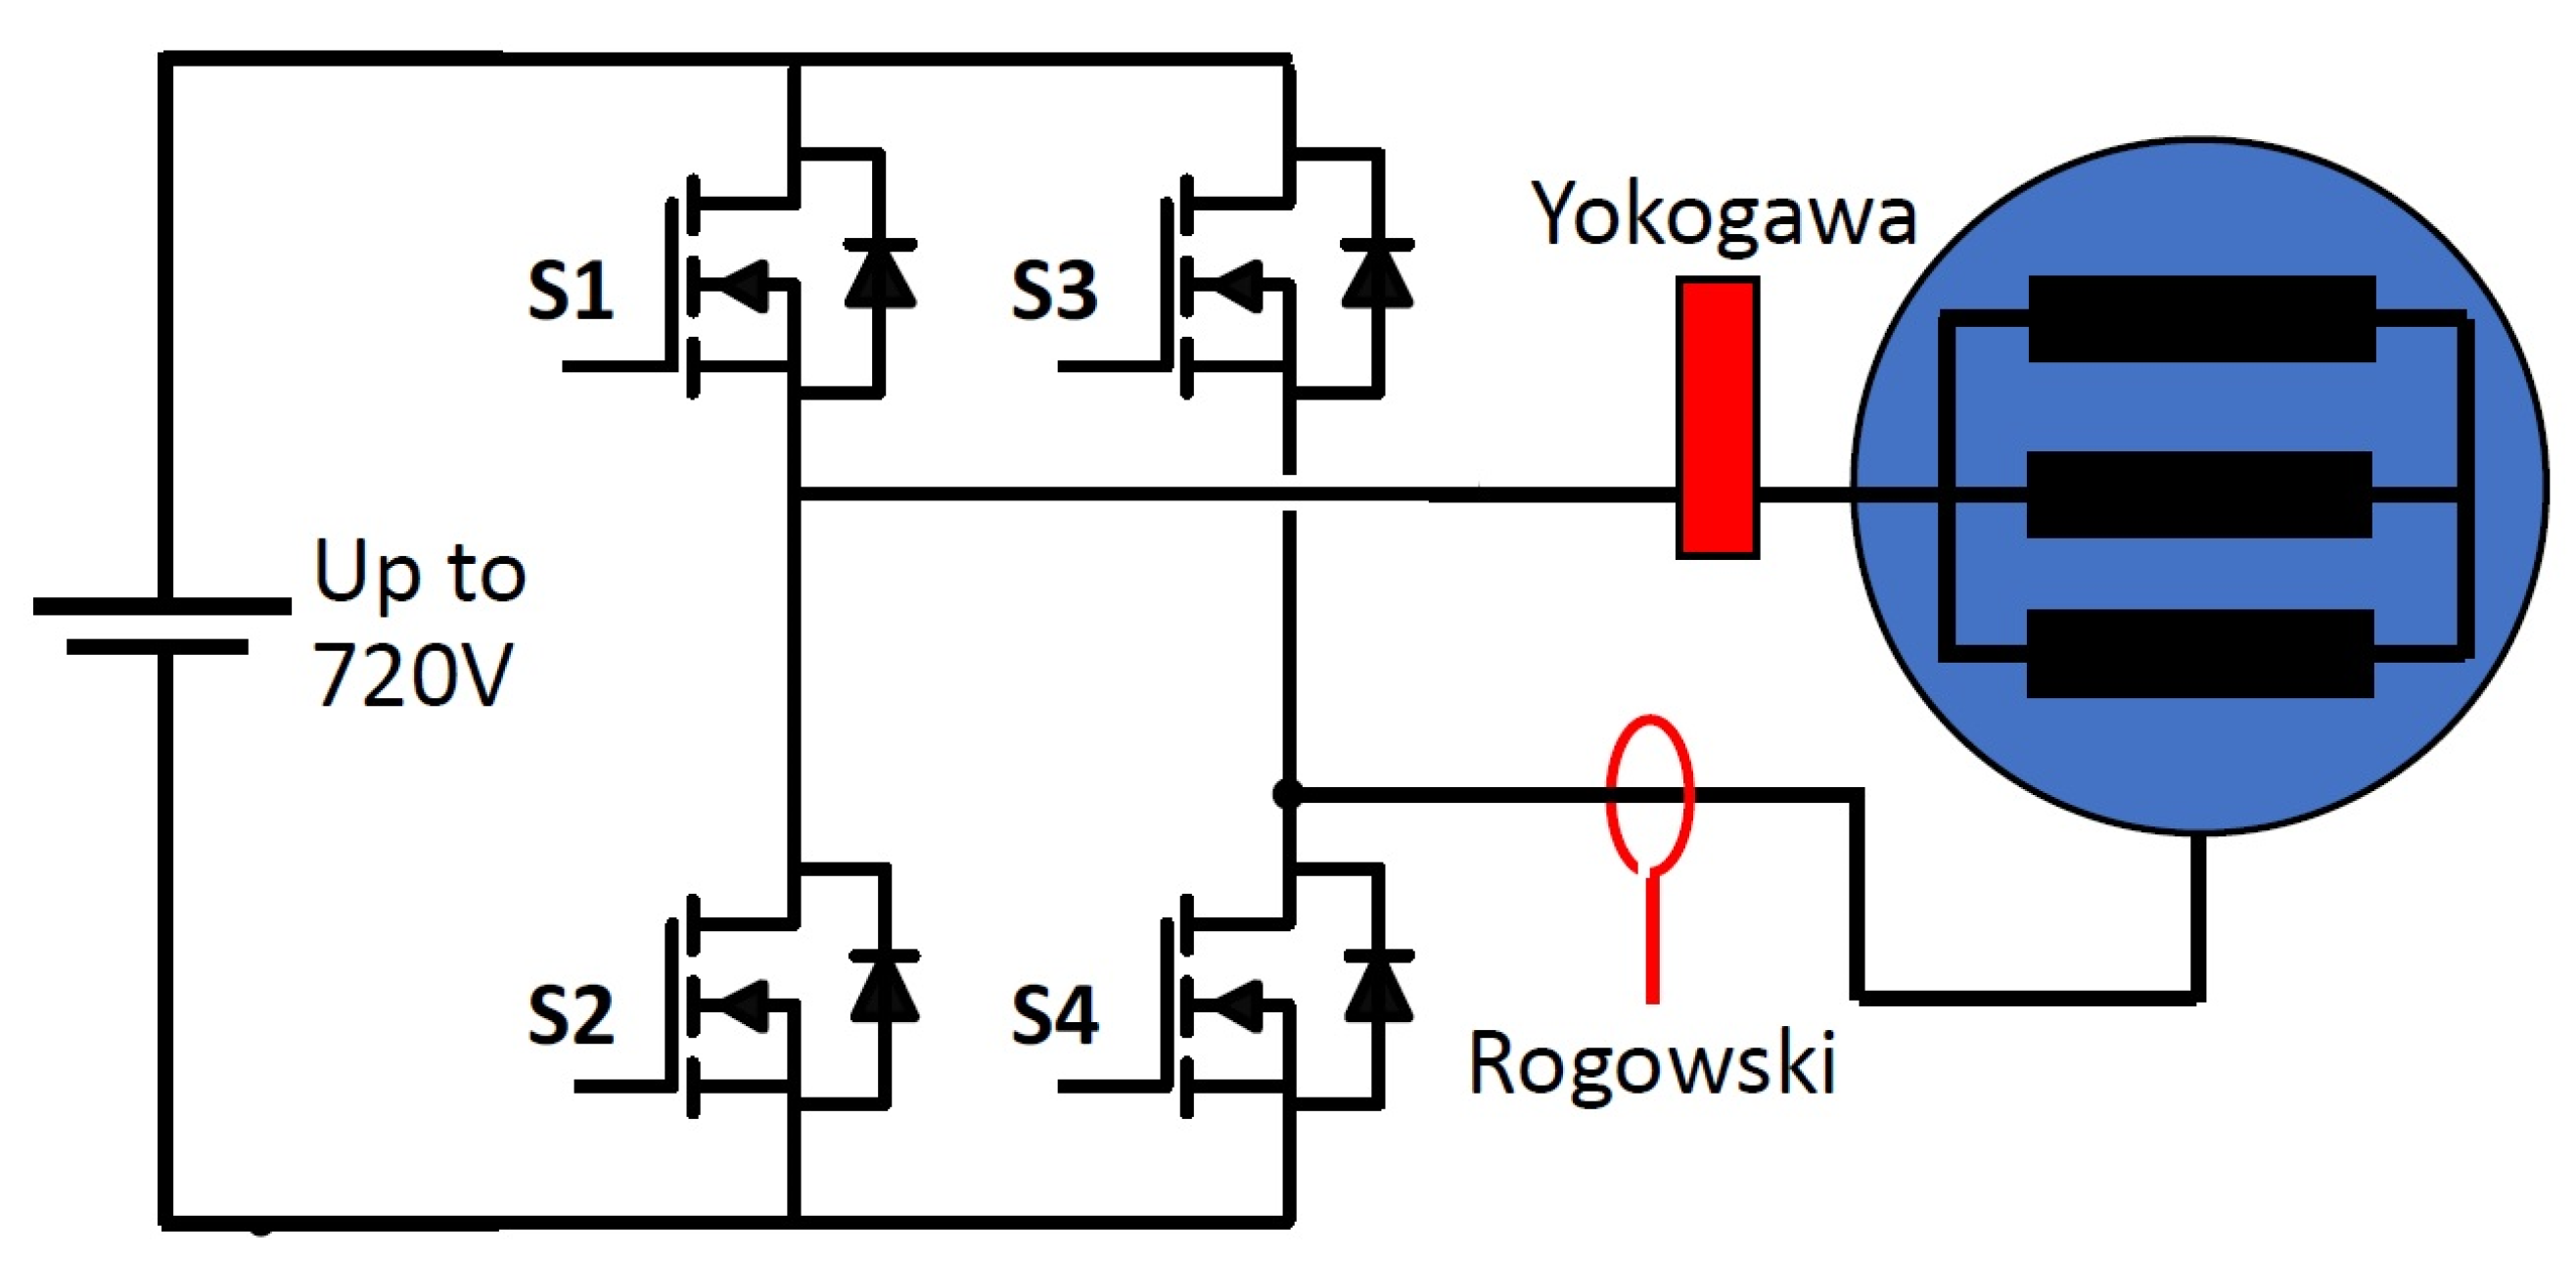
3.2. Full-Bridge Converter
The schematic representation of the
FB converter and
HF sensorization developed to capture the
HF common mode current is shown in
Figure 4. The
FB converter uses
kV
SiC MOSFET, with a
dc-link voltage up to 720 V. The voltage applied by the
FB is the same as when the three-phase inverter is commanded zero voltage (
3). However,
SiC MOSFET produces faster commutations than
Si IGBTs. Furthermore, a voltage step up to 1440 V is now possible, compared to the voltage step of 400 V achievable with the three-phase inverter.
Figure 5a,b show the voltage pulses applied by the
FB and the resulting common mode current.
Figure 5c,d show the same signals using a zoomed timescale. A conclusion from
Figure 5c,d is that the magnitude of the voltage pulses has no visible effects on the common mode current transient. However, when the insulation fault developed, the magnitude of the voltage clearly affected the speed of degradation. This will be discussed later.
3.3. Experiment Description
Experiments were performed at a maximum rate of one per day, always starting with the motors at ambient temperature. The DUT temperature increase is due exclusively to losses induced during its operation. To accelerate degradation, in some of the experiments DUT was forced to operate at temperatures above its class for small periods of time. As mentioned, DUT fan was removed. Consequently, AUX temperature is significantly lower, its insulation not being jeopardized.
Motors are fed using the back-to-back inverters in
Figure 2. Phase currents, voltages, speed, and temperatures are measured and stored. The operating conditions of the motors (control and modulation strategy of inverter feeding
DUT machine, speed, and torque) vary from experiment to experiment, not being relevant to the contents of this paper. Most of the time the machines operate at rated load as this produces higher losses.
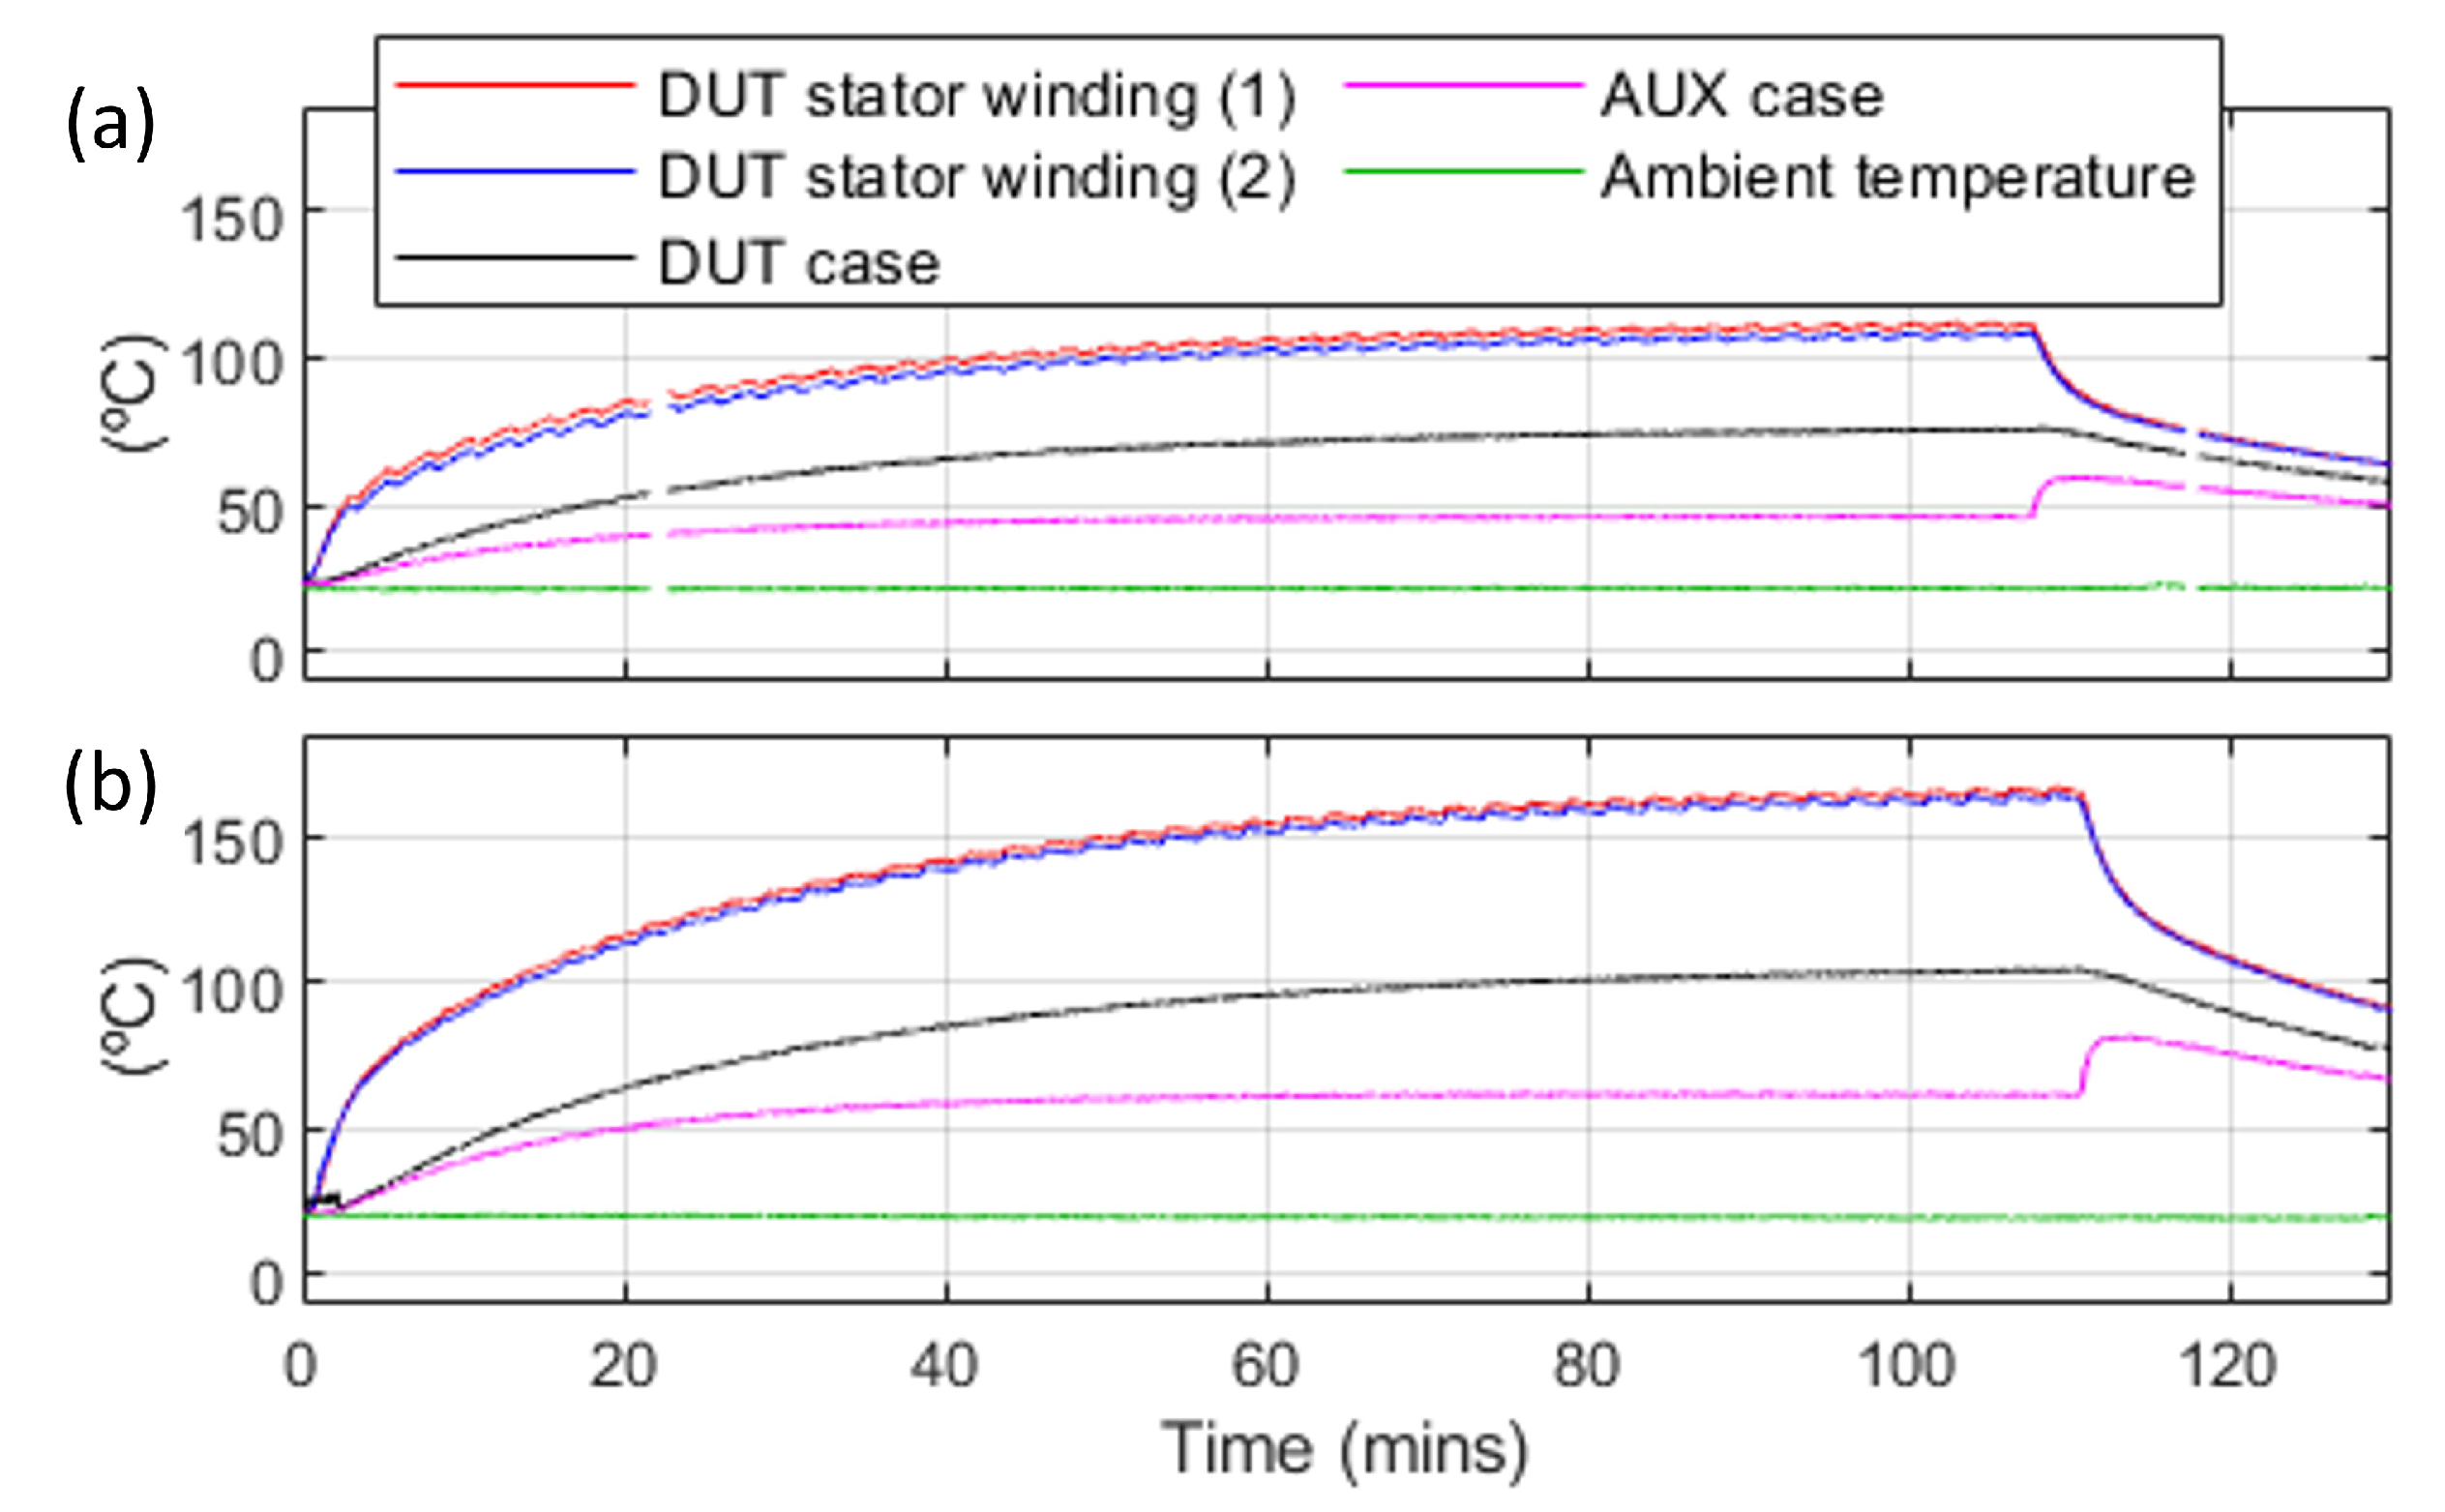
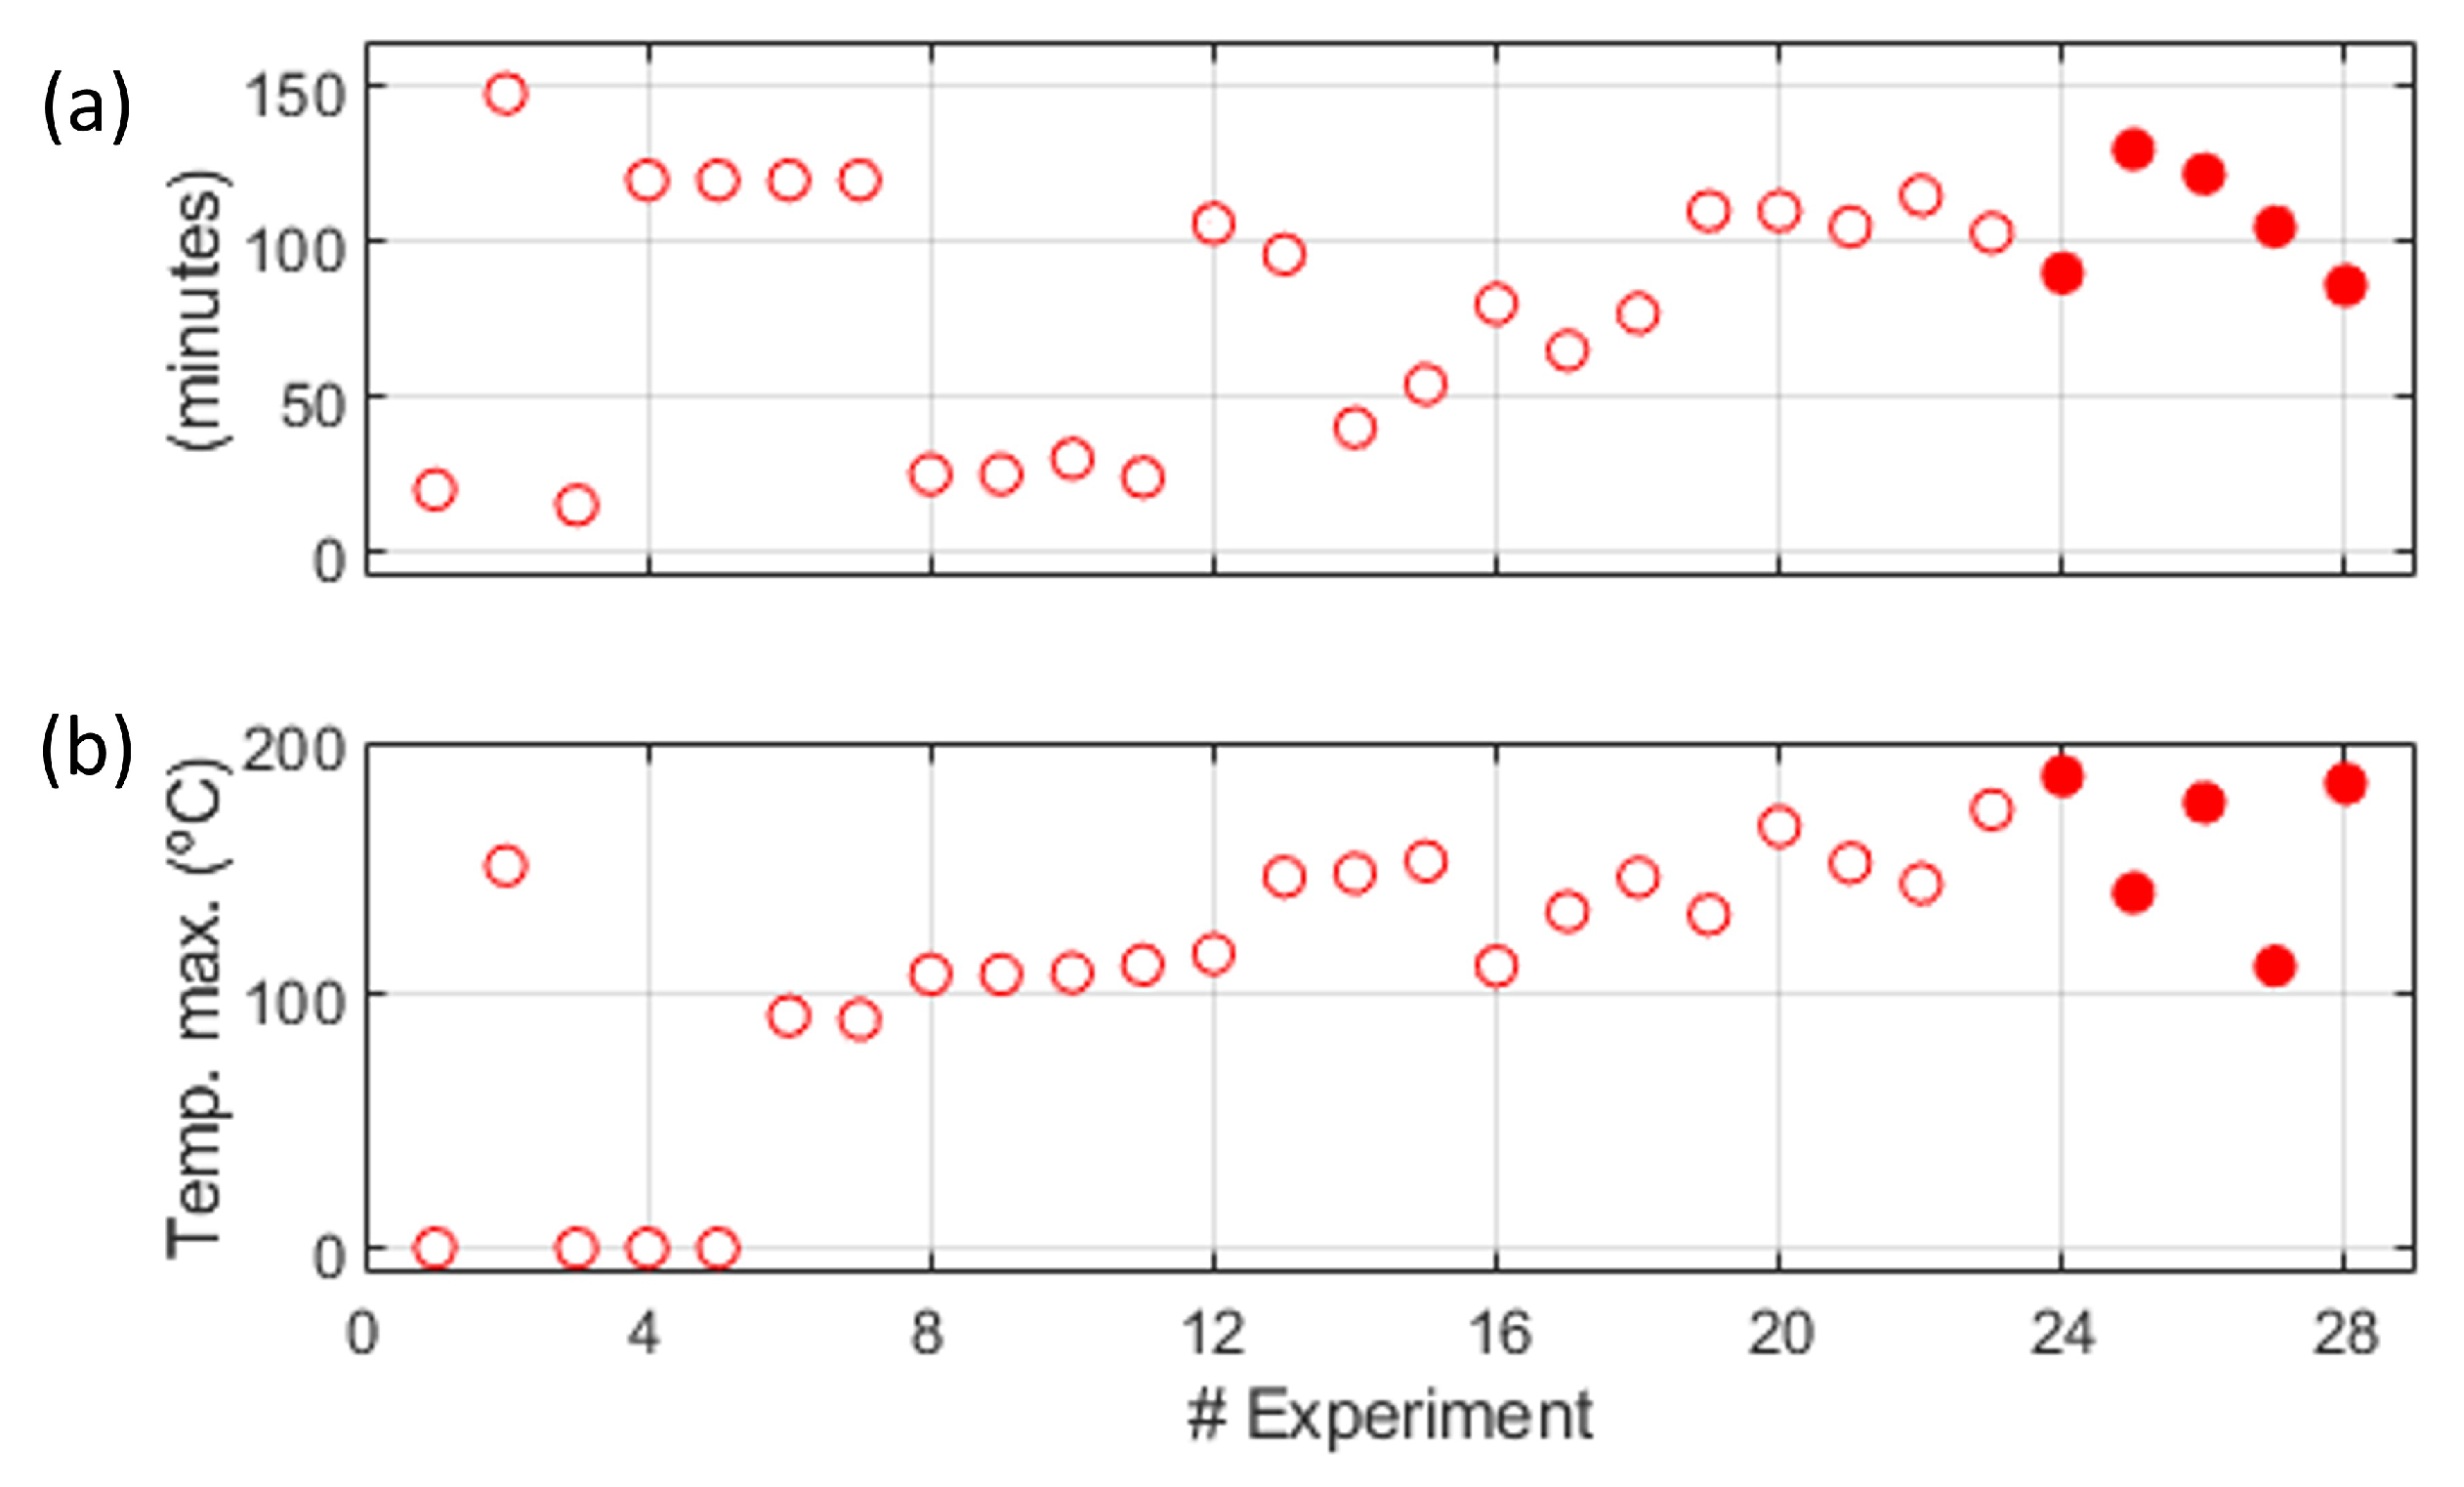
The number of experiments before failure was 28.
Figure 6 shows temperatures vs. time for two of them. Both took ≈110 min, with a maximum
DUT stator winding temperature of ≈110
C and ≈160
C, respectively.
Figure 7 shows the duration and maximum temperature for all the experiments carried out. Further discussion on
Figure 7 is presented in
Section 5.
DUT phase-to-phase and phase-to-frame insulation was measured using an insulation tester immediately before and after each experiment. The
HF common mode current measurement using the
FB was not performed for all the experiments, as disconnection/reconnection of power converters was impractical. However, it was measured before starting any new experiment once phase-to-phase insulation degradation was detected for the first time with the insulation tester (experiment
in
Figure 7).
4. Common Mode Current Measurement
A variety of sensors have been reported in the literature for common mode current analysis. The use of impedance analyzers with embedded sensors is reported in [
25,
28]; high sensitivity 2 MHz bandwidth differential current transformers were used in [
3,
20], but noting that in this case, the objective was to detect the leakage current through the winding-to-magnetic core resistance; shunt resistors were mentioned in [
27]; use of Rogowski coils is reported in [
35,
36]; in [
35] a 2 MHz magnetoresistive sensor was used; [
7,
8,
29] used a 1 MHz bandwidth current transformer; a current transformer was also used in [
26], but the bandwidth was not specified.
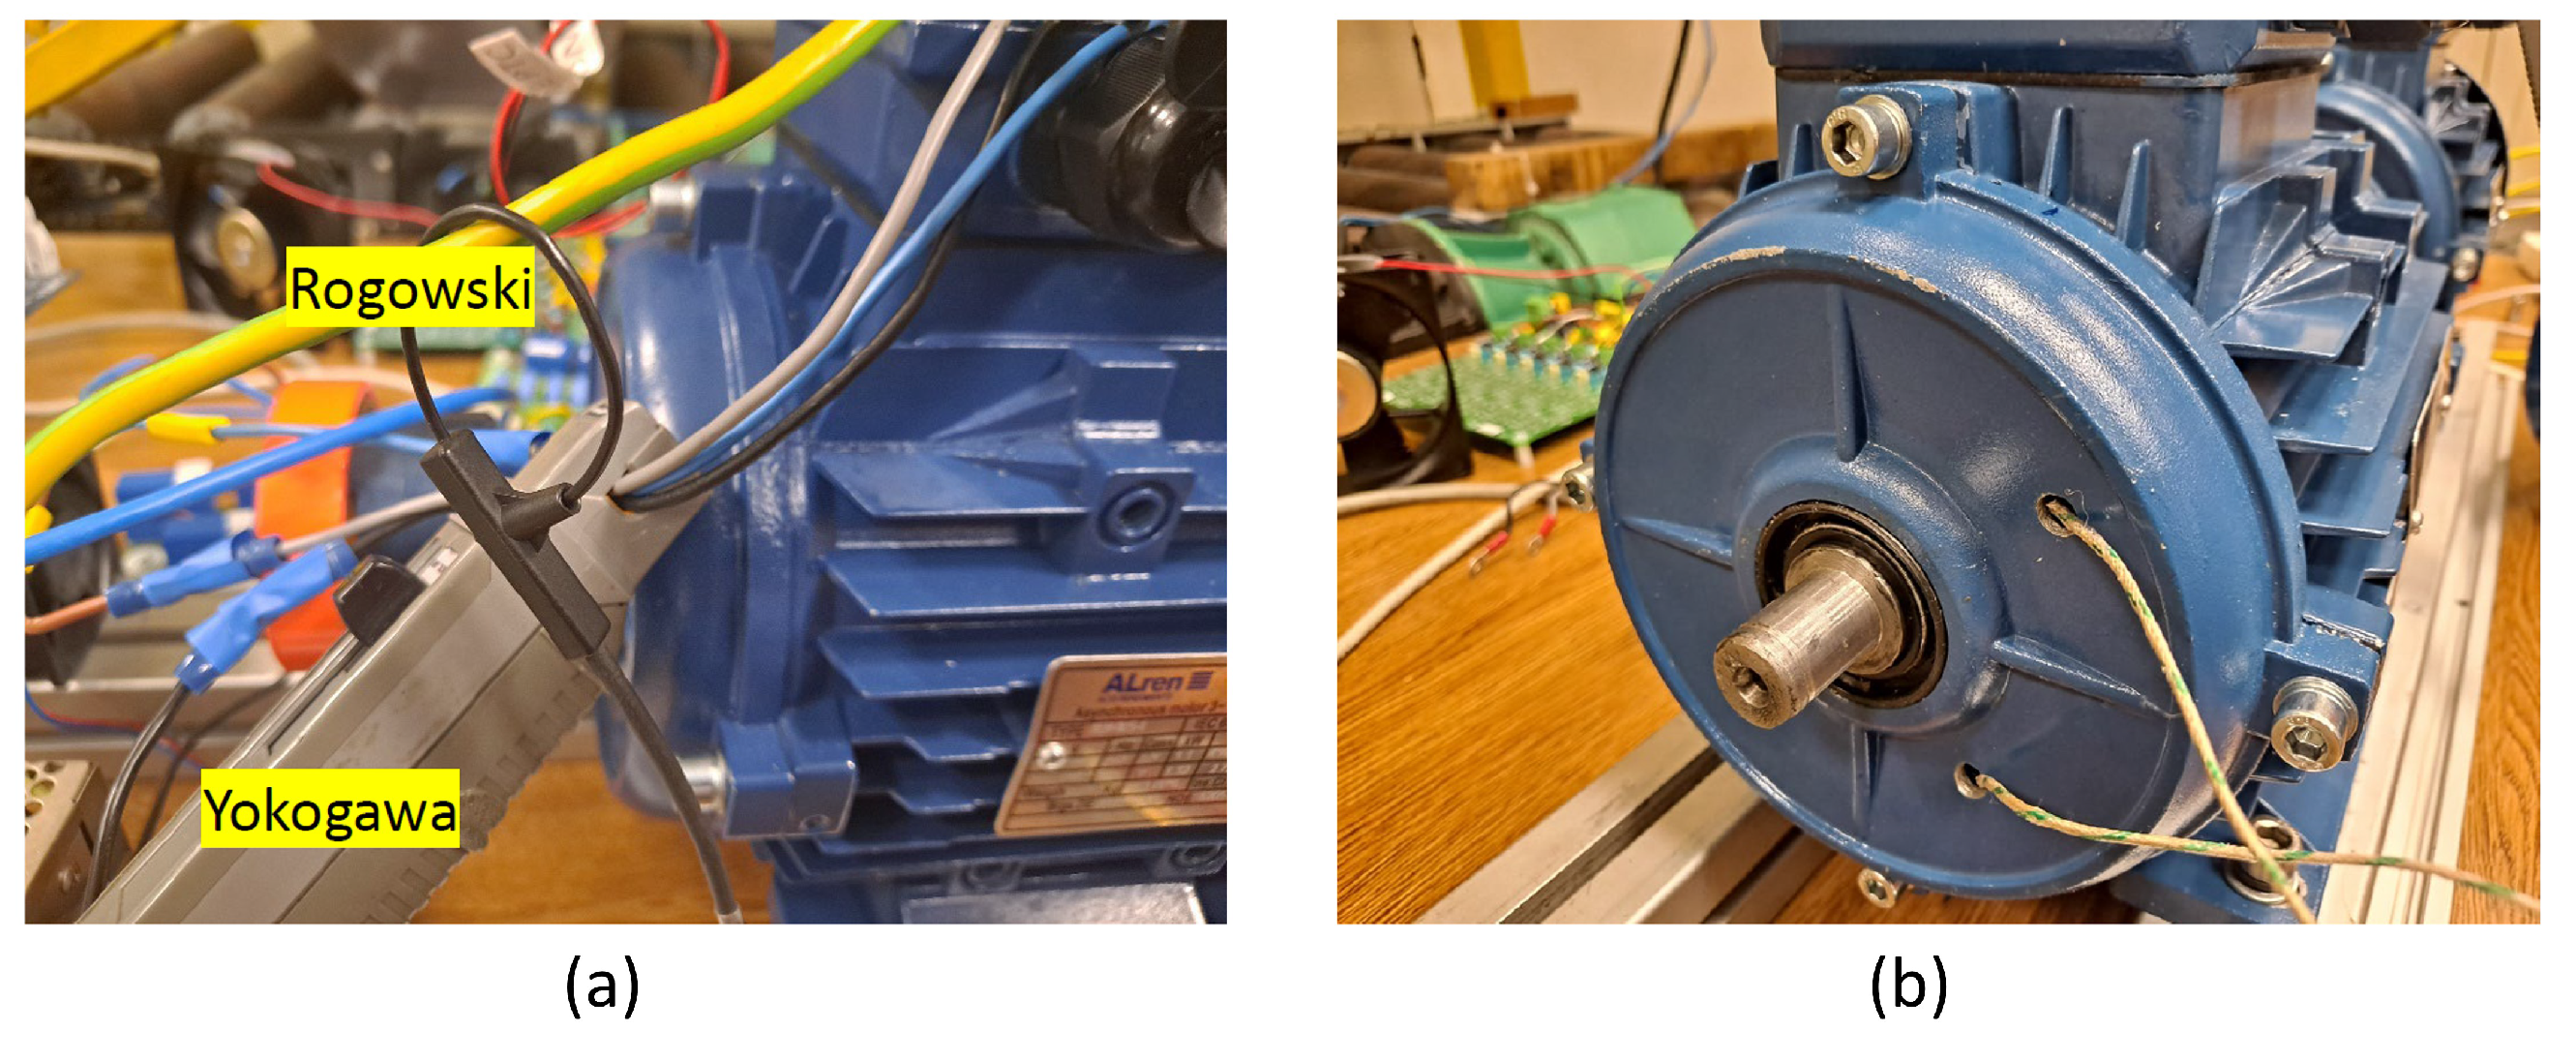
From the observed properties for the common mode current, it is concluded that bandwidths in the range of MHz are required. Two current sensors were evaluated: (1) High bandwidth, Hall-effect type instrumentation probe, and (2) Rogowski coil (See
Figure 8). For signal acquisition, a conventional digital scope was used. Sensors configuration and connection are shown in
Figure 4 and
Figure 8a. Measured signals are shown in
Figure 9a. Both provide similar responses, the differences could come from the fact that one sensor was located at the cable feeding the stator and the other at the return cable.
For a real implementation, there are two relevant aspects to consider. First, whether the sensor would be installed permanently, or only when a measurement is to be taken; second, the accuracy required both for sensors and associated electronics to achieve reliable measurements. Considering that the faults being tracked develop slowly and the sensors can be relatively expensive, having the sensors permanently installed might seem an inefficient solution. However, installing the sensor when a measurement is to be taken will give rise to additional concerns, e.g., if the sensor changes from measurement to measurement, or tolerances mounting the sensor. Having the sensor permanently installed would significantly reduce these concerns. In this case, sensor repetitiveness rather than sensor accuracy would be the parameter to consider. On the other hand, Analog-to-Digital Converters (ADC) with sampling rates in the range of at least tens of MHz would be required to sample the HF common mode current. ADCs providing such sampling rates with 16-bit resolution can be found at a reasonable cost. Having them permanently installed might not be therefore prohibitive in some applications.
If the sensor is to be installed only when a measurement is required, the use of open-core sensors would be advantageous. Consequently, the Rogowski coil seems a good option in this case, as it is a flexible, clip-around sensor. Since the information of interest is at
HF, and in principle the low-frequency components of the common mode currents do not contain useful information, the use of a Rogowski coil without an integrator at its output might be viable [
36]. It is noted, however, that this option has not been evaluated experimentally. Sensitivity of Rogowski coil to environmental conditions should also be considered [
37].
HF Common Mode Current Sensitivity Analysis
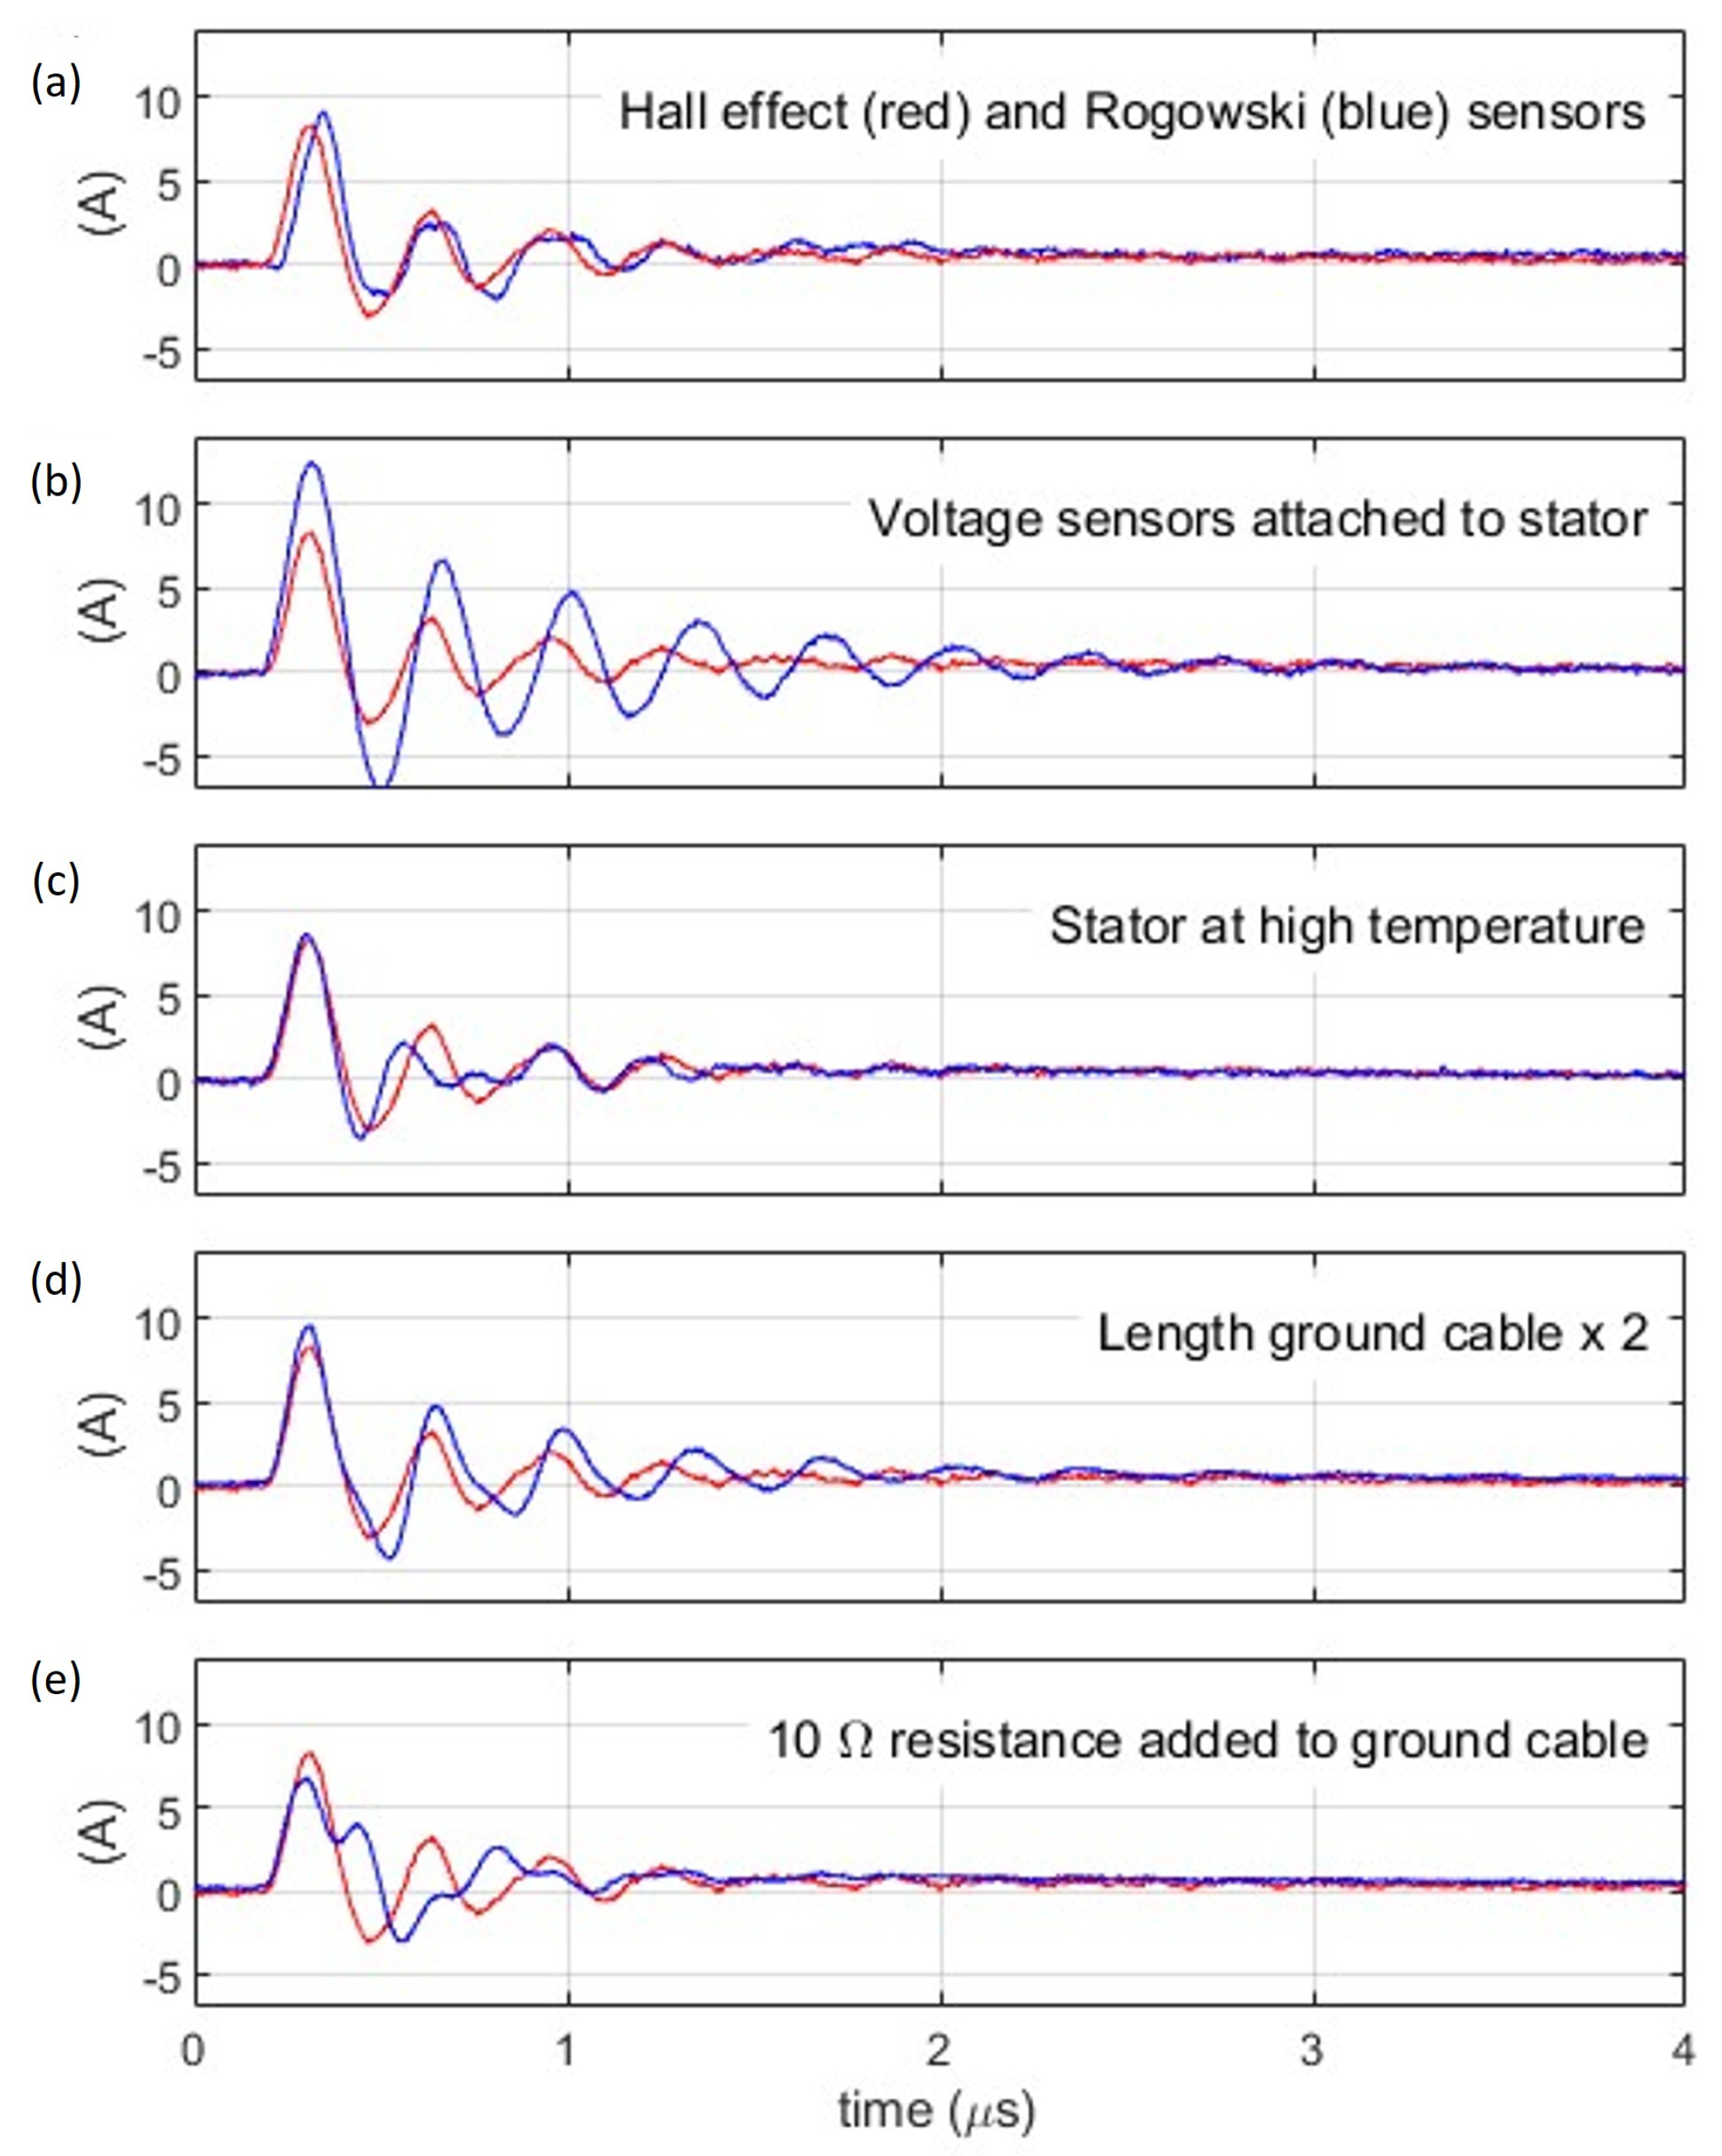
A number of experiments were performed to understand the sensitivity of the
HF common mode current to operating and implementation issues. The results are shown in
Figure 9b–f. All the measurements were made using the Hall effect sensor. The trace in red in
Figure 9a is shown in all the cases for reference. The remaining subplots in
Figure 9 show the effect of: (b) connecting Hall-effect type voltage sensors to the stator; (c) increasing the stator temperature; (d) increasing the ground cable length
; (d) adding a resistor to the ground cable.
It is concluded from inspection of
Figure 9 that the
HF common mode current is sensitive to changes in the machine temperature, cable impedance, as well as to other elements that could be connected to the stator as voltage sensors. Consequently, to increase the reliability of the measurements, special attention should be paid to minimizing the changes of these parameters during measurements.
5. Motor Degradation and Post-Fault Analysis
The insulation level was measured before and after each experiment using an insulation tester. Phase-to-phase insulation and phase-to-frame insulation for experiments #1 to #23 was >10 G, which was the limit value of the insulation tester. insulation decreased to be in the range between <10 G and >5 G after experiment #24. failure occurred during common mode current measurement following experiment #28. After this experiment, noise due to partial discharges was readily audible when a common mode voltage of 720 V was applied. Initially, the noise disappeared when the common mode voltage was 360 V. However, the fault evolved very quickly resulting in a net insulation failure between phase . No ground-wall fault was detected. Phase V remained healthy as well. DUT motor was open after failure, with no deterioration in the stator winding being visible.
Insulation fault occurred between phases
U and
W. As the stator winding has a single layer with one phase per slot, the fault necessarily occurred in the end-winding. End-windings have been reported to be the hottest spot in electric machines [
38].
Figure 10 shows the measured resistance between phases
U and
W using the four possible combinations and the estimated location of the fault. The phase resistances and phase-to-frame capacitance for the healthy case and after the last test are shown in
Table 1. Capacitance for phase
U and
W after the fault is the same as they are short-circuited. Resistance and capacitance for the healthy phase increased slightly.
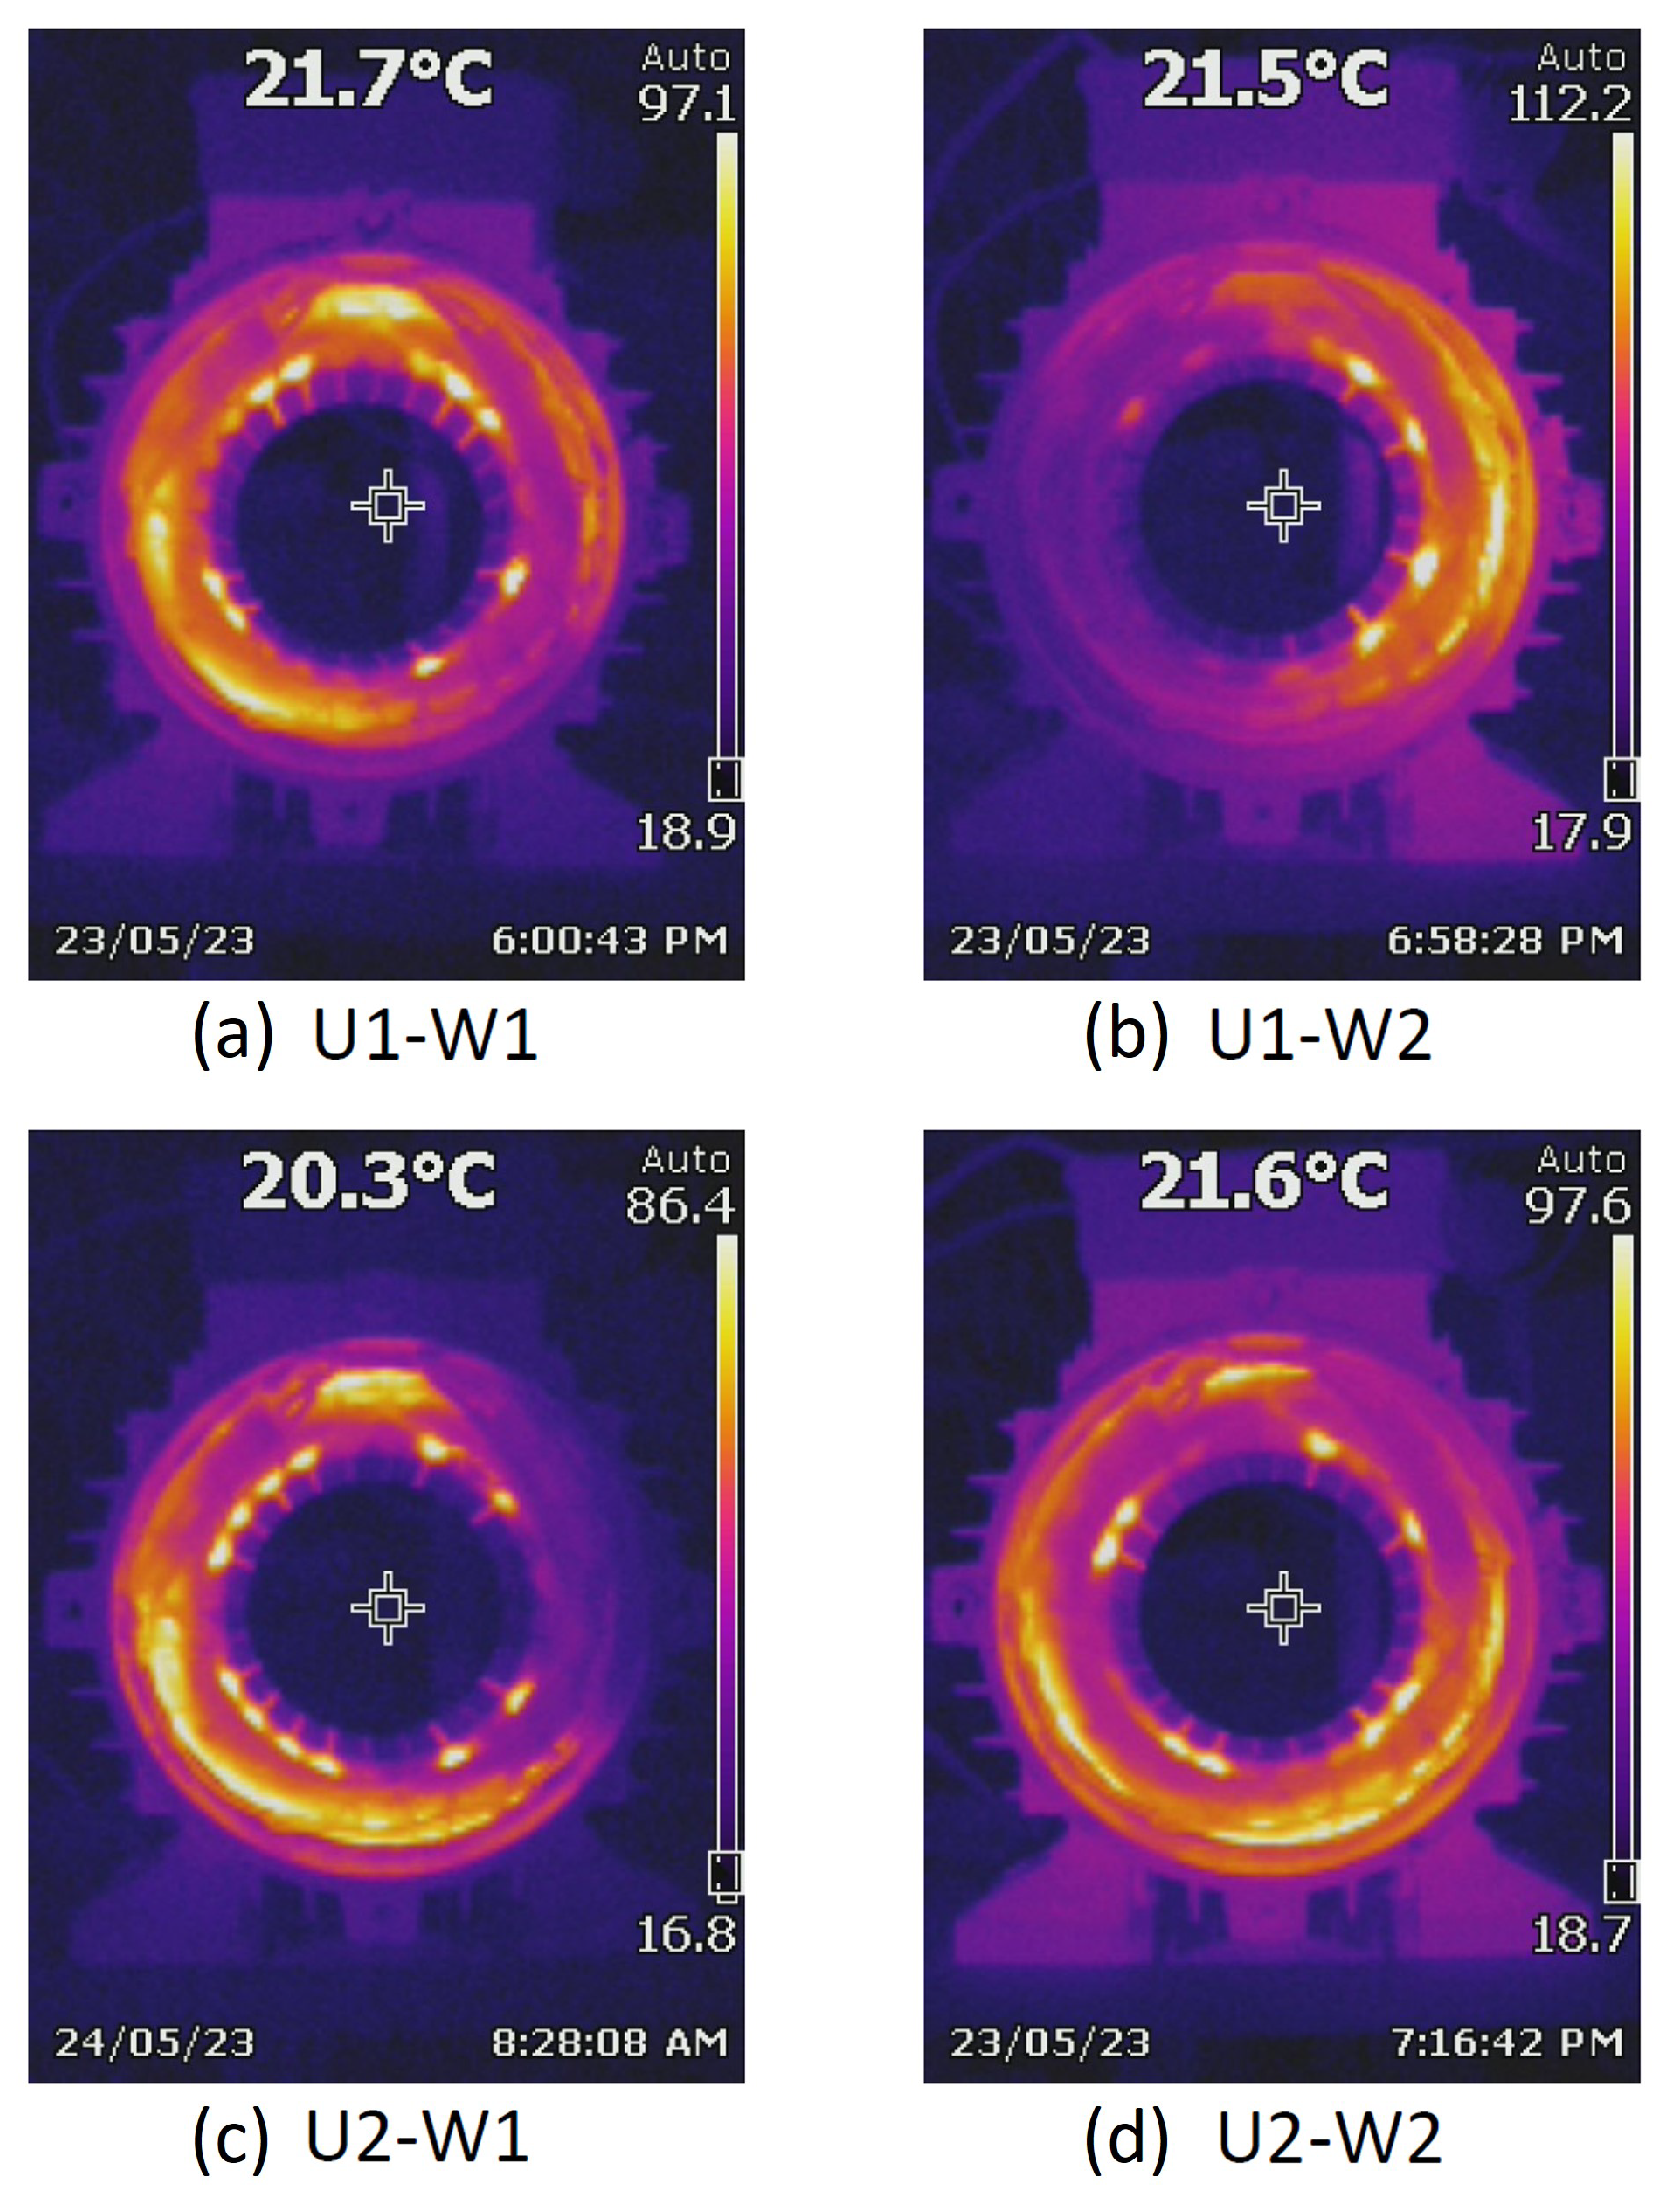
Figure 11 shows captures with the thermal imaging camera when a
voltage is applied to the stator terminals indicated in the corresponding captions. The voltage was adjusted manually to obtain the nominal current. The images confirm that the insulation fault occurred in the end-winding, and not in the cables connecting the terminal box to the winding.
6. HF Common Mode Current Analysis and Processing
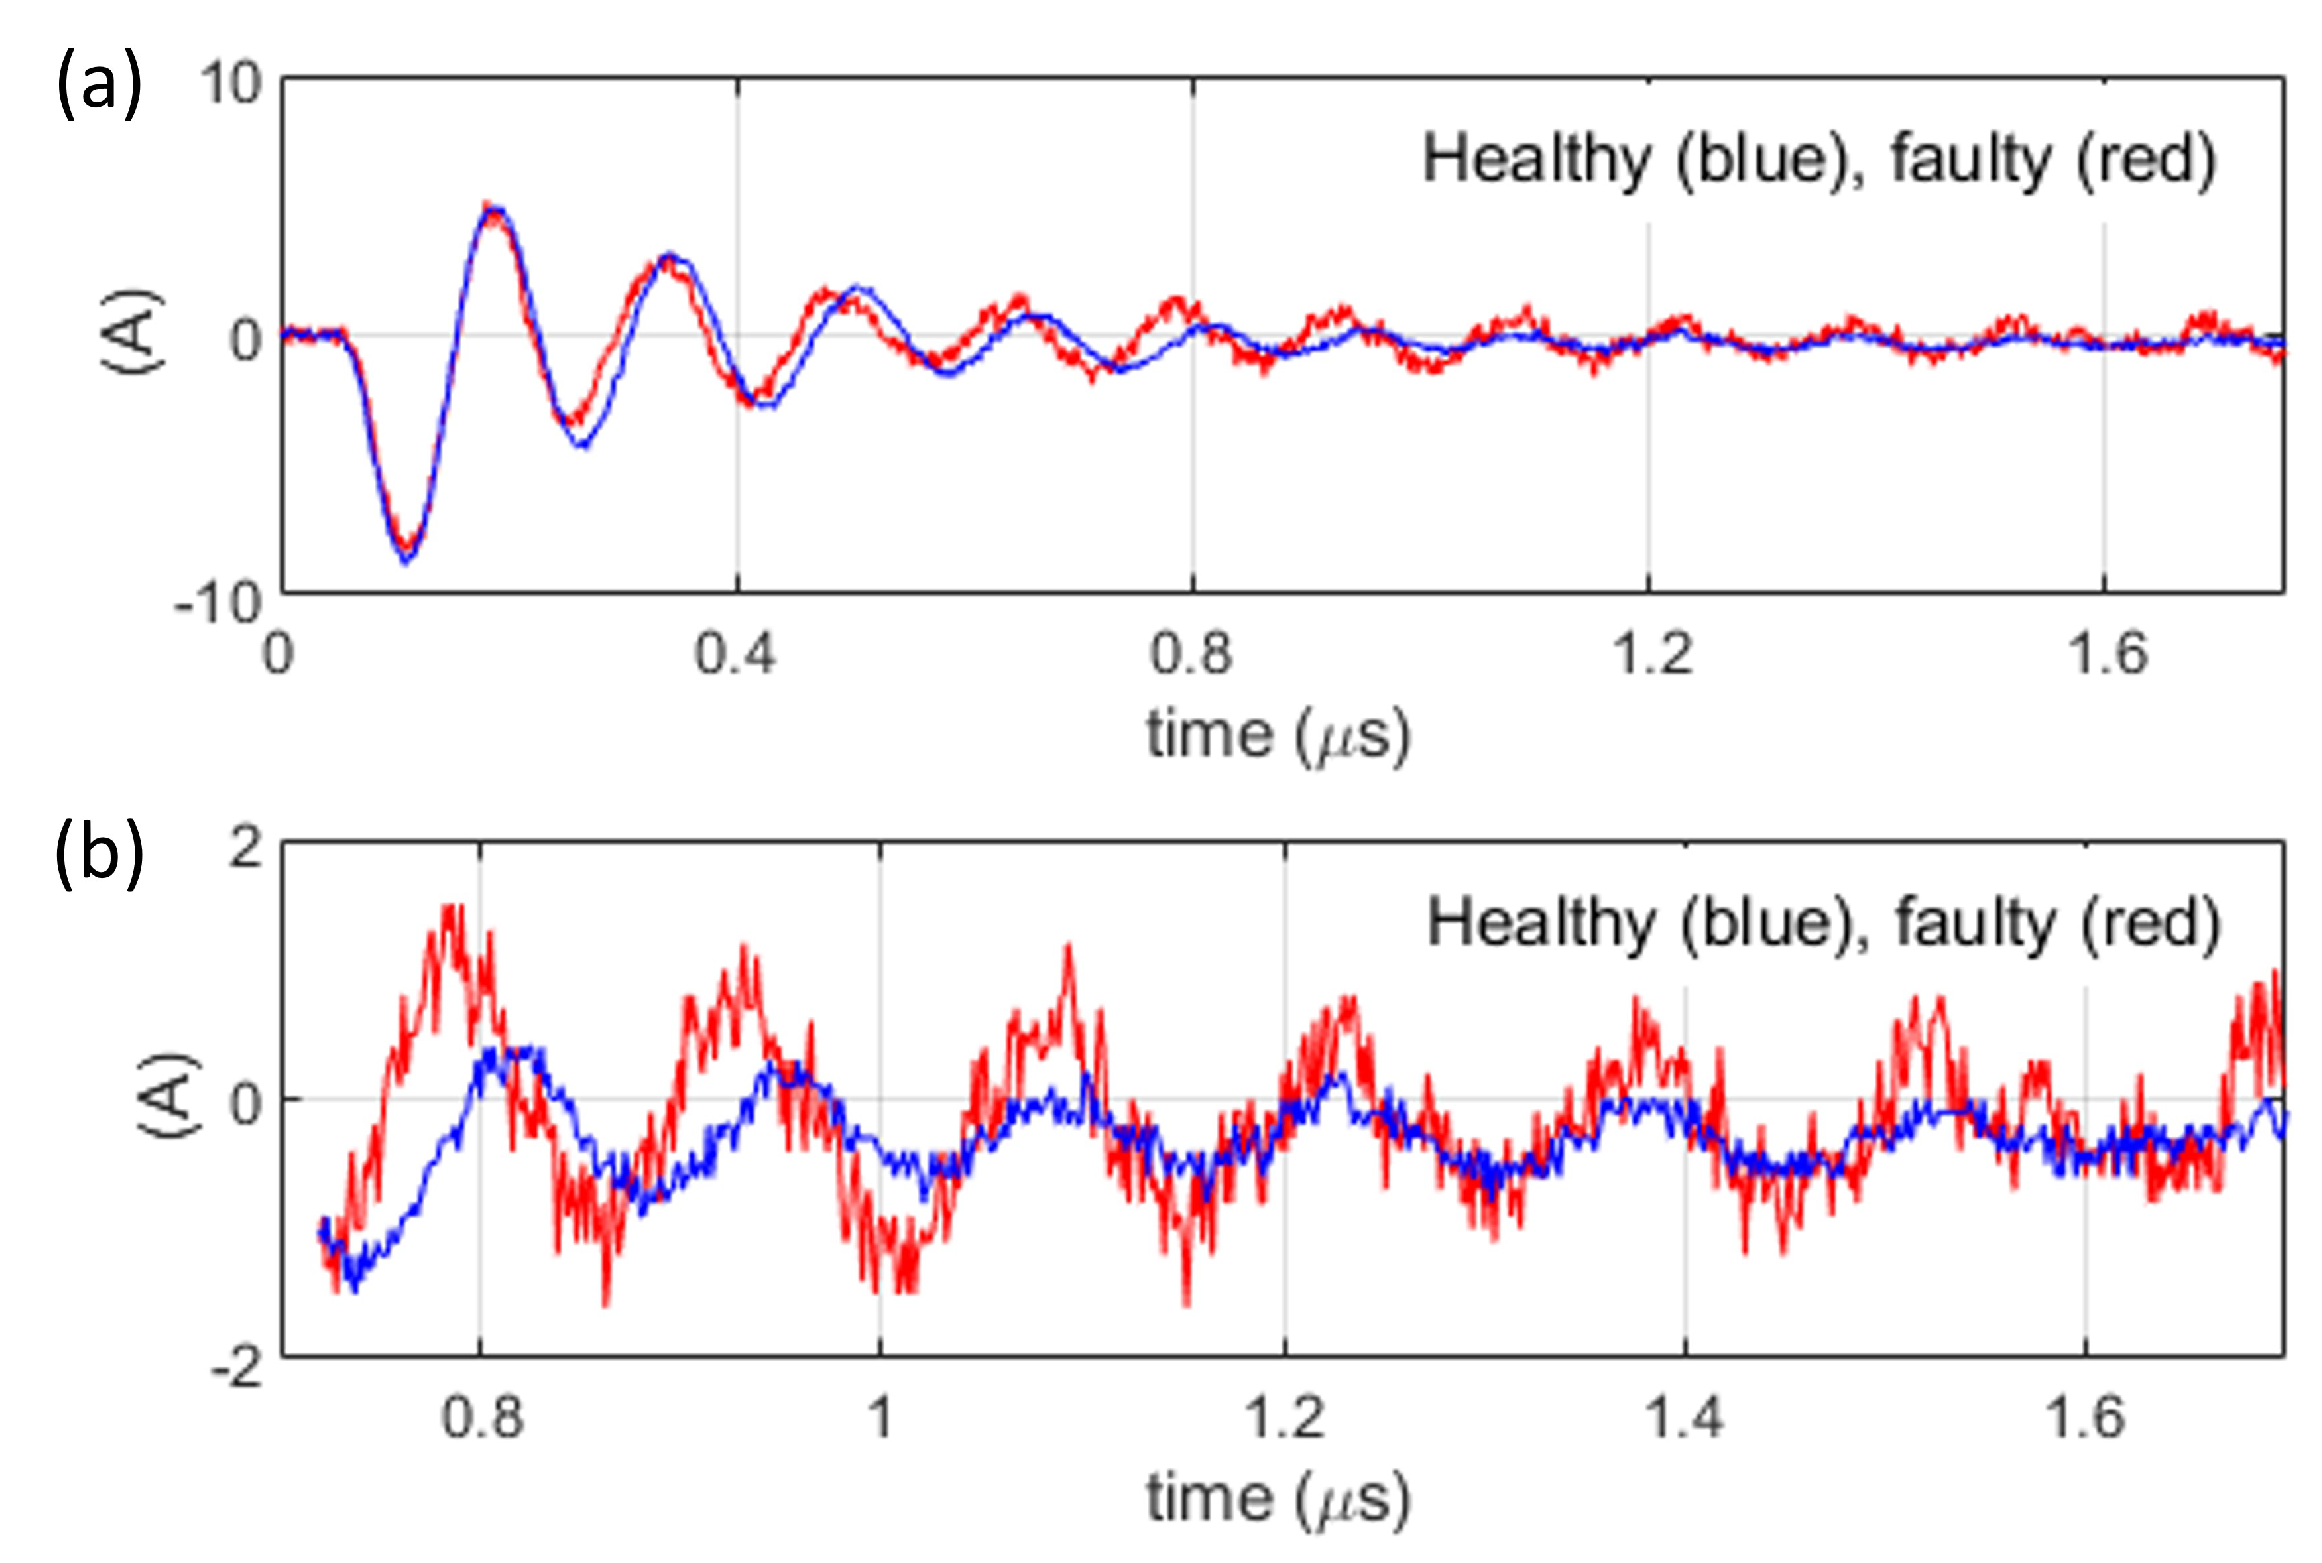
Figure 12a shows the common mode current for the case of a healthy machine, and for the case when an insulation decrease was detected for the first time with the insulation tester (experiment
, see
Figure 7). It is noted that although the figure shows a single pulse, the response is highly repetitive.
At first glance, the response for both cases looks very similar. A closer look reveals that the coincidence is most remarkable during the initial part of the transient.
Figure 12b shows the common mode current after removing the initial part of the transient in
Figure 12a. This signal is denoted as
. It is observed that the oscillations of
DUT once insulation degradation has started last longer (lower damping). Interestingly, this change in behavior of the common mode current remained almost unaltered for all the measurements of the common mode current performed previous to the start of experiments
to
in
Figure 7. Furthermore, the behavior persisted even when the machine could not be fed from the inverter due to the lack of insulation between phases.
Different forms of signal processing of the common mode current are discussed in the following subsections.
6.1. Insulation Assessment Based on Model Estimation
The peak value of the common mode current was used in [
26,
27] as a possible indicator of the insulation condition. However, from the results obtained in this work, the peak value alone was not found to be a reliable metric. The common mode voltage-to-current frequency response function was used in [
8,
25,
32]. Changes either in the peak value or in the frequency response function would be connected with system pole migration in (
4), (
5) due to changes in machine parameters. It would, therefore, be expected that the migration of model parameters could provide useful information on the insulation condition.
Model identification using the measured common mode current was implemented using Matlab. The function
procest with a model structure of two underdamped poles and a zero provided the best fit to estimation data, the system resulting from the identification being of the form (
6).
Under the assumption that
, the following relationship can be found between (
6) and (
5).
To reduce the sensitivity to noise or other possible disturbances, parameter identification was performed by averaging the common mode current resulting in eight successive common mode voltage transitions, as shown in
Figure 5.
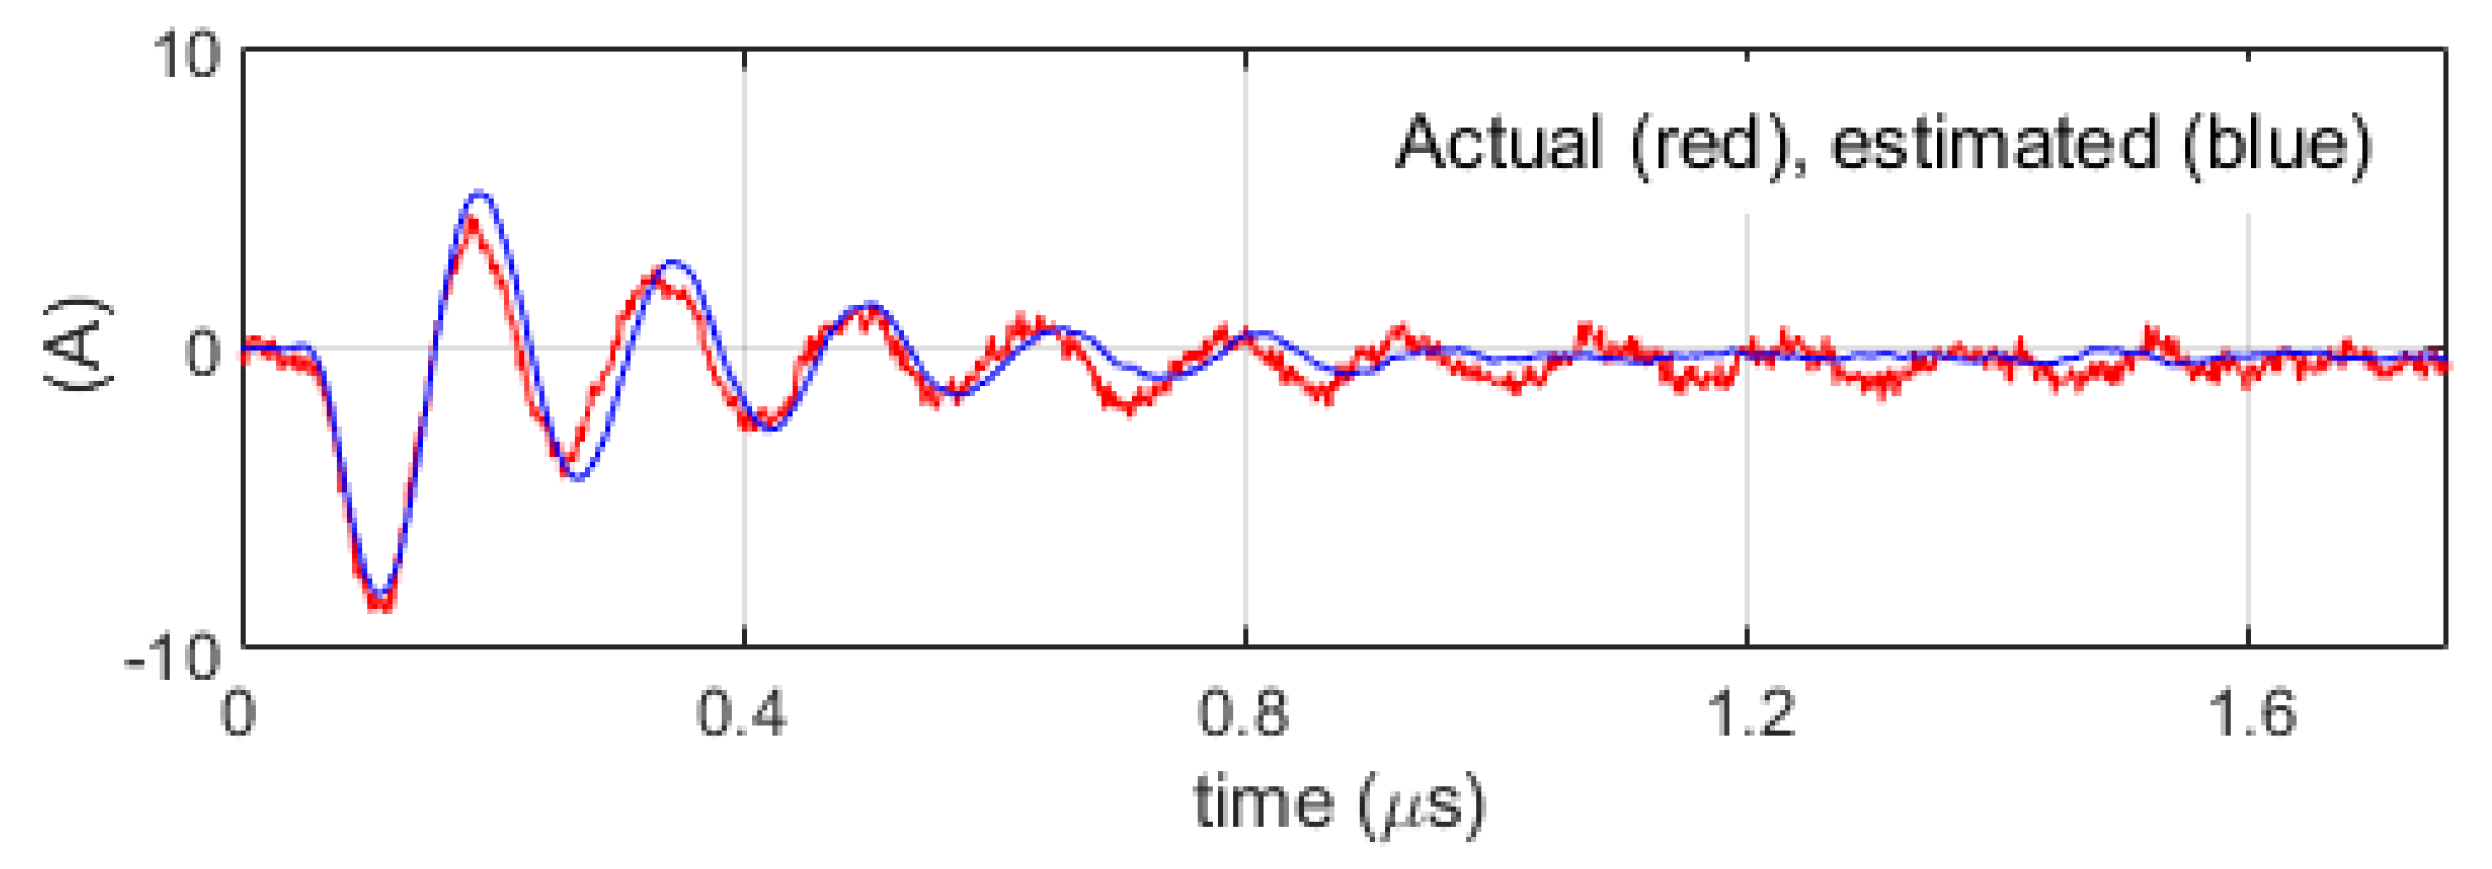
To validate the estimated model, its response was obtained using Matlab function
lsim, with the input being the measured voltage.
Figure 13 shows the actual and simulated common mode current. A good agreement is observed in general.
Table 2 shows the result obtained averaging the eight estimations,
being the damped natural frequency. A difference between the healthy and faulty cases in
Figure 12 is the reduction in the estimated damping for the case of the faulty machine (oscillations last longer). This is consistent with the behavior of the damping factor
observed in
Table 2. It is deduced from (
7) that a decrease in
can be due to a decrease in either
R and/or
, or to an increase on
L. Unfortunately, the decrease observed is in the range of
to
, which might not be enough for reliable detection. A second difference observed in
Figure 12 between the healthy and the faulty cases is an increase in the damped natural frequency
. However, this is not confirmed by the results in
Table 2, as the trend observed for the cases 360 V and 720 V are opposite.
6.2. Insulation Assessment Based on Frequency Analysis
It was already shown in
Figure 12 that a remarkable difference between the healthy and faulty cases was the persistence of the oscillations for the second case. This suggests the use of frequency-based methods. For this purpose, it is advantageous to remove the initial part of the common mode current transient due to two reasons: first, no relevant differences are observed between the healthy and faulty cases during the initial part of the transient; second, frequency-based methods are not effective in analyzing transient phenomena. A similar approach to the one described following was proposed in [
35].
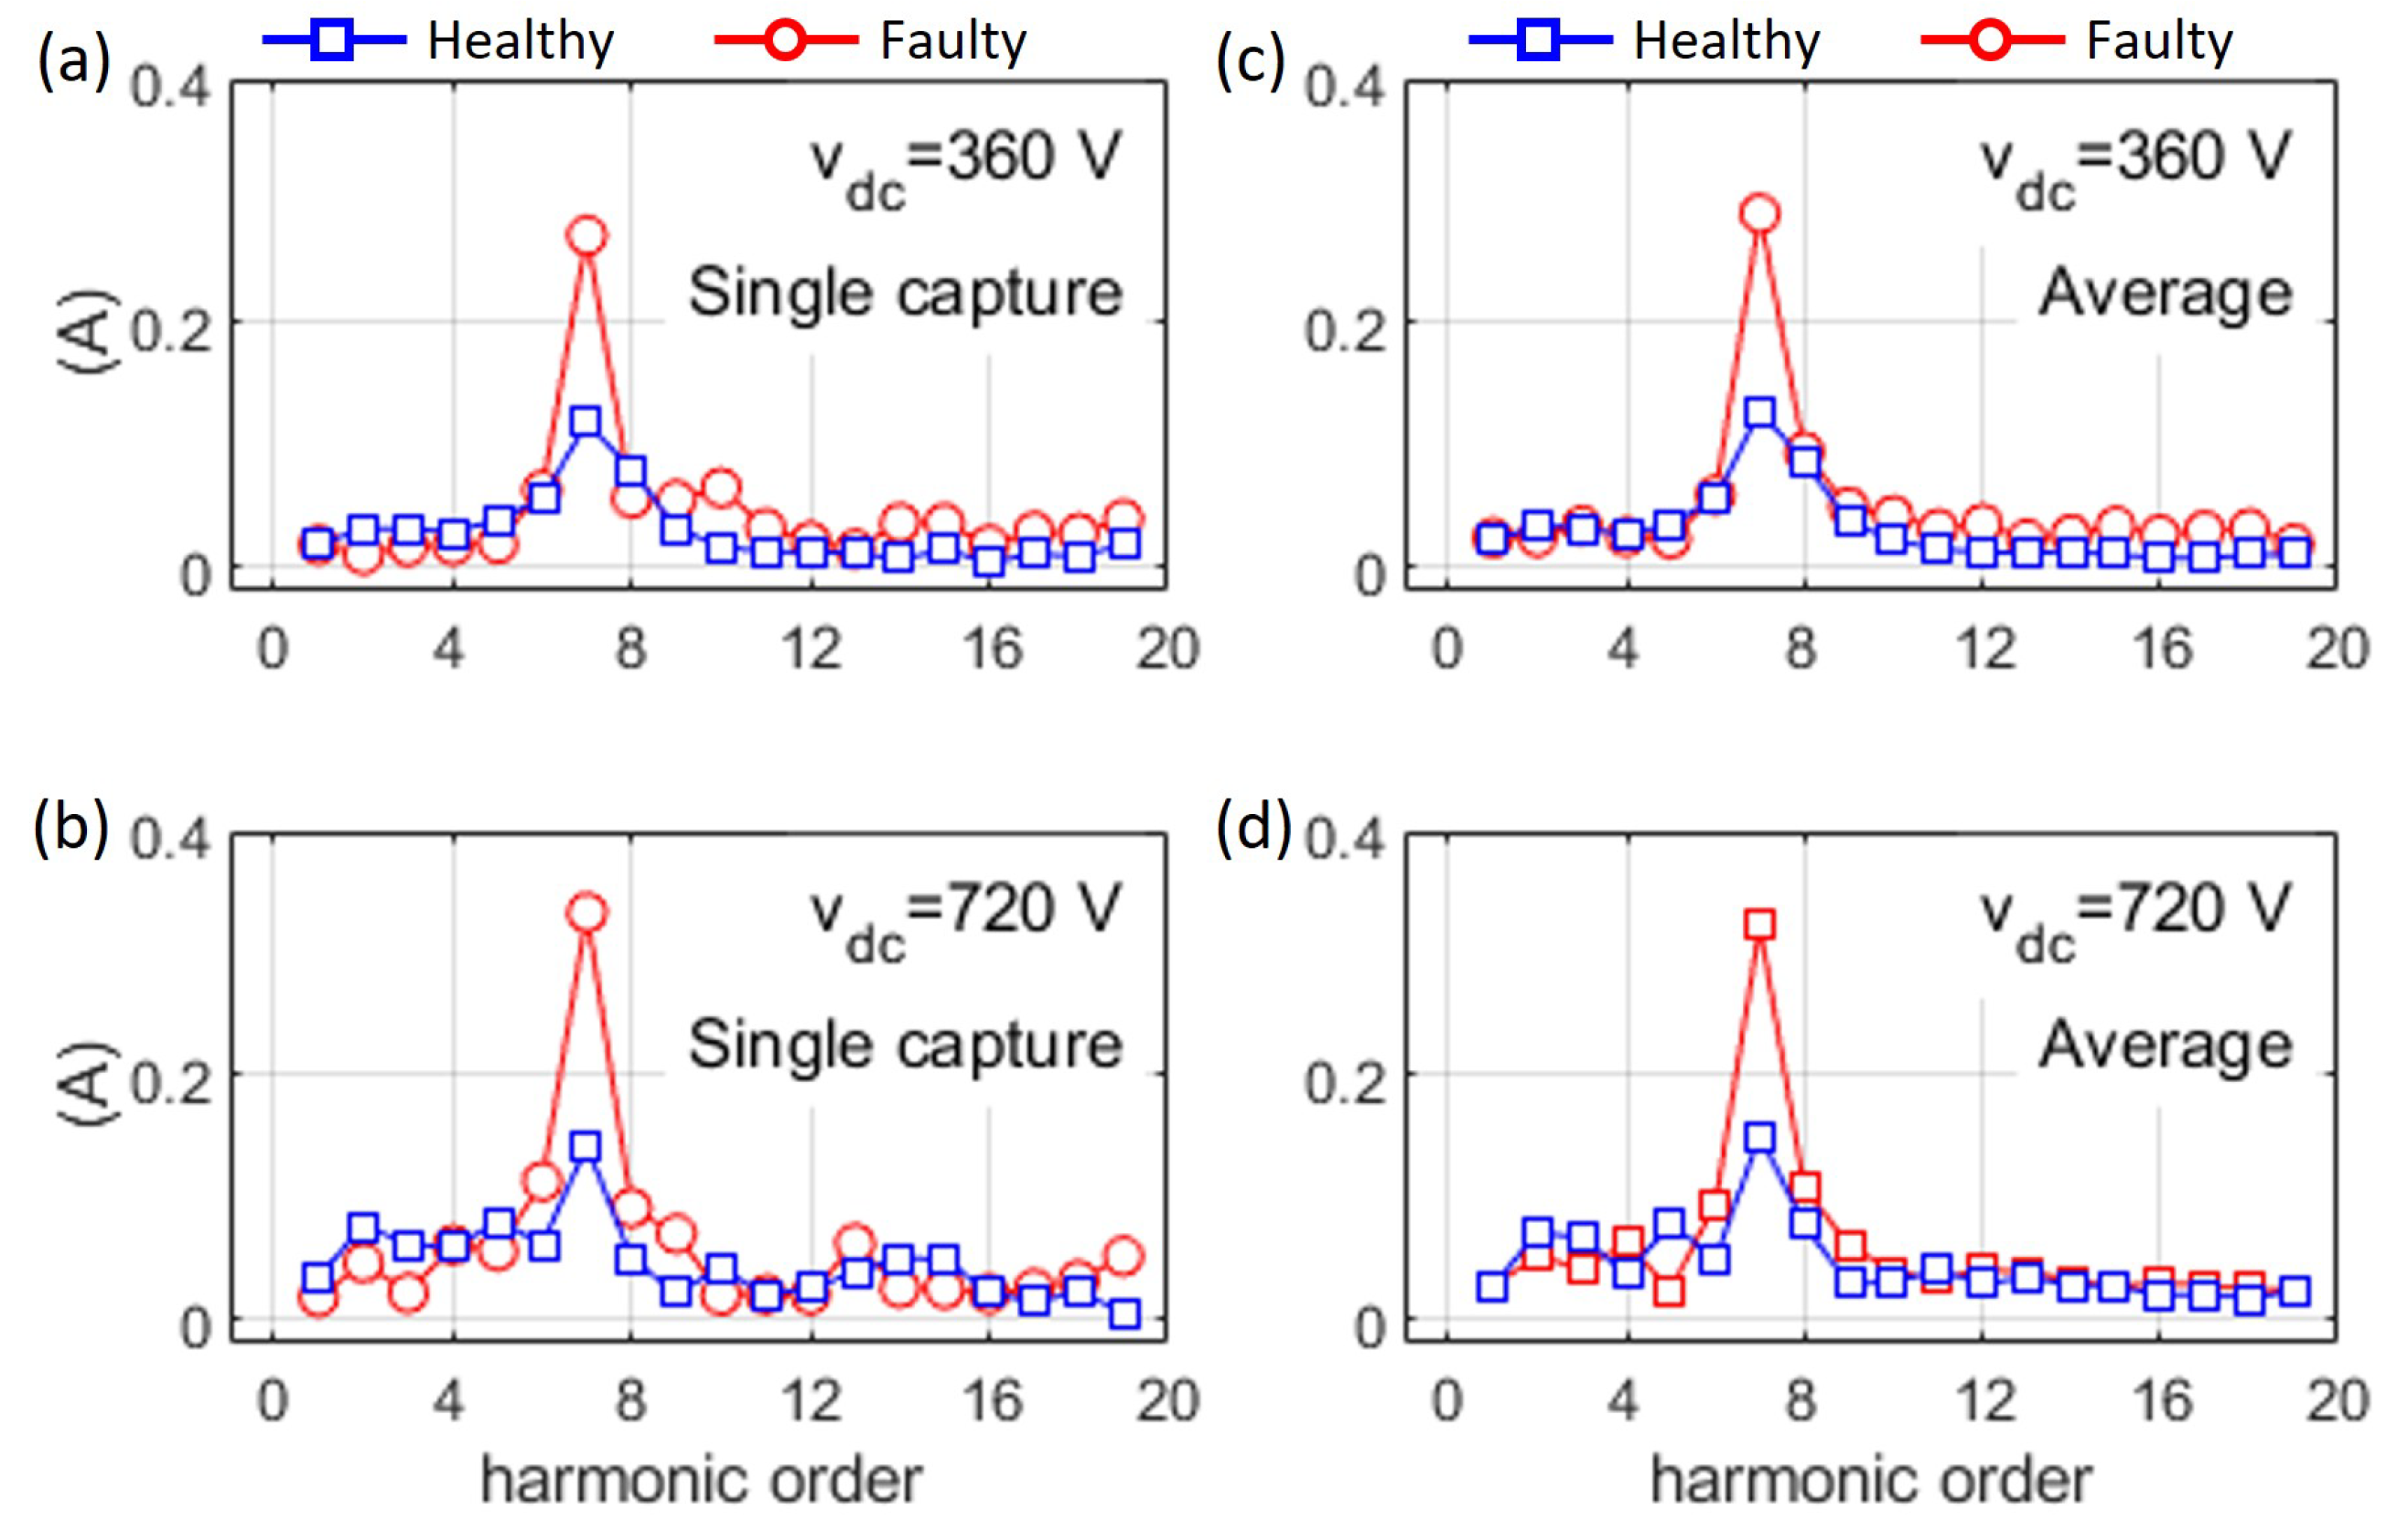
Figure 14 shows the
FFT of the common mode current after removing the initial part of the transient (see
Figure 12b. It is noted that with the time window used in
Figure 12b, the oscillation occurs at the 7th harmonic. The increase in the peak values between the faulty and healthy cases observed in
Figure 14 is seen in all cases in the range of
, and can be considered therefore significantly more reliable than the changes in
observed in
Section 6.1.
Regardless of the promising results, there are a few aspects to consider for the described signal processing. First, it is based on the assumption that the frequency of the oscillation does not change significantly between the healthy and faulty cases. Also, the length of the initial transient being removed, as well as the length of the common mode current window being processed, were adjusted manually. It would be desirable to automatize this process. For example, PLL could be used to estimate the frequency of the oscillation and adapt the FFT. However, more experimental data is needed to solve these uncertainties.
6.3. Other Forms of Signal Processing
The dependency on the oscillation frequency discussed in the previous section could be avoided if instead of focusing on a single component of the spectrum, the total energy of the common mode current is considered. The
RMS value of the common mode current can be used for this purpose.
Table 3 summarizes the results obtained using this approach. It is observed that if the initial part of the transient is not removed,
actually decreases for the faulty case with respect to the healthy case. This is due to the fact that most of the energy of the signal occurs on the initial part of the transient, which is not affected by insulation deterioration. This problem is solved by using
. However, significant differences are observed for the case of
and 720 V. Also, the sensitivity is significantly smaller compared to using the
.
It is finally noted that many other forms of signal processing, e.g., based on correlations or wavelet-based analysis [
39], could be used. Independent of the approach being used, it is concluded from the results presented in this work that a single measurement of the
HF common mode current is not enough to determine the insulation condition of a machine. Tracking the deviations with respect to when the machine was healthy is required. It is noted that the same applies to other methods for insulation degradation detection [
21,
22].
7. Conclusions
A case study of stator windings insulation condition assessment for inverter-fed machines using the HF common mode current has been presented in this paper. Implementation of the proposed method requires the use of a high bandwidth current sensor and acquisition system. The cost of these elements can be relevant for low-power, cheap induction motor drives. However, it could be fully justified in high-power (hundred kW), high efficiency, expensive induction motor drives, e.g., for railway traction. Implementation of the method does not require changes in the system layout and does not interfere with drive normal operation either. These elements could be installed permanently or only when a measurement is to be taken, both options having pros and cons.
Aging was accelerated by performing a sequence of experiments in which the machine was forced to operate at temperatures above its class. Phase-to-phase insulation failure finally occurred in the end-winding. Visual inspection did not reveal any anomaly.
Two main types of signal processing methods were used: model-based and -based, with the second showing a significantly better detection capability when applied to the windowed common mode current. As the behavior of the common mode current is specific to each machine design, the signal processing should be tuned accordingly.
The sensitivity of the HF common mode current to operating conditions and system configuration was also evaluated. Winding temperatures can have significant effects. Consequently, measurements should be carried out with the machine at a similar temperature. Realizing the measurements at the start-up of the drive seems to be the most reliable option.
From the results shown in this paper, it is concluded that a single measurement of the HF common mode current is not enough to determine the insulation condition, trends over time should be tracked. It is noted that the same concern applies to other methods as DF and PF.
A limitation of the results presented in this paper is that the analysis was limited to a specific fault. However, this fault resulted from operating the machine repeatedly under extreme working conditions; no external elements were added. Consequently, the results shown are believed to be a true subset of the phenomena that could happen in practice.
Author Contributions
Conceptualization, M.S. and F.B.; methodology, M.S., J.M.G. and F.B.; software, M.S., J.M.G. and D.F.; validation, F.B., I.D. and M.S.; formal analysis, J.M.G. and F.B.; investigation, M.S. and J.M.G.; resources, F.B. and J.M.G.; data curation, F.B. and I.D.; writing—original draft preparation, F.B. and M.S.; writing—review and editing, J.M.G., I.D. and D.F.; visualization, M.S. and F.B.; supervision, F.B.; project administration, F.B.; funding acquisition, F.B. and J.M.G. All authors have read and agreed to the published version of the manuscript.
Funding
This work was supported in part by Ingeteam Power Technology S.A. and by the Government of the Principality of Asturias under project AYUD/2021/50988.
Data Availability Statement
Data are contained within the article.
Conflicts of Interest
The authors declare no conflicts of interest.
Abbreviations
The following abbreviations are used in this manuscript:
| MCSA | Motor Current Signature Analysis |
| HF | High Frequency |
| DUT | Device Under Test |
| AUX | Auxiliary |
| FB | Full-Bridge |
| ADC | Analog-to-Digital Converters |
| DF | Dissipation Factor |
| PF | Power Factor |
References
- Surya, G.N.; Khan, Z.J.; Ballal, M.S.; Suryawanshi, H.M. A Simplified Frequency-Domain Detection of Stator Turn Fault in Squirrel-Cage Induction Motors Using an Observer Coil Technique. IEEE Trans. Ind. Electron. 2017, 64, 1495–1506. [Google Scholar] [CrossRef]
- Lee, S.B.; Younsi, K.; Kliman, G. An online technique for monitoring the insulation condition of AC machine stator windings. IEEE Trans. Energy Convers. 2005, 20, 737–745. [Google Scholar] [CrossRef]
- Zhang, P.; Younsi, K.; Neti, P. A Novel Online Stator Ground-Wall Insulation Monitoring Scheme for Inverter-Fed AC Motors. IEEE Trans. Ind. Appl. 2015, 51, 2201–2207. [Google Scholar] [CrossRef]
- Stone, G.; Campbell, S.; Tetreault, S. Inverter-fed drives: Which motor stators are at risk? IEEE Ind. Appl. Mag. 2000, 6, 17–22. [Google Scholar] [CrossRef]
- Xu, Y.; Yuan, X.; Ye, F.; Wang, Z.; Zhang, Y.; Diab, M.; Zhou, W. Impact of High Switching Speed and High Switching Frequency of Wide-Bandgap Motor Drives on Electric Machines. IEEE Access 2021, 9, 82866–82880. [Google Scholar] [CrossRef]
- Zoeller, C.; Vogelsberger, M.A.; Wolbank, T.M.; Ertl, H. Impact of SiC semiconductors switching transition speed on insulation health state monitoring of traction machines. IET Power Electron. 2016, 9, 2769–2775. [Google Scholar] [CrossRef]
- Zheng, D.; Zhang, P. An Online Groundwall and Phase-to-Phase Stator Insulation Monitoring Method for Inverter-Fed Machine. IEEE Trans. Ind. Electron. 2021, 68, 5303–5313. [Google Scholar] [CrossRef]
- Zheng, D.; Lu, G.; Zhang, P. An Improved Online Stator Insulation Monitoring Method Based on Common-Mode Impedance Spectrum Considering the Effect of Aging Position. IEEE Trans. Ind. Appl. 2022, 58, 3558–3566. [Google Scholar] [CrossRef]
- Alvarez-Gonzalez, F.; Hewitt, D.; Griffo, A.; Wang, J.; Diab, M.; Yuan, X. Design of Experiments for Stator Windings Insulation Degradation under High dv/dt and High Switching Frequency. In Proceedings of the IEEE Energy Conversion Congress and Exposition (ECCE), Detroit, MI, USA, 11–15 October 2020; pp. 789–795. [Google Scholar] [CrossRef]
- Lee, S.B.; Yang, J.; Younsi, K.; Bharadwaj, R. An online groundwall and phase-to-phase insulation quality assessment technique for AC-machine stator windings. IEEE Trans. Ind. Appl. 2006, 42, 946–957. [Google Scholar] [CrossRef]
- Cruz, J.d.S.; Fruett, F.; Lopes, R.d.R.; Takaki, F.L.; Tambascia, C.d.A.; Lima, E.R.d.; Giesbrecht, M. Partial Discharges Monitoring for Electric Machines Diagnosis: A Review. Energies 2022, 15, 7966. [Google Scholar] [CrossRef]
- Jung, J.H.; Lee, J.J.; Kwon, B.H. Online Diagnosis of Induction Motors Using MCSA. IEEE Trans. Ind. Electron. 2006, 53, 1842–1852. [Google Scholar] [CrossRef]
- Afrandideh, S.; Haghjoo, F.; Cruz, S.; Eshaghi Milasi, M. Detection of Turn-to-Turn Faults in the Stator and Rotor of Synchronous Machines During Startup. IEEE Trans. Ind. Electron. 2021, 68, 7485–7495. [Google Scholar] [CrossRef]
- Gandhi, A.; Corrigan, T.; Parsa, L. Recent Advances in Modeling and Online Detection of Stator Interturn Faults in Electrical Motors. IEEE Trans. Ind. Electron. 2011, 58, 1564–1575. [Google Scholar] [CrossRef]
- Briz, F.; Degner, M.W.; Garcia, P.; Diez, A.B. High-Frequency Carrier-Signal Voltage Selection for Stator Winding Fault Diagnosis in Inverter-Fed AC Machines. IEEE Trans. Ind. Electron. 2008, 55, 4181–4190. [Google Scholar] [CrossRef]
- Pietrzak, P.; Wolkiewicz, M. Comparison of Selected Methods for the Stator Winding Condition Monitoring of a PMSM Using the Stator Phase Currents. Energies 2021, 14, 1630. [Google Scholar] [CrossRef]
- Wolkiewicz, M.; Tarchała, G.; Orłowska, T.; Kowalski, C.T. Online Stator Interturn Short Circuits Monitoring in the DFOC Induction-Motor Drive. IEEE Trans. Ind. Electron. 2016, 63, 2517–2528. [Google Scholar] [CrossRef]
- Bazan, G.H.; Scalassara, P.R.; Endo, W.; Goedtel, A.; Palácios, R.H.C.; Godoy, W.F. Stator Short-Circuit Diagnosis in Induction Motors Using Mutual Information and Intelligent Systems. IEEE Trans. Ind. Electron. 2019, 66, 3237–3246. [Google Scholar] [CrossRef]
- Mazzoletti, M.A.; Bossio, G.R.; De Angelo, C.H.; Espinoza-Trejo, D.R. A Model-Based Strategy for Interturn Short-Circuit Fault Diagnosis in PMSM. IEEE Trans. Ind. Electron. 2017, 64, 7218–7228. [Google Scholar] [CrossRef]
- Neti, P.; Younsi, K.; Shah, M.R. A novel high sensitivity differential current transformer for online health monitoring of industrial motor ground-wall insulation. In Proceedings of the 2013 IEEE Energy Conversion Congress and Exposition, Denver, CO, USA, 15–19 September 2013; pp. 2493–2499. [Google Scholar] [CrossRef]
- IEC 60034-27-3:2015; Rotating Electrical Machines—Part 27-3: Dielectric Dissipation Factor Measurements on Stator Winding Insulation of Rotating Electrical Machines. IEC Standards: Geneve, Switzerland, 2015; pp. 1–34.
- IEEE Std 286-2000; IEEE Recommended Practice for Measurement of Power Factor Tip-Up of Electric Machinery Stator Coil Insulation. IEEE Standards Association: Piscataway, NJ, USA, 2000. [CrossRef]
- Pascoli, G.; Hribernik, W.; Ujvari, G. A practical investigation on the correlation between aging and the dissipation factor value of mica insulated generator windings. In Proceedings of the International Conference on Condition Monitoring and Diagnosis, Beijing, China, 21–24 April 2008; pp. 268–271. [Google Scholar] [CrossRef]
- Yang, J.; Lee, S.B.; Yoo, J.; Lee, S.; Oh, Y.; Choi, C. A Stator Winding Insulation Condition Monitoring Technique for Inverter-Fed Machines. IEEE Trans. Power Electron. 2007, 22, 2026–2033. [Google Scholar] [CrossRef]
- Neti, P.; Grubic, S. Online Broadband Insulation Spectroscopy of Induction Machines Using Signal Injection. IEEE Trans. Ind. Appl. 2017, 53, 1054–1062. [Google Scholar] [CrossRef]
- Niu, F.; Wang, Y.; Huang, S.; Wu, L.; Huang, X.; Fang, Y.; Yang, T. An Online Groundwall Insulation Monitoring Method Based on Transient Characteristics of Leakage Current for Inverter-Fed Motors. IEEE Trans. Power Electron. 2022, 37, 9745–9753. [Google Scholar] [CrossRef]
- Jensen, W.R.; Strangas, E.G.; Foster, S.N. A Method for Online Stator Insulation Prognosis for Inverter-Driven Machines. IEEE Trans. Ind. Appl. 2018, 54, 5897–5906. [Google Scholar] [CrossRef]
- Cao, S.; Niu, F.; Huang, X.; Huang, S.; Wang, Y.; Li, K.; Fang, Y. Time-Frequency Characteristics Research of Common Mode Current in PWM Motor System. IEEE Trans. Power Electron. 2020, 35, 1450–1458. [Google Scholar] [CrossRef]
- Tsyokhla, I.; Griffo, A.; Wang, J. Online Condition Monitoring for Diagnosis and Prognosis of Insulation Degradation of Inverter-Fed Machines. IEEE Trans. Ind. Electron. 2019, 66, 8126–8135. [Google Scholar] [CrossRef]
- Nussbaumer, P.; Vogelsberger, M.A.; Wolbank, T.M. Induction Machine Insulation Health State Monitoring Based on Online Switching Transient Exploitation. IEEE Trans. Ind. Electron. 2015, 62, 1835–1845. [Google Scholar] [CrossRef]
- Ryu, Y.; Park, B.R.; Han, K.J. Estimation of High-Frequency Parameters of AC Machine From Transmission Line Model. IEEE Trans. Magn. 2015, 51, 8101404. [Google Scholar] [CrossRef]
- Zheng, D.; Zhang, P. A Novel Method of Monitoring and Locating Stator Winding Insulation Ageing for Inverter-fed Machine based on Switching Harmonics. In Proceedings of the IEEE Energy Conversion Congress and Exposition (ECCE), Detroit, MI, USA, 11–15 October 2020; pp. 4474–4479. [Google Scholar] [CrossRef]
- Bolgova, V.; Lefebvre, S.; Hlioui, S.; Boucenna, N.; Costa, F.; Leonov, A. Development of testing methods for winding turn-to-turn insulation of low voltage motors fed by PWM converters. In Proceedings of the 19th European Conference on Power Electronics and Applications (EPE’17 ECCE Europe), Warsaw, Poland, 11–14 September 2017; pp. 1–10. [Google Scholar] [CrossRef]
- IEEE Std 117-2015; (Revision of IEEE Std 117-1974). IEEE Standard Test Procedure for Thermal Evaluation of Systems of Insulating Materials for Random-Wound AC Electric Machinery. IEEE Standards Association: Piscataway, NJ, USA, 2016; pp. 1–34. [CrossRef]
- Zanuso, G.; Peretti, L. Evaluation of High-Frequency Current Ringing Measurements for Insulation Health Monitoring in Electrical Machines. IEEE Trans. Energy Convers. 2022, 37, 2637–2644. [Google Scholar] [CrossRef]
- Poncelas, O.; Rosero, J.A.; Cusido, J.; Ortega, J.A.; Romeral, L. Motor Fault Detection Using a Rogowski Sensor Without an Integrator. IEEE Trans. Ind. Electron. 2009, 56, 4062–4070. [Google Scholar] [CrossRef]
- Mingotti, A.; Costa, F.; Peretto, L.; Tinarelli, R. Accuracy Type Test for Rogowski Coils Subjected to Distorted Signals, Temperature, Humidity, and Position Variations. Sensors 2022, 22, 1397. [Google Scholar] [CrossRef]
- Tovar-Barranco, A.; López-de Heredia, A.; Villar, I.; Briz, F. Modeling of End-Space Convection Heat-Transfer for Internal and External Rotor PMSMs With Fractional-Slot Concentrated Windings. IEEE Trans. Ind. Electron. 2021, 68, 1928–1937. [Google Scholar] [CrossRef]
- Briz, F.; Degner, M.W.; Garcia, P.; Bragado, D. Broken Rotor Bar Detection in Line-Fed IM Using Complex Wavelet Analysis of Startup Transients. IEEE Trans. Ind. Appl. 2008, 44, 760–768. [Google Scholar] [CrossRef]
Figure 1.
Equivalent circuits: (a) RC used mainly for ground-wall insulation analysis; (b) RLC used for HF response analysis. Components in blue can exist or not, depending on the approach.
Figure 1.
Equivalent circuits: (a) RC used mainly for ground-wall insulation analysis; (b) RLC used for HF response analysis. Components in blue can exist or not, depending on the approach.
Figure 2.
Schematic representation of the experimental test bench using two back-to-back inverters.
Figure 2.
Schematic representation of the experimental test bench using two back-to-back inverters.
Figure 3.
Test bench pictures: (a) back-to-back inverters and, (b) DUT and AUX motors. Rated values: V; A; kW; Hz; rpm; 4 poles .
Figure 3.
Test bench pictures: (a) back-to-back inverters and, (b) DUT and AUX motors. Rated values: V; A; kW; Hz; rpm; 4 poles .
Figure 4.
Full-bridge and current sensors used to measure the common mode current.
Figure 4.
Full-bridge and current sensors used to measure the common mode current.
Figure 5.
(a) Common mode voltage; (b) common mode current. FB switches at 2 kHz, V; (c,d) zoomed signals for the case of V (red) and V (blue), respectively .
Figure 5.
(a) Common mode voltage; (b) common mode current. FB switches at 2 kHz, V; (c,d) zoomed signals for the case of V (red) and V (blue), respectively .
Figure 6.
Temperatures for experiments (
a) #27 and (
b) #20 (see
Figure 7).
Figure 6.
Temperatures for experiments (
a) #27 and (
b) #20 (see
Figure 7).
Figure 7.
Summary of experiments: (a) length in minutes; (b) maximum temperature. Experiments marked with a solid dot indicate that a decrease in phase-to-phase insulation had been detected with the insulation tester.
Figure 7.
Summary of experiments: (a) length in minutes; (b) maximum temperature. Experiments marked with a solid dot indicate that a decrease in phase-to-phase insulation had been detected with the insulation tester.
Figure 8.
(a) Yokogawa Hall-effect and PEM Rogowski sensors. Both provide 50 MHz bandwidth and a maximum current of 30 A; (b) end-frame with the cables connected to two temperature sensors. Temperature sensors are attached to the end coils.
Figure 8.
(a) Yokogawa Hall-effect and PEM Rogowski sensors. Both provide 50 MHz bandwidth and a maximum current of 30 A; (b) end-frame with the cables connected to two temperature sensors. Temperature sensors are attached to the end coils.
Figure 9.
Measured common mode current: (a) Hall sensor vs. Rogowski coil at ambient temperature; (b) effect of a voltage sensor attached to the stator; (c) effect due to temperature; (d) effect due to ground cable length; (e) effect due to ground cable resistance. . Hall sensor was used for cases (b–e). The trace in red in (a) is shown in all the subplots for reference.
Figure 10.
Measured resistances and estimated location of the fault between phases U and W in p.u. of winding length l.
Figure 10.
Measured resistances and estimated location of the fault between phases U and W in p.u. of winding length l.
Figure 11.
Captures of the thermal imaging camera after test #28 when the stator is fed from a dc voltage source between terminals indicated in the subcaptions. The stator has 24 slots, single-layer winding.
Figure 11.
Captures of the thermal imaging camera after test #28 when the stator is fed from a dc voltage source between terminals indicated in the subcaptions. The stator has 24 slots, single-layer winding.
Figure 12.
(a) Transient common mode current for the healthy and faulty cases. (b) Windowed common mode current ; obtained by applying a window W to . for 0.75 s < t < 1.7 s; otherwise.
Figure 12.
(a) Transient common mode current for the healthy and faulty cases. (b) Windowed common mode current ; obtained by applying a window W to . for 0.75 s < t < 1.7 s; otherwise.
Figure 13.
Actual and estimated common mode current using the parametric model in (
6).
Figure 13.
Actual and estimated common mode current using the parametric model in (
6).
Figure 14.
[see
Figure 12b]. Left (
a,
b): single capture, right (
c,
d): average of eight successive captures. Top (
a,
c):
, bottom (
b,
d):
. Blue/Red: healthy/faulty machine.
Figure 14.
[see
Figure 12b]. Left (
a,
b): single capture, right (
c,
d): average of eight successive captures. Top (
a,
c):
, bottom (
b,
d):
. Blue/Red: healthy/faulty machine.
Table 1.
DUT stator resistance and capacitance.
Table 1.
DUT stator resistance and capacitance.
| | Healthy | Faulty | | Healthy | Faulty |
|---|
| 9.67 | 9.8 | | nF | nF |
| 9.55 | 9.75 | | nF | nF |
| 9.7 | 9.9 | | nF | nF |
Table 2.
Model identification: Experimental results.
Table 2.
Model identification: Experimental results.
| DUT | Voltage (V) | (Hz) | | (Hz) | k |
|---|
| Healthy | 360 | 6,749,592 | 0.1167 | 6,820,495 | 380 |
| Faulty | 360 | 70,073,690 | 0.1042 | 7,089,280 | 340 |
| Healthy | 720 | 7,216,209 | 0.1103 | 7,261,304 | 417 |
| Faulty | 720 | 6,888,639 | 0.1049 | 6,941,588 | 359 |
Table 3.
.
| DUT | Voltage (V) | (A) | (A) | Voltage (V) | (A) | (A) |
|---|
| Healthy | 360 | 1.807 | 0.436 | 720 | 2.67 | 0.792 |
| Faulty | 360 | 1.737 | 0.644 | 720 | 2.4722 | 0.897 |
| 360 | | | 720 | | |
| Disclaimer/Publisher’s Note: The statements, opinions and data contained in all publications are solely those of the individual author(s) and contributor(s) and not of MDPI and/or the editor(s). MDPI and/or the editor(s) disclaim responsibility for any injury to people or property resulting from any ideas, methods, instructions or products referred to in the content. |
© 2024 by the authors. Licensee MDPI, Basel, Switzerland. This article is an open access article distributed under the terms and conditions of the Creative Commons Attribution (CC BY) license (https://creativecommons.org/licenses/by/4.0/).


