Abstract
The rising share of renewable energies leads to increased fluctuations in electrical power supply. One possibility to shift the surplus energy based on demand is a Carnot battery (CB). A CB uses a heat pump or resistance heater to convert and store thermal energy into electrical energy. Later, the stored thermal energy is converted back into electrical energy using a heat engine. This study investigates a CB with a two-zone tank for thermal energy storage. A transcritical process with is applied for charging, while discharging employs a transcritical process with and six refrigerants operating in a subcritical process. The transcritical process with and the four most promising subcritical processes are compared regarding round trip efficiency and levelized cost of electricity (LCOE) depending on the pinch points 5 K and 1 K in the heat exchangers. Additionally, the technology readiness level (TRL) is determined for these configurations. The results show round-trip efficiencies between 11.3% and 33.5% and LCOEs ranging from EUR 0.95 to EUR 2.09 for the considered concepts with TRLs of up to six.
1. Introduction
Renewable energies lead to increased fluctuations in the electricity supply as their electricity generation depends on the prevailing weather conditions. As depicted in Figure 1, the expansion of renewable energies will intensify this trend in the future [1]. For example, the surplus energy supplied by photovoltaic plants during midday has to be shifted to the night hours when the demand exceeds the supply of renewable energies. One potential method for storing electrical energy on a large scale for several hours is the Carnot battery (CB). A CB converts electrical energy into thermal energy using a heat pump (HP) or an electrical resistance heater, where it is then stored in thermal energy storage (TES). For this purpose, sensible, latent, and thermo-chemical energy storage options can be applied. After storage, the thermal energy is converted back into electrical energy through a heat engine (HE). For the charging process in the HP and discharging process in the HE, different configurations involving supercritical, transcritical, and subcritical processes have been investigated. Comprehensive overviews of CBs can be found in [2,3].
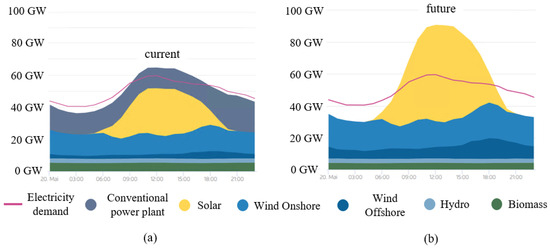
Figure 1.
Current electricity generation in Germany and future generation with an 80% renewable share [1].
Some research literature regarding transcritical processes with is presented below. Hot water tanks are often used for high-temperature storage [4,5,6,7], allowing a temperature glide between the and the storage medium. For low-temperature storage, either an ice storage tank [4,6] or the environment [7,8] is employed.
Mercangöz et al. [9] investigated a system with the working fluid that undergoes a transcritical process for both charging and discharging processes. The storage unit for the thermal energy at the higher temperature level consisted of water-based tanks achieving a temperature of up to 123 . For the cold side, they used an ice storage tank with a temperature of −5 . To remove the irreversibilities from the process, the ice storage tank was equipped with an additional circuit to be used during the charging process to dissipate the losses incurred to the environment. A 1 MW pilot plant (, and ) and a 50 MW commercial configuration (, and ) were simulated. The resulting efficiencies were 51% and 65%, respectively.
Morandin et al. [4,10] analyzed a base case of a transcritical charging/discharging process that comprised several water tanks on different temperature levels on the hot side and a two-tank ice storage system for the low-temperature side. To achieve a freezing point of −21.2 , the authors used a salt mixture as the storage medium in the ice storage tank. The irreversibilities to the environment were removed with an air fan during the charging and discharging processes. An optimization of the base case including eight water tanks resulted in a round-trip efficiency of 60%, assuming a maximum discharge temperature of 177 . The addition of an internal heat exchanger in the charging and discharging processes increased the round-trip efficiency to 62%. While this configuration assumes an expansion of the working fluid in the two-phase region, which is associated with technological problems, a throttle could replace the expander; however, this would lower the efficiency.
Kim et al. [5] investigated CBs based on the studies of Morandin et al. [4] and Mercangöz et al. [9]. Their concept involved an isothermal compression/expansion using a liquid expander. Water injection was used to cool/heat the working fluid in the liquid expander during the charging/discharging process, respectively. A maximum temperature in the charging process of 150 accompanied by a maximum pressure of 160 bar, assuming high isentropic efficiencies (, and ), resulted in an overall round-trip efficiency of 74.5%.
The study by Steinmann et al. [6] applied a transcritical process with for charging and discharging. A pressurized water tank with a temperature of up to 160 represented the hot-side energy storage unit. An ice storage having a temperature of 0 served as a low-temperature storage unit. The compressor was assumed to operate isentropically, and the isentropic efficiencies of the turbine varied between 80% and 90%. The obtained round-trip efficiency was approximately 45%.
Baik et al. [8] investigated transcritical CBs with two tanks on the hot side and one tank combined with an ambient temperature reservoir of 20 on the cold side. Water was used as a storage medium. In contrast to the concepts of [4,6,10], the expander used in the charging process was substituted with a throttle. The maximum temperature of the storage was 120 . The isentropic efficiencies of the compressor, turbine, and pump were 85%. Additionally, the round-trip efficiency was investigated based on the variation of the lower storage temperature of the hot side storage unit. This temperature was varied between 25 and 70 , leading to round-trip efficiencies of 14.7% to 29.1%. The highest round-trip efficiency was observed for a lower storage temperature of 40 .
Koen et al. [7] analyzed the working fluids , R1234yf, R1234ze(e), R1234ze(z), R152A, R161, R13I1, and ammonia for the application in a transcritical process. Additionally, they considered water, Therminol D12, and Therminol 66 as storage media. For the charging and discharging processes a compressor and an expander were used. The hot side employed a two-tank system, whereas the cold side did not include a storage unit and instead used the environment for storage. Under optimal operation conditions, round-trip efficiencies between 50.5% and 57.6% could be achieved if polytropic component efficiencies of 90% were assumed. The working fluid R13I1 showed the best result at a maximum storage temperature of 206 .
Bodner et al. [11] investigated a transcritical process with as the working medium in combination with a subcritical process with R1234yf as the working medium. A two-zone storage system was used. This configuration was evaluated in terms of round-trip efficiency (36.8%), LCOE (EUR ), and technology maturity. The authors reported a pinch temperature in the heat exchangers of ≥0.1 K. However, the minimum pinch point (PP) used in the heat exchangers is unknown. The PP affects both the round-trip efficiency and the LCOE and should be set within a certain range.
Fan et al. [12] studied a subcritical process employing R245fa as the working medium. In addition to the basic configuration without internal heat exchangers, three other configurations were analyzed. In the second configuration, internal heat exchangers were integrated into the HP and HE processes. The third and fourth configurations contained only one additional internal heat exchanger, either in the HP or HE. The temperature of the water-based pressurized TES was varied between 90 and 130 . A PP of 8 K in each heat exchanger and isentropic efficiencies of 80% were assumed. To compare the configurations, they considered thermodynamic and economic aspects, achieving maximum round-trip efficiency of 25% and LCOE of EUR 0.29–0.42 . Of note, this study assumed a waste heat utilization of 80 .
The presented literature evaluated the concepts based on their round-trip efficiencies. While a few studies also investigated economic aspects in more detail [9,11,12,13], the others did not examine costs closely [6,7], or costs were not part of their research [4,5,8,10]. Only the study of Bodner et al. [11] considered the technology readiness level (TRL) as a measure to evaluate the corresponding systems. To take economic and practical questions into account, this study determines the LCOE and the TRL in addition to the round-trip efficiency for each promising configuration. Therefore, the research gap of a comprehensive and multicriteria analysis of transcritical CBs should be addressed. Based on the results, the following questions are posed:
- Which types of CB can be realized in the near future?
- What efficiencies are achieved, and what are the resulting LCOEs of the investigated CBs?
- How does reducing the PP of the heat exchangers affect the round-trip efficiency, purchased equipment cost, and LCOE?
The concepts presented in this study use a transcritical process in the HP. In addition to a transcritical process with , six organic working fluids operating in a subcritical process are examined for use in the HE. Some are already being used in practice, e.g., in geothermal plants [14]. The four most promising workings fluids are compared to the transcritical process with in more detail.
The use of in conjunction with a suitable compressor that operates with an outlet temperature of more than 100 facilitates the use of a HP on a larger scale [15,16]. The current implementation of HPs beyond the kW range is based on positive displacement machines with a high compressor outlet temperature [17].
A two-zone storage tank, consisting of two chambers separated by a partition wall, is employed as the TES. The chambers, connected via pipes, contain water at different temperatures. The advantage of this kind of storage is that the lower chamber has an elevated pressure because of the weight of the water in the upper chamber. Thus, with an unpressurized tank temperature, >100 can be obtained. Therefore, this tank type is less expensive and safer than pressure-loaded tanks [18].
Combined with the described TES, in a transcritical process is a suitable working fluid. approximates the course of the water’s temperature glide, thereby enabling potentially high round-trip efficiencies. Additionally, a compressor used for a transcritical process with is already available [15], and thus, a high TRL can be expected for the charging process.
2. Design and Simulation of the Carnot Battery
The CB comprises a transcritical charging process along with a sensible TES. The discharge process can occur either in a transcritical or subcritical mode. The charging and discharging subprocess schemes are depicted in Figure 2a,b, respectively. The details of these subprocesses are explained below.
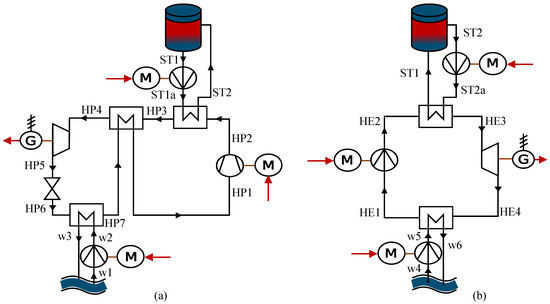
Figure 2.
Flow chart of the (a) charging and (b) discharging processes. The red arrows indicate the electrical power supplied or released.
2.1. Charging Process
In the charging process, excess electrical energy is used to compress the working fluid to achieve supercritical pressure (HP1–HP2). The heat is then transferred to the TES (HP2–HP3). The working fluid is further cooled in the recuperator (HP3–HP4) until the temperature falls below the critical temperature. The working fluid is initially expanded in a liquid expander to a state close to saturation (HP4–HP5) before being further expanded through a throttle to reach the evaporating pressure (HP5-HP6). Within the heat exchanger (HP6–HP7), the working fluid evaporates from heat supplied by river water and undergoes additional heating within the regenerative heat exchanger (HP7–HP1). This HP process is depicted in Figure 3a.
2.2. Discharging Process
In the discharging process, the liquid working fluid is compressed in the pump to a high-pressure level (HE1–HE2). The heat is subsequently conveyed to the fluid within the heat exchanger (HE2–HE3) using the two-zone energy storage. In a transcritical process, heating of the fluid occurs without a phase change, whereas in a subcritical process, the fluid undergoes a phase change accompanied by evaporation. The working fluid is then expanded in the turbine (HE3–HE4), driving the generator. Finally, to complete the process, the working fluid is condensed in the heat exchanger (HE4–HE1), releasing heat to river water and returning to its initial state (HE1). The transcritical discharging process is depicted in Figure 3b, and the subcritical discharging process is shown in Figure 3c,d for the working fluids R1234yf and R134a, respectively.
The discharging process involves comparing a HE operating in transcritical mode using the same working fluid () as in the charging process with heat engines operating in subcritical mode, employing the following working fluids:
- R600a (Isobutane), R134a, and R245fa, currently employed within geothermal power plants [14].
- R1233zd(E), which serves as a working fluid in laboratory configurations for a CB [19,20].
- R1234yf, which is under discussion as a potential substitute for R134a [21].
- R290 (Propane), which finds application in refrigeration or HP systems [22].
2.3. Modeling and Simulation
The CB configurations were modeled with the software EBSILON®Professional [23] and subjected to a steady-state calculation. This software enables the modeling and simulation of thermodynamic cycle processes on a graphical user interface [23]. To model CB configurations, turbines, heat exchangers, pumps and other components are positioned on the graphical user interface and interconnected with lines, representing electrical, mechanical, or fluidic transmission. A start value, e.g., to specifiy the mass flow in the subprocesses, and identification of the fluid type are required at a specific point along the physical line. Additional measuring points along these designated lines enable the determination of further operating points within the system. The implementation of different working fluids is supported by substance databases such as Refprop [24].
During the charging process, 18 MW of electrical power is used to operate the compressor and two pumps. A controller regulates the mass flow in the HP, which adjusts the mass flow until an input power of 18 MW is reached. The pumps transport the river water and hot water from the two-zone storage tank. The highest pressure and highest temperature in HP2 are limited to 140 bar and 150 , respectively, [15]. The maximum storage temperature is 115 , which is determined by the existing implementation of the two-zone storage system [18]. This study does not take into account the heat losses in the TES. To vaporize the in the heat exchanger of HP6–HP7, water at 10 and 1 bar is taken from the environment (state w1) and then reduced by 5 K (state w3). The temperature in state HP6 is set by defining a PP within the heat exchanger. Consequently, this leads to the evaporation pressure and subsequently influences the pressure in HP6 and HP7. Identical PPs are provided for all heat exchangers. Pressure losses are also neglected in the study. The lower storage temperature is set so that the in the HP4 remains in a liquid state. This precaution prevents gas from entering the liquid expander, and thus, possible damage to the machine.
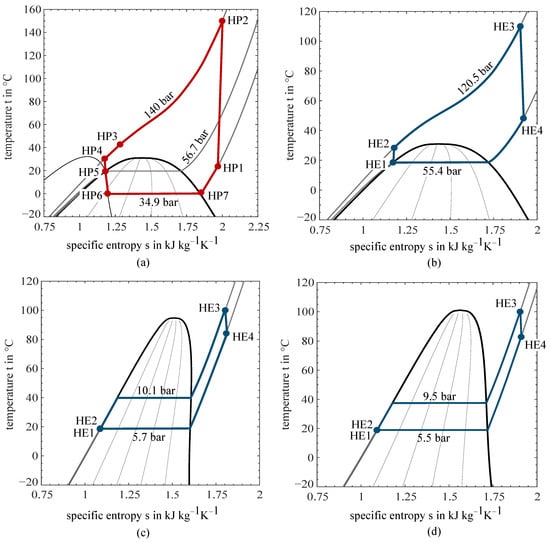
Figure 3.
Temperature–entropy diagrams of (a) charging with , (b) discharging with , (c) discharging with R1234yf, and (d) discharging with R134a [24].
The condensation pressure in the HE results from the specification of the ambient temperature, its warming by 5 K, and the specification of the PP in the heat exchanger (HE4–HE1). The variables evaporation pressure, mass flow, and inlet temperature to the turbine are determined to maintain the PP in the evaporator (HE2–HE3).
Table A1 presents the isentropic, mechanical, and electrical efficiencies used in the model for all configurations.
The round-trip efficiency is calculated as follows:
Additionally, the charging and discharging processes can be considered separately. To evaluate the HP, the is determined:
The HE efficiency is determined with the following formula:
2.4. Simulations Results
Figure 4 presents an overview of the simulation results for the different configurations with two different PPs. The best round-trip efficiency at a PP of 5 K is achieved by the transcritical discharge process (Configuration 1), while the other configurations with the operational organic Rankine cycle (ORC) fluids have efficiencies between 9.6% and 13.7%. Overall, a reduction in PP generally leads to an increase in the round-trip efficiency, likely due to the increase in evaporation pressure and decrease in condensation pressure during discharge. In Configuration 1 (–), the round-trip efficiency increases from 24.15% to 33.48%. Comparatively, Configurations 2 to 6 now exhibit notably higher increases in round-trip efficiencies compared to the 5 K PP.
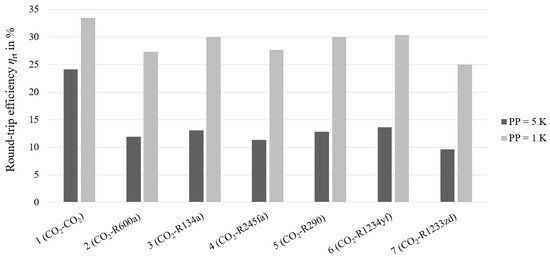
Figure 4.
Round-trip efficiencies of all configurations for PPs of 5 K and 1 K.
To determine the technical potential of each configuration, a PP of 1 K was additionally examined. This is particularly relevant in the low-temperature range, where any temperature reduction that can be avoided is important. The reduced PP facilitates an increase in the lower storage temperature , benefiting the HE. However, this lower storage temperature has an upper limit, and exceeding this limit leads to a supercritical aggregate state upstream of the liquid expander in the HP. Additional information about the simulation results can be found in Table A2 and Table A3. The desired numerical accuracy of the calculation can be set in the simulation, and the default value is . At , the round-trip efficiency changes in the sixth decimal place and can therefore be considered negligible. Therefore, the default value is chosen.
Figure 5 depicts the temperature profiles of the fluids within the heat exchangers, illustrating the differences in PPs between HP2 and HP3 and between HE2 and HE3. Reducing the PP is expected to increase the component costs of the heat exchangers. For this reason, the effects of the PP in the heat exchangers on the component costs and the LCOE are examined in the next section. The working fluids R245fa and R1233zd(E) are not included in the economic analysis because of the low round-trip efficiencies and low pressure ratios obtained in the discharge process.

Figure 5.
Temperature–heat flow diagrams of (a,d) Configuration 1 in the heat exchanger (HP2–HP3); (b,e) Configuration 1 in the heat exchanger (HE2–HE3); and (c,f) Configuration 6 in the heat exchanger (HE2–HE3) at different PPs for illustration of the curve between the fluids.
3. Economic Analysis
This section describes the approaches for calculating the purchased equipment costs (PECs) and the LCOE.
3.1. Equipment Cost
The Turton method [25] was used for the initial estimation of component costs. In this approach, the PECs are determined using cost functions derived from predefined factors and specific size parameters, such as power or heat exchanger area. The PECs of the generators were calculated according to the six-tenths rule [26], using values from the cost analysis of the generators by Balli et al. [27]. In contrast to the other components, the PEC of the throttle was negligible. A detailed explanation of the calculation of PECs can be found in [28]. An average value of EUR 550 m [18] was used to determine the PEC for the two-zone storage tank. The PECs rely on particular reference years. Therefore, updating the costs is essential, taking into account price fluctuations, inflation, and other factors, using the CEPCI as an instrument. The CEPCI is given as 708 [29] for the reference year 2021. For the conversion of various currencies into euros, the European Commission’s official exchange rate [30] was employed.
3.2. Levelized Cost of Electricity
To assess the various CB configurations, the LCOE was computed in accordance with [31]. The electricity generation costs comprise the total economic expenses over the lifetime of the system and the cumulative electricity generation. The LCOE can be calculated using Equation (4), taking into account the purchase costs of the electrical energy provided:
where I represents the investment cost, represents the annual operating and maintenance costs, is the yearly electricity output, is the electricity purchase cost, and n is the operation period.
Based on [32], PTES systems are assumed to function for 20 to 30 years. Therefore, this study assumes an operation period of n = 25 years. In [33], a characteristic operating scenario with a uniform charging and discharging of = 4 h was derived on the basis of the day-ahead market. The same operating scenario is used here. Consequently, this yields the yearly electricity output, calculated as . The investment costs I include not only the PECs but also other expenses, such as those of measuring devices, pipes, and installation [34]. The determination of I involves multiplying the Lang factor ( = 4.74) [34] by the total PECs. The annual operating and maintenance costs are determined by multiplying a fixed factor () by the total investment costs. The purchase cost for the electricity utilized during charging is based on the day-ahead market for Germany and Austria on the European Energy Exchange [35]. Employing Dietrich’s method [33] for the reference year 2021 leads to a purchase cost of [36]. From the program ’Renewable Energies Standard’ [37] of the credit bank KfW, the debt interest rate i was estimated to be 3.49% [38]. This interest rate applies for a maximum fixed-interest period of 20 years. In view of the 25-year term of the study, the interest rate is assumed constant for the full term. Inflation adjustments were not taken into account.
3.3. Results of the Economic Analysis
Figure 6 shows the LCOEs for CBs with , R1234yf and isobutane depending on the hours of discharge and the PP. The numerical values mentioned in the following regarding PEC and LCOE for the different configurations can be found in Table A4, Table A5, Table A6 and Table A7. The average total PEC for the subcritical processes of configurations 2, 3, 5, 6 is EUR 12.212 . Configuration 1, based on the HE, has PECs of about EUR 3 million higher than the others. However, Configuration 1 has the lowest LCOE (EUR 1.23 ). Because of their lower round-trip efficiencies, the other configurations range from EUR 1.84 to EUR 2.09 . With a reduced PP, Configuration 1’s component costs increase by over 56%, while those for the other configurations are only 20% more on average (see Table A5). In addition, a higher LCOE for Configuration 1 is obtained. The principal reason behind the escalated costs for the heat exchangers is the temperature differences within the HE, specifically from the hot TES to the discharging process. The reduction in PP has a positive effect on the LCOE of the other configurations, leading to an average reduction of 53.8%. The data presented in Table A6 and Table A7 show that the assumption of uniform charging and discharging times of 5 and 6 h, respectively, leads to a further reduction in the LCOE. Although the expansion of the two-zone storage system is associated with additional costs, they do not have a major impact on the total PEC or LCOE, as shown in Table A6 and Table A7. The increase in is due to the additional hours necessary for the charging process. As the timeslots with the lowest prices are chosen first for the charging process, additional hours necessary are accompanied by higher prices for these hours, resulting in higher prices on average. In addition, Figure 7 compares the shares of the PECs of the different components for Configurations 1 () and 6 (R1234yf) with different PPs. The sub-processes of charging, storage, and discharging are presented in different colors. In all configurations, the compressor (including the motor) is the most cost-intensive component. However, if the PP decreases, the cost share of the heat exchanger increases. The PEC distributions for the remaining configurations are similar to those for Configuration 6.
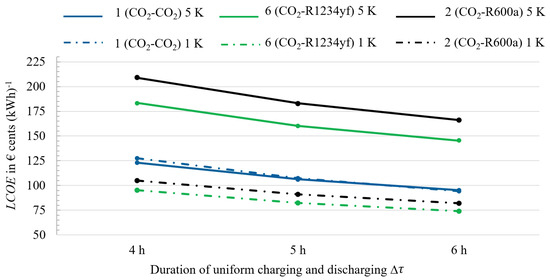
Figure 6.
LCOE of , R1234yf and R600a for PPs of 5 K and 1 K with discharging durations of 4, 5 and 6 h.
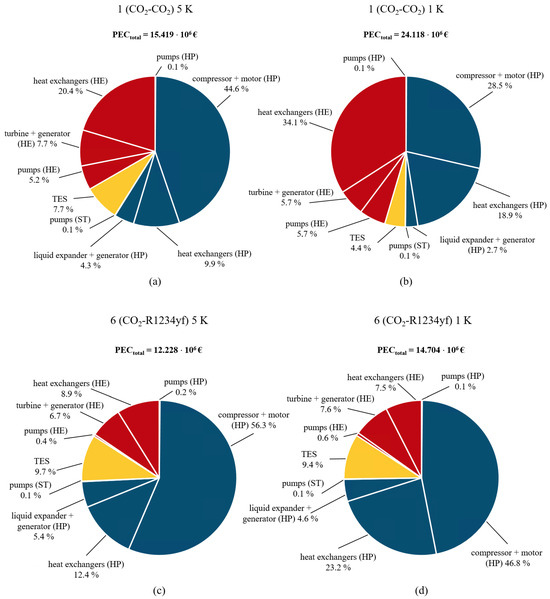
Figure 7.
PEC distribution for Configuration 1 (-) (a) with a PP of 5 K and (b) with a PP of 1 K and for Configuration 6 (-R1234yf) (c) with a PP of 5 K and (d) with a PP of 1 K.
Figure 8 presents a comprehensive and compact comparison of the various configurations. The bubble chart shows the round-trip efficiency and LCOE of CBs with , isobutane, propane, and R1234yf for the two investigated PPs. Additionally, the PEC of each configuration is visualized by the size of the respective bubble. The increases in PEC and efficiency by lowering the PP are clearly recognizable. Except for Configuration 1, the LCOEs decrease for all configurations when the PP is reduced.
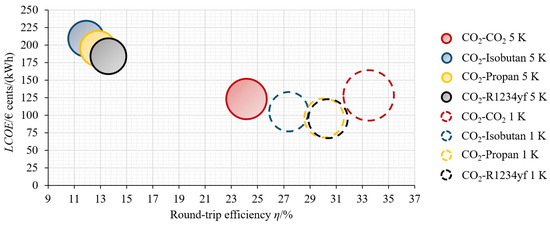
Figure 8.
Bubble chart of , isobutane, propane, and R1234yf showing LCOE, round-trip efficiency, and PEC (bubble size) for a pinch point of 5 K and 1 K.
3.4. Sensitivity Analysis of the LCOE
To identify the parameters with the greatest impact on the LCOE, a sensitivity analysis was carried out. Figure 9 shows the results for Configurations 1 and 6 with a PP of 5 K and a duration for the discharging process of 4 h. Table A8 lists the parameters and their variations for the sensitivity analysis. The results of only Configurations 1 and 6 are presented in this work because the latter is representative of the other organic working fluids. The configurations are comparably sensitive to the same parameters, and only the absolute values differ between the configurations. Al though Configuration 1 has higher total PECs and a relative variation of a parameter can be assumed to be more influential, the higher round-trip efficiency overcompensates this effect. This connection is also why the LCOEs of Configuration 1 are lower than those of the other configurations for a PP of 5 K. A rise in the purchase cost of electricity increases the LCOE the most. The values used to vary the purchase cost of electricity are the lower and upper limits of the years 2020 and 2022, respectively. The second most influential factor on the LCOE is the investment costs. As the deviation in the investment costs is the same for the upper and lower limits, the results of the sensitivity analysis are evenly distributed compared to the base case, unlike the analysis results of the purchase cost of electricity. Further uneven influences occur by changing the period and debt interest rate. As the estimation of the LCOE is subject to great uncertainties, the results obtained can only be used for a qualitative comparison rather than evaluating the economic viability.
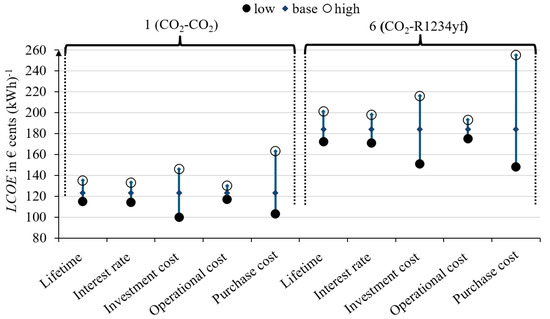
Figure 9.
Sensitivity analysis for Configurations 1 and 6 with a PP of 5 K and a discharging duration of 4 h.
4. Technology Readiness Level
The European Commission’s TRL scale [39] is used to assess the level of development and usability of a technology or concept. It consists of nine levels, with levels 1 and 9 being the lowest and highest levels of technological maturity, respectively, (see Figure 10). In the following subsection, the TRL is applied to the subprocesses.
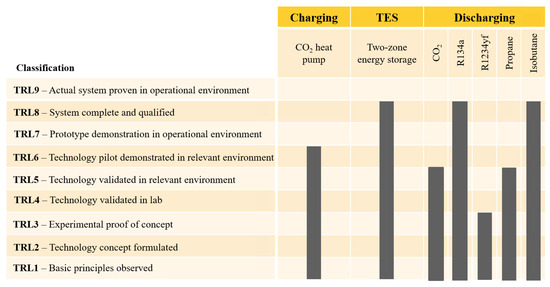
Figure 10.
TRL classification [39] and categorization of the components in the configurations.
4.1. Evaluation of the Subprocesses
- heat pump
- HPs with displacement compressors and throttles for expansion are available on the market. However, their capacity is limited [17]. A configuration similar to the concept of this study has been developed by MAN Energy Solutions [15,16] and successfully implemented in a test rig. The essential components are also provided by this company. Utilizing a barrel compressor instead of a displacement compressor allows higher capacities. This subprocess is therefore classified to a TRL of 6. Since a prototype has not yet been demonstrated in a relevant operational environment, a TRL of 7 has not been attained.
- Two-zone storage
- The two-zone storage system is classified with a TRL of 8 because of its implementation in four facilities [18].
- heat engine
- The discharge process was experimentally investigated in [40], resulting in a minimum TRL of 3. A commercial system employing a supercritical process with high-temperature heat input is offered by one manufacturer [41]. However, this study utilized a lower heat input temperature of 115 . As a result, the subprocess is allocated a TRL of 5, requiring additional testing and development under operational conditions to reach a TRL of 6.
- ORC with R600a
- An operational ORC using isobutane as a working fluid is located in Germany [14]. Operating with a geothermal source inlet temperature of 135 , it produces an electrical output of 4.3 MW [14], leading this specific process to achieve a TRL of 8.
- ORC with R134a
- A geothermal power plant uses R134a as the operating fluid and accesses a geothermal reservoir with an inlet temperature of 118 to generate 5.5 MW of electrical power [14]. Consequently, this system is assessed with a TRL of 8.
- ORC with R290
- Propane finds common application as a working fluid within cooling systems [22]. Only one research group has been identified as using propane in its transcritical process for generating geothermal power [42]. Consequently, this subprocess is rated at a TRL of 5.
- ORC with R1234yf
- R1234yf was developed as an alternative to R134a. The use of this working fluid in an ORC was verified in numerical simulations, resulting in a TRL rating of 3. However, a prototype or an experimental test is needed for a TRL of 4 [21].
The classification of the subprocesses to the TRL is summarized in Figure 10.
4.2. Evaluation of the Overall Process
The TRL of the overall processes is equal to the lowest TRL resulting from the subprocesses. Configurations 2 with R600a and 3 with R134a reach the highest TRL of 6. The lowest TRL of 3 is obtained by Configuration 6 with R1234yf. An overview of the TRL of each configuration is given in Figure 11.
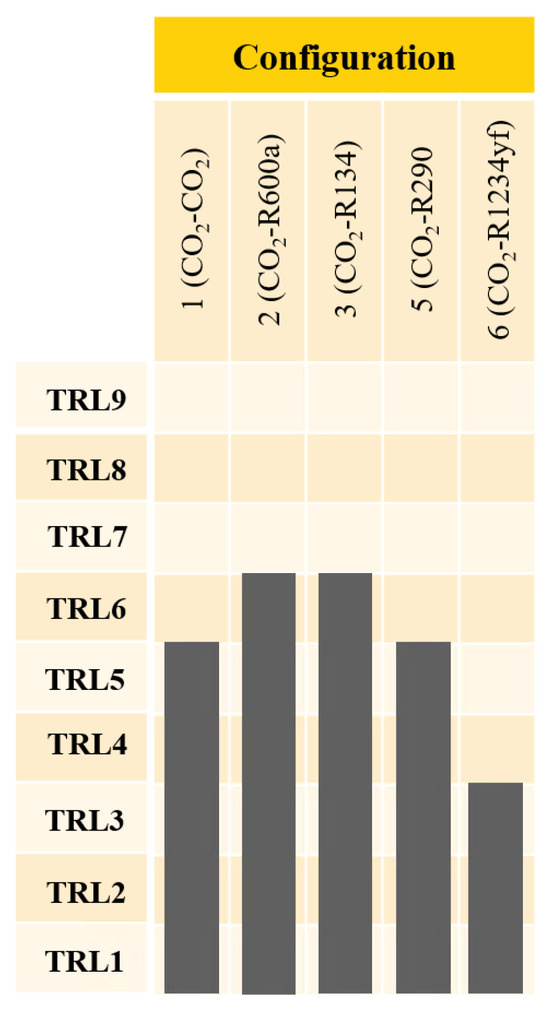
Figure 11.
Overall TRLs of the configurations.
5. Discussion
The investigated configurations achieve round-trip efficiencies between 9% and 24% for a PP of 5 K. The LCOEs of these configurations vary between EUR 1.23 and EUR 2.09 , with Configuration 1 based on the transcritical process with having the highest round-trip efficiency and lowest LCOE. While Configuration 1 reaches a round-trip efficiency of more than 24%, the other four configurations investigated in more detail show a round-trip efficiencies of less than 13% on average. Although Configuration 1 has the highest PEC of these systems, its LCOE is only 63.2% of the average LCOE of the other four systems.
Compared to a PP of 5 K, for a reduced PP of 1 K, the configurations using subcritical processes show more than double the round-trip efficiencies on average and substantially lower LCOEs, reduced by nearly 50% on average, except for Configuration 1. While the round-trip efficiency of Configuration 1 increases its LCOE also increases. The reason for this is that the component costs are higher than for the 5 K configuration as a substantially greater heat transfer area between the hot water and in the HE is necessary to achieve the intended PP. Consequently, for a PP of 1 K, an opposite behavior is evident regarding LCOE between the system based on for the discharge process and the systems using a subcritical discharge process.
The highest TRL of 6 is reached by Configurations 2 and 3 with R600a and R134a, respectively. Consequently, a prompt implementation is conceivable. Although the configuration with R134a shows a higher round-trip efficiency and lower LCOE, this refrigerant may be phased out by the European Union in the future because of its high global warming potential (GWP).
Configuration 1 combines the highest round-trip efficiency and lowest LCOE with a relatively high TRL of 5. However, this configuration with the environment as a low temperature TES is unsuitable because the approaches the critical point in the evaporator of the HE if the ambient temperature increases. Technical problems may result from this configuration. Using an ice storage unit instead of the ambient reservoir combined with an intermediate circuit may be a solution for this problem, but an additional heat exchanger to dissipate the entropy generated from the system to the environment is required, which is linked to further costs and irreversibilities.
Some studies present CBs based on transcritical processes with resulted in higher round-trip efficiencies [4,5,6,7,9]. These concepts differ from the one presented in this paper. First, their CBs used a second storage tank instead of the environment—either an ice slurry storage [9] or an ice storage [6] was integrated into the CB. Because a high-pressure is necessary, ice storage is not feasible [16]. Furthermore, ice slurry storage tanks are uncommon [43] and yield a lower TRL. Second, deviating concepts of high-temperature storage are employed. Higher round-trip efficiencies resulting from pressurized tanks with water as a storage medium at high storage temperatures, as shown in a previous publication [4], comprise one possibility. Another option is to use multiple storage options for the high-temperature storage system to improve the temperature glide between and the water inside the tanks. To exploit this potential multiple heat exchangers are necessary, resulting in a significantly more complex system.
One simplification made in other studies is neglecting the efficiencies of motors and generators, i.e., no losses of these components were considered. Additionally, an expansion machine used in the charging process was assumed a technically unfeasible configuration.
Supercritical discharge processes and ORC fluids as working fluids can be a solution for increased round-trip efficiency [7]. However, higher storage temperatures are necessary. Furthermore, alternative storage media are required if the storage temperature exceeds 160 , along with a compressor that can achieve the desired temperature. Thus, a low TRL for such a system is expected.
In addition, the predicted round-trip efficiencies under simplified assumptions, such as the absence of heat and pressure losses in the storage and the subprocesses, are higher than in the feasible options of the considered configurations.
Moreover, with uniform charging and discharging times of 4 h, the LCOEs are very high, but they can be reduced by increasing the charging and discharging duration. Thus, the increase in the costs for a larger TES is overcompensated by the additional revenue because of the higher amount of electricity discharged.
In this study, the calculated LCOEs are considerably higher compared to Fan et al. [12], which may be because the Lang factor was taken into account to estimate the total costs rather than only the component costs.
6. Conclusions and Outlook
In this study, CBs with an electrical input power of 18 MW were modeled and simulated using the software EBSILON®Professional. For charging, a transcritical process with was applied. For discharging, a transcritical process with and six organic working fluids based on subcritical processes was investigated, four of them in detail. A water-based two-zone storage tank served as TES, having a maximum storage temperature of 115 . The processes were evaluated based on round-trip efficiency, LCOE, and TRL. The configurations are compared for PPs of 5 K and 1 K and a discharging duration of 4 h for the base case. Furthermore, discharging durations of 5 and 6 h were considered.
The following conclusions can be drawn:
- Configuration 1, which uses a transcritical in the HE, shows the highest round-trip efficiency of more than 24% and the lowest LCOE of EUR 1.23 with a PP of 5 K and a discharge duration of 4 h. The four organic working fluids investigated in more detail show significantly lower round-trip efficiencies and higher LCOEs (12.9% and EUR 1.95 on average, respectively). Although Configuration 1 has a TRL of 5, it is unsuitable for implementation because the evaporator temperature in the HE comes too close to the critical point when the ambient temperature rises, resulting in technical problems.
- A PP of 1 K and a discharge duration of 4 h result in higher efficiencies and lower LCOEs for the configurations using organic working fluids (29.5% and EUR 0.98 on average, respectively). For Configuration 1, the increase in costs overcompensates for the increase in efficiency, which leads to a slightly higher LCOE of EUR 1.28 . Among the subcritical processes, the working fluid R1234yf shows promising results. However, this configuration is classified with the lowest TRL of 3. The organic working fluid R134a achieves comparable results regarding round-trip efficiency and LCOE but shows a higher TRL. Since this refrigerant is banned in the automotive sector due to its high GWP [44], it does not represent a sustainable alternative. With the refrigerant R600a, having the same TRL, a poor round-trip efficiency of 27.38% accompanied by the highest LCOE of EUR 1.05 was obtained. Finally, R290 has disadvantages in that it shows a comparatively lower TRL of 5 and requires higher system pressures of up to 21.8 bar, rendering this option unfavorable from a technical perspective.
- The sensitivity analysis shows that the calculated LCOEs are subject to considerable uncertainties. Therefore, these values can only serve to compare the configurations and not to estimate their economic viability. Reliable component costs and a full financing calculation are necessary to obtain a better estimate. Furthermore, a detailed plant design and component efficiencies are required.
In future investigations, ice-storage-based concepts can be considered to replace the environment as a storage unit, enabling the use of Configuration 1. A comparison with the presented configurations regarding round-trip efficiency, LCOE, and TRL can be purposeful. As a PP of 5 K results in low round-trip efficiencies and a PP of 1 K is associated with higher costs and technological difficulties, further investigations should focus on intermediate points, e.g., 3 K.
Author Contributions
Conceptualization, J.K.; funding acquisition, P.S.; methodology, J.K. and L.Z.; project administration, F.D. and P.S.; supervision, F.D. and P.S.; visualization, J.K. and L.Z.; writing—original draft, J.K. and L.Z.; writing—review and editing, F.D. and Peter Stephan. All authors have read and agreed to the published version of the manuscript.
Funding
Financial support from the German Research Foundation within the Priority Programme 2403: ‘Carnot-Batteries: Inverse Design from Markets to Molecules’ under project number 525974553 is gratefully acknowledged.
Data Availability Statement
The data presented in this study will be made available on request from the authors.
Conflicts of Interest
The authors declare no conflicts of interest. The funders had no role in the design of the study; in the collection, analyses, or interpretation of data; in the writing of the manuscript; or in the decision to publish the results.
Nomenclature
| Abbreviations | ||
| CB | Carnot battery | |
| CEPCI | chemical engineering plant cost index | |
| condenser | ||
| electrical | ||
| evaporator | ||
| GWP | global warming potential | |
| HE | heat engine | |
| HP | heat pump | |
| isentropic | ||
| LCOE | levelized cost of electricity | |
| mechanical | ||
| operation | ||
| ORC | organic Rankine cycle | |
| output | ||
| purchased equipment cost | ||
| PP | pinch point | |
| round trip | ||
| storage property at position ST1 | ||
| storage property at position ST2 | ||
| TES | thermal energy storage | |
| TRL | technology readiness level | |
| Variables | ||
| A | operation and maintenance cost | € |
| c | purchase cost | €cents |
| produced amount of electricity | kWh | |
| F | factor | - |
| i | interest rate | % |
| I | investment costs | € |
| levelized cost of electricity | €cents | |
| n | operation period | a |
| P | power | kW |
| t | year of operation | a |
| Greek symbols | ||
| difference | - | |
| efficiency | % | |
| time | ||
Appendix A

Table A1.
Component parameters used in EBSILON®Professional.
Table A1.
Component parameters used in EBSILON®Professional.
| Parameter | Symbol | Value | Unit |
|---|---|---|---|
| Isentropic efficiency compressor | 85 | % | |
| Isentropic efficiency liquid expander | 85 | % | |
| Isentropic efficiency pumps | 80 | % | |
| Isentropic efficiency turbine | 85 | % | |
| Mechanical efficiency compressor | 99 | % | |
| Mechanical efficiency liquid expander | 99 | % | |
| Mechanical efficiency pumps | 99 | % | |
| Mechanical efficiency turbine | 99 | % | |
| Mechanical efficiency motor | 99 | % | |
| Electrical efficiency motor | 95 | % | |
| Electrical efficiency generator | 98 | % |
Appendix B

Table A2.
Results of the simulation with a pinch point of 5 K in the heat exchangers. 115 .
Table A2.
Results of the simulation with a pinch point of 5 K in the heat exchangers. 115 .
| Configuration | 1 | 2 | 3 | 4 | 5 | 6 | 7 |
|---|---|---|---|---|---|---|---|
| Charging process | |||||||
| Fluid | |||||||
| in [-] | 3.04 | 3.04 | 3.05 | 3.04 | 3.04 | 3.04 | 3.04 |
| TES | |||||||
| in [] | 33.8 | 33.8 | 33.7 | 34.0 | 34.0 | 34.0 | 34.0 |
| Discharging process | |||||||
| Fluid | R600a | R134a | R245fa | R290 | R1234yf | R1233zd(E) | |
| in [bar] | 120.5 | 4.9 | 9.5 | 2.2 | 12.9 | 10.1 | 1.8 |
| in [bar] | 55 | 2.9 | 5.5 | 1.2 | 8.1 | 5.7 | 1.1 |
| in [%] | 7.94 | 3.91 | 4.30 | 3.73 | 4.22 | 4.48 | 3.17 |
| in [%] | 24.15 | 11.91 | 13.08 | 11.34 | 12.82 | 13.61 | 9.64 |

Table A3.
Results of the simulation with a pinch point of 1 K in the heat exchangers.
Table A3.
Results of the simulation with a pinch point of 1 K in the heat exchangers.
| Configuration | 1 | 2 | 3 | 4 | 5 | 6 | 7 |
|---|---|---|---|---|---|---|---|
| Charging process | |||||||
| Fluid | |||||||
| in [-] | 3.57 | 3.24 | 3.20 | 3.19 | 3.20 | 3.21 | 3.20 |
| TES | |||||||
| in [] | 30.9 | 41.1 | 42.4 | 42.3 | 42.4 | 41.8 | 42.4 |
| Discharging process | |||||||
| Fluid | R600a | R134a | R245fa | R290 | R1234yf | R1233zd(E) | |
| in [bar] | 140 | 7.9 | 17.3 | 4.2 | 21.8 | 18.4 | 3.3 |
| in [bar] | 51 | 2.6 | 5.0 | 1.0 | 7.7 | 5.1 | 1 |
| in [%] | 9.39 | 8.45 | 9.40 | 8.69 | 9.41 | 9.47 | 7.83 |
| in [%] | 33.48 | 27.38 | 30.03 | 27.77 | 30.07 | 30.38 | 25.03 |

Table A4.
PEC and LCOE with a pinch point of 5 K in heat exchangers during uniform charging and discharging for 4 h.
Table A4.
PEC and LCOE with a pinch point of 5 K in heat exchangers during uniform charging and discharging for 4 h.
| Configuration | 1 | 2 | 3 | 5 | 6 |
|---|---|---|---|---|---|
| PEC [€] | 15.419 | 12.163 | 12.222 | 12.235 | 12.228 |
| LCOE [€cents ] | 123 | 209 | 191 | 195 | 184 |

Table A5.
PEC and LCOE with a pinch point of 1 K in heat exchangers during uniform charging and discharging for 4 h.
Table A5.
PEC and LCOE with a pinch point of 1 K in heat exchangers during uniform charging and discharging for 4 h.
| Configuration | 1 | 2 | 3 | 5 | 6 |
|---|---|---|---|---|---|
| PEC [€] | 24.118 | 14.670 | 14.683 | 14.712 | 14.704 |
| LCOE [€cents ] | 128 | 105 | 96 | 96 | 95 |

Table A6.
PEC and LCOE with a pinch point of 5 K in heat exchangers during uniform charging and discharging for 5 h with .
Table A6.
PEC and LCOE with a pinch point of 5 K in heat exchangers during uniform charging and discharging for 5 h with .
| Configuration | 1 | 2 | 3 | 5 | 6 |
|---|---|---|---|---|---|
| PEC [€] | 15.717 | 12.459 | 12.520 | 12.533 | 12.526 |
| LCOE [€cents ] | 106 | 183 | 167 | 170 | 160 |

Table A7.
PEC and LCOE with a pinch point of 5 K in heat exchangers during uniform charging and discharging for 6 h with .
Table A7.
PEC and LCOE with a pinch point of 5 K in heat exchangers during uniform charging and discharging for 6 h with .
| Configuration | 1 | 2 | 3 | 5 | 6 |
|---|---|---|---|---|---|
| PEC [€] | 16.015 | 12.756 | 12.818 | 12.831 | 12.824 |
| LCOE [€cents ] | 95 | 166 | 151 | 155 | 146 |

Table A8.
Sensitivity analysis of the LCOE for Configuration 1 with a pinch point of 5 K.
Table A8.
Sensitivity analysis of the LCOE for Configuration 1 with a pinch point of 5 K.
| Parameter | Value |
|---|---|
| Investment costs I | 0.7 |
| (base case: 73.086€) | 1.3 |
| Factor for operational costs | 1% |
| (base case: 1.5%) | 2% |
| Period of time n | 20 years |
| (base case: 25 years) | 30 years |
| Debt interest rate i | 2.39% [38] |
| (base case: 3.49%) | 4.69% [38] |
| Purchase cost of electricity | 1.82 €cents |
| (base case: 6.64 €cents ) | 16.31 €cents |
References
- Agora Energiewende, Agorameter. Available online: https://www.agoraenergiewende.de/service/agorameter/chart/future_compare/20.05.2023/20.05.2023/future/2030/ (accessed on 23 May 2023).
- Liang, T.; Vecchi, A.; Knobloch, K.; Sciacovelli, A.; Engelbrecht, K.; Li, Y.; Ding, Y. Key components for Carnot battery: Technology review, technical barriers and selection criteria. Renew. Sustain. Energy Rev. 2022, 163, 112478. [Google Scholar] [CrossRef]
- Zhao, Y.; Song, J.; Liu, M.; Zhao, Y.; Olympios, A.V.; Sapin, P.; Yan, J.; Markides, C.N. Thermo-economic assessments of pumped-thermal electricity storage systems employing sensible heat storage materials. Renew. Energy 2022, 186, 431–456. [Google Scholar] [CrossRef]
- Morandin, M.; Maréchal, F.; Mercangöz, M.; Buchter, F. Conceptual design of a thermo-electrical energy storage system based on heat integration of thermodynamic cycles—Part A: Methodology and base case. Energy 2012, 45, 375–385. [Google Scholar] [CrossRef]
- Kim, Y.-M.; Shin, D.-G.; Lee, S.-Y.; Favrat, D. Isothermal transcritical CO2 cycles with TES (thermal energy storage) for electricity storage. Energy 2012, 49, 484–501. [Google Scholar] [CrossRef]
- Steinmann, W.-D.; Jockenhöfer, H.; Bauer, D. Thermodynamic analysis of High-temperature Carnot battery concepts. Energy Technol. 2020, 8, 1900895. [Google Scholar] [CrossRef]
- Koen, A.; Antunez, P.F.; White, A. A study of working fluids for transcritical pumped thermal energy storage cycles. In Proceedings of the 2019 Offshore Energy and Storage Summit (OSES), Brest, France, 10–12 July 2019; pp. 1–7. [Google Scholar]
- Baik, Y.-J.; Heo, J.; Koo, J.; Kim, M. The effect of storage temperature on the performance of a thermo-electric energy storage using a transcritical CO2 cycle. Energy 2014, 75, 204–215. [Google Scholar] [CrossRef]
- Mercangöz, M.; Hemrle, J.; Kaufmann, L.; Z’Graggen, A.; Ohler, C. Electrothermal energy storage with transcritical CO2 cycles. Energy 2012, 45, 407–415. [Google Scholar] [CrossRef]
- Morandin, M.; Maréchal, F.; Mercangöz, M.; Buchter, F. Conceptual design of a thermo-electrical energy storage system based on heat integration of thermodynamic cycles—Part B: Alternative system configurations. Energy 2012, 45, 386–396. [Google Scholar] [CrossRef]
- Bodner, J.; Koksharov, J.; Dammel, F.; Stephan, P. Analysis of low-temperature pumped thermalenergy storage systems based on a transcritical CO2 charging process. Energy Sci. Eng. 2023, 11, 3289–3306. [Google Scholar] [CrossRef]
- Fan, R.; Xi, H. Energy, exergy, economic (3E) analysis, optimization and comparison of different Carnot battery systems for energy storage. In Energy Conversion and Management; Elsevier: Amsterdam, The Netherlands, 2022; Volume 252. [Google Scholar] [CrossRef]
- Morandin, M.; Mercangöz, M.; Hemrle, J.; Maréchal, F.; Favrat, D. Thermoeconomic design optimization of a thermo-electric energy storage system based on transcritical CO2 cycles. Energy 2013, 58, 571–587. [Google Scholar] [CrossRef]
- Heberle, F.; Brüggemann, D.; Weiß, A.P.; Grundemann, L. Geothermische Kraftwerke in Deutschland: Individuelle Lösungen durch die geeignete Wahl des Arbeitsmediums. BWK Das Energie-Fachmag. 2017, 69, 51–54. [Google Scholar]
- Hirsch, T. MAN Wärmepumpen-Wie wir die klimaneutrale Zukunft der Stadt Esbjerg gestalten; 27. Dresdner Fernwärme-Kolloquium, Dresden. 2022. [Google Scholar]
- Decorvet, R.C.; Jacquemoud, E. Industrial Heat Pumps—MAN Energy Solutions. Research Report. 2021. Available online: https://www.man-es.com/campaigns/download-request (accessed on 3 February 2023).
- Arpagaus, C.; Bless, F.; Uhlmann, M.; Schiffmann, J.; Bertsch, S.S. High temperature heat pumps: Market overview, state of the art, research status, refrigerants, and application potentials. Energy 2018, 152, 985–1010. [Google Scholar] [CrossRef]
- Maximini, M. Flexibilisierung der Strom- und Wärmeerzeugung durch Wärmespeicher. Available online: https://enerko.de/wp-content/uploads/2019/11/191120-Flexibilisierung-der-Strom-und-Waermeerzeugung-durch-Waermespeicher-.pdf (accessed on 8 February 2023).
- Dumont, O.; Charalampidis, A.; Lemort, V. Experimental Investigation of a Thermally Integrated Carnot Battery Using A Reversible Heat Pump/Organic Rankine Cycle. In Proceedings of the International Refrigeration and Air Conditioning Conference, West Lafayette, IN, USA, 24–28 May 2021. [Google Scholar]
- Eppinger, B.; Steger, D.; Regensburger, C.; Karl, J.; Schlücker, E.; Will, S. Carnot battery: Simulation and design of a reversible heat pump-organic Rankine cycle pilot plant. Appl. Energy 2021, 288, 116650. [Google Scholar] [CrossRef]
- García-Pabón, J.J.; Méndez-Méndez, D.; Belman-Flores, J.M.; Barroso-Maldonado, J.M.; Khosravi, A. A review of recent research on the use of R1234yf as an environmentally friendly fluid in the organic Rankine cycle. Sustainability 2021, 13, 5864. [Google Scholar] [CrossRef]
- Ghoubali, R.; Byrne, P.; Bazantay, F. Refrigerant charge optimisation for propane heat pump water heaters. Int. J. Refrig. 2017, 76, 230–244. [Google Scholar] [CrossRef]
- Iqony Solutions GmbH, EBSILON®Professional, Process Simulation Software. Available online: https://systemtechnologies.iqony.energy/de (accessed on 3 February 2023).
- Lemmon, E.W.; Bell, I.H.; Huber, M.L.; McLinden, M.O. NIST Standard Reference Database 23: Reference Fluid Thermodynamic and Transport Properties-REFPROP; Version 10.0; National Institute of Standards and Technology: Boulder, CO, USA, 2018.
- Turton, R.; Bailie, R.C.; Whiting, W.B.; Shaeiwitz, J.A.; Bhattacharyya, D. Analysis, Synthesis, and Design of Chemical Processes, 4th ed.; Prentice Hall: Upper Saddle River, NJ, USA, 2013. [Google Scholar]
- Bejan, A.; Tsatsaronis, G.; Moran, M. Thermal Design and Optimization; Wiley-Interscience Publication; Wiley: Hoboken, NJ, USA, 1996. [Google Scholar]
- Balli, O.; Aras, H.; Hepbasli, A. Exergoeconomic analysis of a combined heat and power (CHP) system. Int. J. Energy Res. 2008, 32, 273–289. [Google Scholar] [CrossRef]
- Koksharov, J.; de Oliveira, H.T.; Dammel, F.; Stephan, P. Evaluation of different pumped thermal energy storage systems. In Proceedings of the 34th International Conference on Efficiency, Cost, Optimization, Simulation and Environmental Impact of Energy System, ECOS 2021, Taormina, Italy, 27 June–2 July 2021; pp. 679–690. [Google Scholar]
- Towering Skills, Cost Indices. Available online: https://www.toweringskills.com/financial-analysis/cost-indices/ (accessed on 23 February 2023).
- European Commission. Exchange Rate. Available online: https://www.ecb.europa.eu/stats/policy_and_exchange_rates/euro_reference_exchange_rates/html/eurofxref-graph-usd.de.html (accessed on 8 February 2023).
- Kost, C.; Shammugam, S.; Fluri, V.; Peper, D.; Memar, A.D.; Schlegl, T. Stromgestehungskosten Erneuerbare Energien. Frauenhofer-Institut für Solare Energiesysteme ISE, Study. June 2021. Available online: https://www.ise.fraunhofer.de/de/veroeffentlichungen/studien/studie-stromgestehungskosten-erneuerbare-energien.html (accessed on 8 March 2023).
- Steinmann, W.-D.; Bauer, D.; Jockenhöfer, H.; Johnson, M. Pumped thermal energy storage (PTES) as smart sector-coupling technology for heat and electricity. Energy 2019, 183, 185–190. [Google Scholar] [CrossRef]
- Dietrich, A. Assessment of Pumped Heat Electricity Storage Systems through Exergoeconomic Analyses. Ph.D. Thesis, TU Darmstadt, Darmstadt, Germany, 2017. [Google Scholar]
- Towler, G.P.; Sinnott, R.K. Chemical Engineering Design: Principles, Practice, and Economics of Plant and Process Design, 2nd ed.; Butterworth-Heinemann: Boston, MA, USA, 2013. [Google Scholar]
- European Power Exchange, EPEX SPOT SE. Available online: https://www.epexspot.com (accessed on 12 March 2023).
- entsoe. Transparency Platform. Available online: https://transparency.entsoe.eu (accessed on 23 February 2023).
- KfW. KfW-Programm Erneuerbare Energien ‘Standard’. Available online: https://www.kfw.de/inlandsfoerderung/Unternehmen/Wohnwirtschaft/Förderprodukte/Erneuerbare-Energien-Standard-(270) (accessed on 23 February 2023).
- KfW, Konditionenübersicht für Endkreditnehmer. Available online: https://www.kfw-formularsammlung.de/KonditionenanzeigerINet/KonditionenAnzeiger (accessed on 1 June 2021).
- De Rose, A.; Buna, M.; Strazza, C.; Olivieri, N.; Stevens, T.; Peeters, L.; Tawil-Jamault, D. Technology Readiness Level: Guidance Principles for Renewable Energy Technologies; Report. 2017. Available online: https://d362j716yjtjbt.cloudfront.net/media/2900/trl-orka.pdf (accessed on 8 March 2023).
- Lecompte, S.; Ntavou, E.; Tchanche, B.; Kosmadakis, G.; Pillai, A.; Manolakos, D.; De Paepe, M. review of experimental research on supercritical and transcritical thermodynamic cycles designed for heat recovery application. Appl. Sci. 2019, 9, 2571. [Google Scholar] [CrossRef]
- Echogen Power Systems. EPS100 Heat Recovery Solution. Available online: https://www.echogen.com/_CE/pagecontent/Documents/EPS100_brochure_2017.pdf (accessed on 2 March 2023).
- Gardella, L.; Wiemer, H.-J. First experimental results of a supercritical Organic Rankine cycle using propane as working fluid. In Annual Report 2020 of the Institute for Thermal Energy Technology and Safety; Tromm, W., Ed.; KIT Scientific Publishing: Karlsruhe, Germany, 2022; pp. 59–65. [Google Scholar]
- Dincer, I.; Erdemir, D. Heat Storage Systems for Buildings; Chapter 2—Heat Storage Methods; Elsevier: Amsterdam, The Netherlands, 2021; pp. 37–90. [Google Scholar]
- Macchi, E.; Astolfi, M. Organic Rankine Cycle (ORC) Power Systems, Technologies and Applications; Woodhead Publishing: Sawston, UK, 2017. [Google Scholar]
Disclaimer/Publisher’s Note: The statements, opinions and data contained in all publications are solely those of the individual author(s) and contributor(s) and not of MDPI and/or the editor(s). MDPI and/or the editor(s) disclaim responsibility for any injury to people or property resulting from any ideas, methods, instructions or products referred to in the content. |
© 2024 by the authors. Licensee MDPI, Basel, Switzerland. This article is an open access article distributed under the terms and conditions of the Creative Commons Attribution (CC BY) license (https://creativecommons.org/licenses/by/4.0/).