Article

Energy Generation Intensity (EGI) of Solar Updraft Tower (SUT) Power Plants Relative to CSP Plants and PV Power Plants Using the New Energy Simulator “Aladdin”

College of Engineering, University of Buraimi, Al Buraimi 512, Oman
Energies 2024, 17(2), 405; https://doi.org/10.3390/en17020405
Submission received: 15 December 2023 / Revised: 6 January 2024 / Accepted: 11 January 2024 / Published: 13 January 2024

Abstract

:
The current investigation provides information about solar updraft tower power plants, SUTPPs (also called solar chimney power plants, SCPPs), which form a unique method of solar-powered electricity production through a ducted wind turbine driven by induced airflow as a result of solar heating. The investigation is conducted using numerical modeling via the system-level simulation tool Aladdin (developed and released freely by the Institute for Future Intelligence, IFI) for solar energy systems, wind energy systems, or the built environment. The Aladdin energy simulator is first evaluated here by comparison with published experimental and numerical results corresponding to the historical 50 kW prototype SUTPP that was successfully tested in Manzanares (Spain) between 1982 and 1989. This prototype has a height of about 195 m for the chimney (the updraft tower) and a radius of about 122 m for the solar heat absorber (the solar air collector or the greenhouse). Next, various climate and performance characteristics are investigated and contrasted for nine different locations around the world with a similar latitude of 24°, which is within the sunbelt, assuming that the same Manzanares SUTPP prototype geometry is employed in these locations. These nine locations are Muscat (Oman), Al Jawf (Libya), Riyadh (Saudi Arabia), Karachi (Pakistan), Ahmedabad (India), Havana (Cuba), Culiacán (Mexico), Dhaka (Bangladesh), and Baise (China). The energy generation intensity (EGI) for the Manzanares-type solar updraft tower power plant in these nine examined locations was between 0.93 kWh/m2 per year (in Baise) and 2.28 kWh/m2 per year (in Muscat). Also, Muscat had the smallest seasonality index (maximum-to-minimum monthly electric output) of 1.90, while Baise had the largest seasonality index of 4.48. It was found that the main limitation of the overall SUTPP energy conversion efficiency is the chimney efficiency (the process of accelerating the air after entering the chimney). This study concludes that solar updraft towers (SUTs) cannot compete with existing mature and modular renewable energy alternatives, particularly photovoltaic (PV) panels, if the aimed use is commercial utility-scale electricity generation. Instead, SUTs may become attractive and achievable if viewed as hybrid-use projects by serving primarily as a large-scale greenhouse area for agricultural applications while secondarily allowing energy harvesting by generating clean (emissions-free) electricity from the incoming solar radiation heat.

1. Introduction

1.1. Background

In concentrated solar power (CSP) or solar thermal power (STP) systems, solar radiation is utilized as a clean, renewable alternative to fossil fuels or nuclear fuels to add heat to a heat transfer medium (such as water/steam) for the sake of operating a heat engine, which in turn drives an electric generator [1,2,3,4]. CSP technologies include, for example, parabolic troughs [5,6], which may be described as an array of parallel lines of specially shaped reflecting mirrors that concentrate incoming parallel light beams onto the line of an absorber tube. Another type of CSP system is the solar tower [7,8], where the reflecting surfaces (called heliostats) are separated from the heat absorber. The absorber is located at the top of a central tower, whereas the individual reflecting mirrors take the appropriate angular orientation independently to reflect the incidental sunlight toward the common absorber. The parabolic dish [9,10] is another type of CSP system where the absorber is attached to the reflector, and both of them move together as a single unit. The parabolic dish unit rotates with two degrees of freedom for optimized angular orientation by continuously tracking the sun’s position. Linear Fresnel reflectors (LFR) form another type of CSP system [11,12]. They share with the parabolic troughs their layout as parallel rows, while sharing with the solar tower the feature of separating the reflecting surfaces from a common absorber. When two or more absorbers (rather than a single absorber) are used with linear Fresnel reflectors, this arrangement is referred to as a compact linear Fresnel reflector (CLFR), which is another type of CSP system [13].
Instead of heating a confined fluid that is contained within a closed system or is circulating in a closed loop (as in CSP systems), the solar updraft tower power plant (SUTPP), which is also called solar chimney power plant (SCPP) follows a different approach for converting the heat from solar radiation into electricity by using the ambient air as the working fluid, and it aims to impart kinetic energy to this air after heating it and to cause this accelerated air to move upward inside a long vertical chimney (a hollow tower) with an installed wind turbine inside it at the bottom. The artificially induced wind (or thermal wind) inside the chimney results from a temperature gradient, leading to the buoyancy-driven upward motion of the hotter and lighter air (natural convection), causing the wind turbine blades to spin, and thus causing an electric generator coupled to the internal turbine to produce electricity [14,15,16,17,18,19].
While Ming et al. [20] viewed the SUTPP (or SCPP) as a category of solar thermal energy technology, several other studies classified the SUTPP/SCPP as a unique solar energy technology, being different from CSP/STP [21,22,23]. Gauché et al. [24] included the SUTPP within solar thermal electricity (STE) systems but excluded it from CSP systems, given that the SUTPP does not concentrate solar radiation but it still converts it into electricity. The SUTPP deserves to be confusing in terms of classifying it under CSP systems or not. Both opinions appear to be acceptable.
Elsayed and Nishi [25] emphasized the environmental advantages of SUTPPs through conserving water when compared to conventional power plants or solar thermal power plants. The SUTPP does not need water for cooling and does not use water as a working medium. Another advantage they listed for SUTPPs is their relative simplicity. They predicted that a large-scale SUTPP (such as one with 200 MW power) would be excellent in terms of sustainable development and environmental conservation. However, it is expected to have very small electricity generation compared to CSP or conventional power plants in terms of the efficient use of natural and economic resources.
Satpathi et al. [26] listed several advantages of SUTPPs, including the simplicity of the technology, the absence of harmful emissions, and the low need for maintenance. However, they also mentioned some disadvantages for SUTPPs, including the favoring of huge scales (for larger power outputs), the large initial cost due to construction materials and engineering, the structural challenges due to the need for a high chimney, and the low energy conversion efficiency.
Zhou et al. [27] indicated that a solar updraft tower (SUT) can be used for reducing the urban haze problem in urban heat islands, UHIs [28], by driving the warm air containing haze up to a high altitude (such as 1 km). The SUT simultaneously can produce clean electricity.
Boretti and Al-Zubaidy [29] commented on the lack of practical progress in SUTs, as no large-scale commercial plant has been made. They considered this a lack of maturity for this solar energy technology, which is not competitive with more established renewable energy technologies such as wind energy, solar photovoltaic energy, and concentrated solar power. They referred to the small-scale experimental SUTPP model made in Manzanares (Spain) in 1982, which structurally collapsed in 1989 due to rust and storm winds, as the only relevant field experience performed for SUTPPs. Despite this, they mentioned that SUTs can have better opportunities if combined with other systems rather than being used as a standalone system for electricity generation. For example, SUTs may help in achieving an additional function such as purifying atmospheric air.
Cuce et al. [30] defined an area ratio (AR) for SCPPs as the chimney outlet area divided by the chimney inlet area. For the reference case of AR = 1, the chimney is exactly cylindrical. For AR < 1, the chimney is convergent (conical). For AR > 1, the chimney is divergent (funnel-shaped). They performed three-dimensional computational fluid dynamics (CFD) simulations for the Manzanares pilot solar chimney power plant under different area ratios ranging from 0.5 to 10 and investigated the impact of this design parameter on multiple performance quantities, such as the electric power output and the air mass flow rate through the chimney. For the reference case (AR = 1), the air mass flow rate was 1122.1 kg/s, and the electric power output was 54.3 kW. They found that the electric power output increased to 168.5 kW at an optimum AR of 4.1 (at which the air mass flow rate was approximately 1629.1 kg/s). They identified the range of 3 ≤ AR ≤ 6 as the recommended domain. However, all these AR values imply a chimney whose cress-section becomes largest at its upper end, and such divergent and tall chimneys are not preferred structurally, since the wind-induced drag force is proportional to the diameter [31]. The authors also defined system efficiency as the electric output power from the turbine divided by the product of the absorber area and the incoming solar radiation per unit area. They found that the system efficiency was 0.29% in the reference case (AR = 1), but it was 0.83% in the optimum case (AR = 4.1).
Smaisim et al. [32] reported the results of their numerical modeling of the components of a hypothetical solar chimney power plant design, which was geometrically similar to the pilot-scale power plant of Manzanares (Spain). Their modeling corresponded to five cities in Iran, which were Shiraz, Bushehr, Kerman, Tehran, and Mashhad. Their modeling was based on using the finite difference method for discretizing the differential governing equations (mass, momentum, and/or energy) in the absorber (which they called the “collector”) and in the chimney. They found that the city of Shiraz was the best location for siting a solar chimney power plant among the five Iranian cities covered.

1.2. Goal of the Study

This study provides a collection of simulation-based data about solar updraft tower power plants (SUTPPs), which can help the reader in forming an unbiased view about their value and whether or not they are suitable for the power sector. In particular, the study provides a quantitative assessment of the electricity output from SUTPPs when compared to nine other solar energy technologies (both photovoltaic and concentrated solar power) in the same location. This comparison is made using a standardized metric, which is the energy generation intensity (EGI). It is defined for an electricity generation system as the amount of expected electric energy (kWh) produced during one non-leap year (365 days) per unit area (1 m2) of land occupied by the system [33]. The area normalization incorporated into the EGI formula allows its use in comparing the performance of power systems of different sizes. In addition, it can be used successfully even when the systems do not have a clearly stated electric power capacity. In solar photovoltaic (PV) systems, a peak capacity (at standard test conditions) is available [34,35,36,37]; thus, a power-normalized metric may be used in such cases as kWh/kWp, which means the amount of electric energy generation (in kWh, kilowatt hours) per unit peak capacity power (in kWp, kilowatt peak). However, concentrated solar power systems do not have an equivalent well-defined instantaneous peak capacity power, but they still have well-defined accumulated electric energy generated over one year and a well-defined ground area.
Multiple performance characteristics of an SUTPP that resembles the Manzanares (Spain) pilot plant are demonstrated, with the scenario that this SUTPP is operating in nine different cities/towns (in nine different countries in the northern hemisphere) with a similar latitude near 24°, putting them within the global sunbelt [38,39], where solar radiation is generally high. Including locations from around the world in the analysis helps in expanding the scope of the current study by not focusing on one country with a limited range of interested readers. Contrasting the expected performance of the small-scale SUTPP in different geographic locations (in three continents) shows a large disparity due to strong variations in the climatic conditions throughout the year. The performance characteristics examined and presented here include year-based results, month-based results (for each of the 12 calendar months), and hourly profiles for two particular days that are representative of the extreme summer conditions (21 June) and the extreme winter conditions (21 December) in the northern hemisphere.

1.3. Article Structure

In the next section, the research method is described. Then, some details about the mathematical model for the numerical simulation are provided. Then, a validation section for the modeling tool used (which is “Aladdin”) is presented, where its predictions for the Manzanares (Spain) pilot SUTPP are compared with experimental and other numerical data in the literature. After this, the results for the same pilot SUTPP are provided for nine locations around the world. These results include annual data (sunshine hours and energy generation intensity—EGI), monthly data (sunshine hours and monthly energy generation intensity—MGI), and hourly profiles (hourly energy generation intensity—HGI—and thermal wind speeds) for 21 June and 21 December. In Section 7, some analysis is provided about the efficiencies of the three main elements of an SUTPP. Also, the EGI for the SUTPP in the city of Muscat is compared with the EGI valuesin the same city but for nine other solar energy technologies to illustrate the level of efficiency of SUTPP in general. Finally, concluding remarks are provided.

1.4. Benefits of the Study

This part is used for enumerating some elements provided by the current study, which can be beneficial to a reader interested in solar energy, low-emission power systems, or computer-based modeling:
  • The validation of the Aladdin web tool for numerically modeling solar systems;
  • Contrasting the value of SUTPPs with other solar energy technologies (four PV and five CSP);
  • Estimating the SUTPP energy generation intensity (EGI) in nine countries;
  • Comparing expected monthly sunshine hours and SUTPP electricity in nine countries;
  • Analyzing sample hourly profiles (summer and winter) of an SUTPP in nine countries.

2. Research Method

The present study falls under the numerical simulation class, with quantitative analysis of data generated by cloud-based computer modeling software that predicts the electricity generated by various types of solar power systems. The simulation tool used here is Aladdin, which is an open computer-aided design (CAD) platform that was developed and released recently by the Institute for Future Intelligence—IFI [40,41].
Aladdin has the capability to simulate photovoltaic (PV) systems, concentrated solar power (CSP) systems, solar updraft tower (SUT) systems, and wind energy systems. It includes automated design optimization using biologically inspired artificial intelligence (AI) techniques, such as genetic algorithms (GAs). The version used in the current study is 0.7.0, released on 21 January 2023. The simulation cases can be saved and retrieved online (cloud-based) and also can be saved and uploaded as offline computer files (with the file extension “ala”). Aladdin allows the user to construct the energy system through built-in elementary units (such as PV panels, and parabolic dishes) and examine their annual, monthly, daily (on a user-selected day), or hourly (on a user-selected day) performance at a user-selected geographic location (with weather data available from more than 800 locations around the world). The Aladdin platform also provides pre-prepared tutorial examples. The Manzanares (Spain) SUTPP studied here is one of the built-in tutorials that already come with the platform.
Solar radiation modeling in Aladdin is based on ray optics while considering the effects of attenuation by the air mass (AM), radiation diffusion in the sky, radiation reflection by the ground surface, and sky clearness as determined from the weather data of the location selected for the simulation [42]. The Aladdin project was supported through funding from the U.S. National Science Foundation—NSF [43]. Reported comparisons between measured and predicted daily solar insolation (kWh/m2/day) for each of the 12 months of the year at the city of Tucson (in the state of Arizona, U.S.A.) show good agreement with measurements [44].

3. Description of the SUTPP Mathematical Modeling

Details about the mathematical model for the SUTPP can be found in the work of Teja et al. [45]. This section provides equations that describe how some quantities are estimated for predicting the behavior of an SUTPP.
The mass flow rate of the collected air is [46]
m ˙ = ρ   v   A c
Air is treated as an ideal gas [47] with a specific gas constant of 287 J/kg/K [48]. Thus, the density is related to the ambient pressure and the ambient temperature as [49]
ρ = p o R a i r ( T o + 273.15 )
The addition of (273.15) to the ambient (outdoor) temperature ( T o ) in the above equation converts it from being expressed in terms of a relative scale to being expressed as an absolute temperature, in kelvins (K) [50]. The system-level energy simulator Aladdin used here provides more than one option to model the variation in the ambient air temperature during the day. The option used here is a sinusoidal profile, with the peak occurring in the afternoon.
The air velocity at the bottom of the chimney, which is the upstream condition for the wind turbine inside the chimney, is
v = 2   g   H Δ T T o + 273.15
The net heat flux passed through the absorber to the air is used to raise the temperature of that air, according to
q n e t   A a = m ˙   C p   Δ T
This net heat flux is the result of transmitted incidental solar radiation with losses at the absorber surface (roof) due to emitted thermal radiation from the absorber itself and due to convective heat transfer, as follows [51]:
q n e t = τ   q i n q L , c o n v q L , r a d
The heat flux of the convective heat loss is estimated as [52]
q L , c o n v = h c o n v T a T o
The convective heat transfer coefficient is taken as 5 W/m2/K, which is suitable for natural convection in air [53]. The absorber temperature is taken as an average of the ambient air temperature and the temperature below the absorber. The latter is assumed to increase linearly in the radial direction toward the chimney.
The heat flux of radiative heat loss is estimated as [54]
q L , r a d = ε   σ   T a + 273.15 4 T o + 273.15 4
where ( σ ) is the Stefan–Boltzmann constant with a value of 5.67 × 10⁻⁸ W/m2/K4 [55].
The electric power generated from the SUTPP is related to the kinetic power of the air available for the turbine by the combined turbine-and-generator efficiency ( η t ) as [56]
P o u t = 0.5   η t   ρ   A c   v 3
Starting with an initial guess, the air temperature rise is updated iteratively. When the iterative process converges, the SUTPP-dependent quantities (such as the air velocity in the chimney, the air mass flow rate, and the electric power output) are computed.
Although the chimney efficiency ( η c ) and the absorber efficiency ( η a ) are neither explicitly specified by the user nor visible in the modeling equations, their expressions are provided below for a more comprehensive presentation
η c = a i r   k i n e t i c   p o w e r a i r   h e a t i n g   r a t e = 0.5   ρ   A c   v 3 m ˙   C p   Δ T
Using Equations (1) and (3), the above expression can be rewritten as
η c = g   H C p ( T o + 273.15 )
η a = a i r   h e a t i n g   r a t e r a d i a t i v e   h e a t i n g   r a t e = q n e t   A a = m ˙   C p   Δ T q i n   A a = τ q L c o n v q i n q L , r a d q i n
Thus, the electric power output can be related to the incoming solar radiative heating by a combined overall power plant efficiency that is the product of the three efficiencies of energy conversions taking place within the SUT power plant, as
P o u t q i n   A a = η a   η c   η t

4. Validation Case

As a test of the accuracy of the simulation tool used here, a test case is presented first before the main set of simulations. In the test case, the small Manzanares (Spain) SUT power plant is modeled and its predicted performance is compared with experimental and other numerical results in the literature.
The pilot SUTPP was a collaborative project, where the site in Manzanares was made available by the Spanish utility company “Union Electrica Fenosa”, while funding was provided by the German Ministry of Research and Technology (BMFT) of former West Germany (the Federal Republic of Germany) at that time. Manzanares is a Spanish municipality located approximately 160 km south of Madrid.
Table 1 lists some parameters of this test simulation [57,58,59].
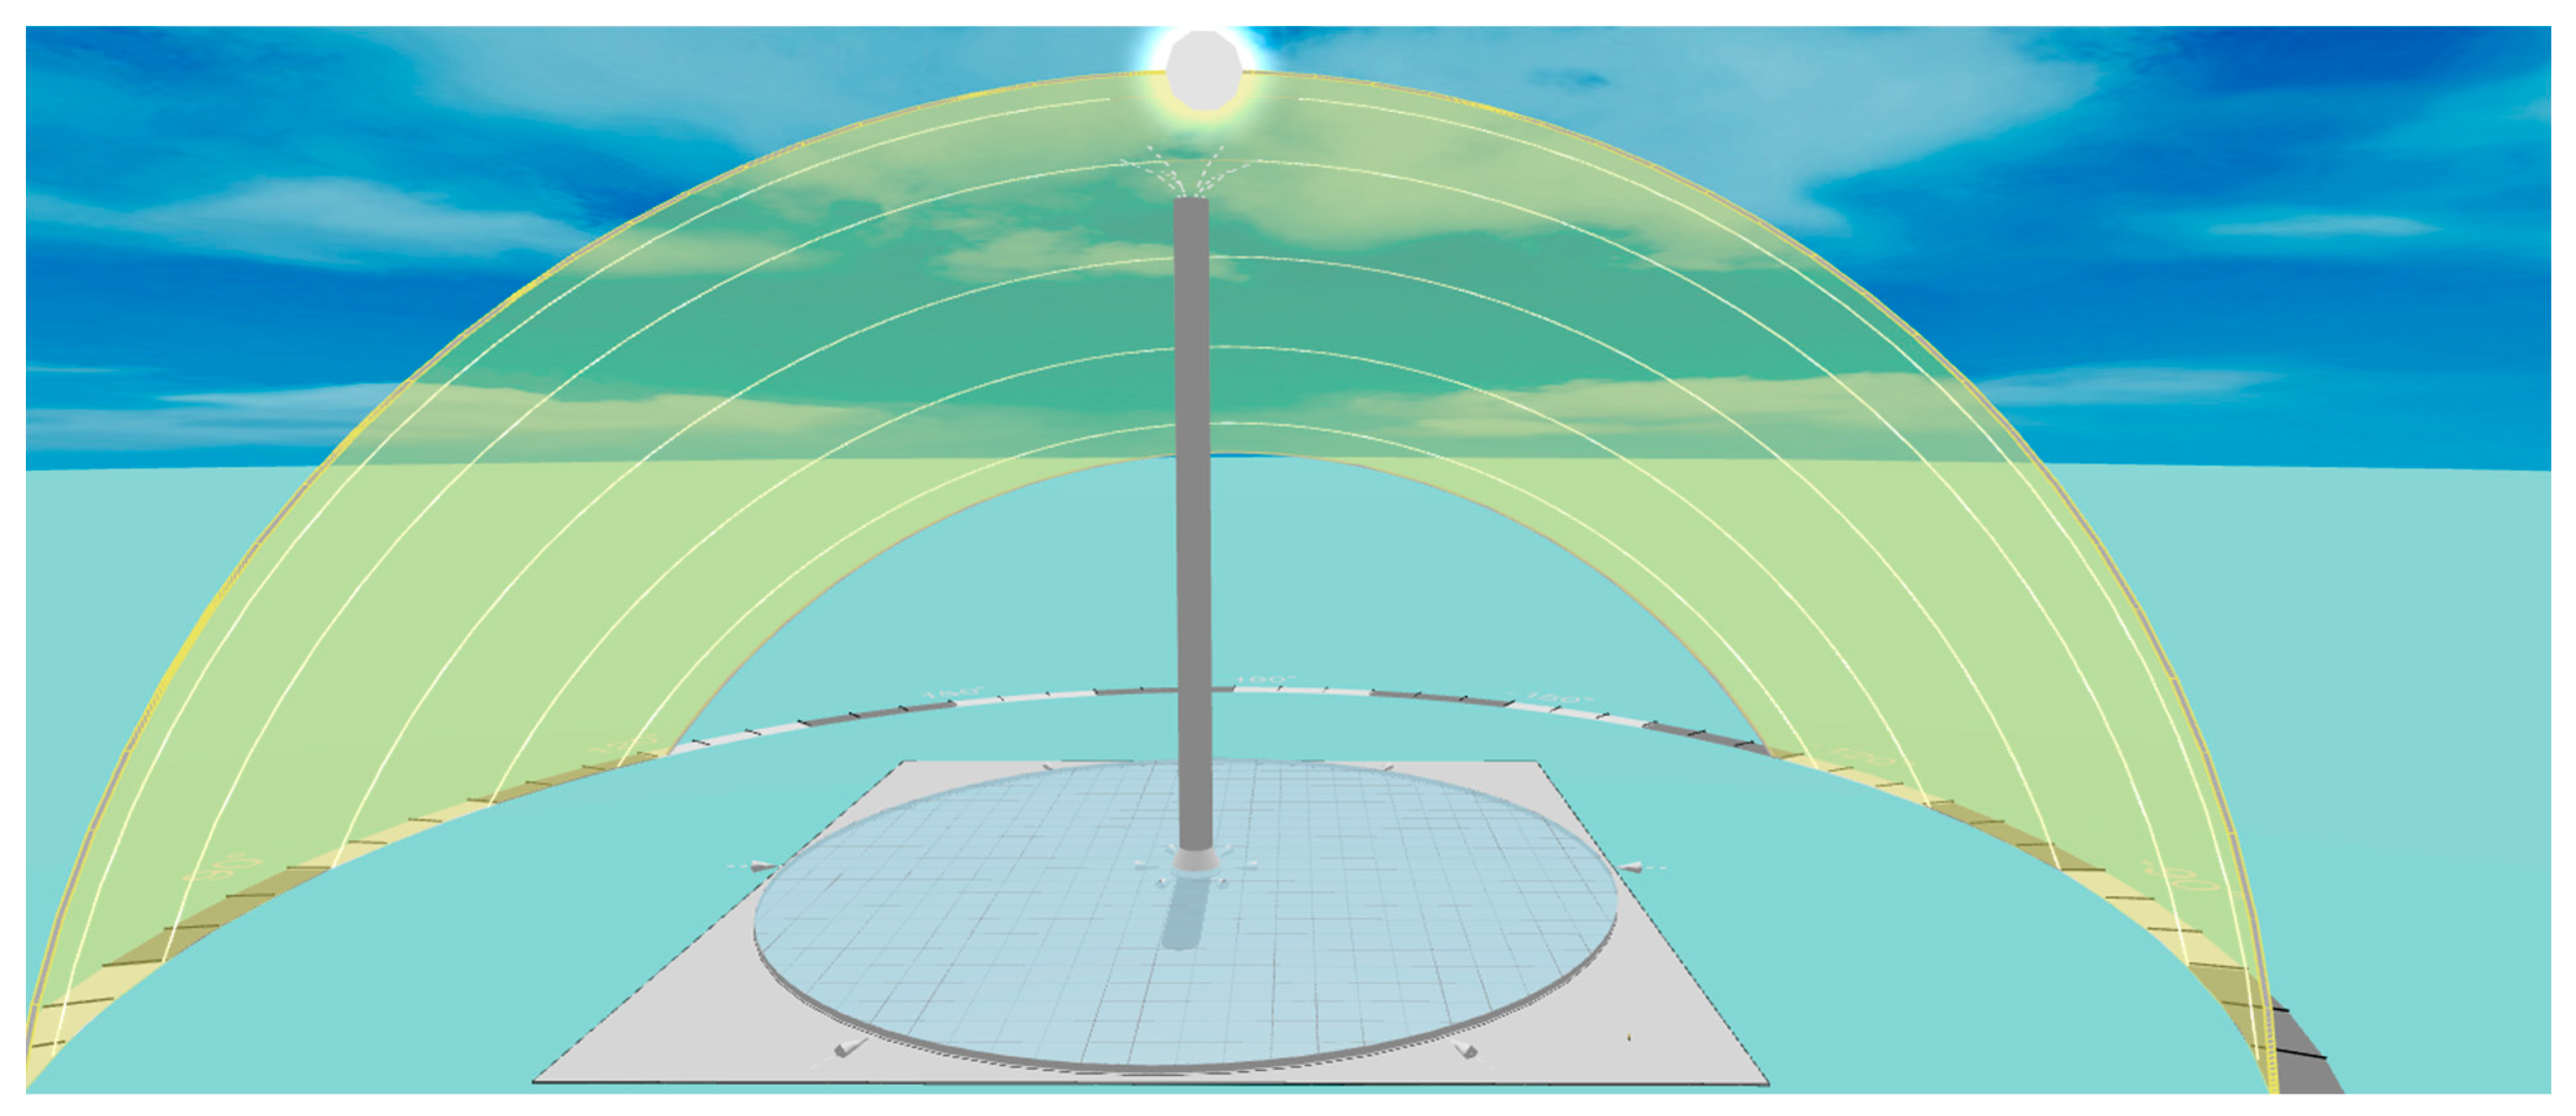
Figure 1 and Figure 2 illustrate the three-dimensional geometric model of the Manzanares pilot SUTPP.
Table 2 summarizes a quantitative assessment of Aladdin as an SUTPP modeling tool by comparing some scalar quantities with those published in other sources. These include sunshine hours, estimated electric power output, estimated air temperature rise in the chimney inlet, and induced thermal wind speed.
The difference (between an Aladdin value and a corresponding independent reference value) is expressed using the following formula:
%   d i f f e r e n c e = 2 | S A l a d d i n S R e f | S A l a d d i n + S R e f × 100 %
where ( S A l a d d i n ) is the value of a general scalar quantity ( S ) as reported by the Aladdin solver, ( S R e f ) is the value of that scalar quantity as reported by an external reference, and S A l a d d i n S R e f is the absolute difference between the two values. This formula simply normalizes the absolute difference with the mean of the two values being compared.
Regarding the solar radiation used in parts of the comparisons, it was obtained using the Typical Meteorological Year (TMY) web tool, which allows downloading hourly profiles of solar radiation data in arbitrary locations. It was used with the aid of another web tool, which is the Hourly Radiation Data tool. Both tools are parts of the online suite of solar design tools called the PVGIS (Photovoltaic Geographical Information System), which was developed by the Joint Research Centre (JRC) of the European Commission (EC). The PVGIS version used here is 5.2. It was announced on 1 March 2022 [60], and it was the latest release when this study was conducted. The time associated with the hourly global horizontal irradiation (GHI) from PVGIS is expressed in terms of the coordinated universal time (UTC) without considering a daylight savings offset. On the other hand, the time used in Aladdin (which is associated with the hourly profiles of electric output) is solar time. Given the longitude of Manzanares in Spain, being 3.37° W, thus close to 0° (the prime meridian), the difference between the two times is small, limited to 12 min and 6 s on 21 December and to 14 min and 56 s on 21 June [61,62]. This small difference is ignored here in this validation section. Furthermore, this small shift between the time systems does not have any influence on the main simulations of this study (in nine cities other than Manzanares) because only the solar time of Aladdin is used when presenting any hourly profile.
Table 2. Quantitative validation of Aladdin modeling of SUTPPs by comparisons with external results.
QuantityAladdin ValueReference Value% DifferenceReference
Annual sunshine hours in Albacete 1 (Spain)2787.02707.72.89%Weather station data [63]
June sunshine hours in Albacete (Spain)318.0303.44.70%
December sunshine hours in Albacete (Spain)134.0137.32.43%
Annual sunshine hours in Muscat 2 (Oman)3493.33493.30.00%
June sunshine hours in Muscat (Oman)325.7325.70.00%
December sunshine hours in Muscat (Oman)267.0267.00.00%
Peak electric power on June 8 (kW or kWh/h)54.204910.08%measurements [64]
Maximum air temperature rise (°C)15.83 3177.13%
Maximum induced air speed (m/s)14.18 31216.65%
Electric power with 1000 W/m2 solar radiation (kW or kWh/h)54.20 454.30.18%Three-dimensional computational fluid dynamics simulation [65]
Electric power with 600 W/m2 solar radiation (kW or kWh/h)28.68 53210.94%
Maximum induced air speed (m/s)14.2514.2030.33%
Electric power with 800 W/m2 solar radiation (kW or kWh/h)45.10 646.63.27%Three-dimensional computational fluid dynamics simulation [66]
1 Albacete is a city and municipality in Spain, located about 150 km east of Manzanares. It is the source of weather data for Manzanares in Aladdin. It has a WMO station number of 8280. Manzanares itself does not have a World Meteorological Organization weather station. 2 The World Meteorological Organization weather station used here is at Seeb “or Al Seeb” (which is a district or town within Muscat). It has a WMO station number of 41,256. 3 Taken as the maximum hourly value on 21 June, corresponding to solar noon. 4 With 1004 W/m2 global horizontal irradiation (GHI) on June 8 at noon (coordinated universal time, UTC). 5 Interpolated using GHI of 759 W/m2 and 587 W/m2, on June 8 at 3 p.m. and 4 p.m., respectively (coordinated universal time, UTC). 6 With 792 W/m2 global horizontal irradiation (GHI), on 21 June at 2 p.m. (coordinated universal time, UTC).
It is pleasant to find perfect matching in the sunshine hours (annual and in two example months) in Muscat, which is one of the cities examined in this study as a virtual destination for an SUTPP. Although the deviation in the electric power can be near 10%, this is mitigated by observing that Aladdin predictions come between measurements and computational estimations. Thus, its predictions appear to lie favorably within the range of reported values. Overall, the comparison is considered satisfactory and enables the use of the Aladdin solver for further modeling the same SUTPP structure in different locations.
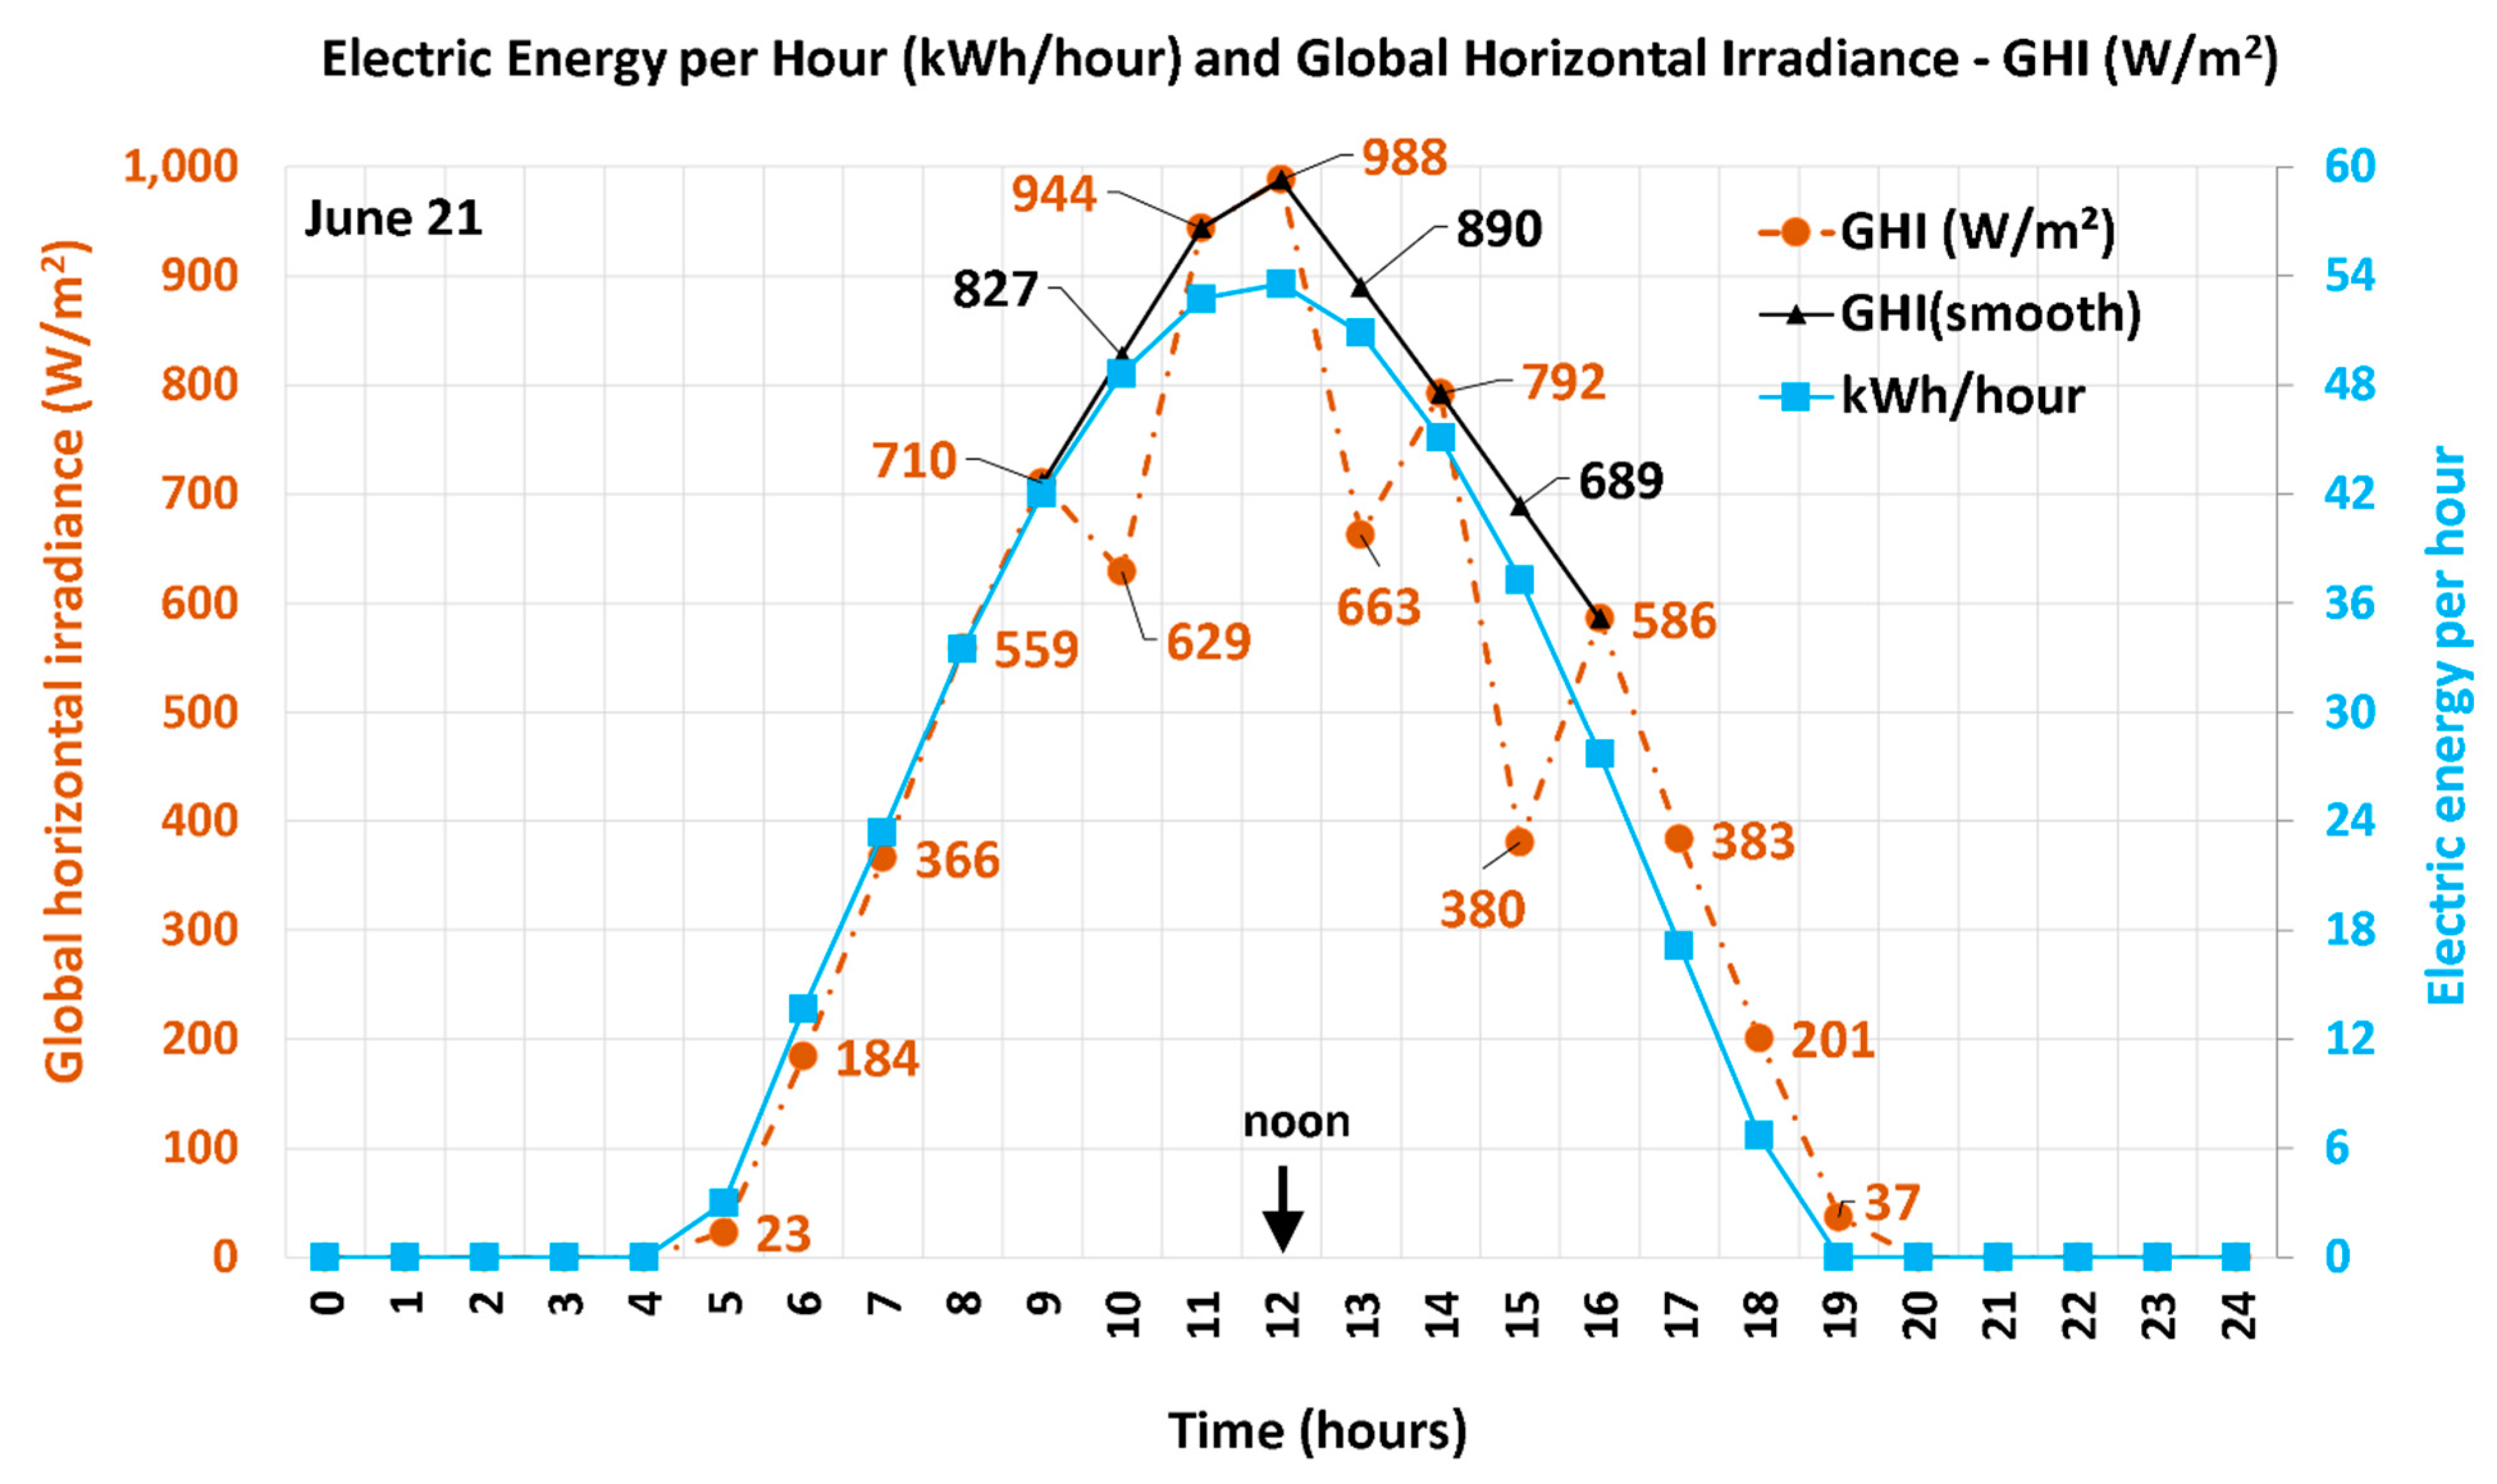
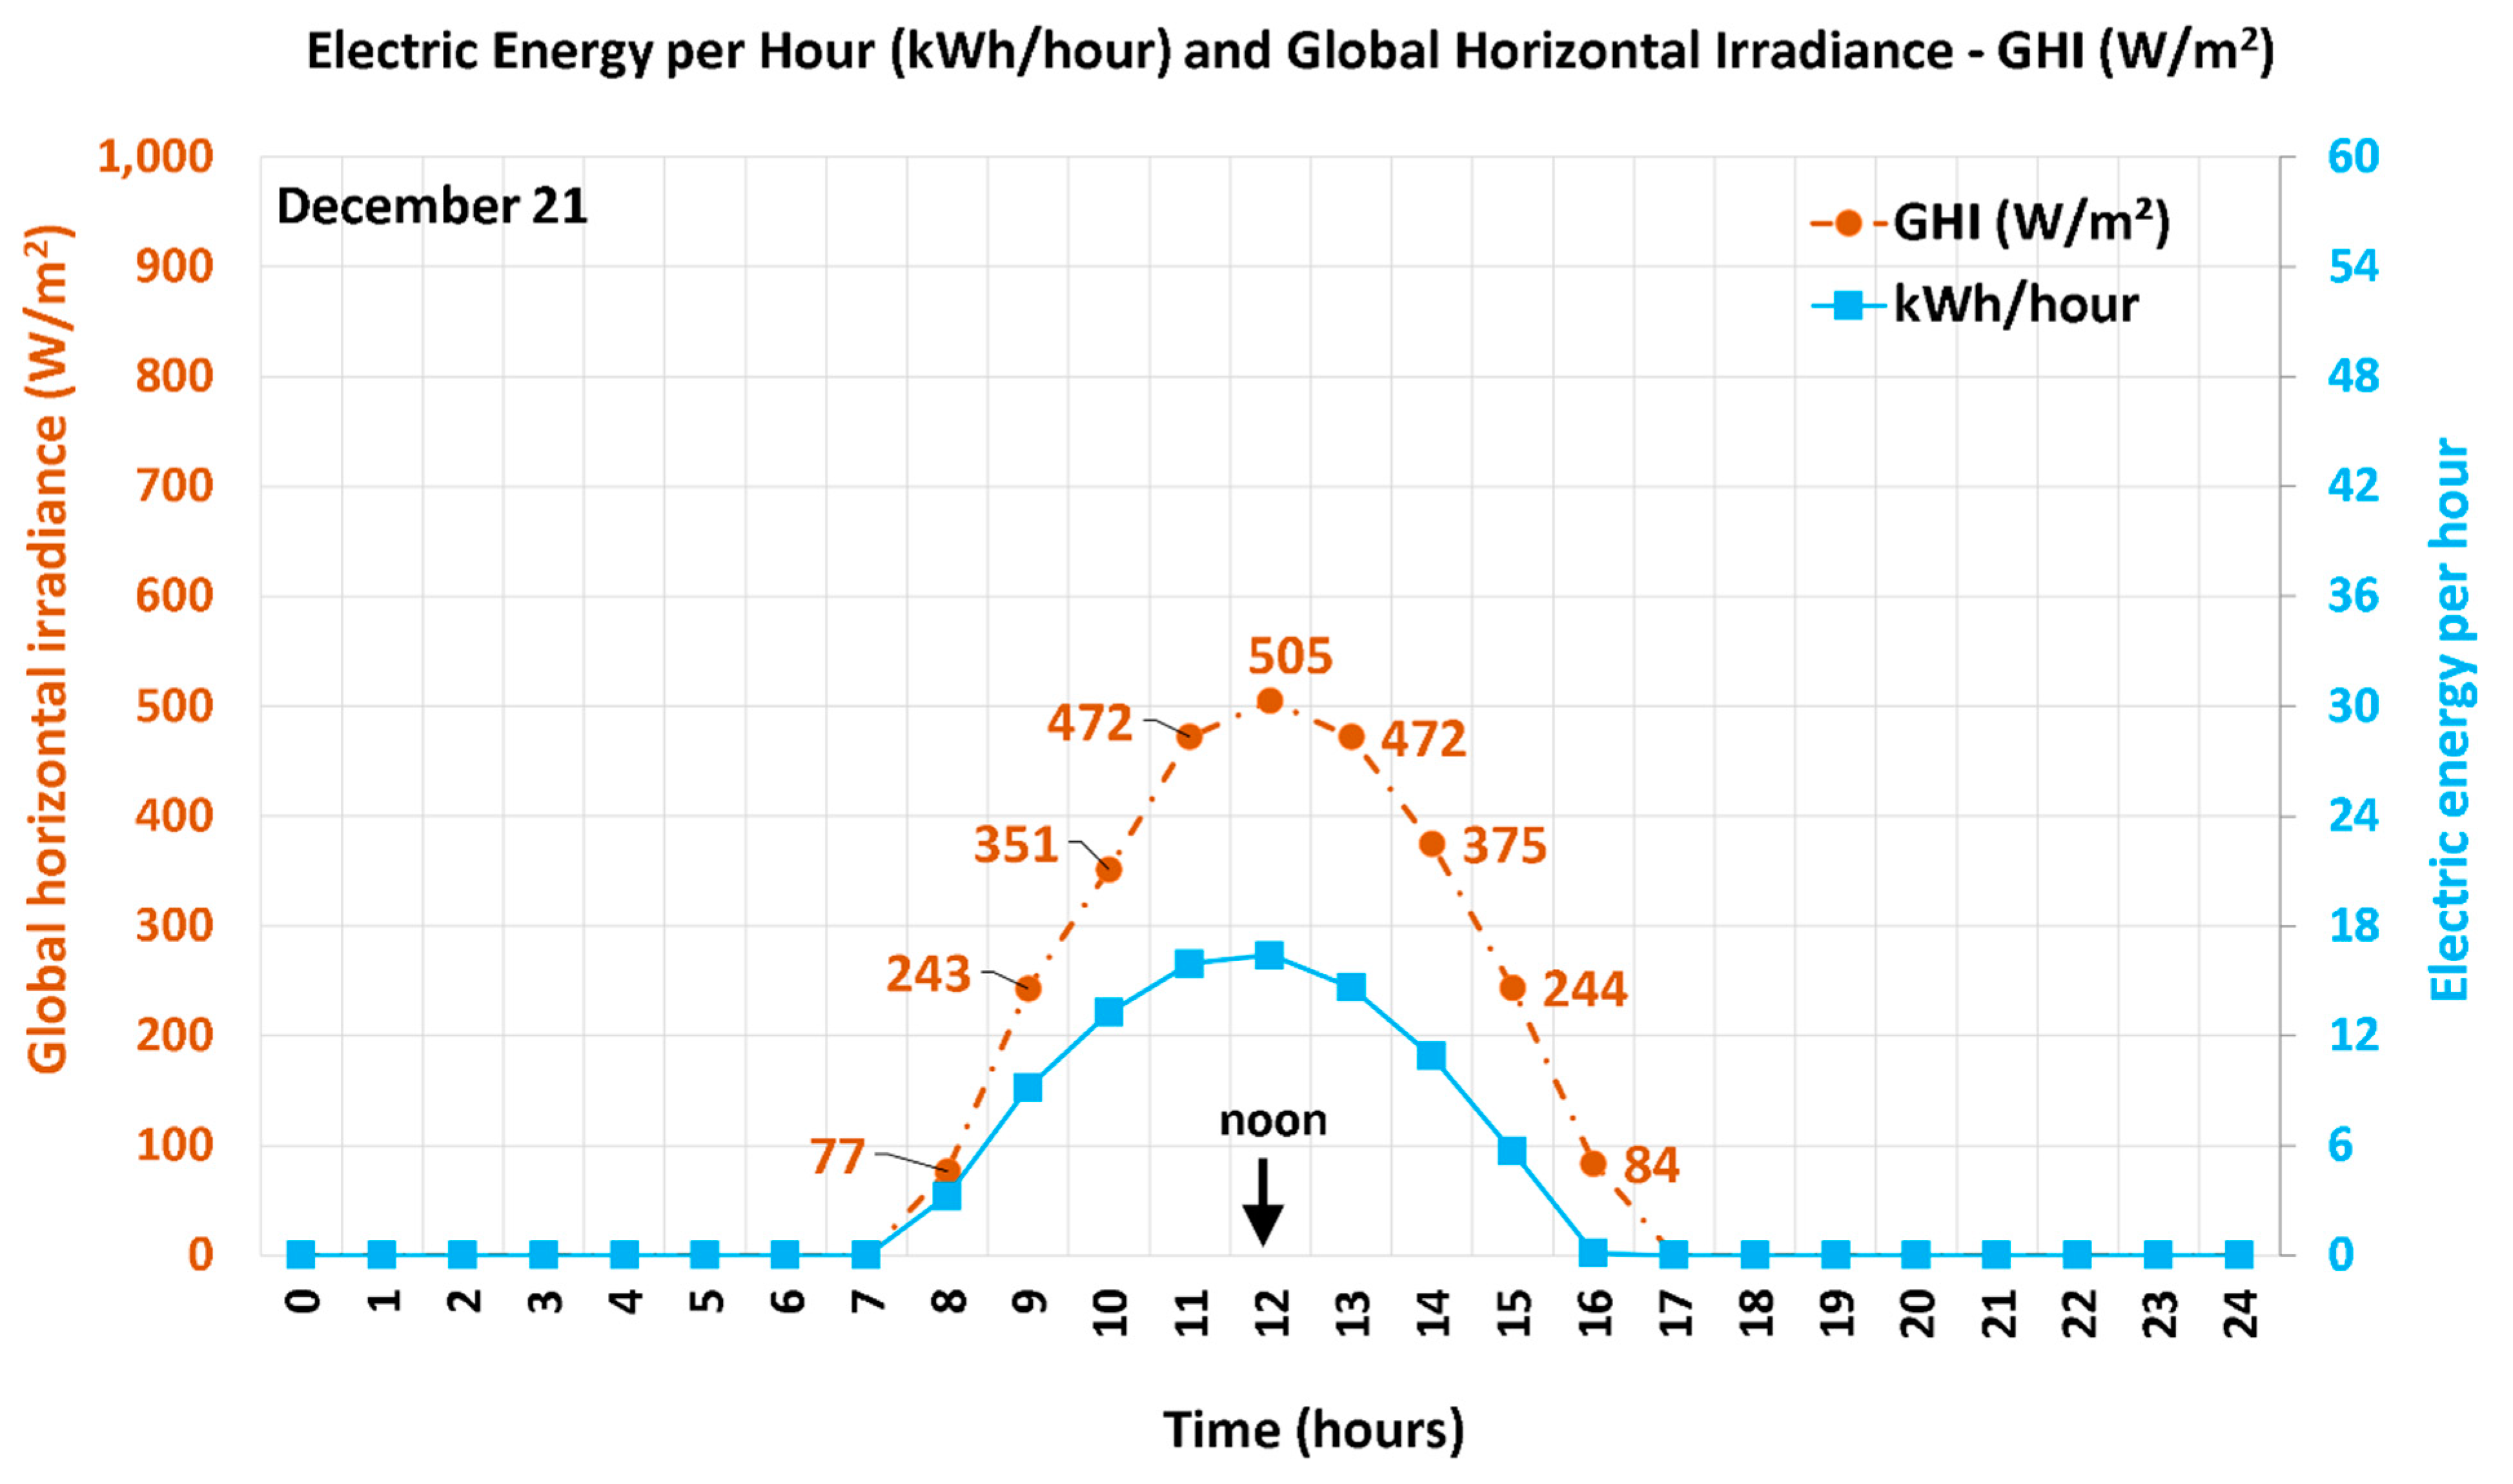
Figure 3 and Figure 4 combine the hourly profiles of the solar radiation and the estimated electric generation for 21 June and 21 December, respectively. The solar radiation for 21 June from PVGIS corresponds specifically to the year 2009, rather than an average over several years. Inspecting radiation data for the same day in the years 2011 to 2020 reveals that the irregular drop in the radiation at three data points (corresponding to 10 a.m., 1 p.m., and 3 p.m.) in the raw data reflects a transient incident rather than a consistent behavior for that particular day. This was remedied by reconstructing the solar radiation at exceptionally low values by linear interpolation using the two adjacent radiation values. This partial reconstruction gives a smoother radiation profile.
Figure 5 represents the solar radiation data and the associated electricity generation in the previous two figures as a scatter plot with a best-fit line. This allows a qualitative assessment of Aladdin predictions by comparing this pattern of data with others, such as the one included in the figure from an independent three-dimensional computer simulation using the commercial Computational Fluid Dynamics (CFD) simulation software ANSYS, Inc (in USA) [67,68,69,70]. The two lines have a similar slope and are separated by a small gap only. A simulation in ANSYS may take 2–6 h, which is very long compared to about one minute using Aladdin (not counting the time consumed in building the geometric model and setting the modeling parameters at the desired values). This is due to the different levels of sophistication involved in the two modeling software programs. ANSYS (or any similar CFD solver in general) discretizes the air space into small volumes (computational cells) that can be hundreds of thousands and iteratively attempts to reach an approximation for the three-dimensional distribution of various flow variables (such as three velocity components and the temperature). While this gives the user a huge number of details about the fluid flow and heat transfer aspects of the problem, they can be significantly beyond the needs of a user who is interested in the system-level results (such as the average air speed in the chimney, rather than the three components of the velocity vector at thousands of points within the chimney).

5. Resolution Sensitivity Test

Numerical methods tend to give approximate, rather than exact, solutions [71]. The approximate solution may depend on the resolution adopted in the modeling [72]. While this is acceptable, the solution should not be very sensitive to small changes in resolution [73,74] as this can reflect inadequate settings.
There are two resolution parameters that the user can select while modeling an SUTPP in Aladdin. One of them represents temporal resolution, which is the sampling frequency (number of samples per hour). The other represents spatial resolution, which is the grid cell size (in meters). Different values were explored and it was found that a value of 4 samples per hour and a 1.0 m grid cell size are adequate. The former is also the default value, while the latter is five times smaller than the default value of 5.0 m. Finer resolutions were permissible, with the finest level being 60 samples per hour and a 0.1 m cell grid size. However, such extreme resolutions can cause the simulation to take a long time without useful improvement in the results. To demonstrate the convergence of the solution in terms of the resolutions, Table 3 compares the predicted annual and daily electric generation for the SUTPP of Manzanares (Spain) in the case of operation in Muscat (Oman), with the adopted resolution and with a higher resolution of eight samples per hour (twice the adopted value) and a 0.5 m cell grid size (half the adopted value). The relative differences are negligible for all three quantities.

6. Results

After establishing a reasonable level of confidence in the simulation approach, its results when used in nine cities in nine different countries are presented.

6.1. Sites of Analysis

The rationale behind selecting the nine specific locations (cities) for SUTPP modeling comes from the desire to have Muscat be one of them. Muscat is the capital of Oman, where this study was prepared, and thus it has a special local importance. In order to make the study of better value and with a much wider international scope, eight other cities were added into the analysis. Thus, a total of nine cities are included here. Four out of these nine sites are the capitals of their countries. When selecting the cities, it was intended to have them at nearly the same latitude (near 24° north). This eliminates the influence of the latitude on the performance of the modeled SUTPP due to its relation with the angular coordinate of the sun and its path [75]. Variations in the performance can still arise from differences in the climate, such as having a season of heavy rains like the so-called “summer wet monsoon” [76] or a season of heavy cloudiness.
Table 4 lists the sites considered for analysis where the performance of the Manzanares (Spain) SUTPP is predicted in them from different aspects in subsequent parts of this study.

6.2. Sunshine Hours

Irrespective of the solar system modeling, users interested in general weather data about arbitrary locations can access useful data in the Weather Data tool in Aladdin. Here, only the sunshine information is discussed, as it strongly affects the performance of a solar power system of any type.
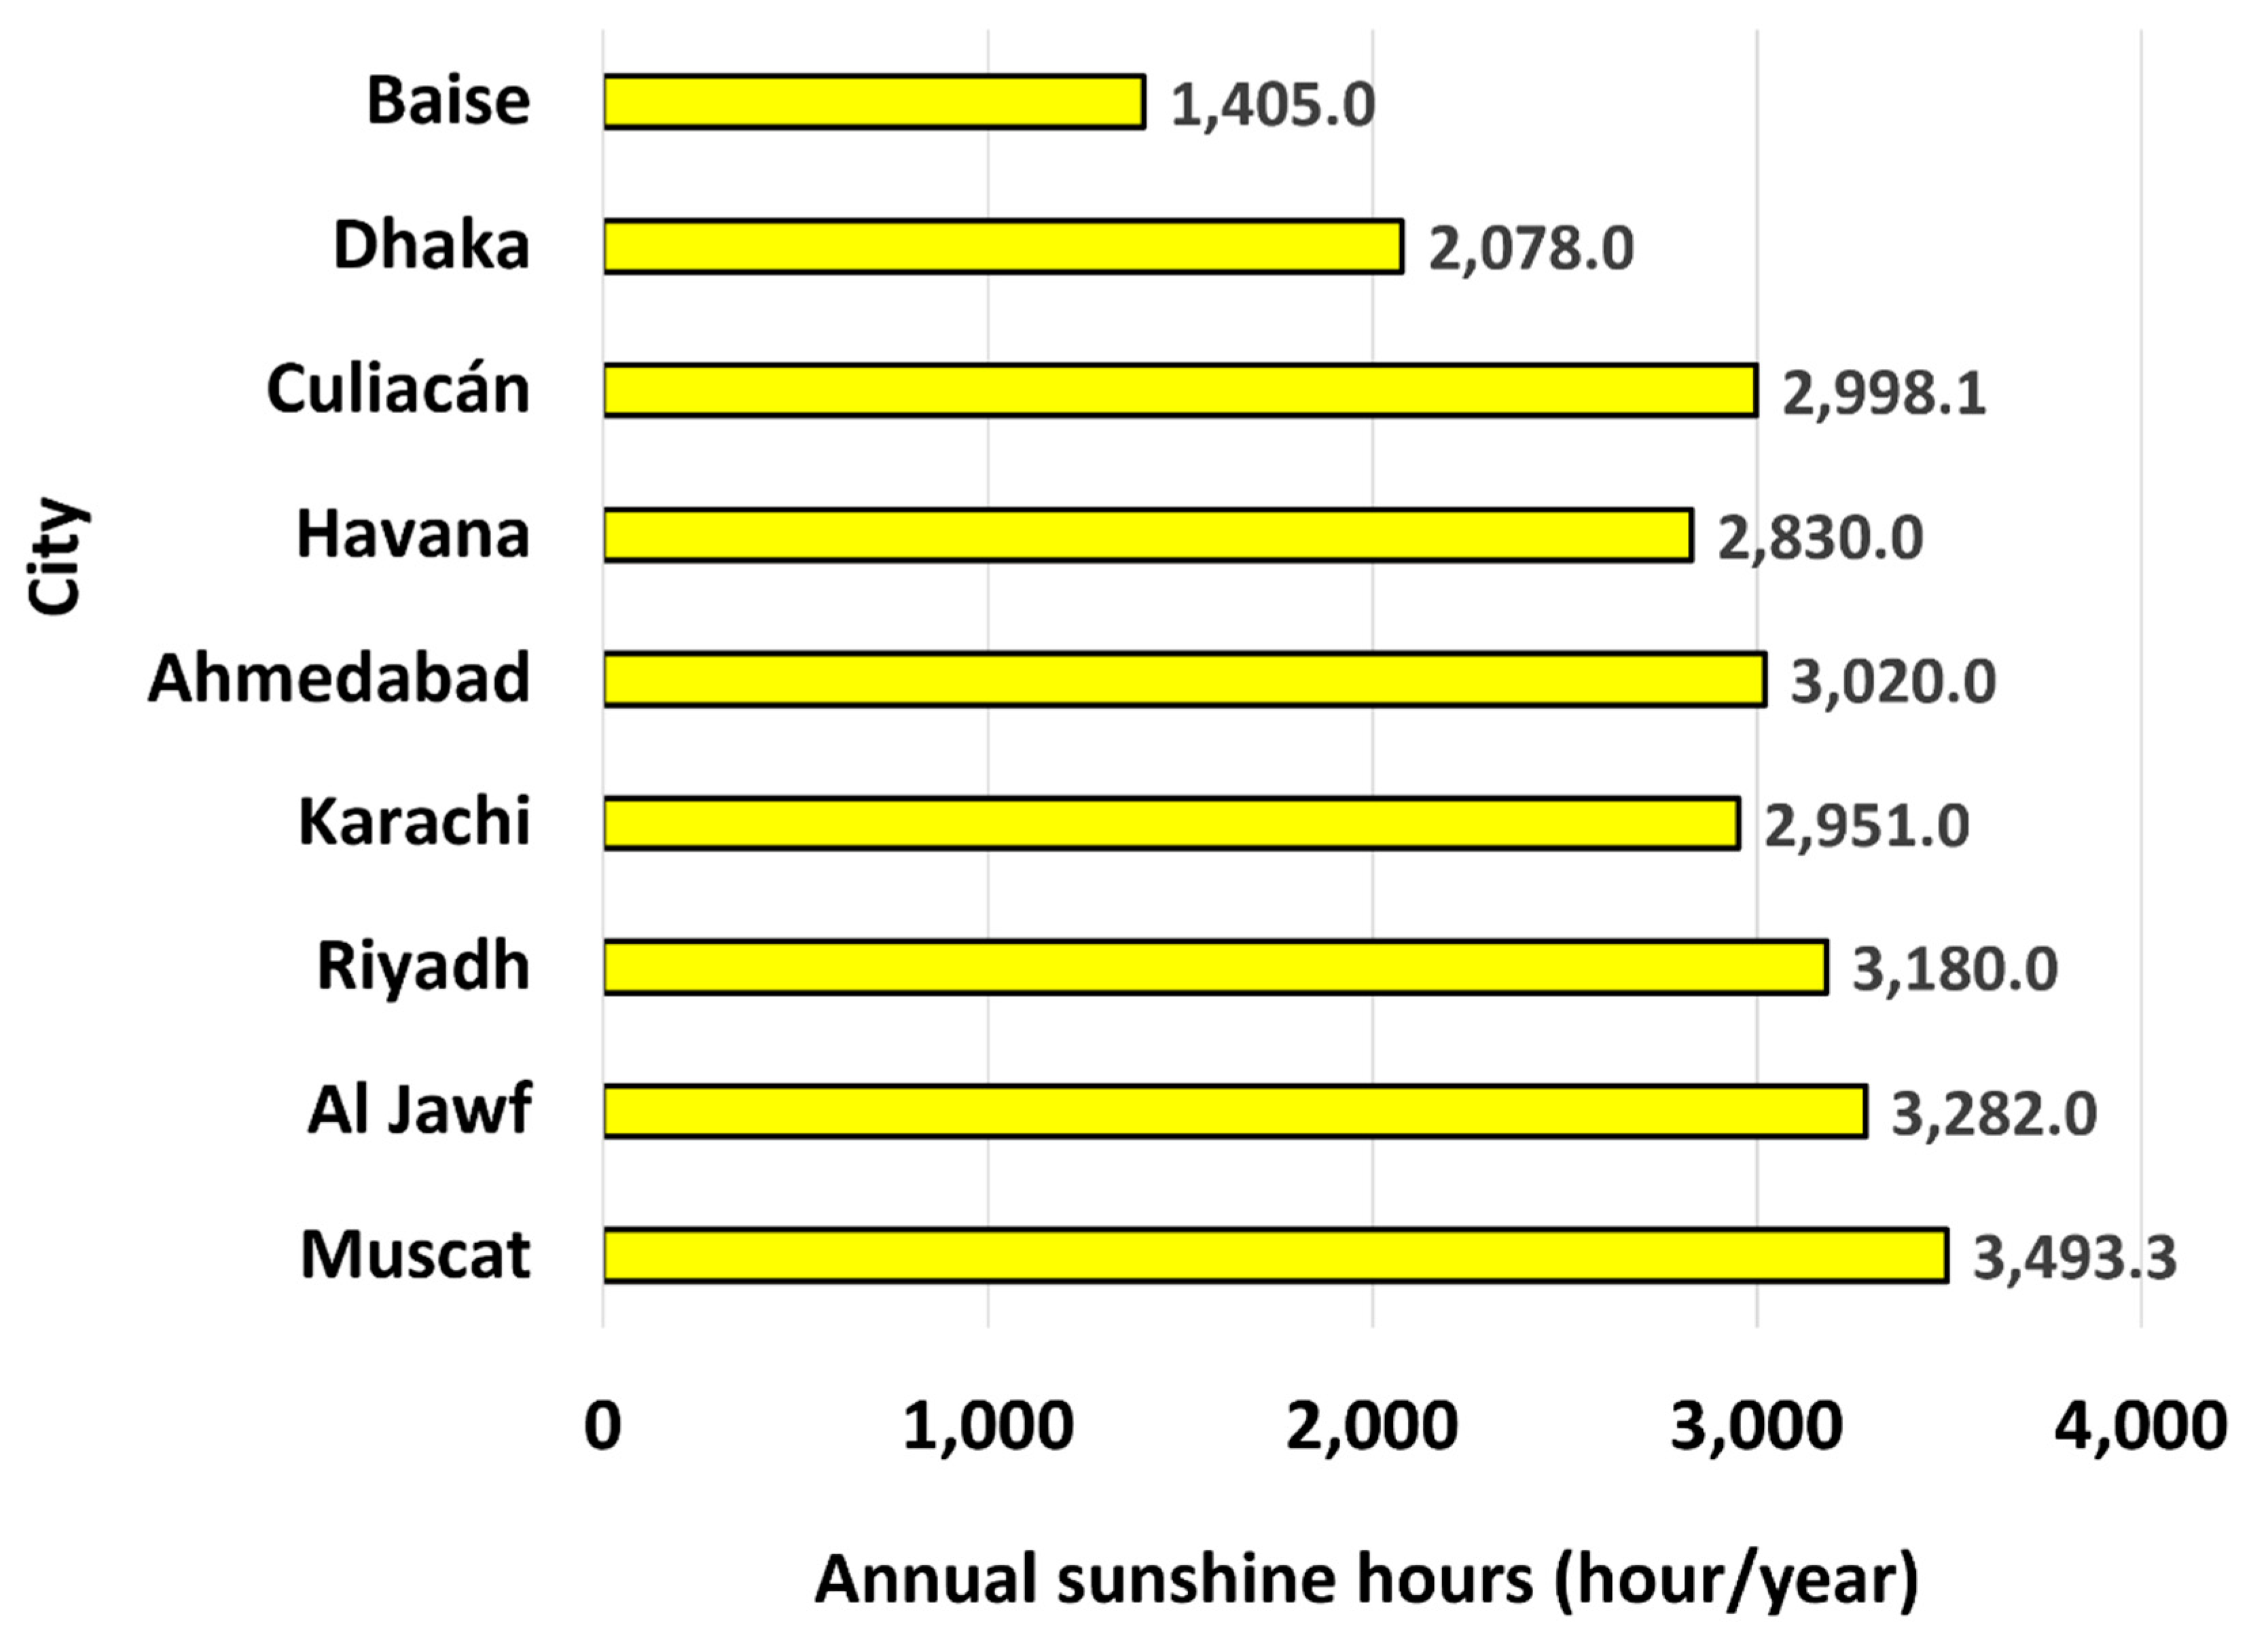
Figure 6 contrasts the annual sunshine hours for the nine cities considered in the current study. Out of 8760 h in a 365-day year, Muscat (Oman) has the largest fraction of sunshine hours at 39.88%. On the other hand, Baise (China) has the smallest fraction at 16.04%.
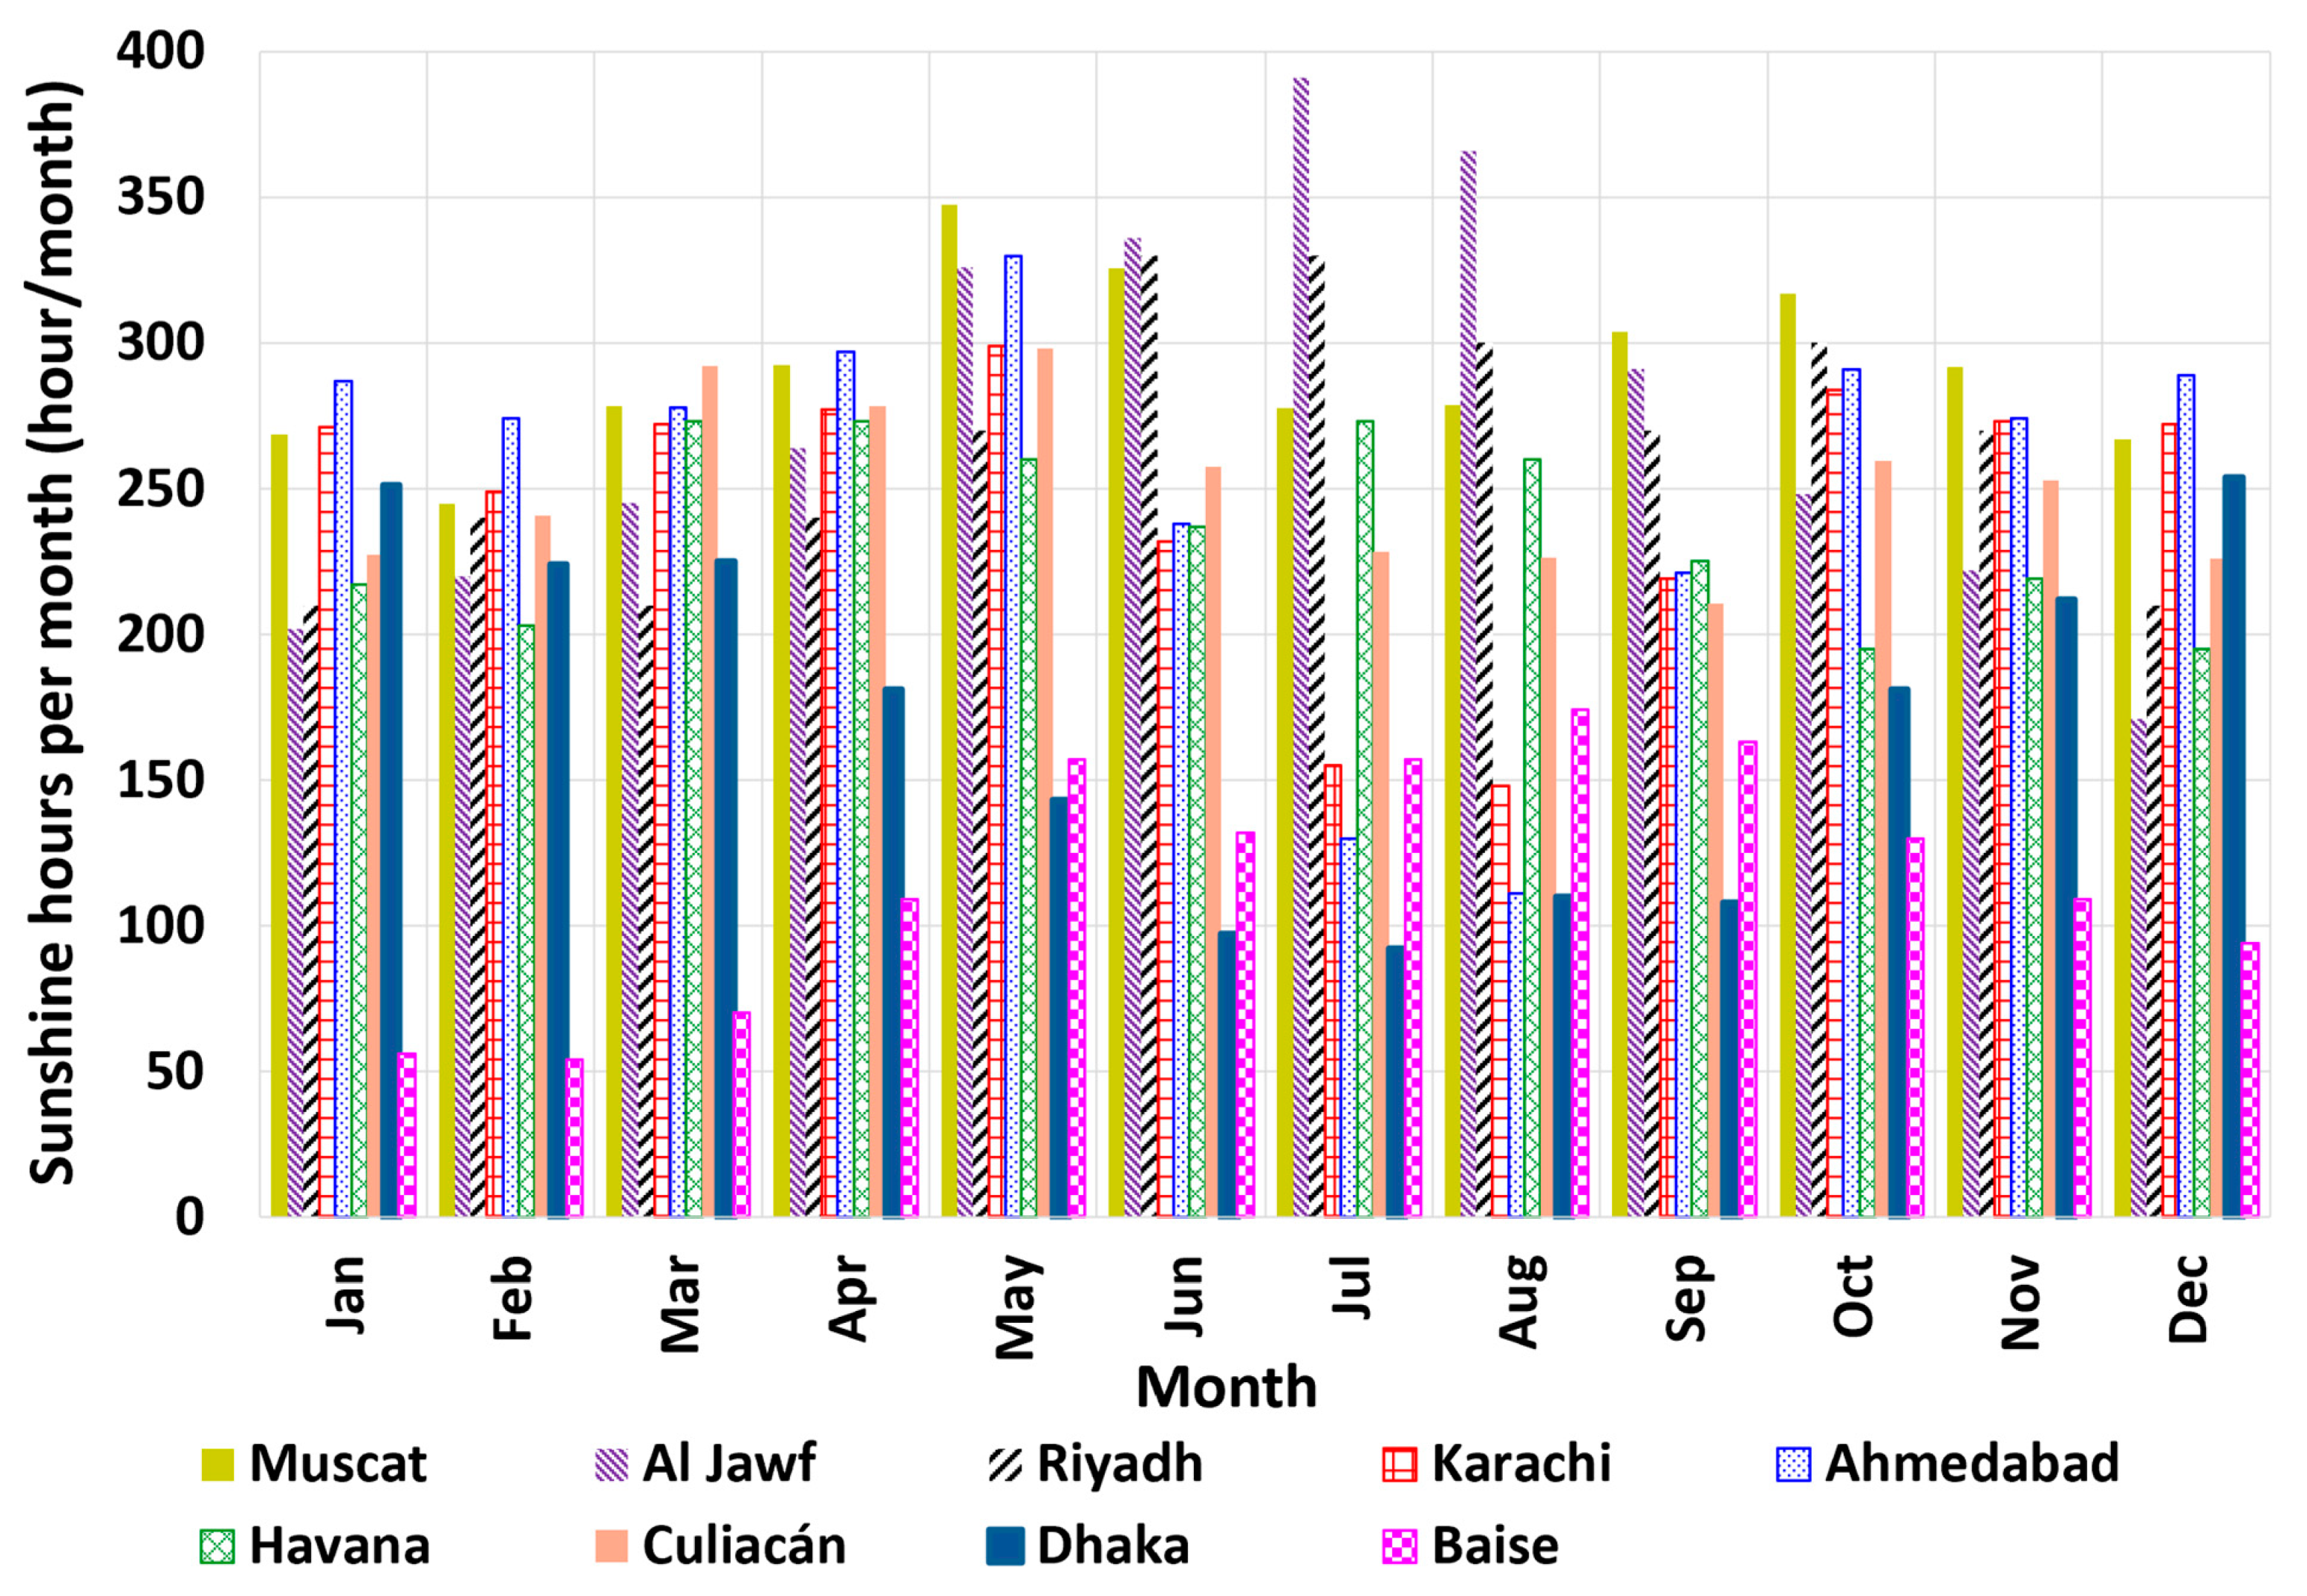
Figure 7 shows the monthly sunshine hours, which can be a powerful tool for understanding the seasonality of the climate and particularly the solar radiation. For example, the dry city of Al Jawf (Libya) tends to have more sunshine hours in the summer [77], while Dhaka (Bangladesh) has the opposite trend, with many rainfall days in the summer, during a season called “wet monsoon” [78,79]. Muscat has more sunshine hours in May compared to June, July, and August, but this can be due to an increased density of particulate matter during the summer period locally [80]. Thus, each site can have its unique climate conditions despite being at a similar distance to the north of the equator.

6.3. Energy Generation Intensities

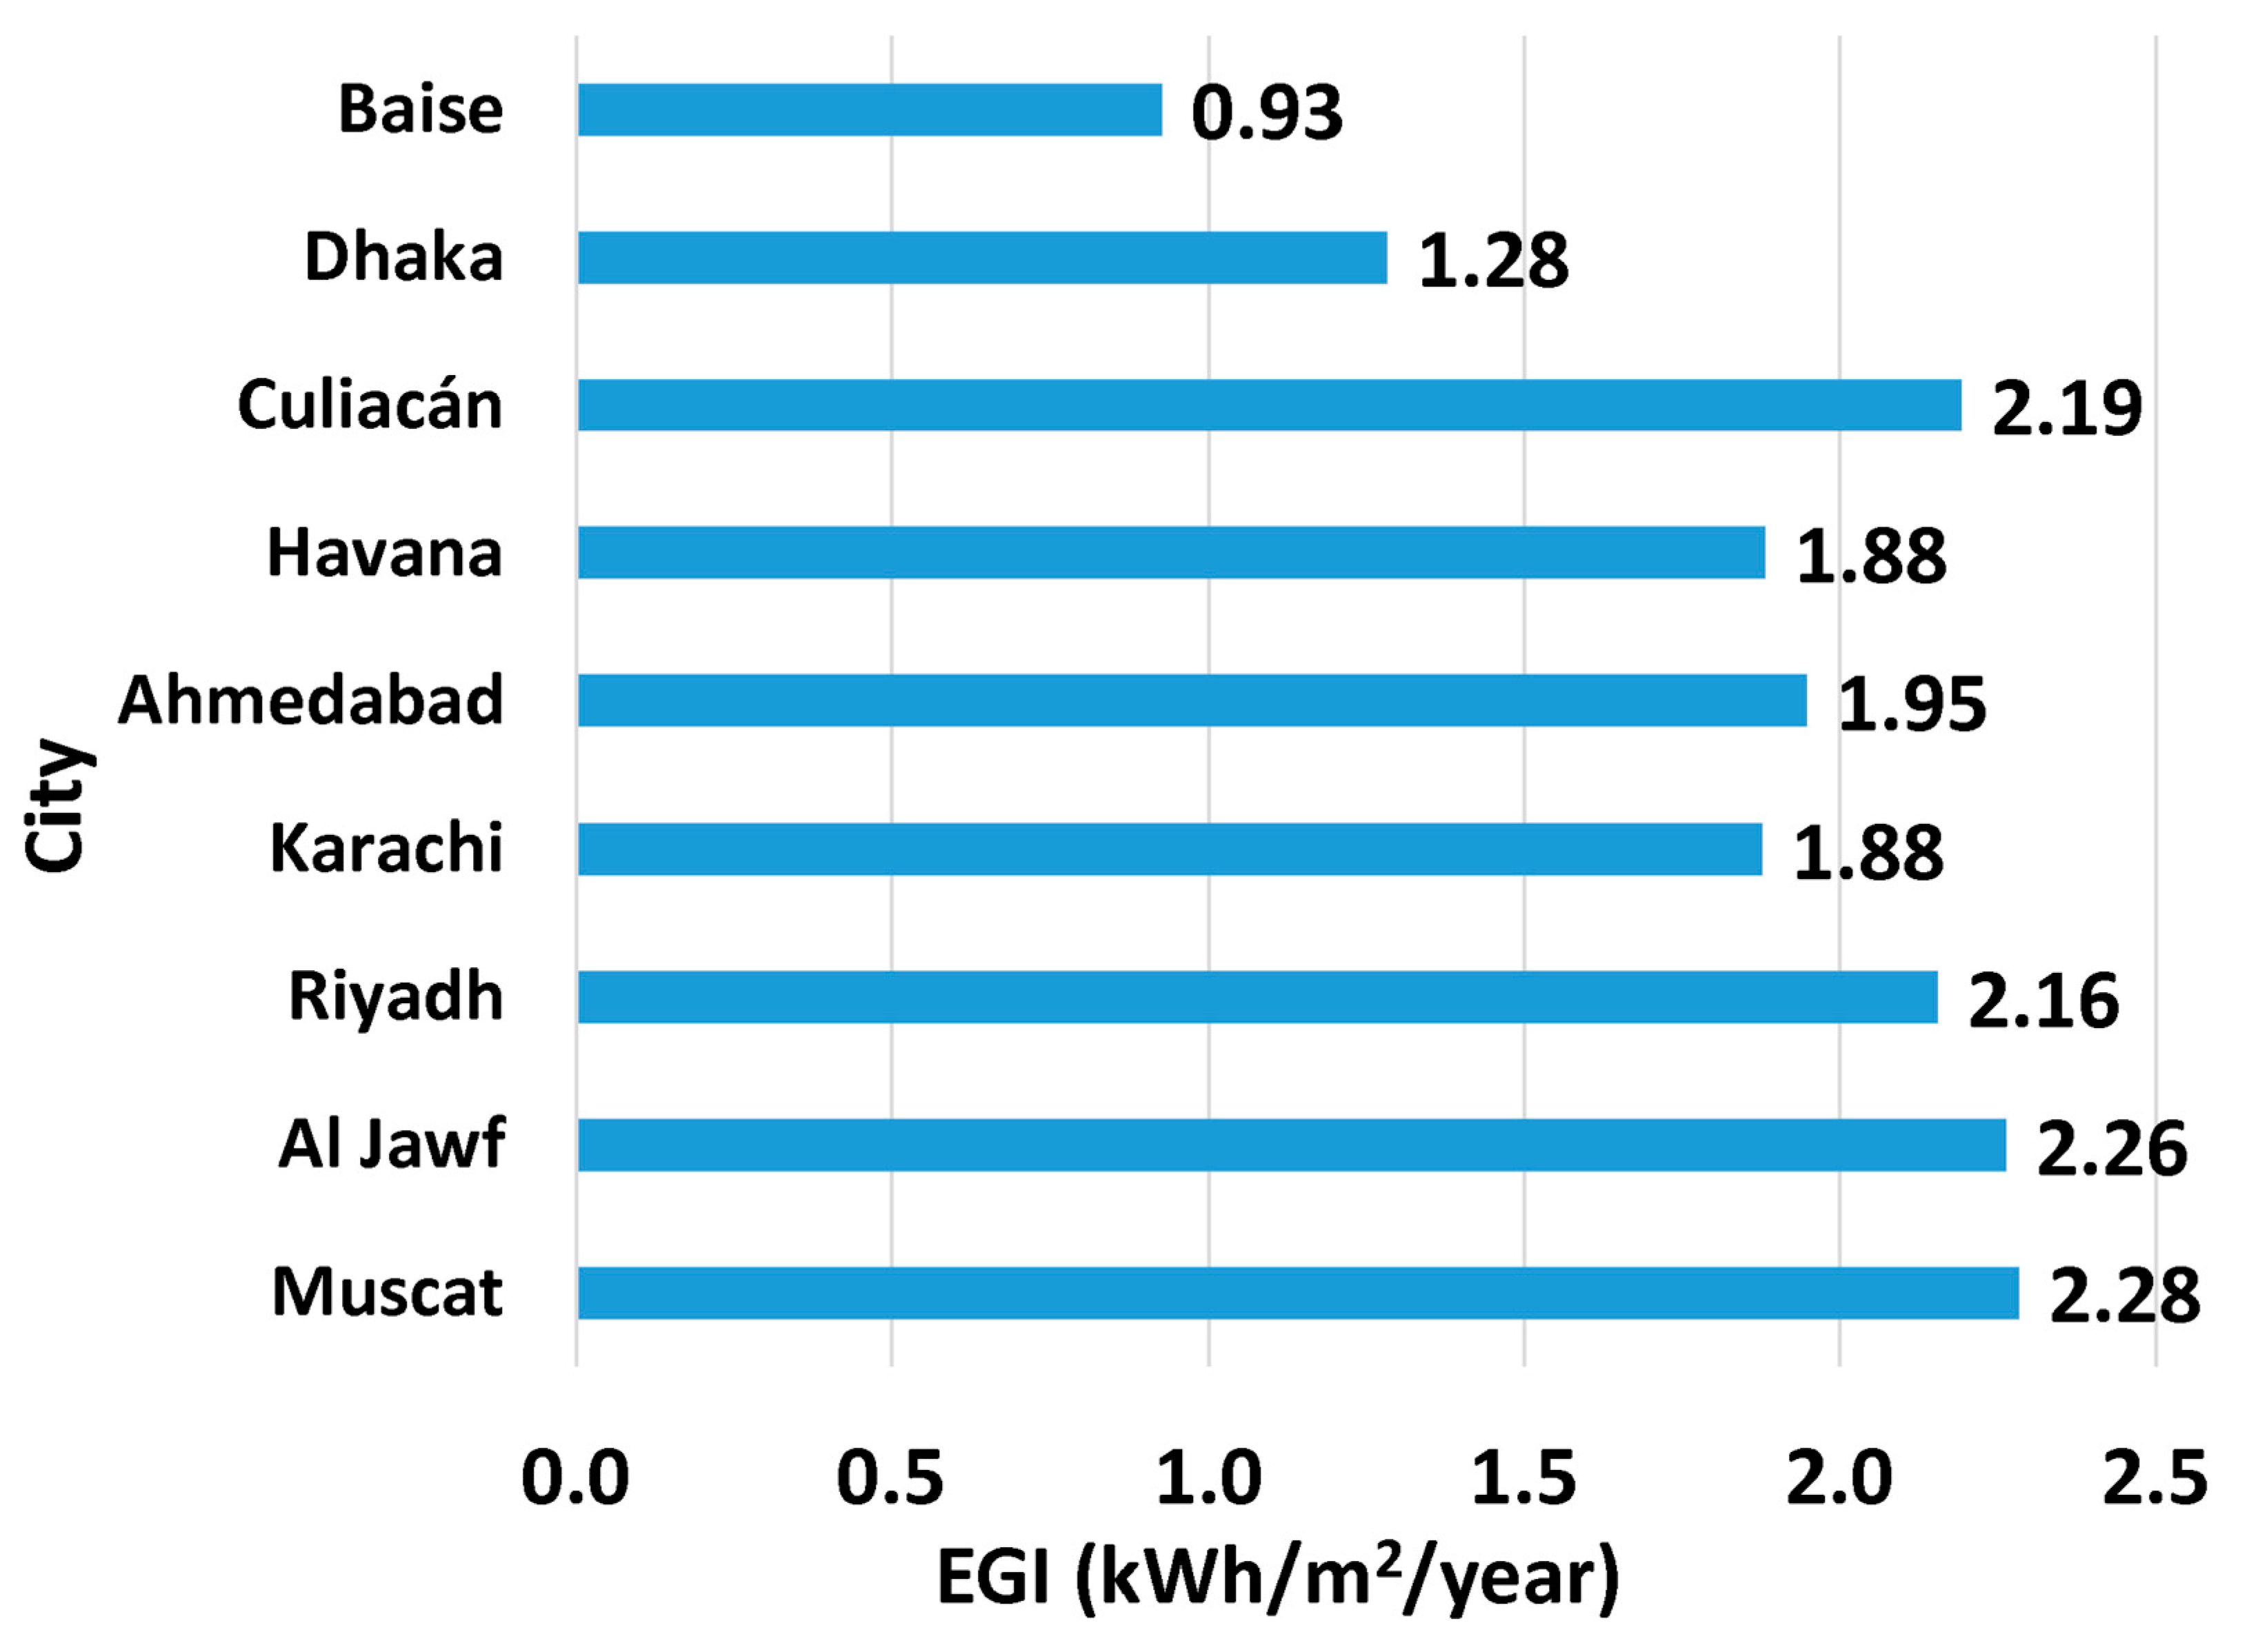
Figure 8 contrasts the energy generation intensity (EGI) values of the nine locations being examined here as potential sites for a solar updraft tower power plant (SUTPP). The EGI value is obtained by dividing the annual expected electric energy output by the land area allocated for the SUTPP. In the current case, the land area is a square with a side length of 244 m. Thus, the land area used for computing all of the energy generation intensities is 244 m2. While the absorber in the simulations has a circular area with a diameter of 244 m, additional space is assumed to be utilized with an overall square foundation. The annual estimated electrical output can be deduced from the EGI value by multiplying it with the constant plant area. For example, the EGI of 1.9478 kWh/m2/year (displayed as 1.95 in the figure after rounding to two decimal places) for the location of Ahmedabad (India) corresponds to an expected annual electric energy of 115,964 kWh/year. When ordered by either the EGI or the annual sunshine hours, the nine locations receive the same order, with Muscat being first (having the highest annual sunshine hours and the highest EGI) and Baise being last (having the smallest annual sunshine hours and the smallest EGI). However, the city-to-city ratios of the annual sunshine hours among these cities are not exactly the same as the city-to-city ratios of the EGI value. In other words, the EGI is not simply related to the annual sunshine hours by a constant multiplier.
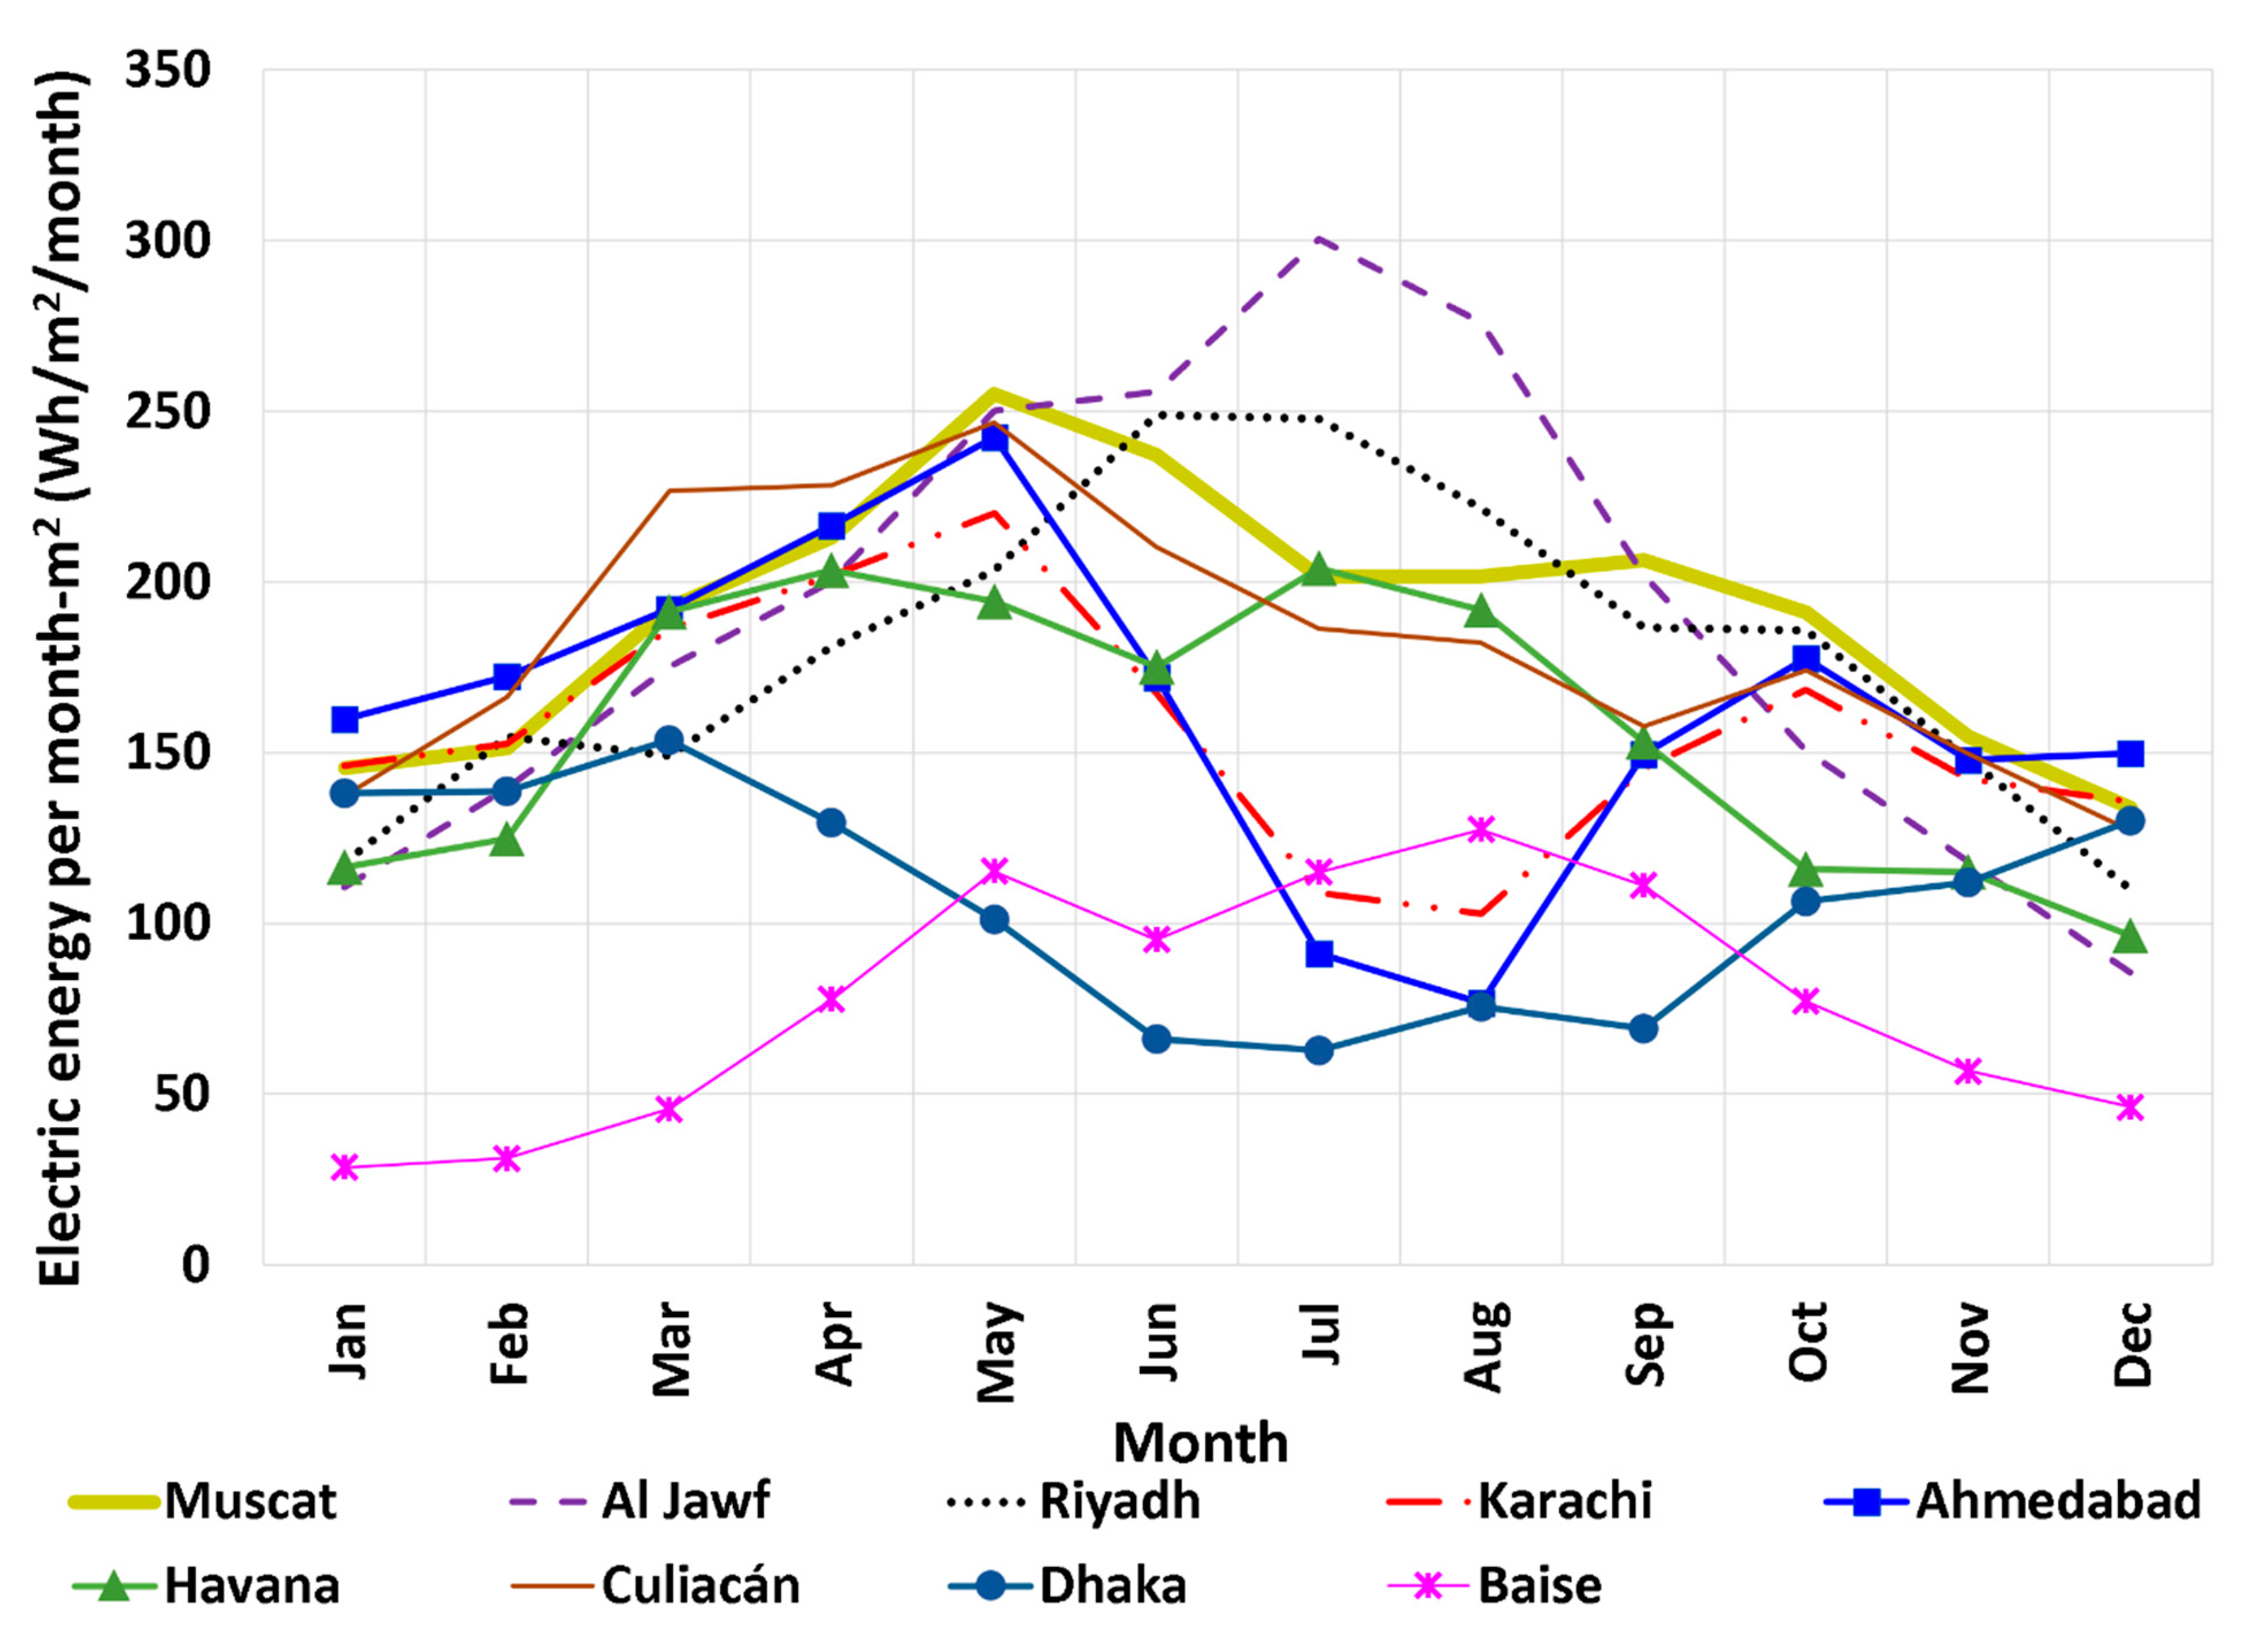
Figure 9 shows the monthly energy generation intensity (MGI) values for the examined sites. It demonstrates large variability among cities as well as among seasons. If a seasonality (or seasonality index) is defined here as the ratio of the maximum monthly electricity generation to the minimum monthly value [81], then processing the MGI data reveals that the seasonality is highest in Baise (China), with a value of 4.48, while it is smallest in Muscat (Oman), with a value of 1.90. The lower the seasonality is, the more regular monthly profile the SUTPP has for electricity generation, thus the better the SUTPP location becomes.

6.4. Daily Results on 21 June and 21 December

After discussing annual and monthly results, this part is limited particularly to 21 June and 21 December as two days that represent extreme summer and winter conditions in the northern hemisphere, respectively. On 21 June, the sun is near its highest elevation and the daylight (assuming a clear sky) is longest in the northern hemisphere, while the opposite occurs on 21 December.
Figure 10 contrasts the daily energy generation intensity (DGI) values for the nine examined sites on 21 June and 21 December. On 21 June, Muscat (Oman) was not the best site, as was the case based on the EGI values, but it is Al Jawf (Libya), with Riyadh (Saudi Arabia) in second place, and Muscat in third place. Also, Baise (China) was not the site with the smallest daily electric generation, but it was Dhaka (Bangladesh), with Baise being the site immediately better than Dhaka. Karachi (Pakistan) is immediately better that Baise, but the gap is big (ratio 1:1.76) between the DGI of the two sites. On 21 December, Ahmedabad (India) was in first (best) place, followed by Karachi, while Baise was in last (worst) place, immediately after Al Jawf.
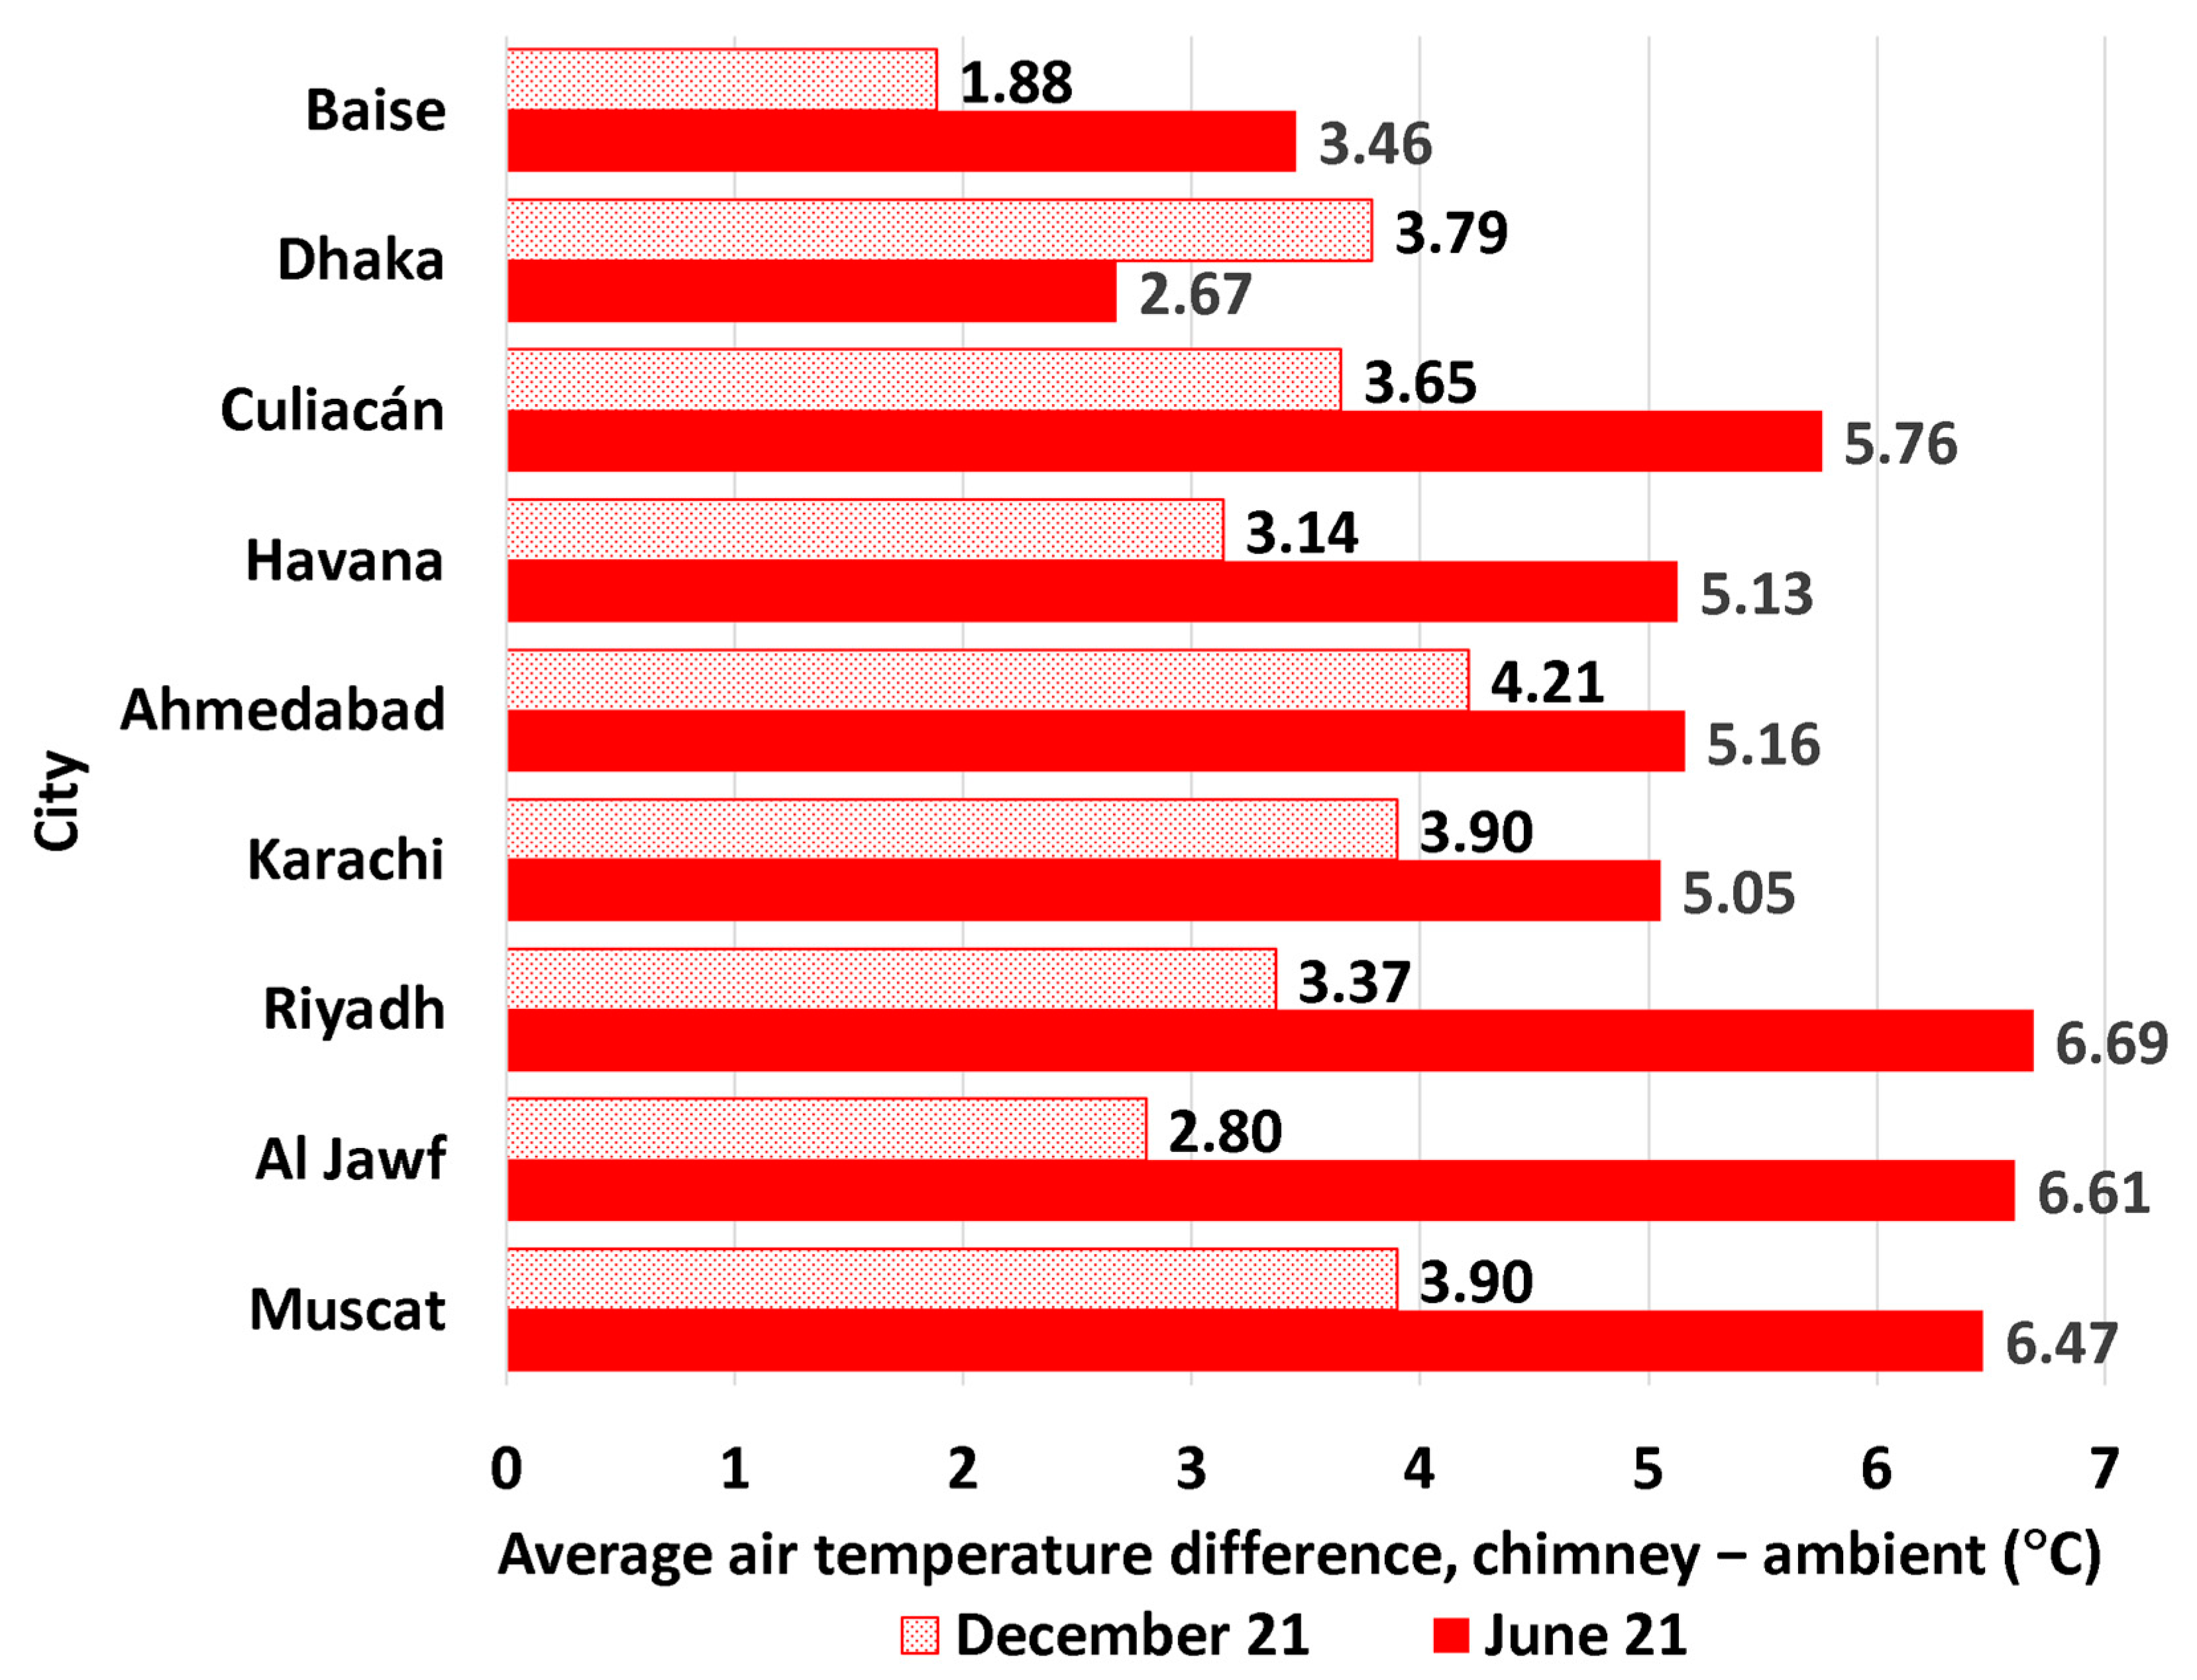
Figure 11 contrasts the average rise in air temperature due to the absorber for the nine examined sites on 21 June and 21 December. This average is computed as the arithmetic mean of 24 h values. Thus, it includes night values (when the temperature rise is zero). Thus, the computed average of the air temperature rise on either 21 June or 21 December is always reduced due to additional night hours where the temperature rise is zero (the air temperature in the chimney is equal to the ambient temperature outside the chimney and absorber), regardless of the change in the temperature rises during the daytime. The overall mean of all 24 values of hourly air temperature rises of all the nine sites (thus, the mean of 216 values, including the null night values) is 5.220 °C on 21 June and 3.404 °C on 21 December. If null (zero) hourly values are excluded, the adjusted overall means (over 125 values for 21 June, but over 90 values for 21 December) increase to 9.020 °C on 21 June and 8.171 °C on 21 December. For either method of averaging, the overall mean is higher on 21 June than on 21 December but excluding the nighttime makes the two overall means closer to each other.
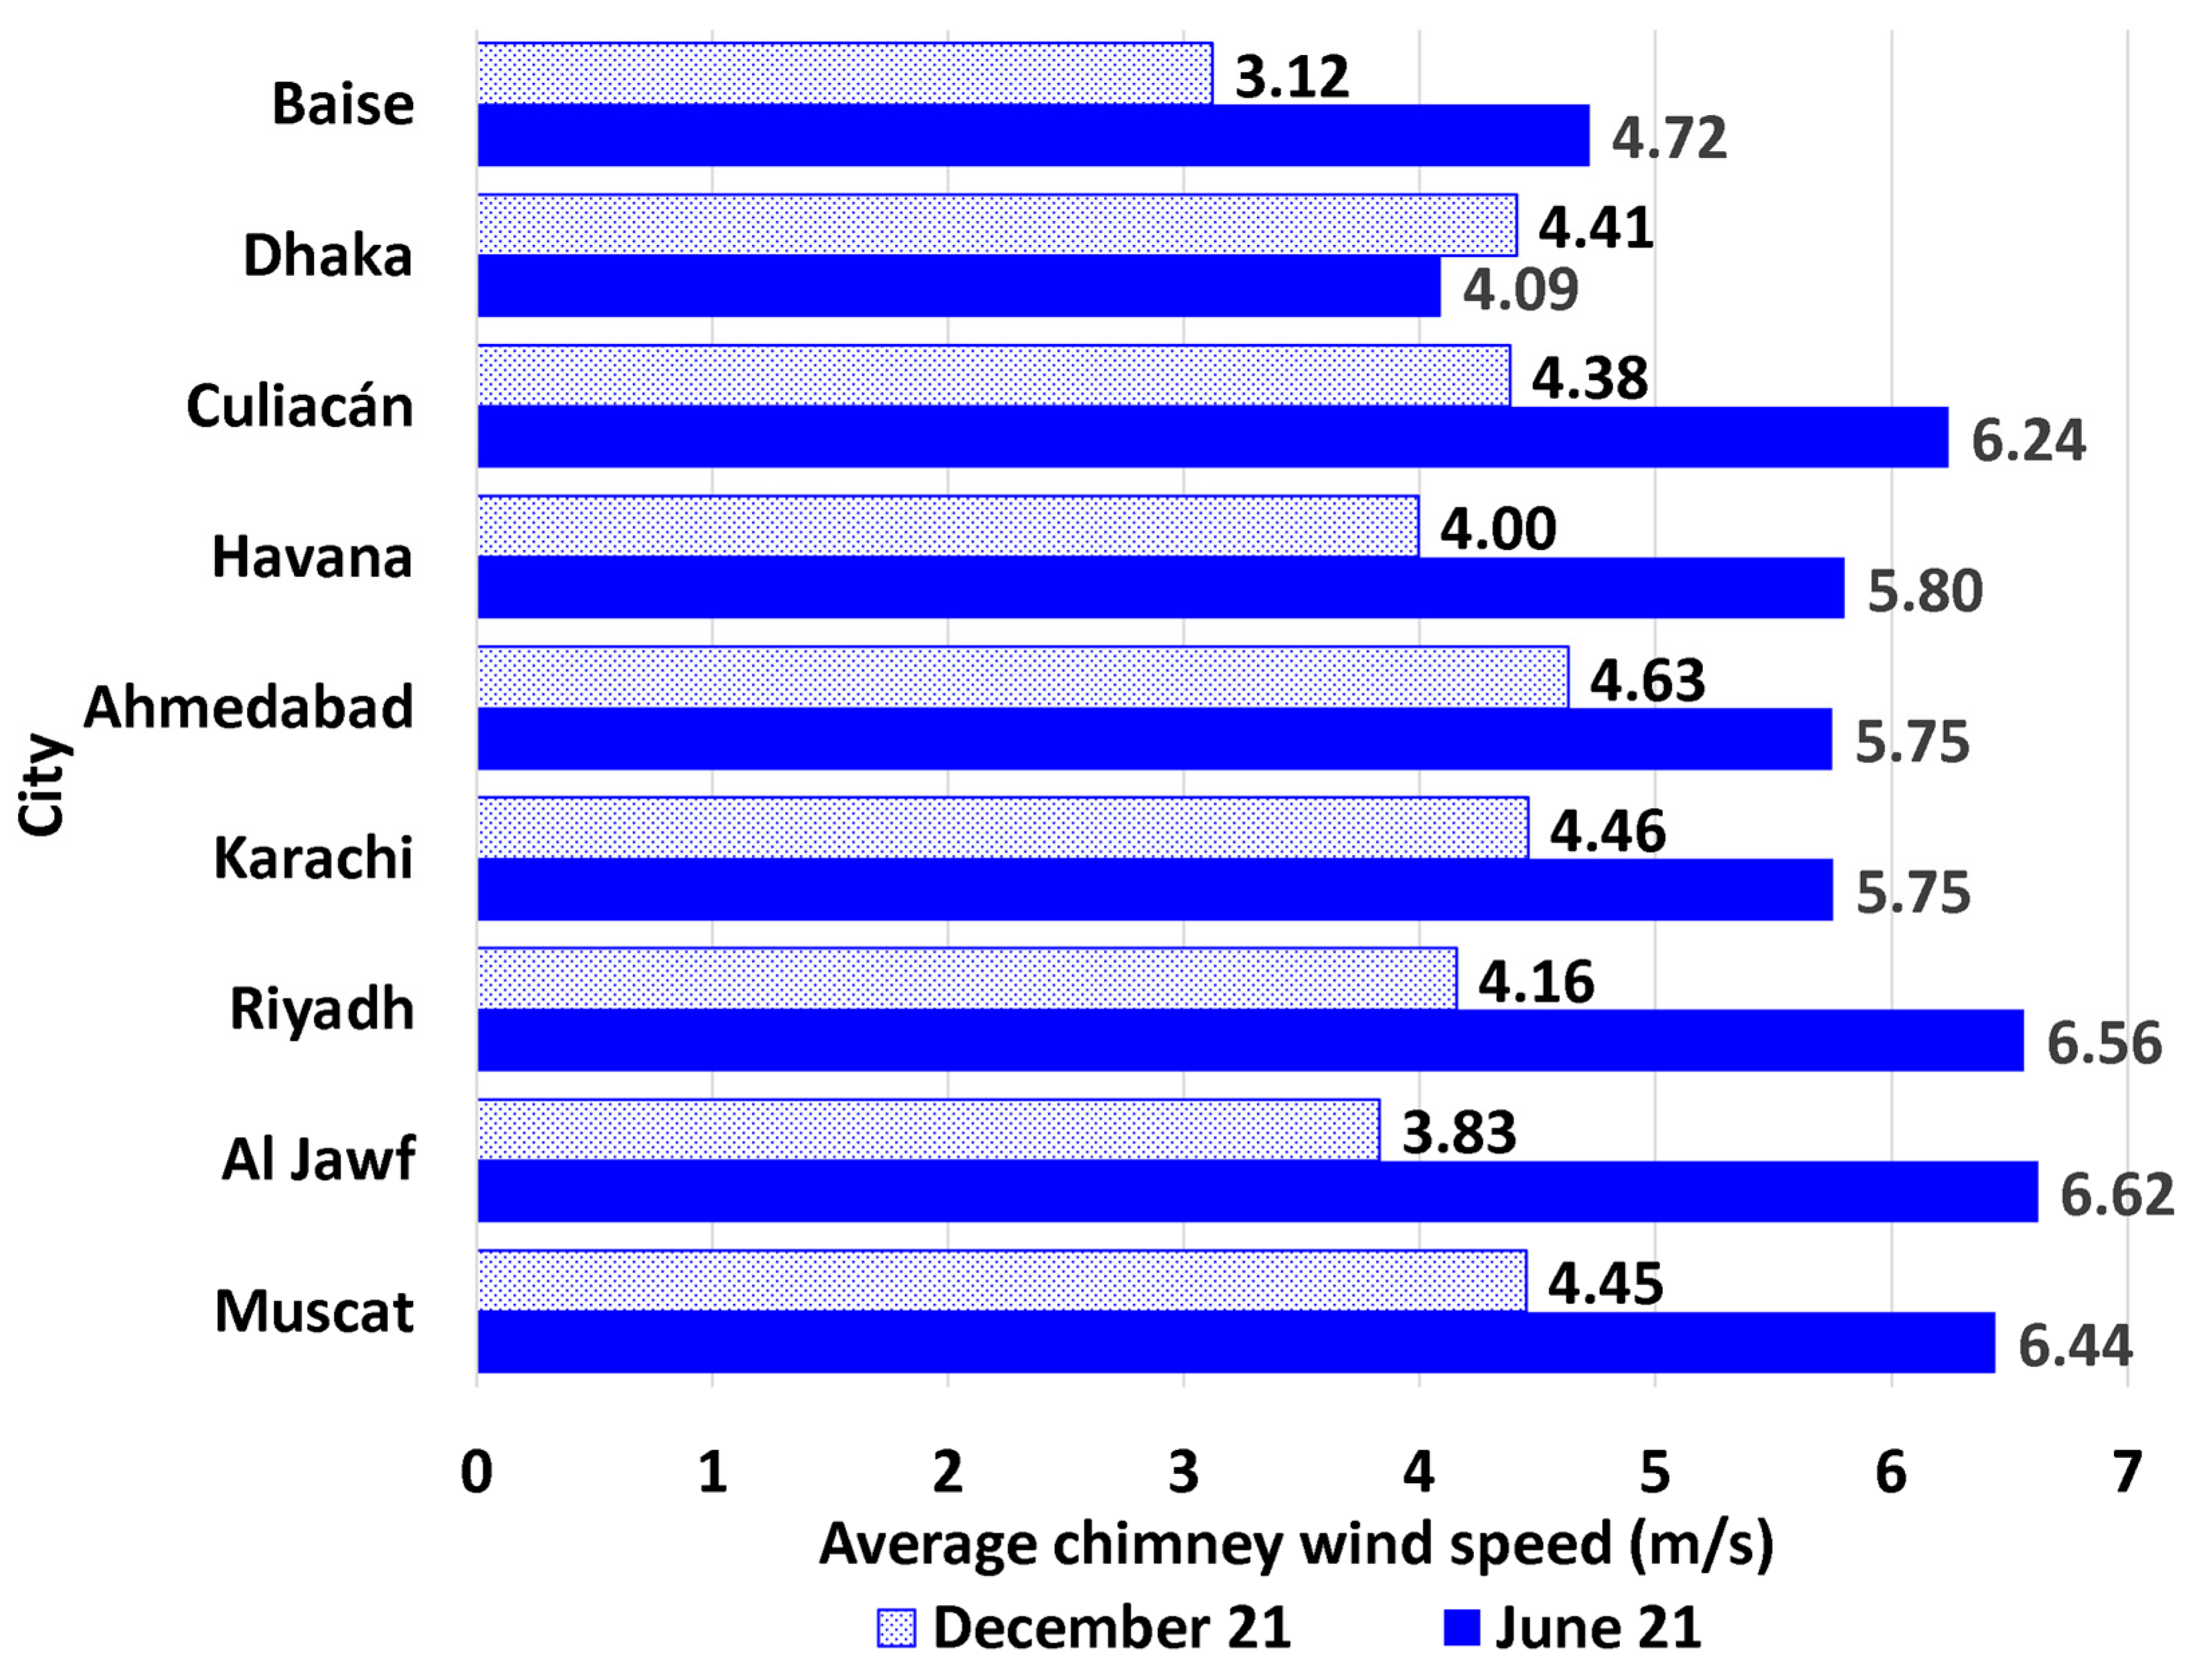
Figure 12 contrasts the mean induced air speed due to the chimney for the nine sites on 21 June and 21 December. These mean values are taken over the entire 24 values of the hourly profiles, so the nighttime is included despite not having any acceleration of the air inside the chimney (zero induced air speed). Given the inherent nonlinearity in the model, the induced thermal velocity and the air temperature rise are not linearly dependent. The overall mean of all 24 h air speeds of all the nine sites is 5.776 m/s on 21 June and 4.160 m/s on 21 December. If null values are excluded, the adjusted overall means (over 125 values for 21 June but over 90 values for 21 December) increase to 9.981 m/s on 21 June and 9.984 m/s on 21 December. Thus, they become practically equal if the nighttime is excluded. This does not contradict the disparity in the electric power output because it is a nonlinear function of the wind speed.

6.5. Hourly Profiles on 21 June and 21 December

The final set of results presented here gives additional details about those already provided in the previous part for the two selected days of the year but inspects the hourly profiles rather than aggregate daily values.
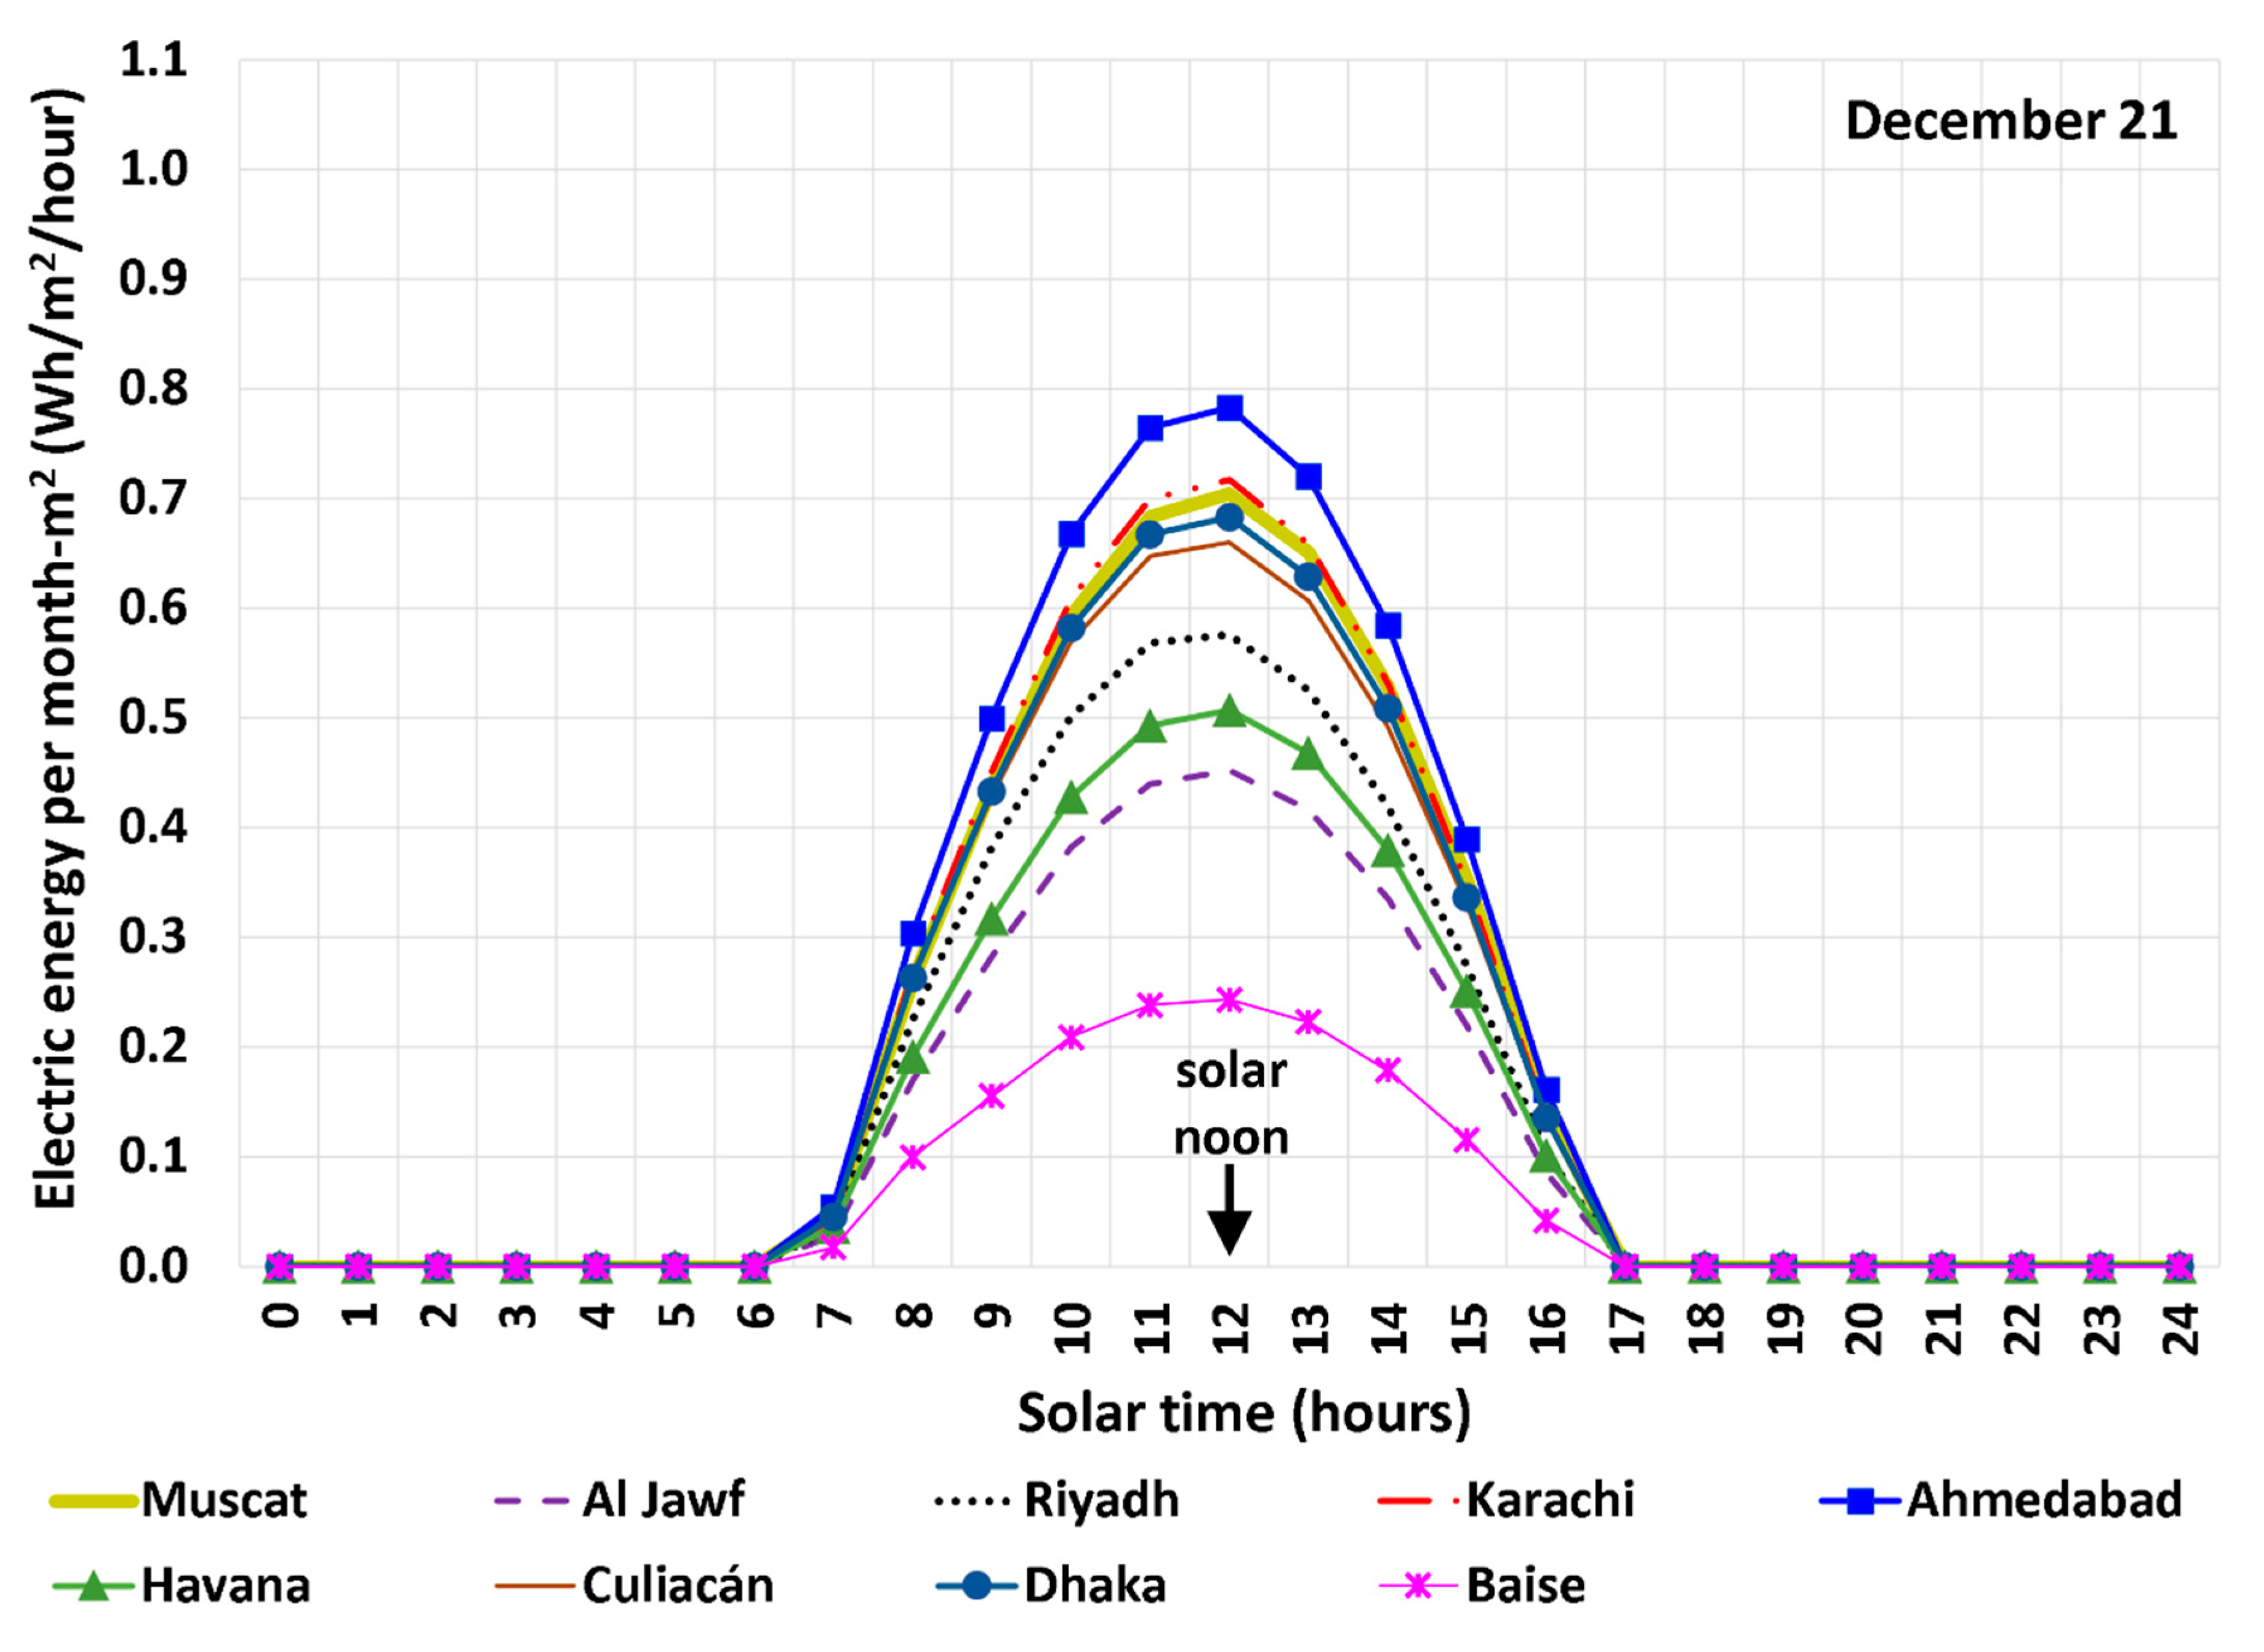
Figure 13 and Figure 14 contrast the hourly energy generation intensity (HGI) values for the nine studied sites on 21 June and 21 December, respectively. The profiles have a similar overall shape with a peak at the solar noon, without being perfectly symmetric about this point since this is also the case for the ambient temperature and the solar radiation. By considering the hourly electric generation as an approximation of the instantaneous power (thus, by approximating the one-hour-based unit of Wh/h as equivalent to the instantaneous power unit of W), the largest power per unit area is about 1.08 W/m2 (Al Jawf, Libya) on 21 June, while the smallest peak power per unit area on the same day is about 0.284 W/m2 (Dhaka, Bangladesh). On 21 December, the largest approximate power of electricity generation per unit area is 0.782 W/m2 (Ahmedabad, India), while the smallest peak power per unit area on the same day is about 0.243 W/m2 (Baise, China). Comparing these values with a typical solar radiation intensity of 1000 W/m2 [82] elucidates the very small radiation-to-electricity energy conversion efficiency of SUTPPs in general, regardless of the location and the month.
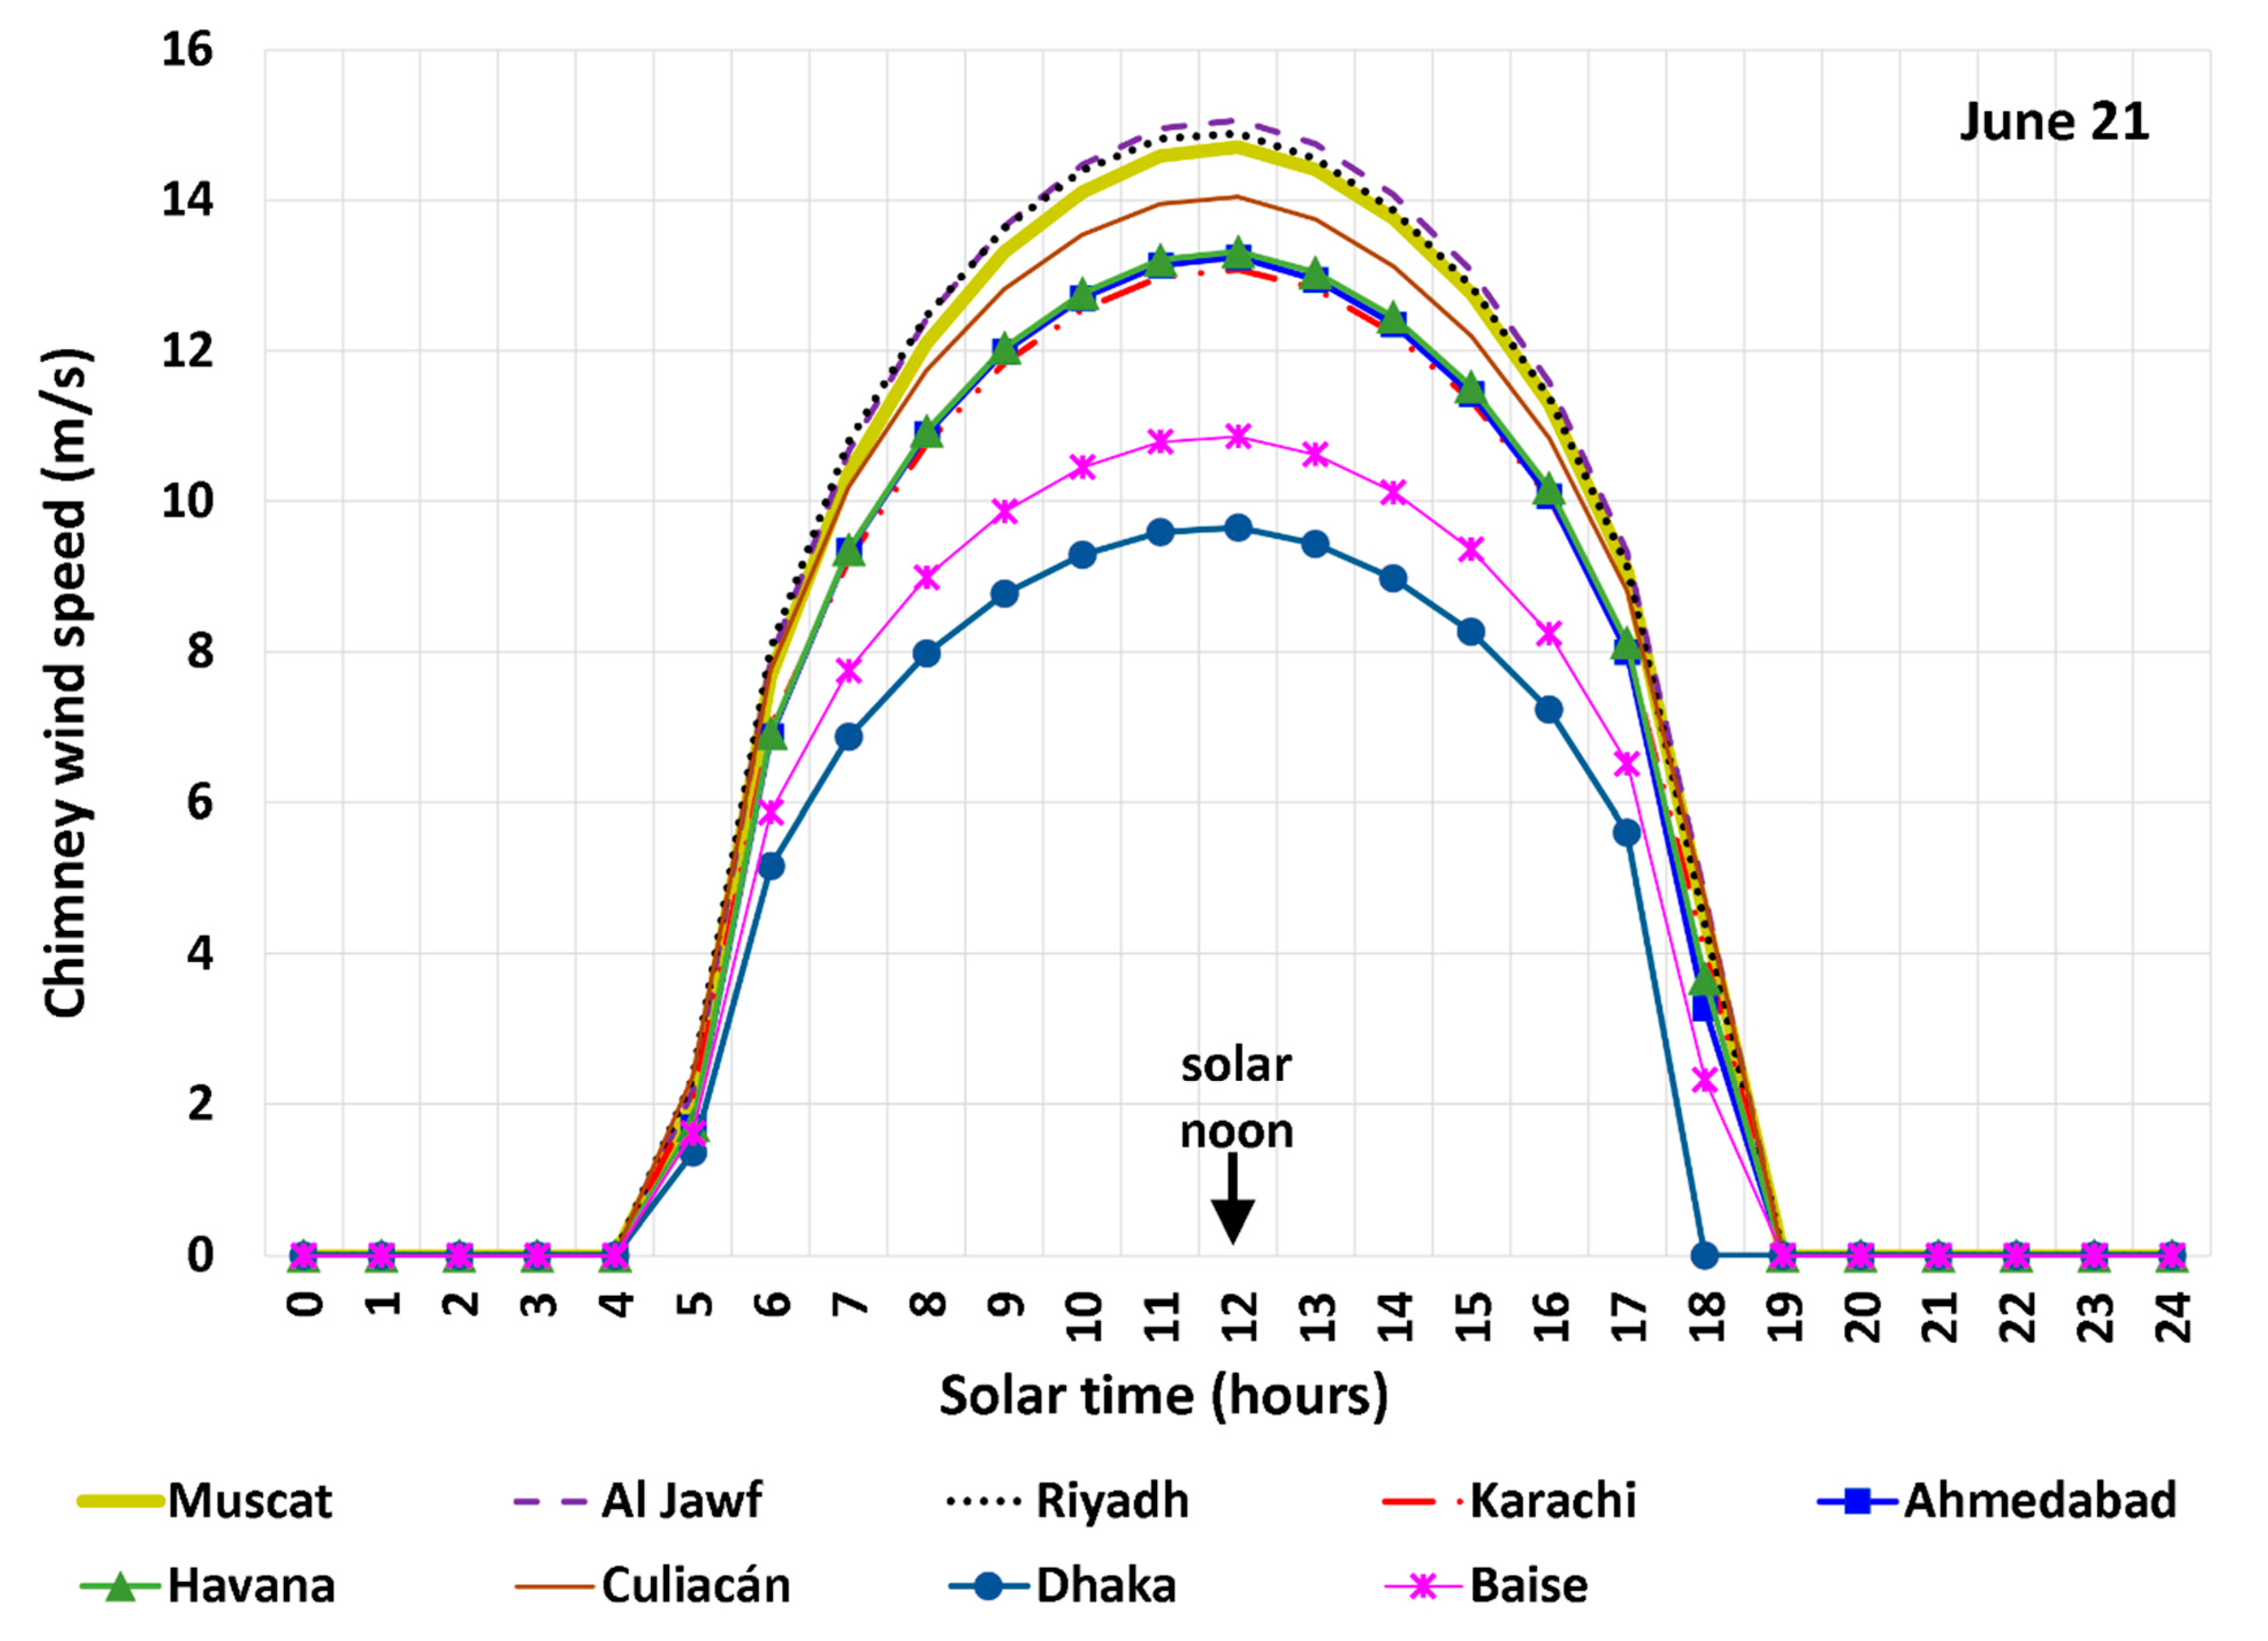
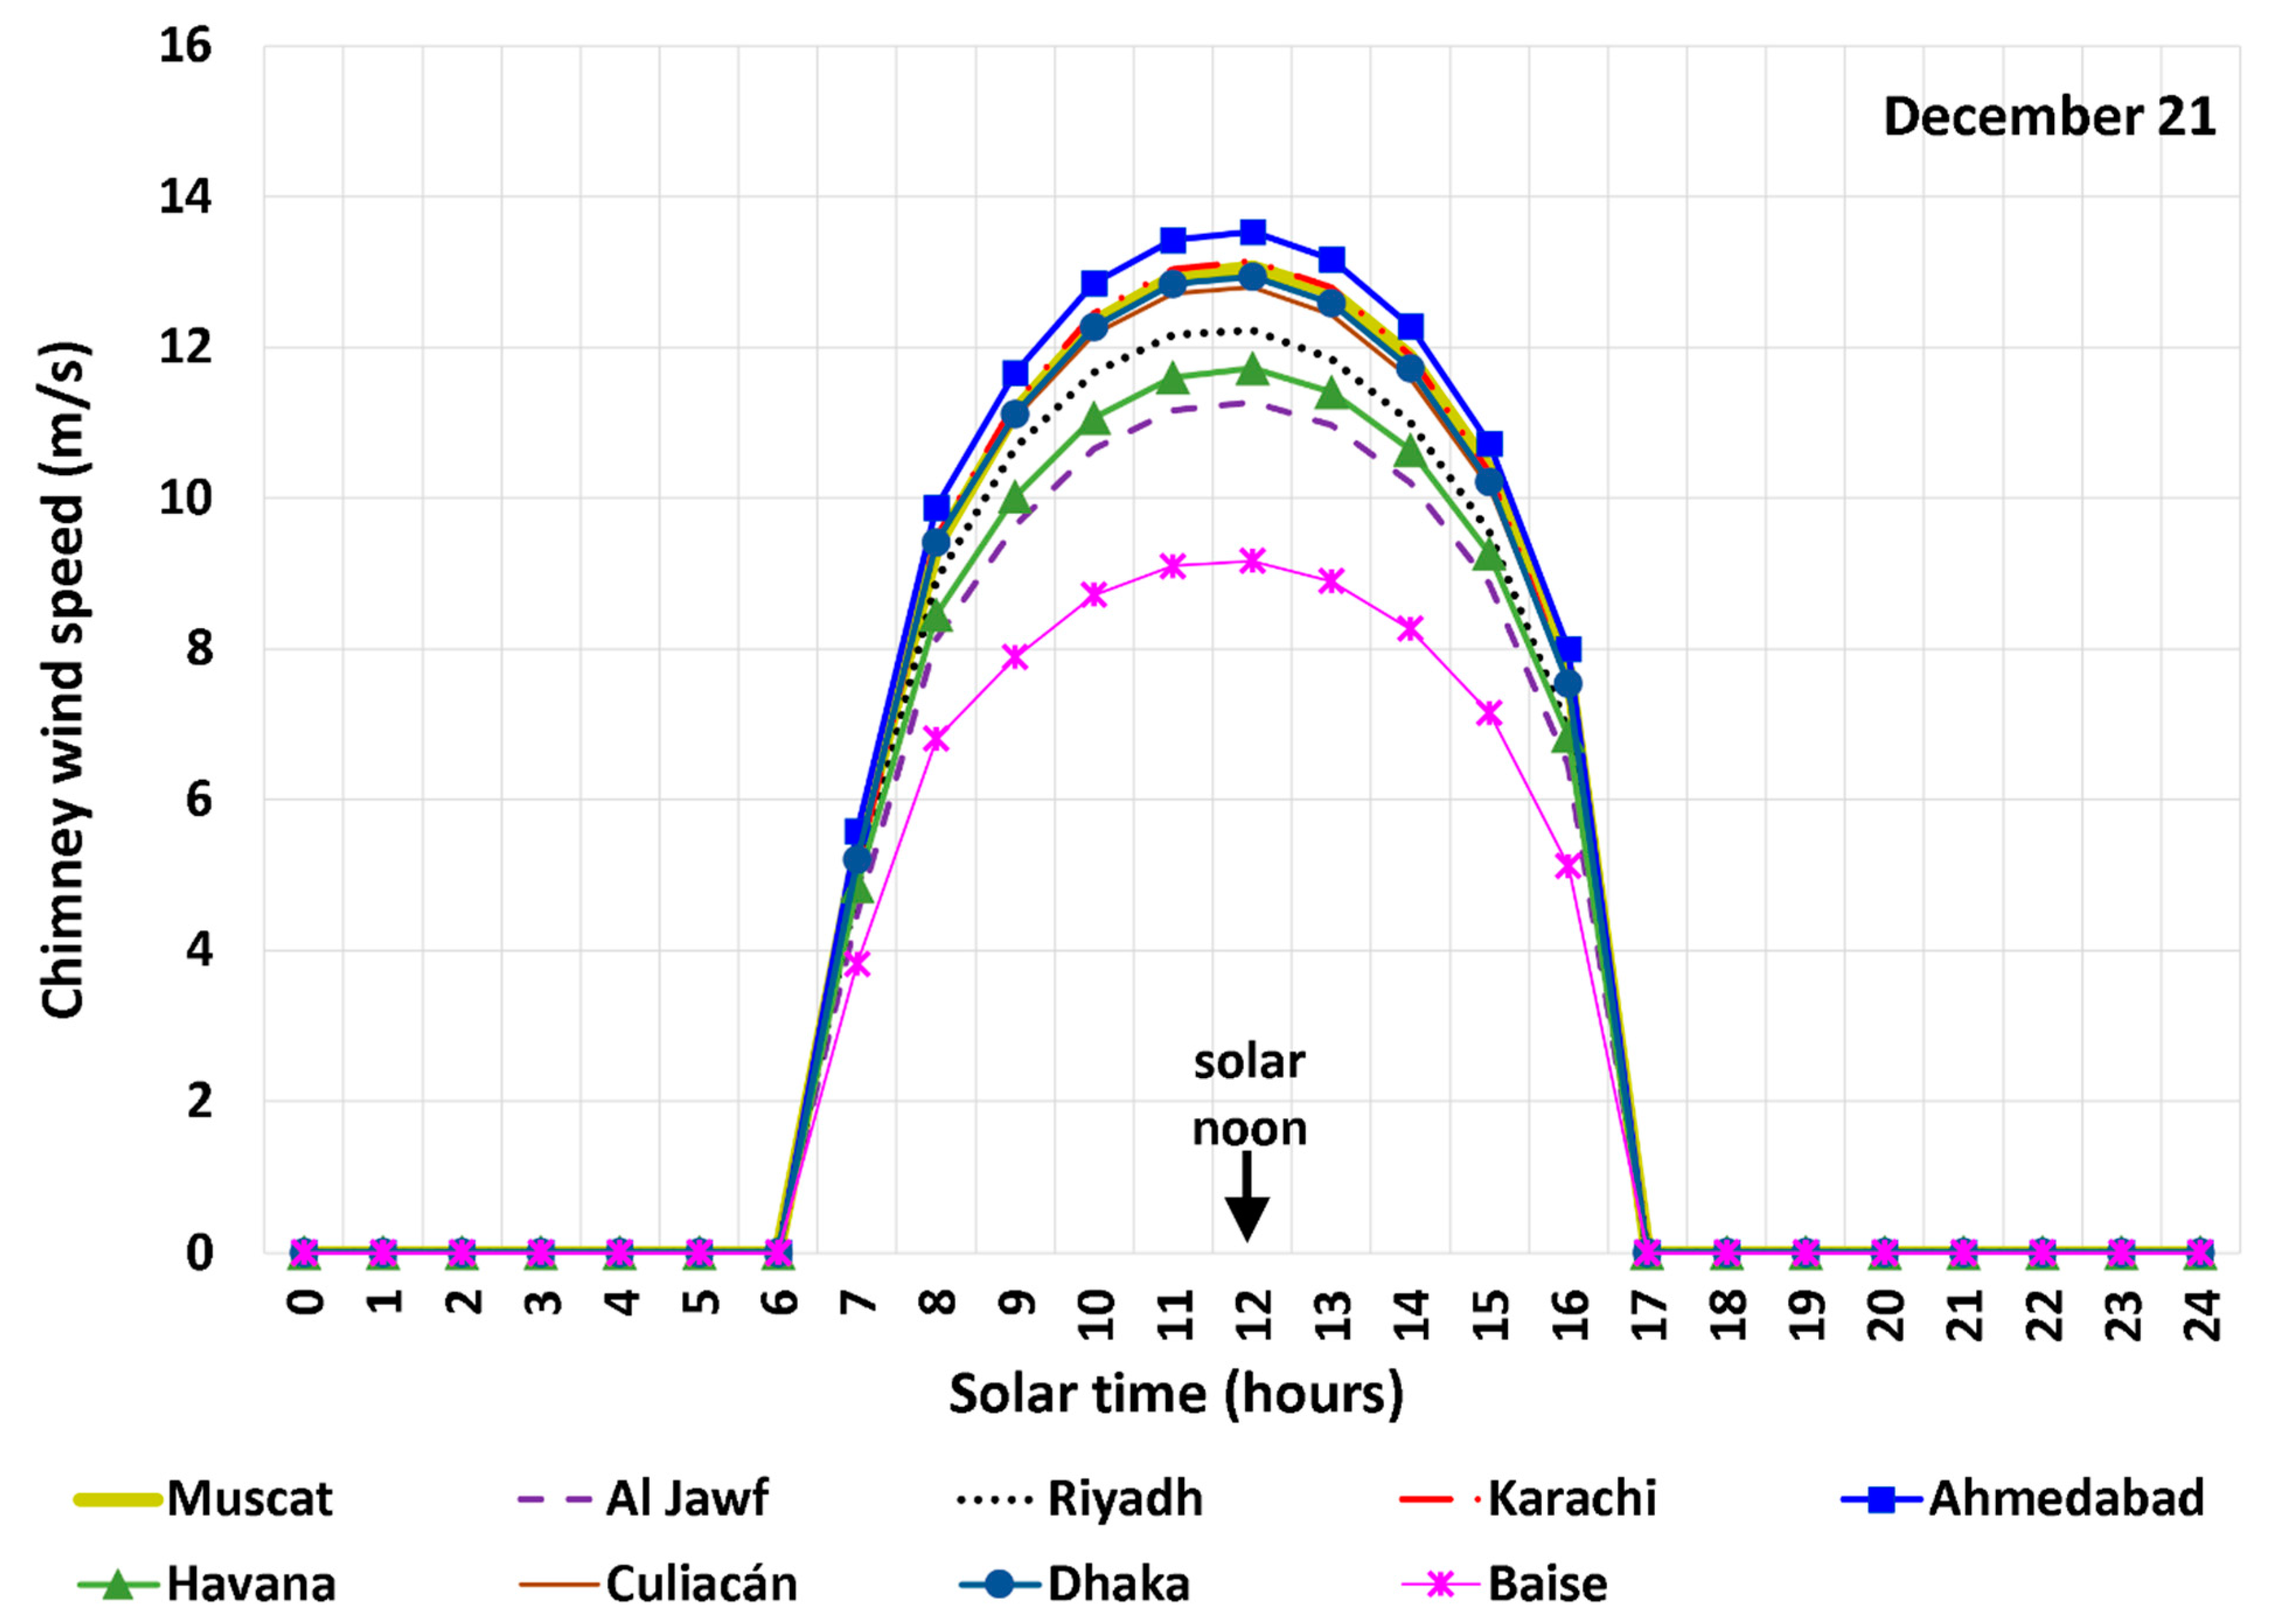
Figure 15 and Figure 16 contrast the hourly profiles of the induced thermal air speed in the chimney before the wind turbine for the nine studied sites on 21 June and 21 December, respectively. For three sites (Karachi, Ahmedabad, and Dhaka), the peak air speed on 21 December is larger than that on 21 June. This is reversed for the remaining six sites (Muscat, Al Jawf, Riyadh, Havana, Culiacán, and Baise). Considering all nine sites, the average of the nine peak air speeds on 21 June (13.21 m/s) is larger than that on 21 December (12.21 m/s).

7. Discussion

In the section describing the mathematical model for a solar updraft tower power plant (SUTPP), three efficiencies were mentioned. These are:
  • The turbine (and its electric generator) efficiency η t , for converting air’s induced kinetic energy into electricity;
  • The chimney efficiency η c , for converting air’s gained thermal energy into air’s induced kinetic energy;
  • The absorber efficiency η a , for converting incoming solar radiation energy into a heat gain in the air, thus causing an air temperature rise.
The turbine-and-generator efficiency can be further divided into two multiplied efficiencies, with the first being a mechanical efficiency for the turbine alone as a machine converting air’s kinetic energy into rotating shaft energy and the second being an electric efficiency for the electric generator driven by the turbine shaft. However, the approach here of combining these two efficiencies together is convenient and practical because it reduces the number of inputs needed from the user and it also considers realistic situations where the turbine as a turbomachine and the electric generator are delivered together as one unit [83]. Furthermore, the efficiency of an electric generator for converting shaft rotation power into electric power is generally high, such as 99% [84,85]. Thus, it is reasonable to refer to the turbine and generator efficiency as just the turbine efficiency, neglecting possibly small losses in the electric generator.
The efficiency of a wind turbine for extracting energy from incoming air flow is also referred to as the power coefficient of that wind turbine [86]. It is subject to a theoretical limit of 16/27 or 59.3%, known as the Betz limit [87,88] for conventional open wind turbines. However, this limit can be exceeded for ducted (shrouded) wind turbines [89,90], which is the case in SUTPPs.
It can be of interest to demonstrate quantitatively how the three efficiencies compare to each other in magnitude. In the current study, with a chimney height of H = 195 m, and assuming a representative ambient daytime temperature of 24 °C, the chimney efficiency is only 0.639%. This is 61 times smaller than a turbine efficiency of 39%. Regarding the absorber efficiency, a representative estimate is made here assuming an absorber temperature of 28 °C and a solar radiative heating flux of 800 W/m2. In this case, the estimated flux of convective heat loss becomes 20 W/m2, causing the absorber efficiency to drop from 80% (an initial base value due to transmissivity) to 77.5%. In addition, the estimated flux of radiative heat loss is 21.8591 W/m2, causing the absorber efficiency to drop further from 77.5% to 74.76%. This is nearly twice the turbine efficiency. Thus, the main limitation of the overall SUTPP efficiency is the chimney efficiency (the process of accelerating the air after entering the chimney).
In a previous study [91], the energy generation intensity (EGI) values of five concentrated solar power (CSP)-type technologies and four photovoltaic (PV) power technologies were assessed in Muscat (Oman) using the desktop solar systems simulation program [92]. Since the EGI of the SUTPP for Muscat was already estimated here, it is useful to compare the EGI for this technology with other solar power technologies. This is presented in Table 5. The information in this table is another contribution made by the current study. This table links the results of the current study with a previous study about nine solar power technologies (other than solar updraft towers). Thus, the performance of the solar updraft tower (as the 10th solar power technology) is compared to those nine solar power technologies in terms of the EGI (or how much electricity can be generated per square meter of occupied land by the solar power project during one year). For a fair comparison, the modeling should be at the same location, which is Muscat (the capital of Oman). This table gives a useful quantitative assessment of 10 different solar power technologies, showing their relative land utilization effectiveness. It is clear that the SUTPP technology has a very small land utilization efficiency compared to any other listed solar technology, being about 50 times less efficient than the least-performing non-SUTPP technology (and about 245 times less efficient than the best non-SUTPP technology). A simple photovoltaic system without any solar tracking mechanisms in Muscat appears to be 165 times more attractive than an SUTPP.

8. Conclusions

  • The solar updraft tower power plant (SUTPP), also known as the solar chimney power plant (SCPP), is a concept in renewable energy that combines solar power with wind power to produce electricity without harmful emissions. While the idea has not been monetized, it has been studied experimentally and mathematically.
  • The SUTPP concept was evaluated in the current study by computer simulations in nine different locations on three different continents sharing a similar northern latitude of 24°.
  • The processed simulation results facilitated the estimation of the energy generation intensity (EGI) of this SUTPP plant in the nine different locations, which was found to be between 0.9271 kWh/m2/year in Baise (China) and 2.284 kWh/m2/year in Muscat (Oman), with a ratio of 2.46 between the two values.
  • Overall, the locations of Muscat (Oman), Al Jawf (Libya), Culiacán (Mexico), and Riyadh (Saudi Arabia) are the four best locations among the nine examined for the SUTPP technology, and they were in this order from first (best) to fourth (least performing).
  • It is felt that a standalone commercial SUTPP that solely produces and sells electricity might not ever get a chance of being established because SUTPP technology is not progressing well, while photovoltaic technology is growing and advancing. Photovoltaic systems are very flexible and modular; they can be established with a wide range of capacities and without a challenging tall construction. These valuable features are missing in SUTPPs.
  • SUTPPs may have a chance of being established if viewed as an energy harvesting method and a source of clean electricity (with little or no carbon dioxide emissions, thereby mitigating global warming), where the primary use of the heat absorber (the solar air collector) is for large-scale agricultural activities such as a greenhouse (such as 450 acres or 180 hectares), while the chimney is added (with a height of 500 m, for example) to utilize the existing greenhouse infrastructure, forming a grid-connected small-scale power plant with a peak capacity of about 5 MW.

Funding

This research received no funding.

Data Availability Statement

No new data were created or analyzed in this study. Data sharing is not applicable to this article.

Acknowledgments

Charles Xie (Founder and Chief Scientist, Institute for Future Intelligence—IFI) is highly acknowledged for the valuable information provided about the mathematical model used in Aladdin for simulating solar updraft towers, and for the clarification provided regarding the use of the results produced by that web tool.

Conflicts of Interest

The author declares that the research was conducted in the absence of any commercial or financial relationships that could be construed as a potential conflict of interest.

Nomenclature

T Rise in air temperature (the temperature inside the chimney minus the ambient temperature, T i T o ) (°C).
ε Emissivity of the absorber. Here, ε = 0.90.
η a Efficiency of the solar heat absorber, also called a solar air collector or greenhouse (for converting the incoming solar radiation into heat passed to the heated air beneath the absorber).
η c Efficiency of the chimney, also called the updraft tower (for converting the gained heat content by the heated air into kinetic energy ahead of a wind turbine).
η t Efficiency (or power coefficient) of the wind turbine, with a built-in electric generator (for converting input air kinetic energy into electricity). Here, η t = 39%.
ρDensity of the air, assumed to be uniform at the ambient condition (kg/m3).
σ Stefan–Boltzmann constant, σ = 5.67 × 10⁻⁸ (W/m2/K4).
τ Transmissivity of the absorber. Here, τ = 0.80.
A a Surface area of the absorber, also called a solar air collector or greenhouse (m2). Here, A a = 0.25   π   D 2 d 2 = 46,681   m 2 .
A c Cross-sectional area of the chimney, also called the updraft tower (m2). Here, A c = 0.25   π   d 2 = 19.635   m 2 .
C p Specific heat capacity for air at constant pressure, assumed to be uniform (J/kg/K). In the presented model, C p = 1007 J/kg/K.
D Outer diameter of the absorber, also called solar air collector or greenhouse (m). Here, D = 244 m.
d Inner diameter of the absorber, also called a solar air collector or greenhouse. This is the diameter of the chimney, also called the updraft tower (m). Here, d = 10 m.
DGIDaily energy generation intensity (Wh/m2/day). This is the estimated electricity generated from a power generation system during one full day (24 h) divided by the land area occupied by that system.
EGIEnergy generation intensity (kWh/m2/year). This is the estimated electricity generated from a power generation system during one non-leap year (365 days) divided by the land area occupied by that system. It is an overall measure of the efficient use of space and thus the efficient use of incoming solar radiation.
g Gravitational acceleration, g = 9.81 m/s2.
H Height of the chimney, also called the updraft tower. Here, H = 195 m.
h c o n v Heat transfer coefficient for convection heat transfer away from the absorber, also called a solar air collector or greenhouse. In the presented model, h c o n v = 5 W/m2/K.
HGIHourly energy generation intensity (Wh/m2/hour). This is the estimated electricity generated from a power generation system during one hour divided by the land area occupied by that system.
m ˙ Mass flow rate of collected air (kg/s).
MGIMonthly energy generation intensity (Wh/m2/month). This is the estimated electricity generated from a power generation system during one month (either 28 days, 30 days, or 31 days) divided by the land area occupied by that system.
P o u t Instantaneous electric power generated from the wind turbine (W).
p o Ambient (outdoor) pressure (N/m2).
q i n Heat flux of incidental solar radiation going to the absorber, also called a solar air collector or greenhouse (W/m2).
q n e t Net heat flux transferred through the absorber to the heated air beneath it (W/m2).
q L , c o n v Heat flux of lost convective heat transfer from the absorber’s top surface (W/m2).
q L , r a d Heat flux of lost radiative heat transfer from the absorber’s top surface (W/m2).
R a i r Specific gas constant for air, 287 J/kg/K.
T a Temperature of the absorber, also called a solar air collector or greenhouse (°C).
T i Temperature of air in the chimney, also called the updraft tower, before the wind turbine (°C).
T o Ambient (outdoor) air temperature (°C).
v Induced wind speed in the chimney, also called the updraft tower, before the wind turbine (m/s).

References

  1. Viebahn, P.; Lechon, Y.; Trieb, F. The potential role of concentrated solar power (CSP) in Africa and Europe—A dynamic assessment of technology development, cost development and life cycle inventories until 2050. Energy Policy 2011, 39, 4420–4430. [Google Scholar] [CrossRef]
  2. Lovegrove, K.; Csiro, W.S. Chapter 1—Introduction to concentrating solar power (CSP) technology. In Concentrating Solar Power Technology—Principles, Developments and Applications; Janardhanan, N., Chaturvedi, V., Eds.; Woodhead Publishing: Sawston, UK, 2012. [Google Scholar] [CrossRef]
  3. Shouman, E.R.; Khattab, N.M. Future economic of concentrating solar power (CSP) for electricity generation in Egypt. Renew. Sustain. Energy Rev. 2015, 41, 1119–1127. [Google Scholar] [CrossRef]
  4. Marzouk, O.A. Facilitating Digital Analysis and Exploration in Solar Energy Science and Technology through Free Computer Applications. Eng. Proc. 2023, 31, 75. [Google Scholar] [CrossRef]
  5. Malagueta, D.; Szklo, A.; Soria, R.; Dutra, R.; Schaeffer, R.; Borba, B.S.M.C. A Comprehensive Review on Bypass Diode Application on Photovoltaic Modules. Renew. Energy 2014, 68, 223–235. [Google Scholar] [CrossRef]
  6. Ahmad, A.; Prakash, O.; Kausher, R.; Kumar, G.; Pandey, S.; Hasnain, S.M. Parabolic trough solar collectors: A sustainable and efficient energy source. Mater. Sci. Energy Technol. 2024, 7, 99–106. [Google Scholar] [CrossRef]
  7. Agyekum, E.B.; Velkin, V.I. Optimization and techno-economic assessment of concentrated solar power (CSP) in South-Western Africa: A case study on Ghana. Sustain. Energy Technol. Assess. 2020, 40, 100763. [Google Scholar] [CrossRef]
  8. Yerudkar, A.N.; Kumar, D.; Dalvi, V.H.; Panse, S.V.; Gaval, V.R.; Joshi, J.B. Economically feasible solutions in concentrating solar power technology specifically for heliostats—A review. Renew. Sustain. Energy Rev. 2024, 189, 113825. [Google Scholar] [CrossRef]
  9. Coventry, J.; Andraka, C. Dish systems for CSP. Sol. Energy 2017, 152, 140–170. [Google Scholar] [CrossRef]
  10. Esfanjani, P.; Mahmoudi, A.; Rashidi, S.; Valipour, M.S. Experimental investigation of a novel design of cavity receiver for a parabolic dish collector humidification-dehumidification desalination system. Energy Convers. Manag. 2024, 299, 117845. [Google Scholar] [CrossRef]
  11. Abbas, R.; Muñoz-Antón, J.; Valdés, M.; Martínez-Val, J. High concentration linear Fresnel reflectors. Energy Convers. Manag. 2013, 72, 60–68. [Google Scholar] [CrossRef]
  12. Zadeh, N.; Ameri, M.; Shojaei, A.; Askari, I.B. Optical Efficiency of Linear Fresnel Reflectors in Fixed, Variable and Optimal Distance between Mirrors: Theoretical and Experimental Studies. Int. J. Eng. 2024, 37, 283–297. [Google Scholar] [CrossRef]
  13. Mills, D.R.; Morrison, G.L. Compact Linear Fresnel Reflector solar thermal powerplants. Sol. Energy 2000, 68, 263–283. [Google Scholar] [CrossRef]
  14. Schlaich, J. The Solar Chimney: Electricity from the Sun; Edition Axel Menges: Fellbach, Germany, 1995. [Google Scholar]
  15. Schlaich, J.; Bergermann, R.; Schiel, W.; Weinrebe, G. Sustainable Electricity Generation with Solar Updraft Towers. Struct. Eng. Int. 2004, 14, 225–229. [Google Scholar] [CrossRef]
  16. Al-Dabbas, M.A. The first pilot demonstration: Solar updraft tower power plant in Jordan. Int. J. Sustain. Energy 2012, 31, 399–410. [Google Scholar] [CrossRef]
  17. Zhou, X.; Xu, Y. Solar updraft tower power generation. Sol. Energy 2016, 128, 95–125. [Google Scholar] [CrossRef]
  18. Amudam, Y.; Chandramohan, V. Influence of thermal energy storage system on flow and performance parameters of solar updraft tower power plant: A three dimensional numerical analysis. J. Clean. Prod. 2018, 207, 136–152. [Google Scholar] [CrossRef]
  19. Das, P.; Chandramohan, V.P. A review on solar updraft tower plant technology: Thermodynamic analysis, worldwide status, recent advances, major challenges and opportunities. Sustain. Energy Technol. Assess. 2022, 52, 102091. [Google Scholar] [CrossRef]
  20. Ming, T.; Wang, X.; de Richter, R.K.; Liu, W.; Wu, T.; Pan, Y. Numerical analysis on the influence of ambient crosswind on the performance of solar updraft power plant system. Renew. Sustain. Energy Rev. 2012, 16, 5567–5583. [Google Scholar] [CrossRef]
  21. Bayeh, C.Z.; Moubayed, N. Comparison between PV farm, solar chimney and CSP tower in Lebanon: Economical study for 100 MW power plant. In Proceedings of the International Conference on Renewable Energies for Developing Countries, Beirut, Lebanon, 26–27 November 2014; pp. 205–210. [Google Scholar] [CrossRef]
  22. Ogunmodimu, O.; Okoroigwe, E.C. Concentrating solar power technologies for solar thermal grid electricity in Nigeria: A review. Renew. Sustain. Energy Rev. 2018, 90, 104–119. [Google Scholar] [CrossRef]
  23. Sajjadi, M.; Shirvani, M.; Yousefi, M.R.; Afsari, H.; Rezaei, L.; Ghanadi, M. Day and Night Times Performance Improvement of the Solar Chimney by Combining with the CSP System. Appl. Sol. Energy 2021, 57, 310–322. [Google Scholar] [CrossRef]
  24. Gauché, P.; Rudman, J.; Mabaso, M.; Landman, W.A.; von Backström, T.W.; Brent, A.C. System value and progress of CSP. Sol. Energy 2017, 152, 106–139. [Google Scholar] [CrossRef]
  25. Elsayed, I.; Nishi, Y. Emergy and Sustainability Ternary Diagrams of Energy Systems: Application to Solar Updraft Tower. Sustainability 2020, 12, 10546. [Google Scholar] [CrossRef]
  26. Satpathi, A.; Sil, S.; Chakravarti, A. Model of a centrifugal-force-aided convective heat engine—An attempt to miniaturise solar updraft tower technology. Energy 2020, 193, 116787. [Google Scholar] [CrossRef]
  27. Zhou, X.; Xu, Y.; Yuan, S.; Wu, C.; Zhang, H. Performance and potential of solar updraft tower used as an effective measure to alleviate Chinese urban haze problem. Renew. Sustain. Energy Rev. 2015, 151, 1499–1508. [Google Scholar] [CrossRef]
  28. Rizwan, M.; Dennis, L.Y.C.; Liu, C. A review on the generation, determination and mitigation of Urban Heat Island. J. Environ. Sci. 2008, 20, 120–128. [Google Scholar] [CrossRef] [PubMed]
  29. Boretti, A.; Al-Zubaidy, S. Maturity assessment of the solar updraft tower technology. Renew. Energy Focus 2018, 27, 135–144. [Google Scholar] [CrossRef]
  30. Cuce, E.; Saxena, A.; Cuce, P.M.; Sen, H.; Guo, S.; Sudhakar, K. Performance assessment of solar chimney power plants with the impacts of divergent and convergent chimney geometry. Int. J. Low-Carbon Technol. 2021, 16, 704–714. [Google Scholar] [CrossRef]
  31. Poulin, S.; Larsen, A. Drag loading of circular cylinders inclined in the along-wind direction. J. Wind. Eng. Ind. Aerodyn. 2007, 95, 1350–1363. [Google Scholar] [CrossRef]
  32. Smaisim, G.F.; Abed, A.M.; Shamel, A. Modeling the Thermal Performance for Different Types of Solar Chimney Power Plants. Complexity 2022, 2022, 3656482. [Google Scholar] [CrossRef]
  33. Marzouk, O.A. Energy Generation Intensity (EGI) for Parabolic Dish/Engine Concentrated Solar Power in Muscat, Sultanate of Oman. IOP Conf. Ser. Earth Environ. Sci. 2022, 1008, 012013. [Google Scholar] [CrossRef]
  34. Hollmuller, P.; Joubert, J.-M.; Lachal, B.; Yvon, K. Evaluation of a 5 kWp photovoltaic hydrogen production and storage installation for a residential home in Switzerland. Int. J. Hydrogen Energy 2000, 25, 97–109. [Google Scholar] [CrossRef]
  35. Satria, H.; Syafii, S.; Aswardi, A. Analysis of Peak Power Capacity on Rooftop Solar PV 1.25 kWp at Sun Conditions 90 Degrees. Int. J. Electr. Energy Power Syst. Eng. 2021, 4, 173–178. [Google Scholar] [CrossRef]
  36. Marzouk, O.A. Lookup Tables for Power Generation Performance of Photovoltaic Systems Covering 40 Geographic Locations (Wilayats) in the Sultanate of Oman, with and without Solar Tracking, and General Perspectives about Solar Irradiation. Sustainability 2021, 13, 13209. [Google Scholar] [CrossRef]
  37. Marzouk, O.A. Tilt sensitivity for a scalable one-hectare photovoltaic power plant composed of parallel racks in Muscat. Cogent Eng. 2022, 2, 2029243. [Google Scholar] [CrossRef]
  38. Almasoud, H.; Gandayh, H.M. Future of solar energy in Saudi Arabia. J. King Saud Univ.-Eng. Sci. 2015, 27, 153–157. [Google Scholar] [CrossRef]
  39. Marzo, A.; Salmon, A.; Polo, J.; Ballestrín, J.; Alonso-Montesinos, J.; Pulido, D. Assessment of the Atmospheric Extinction for Solar Tower Power Plants along the Sun Belt: Preliminary Results. In Proceedings of the International Solar Energy Society Solar World Congress (ISES SWC), Online, 25–29 October 2021. [Google Scholar] [CrossRef]
  40. Institute for Future Intelligence, Inc. (IFI). Designing a Solar Farm with Artificial Intelligence. 2023. Available online: https://intofuture.org/aladdin-design-solar-farm-with-ai.html (accessed on 28 January 2023).
  41. Xie, C.; Ding, X.; Jiang, R. Using Computer Graphics to Make Science Visible in Engineering Education. IEEE Comput. Graph. Appl. 2023, 43, 99–106. [Google Scholar] [CrossRef]
  42. Wong, L.T.; Chow, W.K. Solar radiation model. Appl. Energy 2001, 69, 191–224. [Google Scholar] [CrossRef]
  43. United States National Science Foundation (NSF). Award Abstract # 2105695—Collaborative Research: SmartCAD: Guiding Engineering Design with Science Simulations. 2020. Available online: https://nsf.gov/awardsearch/showAward?AWD_ID=2105695 (accessed on 28 January 2023).
  44. Institute for Future Intelligence, Inc. (IFI). Prediction vs. Measurement of Solar Radiation Intensity in Tucson, Arizona, U.S.A. 2023. Available online: https://intofuture.org/image/aladdin-yearly-light-sensor-tucson-az.png (accessed on 28 January 2023).
  45. Teja, V.S.; Garg, K.; Tyagi, H. Mathematical Modelling of Solar Updraft Tower. In Solar Energy. Energy, Environment, and Sustainability; Tyagi, H., Chakraborty, P., Powar, S., Agarwal, A., Eds.; Springer: Singapore, 2020. [Google Scholar] [CrossRef]
  46. Hong, B.; Venkataraman, V.; Mihaescu, M.; Cronhjort, A. Cronhjort. Crank angle-resolved mass flow characterization of engine exhaust pulsations using a Pitot tube and thin-wire thermocouples. Appl. Therm. Eng. 2024, 236, 121725. [Google Scholar] [CrossRef]
  47. Kautz, H.; Heron, P.R.L.; Loverude, M.E.; McDermott, L.C. Student understanding of the ideal gas law, Part I: A macroscopic perspective. Am. J. Phys. 2005, 73, 1055–1063. [Google Scholar] [CrossRef]
  48. Ozerdem, B.; Ozer, S.; Tosun, M. Feasibility study of wind farms: A case study for Izmir, Turkey. J. Wind. Eng. Ind. Aerodyn. 2006, 94, 725–743. [Google Scholar] [CrossRef]
  49. Moncayo-Riascos, I.; Aristizábal, J.D.; Ramírez-Jaramillo, O.; Rojas-Ruiz, F.A.; Orrego-Ruiz, J.A.; Torres-Sáez, R.; Cundar, C.; Cañas-Marín, W.; Osorio, R. Association parameters for Cubic-Plus-Association equation of state determined by molecular dynamics and Petroleomics: Prediction of asphaltene precipitation. Fuel 2024, 361, 130576. [Google Scholar] [CrossRef]
  50. Marzouk, O.A. Adiabatic Flame Temperatures for Oxy-Methane, Oxy-Hydrogen, Air-Methane, and Air-Hydrogen Stoichiometric Combustion using the NASA CEARUN Tool, GRI-Mech 3.0 Reaction Mechanism, and Cantera Python Package. Eng. Technol. Appl. Sci. Res. 2023, 13, 11437–11444. [Google Scholar] [CrossRef]
  51. Jhumka, H.; Yang, S.; Gorse, C.; Wilkinson, S.; Yang, R.; He, B.-J.; Prasad, D.; Fiorito, F. Assessing heat transfer characteristics of building envelope deployed BIPV and resultant building energy consumption in a tropical climate. Energy Build. 2023, 298, 113540. [Google Scholar] [CrossRef]
  52. Adnan; AlBaidani, M.M.; Mishra, N.K.; Alam, M.M.; Eldin, S.M.; AL-Zahrani, A.A.; Akgul, A. Numerical analysis of magneto-radiated annular fin natural-convective heat transfer performance using advanced ternary nanofluid considering shape factors with heating source. Case Stud. Therm. Eng. 2023, 44, 102825. [Google Scholar] [CrossRef]
  53. Dassault Systèmes. 2019 SolidWorks—Convection. 2023. Available online: https://help.solidworks.com/2019/english/SolidWorks/cworks/c_convection.htm?format=P&value= (accessed on 28 January 2023).
  54. Abbasov, Y.; Umurzakova, M.; Sharofov, S. Results of the calculation of the absorber temperature in a flat solar air heater. E3S Web Conf. 2023, 411, 01004. [Google Scholar] [CrossRef]
  55. Ramírez-Moreno, M.A.; González-Hernández, S.; Angulo-Brown, F. The role of the Stefan–Boltzmann law in the thermodynamic optimization of an n-Müser engine. Physica A Stat. Mech. Its Appl. 2016, 444, 914–921. [Google Scholar] [CrossRef]
  56. Alshamali, S.; Alawadhi, D.; Aljuwaiser, E. Nonlinear Control Design for Maximum Power Point Tracking of a PMSG-Based Wind Turbine. Int. J. Innov. Comput. Inf. Control. 2024, 20, 313–328. [Google Scholar] [CrossRef]
  57. Azizi, A.; Tahri, T.; Sellami, M.; Segni, L.; Belakroum, R.; Loudiyi, K. Experimental and CFD investigation of small-scale solar chimney for power generation. Case study: Southeast of Algeria. Desalination Water Treat. 2019, 160, 1–8. [Google Scholar] [CrossRef]
  58. Schlaich Bergermann Partner (sbp). Solar Updraft Tower Pilot Plant Manzanares. 2023. Available online: https://www.sbp.de/en/project/solar-chimney-pilot-plant-manzanares (accessed on 28 January 2023).
  59. Mandal, K.; Biswas, N.; Manna, N.K.; Benim, A.C. Impact of chimney divergence and sloped absorber on energy efficacy of a solar chimney power plant (SCPP). Ain Shams Eng. J. 2024, 15, 102390. [Google Scholar] [CrossRef]
  60. EU Science Hub [European Union Science Hub]. PVGIS 5.2. 2022. Available online: https://joint-research-centre.ec.europa.eu/pvgis-online-tool/pvgis-releases/pvgis-52_en (accessed on 29 January 2023).
  61. Maleki, S.A.M.; Hizam, H.; Gomes, C. Estimation of Hourly, Daily and Monthly Global Solar Radiation on Inclined Surfaces: Models Re-Visited. Energies 2017, 10, 134. [Google Scholar] [CrossRef]
  62. Honsberg, B.; Bowden, S.G. Solar Time, the Photovoltaics Education Website. 2019. Available online: https://www.pveducation.org/pvcdrom/properties-of-sunlight/solar-time (accessed on 29 January 2023).
  63. United Nations Statistics Division (UNdata). Sunshine—Source: World Meteorological Organization. 2010. Available online: https://data.un.org/Data.aspx?d=CLINO&f=ElementCode%3A15 (accessed on 29 January 2023).
  64. Schlaich, J.; Bergermann, R.; Schiel, W.; Weinrebe, G. Design of Commercial Solar Updraft Tower Systems—Utilization of Solar Induced Convective Flows for Power Generation. J. Sol. Energy Eng. 2005, 127, 117–124. [Google Scholar] [CrossRef]
  65. Sen, H.; Cuce, A.P.M.; Cuce, E. Impacts of Collector Radius and Height on Performance Parameters of Solar Chimney Power Plants: A Case Study for Manzanares, Spain. Recep Tayyip Erdogan Univ. J. Sci. Eng. 2021, 2, 83–104. [Google Scholar] [CrossRef]
  66. Cuce, E. Dependence of electrical power output on collector size in Manzanares solar chimney power plant: An investigation for thermodynamic limits. Int. J. Low-Carbon Technol. 2022, 17, 1223–1231. [Google Scholar] [CrossRef]
  67. Stenmark, E. On Multiphase Flow Models in ANSYS CFD Software. Master’s Thesis, Chalmers University of Technology, Göteborg, Sweden, 2013. Available online: https://publications.lib.chalmers.se/records/fulltext/182902/182902.pdf (accessed on 29 January 2023).
  68. Muttalli, R.S.; Agrawal, S.; Warudkars, H. CFD Simulation of Centrifugal Pump Impeller Using ANSYS-CFX. Int. J. Innov. Res. Sci. Eng. Technol. 2014, 3, 15553–15561. [Google Scholar] [CrossRef]
  69. Marzouk, O.A. Performance analysis of shell-and-tube dehydrogenation module. Int. J. Energy Res. 2017, 41, 604–610. [Google Scholar] [CrossRef]
  70. ANSYS. CFD Software: Fluid Dynamics Simulation Software. 2023. Available online: https://www.ansys.com/products/fluids (accessed on 29 January 2023).
  71. Marzouk, O.A. The Sod gasdynamics problem as a tool for benchmarking face flux construction in the finite volume method. Sci. Afr. 2020, 10, e00573. [Google Scholar] [CrossRef]
  72. Beare, R.J.; Macvean, M.K. Resolution Sensitivity and Scaling of Large-Eddy Simulations of the Stable Boundary Layer. Bound.-Layer Meteorol. 2004, 112, 257–281. [Google Scholar] [CrossRef]
  73. Osama, A.M. Radiant Heat Transfer in Nitrogen-Free Combustion Environments. Int. J. Nonlinear Sci. Numer. Simul. 2018, 19, 175–188. [Google Scholar] [CrossRef]
  74. Jiang, Y.; Murray, A.; di Mare, L.; Ireland, P. Mesh sensitivity of RANS simulations on film cooling flow. Int. J. Heat Mass Transf. 2022, 182, 121825. [Google Scholar] [CrossRef]
  75. Stanciu, C.; Stanciu, D. Optimum tilt angle for flat plate collectors all over the World—A declination dependence formula and comparisons of three solar radiation models. Energy Convers. Manag. 2012, 81, 133–143. [Google Scholar] [CrossRef]
  76. Katzenberger, A.; Levermann, A.; Schewe, J.; Pongratz, J. Intensification of Very Wet Monsoon Seasons in India Under Global Warming. Geophys. Res. Lett. 2022, 49, e2022GL098856. [Google Scholar] [CrossRef]
  77. Weather Atlas. Al-Jawf, Libya—Climate & Monthly Weather Forecast. 2023. Available online: https://www.weather-atlas.com/en/libya/al-jawf-climate#rainfall (accessed on 30 January 2023).
  78. Ahmed, R.; Kim, I.-K. Patterns of Daily Rainfall in Bangladesh During the Summer Monsoon Season: Case Studies at Three Stations. Phys. Geogr. 2003, 24, 295–318. [Google Scholar] [CrossRef]
  79. Worldmeteo. Weather Dhaka, Bangladesh. 2023. Available online: https://www.worldmeteo.info/en/asia/bangladesh/dhaka/weather-102569 (accessed on 30 January 2023).
  80. Oman Power and Water Procurement Company (OPWP). Solar Data—Weather Impact Analysis. 2013. Available online: https://omanpwp.om/PDF/Solar%20Data%20-%20Weather%20Impact%20Analysis.pdf (accessed on 30 January 2023).
  81. Energy Sector Management Assistance Program or the World Bank (ESMAP). Global Photovoltaic Power Potential by Country [Report]. 2020. Available online: https://documents1.worldbank.org/curated/en/466331592817725242/pdf/Global-Photovoltaic-Power-Potential-by-Country.pdf (accessed on 30 January 2023).
  82. Plantard, G.; Janin, T.; Goetz, V.; Brosillon, S. Solar photocatalysis treatment of phytosanitary refuses: Efficiency of industrial photocatalysts. Appl. Catal. B Environ. 2012, 115–116, 38–44. [Google Scholar] [CrossRef]
  83. Siemens Gamesa. SG 2.9-129 Onshore Wind Turbine [Product Brochure]. 2022. Available online: https://www.siemensgamesa.com/en-int/-/media/siemensgamesa/downloads/en/products-and-services/onshore/brochures/siemens-gamesa-onshore-wind-turbine-sg-2-9-129-en.pdf (accessed on 30 January 2023).
  84. Siemens Energy. SGen-2000P Pressurized Air-Cooled Generator Series for Gas and Steam Power Applications from 370–560 MVA [Factsheet]. 2021. Available online: https://assets.siemens-energy.com/siemens/assets/api/uuid:83c60d62-cb98-45f6-a661-c639fe3086ef/sgen-2000p-factsheet.pdf (accessed on 30 January 2023).
  85. General Electric. Gigatop 2-Pole Generator for Large Power Applications. 2023. Available online: https://www.ge.com/steam-power/products/generators/gigatop-2-pole (accessed on 28 January 2023).
  86. Neill, S.P.; Hashemi, M.R. Fundamentals of Ocean Renewable Energy—Generating Electricity from the Sea; Academic Press: Cambridge, MA, USA, 2018. [Google Scholar] [CrossRef]
  87. Schubel, P.J.; Crossley, R.J. Wind Turbine Blade Design. Energies 2012, 5, 3425–3449. [Google Scholar] [CrossRef]
  88. Carpintero-Renteria, M.; Santos-Martin, D.; Lent, A.; Ramos, C. Wind turbine power coefficient models based on neural networks and polynomial fitting. Physica A Stat. Mech. Its Appl. 2020, 14, 1841–1849. [Google Scholar] [CrossRef]
  89. González-Hernández, J.G.; Salas-Cabrera, R. Maximum Power Coefficient Analysis in Wind Energy Conversion Systems: Questioning, Findings, and New Perspective. Math. Probl. Eng. 2021, 2021, 9932841. [Google Scholar] [CrossRef]
  90. Siavash, N.K.; Ghobadian, B.; Najafi, G.; Rohani, A.; Tavakoli, T.; Mahmoodi, E.; Mamat, R.; Mazlan, M. Prediction of power generation and rotor angular speed of a small wind turbine equipped to a controllable duct using artificial neural network and multiple linear regression. Environ. Res. 2021, 196, 110434. [Google Scholar] [CrossRef]
  91. Marzouk, O.A. Land-Use competitiveness of photovoltaic and concentrated solar power technologies near the Tropic of Cancer. Sol. Energy 2022, 243, 103–119. [Google Scholar] [CrossRef]
  92. Xie, C.; Schimpf, C.; Chao, J.; Nourian, S.; Massicotte, J. Learning and Teaching Engineering Design through Modeling and Simulation on a CAD Platform. Comput. Appl. Eng. Educ. 2018, 26, 824–840. [Google Scholar] [CrossRef]
Figure 1. A view of the Manzanares SUTPP, as modeled in Aladdin, at the solar noon of 21 December. The position of the sun, the chimney shadow, and the heliodon are also visible (permission for displaying this figure here was requested from Aladdin’s team, who graciously granted it and further clarified that obtaining such permission is not compulsory).
Energies 17 00405 g001
Figure 2. A view of the Manzanares SUTPP, as modeled in Aladdin, at the solar noon of 21 June. The position of the sun, the chimney shadow, and the heliodon are also visible (permission for displaying this figure here was requested from Aladdin’s team, who graciously granted it and further clarified that obtaining such permission is not compulsory).
Energies 17 00405 g002
Figure 3. Hourly profile of the global horizontal irradiation (GHI) from PVGIS and the electric energy output from Aladdin for the modeled Manzanares (Spain) SUTPP on 21 June.
Energies 17 00405 g003
Figure 4. Hourly profile of the global horizontal irradiation (GHI) from PVGIS and the electric energy output from Aladdin for the modeled Manzanares (Spain) SUTPP on 21 December.
Energies 17 00405 g004
Figure 5. Scatter plot for the dependence of the electricity generation on the solar radiation for the modeled Manzanares (Spain) SUTPP and comparison with another study.
Energies 17 00405 g005
Figure 6. Annual (cumulative) sunshine hours in the cities examined in this study.
Energies 17 00405 g006
Figure 7. Monthly (cumulative) sunshine hours in the cities examined in this study.
Energies 17 00405 g007
Figure 8. Energy generation intensity (EGI) based on the modeled SUTPP in the cities examined in this study.
Energies 17 00405 g008
Figure 9. Monthly energy generation intensity (MGI) based on the modeled SUTPP in the cities examined in this study.
Energies 17 00405 g009
Figure 10. Daily energy generation intensity (DGI) on 21 June and 21 December based on the modeled SUTPP in the cities examined in this study.
Energies 17 00405 g010
Figure 11. Twenty-four-hour average (night hours included) of the air temperature rise on 21 June and 21 December based on the modeled SUTPP in the cities examined in this study.
Energies 17 00405 g011
Figure 12. Twenty-four-hour average (night hours included) of the induced air speed before the wind turbine on 21 June and 21 December based on the modeled SUTPP in the cities examined in this study.
Energies 17 00405 g012
Figure 13. Hourly energy generation intensity (HGI) on 21 June based on the modeled SUTPP in the cities examined in this study.
Energies 17 00405 g013
Figure 14. Hourly energy generation intensity (HGI) on 21 December based on the modeled SUTPP in the cities examined in this study.
Energies 17 00405 g014
Figure 15. Hourly profiles of the induced air speed before the wind turbine on 21 June based on the modeled SUTPP in the cities examined in this study.
Energies 17 00405 g015
Figure 16. Hourly profiles of the induced air speed before the wind turbine on 21 December based on the modeled SUTPP in the cities examined in this study.
Energies 17 00405 g016
Table 1. Some parameters used in the test simulation of the Manzanares SUTPP.
ParameterValue
City and countryManzanares, Spain
Latitude and longitude39.00° N, 3.37° W
Absorber diameter244 m *
Absorber height1.8 m **
Absorber transmissivity0.80
Absorber emissivity0.90
Chimney diameter10 m
Chimney height195 m
Turbine efficiency39% ***
* This is an approximate (average) dimension of the real design, since the actual absorber did not have a perfectly circular layout. ** Another value of 1.85 m was also reported. *** This effective turbine-and-generator efficiency is specified through the two multiplicative parameters: discharge coefficient (0.65) and turbine efficiency (0.60).
Table 3. Demonstration of the solution convergence under the adopted resolution through comparing annual expected electric generation in Muscat (Oman).
Duration of the Predicted Electric GenerationWith Adopted Resolution (kWh)With Better (for Testing) Resolution (kWh)% Difference
Annual135,965.11135,960.200.0036%
21 June464.38464.370.0022%
21 December261.98261.950.0115%
Table 4. Summary of the sites considered in the analysis of SUTPPs (“N” means: north of the equator, “E” means: east of the prime meridian, and “W” means: west of the prime meridian).
Serial NumberCityCountryLatitudeLongitude
1Muscat
(the capital)
Oman23.58° N58.32° E
2Al JawfLibya24.21° N23.29° E
3Riyadh
(the capital)
Saudi Arabia24.71° N46.68° E
4KarachiPakistan24.86° N67.00° E
5AhmedabadIndia23.02° N72.57° E
6Havana
(the capital)
Cuba23.11° N82.37° W
7CuliacánMexico24.81° N107.39° W
8Dhaka
(the capital)
Bangladesh23.68° N90.36° E
9BaiseChina23.90° N106.62° E
Table 5. Comparing the EGI for an SUTPP with the EGI of nine other solar power technologies for Muscat (Oman).
Non-SUTPP Solar Power TechnologyEGI (Non-SUTPP), Smallest to Largest, in kWh/m2/yearEGI (Non-SUTPP) ÷ EGI (SUTPP) *
PV, with vertical-axis sun tracking113.09549.52
PV, with two-axis sun tracking118.47752.33
CSP, with heliostats 128.70859.72
CSP, with Fresnel reflectors149.23379.49
CSP, with compact Fresnel reflectors (2 absorbers)161.70083.02
CSP, with parabolic troughs172.55991.70
CSP, with parabolic dishes180.08982.13
PV, with fixed optimum orientation212.047165.28
PV, with horizontal-axis tracking (east-west alignment)227.234245.11
* The estimated EGI (SUTPP) in Muscat in the current study is 2.28375 kWh/m2/year.
Disclaimer/Publisher’s Note: The statements, opinions and data contained in all publications are solely those of the individual author(s) and contributor(s) and not of MDPI and/or the editor(s). MDPI and/or the editor(s) disclaim responsibility for any injury to people or property resulting from any ideas, methods, instructions or products referred to in the content.