1. Introduction
Carbon pricing is central to Canada’s climate change mitigation policy approach. Canada’s federal government sets a minimum national stringency standard—a carbon pricing ‘backstop’—that provinces must meet. If provincial governments decide not to enforce a carbon pricing system, or attempt to put one in place that does not meet the federal standards, the federal system is implemented [
1]. The federal system has two parts: a regulatory charge on fossil fuels, known as the ‘fuel charge’ or ‘carbon tax’, and an industrial output-based system for large emitters. Some provinces have implemented their own carbon pricing systems that meet the federal stringency requirements, such as cap-and-trade schemes in Quebec and Nova Scotia, while others choose to simply implement the two-part federal system. Provinces can implement ‘hybrid’ systems wherein they design their own fuel charge system, but use the federal government’s large-emitter policy, or vice versa [
1]. For example, in the provinces of Alberta, Saskatchewan, and Ontario, provincially designed systems are in place for eligible industrial facilities alongside the federal fuel charge, which applies to fossil fuels used in the residential, commercial, and transportation sectors.
Consequently, the power sectors of Canadian provinces are subject to one of three types of carbon pricing systems: (1) a carbon tax (CT) system, implemented in British Columbia, (2) carbon cap-and-trade (CCAT) systems, implemented in Quebec and Nova Scotia, and different forms of output-based pricing systems (OBPS), in place in the remaining provinces [
1]. In OBPS and CCAT systems, albeit by different administrative mechanisms, emissions-intensive and trade-exposed facilities can be supported through free allocations of emissions that allow them to emit a certain amount of GHGs at zero cost [
2]. In contrast, British Columbia’s hydro-dominated power sector is subject to an unsubsidized fossil fuel charge (i.e., the CT).
Despite similar objectives, these policies vary in terms of impacts on emissions levels, generation mixes, and system costs. The impacts also depend on the characteristics of the electricity systems in question, which in Canada are unique in terms of their incumbent generation mixes and operational constraints. Additionally, provincial electric utilities or market regulators are mandated to maximize the economic benefits of their power sectors to their respective province. Almost all provinces are net exporters of electricity to adjacent regions of the United States (where rates are higher), while trade with adjacent provinces is comparatively limited [
3].
Understanding the consequences of different carbon pricing systems for power sector emissions reductions, operating characteristics, and system costs is important to academics and policymakers alike. This is especially true now as Canada’s federal government designs a regulatory framework that aims to achieve a net-zero electricity system by 2035 [
4]. To this end, several studies have examined the likely impacts of carbon pricing on the evolution of the Canadian electricity system. Most studies use electricity system planning models (ESPMs), which typically optimize system investments over time while supplying electricity generation, capacity, and transmission to meet growing demand [
3]. They solve for least-cost combinations of generation assets while being constrained by factors such as technology costs, unit availability and performance, as well as policy impacts and regulatory considerations [
5]. ESPMs have been used to study the Canadian grid as a whole [
3,
6], specific regions [
7,
8], and the integration of Canadian and American grids [
9,
10,
11,
12,
13,
14].
Most of these ESPM studies represent carbon pricing mechanisms simply as an added fuel cost without representing various OBPS or CCAT systems in place in different provinces. For instance, Arjmand and McPherson [
3] explored the future of Canada‘s national electricity system with varying CT levels, showing that Canada‘s greenhouse gas (GHG) emissions policies need to be strengthened to achieve long-term carbon reduction goals. Similarly, Dolter and Rivers [
6] analyzed the costs of decarbonizing Canada’s electricity system under different scenarios and concluded that Canada needs to increase carbon prices to achieve carbon reduction targets by 2030. Some studies that included Canada used an added fuel cost to represent carbon pricing systems while focusing on the impact of other regulatory measures [
9,
10,
11,
12,
14], while others imposed GHG emissions constraints [
8,
13]. Notably, Doluweera et al. [
7] modelled the western provinces of Canada using a carbon cap and an added fuel cost in addition to other regulations. In general, across ESPM studies, the representation of various carbon pricing systems significantly affected modelled outcomes including costs, emissions, and the electricity system mix.
In addition to studies that employ ESPMs, there are many recent ex ante energy system modelling studies that evaluate the impact of carbon pricing, among other policy instruments, in Canada (e.g., [
15,
16,
17,
18,
19]) and internationally [
20,
21,
22,
23]). Although diverse electricity systems will evolve differently subject to jurisdiction-specific policy regimes and circumstances, there are common themes that emerge from energy system modelling studies, which hold implications for Canada’s grid. In general, low-carbon techno-economic pathways share rapid decarbonization of the power sector, higher technology flexibility of the power sector compared to others, and rapid growth in electricity supply due to considerable energy end-use electrification [
24]. Although these types of studies are helpful in exploring whole-economy energy transitions, energy system models typically operate at five- or ten-year time steps and represent electricity supply–demand at a high level of abstraction. Unfortunately, low-resolution representations of the power sector likely do not capture important system dynamics such as electricity curtailment, capacity reserve considerations, flexibility requirements, demand response, and resource potentials [
25]. In contrast, ESPMs provide researchers with appropriate frameworks to explore pathways to low-carbon electricity systems by including operational details and high spatial and temporal resolution. This makes their results more technically robust than non-ESPMs by design, which is important while studying the transition of the power system [
26,
27,
28]. However, although various carbon pricing mechanisms are in place across Canada, their representation by ESPMs has been limited. This leaves a gap in the literature: none of the reviewed studies explicitly consider the range of carbon pricing mechanisms in place in Canada, thereby allowing for the investigation of electricity system evolution given the provincial heterogeneity of such mechanisms. This gap implies that past studies underrepresented the diversity of carbon pricing systems in Canada, potentially resulting in inaccurate estimation of the impacts of carbon pricing on the provinces’ electricity systems transitions. This study attempts to address this gap by incorporating diverse carbon pricing mechanisms into an ESPM to provide insights into the future of the Canadian electricity system.
The research question motivating this study is as follows: considering differences in built infrastructure and available renewable energy resources across the provinces, how might Canada’s power sector evolve in terms of GHG emissions and incurred costs subject to different carbon pricing mechanisms? We hypothesize that, broadly speaking, carbon pricing will have a significant impact on the evolution of the power system in Canada, but that it is important to model the heterogeneity of carbon pricing policies across the country. This paper makes two primary contributions to the literature in answering these questions. First, we introduce an ESPM that represents three different carbon pricing mechanisms: CT, OBPS, and CCAT systems. Second, we analyze the implications of the various carbon pricing mechanisms by simulating their impacts on provincial and national electricity system transitions using a scenario-based approach. We conclude with policy suggestions that aim to guide emissions reductions in the electricity sector.
2. Methods
The dynamic ESPM described by Arjmand and McPherson [
3], COPPER, is used here to explore the impact of carbon pricing on electricity systems in Canada. COPPER was developed to explore cost-optimal configurations of Canada’s future electricity system and represents some of the unique characteristics of Canada’s power system. The mixed-integer linear programming formulation used in COPPER co-optimizes (for least cost) generation, transmission and storage expansion over the selected planning period (1) [
3]. COPPER takes a centralized management approach to dispatching the power system in which assets are dispatched according to their place on the merit order curve; market dynamics and power purchase agreements are not accounted for.
The optimization formulation is subject to a set of constraints involving hourly supply–demand balancing, provincial planning reserve margins, thermal unit operation (e.g., ramp-rates), hydro-electric operation and new development, variable renewable generation and land use, and energy storage. Importantly, constraining provincial planning reserves in turn implicitly constrains the new construction of interprovincial transmission. That is, while building new transmission between provinces may be a least-cost pathway according to the unconstrained optimization problem, provincial governments aim to maximize the economic benefits of their electricity systems to their province, making interprovincial transmission much less likely. In addition, imports from and exports to the United States are modelled as exogenous parameters; historical data for connection points were collected and assumed to remain the same over the planning period. This simplification is a limitation of this work but was made because modelling the power system of the United States is an extensive effort that is out of the scope of this project. Furthermore, the computational resources to model the United States and Canada together, with COPPER’s spatial and temporal resolution exceeds the computational resources at our disposal. Finally, there is a high degree of uncertainty about if, when, and to what extent additional transmission capacity between the United States and Canada would be built.
The model uses an hourly temporal resolution while minimizing computational burden by using clusters of representative days (26 days per planning period) and was run in five-year increments for this study (i.e., every five years from 2025 to 2050). Regarding spatial resolution, the version of COPPER used in this study models thirteen balancing areas—one for each province except for Ontario, Quebec, and Newfoundland and Labrador, which have two each—for electricity demand, transmission, and conventional dispatch. Variable renewable energy technologies (e.g., wind and solar photovoltaic) are modelled using 2050–3050 square-kilometer grid cells, which enables the representation of renewable resource availability. We assume that the Churchill Falls power station is excluded from Quebec’s available firm capacity after 2041 and added to Newfoundland’s firm capacity. In COPPER, the generation from this facility can be exported to interconnected markets or used to supply local demand.
The original COPPER framework represented the electricity system with higher spatial and temporal resolutions than alternative ESPMs while taking into account operational constraints, which results in more robust results [
3]. However, it was limited in terms of modelling carbon pricing mechanisms and required modification to study these effectively.
2.1. Modelling Carbon Pricing Systems in COPPER
As discussed above, carbon pricing mechanisms in place for the electricity system in Canada include CT (also known as fuel charges), OBPS, and CCAT systems. For this study, OBPS and CCAT mechanisms were added to the COPPER model alongside the CT used by Arjmand and McPherson [
3]. While these three mechanisms all set prices on carbon emissions, each entails a different implementation and has distinct benefits and drawbacks [
29]. The associated methodology is detailed below, and the specific parameter assumptions for each scenario (e.g., the CT schedule) are summarized in
Section 2.2.
First, in a CT system, an extra cost is charged on the fuel price in proportion to the emissions intensities of each fuel. A price schedule is typically set out by fuel type (e.g., gasoline, diesel fuel, natural gas) and often rises over time. We model a CT in COPPER by adding to effective fuel prices based on the emission intensity of fuels and corresponding carbon price levels [
3].
Second, an OBPS is a form of government subsidy that lowers a regulated facility’s average costs—relative to an unsubsidized CT—of emitting GHGs by allocating free emissions to qualifying facilities [
2,
30]. In provincial and federal OBPS frameworks, the effect of an OBPS on carbon costs depends on the comparison of facilities’ emissions intensities of output to emissions intensity ‘benchmarks’, which represent the level of subsidy (i.e., the volume of free emissions allocations). The methodology used to set emissions intensity benchmarks varies by jurisdiction in Canada [
30] but is typically based on scaling the historical emission intensity of a facility or sector to a targeted level. For example, Alberta’s OBPS framework allows most facilities to use the less stringent of either a facility-specific benchmark or a ‘high-performance’ sector-specific standard, while Canada’s OBPS only uses the latter. Importantly, benchmarks can be specified to decline over time (increasing in stringency), effectively decreasing the volume of free allocations. Our benchmark assumptions are specified in
Section 2.2.
In the OBPS modelled in COPPER, generation assets that exceed their benchmarks are proportionally penalized with costs that increase generation price, while generation assets that emit less than their benchmarks receive revenues that decrease the generation price. Equation (2) describes this relationship, where
,
, and
denote sets of planning periods, thermal units, and hours, respectively.
is the emission intensity of the thermal type,
represents the benchmark level for that thermal type,
is the carbon price level in the planning period
, and
is the generation of thermal type
in hour
of planning period
.
Third, CCAT systems can similarly subsidize carbon costs for industrial facilities by distributing free allocations, following various methodologies (e.g., declining emissions intensity targets based on historical averages). Allowances for GHG emissions that are not covered by free allocations must be purchased. Prices for allowances are typically determined by the market but can be constrained by high and low limits (often referred to as price floors and ceilings). In Canada, the provinces of Quebec and Nova Scotia currently administer CCAT systems instead of fuel charges and/or OBPS frameworks, although Nova Scotia recently announced their intention to move from CCAP to an OBPS. In Quebec, electricity producers must buy all their allowances, except for producers that signed contracts prior to 2008 that have not been renewed or extended. In Nova Scotia, the electric utility was assigned between 5 and 6.3 megatonnes (Mt) worth of GHG emissions credits from 2019 to 2022 [
31]. Our scenario assumptions around these free allocations are discussed in
Section 2.2.
COPPER represents CCAT systems in a two-stage modelling approach. First, the model considers a CCAT with no limit on interprovincial imported power to determine the average carbon intensity (per megawatt-hour (MWh)) of all provinces in each planning period. Second, the model uses the average carbon intensity of neighbouring provinces to calculate and limit total GHG emissions of imported power in provinces with CCAT systems before running the ‘final’ carbon pricing system simulation. The model uses the following equations to penalize carbon emissions (3) and limit total emissions (4):
For each province with a CCAT system, denotes a set of neighbouring provinces. stands for the imported power from neighbouring provinces in hour and period , and represents the carbon cap limit in period .
Crucially, OPBS frameworks and CCAT systems in place in Canada have different inclusion thresholds, opt-in thresholds, and levels of cost containment. For example, although British Columbia has an industrial large-emitter system, it does not apply to electricity generation, meaning that the sector faces an unsubsidized CT. And Nova Scotia does not allow facilities with emissions below its threshold to opt into its CCAT system. These factors are important because they determine how carbon pricing affects costs for electricity systems, which in turn affects costs, emissions, and the electricity system mix, among other outcomes [
18,
30].
2.2. Scenarios
The following four scenarios were designed to explore the impacts of various carbon pricing systems on electricity systems in Canadian provinces. The carbon pricing landscape has changed quickly in Canada as different provinces continually evaluate and reconsider their approaches for complying with the federal system for many reasons. Our scenarios were designed to roughly reflect Canada’s policy environment as of December 2022. Although there has been policy development in the meantime (see
Section 2.4), the scenarios remain relevant to jurisdictions considering different forms of carbon pricing. The scenarios should not be taken as prescriptive or as forecasts of likely electricity system development. Instead, we aimed to explore the solution space by comparing results across the following four scenarios:
National CT scenario (NCT): Applies a rising CT all provinces. This scenario is used as a comparison tool to assess how the electricity system evolves with no free emissions allowances. The price rises from CAD 90 per tonne of CO2 equivalent (CAD/t CO2e) in 2025 to 170 CAD/t CO2e in 2030, then by 10 CAD/t CO2e annually to 370 CAD/t CO2e by 2050.
Federal backstop scenario (FB): Applies an OBPS to all provinces using the federal benchmark schedule. The CT that applies to residual emissions follows the same schedule as NCT.
Provincial Carbon Pricing scenario (PCP): Applies a CT in British Columbia, CCAT systems in Quebec and Nova Scotia, and OBPS frameworks in the remaining provinces. OBPS benchmarks vary by province: Alberta, Ontario, and New Brunswick use provincially determined benchmark schedules, while remaining provinces use the federal benchmark schedule. The CT that applies to residual emissions follows the same schedule as NCT. With respect to the CCAT systems, the market price of carbon, Equation (3), follows the NCT scenario’s price schedule. This scenario is used to illustrate which jurisdictions determined policy design at time of analysis.
Carbon reduction target scenario (CRT): This scenario constrains GHG emissions in 2035 to zero.
OBPS benchmarks were specified by fossil fuel types according to
Table 1. Although we specified different benchmarks according to jurisdiction in the model years 2025 and 2030, all benchmarks declined from their 2030 levels to zero by 2035 to simulate policy development around Canada’s net-zero GHG emissions target [
4]. The provincial benchmarks in the PCP scenario reflect policy expectations at time of analysis for the 2025 and 2030 model years. Additionally, the schedule for federal benchmarks in
Table 1 reflect an assumed 2% annual tightening starting in the 2023 compliance period.
CCAT systems were only modelled for Quebec and Nova Scotia in the PCP scenario. In each of these provinces, we set a power sector GHG emissions cap,
Equation (4), of 0 MtCO
2e in the 2050 model year. Additionally, we assumed that facilities in Quebec and Nova Scotia received no emissions allowances in any year. For both OPBS and CCAT systems, we did not account for inclusion thresholds, opt-in thresholds, or levels of cost containment. We also did not account for various methodologies regarding the administration of free emissions allocations. For instance, Quebec’s CCAT system has a feature that auctions a share of permits three years in advance, and Nova Scotia auctions permits after emissions occur. These market dynamics and others like them, which can affect permit prices, were not considered explicitly in our methods. Finally, to reflect Canadian legislation, all scenarios assume a coal phase-out by 2030 and performance standards applied to gas-fired power plants [
32]. Further details about the scenarios are given in the
Supplemental Material (see Section S1).
2.3. Data
The data inputs required to run COPPER and the associated data limitations are described in full by Arjmand and McPherson [
3]. Due to space considerations, we do not elaborate on them here but instead summarize the main points. In general, data were collected from an open access data set documented by McPherson et al. [
33]. Where data were not available, gaps were filled with assumptions based on the literature. Data were updated and transformed into the 2018 reference year for the following categories: generation and storage, fuel prices, transmission, demand and imports/exports, and hydroelectric facility.
2.4. Limitations
The following summary of model limitations, which involves the model’s formulation, is detailed by Arjmand and McPherson [
3]. First, COPPER uses the point of view of a central operator to explore system-wide least-cost solutions, as is the case with most ESPMs. This view is limited by its inability to capture the other objectives of stakeholders, and relatedly, the influence of the Canadian electricity system’s institutional context. Furthermore, market dynamics and power purchase agreements are not accounted for. The implication is that ESPMs can be used to provide stakeholders with insights about the cost-optimal evolution and expected path of electricity systems under different scenarios but cannot purport to forecast real-world power sector development. While this framing limits how the results should be interpreted, it is a common characteristic of capacity expansion models. Second, the optimization model may be biased, specifically when there are uncertainties in the objective function coefficients. While the access to data available in each country differs, most energy system-modelling efforts are compromised by data uncertainty. Third, the number of balancing areas is limited in consideration of computational resources, meaning that the model is unable to fully capture power flow and may overestimate the flexibility of the network. Fourth, the model ignores some constraints/costs involving thermal units and does not include some emerging generation technologies (e.g., tidal turbines). Fifth, land use limitations are not fully addressed, and the model excludes the northern Canadian territories. Sixth, the model uses exogenous demand forecasts from provincial electric utilities. Finally, imports and exports with the United States were held constant based on historical data, rather than being modelled endogenously in this work. This simplifying assumption likely does not represent how actual imports and exports will evolve over time. However, modelling the United States power system is beyond the scope of this project. As with all previous energy systems analyses, the modelling work is limited by data availability, computational resources, and the scope of the modelling exercise.
A second set of limitations involves the way that we represent OBPS and CCAT systems in COPPER, which influences our results and policy recommendations. The jurisdictions that govern each province’s carbon pricing systems in the PCP scenario are not reflective of the current policy landscape. Saskatchewan is moving to a full provincial system (i.e., they will not follow federal benchmarks into the future), and Nova Scotia is eliminating its CCAT system in favour of an OBPS. Relatedly, the benchmarks used in the FB and PCP scenarios are not reflective of current policy. Instead, they are used to illustrate alternative futures. Furthermore, the measure of OPBS costs in Equation (2) does not make free allocations mathematically explicit, meaning that we do not explicitly represent the volume of output subsidies in our cost analysis and only represent costs from the power sector’s point of view. Next, we approximate CCAT systems in this study by functionally applying a CT with an additional emissions cap constraint instead of modelling a credit market. The associated assumption that future permit prices will align with the federal backstop CT schedule may be overly costly. Currently, the price floors in the Quebec and Nova Scotia CCAT systems are about a third of the federal backstop. Additionally, although Nova Scotia allocated between 5 and 6.3 MtCO2e worth of free emissions allowances annually to the electricity sector from 2019 to 2022, we do not project these allocations forward into the 2025 model year or beyond. Also, our representation of CCAT systems does not consider dynamics around permit auctions than can influence prices. For instance, Quebec’s system auctions a share of permits three years in advance, which reduces average permit prices. Finally, as mentioned above, we do not account for inclusion thresholds, opt-in thresholds, or levels of cost containment. However, these factors all affect how OBPS and CCAT systems impact regulated facilities.
3. Results
This section explores potential electricity system transitions in each of the four scenarios in terms of GHG emissions and power sector costs, as well as cost-optimal infrastructure build-out pathways.
3.1. GHG Emissions and Costs
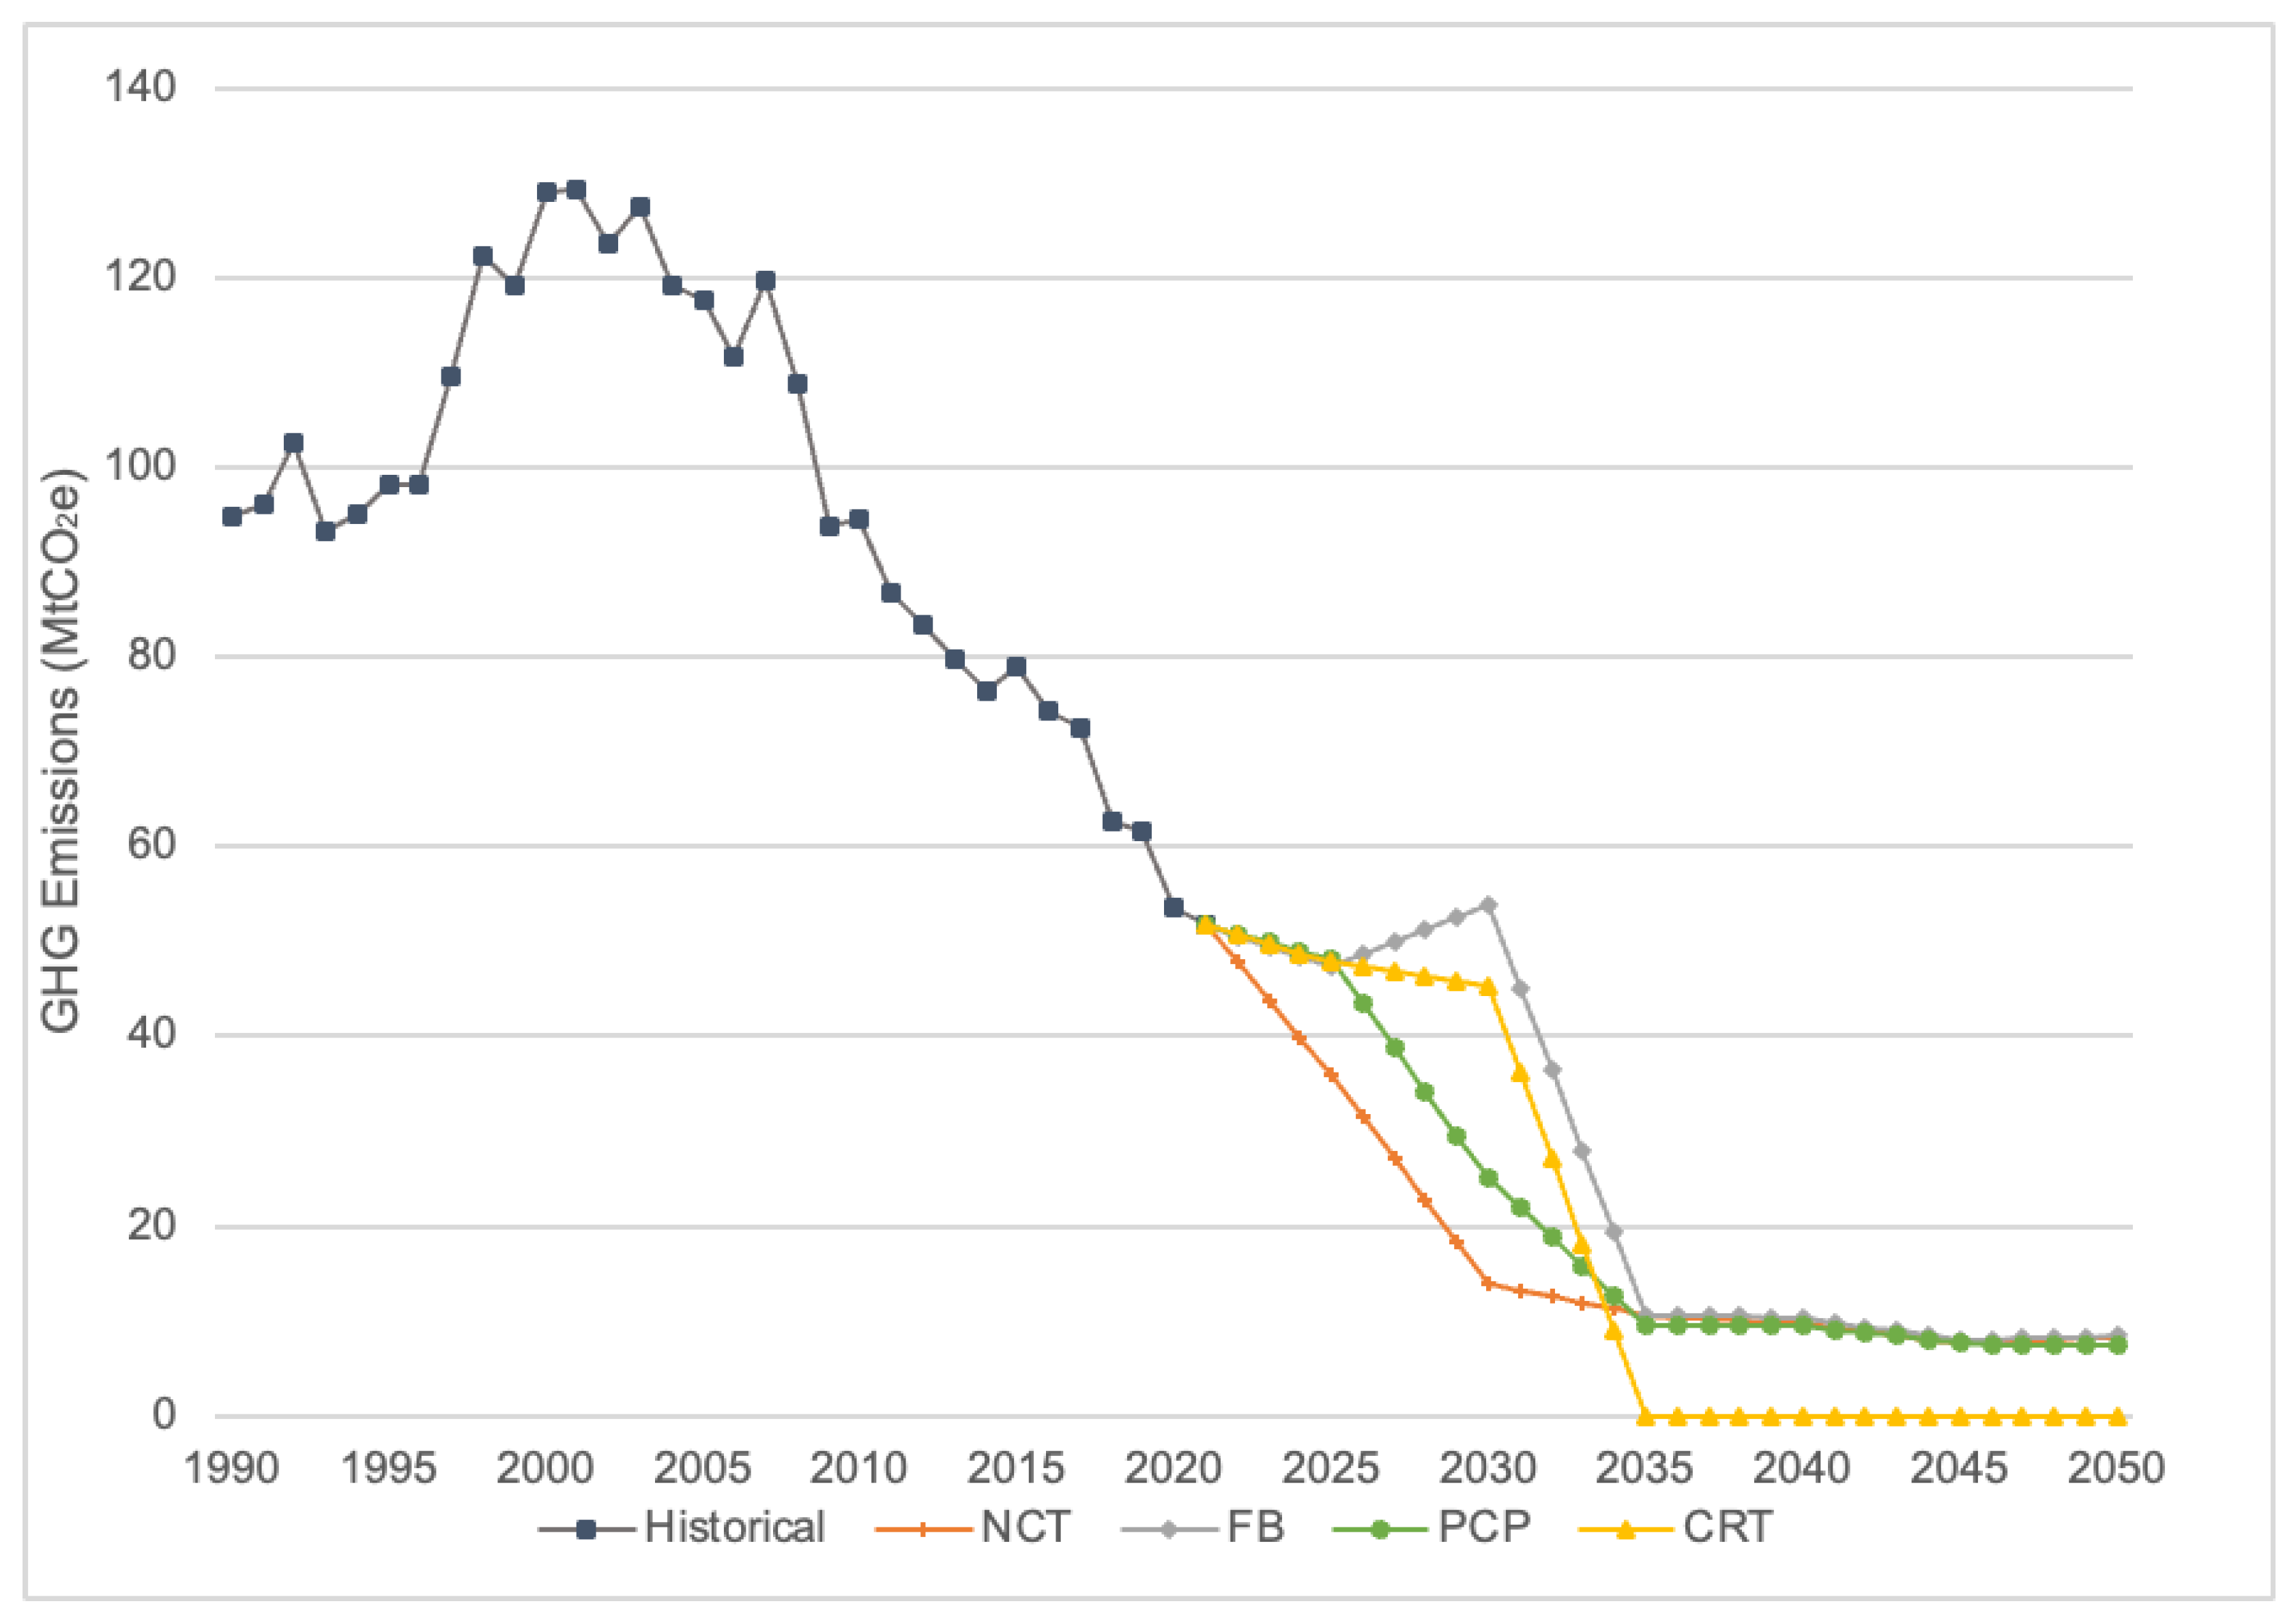
All four scenarios achieve significant GHG emissions reductions in the long term. In all scenarios, electricity system emissions at the national level are below 10 MtCO
2e by 2050. However, while final-year emissions are similar for each scenario, the transition pathways differ substantially, and consequently, so do cumulative emissions (
Figure 1). The NCT scenario exhibits the lowest cumulative emissions due to early emissions reductions (between 2022 and 2030). The CRT scenario’s cumulative emissions are higher than in the NCT scenario because high-emitting generation units remain in operation until the hard zero-emissions cap in 2035 forces them to retire.
The PCP and FB scenarios incur similar power sector costs—about CAD 65 billion (all costs given in 2018 CAD), roughly 10% less than the NCT scenario—but PCP cumulative emissions are significantly less than FB. The CRT and NCT scenarios are the costliest pathways to the power sector, with cumulative costs exceeding CAD 70 billion for the six representative years (CAD 73 billion for CRT and CAD 72 billion for NCT), due to the national zero-emissions cap and the lack of free emissions allowances, respectively.
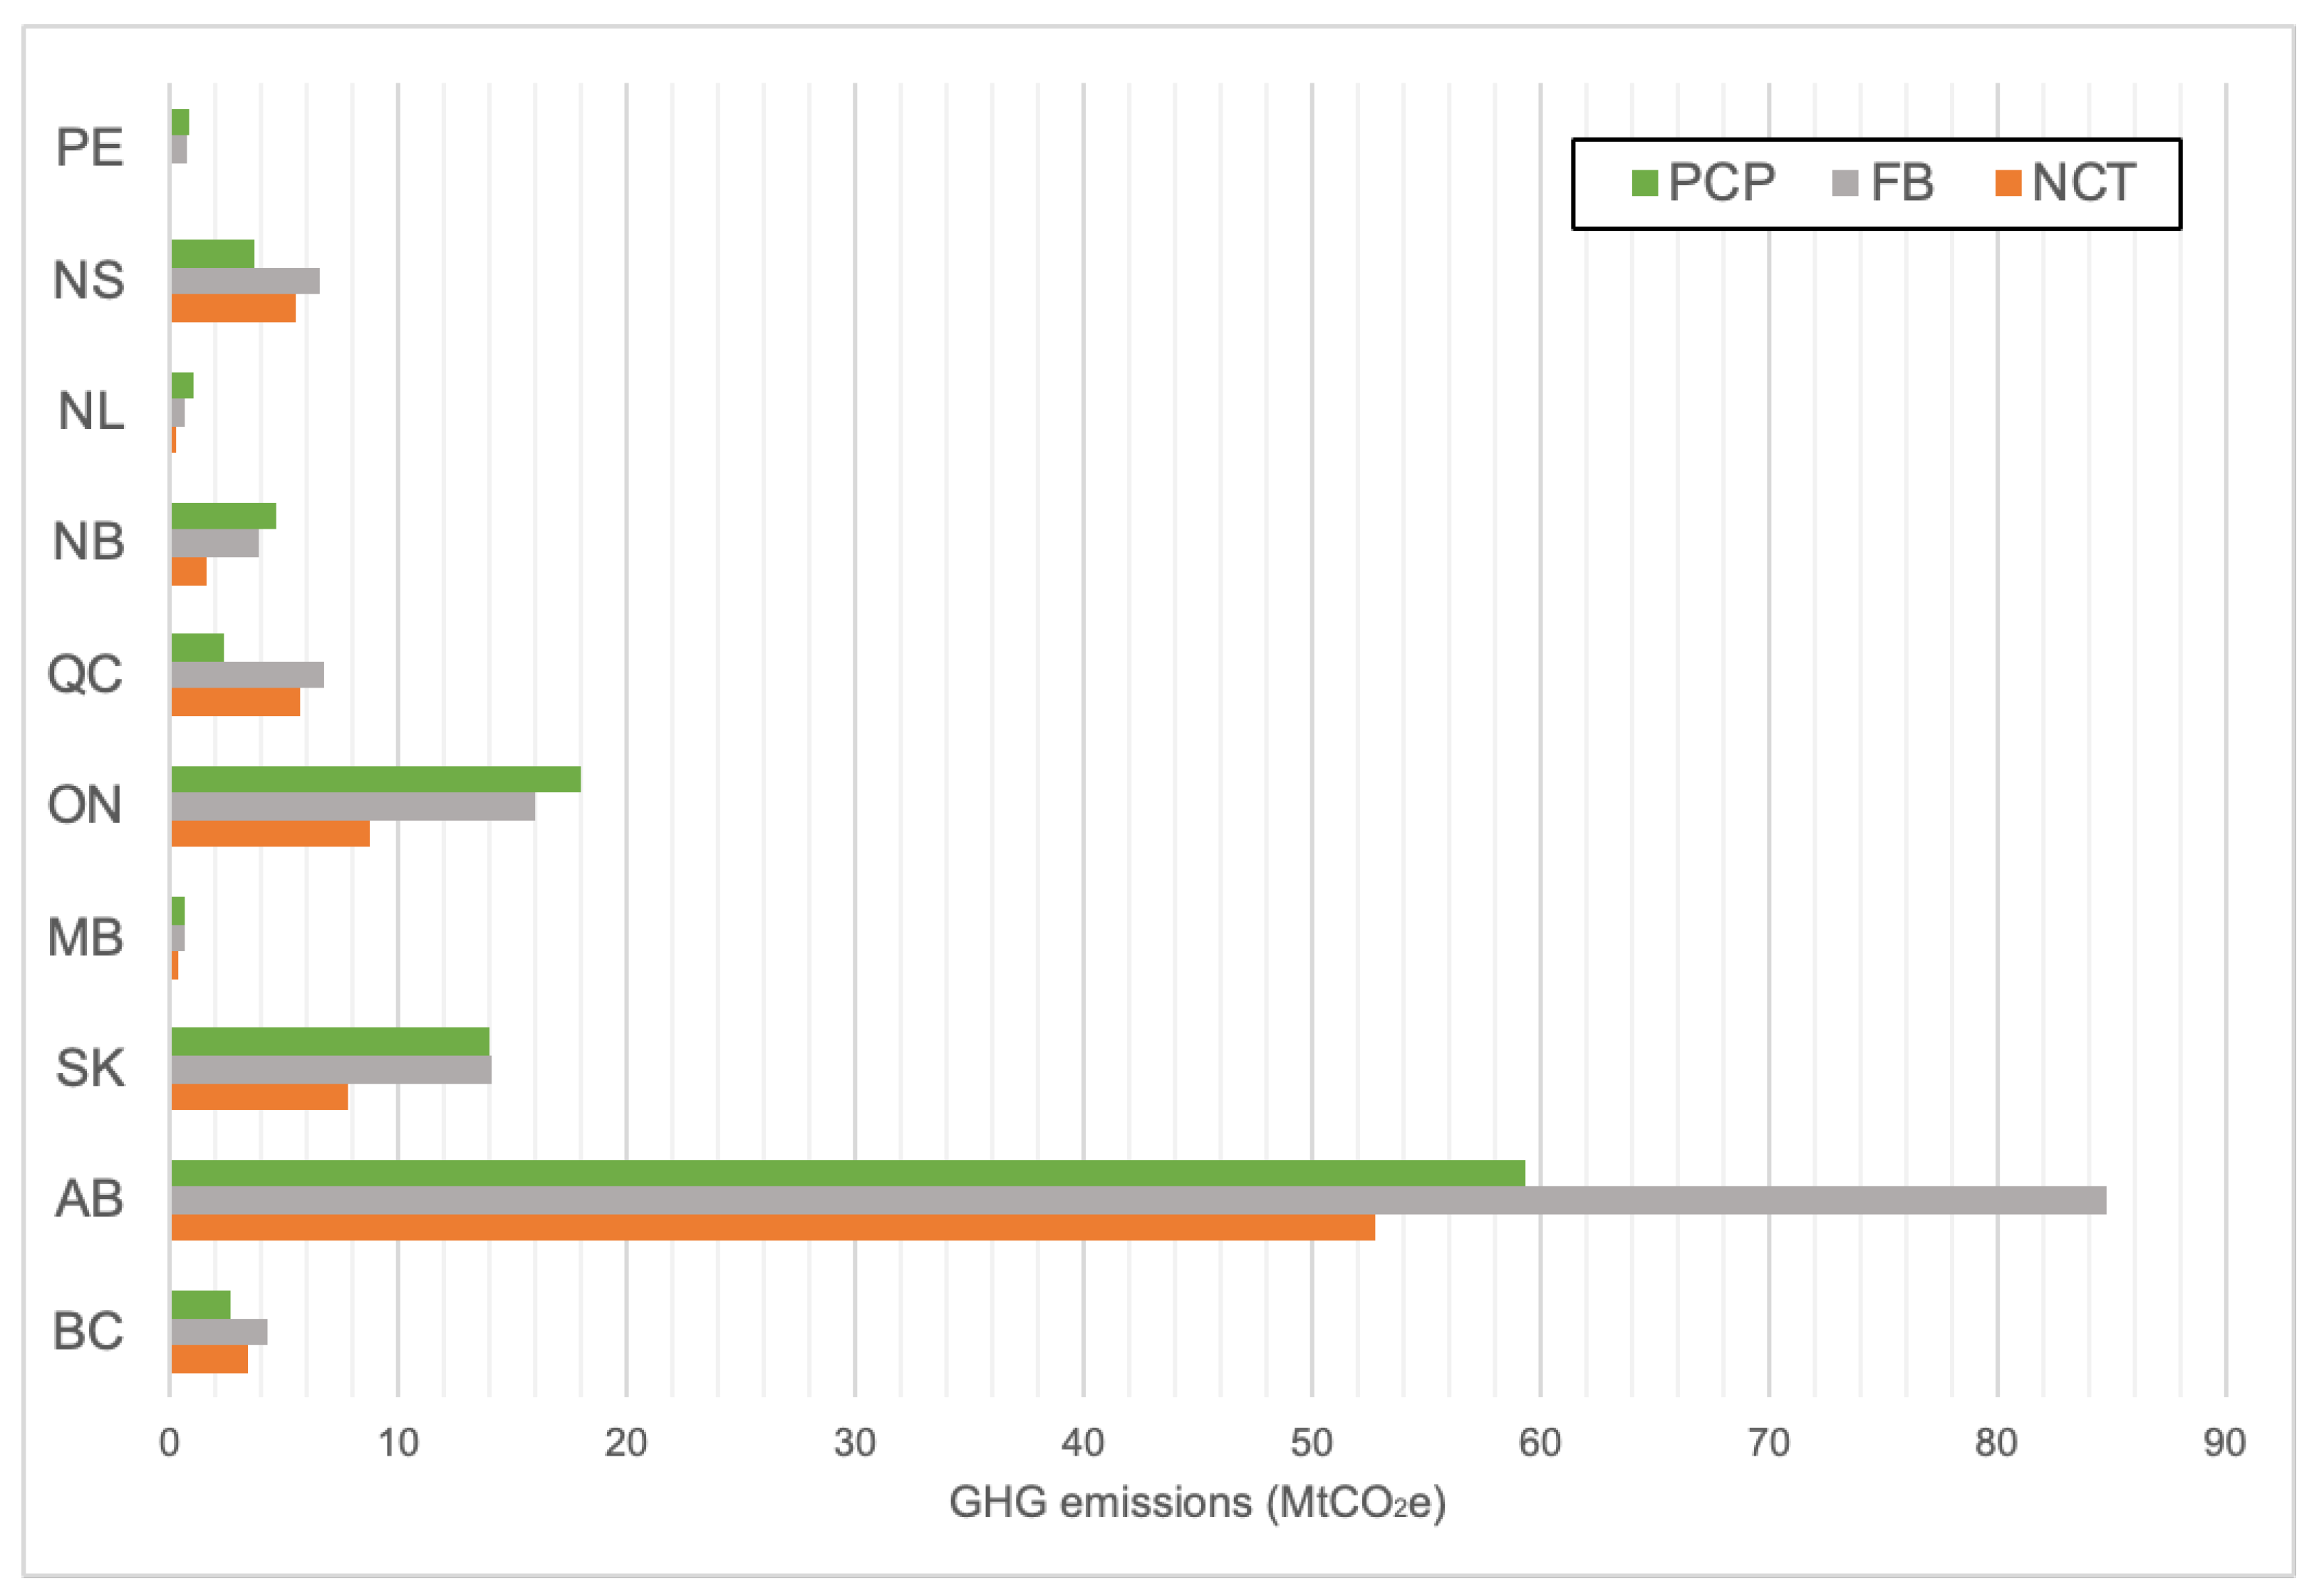
A provincial breakdown of emissions levels reveals the reason for the difference in cumulative emissions between the FB and PCP scenarios (
Figure 2). Under FB, the OBPS benchmark for new gas-fired units in 2030 is zero, while under PCP, the benchmarks are 360 kgCO
2e/MWh or higher (recall that these differ by jurisdiction). This difference makes gas with carbon capture and storage (gas CCS) cost-effective five years earlier in the PCP scenario compared to the FB scenario. For instance, the results show around 10 GW of new gas CCS units built in Alberta (AB) by 2030 in the PCP scenario. But in FB, the model postpones this build to 2035 and meets demand by adding more gas-fired combined cycle (gas CC) units and operating them at higher capacity factors.
The PCP scenario exhibits the lowest emissions for British Columbia (BC), Quebec (QC), and Nova Scotia (NS)—the provinces that do not use an OBPS framework in that scenario. In AB, total emissions in the PCP scenario are less than the FB scenario but more than the NCT scenario, while in Saskatchewan (SK) and Manitoba (MB), emissions are virtually the same (reflecting their implementation of the federal benchmarks in the PCP scenario). Ontario (ON), New Brunswick (NB), and Newfoundland and Labrador (NL)—the provinces interconnected with a province that implements a CCAT system—experience higher emissions levels compared to the FB scenario. Interestingly, a hard cap on emissions in provinces using CCAT systems results in an increase in the emissions of neighbouring provinces due to limited interprovincial imports.
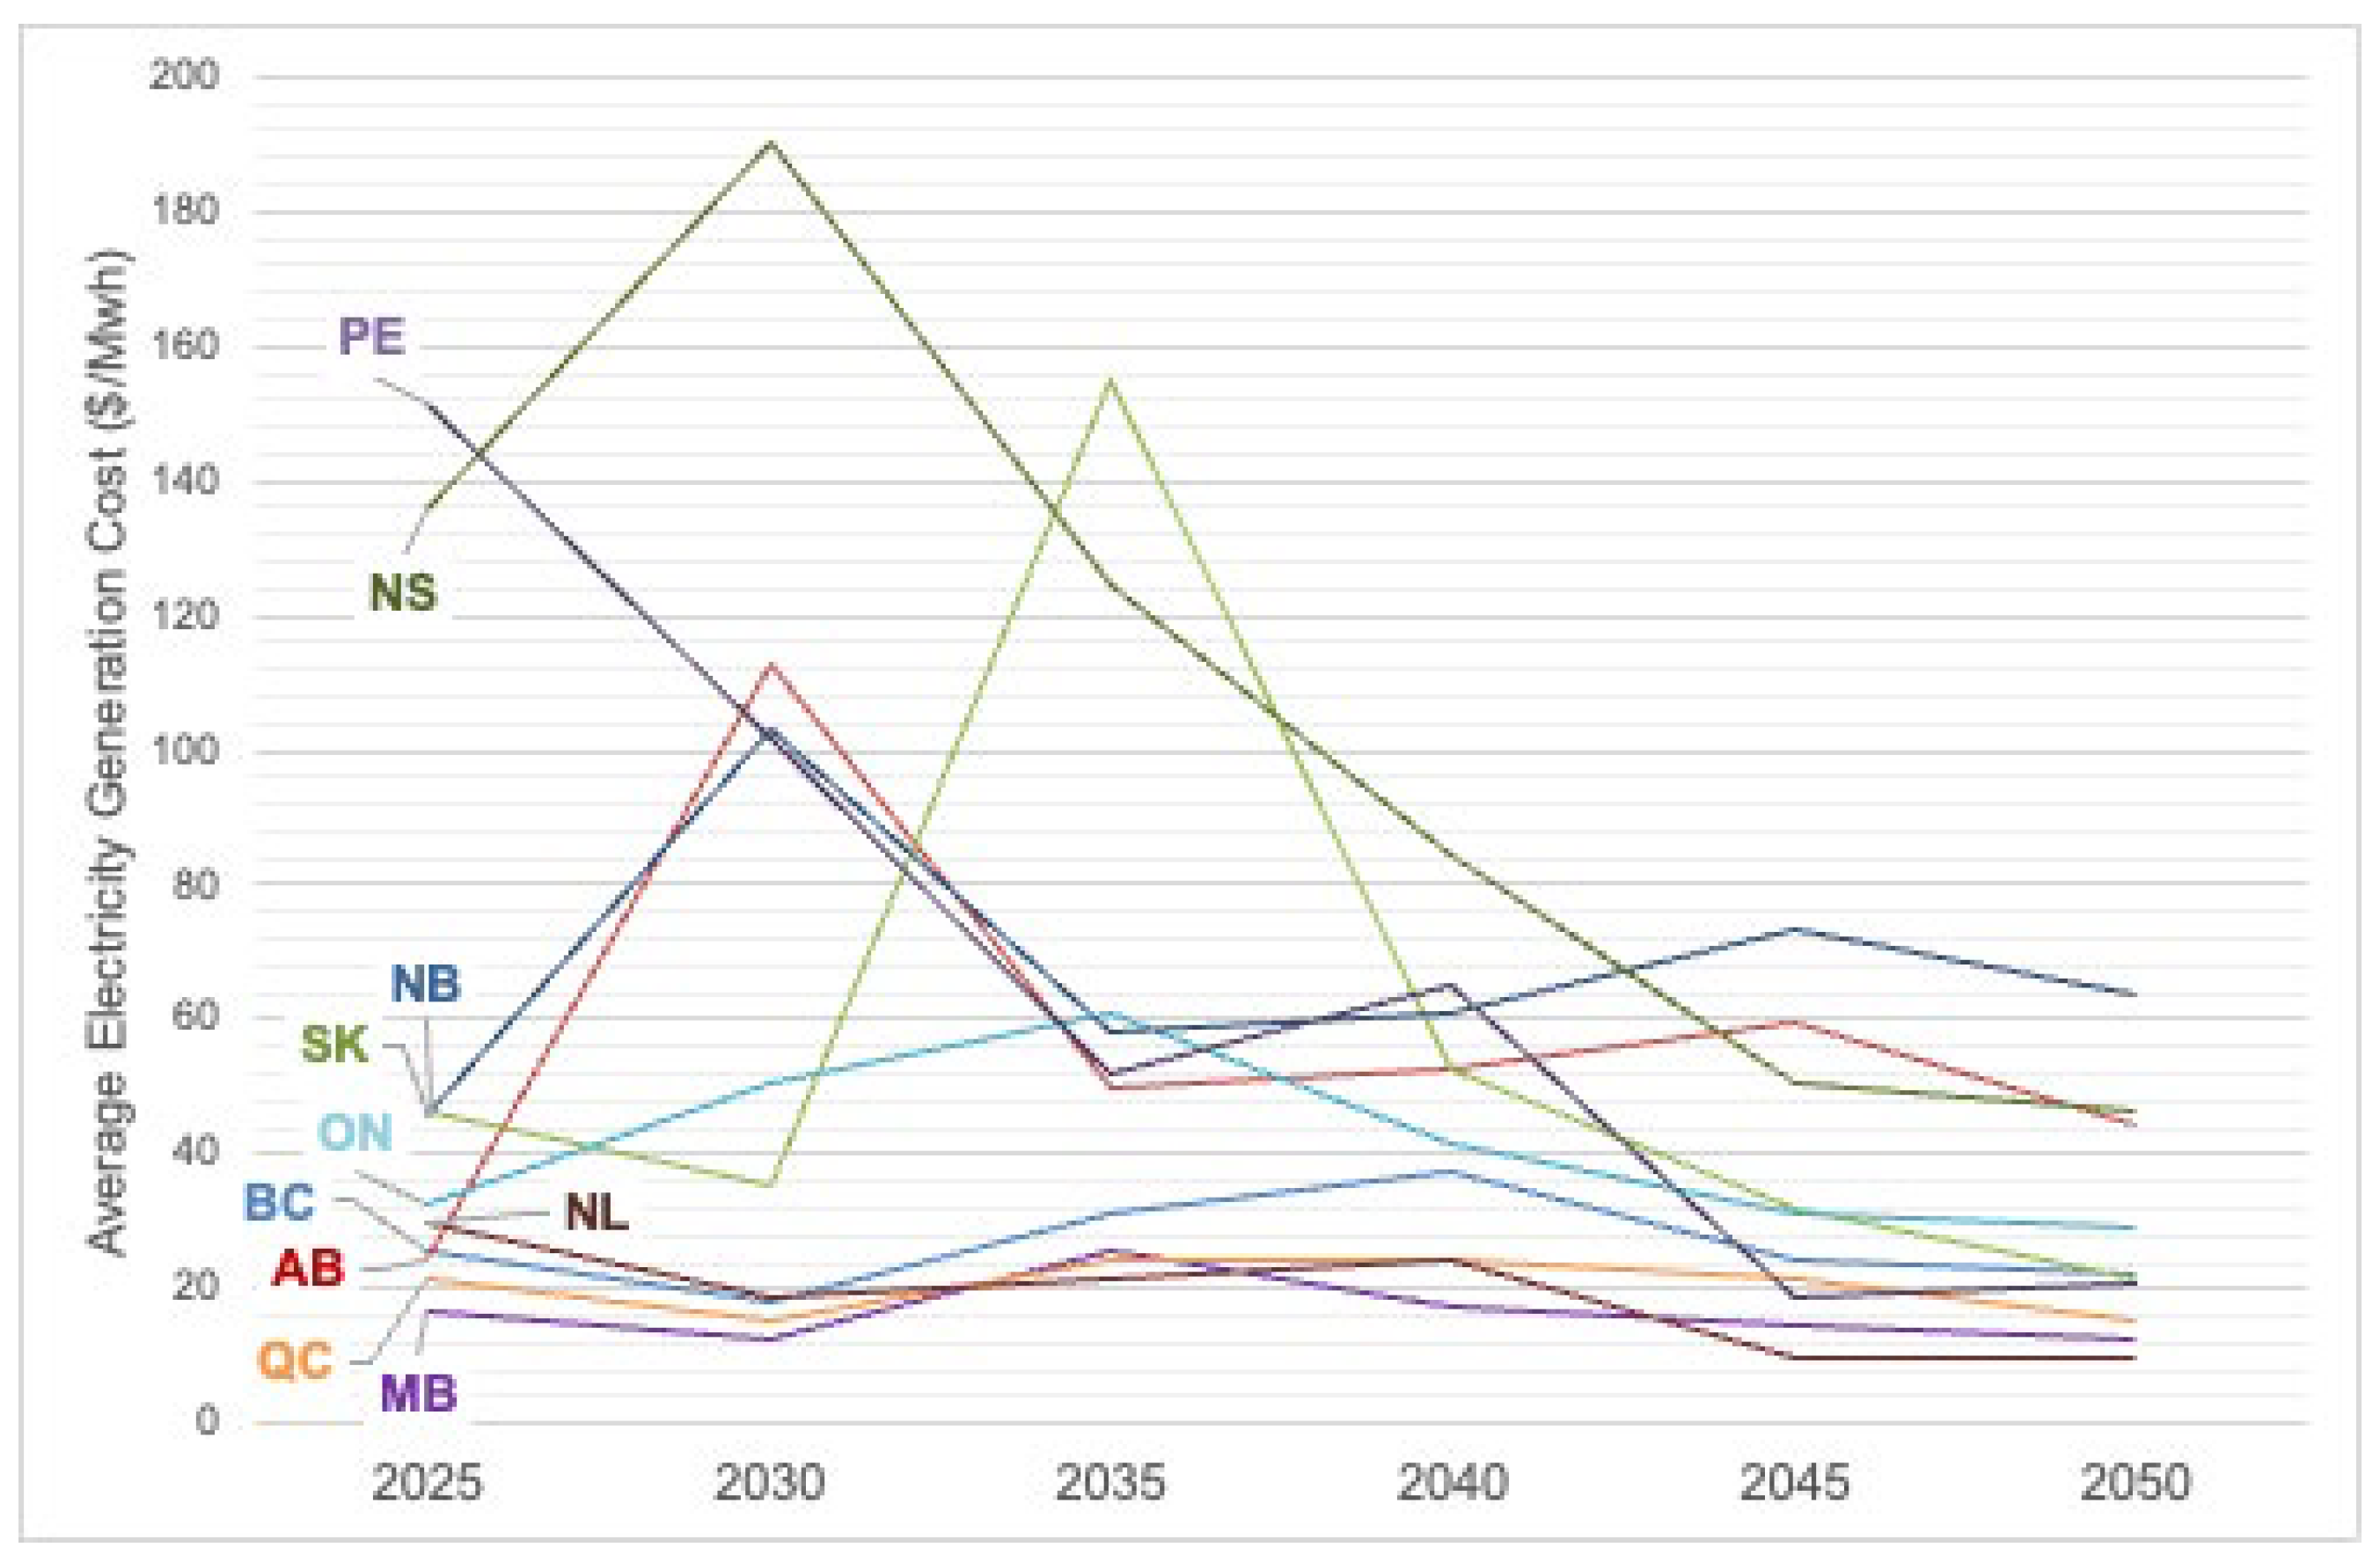
To assess the effects of the electricity system transition on generation costs across different provinces in the PCP scenario, we calculated the average cost of electricity generation by province (
Figure 3). The transition has less impact on electricity generation costs in hydro-dominated provinces (BC, MB, QC, and NL) as these provinces keep most of their existing hydro capacity operational until the end of the study period. Also, in all provinces, electricity generation costs decline towards the end of the study period such that in six provinces—the four hydro-dominated provinces plus SK and Prince Edward Island (PE)—prices are near or less than 20 CAD/MWh by 2050.
SK and AB experience increases in electricity generation costs from 2030 to 2035 due to large investments in wind and the transition from coal- to gas-fired units, respectively. Similarly, investment in new generation units increases generation costs in NS and PE from 2025 to 2030, after which costs return to lower levels in the 2045–2050 period. Costs in ON and NB fluctuate between 29 and 61 CAD/MWh and 45 to 103 CAD/MWh, respectively. Further details on costs are presented in the
Supplemental Material (Section S1).
3.2. Generation Mixes
This section assesses the baseline generation mixes of provinces under the PCP scenario, including retirement schedule, new installed capacity, and total installed capacity for two policy-relevant years: 2035 and 2050; 2035 is the federal government’s net-zero emissions target year and the year that the OBPS benchmark for all generation types is set to zero in this study, and 2050 is the economy-wide zero-emissions target year and the end of the study period.
3.2.1. Transition by 2035
Figure 4a shows capacity retirements and additions in the PCP scenario by 2035. All coal-fired electricity generation in AB, SK, NB, and NS is phased out before 2035. Also, partial retirements of diesel, gas-fired simple cycle (gas SC), and gas CC electricity generation occur in all provinces except for BC, QC, and MB due to end-of-life or cost non-competitiveness by 2035. Gas CC, gas CCS, wind, and solar are the most cost-optimal options to replace retired capacity. Renewables (mostly wind) account for more than 50 percent of new installed capacity by 2035 in all provinces except for BC, AB, and NB, in which gas CCS accounts for most new additions. Despite being an emissions-intensive technology compared to renewable sources, new gas CC units are built in six provinces including ON, NS, QC, SK, NL, and PE. Accordingly, it appears that to achieve carbon reduction goals, including zero emissions by 2035, provincial governments will need to introduce additional measures that curtail investment in gas-fired units compared to those represented in the PCP scenario. Notably, as there are significant uncertainties and concerns regarding financing, regulatory support, technology development, and the social and environmental acceptability of CCS technologies [
34], the role of these technologies in electricity system decarbonization is uncertain. Sensitivity analysis shows that if new gas CCS units are constrained, the model deploys a combination of gas CC, wind, and solar instead.
3.2.2. Transition by 2050
The PCP scenario shows fossil fuel generation becoming uneconomical and progressively replaced by renewables between 2035 and 2050.
Figure 4b shows the provincial generation mixes between 2035 and 2050 in the PCP scenario. Renewables account for 96% of new installed capacity after 2035 due to ongoing declines in their costs, increased carbon price levels, declining emissions benchmarks, and carbon caps in provinces with CCAT systems. The remaining diesel units in NS and NB are phased out between 2035 and 2050. Hard emissions caps in 2050 force the retirement of the remaining gas CC units in QC and NS; in AB (with an OBPS), more than half (6 GW) of its gas CC capacity is phased out as it becomes cost non-competitive. Seven provinces add only renewables (mostly solar) in this period, and BC, ON, and NB are the only provinces to install gas-fired generating units after 2035. The share of capacity additions represented by gas-fired units is small in BC and ON (10% and 2%, respectively), while in NB, 73% of new installed capacity is gas-fired (primarily gas SC).
Importantly, ON, QC, and NS add energy storage (energy storage options in this study aredescribed in full by Arjmand et al. [
35], include pumped hydro storage (PHS) and lithium battery (LB)) to satisfy planning reserve margins and deliver flexibility to handle variability in renewables output. ON has high penetrations of inflexible nuclear and non-dispatchable renewable capacity by 2050, necessitating substantial storage capacity. The emissions caps in QC and NS alongside variable renewable additions also necessitate storage. Overall, the results suggest that wind, solar, and energy storage will become the most cost-optimal alternatives after 2035 in all provinces, except for NB.
Figure 5 shows the modelled provincial generation mixes as of 2050. AB and NB exhibit the smallest shares of non-emitting technologies by this time (52% and 58%, respectively), while QC and NS achieve 100% non-emitting generation. The penetration of non-emitting generation in other provinces is between 85% and 93%. By 2050, BC, SK, MB, and ON retain gas SC capacity, an emissions-intensive technology, to provide needed system flexibility given high renewables penetration.
5. Conclusions
- (1)
Each of the carbon pricing scenarios results in significant GHG emissions reductions by 2050, but the magnitude of cumulative reductions, their cost to the power sector, and associated transition pathways vary.
Diverse carbon pricing mechanisms in the PCP scenario are preferable compared to a national CT or OBPS, both in terms of costs to the power sector and cumulative emissions reductions. The PCP scenario—representing Canada’s policy landscape at the time of analysis—sees the power sector incur similar costs to the federal OBPS applied universally (the FB scenario) but results in cumulative emissions 30 MtCO2e lower over the six studied years. The difference is due to gas units with carbon capture and storage becoming cost-effective five years earlier in the PCP scenario compared to the FB scenario. This itself is a result of our stringency assumptions; in the FB scenario, the OBPS benchmark for new gas-fired units in 2030 is zero, while under PCP, the benchmarks are 360 kgCO2e/MWh or higher. A national carbon tax (the NCT scenario), on the other hand, results in cumulative emissions 20 MtCO2e lower than PCP policies but increases costs incurred by the power sector by 10%.
- (2)
None of the policy scenarios result in Canada achieving its goal of net-zero power sector GHG emissions by 2035.
While the FB and PCP scenarios assume that OBPS benchmarks for all generation technologies go to zero by 2035, there is still a gap between emissions and Canada’s carbon reduction goal. Thus, to achieve the stated goals, Canada will need to reduce accommodations for high-emitting electricity generation, for example, by decreasing OBPS benchmarks and/or increasing carbon prices more rapidly than modelled here, or using different regulatory measures, as is now planned [
4].
- (3)
The diverse carbon pricing mechanisms represented by the PCP scenario generally improve modelled outcomes in terms of power sector costs and GHG emissions.
The diversity in carbon pricing schemes across the country produces better outcomes (when compared to the FB scenario) for most provinces, except for provinces interconnected with those with CCAT systems in place (i.e., neighbours of Quebec and Nova Scotia). Affected provinces may wish to consider the effects of neighbouring provinces’ emissions caps on their own electricity system transitions. Different carbon pricing systems have different impacts on the power sector. The results of this study indicate that there is no one-size-fits-all solution. Policies that aim to make progress towards achieving Canada’s climate targets should be designed with attention given to provincial contexts and energy resources.
In summary, emissions-intensive provinces experience substantial emissions reductions in the long term, while hydro-dominated provinces maintain low emissions despite increased electricity demand. In some provinces, emissions reductions are achieved by switching from fossil fuel generation to renewable sources, while in others, they are achieved by transitioning from high-emissions generation sources to lower-emissions fossil fuel technologies such as combined cycle gas plants and gas paired with CCS. However, carbon pricing at the stringencies modelled here is not sufficient considering Canada’s zero-emissions goal for the power sector by 2035. If Canada aims to achieve net-zero emissions in the electricity sector by 2035, our modelling suggests that the construction of new fossil fuel electricity generation, even paired with CCS, is not advisable. Notably, this result goes against the prevailing political narrative that in some provinces (e.g., Alberta), CCS will play a significant role in the electricity system going forward.


