Article

Urban Greening in the Process of Climate Change Adaptation of Large Cities

Faculty of Architecture, Silesian University of Technology, 44-100 Gliwice, Poland
*
Author to whom correspondence should be addressed.
Energies 2024, 17(2), 377; https://doi.org/10.3390/en17020377
Submission received: 21 November 2023 / Revised: 4 January 2024 / Accepted: 6 January 2024 / Published: 12 January 2024
(This article belongs to the Special Issue Smart Green Cities—Energy Treatment and Management)

Abstract

:
Cities—being places where both growth at large and human activity concentrate to the maximum extent, as well as being places of creation, innovation, and development—have been facing the challenge of adaptation to changing climate conditions. Successive greening of urban spaces is becoming an indicator of civilisational progress and one of the most important aspects of sustainable urban development and quality of life of city dwellers. It also represents a part of the sustainable management of natural resources and energy in the urban environment. This article addresses the subject of urban space greening, perceived as one of the ways of mitigating the effects of climate change. The study focuses on a comparative analysis of various planning and implementing activities related to green areas, as well as on available quantitative data on the greening and climate change adaptation of 44 Polish cities with urban adaptation plans (UAPs) in place. The research, covering the years 2017–2023, identifies the variety of urban greening methods, initiatives, and tools used in the process of urban planning and urban design. The results of the study showed that measures planned by local authorities lacked detailed tools as well as a long-term and systemic approach to greenery, energy, and space management. On the other hand, what was observed in the implementation was an apparent prevalence of urban acupuncture spots and a failure to make the most of all the benefits of the adaptive, social, and ecosystem-forming role of urban greening. The authors imply that their research can be used to formulate conclusions and guidelines for urban development policies which highlight the role and raise the importance of the greening of Polish cities under all urban investments, particularly in the process of adaptation of urban areas to climate change.

1. Introduction

1.1. Context of the Problem and Purpose of the Research

Cities are natural habitats of humans. This seems obvious, and yet, on the one hand, the duality of human nature leads to people’s tendencies to juxtapose dwelling places with nature, while on the other hand, people seek to live close to nature [1]. The search for a balance between the natural and built environment manifests itself in both the spatial and functional structure as well as urban composition, but also in the urban natural systems and lifestyle of inhabitants. As socio-economic, cultural, and natural conditions have changed, the ways in which cities, nature, and humans relate to one another have also evolved. The predominant consumerist attitude towards nature and its resources in the past, has undergone transformation. Ecological awareness has emerged, emphasising the need to establish a partnership between human beings and nature, and making the trend towards growth-balancing significantly more discernible [2]. Greenery has become a factor in overcoming the challenges associated with the pace of life in highly urbanised societies [3,4]. Attention has shifted towards the potential of green areas to provide ecosystem services—basic, provisioning, regulatory, and cultural—that yield measurable economic, social, and environmental benefits for cities [5]. The current challenges facing civilisation have necessitated a continuous search for optimal solutions to achieve compact, green, resilient, and sustainable cities. Green areas have become a crucial element in the urban strategies of adaptation to climate change, and the role of greenery in adaptive and mitigative activities has been emphasised. Since large urban centres are particularly vulnerable to climate change, maintaining adequate proportions between urban natural and built features, preserving the continuity of natural systems, as well as protecting, creating, and appropriately managing urban green areas have become essential to both sustainable urban development and the struggle against the adverse consequences of climate change. Cities in transition have been striving to create new urban systems based on natural structures. The development of blue–green infrastructure, the implementation of nature-based solutions (NbSs), urban greening, biodiversity conservation, and the sustainable management of greenery and water bodies make cities more resilient, influencing their social and economic well-being, and providing a healthier and more attractive living environment. Functioning within a well-designed green urban environment has become a determinant of the quality of city life, encompassing aspects such as a sense of security, health, social relationships, freedom of choice and action, and the foundation for a dignified life [5]. Architects and urban planners are crucial to this process as they utilise both the constraints and the opportunities posed by climate change while shaping resilient and appealing urban spaces serving residents in the most effective fashion. The planning and implementation of innovative solutions determine the success of this approach.
This article delves into the topic of the importance of increasing urban greening in cities to tackle climate change impacts. The implementation of strategies and programmes by cities for the renewal, development, and adaptation of urban spaces to climate change through successive greening contributes, by definition, to solving environmental, spatial, and social problems. This, in turn, leads to improving the quality of life of residents and promotes sustainable development at the local level. The aim of this article is to analyse planned and implemented activities related to greening and adaptation to climate change in 44 large Polish cities with urban adaptation plans (UAPs). These cities differ in structure, degree of socio-economic development, degradation levels of individual elements of the natural environment, density of development, land use, and sensitivity of individual zones to climate change. However, a commonality among them is a systemic approach to climate change adaptation and awareness of the role of greening in increasing the resilience of urban spaces, their attractiveness, and the well-being of residents. The research, covering the period 2017–2023, serves as the basis for identifying the connection between urban greening and climate change adaptation, as well as the relationship between planning, theory, and urban practice.

1.2. State of Research

Urban greening analysed against the context of climate change adaptation is a subject which has been continuously explored over recent years [6]. Depending on terrain characteristics, spatial assumptions, technical possibilities, and residents’ needs, urban greenery serves various functions: biological, educational, economic, aesthetic, recreational, and leisure-related. Considering the relevant natural, functional, and locational factors, urban greenery can vary in terms of size, the species composition of vegetation, as well as its arrangement and development. Urban nature comprises parks, squares, lawns, urban forests, areas used for agriculture, allotment and backyard gardens, private gardens, surface greenery along transportation routes; roadside trees, tree clusters, individual trees, shrubs, and small clumps of greenery; vegetation on banks of watercourses and reservoirs, as well as areas of spontaneous succession [1]. If adequately utilised, an understanding of urban greenery becomes a significant factor of urban development [7,8,9]. The European Biodiversity Strategy for 2030 emphasises the importance of creating green areas. It also highlights the need for tree planting and the development of green infrastructure in cities to mitigate and reduce the negative effects of climate change [10,11]. In recent years, concepts related to urban nature, such as green infrastructure, NbSs, and urban ecosystem services, have grown in importance. The European Commission defines green infrastructure, regardless of its location in urban or rural areas, as a network of natural and semi-natural areas that provide ecosystem services and support biodiversity [12]. NbSs are a broad concept used in urban planning policies, encompassing various approaches to urban greening [13]. NbSs include ecosystem-based adaptation (EbA), blue and green infrastructure, ecological engineering, and many more solutions [14].
What proves particularly important within the thematic scope addressed in this paper are the studies pertaining to the role of urban greening against climate change adaptation [15]. Greenery improves microclimates [16], increases air quality, and reduces noise pollution [17]. Some studies encompass mitigation of urban heat islands and floods, as well as the potential benefits behind hydrological and thermal efficiency [18]. The variety of strategies proposed comprise increasing the presence of urban greenery using green roofs, green walls, or vegetated urban spaces [19,20]. A significant focus in research is on supporting local ecosystem services. Many studies imply that urban nature, green infrastructure, NbSs, and the processes taking place in nature should be utilised to manage and create healthier urban environments [21]. Research clearly demonstrates the abundance of health, climate, environment, and economy-related benefits of greening. These benefits can be expressed in measurable, quantitative, and financial terms [22], and can be measured by the decline of urban pollution (carbon sequestration and solid particle filtration), water regime regulation, biomass production, reduction of greenhouse gas emissions, increase in property value (impact of green neighbourhoods), improvement in productivity (greenery viewed from workplaces), reduction of cooling demand, optimisation of daylight entry, shading by greenery, temperature reduction by greenery, and decrease of energy costs (providing insulation and shading, making buildings cooler in summer and warmer in winter) [23].
Numerous studies confirm the positive impact of green areas on the quality and attractiveness of urban spaces, the health of city dwellers, as well as their activity levels and capacity for regeneration [24,25]. Research spans various spatial scales, including regional and local perspectives [26,27]. Many of these studies were carried out within the framework of a sustainable approach to strategic and implementation activities [19]. Some identify the needs and preferences of different social groups, such as residents, experts, planners, and urban space managers [28].
The benefits of greening can also be assessed in an immeasurable way by studying human–environment interactions, combining natural structures and ecological functions with services useful to urban residents [29,30]. The use of adequate tree and plant species, and the availability of parks and open spaces are associated with physical activity [31], leisure, and diverse forms of recreation [32], creating a sense of place and cultural identity [33]. Additionally, studies show that contact with greenery improves mental health, which consequently reduces mortality and incidence of chronic diseases [34], and strengthens social relationships, including those between neighbours [35]. Man-made urban green areas, properly designed in terms of species diversity, can effectively increase biodiversity [36,37]. The latter can be both preserved and enhanced by linking in-city natural areas, enabling wildlife migration [12].
While it appears that urban greening is perceived as the ultimate solution to urban issues, other studies highlight its problematic aspects, such as the spread of allergens, the emission of volatile organic compounds, the diseases transmitted by urban animals, the damage to infrastructure and facilities, or the decreased sense of security [38,39,40,41,42]. Furthermore, various aspects of urban greenery have not been sufficiently studied, including the environmental impact of greenery, the costs behind the implementation of green solutions, and outdoor thermal comfort [6].
In this article, the problem of urban greening has been addressed in the context of adaptation to climate change and the relationship between theory, planning, and the implementation of solutions in the urban space of multiple Polish cities. Such an approach to the matter in question is a rarity across the literature on the subject, and to the best of the authors’ knowledge, Polish cities have not yet been compared with one another from this perspective of green planning and implementation.

1.3. Development Policy of Polish Cities in the Context of Greening and Adaptation to Climate Change

The local development policies of Polish cities leading to urban greening in the context of adaptation to climate change require cohesion with the EU guidelines as well as the relevant national and regional policies, to be ensured. Polish national and local planning and strategic documents are inextricably linked with the greening policy envisaged in the documents adopted by the European Commission. The European Union’s policy encourages member states to undertake specific measures, including to increase biodiversity in urban areas. One of the key provisions of the Biodiversity Strategy for 2030 urges European cities with a population of inhabitants greater than 20,000 to develop urban greening plans [10].
With reference to the provisions of the Biodiversity Strategy for 2030, the Polish National Urban Policy 2030 [43], adopted in 2022, proposes a range of solutions that position the activities related to urban greenery towards the adaptation of cities to climate change. Among its variety of solutions, it envisages the introduction of blue–green infrastructure management plans as a step towards systematic resource management of blue–green infrastructure in cities. Furthermore, the document recommends that cities introduce standards for the protection and shaping of greenery in investment processes, including limitations on tree felling. It also advocates legal subjectification of blue–green infrastructure. These activities are not referred to as greening per se, since in Poland this process is associated with vegetation planting, especially of trees, which is not a broad enough notion in the context of all the possible measures undertaken in the process of urban space greening. Blue–green infrastructure management plans for cities do not have to be separate and elaborate documents of urban policy. They can be part of larger documents or plans, especially those considering the organisational and financial capabilities of individual cities [43]. Such plans may be included, for example, in UAPs.
UAPs have become widespread in Poland thanks to the initiative taken by the Ministry of Climate and Environment aimed at developing 44 adaptation plans for cities with a population exceeding 100,000 inhabitants. The project was implemented between 2017 and 2019, and on account of its sheer scale, it represented the largest initiative of such nature in Europe. All 44 UAPs followed a uniform methodology described in the Adaptation Handbook for Cities [44].
In 2021, work commenced in Poland on the Draft Law on the Amendments to the Environmental Protection Law and Certain Other Laws. The purpose of the Draft was to introduce provisions strengthening the climate dimension of urban policy and supporting environmentally friendly initiatives in cities by taking the measures related to climate change adaptation into account. The rationale behind the provisions outlined in the Draft was to obligate cities with a population of inhabitants equal to or greater than 20,000 to develop UAPs and to incorporate the conclusions and recommendations arising from these plans into their local strategic and planning documents. The Draft was planned to be adopted by the Council of Ministers in the second half of 2023 [45].
An important part of the policy for the greening of Polish cities has been initiatives conducted under a facility referred to as a participatory budget, implemented since 2011. These initiatives are performed on an annual basis, taking the form of open calls for projects, with all inhabitants entitled to vote and decide on the measures to be undertaken in their immediate surroundings. Municipal authorities are obliged to implement the winning projects [46]. The proposals being submitted can relate to the greening of public urban spaces, and for this purpose, some cities have already established schemes referred to as green budgets, specifically designed to complete public tasks related to ecology and environmental protection. What the aforementioned Draft Law on the Amendments to the Environmental Protection Law and Certain Other Laws envisages, within the framework of the participatory budget, is an obligation for all cities to allocate a pool of funds dedicated to implementing projects related to the protection of the natural urban environment as well as to greening [47].
Another important aspect to the implementation of development policies by Polish cities is educating local authorities on the subject of urban greening. To this end, the Ministry of Climate and Environment has released a guide for cities entitled Nature and Climate Indicators of Sustainable Urban Development (Przyrodniczo-klimatyczne wskaźniki zrównoważonego rozwoju miast). Since urban indicators are generally complex, this document has been rendered available with an appendix providing a technical guide describing the successive stages of spatial data acquisition from and processing in geographic information systems (GIS) as well as calculation of the relevant indicators [48].
Urban greening policy is inextricably linked with the use of financial facilities. In Poland, numerous support programmes are created for this purpose, targeting not only large cities, but all municipalities. In October 2023, the National Fund for Environmental Protection and Water Management in Poland announced the launch of a programme aimed at de-concreting and greening of cities with a population of inhabitants below 50,000. The available financial support, granted upon request of municipal authorities, can cover up to 85% of the costs of such investments. The programme finances activities related to the replacement of hardened surfaces with permeable ones as well as the purchase and planting of diverse vegetation (trees, shrubs, perennials, flowers). The goal is to create spaces which make the most of the natural capital in urban areas: pocket parks, rain gardens, areas featuring water retention and purification systems, but also to enable renaturation of riverbanks and water reservoirs [49]. Financial aid for urban greening and urban energy is also provided under the Green Transformation of Cities instrument, established in Poland as part of the National Recovery Plan. This scheme offers funding for urban projects aimed at increasing energy efficiency in public utility buildings, introducing RES, preserving nature, public space greening, water resource management, noise reduction, and air pollution combatting. In the application submission phase, the programme puts an emphasis on a sustainable approach to urban space shaping. It exclusively supports projects which do not entail reduction of the biologically active area, tree felling, or unjustified demolition of built features [50].

2. Materials and Methods

The method used in our research involved selecting cities representative of the urban greening and climate change adaptation process, identifying the measures planned and implemented in relation to urban greening in spatial planning and urban design, and collecting statistical data presenting quantitative and surface area changes with respect to green areas in the cities subject to the studies. The research partly comprised a comparative analysis of the data obtained with regard to all the Polish cities surveyed.
In order to illustrate the relationships between theory, planning, and the implementation of the urban greening process in the context of climate change adaptation of cities, we surveyed 44 large Polish cities, mostly with populations exceeding 100,000. In three cases, the population ranged from 90,000 to 100,000 residents, and in four cities, it was less than 90,000 residents. The criterion for the selection of cities was their adoption of UAPs in 2019. All the cities included in the survey participated in a project launched by the Polish Ministry of Environment, entitled Developing Climate Change Adaptation Plans in Cities with a Population Exceeding 100,000, implemented between 2017 and 2019. Using a consistent methodology to attain the assumed outcome, the project made it possible to identify the main climate threats and the most vulnerable urban areas, and delivered proposed solutions to the identified threats [51].
Our research covered two time intervals, the first spanning the years 2014–2022. In this period, we identified the measures relating to the sustainable management of green areas, as planned and implemented by the studied cities, both before and after the adoption of the respective UAPs. The second time interval, from 2017 to 2023, was closely linked with the implementation of the cities’ adaptation policies; from 2017, the year that work on the 44 UAPs commenced in Poland, to 2023, being the current year of the available source data. In the case of the data obtained from Statistics Poland (Polski Urząd Statystyczny), the timeframe was limited by the last year of the available statistical data, 2022.
The criteria we adopted for the source selection were largely driven by the availability of the data acquired. Research input data were collected following a review of the information contained in the UAPs and other local strategic, planning and operational programme documents, data from participatory budgets, information posted on the websites of municipal offices, environmental institutes and foundations, urban green management boards, information portals, etc. Additionally, data were gathered through a review of information released by Statistics Poland, being the central government’s administration office responsible for the collection and distribution of statistical information [52]. The data sources also included selected articles published in magazines, articles featured in digital editions of local newspapers, project publications, and educational articles which contained information on specific planned and implemented adaptation measures related to the greening of individual cities [53,54,55,56,57]. The data for the research were collected by both the authors and students of the Faculty of Architecture of the Silesian University of Technology [58].
The chosen research methods enabled the following:
A compilation of the most frequent and significant climate change related threats to the 44 cities studied. We managed to identify these threats by analysing the strategic, directive, or detailed goals specified in the relevant UAPs. Where none of the goals envisaged in the UAPs provided detailed definitions of the threats, we analysed the diagnostic part of the documents, translating it into the programmatic part, comprising the measures that strengthen urban resilience to specific types of threats. In the next step, we evaluated each threat in terms of the direct impact of urban greenery on the mitigation of the threat, and analysed all the 44 cities quantitatively and proportionally against the most significant threats that urban greenery could mitigate (Figures S1–S3);
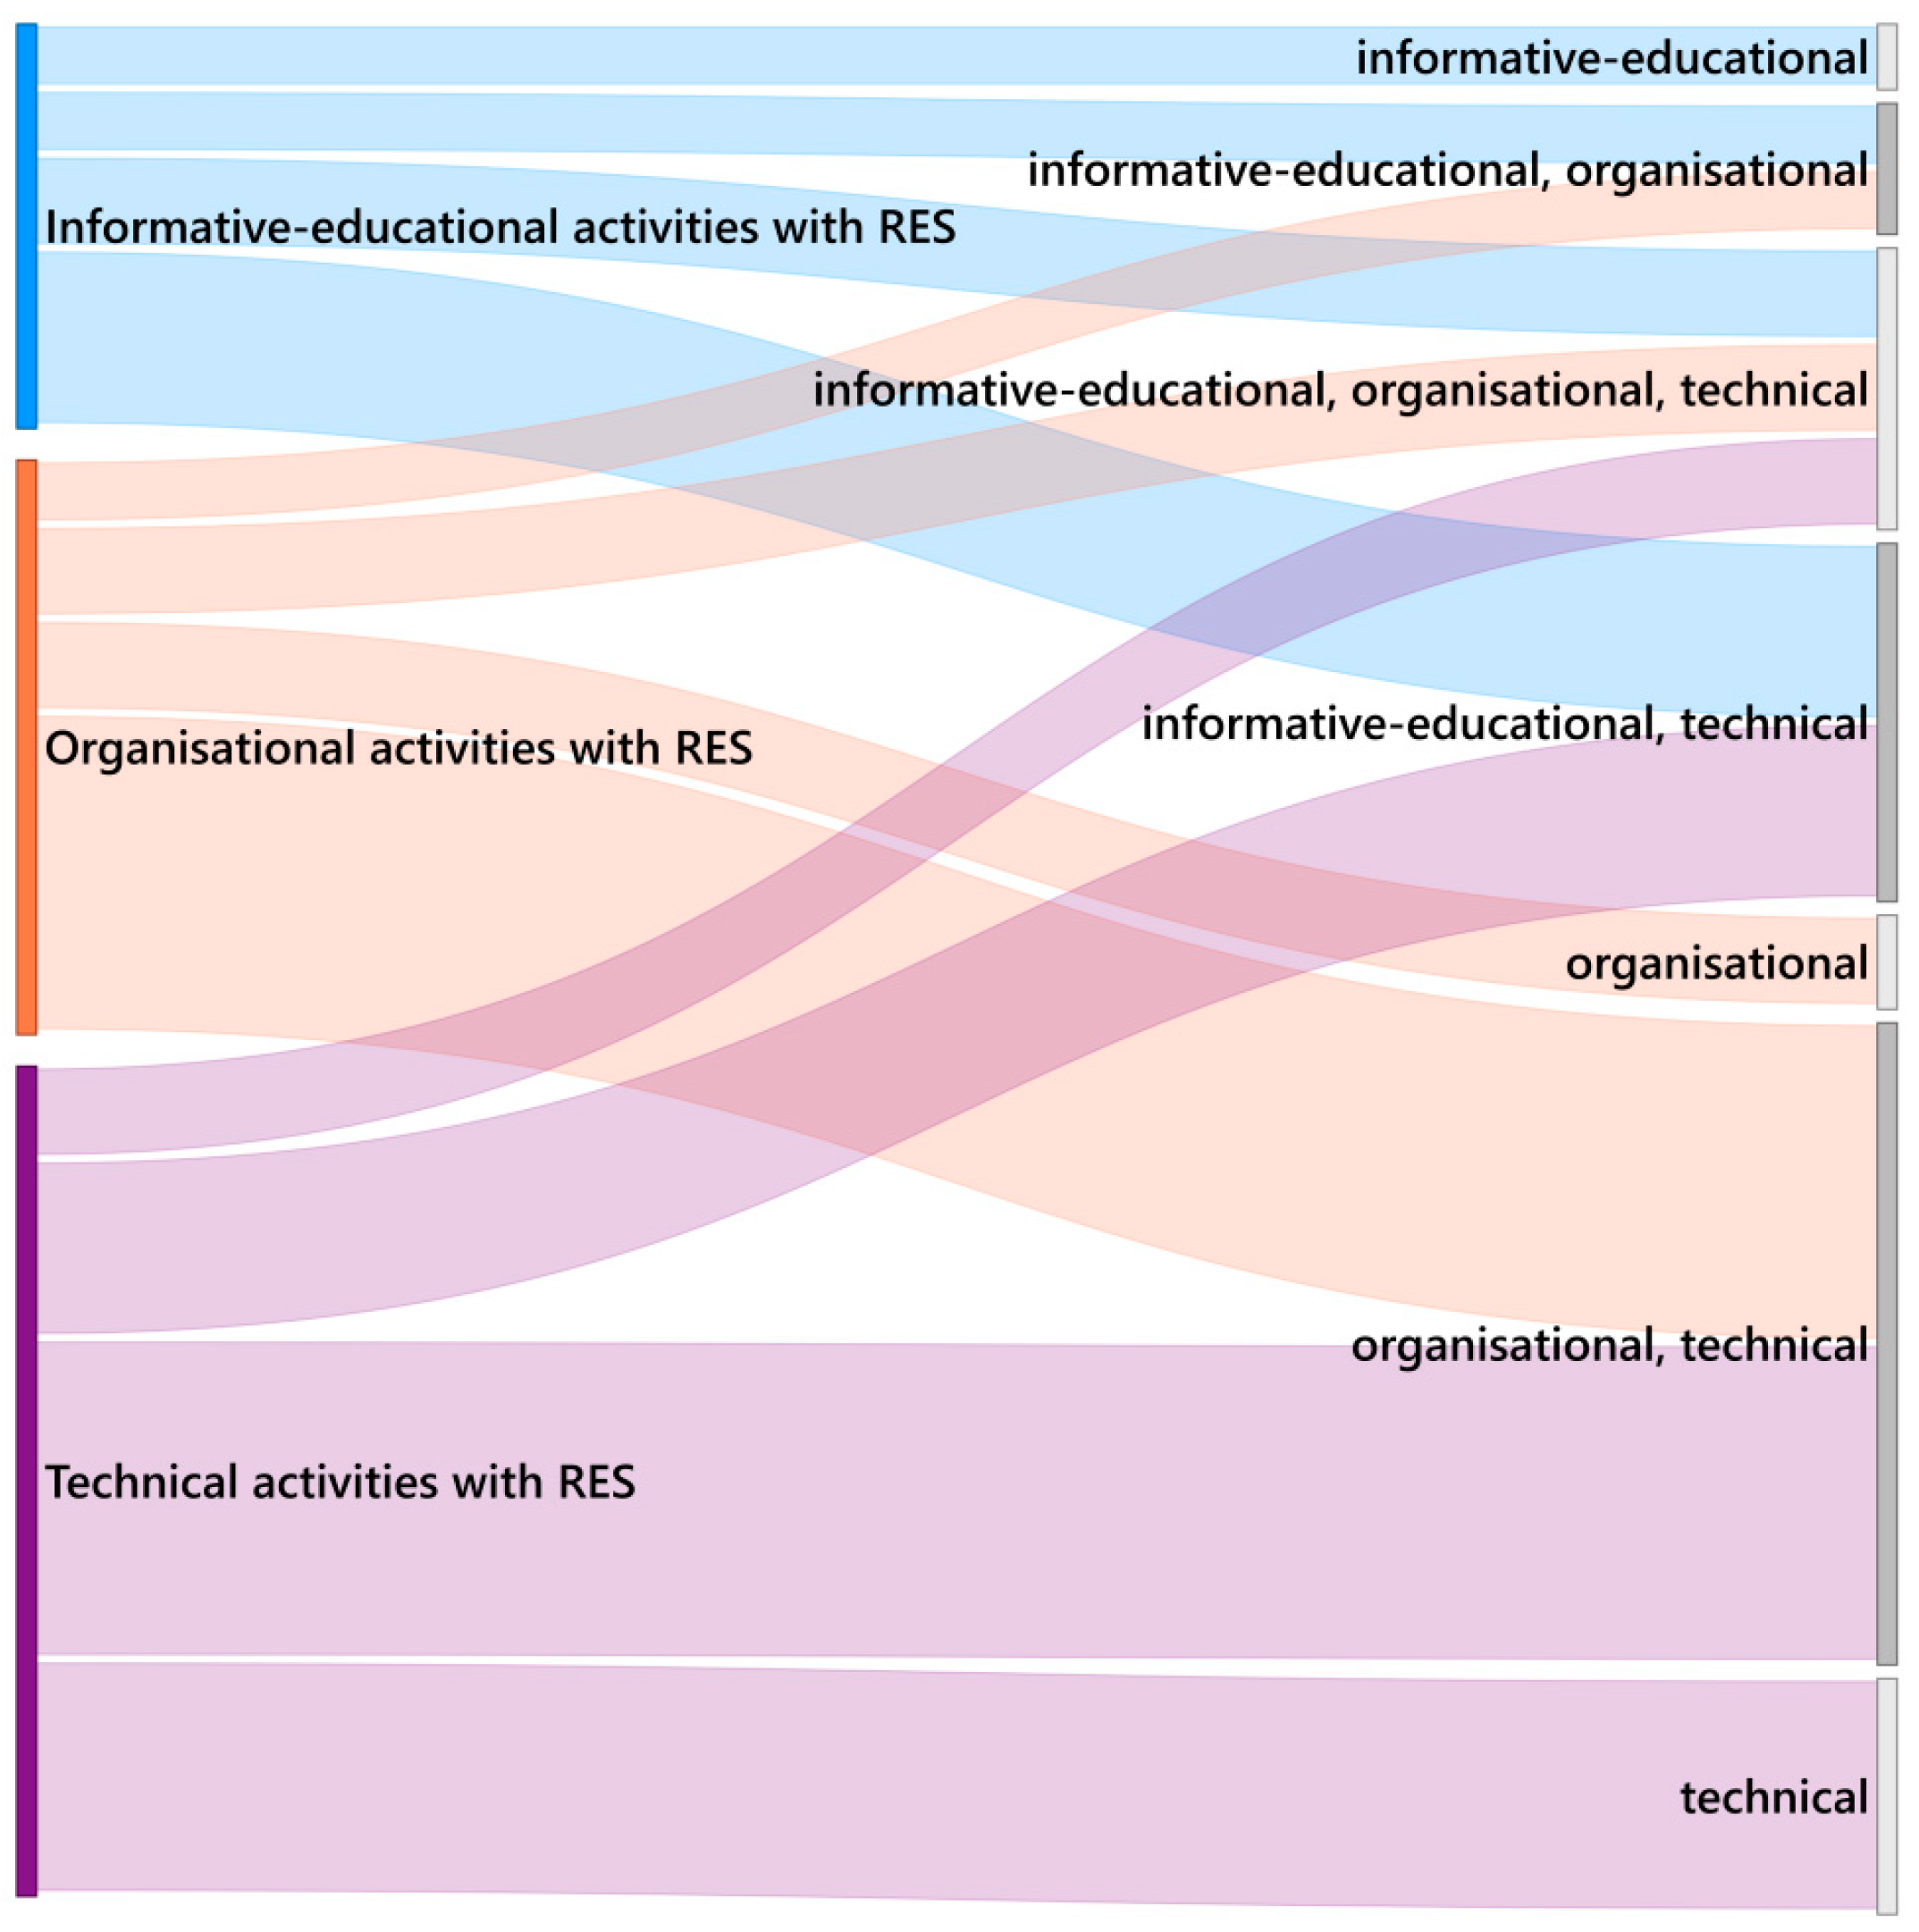
An analysis of the 44 UAPs in terms of whether or not they envisaged renewable energy sources (RES) under the three types of adaptive measures planned: educational, organisational, and technical, as included in the programmatic part of the plans [59]. We compiled the results of these analyses with the city policy sectors diagnosed, in the respective UAPs, as most vulnerable and susceptible to the negative effects of climate change (Figure S5). These sectors included public health, transportation, water management, energy, biodiversity, tourism, cultural heritage, spatial planning, high-intensity residential areas, other infrastructure and non-built areas;
A comparative analysis of the climate change adaptation measures, planned and implemented in the 44 cities, against the sustainable management of green areas, spanning the years 2014–2022 (Figure S6). In this respect, we analysed the most representative groups of the adaptation measures, such as revitalisation of existing green areas, establishing or developing new green areas and recreational spaces, revitalisation of environmentally degraded areas, and protection of environmentally valuable areas/floodplains. Additionally, within this timeframe, we also analysed the number of micro-interventions related to urban space adaptation to climate change. These included such facilities as pocket parks, rain gardens, community gardens, green walls, green roofs, green streets/woonerfs, and green courtyards [60].
A comparative analysis of urban greening measures, including selected NbSs, planned and implemented in the 44 subject cities between 2017 and 2023. Following the assumptions of the URBAN Green UP project, implemented in 2017–2023 [61], the identified types of NbSs included planting and renewing urban trees, pocket parks and parklets, green resting areas, and cycle and pedestrian green routes. Additionally, in this timeframe, we conducted a comparative analysis of singular green infrastructure measures, planned and implemented in the 44 cities between 2017 and 2023. Following the assumptions of the URBAN Green UP project, the identified types of NbSs included green walls, green shady structures, green roofs, vertical gardens, floating gardens, urban farming, urban wildlife habitats, and intelligent natural solutions [62];
A numerical and area analysis of changes involving various types of urban greenery, as well as tree cuttings and plantings in the 44 cities in 2017–2022, using data from Statistics Poland [52]. For the specific purposes of the article, we analysed the following aspects:
(a)
The numerical difference in the areas of green squares, street greenery, neighbourhood greenery, and recreational parks in the timespan 2017–2022 [ha] (Figures S7–S10). The analysis of the numerical difference in the neighbourhood greenery areas covered the years 2017–2021 because the 2022 data were missing in the Local Data Bank of Statistics Poland (as of 10 November 2023);
(b)
The sum of the numerical differences in the areas of all types of greenery in the timespan 2017–2022 [ha];
(c)
The difference between the number of green squares and the number of recreational parks in the timespan 2017–2022 (pcs);
(d)
The number of tree cuttings and plantings in the timespan 2017–2022 (pcs) (Figures S11 and S12);
(e)
The sum of the differences in tree cuttings and plantings in the timespan 2017–2022 (pcs).
The results of the quantitative research were compared and presented on graphs illustrating the numerical values and percentage ratios of the ranges or the areas of the measures undertaken by the 44 Polish cities.

3. Results

Owing to the unified development methodology, UAPs have become a crucial source of knowledge regarding climate-induced threats to urban space. Our study of the 44 UAPs adopted in major Polish cities allowed the identification of the 25 most significant climate-related threats (Figure 1).
All the UAPs examined highlighted the necessity of improving urban resilience to torrential rainfalls. Other threats commonly identified in the UAPs included higher maximum temperatures (43 cities), flash floods/urban floods (40 cities), heat waves (38 cities), and storms, including hailstorms (38 cities).
Among these 25 threats, 13 can be mitigated by means of urban greenery. Having assessed individual threats in terms of their potential mitigation using urban greenery, we note that in the case of threats such as exceedance of air pollutant concentration standards and smog, greenery mitigates these phenomena only to a limited extent. The primary mitigating factors involve actions related to neutralising urban sources of air pollution, such as inadequate and obsolete heating sources in buildings or high volumes of traffic of combustion engine vehicles [63]. Equally significant are the technical measures which focus on energy use, including installation of photovoltaic panels or deploying other RES-based solutions on municipal property, phasing out solid fuel boilers in favour of urban district heating networks, gas heating, or renewable energy sources, as well as other investment measures intended to reduce the emission of pollutants.
In the quantitative analysis, the city of Rybnik (10 threats) clearly stood out among those municipalities whose threats could be mitigated using greenery, followed by Mysłowice, Toruń, Tychy, and Zabrze (nine threats mitigated by urban greenery). The percentage analysis (Figure 2) yielded different results: Legnica stood out, having only four defined major threats, yet all could be mitigated by means of urban greenery (100%); followed by the cities of Częstochowa and Gliwice (80%), Rybnik (~77%), as well as Białystok, Czeladź, Płock, and Wrocław (75%).
A comparison of the results of the threat analyses and the statistical data showing the differences in the amount of urban greenery between 2017 and 2022, resulted in no correlation between them.
An analysis of urban greening activities relating to the use of RES (Figure 3) revealed that, for most of the cities surveyed (~64%), RES were planned activities scheduled for implementation by 2030 or 2050 (Figure S4). These cities included Białystok, Bielsko-Biała, Chorzów, Czeladź, Częstochowa, Dąbrowa Górnicza, Elbląg, Gdynia, Gorzów Wielkopolski, Grudziądz, Katowice, Kraków, Legnica, Lublin, Mysłowice, Olsztyn, Opole, Poznań, Radom, Ruda Śląska, Rybnik, Sosnowiec, Tarnów, Toruń, Tychy, Wałbrzych, Wrocław, and Zielona Góra. Significantly, ~36% of the municipalities had not planned any RES-related measures.
The threatened urban sectors most frequently addressed in the UAPs were Public Health (in 41 cities) and Water Management (in 40 cities). The Energy sector was diagnosed as threatened in 17 cities (Figure S5).
A comparison of the data showing whether or not RES were to be covered by the measures outlined in UAPs and if the Energy sector was at risk in the 44 cities surveyed revealed that 12 cities met both criteria (Figure 4). Among them were the cities of Bielsko-Biała, Częstochowa, Dąbrowa Górnicza, Elbląg, Gdynia, Olsztyn, Ruda Śląska, Rybnik, Sosnowiec, Tarnów, Tychy and Wrocław. All these 12 cities have included specific technical measures in their adaptation plans. Organisational measures can be found in seven adaptation plans—invariably coinciding with the technical ones. This means that the organisational activities undertaken in these cities allow the relevant technical investments to be supported through their adequate organisation, for instance by subsidising technical investments in the installation of renewable energy-producing devices by inhabitants.
The UAPs were not the exclusive source of data on the process of urban greening examined in the context of climate change adaptation. Research on the 44 Polish cities revealed that, since 2014, sustainable management of green areas has been a significant component of the development actions conducted under local policies. On analysing data from the years 2014–2022, sourced from planning and strategic documents as well as from operational programmes, participatory budgets, governmental and local administration websites, organisations, institutes, environmental foundations, urban green management boards, informational portals, scientific articles, as well as cartographic and photographic materials, the following correlations were revealed [58,60]:
In the 44 Polish cities, authorities planned a total of 209 measures concerning broadly defined sustainable management of green areas and implemented 249 measures. These initiatives involved adapting existing, often degraded urban spaces, protecting environmentally valuable areas, and creating new green areas;
The most numerous of the activities planned by the municipalities in relation to the management of green areas were those which entailed introducing or developing new green areas and recreational spaces (40.2%). The measures aimed at protecting environmentally valuable areas and floodplains constituted a minority (14.8%). Those categorised as other were of marginal relevance (4.8%);
The implementation sphere was dominated by measures related to revitalisation processes (44.2%). The largest share of these projects (as much as 37.8%) were implemented under the scheme of revitalisation of organised green areas, including parks and urban squares. Revitalisation efforts were implemented in degraded natural areas to a negligible extent (6.4%). Plans associated with revitalisation measures were as significant as their implementation (40.2%). This sphere was dominated by revitalisation plans for landscaped green areas (28.7%) and was complemented by brownfield renaturation plans (11.5%). The municipalities implemented these measures predominantly in city centres, near water reservoirs, rivers, forested areas, and parks;
The study showed that another major group of measures implemented in the sphere of greenery management were activities based on the introduction or development of new green areas or recreation and leisure sites (27.3%). A smaller portion of the activities actually implemented pertained to establishing legal protection measures for environmentally valuable areas and floodplains (17.3%). The environmentally friendly activities carried out by the municipalities classified as other represented 11.2%;
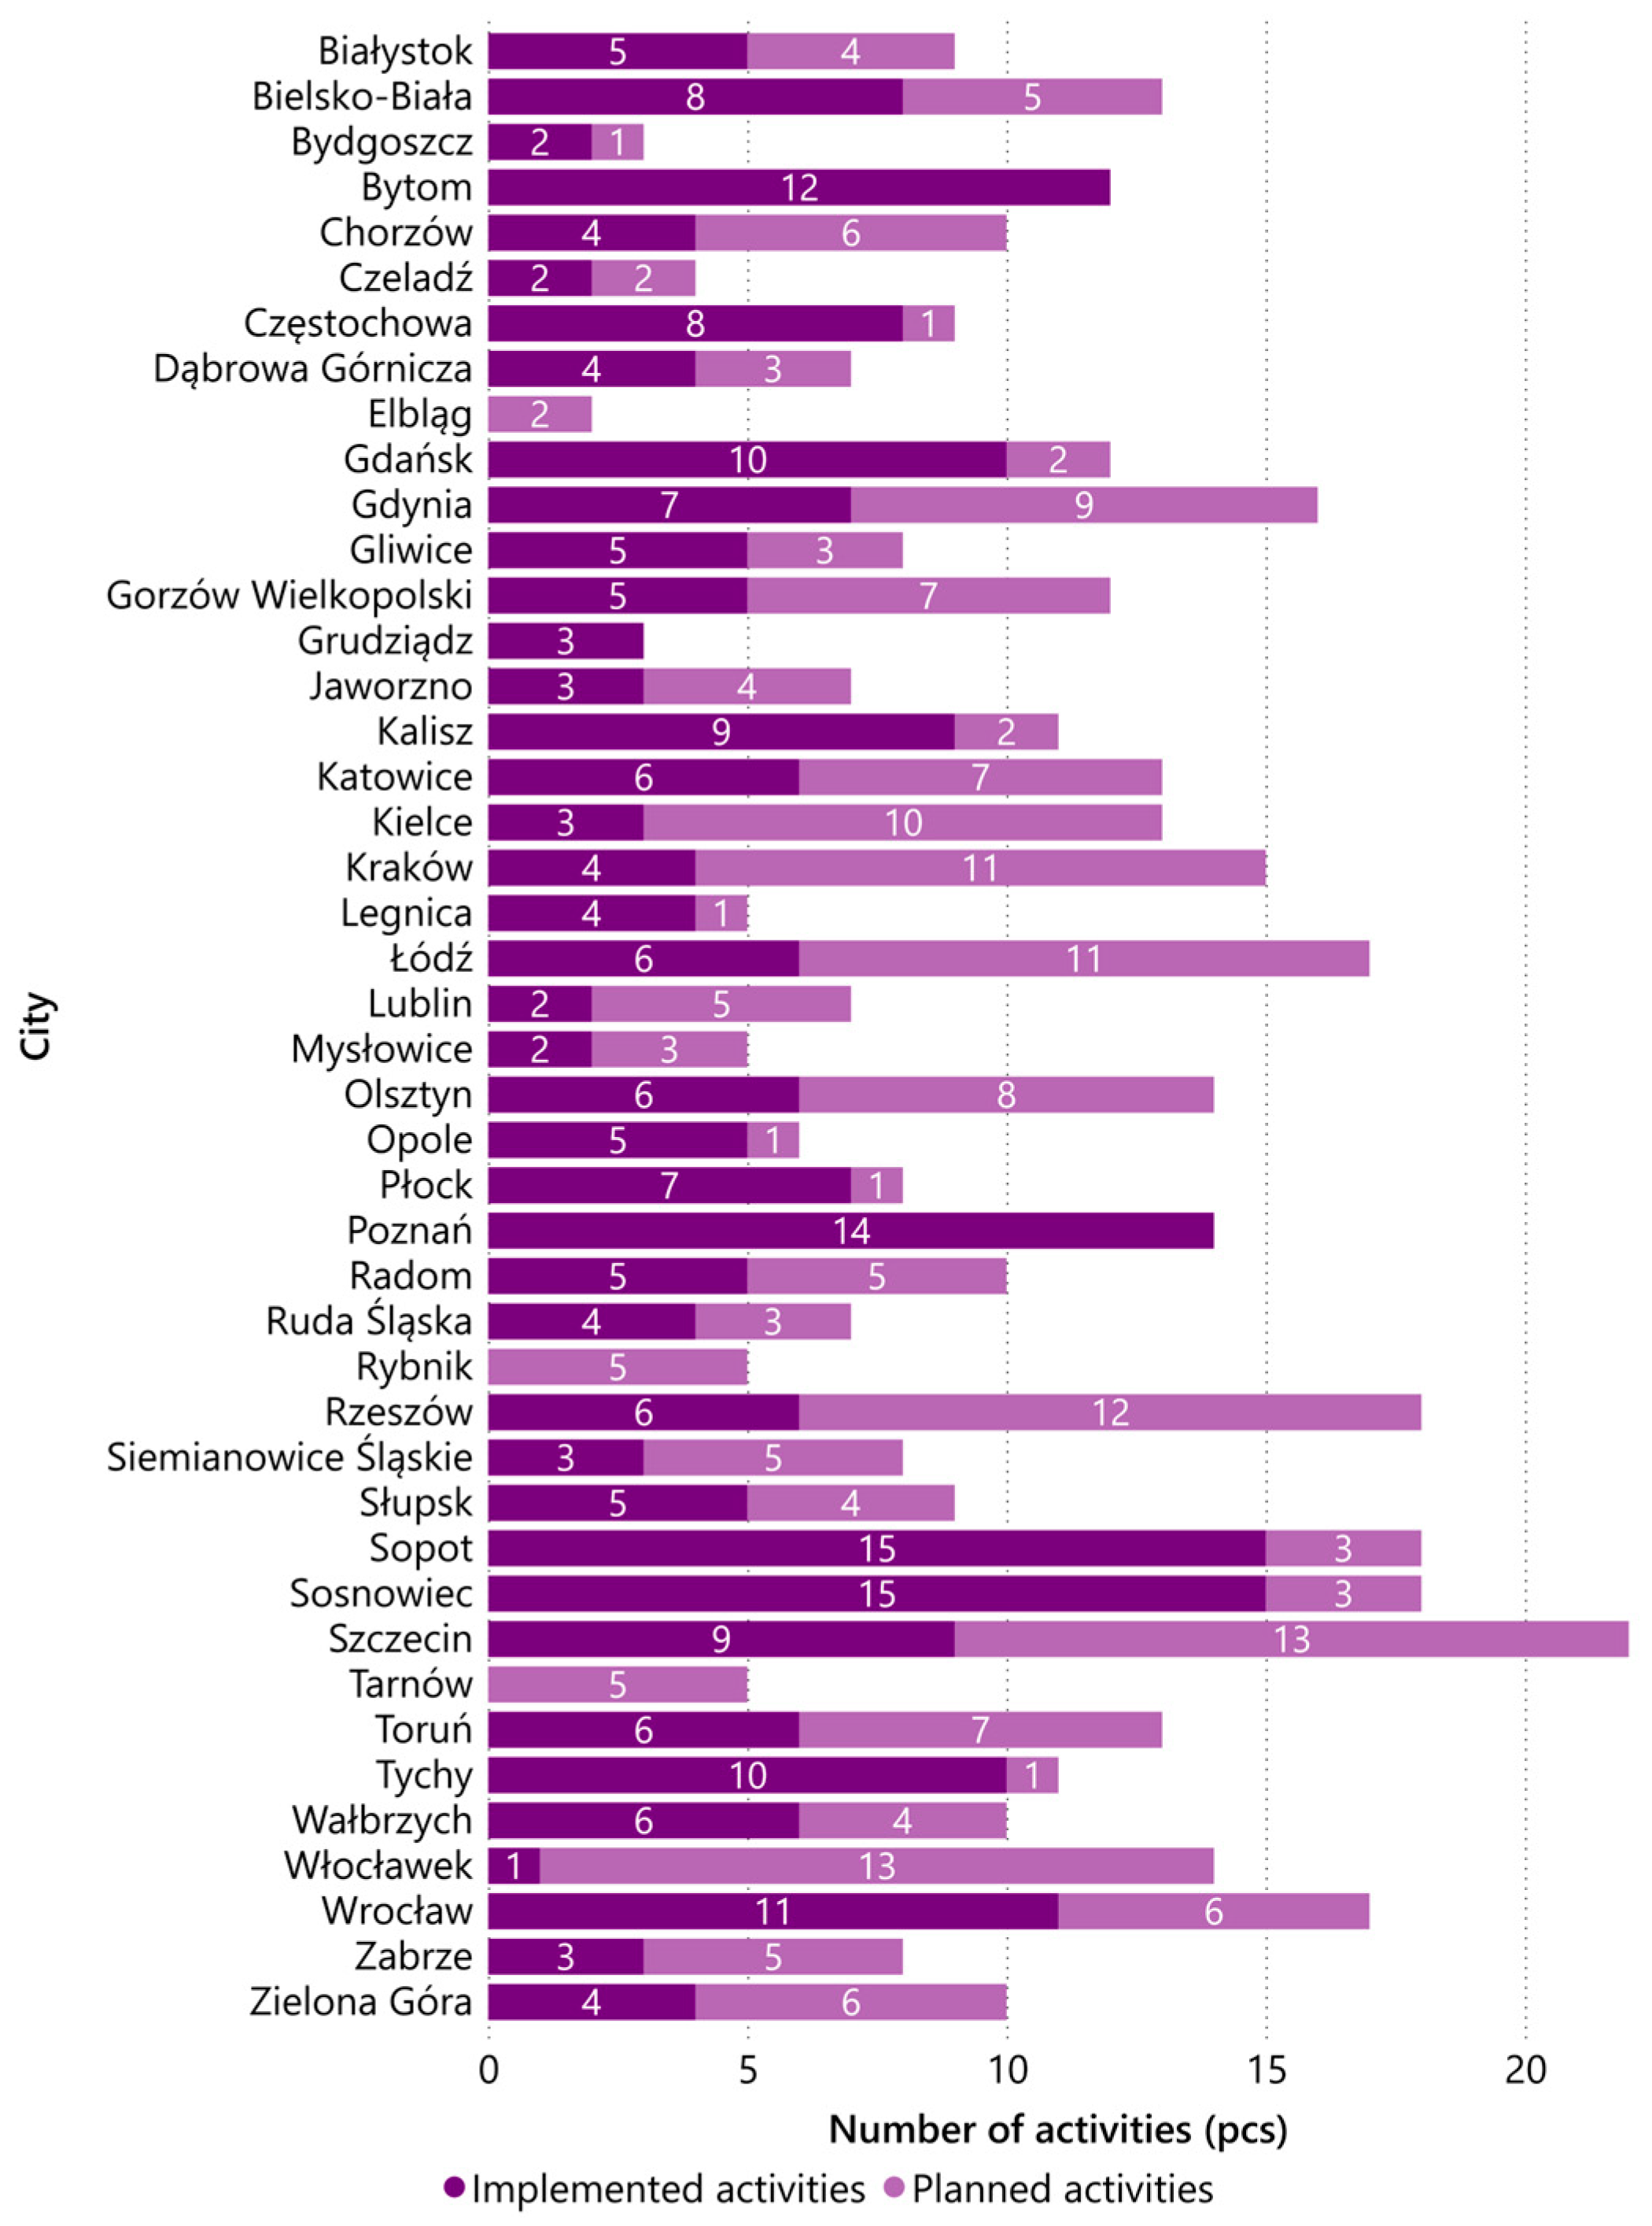
Out of the 44 Polish cities examined, between 2014 and 2022, only 5 implemented more than 10 different measures indicative of the sustainable management of green areas (Figure 5). The cities which stood out in terms of the sheer number of the measures deployed were Sopot (15), Sosnowiec (15), and Poznań (14). An analysis of the activities planned by the cities revealed that, similarly, five cities also planned more than 10 measures. Those with the highest number of planned activities were Szczecin (13), Włocławek (13), and Rzeszów (12).
In a quantitative analysis of the climate change adaptation measures undertaken by the 44 studied Polish cities between 2014 and 2022, we also paid attention to the significant role of urban acupuncture spots in space, associated with the process of city greening. These included activities related to in-city planning and development of pocket parks, rain gardens, community gardens, green walls, green roofs, green streets, woonerfs, or courtyards (288 measures planned and 137 implemented). Many were planned or implemented long before the adoption of UAPs. The analysis indicated that, from 2014 onwards, the measures most frequently implemented in cities were individual pocket parks (20.1%). It was in the same manner that municipalities developed community gardens (17.7%), green streets and woonerfs (18.1%), green courtyards (14.6%), green walls and green roofs (11.1%), and rain gardens (10.1%). The format which dominated the prospects documented in the cities’ planning and strategic papers was pocket parks (27.7%). They were complemented by rain gardens (18.2%), green streets and woonerfs (16.8%), green roofs and walls (11.7%), community gardens (11%), and green courtyards (6.6%). Non-categorised measures represented 8.3% among those completed and 8% among those planned. The cities which stood out in terms of the number of implemented micro-intervention measures (Figure 6) were Łódź (43), Tychy (21), and Gdańsk (19). With respect to the planning of such activities, Toruń (13) and Słupsk (12) were also noteworthy [58,60].
Our study of the development initiatives undertaken by Polish cities, aimed at increasing their greening level, revealed that one of their integral components is the implementation of natural capital-based solutions in the urban space. Such solutions can be planned and implemented in different scopes and typologies. We analysed activities related to planting and maintaining urban trees, developing pocket parks, parklets, urban recreation and leisure areas, as well as green pedestrian and cycling paths. Equally significant were point-based green infrastructure actions: green walls, green shading structures, green roofs, vertical gardens, floating gardens, urban agriculture, habitats for urban wildlife, and intelligent nature solutions.
Based on the study of the chosen 44 Polish cities spanning the years 2017–2023, identifying the NbSs applied with climate change adaptation of Polish cities in mind, we drew the following conclusions pertaining to urban greening [58,62]:
The authorities of the 44 Polish cities planned a total of 418 measures and implemented 851. The prevalence of the measures implemented can be partially attributed to the fact that non-formal planning tools were excluded from the count of the measures planned;
They strategically allocated the measures planned and completed in various urban zones, depending on the NbSs category and type as well as the unique local conditions of individual cities. Most frequently, they covered central in-city areas (56.4% of measures completed, 28.2% of measures planned);
The measures planned by the municipalities were predominantly those focused on increasing the tree cover of urban spaces (38%) and increasing the rank of urban recreation and leisure areas (28.5%). Municipal plans to establish pocket parks and parklets and to green pedestrian and cycle paths were nearly half as frequent, accounting for 14.6% and 14.2%, respectively;
In terms of the activities actually completed in the cities, similarly to their plans, the dominant measures were urban greening (34.4%) as well as establishment, maintenance, and revitalisation of recreational and leisure areas (32%). Pocket parks and parklets, one the one hand, as well as green footpaths and cycle paths, on the other hand, accounted for 15.2% and 14.2%, respectively;
A total of 32 of the 44 Polish cities surveyed implemented more than 10 different types of NbSs relating to urban greening between 2017 and 2023 (Figure 7). The cities which clearly stood out in terms of the number of measures successfully implemented were Kraków (101), Szczecin (42), and Słupsk (37). Having analysed the cities for the measures planned, only 12 cities planned more than 10. The cities with the highest number of planned measures were, similarly to those implemented, Kraków (88), Szczecin (31), and Słupsk (23).
In the planning of singular green infrastructure initiatives, between 2017 and 2023, cities focused on horizontal forms, including green roofs, shading structures, and canopies (44.8%). Vertical solutions, such as green walls, vertical gardens, barrier structures, etc., were planned far less frequently (17.1%). The municipal plans of designating habitats for pollinating animals (13.3%) as well as areas for urban agriculture and pollution filtration (7.6% each) were rather scarce. The category of other comprised 11.2% of planned measures, including various urban programmes, promotional campaigns, or eco-friendly initiatives [58,62].
The cities implementing singular green infrastructure measures (Figure 8) focused on arranging habitats for pollinating animals in the urban space (22.8%) as well as on green roofs, canopies, and shading structures (21.6%). Vertical solutions (15.8%), initiatives related to pollution filtration (10.9%), urban agriculture (6.7%), and the use of smart soils (5.8%) were implemented to a lesser extent. A significant percentage of the activities (16.4%), such as environmentally friendly programmes or initiatives, fell under the other category [58,62].
The above results may be encumbered with some errors due to lack of access to all local data and differences resulting from variations in the data provision by individual cities. Therefore, for research purposes, it became important to use quantifiable data related to the process of urban greening, obtained from Statistics Poland, and presented in a standardised manner and using unified indicators. These indicators encompassed the changes which occurred in the 44 cities examined, involving various types of urban greenery as well as tree cutting and planting. The comparative analysis of both numerical and surface area changes pertaining to different types of urban greenery as well as tree cutting and planting in the 44 cities in the years 2017–2022 revealed certain variations between these cities. Some cities were found to report significant outliers as compared with others, e.g., Bydgoszcz and Rzeszów. Differential analysis revealed that Bydgoszcz lost 458 hectares of park area. The most substantial change occurred between 2019 and 2020, with a difference of −490.55 hectares of park area. In the following intervals (2020–2021 and 2021–2022), an increase of 1.05 and 31.99 hectares, respectively, was observed. According to the analysis of the difference in the number of parks in Bydgoszcz, a total of 12 parks were added between 2019 and 2022. In Rzeszów, according to the analysis of the differences in the area of green squares, there was an overall increase of 1246 hectares between 2017 and 2022. The most significant change was observed between 2018 and 2019, with an increase of 1304.63 hectares. In 2020–2022, a decrease in the area in question was reported (a total of −68.67 hectares). Over the analysed period, there was an increase in the number of green squares in Rzeszów. The most considerable increase (by 648) occurred in 2019. In subsequent years, the relevant figures increased by 14 pieces in 2020 and 3 pieces in 2022. These analyses imply that, despite the decrease in the park area hectare count in Bydgoszcz and a significant increase in the number of green square area in hectares in Rzeszów, the overall numbers of park units and green squares increased in both these cities. The said outlier values result from a change in the planning category assigned to specific areas in both cities.
Except the aforementioned cities, the most significant increase in the number of hectares of urban green space (of all types) was successively observed between 2017 and 2022 (Figure 9) in Tarnów (213 ha), Kraków (195 ha), and Mysłowice (115 ha). Additionally, 26 cities recorded an increase in hectarage at various levels, ranging from several to more than 100 hectares, while these figures declined in 15 cities. The highest negative values were reported by Rybnik (−99 ha) and Wrocław (−233 ha). Both cities recorded the highest decrease under the category of green squares.
The largest increase in the area of green squares was observed in Kraków (135 ha). There was also a significant hectarage growth under the same category in Mysłowice (69 ha), Katowice (51 ha), Łódź (50 ha), and Bytom (40 ha). The remaining cities recorded a minimal growth or even a decrease in the area of green squares, ranging from a few to several hectares, either positively or negatively. The greatest negative values were reported in Wrocław (−286 ha) and Rybnik (−128 ha).
In terms of the difference in area of street greenery analysed between 2017 and 2022, 24 cities had an increase in the number of hectares, 6 recorded a decrease, and in 14 cities the final balance did not change, remaining at zero. Tarnów (172 ha) and Szczecin (109 ha) recorded the largest increases. The cities of Białystok, Bydgoszcz, Elbląg, Gliwice, Legnica, Olsztyn, Rybnik, and Tychy recorded similar increases, ranging between 45 and 72 ha. The city of Łódź witnessed the largest decline in this respect (−22 ha).
The results of the analysis of the difference in the area of neighbourhood greenery were diversified: 20 cities recorded an increase and 20 cities a decrease. The cities with the largest increase in this score were Bytom (111 ha), Gdańsk (76 ha), and Kraków (61 ha).
An analysis of the difference in walking and recreational parks area showed that half the cities in question (22) recorded an increase in the hectarage between 2017 and 2022, while seven cities recorded a decrease. Jaworzno (77 ha), Szczecin (53 ha), and Łódź (45 ha) enjoyed the highest results. The scores of the remaining cities with positive values oscillated mostly between 10 and 40 hectares.
In the category of the number of tree plantings and cuttings conducted between 2017 and 2022, the results were diversified (Figure 10). A total of 20 cities achieved a positive balance and 24 cities a negative one. The highest results were achieved by Wrocław (7550 units), Kraków (7095 units), and Rzeszów (6937 units). Wrocław was the city with the second highest number of trees removed (−22,546 units). At the same time, it was precisely in Wrocław that the largest number of trees were planted compared against all surveyed cities (30,096 trees). The next city with the highest score was Kraków, where 11,673 trees were removed and 18,768 were planted. Another notable case was that of Rzeszów, where 2908 trees were removed and 9845 planted. Such results may indicate that the development and investment policy pursued by the respective municipalities, often linked with nature compensation, translates directly into the state of city greening.
Such a comparison of large Polish cities has made it possible to draw conclusions concerning the process of urban greening in Poland over the past few years. Despite the variety of data sources and indicator categories in use, the research has provided convergent results for the cities which clearly stand out having achieved either the highest or the lowest scores under the categories analysed.

4. Discussion

Our research of large Polish cities has revealed that the approaches to the planning and implementation of the urban space greening process are representative of the selected research group. From the perspective of studies that analysed this process against the context of climate change adaptation planning, the key documents proved to be the UAPs [59]. However, despite the methodological consistency underlying the development of UAPs, research has shown that, only to a limited extent, do cities with climate policies in place include in their plans solutions which, using greenery, can not only mitigate the effects of climate change, but also enhance ecosystem services as well as provide social and economic benefits. These benefits have been confirmed by Cuthbert et al., who demonstrated the links between hydrological retention and the cooling potential of urban greening [18]. Similarly, research by Chatzimentor et al. focused on the key role of green infrastructure elements for the built environment [21]. Recognising discrepancies between planning and development of green spaces that contribute to the resilience of urban areas to climate change, as demonstrated by Graca et al. [15], we have primarily highlighted the advantages attributable to greenery being included in the process aimed at urban resilience enhancing. Of the 25 risks identified, only half can be mitigated by measures which make the most of the advantages brought by introducing various forms of urban greenery, such as parks, recreational areas, or green roofs. This implies that cities have not yet fully realised the potential behind green areas to adapt urban spaces to climate change.
The variation found between the cities surveyed in terms of the measures in question is largely due to how the cities themselves differ. Although displaying a number of common characteristics, such as inhabitant population count, concentration of urban functions, or intensity of development and infrastructure, these cities are characterised by different conditions, location, and non-uniform quality of the urban natural environment—features which often determine the manner in which the measures they have envisaged are implemented. Urban space greening requires adaptive planning activities tailored to the specific characteristics of each city and appropriate in scale. This approach should draw on global trends and experiences of cities worldwide. Such a conclusion aligns with the research of Broto and Bulkeley, who analysed representative cities for their experimental approaches to climate change. They observed clear differences between cities based on factors such as location, planning culture, and affiliation with urban networks [64]. Interestingly, their work indicates that individual characteristics of cities do not necessarily increase the likelihood of undertaking climate change experiments. The findings presented in this article are representative of large Polish cities, primarily depending on whether or not they have local climate-related documents in place. However, in light of the studies conducted by Heidrich et al. [65], Reckien et al. [27], and Grafakos et al. [66], which highlight the role of climate change mitigation and adaptation in the development policies of small and medium-sized cities, it becomes evident that a multi-scale approach to climate policy is necessary. Regardless of city size, increased commitment to the pursuit of local climate policies can lead to enhanced planning and implementation of urban greening initiatives.
What proves to be of particular significance to the results of our study is the approach of large cities towards both existing and newly designed green spaces. Many cities do not intend to plan new green area systems, while they do aim to complement or extend the existing ones. The need to introduce new landscaped and recreational green areas is evident in the assumed development vectors. However, implementation projects are dominated by activities related to the revitalisation of existing green areas. Research has shown that, regardless of the type of greening measures, their effect is an increase in the number and surface area of the green space in the surveyed cities. This study has recognised a growing significance of urban parks and recreational areas. Considering the findings derived from the study by Van Dinter et al. [16], emphasising the impact of parks on enhancing city dwellers’ quality of life, it is evident that an increase in both the number and size of green spaces will lead to greater life satisfaction in cities. We can also conclude that the higher the values of the indicators in these ranges, the potentially better the situation of cities in terms of the progress of urban greening. A modification of Statistics Poland’s indicators using current data from the Central Office of Geodesy and Cartography and the Database of Topographic Objects may provide further information on the stock (% share) of green areas in urban spaces. Their mapping will also provide information on the distribution of green areas and their positioning relative to urban zones. This approach was applied by the Polish Ministry of Climate and Environment as nature- and climate-specific indicators were established to describe the adaptation of urban areas to climate change [48]. Under the category of greenery and urban retention, four indicators were selected as adequate to provide information on the stock of green areas or the retention potential of cities: stock of green spaces within the city territory, surface area of forests and tree cover above 1 ha per inhabitant, share of green space in the anthropogenic area of the city, and the city’s retention potential. When presented in quantitative terms, such data can provide grounds for further comparative analyses of the changes to and trends in urban indicators over the years. Banaszak et al. emphasise that an appropriate selection of indicators can serve cities in planning and analysing the increase in the share of green areas, the improvement of the quality of existing green areas, and the formation of new green areas, using the available tools and opportunities, differentiated for each city [48].
What is apparent in the measures undertaken by the cities is that they seek to harness the potential of different types of greenery to make urban spaces more attractive and to improve their quality. Following the analysis of the different categories and types of the measures envisaged, our attention was drawn to the large number of urban acupuncture spots, blue–green infrastructure micro-interventions and solutions based on natural capital. All such activities, although significant in number, are only complementary to the systemic approach to the urban greening process. However, as suggested by Stangel [67], there is an additional dimension to their relevance: their frequency and location-specific variation demonstrate the benefits of including greenery in the climate change adaptation of urban spaces to those who use these spaces. Following the insights of Sullivan et al. [35], it becomes evident that the mere presence of trees and grass can be a key element to the shaping of neighbourhood space. Consequently, we conclude that the social and educational aspects of the measures implemented are just as crucial as the economic and environmental benefits they yield. However, the valuation of these benefits is context-, space-, and time-dependent, as acknowledged by De Groot et al. [29]. This dimension is relevant to the design of climate policies or interventions. Furthermore, this perspective aligns with the research by Sandifer et al. [30], emphasising the importance of incorporating health benefits and well-being promotion for urban residents in local planning. This is based on human interaction with urban nature and biodiversity.
The research also revealed links between the urban greening process and the use of RES. However, this relationship is marginal, underscoring the imperative to enhance the involvement of green technologies and clean energy in the planning and application of solutions in pursuit of carbon neutrality in cities. This can be achieved through dissemination of existing solutions, exploration of innovative measures, and, most importantly, implementation of comprehensive local climate policies that bolster environmental sustainability through promotion of green technology innovation and renewable energy. The necessity for the development and implementation of such policies has been affirmed by the research conducted by Shan et al. [68]. They highlight the strategic need to control the carbon-related benefits and impacts of technological innovations.
An important conclusion summarising our research is that cities, using various tools and methods to plan and implement climate change adaptation measures, make the most of the opportunities to introduce and use greenery to mitigate climate risks. However, to assess how successfully the measures planned have actually been implemented, is a distinctive challenge [69]. The quantitative research method employed in the study addressed in this article enabled a preliminary evaluation of the vectors assumed by Polish municipalities in implementing development policies geared towards urban greening and climate change adaptation. In line with the insights formulated by Ford and Banaszak, an optimal approach would require considering time criteria, socioeconomic factors, environmental considerations, and the selection of adequate evaluation indicators, with a particular focus on natural and climatic indicators. Additionally, systematic monitoring of results is crucial [48,69]. Due to the absence of formal reports on the implementation of UAPs at the time of the study, the measures identified as successfully implemented, reflecting the urban greening process, serve as indicators of the effectiveness with which the goals defined by cities are pursued. Future reports, gradually published by cities, will include data based on ongoing monitoring and periodic evaluation of the progress in implementing UAPs. These monitored indicators will form the basis for assessing the increase in urban green space. The effects of the relevant adaptation measures will be evaluated by assuming various perspectives and using different indicators, such as mitigating the impacts of climate change on urban heat islands, enhancing biodiversity, and expanding recreational areas [44]. The data measured and published, along with the indicators of output, result, and impact, will not only facilitate adjustments and updates to records or recommendations for further document implementation, but also make it possible to compare the impact of specific measures on a multi-city scale.
All the 44 UAPs in Poland feature a uniform methodology and consistent records to monitor and evaluate the implementation of plans. As part of the evaluation, they set out the types of indicators to be measured by local government units, including indicators for urban energy management, introduction of RES, and urban greenery. However, these plans contain no provisions that actually force cities to carry out monitoring and evaluation. A different approach is envisaged in the Climate Action Plans created by the international C40 network [70]. These documents assign precise values to the indicators that cities should achieve in order to meet the objectives of the Paris Agreement. This approach places greater emphasis on cities to meet their targets. Researchers point to the widespread inclusion of environmental quality in these plans, while at the same time, the health of urban populations attributable to climate change is not sufficiently addressed in the indicators [71].
European cities use various tools to plan and implement climate change adaptation solutions. Examples of such tools include green infrastructure plans or biodiversity plans. Documents of this type aim to expand and strengthen the network of urban green areas and to increase its resilience to various threats, including those related to climate. Such plans, like UAPs, also comprise a diagnosis and a strategic part, but their main objective is to integrate people with nature, restore ecosystems in the city, prevent the disappearance of flora and fauna species, and take care of the connectivity of green areas. Biodiversity plans identify exactly which habitats or species are unique to cities and whether they should be subject to special protection and monitoring [72,73,74,75]. The plans or strategies emerging separately, concerning specific types of greenery, for example, green corridors, parks, trees, or others, can be part of biodiversity plans. These documents contain specific recommendations and guidelines for the shaping of green areas and their systemic implementation in the city. Some of them precisely delineate areas to be redesigned according to guidelines [76,77]. In some cities, greening rules are being enacted to be followed under pain of a fine [78].
Compared with UAPs, these documents are characterised by greater precision and detail in terms of the measures set out. It is important to underscore that, in all the analysed cities, along with these documents, general climate change adaptation plans or strategies have also been adopted. We may discuss both the matter of integrity of all the plans deployed in cities relative to each other [79] and the question of the level of generality in cases where only one plan is in force, as in many Polish cities. The provisions of the adopted Draft Law on the Amendments to the Environmental Protection Law and Certain Other Laws strengthen the climate policy dimension in Poland by imposing an obligation on all cities in the country with a population of over 20,000 inhabitants to create UAPs [45]. At the same time, the National Urban Policy 2030 defines the need for blue–green infrastructure management plans, which can be included in UAPs [43]. This constitutes grounds on which municipal authorities can make a choice on whether to introduce only one document, i.e., the UAP, which would provide guidance on the management of blue–green infrastructure, or if they should introduce separate specific documents on the management of individual types of urban greenery. The National Urban Policy 2030 further stipulates that the foregoing should depend on the organisational, human resource-related, and financial capabilities of cities, especially the smaller ones [43]. We are concerned that the above provision could be misused to achieve some savings in municipal budgets.

5. Conclusions

The aim of the study addressed in this paper was to conduct a comparative analysis of various activities related to the planning and development of green areas and quantitative data on greening and adaptation to climate change in 44 Polish cities with UAPs in place. The research results show that large Polish cities are gradually focussing on adaptive solutions leading to increased urban greening. Although sustainable green management had been included in the cities’ development policies long before the activities related to adapting urban areas to climate change and mitigating commenced, the study revealed not only a certain continuity in the process of urban greening, but also a growing trend observed over recent years. This was associated with the implementation of adaptive policies, a more effective use of urban space, and increased awareness of the benefits that greenery and ecosystem services yield. This awareness is related to efficient planning of specific measures as well as to using various forms and methods to introduce greenery into urban spaces. In this process, both strategic and planning tools and methods for implementing individual solutions are considered equally important. The research has also shown that cities must undertake spatial interventions at various spatial scales, ranging from small projects and micro-interventions to major urban planning projects and citywide strategies. The foregoing implies that the development policies pursued by cities should be interdisciplinary, coherent, and flexible in nature, based on systemic and individual measures, supported by adequate legal, planning, financial, and organisational instruments.
Seeking to establish a connection between the planning and implementation of nature- and climate-related projects which affect the attractiveness of urban spaces and the well-being of city dwellers, it would be intriguing to analyse the benefits of city greening in terms of climate change adaptation under future research. Such an analysis should take both small and medium-sized cities into consideration. This would provide a better link between urban greening and the possibilities arising from the use of various planning, financial, and organisational tools, along with an assessment of the effectiveness of the adaptive policies implemented by all cities. And since urban greening strategies are related to improving urban resilience to climate change and to raising the importance of ecosystem services, further studies aimed at quantifying the benefits of urban greening would definitely be worthwhile. It is essential to investigate the impact of urban greening on health—a category of fundamental significance to quality of life—as well as spatial planning, transport, social capital, and city image building [80]. In follow-up, it would be equally important to explore the economic benefits associated with the increased value of areas surrounded by greenery, the energy savings resulting from efficient use of renewable resources, and the selection of appropriate vegetation species along with their placement in the vicinity of built features.
The conclusions arising from the research addressed in the paper can provide sufficient grounds for updating the UAPs already adopted as well as for formulating new provisions of strategic, planning, and investment nature. They can also serve as a starting point for city authorities to make decisions of relevance toward the effective implementation of their visions, intentions, plans, concepts, and initiatives for urban greening, ensuring adequate comfort of life for those who dwell in and use the city space.

Supplementary Materials

The following supporting information can be downloaded at: https://www.mdpi.com/article/10.3390/en17020377/s1, Figure S1: Overview of the most frequent climate change related threats in the UAPs for 44 Polish cities; Figure S2: Types of threats in 44 UAPs that can be mitigated by greenery; Figure S3: Number of major threats to the city identified in the UAPs that can be mitigated with greenery; Figure S4: Are RES in the activities of the city’s UAPs; Figure S5: Number of cities with a given susceptible sector; Figure S6: Distribution of adaptation activities in the category of sustainable management of green spaces completed and planned in 44 Polish cities; Figure S7: Differences in the walking and recreational park area 2017–2022; Figure S8: Differences in the neighborhood greenery area 2017–2021; Figure S9: Differences in the street greenery area 2017–2022; Figure S10: Differences in the green squares area 2017–2022; Figure S11: Number of planted trees 2017–2022; Figure S12: Number of tree cuttings 2017–2022.

Author Contributions

Conceptualization, A.P., A.K.; methodology, A.P., A.K.; software, A.P., A.K; validation, A.P., A.K.; formal analysis, A.P., A.K.; investigation, A.P., A.K.; resources, A.P., A.K.; data curation, A.P., A.K.; writing—original draft preparation, A.P., A.K.; writing—review and editing, A.P., A.K.; visualization, A.K.; supervision, A.P.; project administration, A.P.; funding acquisition, A.P. All authors have read and agreed to the published version of the manuscript.

Funding

This research was funded by Silesian University of Technology: 01/010/BK_23/0085.

Data Availability Statement

Data are contained within the article and supplementary materials.

Conflicts of Interest

The authors declare no conflicts of interest.

References

  1. Pancewicz, A. Natural Environment in Post-Industrial Landscape Renewal (Środowisko Przyrodnicze w Odnowie Krajobrazu Poprzemysłowego); Publishing House of the Silesian University of Technology: Gliwice, Poland, 2011. [Google Scholar]
  2. European Council of Town Planners. The European Council of Town Planners’ Vision for Cities in the 21st century. In The New Charter of Athens 2003; European Council of Town Planners: Lisbon, Portugal, 2003. [Google Scholar]
  3. Aflaki, A.; Mirnezhad, M.; Ghaffarianhoseini, A.; Ghaffarianhoseini, A.; Omrany, H.; Wang, Z.H.; Akbari, H. Urban Heat Island Mitigation Strategies: A State-of-the-Art Review on Kuala Lumpur, Singapore and Hong Kong. Cities 2017, 62, 131–145. [Google Scholar] [CrossRef]
  4. Kumar, P.; Druckman, A.; Gallagher, J.; Gatersleben, B.; Allison, S.; Eisenman, T.S.; Hoang, U.; Hama, S.; Tiwari, A.; Sharma, A.; et al. The nexus between air pollution, green infrastructure and human health. Environ. Int. 2019, 133, 105181. [Google Scholar] [CrossRef] [PubMed]
  5. Millennium Ecosystem Assessment. In Ecosystems and Human Well-Being: Synthesis. A Report of the Millennium Ecosystem Assessment; Island Press: Washington, DC, USA, 2005; pp. 40–50.
  6. Chàfer, M.; Cabeza, L.F.; Pisello, A.L.; Tan, C.L.; Wong, N.H. Trends and gaps in global research of greenery systems through a bibliometric analysis. Sustain. Cities Soc. 2021, 65, 102608. [Google Scholar] [CrossRef]
  7. Tan, P.Y.; Jim, C.Y. Greening Cities; Springer: Singapore, 2017. [Google Scholar]
  8. Beatley, T. Green Cities of Europe: Global Lessons on Green Urbanism; Island Press: Washington, DC, USA, 2012; pp. 1–234. [Google Scholar]
  9. Breuste, J. The Green City: General Concept. In Making Green Cities: Concepts, Challenges and Practice; Breuste, J., Artmann, M., Ioja, C., Qureshi, S., Eds.; Springer International Publishing: Cham, Germany, 2023; pp. 3–18. [Google Scholar] [CrossRef]
  10. European Commission, Directorate-General for Environment. EU Biodiversity Strategy for 2030—Bringing Nature Back into Our Lives; Publications Office of the European Union: Luxembourg, 2021. [Google Scholar]
  11. Romanello, M.; McGushin, A.; Di Napoli, C.; Drummond, P.; Hughes, N.; Jamart, L.; Kennard, H.; Lampard, P.; Solano Rodriguez, B.; Arnell, N.; et al. The 2021 report of the Lancet Countdown on health and climate change: Code red for a healthy future. Lancet 2021, 398, 1619–1662. [Google Scholar] [CrossRef] [PubMed]
  12. European Commission, Directorate-General for Environment. Building a Green Infrastructure for Europe; Publications Office of the European Union: Luxembourg, 2014. [Google Scholar]
  13. Dorst, H.; van der Jagt, A.; Raven, R.; Runhaar, H. Urban greening through nature-based solutions—Key characteristics of an emerging concept. Sustain. Cities Soc. 2019, 49, 101620. [Google Scholar] [CrossRef]
  14. Eisenberg, B.; Polcher, V. Nature Based Solutions—Technical Handbook. 2019. Available online: https://www.researchgate.net/publication/332230725 (accessed on 18 November 2023).
  15. Graça, M.; Cruz, S.; Monteiro, A.; Neset, T.-S. Designing urban green spaces for climate adaptation: A critical review of research outputs. Urban Clim. 2022, 42, 101126. [Google Scholar] [CrossRef]
  16. Van Dinter, M.; Kools, M.; Dane, G.; Weijs-Perrée, M.; Chamilothori, K.; van Leeuwen, E.; Borgers, A.; van den Berg, P. Urban Green Parks for Long-Term Subjective Well-Being: Empirical Relationships between Personal Characteristics, Park Characteristics, Park Use, Sense of Place, and Satisfaction with Life in The Netherlands. Sustainability 2022, 14, 4911. [Google Scholar] [CrossRef]
  17. Maes, J.; Zulian, G.; Günther, S.; Thijssen, M.; Raynal, J. Enhancing Resilience of Urban Ecosystems through Green Infrastructure (EnRoute): Final Report; Publications Office of the European Union: Luxembourg, 2019; Available online: https://api.semanticscholar.org/CorpusID:117265802 (accessed on 18 November 2023).
  18. Cuthbert, M.O.; Rau, G.C.; Ekström, M.; Bates, A.J. Global climate-driven trade-offs between the water retention and cooling benefits of urban greening. Nat. Commun. 2022, 13, 518. [Google Scholar] [CrossRef] [PubMed]
  19. Jim, C.Y. Sustainable Urban Greening Strategies for Compact Cities in Developing and Developed Economies. Urban Ecosyst. 2013, 16, 741–761. [Google Scholar] [CrossRef]
  20. Bowler, D.; Buyung-Ali, L.; Knight, T.; Pullin, A. Urban greening to cool towns and cities: A systematic review of the empirical evidence. Landsc. Urban Plan. 2010, 97, 147–155. [Google Scholar] [CrossRef]
  21. Chatzimentor, A.; Apostolopoulou, E.; Mazaris, A.D. A review of green infrastructure research in Europe: Challenges and opportunities. Landsc. Urban Plan. 2020, 198, 103775. [Google Scholar] [CrossRef]
  22. Quaranta, E.; Dorati, C.; Pistocchi, A. Water, energy and climate benefits of urban greening throughout Europe under different climatic scenarios. Sci. Rep. 2021, 11, 12163. [Google Scholar] [CrossRef] [PubMed]
  23. Zhang, B.; Xie, G.-D.; Gao, J.-X.; Yang, Y. The cooling effect of urban green spaces as a contribution to energy-saving and emission-reduction: A case study in Beijing, China. Build. Environ. 2014, 76, 37–43. [Google Scholar] [CrossRef]
  24. Payne, L.; Orsega-Smith, E.; Roy, M.; Godbey, G.C. Local Park Use and Personal Health among Older Adults: An Exploratory Study. J. Park Recreat. Adm. 2005, 23, 1–20. [Google Scholar]
  25. Walsh, C.J.; Roy, A.H.; Feminella, J.W.; Cottingham, P.D.; Groffman, P.M.; Morgan, R.P. The Urban Stream Syndrome: Current Knowledge and the Search for a Cure. J. N. Am. Benthol. Soc. 2005, 24, 706–723. [Google Scholar] [CrossRef]
  26. Kundzewicz, Z.W.; Kanae, S.; Seneviratne, S.I.; Handmer, J.; Nicholls, N.; Peduzzi, P.; Mechler, R.; Bouwer, L.M.; Arnell, N.; Mach, K.; et al. Flood Risk and Climate Change: Global and Regional Perspectives. Hydrol. Sci. J. 2014, 59, 1–28. [Google Scholar] [CrossRef]
  27. Reckien, D.; Salvia, M.; Heidrich, O.; Church, J.M.; Pietrapertosa, F.; De Gregorio-Hurtado, S.; D’Alonzo, V.; Foley, A.; Simoes, S.G.; Krkoška Lorencová, E.; et al. How are cities planning to respond to climate change? Assessment of local climate plans from 885 cities in the EU-28. J. Clean. Prod. 2018, 191, 207–219. [Google Scholar] [CrossRef]
  28. Ugolini, F.; Massetti, L.; Calaza-Martínez, P.; Cariñanos, P.; Dobbs, C.; Krajter Ostoić, S.; Marin, A.M.; Pearlmutter, D.; Saaroni, H.; Šaulienė, I.; et al. Understanding the benefits of public urban green space: How do perceptions vary between professionals and users? Landsc. Urban Plan. 2022, 228, 104575. [Google Scholar] [CrossRef]
  29. De Groot, R.; Fisher, B.; Christie, M.; Aronson, J.; Braat, L.; Gowdy, J.; Haines-Young, R.; Maltby, E.; Neuville, A.; Polasky, S.; et al. Integrating the ecological and economic dimensions in biodiversity and ecosystem service valuation. In The Economics of Ecosystems and Biodiversity Ecological and Economic Foundations; Kumar, P., Ed.; Routledge Press: London, UK, 2010; pp. 9–40. [Google Scholar]
  30. Sandifer, P.A.; Sutton-Grier, A.E.; Ward, B.P. Exploring connections among nature, biodiversity, ecosystem services, and human health and well-being: Opportunities to enhance health and biodiversity conservation. Ecosyst. Serv. 2015, 12, 1–15. [Google Scholar] [CrossRef]
  31. Hunter, R.F.; Christian, H.; Veitch, J.; Astell-Burt, T.; Hipp, J.A.; Schipperijn, J. The impact of interventions to promote physical activity in urban green space: A systematic review and recommendations for future research. Soc. Sci. Med. 2015, 124, 246–256. [Google Scholar] [CrossRef]
  32. Semeraro, T.; Scarano, A.; Buccolieri, R.; Santino, A.; Aarrevaara, E. Planning of Urban Green Spaces: An Ecological Perspective on Human Benefits. Land 2021, 10, 105. [Google Scholar] [CrossRef]
  33. World Urban Parks. The Role of Parks in Making Communities Liveable; Wellbeing Statement; ACT Wellbeing Framework—Treasury and Economic Development Directorate, ACT Government: Wellington, New Zealand, 2020; Available online: https://s3.amazonaws.com/s3.arpaonline.ca/WUP/World+Urban+Parks+-+Wellbeing+Statement.pdf (accessed on 18 November 2023).
  34. European Environment Agency. Healthy Environment, Healthy Lives: How the Environment Influences Health and Well-Being in Europe; EEA Report No 21/2019; Publications Office of the European Union: Luxembourg, 2020; Available online: https://op.europa.eu/en/publication-detail/-/publication/da08a73a-ed9d-11ea-991b-01aa75ed71a1/language-en (accessed on 18 November 2023).
  35. Sullivan, W.C.; Kuo, F.E.; Depooter, S.F. The Fruit of Urban Nature: Vital Neighborhood Spaces. Environ. Behav. 2004, 36, 678–700. [Google Scholar] [CrossRef]
  36. Threlfall, C.G.; Mata, L.; Mackie, J.A.; Hahs, A.K.; Stork, N.E.; Williams, N.S.G.; Livesley, S.J. Increasing biodiversity in urban green spaces through simple vegetation interventions. J. Appl. Ecol. 2017, 54, 1874–1883. [Google Scholar] [CrossRef]
  37. Dimoudi, A.; Nikolopoulou, M. Vegetation in the urban environment: Microclimatic analysis and benefits. Energy Build. 2003, 35, 69–76. [Google Scholar] [CrossRef]
  38. Blanco, J.; Dendoncker, N.; Barnaud, C.; Sirami, C. Ecosystem disservices matter: Towards their systematic integration within ecosystem service research and policy. Ecosyst. Serv. 2019, 36, 100913. [Google Scholar] [CrossRef]
  39. Cariñanos, P.; Grilo, F.; Pinho, P.; Casares-Porcel, M.; Branquinho, C.; Acil, N.; Andreucci, M.B.; Anjos, A.; Bianco, P.M.; Brini, S.; et al. Estimation of the Allergenic Potential of Urban Trees and Urban Parks: Towards the Healthy Design of Urban Green Spaces of the Future. Int. J. Environ. Res. Public Health 2019, 16, 1357. [Google Scholar] [CrossRef] [PubMed]
  40. Tandogan, O.; Simsek Ilhan, B. Fear of Crime in Public Spaces: From the View of Women Living in Cities. Procedia Eng. 2016, 161, 2011–2018. [Google Scholar] [CrossRef]
  41. Chaparro, L.; Terradas, J. Ecological Services of Urban Forest in Barcelona; Institut Municipal de Parcs i Jardins Ajuntament de Barcelona, Àrea de Medi Ambient: Barcelona, Spain, 2009. [Google Scholar]
  42. Bixler, R.D.; Floyd, M.F. Nature is scary, disgusting and uncomfortable. Environ. Behav. 1997, 29, 443–467. [Google Scholar] [CrossRef]
  43. Ministry of Development Funds and Regional Policy Republic of Poland. National Urban Policy 2030; Ministry of Development Funds and Regional Policy Republic of Poland: Warszawa, Poland, 2022. Available online: https://www.gov.pl/web/funds-regional-policy/national-urban-policy (accessed on 18 November 2023).
  44. Instytut Ochrony Środowiska—Państwowy Instytut Badawczy. Podręcznik Adaptacji dla Miast; Aktualizacja 2023; Instytut Ochrony Środowiska—Państwowy Instytut Badawczy: Warsaw, Poland, 2023; Available online: https://ios.edu.pl/aktualnosci/podrecznik-adaptacji-do-zmian-klimatu-dla-miast/ (accessed on 18 November 2023).
  45. Rządowy Projekt Ustawy o Zmianie Ustawy—Prawo Ochrony Środowiska Oraz Niektórych Innych Ustaw. Druk nr 2181. 2022. Available online: https://www.sejm.gov.pl/sejm9.nsf/PrzebiegProc.xsp?nr=2181 (accessed on 18 November 2023).
  46. Budżet Obywatelski. Available online: https://www.wolterskluwer.com/pl-pl/solutions/lex/administracja/prawo/budzet-obywatelski (accessed on 18 November 2023).
  47. Projekt Ustawy o Zmianie Ustawy—Prawo Ochrony Środowiska Oraz Niektórych Innych Ustaw. Nr Projektu UD246. Kancelaria Prezesa Rady Ministrów. Available online: https://www.gov.pl/web/premier/projekt-ustawy-o-zmianie-niektorych-ustaw-w-celu-wzmocnienia-klimatycznego-wymiaru-polityki-miejskiej2 (accessed on 18 November 2023).
  48. Banaszak, K.; Gajda, M.; Hobot, A.; Mazur, M.; Renc, A. Przyrodniczo-Klimatyczne Wskaźniki Zrównoważonego Rozwoju Miast Przewodnik dla Miast; Ministerstwo Klimatu i Środowiska: Warszawa, Poland, 2022. Available online: https://www.gov.pl/attachment/44ea8822-0be4-46bf-a363-9158011adb74 (accessed on 18 November 2023).
  49. Narodowy Fundusz Ochrony Środowiska i Gospodarki Wodnej. Program Odbetonowania Miast; Narodowy Fundusz Ochrony Środowiska i Gospodarki Wodnej: Warszawa, Poland, 2023. Available online: https://www.gov.pl/web/nfosigw/odbetonowanie-i-zazielenienie-przestrzeni-publicznych-w-miescie2 (accessed on 18 November 2023).
  50. Strategia Inwestycyjna Instrumentu Zielonej Transformacji Miast. Ministerstwo Funduszy i Polityki Regionalnej. Available online: https://www.gov.pl/web/planodbudowy/zielona-transformacja-miast (accessed on 18 November 2023).
  51. Ministry of the Environment. Climate Change Adaptation Plans in 44 Polish Cities; Summary Report; Ministry of the Environment: Warsaw, Poland, 2018; Available online: http://44mpa.pl/wp-content/uploads/2018/12/MPA_NET-ENG-20-12.pdf (accessed on 18 November 2023).
  52. Statistics Poland, Warsaw. Available online: https://stat.gov.pl/en/ (accessed on 18 November 2023).
  53. Vojvodikova, B. (Ed.) Handbook SALUTE4CE—Handbook on Urban Environmental Acupuncture; Interreg Central Europe, Salute 4CE; Technical University of Ostrava: Ostrava, Czech, 2022; ISBN 978-80-248-4598-2. [Google Scholar]
  54. Gorgoń, J. (Ed.) Obszary Miejsko-Przemysłowe Wobec Zmian Klimatu na Przykładzie Miast Centralnej Części Górnośląsko-Zagłębiowskiej Metropolii; Works & Studies/Prace i Studia, No. 89; Instytut Podstaw Inżynierii Środowiska Państwowej Akademii Nauk: Zabrze, Poland, 2019; Available online: http://44mpa.pl/publikacje-edukacyjne/ (accessed on 28 December 2023).
  55. Masik, G.; Gajewski, R. Working towards urban capacity and resilience strategy implementation: Adaptation plans and strategies in Polish cities. Cities 2021, 119, 103381. [Google Scholar] [CrossRef]
  56. Kalbarczyk, E.; Kalbarczyk, R. Credibility assessment of municipal climate change adaptation plans using the ex-ante method: A case study of Poland. Sustain. Cities Soc. 2022, 87, 104242. [Google Scholar] [CrossRef]
  57. Belčáková, I.; Świąder, M.; Bartyna-Zielińska, M. The Green Infrastructure in Cities as A Tool for Climate Change Adaptation and Mitigation: Slovakian and Polish Experiences. Atmosphere 2019, 10, 552. [Google Scholar] [CrossRef]
  58. Seminar Papers of the First-Year Master’s Students of the Faculty of Architecture at the Silesian University of Technology. Performed on the Subject: Renewal of Degraded Urban Landscape in the Academic Year 2021/2022 and 2022/2023. 2023; Unpublished work.
  59. Urban Adaptation Plans by 2030. Available online: http://44mpa.pl/plany-adaptacji/ (accessed on 18 November 2023).
  60. Pancewicz, A.; Anczykowska, W.; Żak, N. Climate change adaptation activities planning and implementation in large cities: Results of research carried out in Poland and selected European cities. Clim. Change 2023, 176, 116. [Google Scholar] [CrossRef]
  61. URBAN GreenUP. European Union’s Horizon 2020 Programme. Available online: https://www.urbangreenup.eu/ (accessed on 18 November 2023).
  62. Pancewicz, A.; Bednarz, D.; Drożdż, D.; Marszoł, M.; Suchy, N. The Use of Nature-Based Solutions in the Adaptation of Large Polish Cities to Climate Change and Energy Transformation: A Comparative Analysis. Energies 2023, 16, 5189. [Google Scholar] [CrossRef]
  63. Fetting, C. The European Green Deal; ESDN Report; ESDN Office: Vienna, Austria, 2020; Available online: https://www.esdn.eu/fileadmin/ESDN_Reports/ESDN_Report_2_2020.pdf (accessed on 18 November 2023).
  64. Broto, V.C.; Bulkeley, H. A Survey of Urban Climate Change Experiments in 100 Cities. Glob. Environ. Change 2013, 23, 92–102. [Google Scholar] [CrossRef] [PubMed]
  65. Heidrich, O.; Reckien, D.; Olazabal, M.; Foley, A.; Salvia, M.; de Gregorio Hurtado, S.; Orru, H.; Flacke, J.; Geneletti, D.; Pietrapertosa, F.; et al. National Climate Policies across Europe and Their Impacts on Cities Strategies. J. Environ. Manag. 2016, 168, 36–45. [Google Scholar] [CrossRef] [PubMed]
  66. Grafakos, S.; Viero, G.; Reckien, D.; Trigg, K.; Viguie, V.; Sudmant, A.; Graves, C.; Foley, A.; Heidrich, O.; Mirailles, J.M.; et al. Integration of Mitigation and Adaptation in Urban Climate Change Action Plans in Europe: A Systematic Assessment. Renew. Sustain. Energy Rev. 2020, 121, 109623. [Google Scholar] [CrossRef]
  67. Stangel, M. Urban Environmental Acupuncture for Improving the Sustainability of Dense City Areas—Polish Experiences from the SALUTE4CE Project. Archit. Civ. Eng. Environ. 2023, 16, 15–27. [Google Scholar] [CrossRef]
  68. Shan, S.; Genç, S.Y.; Kamran, H.W.; Dinca, G. Role of Green Technology Innovation and Renewable Energy in Carbon Neutrality: A Sustainable Investigation from Turkey. J. Environ. Manag. 2021, 294, 113004. [Google Scholar] [CrossRef]
  69. Ford, J.D.; Berrang-Ford, L. The 4Cs of Adaptation Tracking: Consistency, Comparability, Comprehensiveness, Coherency. Mitig. Adapt. Strateg. Glob. Change 2016, 21, 839–859. [Google Scholar] [CrossRef]
  70. 5 °C Climate Action Plans. C40 Cities. Available online: https://www.c40.org/what-we-do/raising-climate-ambition/1-5c-climate-action-plans/ (accessed on 18 November 2023).
  71. Johnson, L.; Krisko, P.; Malik, M.; O’Donnell, C.; Pendleton, N.; Ahn, D.; Bizberg, A.; Chafe, Z.A.; Kim, D.; McCormick, S.; et al. Environmental, Health, and Equity Co-Benefits in Urban Climate Action Plans: A Descriptive Analysis for 27 C40 Member Cities. Front. Sustain. Cities 2022, 4, 869203. [Google Scholar] [CrossRef]
  72. Rookwood, P. Landscape planning for biodiversity. Landsc. Urban Plan. 1995, 31, 379–385. [Google Scholar] [CrossRef]
  73. Kuipers, Y.; Emonts, M.; ten Brink, P.; Mutafoglu, K.; Schweitzer, J.-P.; Kettunen, M.; Twigger-Ross, C.; Baker, J.; Tyrväinen, L.; Hujala, T.; et al. The Health and Social Benefits of Nature and Biodiversity Protection: Annex 2, 3 and 4; A report for the European Commission (ENV.B.3/ETU/2014/0039); Institute for European Environmental Policy: London, UK; Brussels, Belgium, 2016; Available online: https://ieep.eu/wp-content/uploads/2022/12/Health_and_Social_Benefits_of_Nature_-_Final_Report_Annexes_2_3_and_4_sent.pdf (accessed on 18 November 2023).
  74. Ajuntament de Barcelona. Barcelona Green Infrastructure and Biodiversity Plan; Ajuntament de Barcelona: Barcelona, Spain, 2013; Available online: https://ajuntament.barcelona.cat/ecologiaurbana/sites/default/files/Barcelona%20green%20infrastructure%20and%20biodiversity%20plan%202020.pdf (accessed on 18 November 2023).
  75. City of London. City of London Biodiversity Action Plan 2021–2026; City of London: London, UK, 2021. Available online: https://www.cityoflondon.gov.uk/assets/Green-Spaces/city-of-london-biodiversity-action-plan-2021-2026.pdf (accessed on 18 November 2023).
  76. Paulin, M.; Remme, R.; de Nijs, T. Amsterdam’s Green Infrastructure: Valuing Nature’s Contributions to People; RIVM Letter Report 2019-0021; Rijksinstituut voor Volksgezondheid en Milieu RIVM: Bilthoven, Netherlands, 2019; Available online: https://www.rivm.nl/bibliotheek/rapporten/2019-0021.pdf (accessed on 18 November 2023).
  77. Ajuntament de Barcelona. Tree Master Plan; Ajuntament de Barcelona: Barcelona, Spain, 2021; Available online: https://interlace-hub.com/sites/default/files/Pla-director-arbrat-barcelona-ENG.pdf (accessed on 18 November 2023).
  78. INTERLACE HUB—Urban Governance Atlas—Statute on the Design of Parking Spaces—Chemnitz. Available online: https://interlace-hub.com/statute-design-parking-spaces-chemnitz. (accessed on 18 November 2023).
  79. De Luca, C.; Langemeyer, J.; Vaňo, S.; Baró, F.; Andersson, E. Adaptive Resilience of and through Urban Ecosystem Services: A Transdisciplinary Approach to Sustainability in Barcelona. Ecol. Soc. 2021, 26, 38. [Google Scholar] [CrossRef]
  80. Kronenberg, J. Usługi ekosystemów w miastach. Zrównoważony Rozwój. Zastosowania. Przyroda w mieście. In Zrównoważony Rozwój—Zastosowania nr 3; Fundacja Sendzimira: Cracow, Poland, 2012; pp. 13–28. Available online: https://sendzimir.org.pl/wp-content/uploads/2019/08/ZRZ3_str_13-28.pdf (accessed on 18 November 2023).
Figure 1. The major climate threats identified in 44 UAPs in Poland (pcs), own study based on [59].
Energies 17 00377 g001
Figure 2. Percentage of major threats to cities, as identified in the UAPs, that can be mitigated with greenery (%), own study based on [59].
Energies 17 00377 g002
Figure 3. Types of RES activities in relation to which compilations of types are in planned activities under UAPs, own study based on [59].
Energies 17 00377 g003
Figure 4. Types of RES activities in UAPs of cities with a susceptible energy sector, own study based on [59].
Energies 17 00377 g004
Figure 5. Adaptation activities in the category of sustainable management of green areas completed and planned in cities, 2014–2022 (pcs), own study based on [58].
Energies 17 00377 g005
Figure 6. Adaptation activities in the category of micro-interventions/urban acupuncture completed and planned in cities 2014–2022 (pcs), own study based on [58].
Energies 17 00377 g006
Figure 7. Number of completed and planned NbSs in the category of re-naturing urbanisation 2017–2023 (pcs), own study based on [58].
Energies 17 00377 g007
Figure 8. Number of completed and planned NbSs in the category of singular green infrastructure 2017–2023 (pcs), own study based on [58].
Energies 17 00377 g008
Figure 9. Sum of differences in all types of green areas 2017–2022 (ha), own study based on [52].
Energies 17 00377 g009
Figure 10. Sum of tree cuttings and plantings in the city 2017–2022 (pcs), own study based on [52].
Energies 17 00377 g010
Disclaimer/Publisher’s Note: The statements, opinions and data contained in all publications are solely those of the individual author(s) and contributor(s) and not of MDPI and/or the editor(s). MDPI and/or the editor(s) disclaim responsibility for any injury to people or property resulting from any ideas, methods, instructions or products referred to in the content.

