Abstract
The current study presents the first results of the passive capture of carbon dioxide from the air in aqueous sodium lysinate solutions at ambient conditions. The salt has shown good passive direct air capture (DAC) properties for carbon dioxide with spent solutions exhibiting more than 5% carbon dioxide by weight. Moreover, different quantities of sodium lysinate solutions were mixed with three commercial water-based paints, and their passive DAC performance was studied for 45 days. An average improvement of 70% in passive DAC capacity compared to the control sample was observed across all the studied paint samples. The results establish that a litre of water-based paint doped with sodium lysinate can absorb up to 40 g of CO2 and fix it stably for a short period of time, i.e., 45 days. Such paints can be used to directly capture carbon dioxide from the air. However, further research is required to address various technicalities and establish long-term sequestration.
1. Introduction
Carbon dioxide (CO2) is the largest greenhouse contributor to climate change. The majority of CO2 is released from fossil fuel use and industrial processing [1]. The atmospheric CO2 concentration has consistently increased from 280 ppm in the year 1780 to nearly 420 ppm in recent years [2]. The industrial carbon capture and engineered removal targets are key components for meeting the net-zero targets laid down in the Paris Agreement, which envisages limiting global warming below 2 °C, preferably to 1.5 °C, compared to preindustrial levels. This means that along with aggressive emissions reductions, the world needs to remove 2–20 gigatons of CO2 from the atmosphere annually by the year 2050 [3]. The engineered removals comprise different carbon dioxide removal approaches, which include direct air capture [4], coastal/oceanic carbon dioxide removal [5], bioenergy with carbon capture and storage [6], and carbon dioxide mineralisation [7]. Currently, direct air capture (DAC) is at a higher technology readiness than other technologies [8]. DAC is of interest to small companies and medium enterprises who distribute emissions which would have to otherwise resort to trading carbon credits and paying heavy carbon taxes. However, the operational costs of the technology hinder its application as an expansive CO2 removal method. Moreover, the policy about DAC is unclear, as the market awaits both a breakthrough in technology and economics [4].
Currently, a few pilot plants operate worldwide and capture around 10,000 tons of CO2 per annum [9]. It is expected that nearly 1250 DAC plants would be required by the year 2030 to achieve a removal of 1 megaton of carbon dioxide every year [4]. However, the scale of development will not be able to match the net-zero targets of 1 gigatons/CO2 per year, as defined in the Paris Agreement. Moreover, the land, area, energy resources, and water requirements for the current pilot-scale DAC technologies are of another concern [10]. The inherent low concentration of carbon dioxide in the air (0.042%) results in large energy consumption for the thermal regeneration process and active air contacting (which requires large fans to drive large volumes of air through the sorbent system). It is usually thrice the energy penalty for industrial carbon capture. For a meaningful impact on the climate, its price should be less than USD 100/ton of CO2 capture, which is not achievable with the current energy requirements for DAC [11].
Two major areas for DAC development and cost reductions are to use passive air contact or develop better sorbents for capture. First, the air should contact the sorbent/capture material without the use of driving force/energy. Second, the sorbents require a huge advancement in research to develop an increased CO2 capture rate when in passive contact with air [12]. This breakthrough would not only help to reduce the cost of direct air capture but also help in capturing large quantities of carbon dioxide passively.
Niffenegger and Aziz developed a passive airflow system for the DAC systems. Passive airflow was achieved with a design inspired by the prairie dog burrows where a mound-shaped pipe connector naturally forces air to move upwards through a column, due to low pressure created by the wind draft at the top of the column [13]. They proposed using a carbonic anhydrase-catalysed reaction with magnesium oxide for capturing carbon dioxide. Abanades et al. suggested a low-cost alternative by employing passive contactor volumes that forced airflow and used custom-built Ca(OH)2 porous structures, with an estimated cost of capture between USD 140 and USD 340 per ton of CO2 [14].
Alkaline salts of amino acids have been well-researched for industrial carbon capture, and a few papers also discuss their applications in DAC when mixed with ionic liquids. Barzagli et al. investigated five different diamines, namely 1,2-diaminopropane, N,N-diethyl-ethylene-diamine, piperazine, 1-methyl-piperazine, and N’-tetra-methyl-ethylene-diamine, as liquid sorbents for the direct capture of CO2 from air in both aqueous and non-aqueous solutions, using a 1:1 (volume scale) mixture of ethylene glycol and 1-propanol as an organic diluent [15]. Kikkawa et al. studied direct CO2 capture using a liquid amine–solid carbamic acid in a phase-separation system. The phase separation between a liquid amine and the solid carbamic acid exhibited >99% CO2 removal efficiency under a 400 ppm CO2 flow system using diamines bearing an amino-cyclo-hexyl group [16]. Stamberga et al. used a methyl-glyoxal-bis(iminoguanidine) (m-BBIG) base and studied the effect of different amino acids on the DAC efficacy [17]. Custelcean et al. reported a bench-scale direct air capture process comprising CO2 absorption with aqueous amino acid salts (i.e., potassium glycinate, potassium sarcosinate), followed by room-temperature regeneration of the amino acids using a reaction with solid m-BBIG [18]. However, none of the published studies have studied a solitary alkaline amino acid salt for direct air sequestration. When reacted with CO2, alkaline amino acid salts form stable bicarbonates/carbonates in water [19]. The reaction shifts the carbonation reaction in the forward direction, allowing the rapid formation of bicarbonate/carbonate, which can be precipitated or kept dissolved by controlling the reaction chemistry [20]. A general reaction between an amino acid salt (AANH) and carbon dioxide is provided in equation 1 [21], producing a bicarbonate ion and capturing the hydrogen ion of the reaction itself [22].
Lysine was reported to directly absorb atmospheric carbon dioxide [23] and have excellent CO2 equilibrium capacity and kinetic behaviour when mixed with strong alkalis [24]. Theoretically, L-lysine can be mixed with any strong alkali to make an alkaline amino acid salt that is water soluble and has a high CO2 absorption capacity [25]. They also reduce the energy requirements for heating/solvent [26]. Alkaline salts of L-lysine have been mixed with various alkanolamines, e.g., piperazine [25], diethylenetriamine [26], monoethanolamine [27], methyl-diethanolamine [28], and 2-amino-2-methyl-1-propanol [29], to study its effect on CO2 absorption at a range of temperatures and pressures. Both potassium and sodium hydroxides have been used for activating the amino acid [25]. The capture performance of both hydroxides is comparable at a range of temperatures and pressures. For this study, sodium hydroxide was selected as an activating agent because of its lower price and lower molecular weight (40 g/mol) compared to potassium hydroxide (56 g/mol).
This article presents the first application of alkaline amino acid salts for DAC. With a combination of a strong alkali (sodium hydroxide) and a basic amino acid (L-lysine), we have developed a liquid sorbent that can passively capture carbon dioxide directly from air at ambient conditions. Moreover, the liquid sorbent, when added to commercial water-based paints, imparts a carbon capture capacity to the latter and increases their CO2 uptake and fixation rates. This means that paints doped with an alkaline amino acid salt can passively capture carbon dioxide from the air and stably sequester it (yet to be determined for the long term).
Section 2 discusses the materials and methods used to develop the alkaline amino acid salt and its application to water-based paints. Section 3 presents the results and discussion. Section 4 discusses the socio-economic and environmental benefits of carbon capture paints. Finally, the article concludes with major outcomes and possible directions for future research.
2. Materials and Methods
All chemicals (except water) were sourced from Sigma-Aldrich, UK, and used without further purification. Detailed information about materials used in this study is provided in Table 1. Deionised water was acquired in-house.

Table 1.
Sample provenance table.
The solutions of sodium lysinate (1–4 M) were prepared by first weighing the alkali (sodium hydroxide), followed by separately weighing the equimolar quantity of L-Lysine using an analytical mass balance (Ohaus Adventurer AX224M, Fisher Scientific, Loughborough, UK) (u = 0.2 mg). The chemicals were then conjointly added to a 250 mL volumetric flask, and a solution of the required concentration was prepared by adding deionized water. All solutions were prepared in molar concentrations (1–4 M) at a controlled temperature of 298.2 K (u = 0.1 K).
Once prepared, 20 mL of sodium lysinate solution was exposed to air in a petri dish at the laboratory conditions given in Table 2. The period of exposure varied from 0 to 96 h with a step of 24 h. The exposed solutions were checked every 12 h for any visual changes, and any drop in the volume (due to evaporation) was compensated by adding makeup water. Once the exposure time elapsed, the spent solutions were immediately tested for dissolved carbon dioxide content using the barium chloride wet phase analysis [30].
Table 2.
Laboratory conditions for determining direct air capture capacity of sodium lysinate with maximum variations over time.
In the second set of experiments, different amounts of 3 M solutions of sodium lysinate (chosen for reasons discussed in the results later) were added to the three different types of commercial water-based paints. For a typical experiment, 0.1, 0.3, or 0.5 mL of 3 M sodium lysinate was mixed with a remaining amount of paint to make a total prepared sample of 10 mL in volume. The quantities of sodium lysinate being mixed with paint samples were kept low (5% v/v or lower) to ensure a minimal change to the paint’s properties. A control sample without any sodium lysinate (10 mL each) was also prepared for all paint types by adding deionised water. Two emulsion paints, namely samples AW and AR, were acquired from a major producer (A) of paints in the UK with two different colours, white and red, respectively. The third paint, called sample BW hereafter, was a white emulsion paint acquired from another major manufacturer (B) of water-based paints in the UK. Hence, the samples AW and AR differ in colour, while BW is of the same colour as AW but from a different paint producer. All paint samples were used without dilution and any further modification. During experiments for passive direct air capture, these samples were applied on a Perspex* sheet as a thin layer (1 mm ± 0.2 mm in thickness) and exposed to air for different periods (1–45 days) at the laboratory conditions mentioned in Table 2 above. After the completion of the exposure time, each sample was dissolved in water and immediately tested for its dissolved carbon dioxide content by using the barium chloride wet phase analysis. Results are reported with standard and expanded uncertainties and presented in Section 3.
3. Results and Discussion
As discussed in Section 2, the study was performed in two parts. First, the individual passive DAC capacity of the sodium lysinate salt was determined at room conditions, and the results are presented in Section 3.1. Second, the sodium lysinate was mixed with commercial water-based paints to determine its effect on improving their passive carbon capture capacity and change in a mass fraction over time, and the results are presented in Section 3.2.
3.1. Passive DAC Capacity of Sodium Lysinate at Ambient Conditions
Table 3 presents the amount of CO2 captured by the sodium lysinate solutions at different concentrations and exposure time to air. Figure 1 shows the effect of sodium lysinate salt concentrations on the carbon dioxide dissolution for different exposure times. It is observed that with an increase in the amino acid salt concentration, the mass fraction of carbon dioxide absorbed in the solution increases. The increase is quite rapid initially, i.e., first 24 h, as more free solvent is available for reaction with the atmospheric CO2. The sorption rate drops gradually as time increases, as the solution becomes more saturated with carbon dioxide.
Table 3.
Mass fraction of the carbon dioxide (w1) dissolved in the various concentrations (C) of sodium lysinate solutions as a function of different exposure time to the air (t) at 293.15 K and near atmospheric pressure (100.8 kPa) a,b.
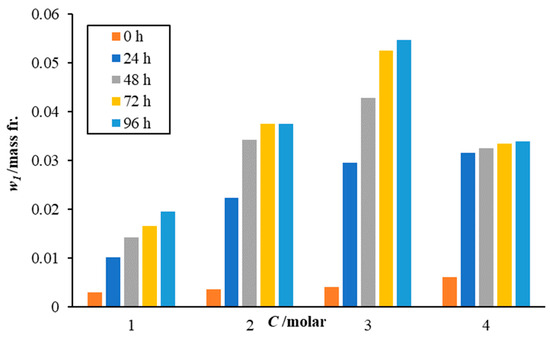
Figure 1.
Effect of sodium lysinate concentration on the dissolution of atmospheric carbon dioxide. Individual bar lines for each concentration represent the effect of exposure time on the carbon dioxide solubility in sodium lysinate solutions.
Interestingly, the base loadings of all solution mixtures at zero time (when freshly prepared) are above the CO2 saturation value of 0.00168 mass fraction (CO2 saturation is 0.169 g CO2/100 g of water at 293.2 K as per Henry’s law). This means either the solutions are quite active at capturing carbon dioxide in the air, while they are stirred during preparation, or the individual components like L-lysine (which captures CO2 directly from air [23]) have sorbed some carbon dioxide from the air during the sample preparation. However, in all cases, the values of this background carbon dioxide are negligible compared to the dissolution values seen after exposure to the atmosphere.
The increase in the amount of carbon dioxide dissolved in the solution increases logarithmically with an increase in amino acid salt concentration (up to 3 M) and then nearly flattens out at 4 M concentration. At 4 M concentration, the solution becomes heavily viscous at 293.15 K. Although, it has the highest sorption rate for the first 24 h. After 24 h, the top layer (which is in contact with air) slowly hardens, either due to evaporation or quick reaction, and forms a solid crust on the top. It fails to dissolve in the remaining mixture upon stirring and even when thermally heated up to 323.15 K. This layer formation hinders the air/liquid interface from further mass transfer of carbon dioxide from the gas phase to the liquid phase. This explains the low amounts of carbon dioxide being dissolved in the 4 M concentrated solutions beyond 24 h.
Since the 3 M sodium lysinate solution showed the highest CO2 dissolution capacity and rates among all the studied solutions, it was selected for mixing with the paint samples. As explained earlier, the amounts of sodium lysinate solutions were selected to be maintained below 5% v/v of the paint samples. The use of different sodium lysinate compositions was avoided to ensure that not only the alkaline salt amount remained consistent among all paint samples, but the water (being one of the reactive species in bicarbonate formation) also remained the same.
3.2. Passive DAC Capacity of Emulsion Paint Samples Doped with Sodium Lysinate at Ambient Conditions
Table 4 presents the amount of CO2 dissolved in the emulsion paint samples, AW, AR, and BW, which were mixed with different amounts of 3 M sodium lysinate and exposure times to air.
Table 4.
Mass fraction of the carbon dioxide (w2) dissolved in 10 mL each of the paint samples AW, AR, and BW, which were doped with small quantities (q) of sodium lysinate solutions as a function of different exposure time to the air (t) at 293.15 K and near atmospheric pressure (100.8 kPa) a,b.
Figure 2, Figure 3 and Figure 4 illustrate the effect of using different mixing amounts of 3 M sodium lysinate solution on the CO2 dissolution in the paint samples, AW, AR, and BW, respectively. Notably, all paint samples without any alkaline salt also register an uptake of carbon dioxide from the atmosphere. This is because most water-based emulsions use slaked lime, Ca(OH)2, which naturally weathers and reacts with atmospheric CO2 to form bicarbonate/carbonate in the paint structure [14]. However, the amount of CO2 being sorbed differs as per the paint type in the order of AR > AW > BW. This may be attributed to the different chemicals used in the paint manufacture.

Figure 2.
Effect of different quantities of 3 M sodium lysinate on the carbon dioxide absorption in the paint sample AW. Please note, the data lines for day 15 and day 45 are superimposed as there was little change in the mass fraction between them.
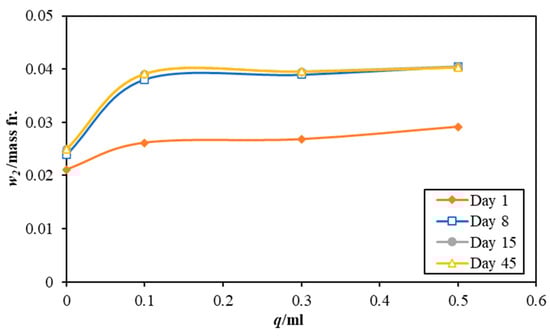
Figure 3.
Effect of different quantities of 3 M sodium lysinate on the carbon dioxide absorption in the paint sample AR. Please note, the data lines for day 15 and day 45 are superimposed as there was little change in the mass fraction between them.
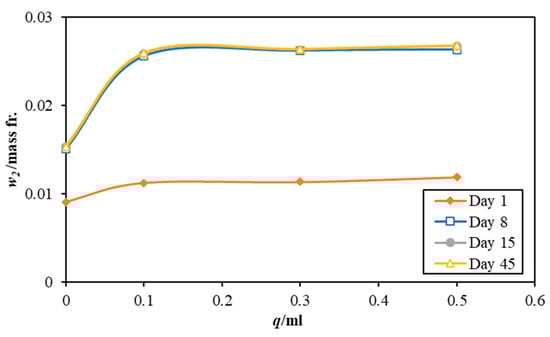
Figure 4.
Effect of different quantities of 3 M sodium lysinate on the carbon dioxide absorption in the paint sample BW. Please note, the data lines for Day 8, Day 15, and Day 45 are superimposed as there was little change in the mass fraction among them.
With the addition of the sodium lysinate, the amount of CO2 captured registers an increase. However, the effect of varying the amount of amino acid salts is not strong, where only a minor increase is seen with an increase in the sodium lysinate amounts being added to each paint sample. Although individual values of CO2 mass fraction for each instance, the effect is not as robust as seen for the pure sodium lysinate solutions. This could be caused by many other competitive and complex reactions that occur when the paint samples dry and lose water, which is critical for the CO2–H2 O reactions. Drying of the paint samples may also explain the plateauing of CO2 dissolution after 8 days, as the amount of CO2 absorbed in the paint sample is nearly the same for days 8, 15, and 45.
On day 1, all paint samples sorbed almost the same amount of carbon dioxide (21–24% higher CO2 content than the control sample) irrespective of the paint type. This confirms that the sodium lysinate does not have a catalytic effect on the absorption rate but enhances the capacity of CO2 dissolution when mixed with paints. Moreover, the final values of CO2 sorbed in paint samples at day 45 also reiterates the same notion. All control samples with no salt added to them show a lower CO2 saturation than the samples mixed with sodium lysinate. Quantitatively, all samples show an average improvement of 70% in adsorption capacity with low values of up to a 63% increase for sample BW, and higher values of up to 82% for sample AR.
Figure 5, Figure 6 and Figure 7 present the change of CO2 mass fraction with respect to time in sodium lysinate mixed paint samples, AW, AR, and BW, respectively. It is interesting to note that the absorption rate is highest on day 1 and between days 1 and 8, and then drops gradually thereof to almost zero between days 15 and 45. The trend seen for the first 24 h is quite in line with the trend exhibited by the individual sodium lysinate solutions as given in Section 3.1. However, the rate of CO2 absorption does not follow the remaining results in Section 3.1. This difference is attributed to the scarcity of water in paint samples once they start drying. This further ascertains that the presence of water is essential in carbon dioxide uptake.
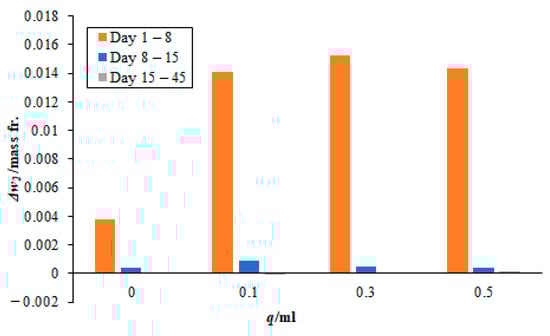
Figure 5.
Effect of different quantities of 3 M sodium lysinate on the carbon dioxide absorption rate in the paint sample AW. Please note, the bars for days 15–45 are very small and not easily visible since there was little change in the mass fraction during this time.
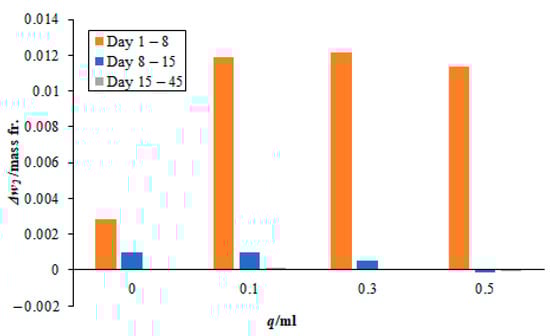
Figure 6.
Effect of different quantities of 3 M sodium lysinate on the carbon dioxide sorption rate in the paint sample AR. Please note, the bars for days 15–45 are very small and not easily visible since there was little change in the mass fraction during this time.
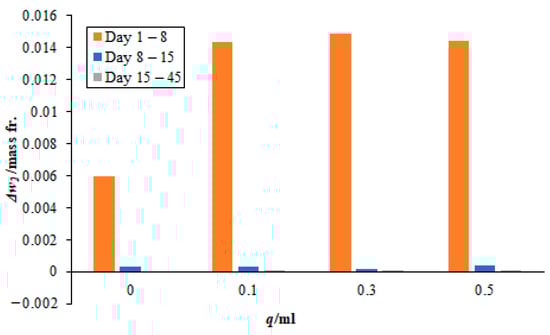
Figure 7.
Effect of different quantities of 3 M sodium lysinate on the carbon dioxide sorption rate in the paint sample BW. Please note, the bars for days 15–45 are very small and not easily visible since there was little change in the mass fraction during this time.
Moreover, the absorption rates from day 8 onwards to day 45 become increasingly small. The values are nearly 10% of the total carbon dioxide sorbed during this period. In case, when no sodium lysinate was mixed with the sodium sample, nearly 20% of the total carbon dioxide was fixated during this period. This may lead to falsely believing that sodium lysinate may have a catalytic effect on the carbon dioxide sorption during this period. However, on closer observation, the amount of CO2 sorbed during days 8 to 45 is nearly similar, whether sodium lysinate was mixed or not. There is only one exception, i.e., in the case of 0.1 mL sodium lysinate being added to the paint sample, AW at day 8–15 (see Figure 5), which is attributed to the experimental error.
Readers are advised to take note that the timeline in Figure 5, Figure 6 and Figure 7 does not represent uniform timescales and, when comparing the lines for days 15–45, they must remember that the carbon dioxide sorption rates were negligibly small during these 30 days, as compared to the seven days that elapsed between day 1–8 and day 8–15. Moreover, most of the sorbent was consumed from the start of the experiment until day 8. This agrees with the results seen in Section 3.1 for pure sodium lysinate solutions, where the maximum change in mass fraction of CO2, with respect to time, is seen for the first 24 h and then they gradually drop to plateau over time. Finally, it is worth noting that none of the sorbed carbon dioxide has broken off/or was re-released into the atmosphere after 45 days of exposure to air. This means that the sorbed CO2 has stabilised in the paint samples during this period. There are a couple of very small negative values registered in the magnitude of 10−5 in the mass fraction after 45 days. This is attributed to experimental and human error in reporting.
Figure 5, Figure 6 and Figure 7 show that the highest sorption rates are seen during days 1–15, which is the curing period of most water-based paints [31]. Since most paints have dried well after 15 days and are devoid of water, the mechanism of carbon dioxide capture is majorly based on adsorption (which is very small compared to the first 15 days). The following two reactions represent the sorption of carbon dioxide in aqueous alkaline amino acid salt solutions [21,22].
The bicarbonate formation (reaction 2) is dependent on the presence of water, which can either be taken up from the water in the paint itself or the humidity in the environment. The carbamate formation (reaction 3) is water-independent and majorly responsible for the chemisorption in paints, as the water dries out. It is pertinent to note that the two molecules of an amino acid salt are consumed to capture one mole of carbon dioxide in the carbamate formation reaction compared to one molecule in the bicarbonate reaction. We believe that higher humidity (>70%) in the environment will favour the bicarbonate formation reaction, resulting in higher sorption rates. However, this will retard the paint curing and film formation [31]. The above reactions happen in addition to the other reactions that occur during the paint curing period, which are given as follows:
Reactions 4 and 5 are dependent on the content of the slaked lime and unreacted calcium oxide present within the paint. The direct reaction of calcium oxide with carbon dioxide (reaction 5) is quite slow (also known as the natural weathering reaction) compared to the slaked lime reaction [32]. Overall, the slaked lime reaction with carbon dioxide (reaction 4) contributes to the carbon capture in the control samples and to some extent in the formulated samples.
Figure 8a–d shows the comparison of sorption performance among three paint samples, AW, AR, and BW. As discussed earlier, both samples from company A showed better sorption performance than BW for all scenarios, even when no sodium lysinate was added. Surprisingly, when the inherent carbon dioxide sorption is subtracted and adjusted for composition in the paint sample, all paint samples mixed with sodium lysinate show similar sorption rates, lying within ±15% of the results seen for pure sodium lysinate solutions presented in Section 3.1.
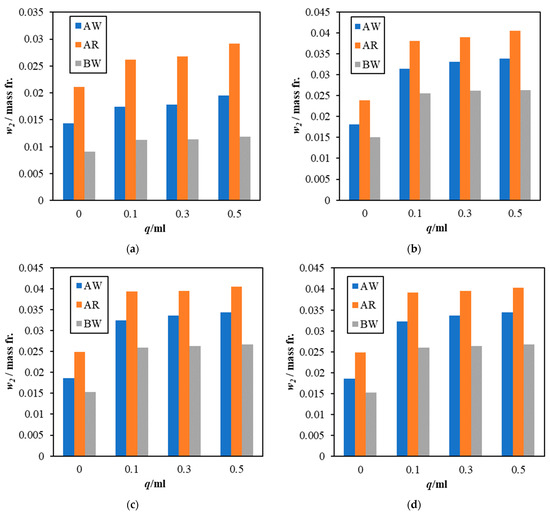
Figure 8.
Comparison of atmospheric CO2 dissolution for paint samples, AW, AR, and BW on different days; (a) day 1, (b) day 8, (c) day 15, and (d) day 45.
4. Socio-Economic and Environmental Impact of Carbon Capturing Paints on Climate Change Mitigation
The world is now taking concrete steps to reduce greenhouse gas emissions for the benefit of the planet and all living organisms. While various scenarios of the impact of emissions are debated, the consensus is that practical mitigation strategies are needed to address the issue. Today, communities, governments, and stakeholders seek sustainable solutions to tackle climate change and rebalance the Earth’s carbon cycle [1]. Greenhouse gas removals and, particularly, carbon removals are one of many methods to reduce elevated greenhouse gas concentrations present in our atmosphere [12]. The use of carbon capture coatings can offer a workable solution to capture, fix, and sequester CO2. Various companies have offered paints that have a lower carbon footprint than conventional paints. For example, paints based on waste concrete powder that can absorb CO2, as well as lime and graphene-infused ones that can absorb significant amounts of carbon dioxide, are available off-the-shelf [33].
The potential impact of these carbon capture coatings is substantial as they are typically used in all facets of life and provide extensive surface area that coatings cover worldwide without extra incurred costs. Combined with an advanced carbon capture sorbent, they can capture CO2 for the long term and contribute to cleaner indoor environments and improved energy efficiency in buildings. We have estimated that paints doped with sodium lysinate solutions can capture 40 g of CO2 per litre of prepared paint. This means that alone, the UK can passively capture, fix, and sequester over 28,000 tons of CO2 from the air every year [34]. This would require minimal changes to the paint production process as sodium lysinate can be added as an additive to the paint during conventional manufacturing.
Any cost estimate at this stage of study will be very rudimentary. Obviously, the market forces, customer perception, and subsidies on the pro-decarbonisation products will play an important role in the final costs. Based only on the material costs at the lab scale, we estimate lysine-based formulated paints (USD 10.5 per litre) will cost 20% to 30% more than conventional paint (USD 8 per litre). A coarse estimate of capturing one ton of carbon dioxide would be between USD 260 and USD 350, which is still higher than the industrial requisite of below USD 100/ton for DAC technologies. However, this is in line with contemporary DAC technologies [11,12].
Sodium lysinate-based formulated paints may not offer greater or comparative sorption capacity like graphene and concrete powder-based paints, but they offer the flexibility to be mixed and infused in water-based paints (other types are under testing) without requiring major changes to the production process or the supply chain. We expect that the carbon-capturing paints will allow the communities to get more involved in the efforts against climate change. With off-the-shelf solutions that can be brought quickly to the market without large investments, society may feel more inclined to make environmentally friendly choices.
5. Future Recommendations
The study reports the first results for the passive DAC in water-based paints. Further research is required to understand the effect of sodium lysinate on the paint’s applicability and drying in domestic environments and the long-term storage of carbon dioxide. The current study does not control/investigate any of the environmental parameters that can affect CO2 capture, like temperature, atmospheric pressure, humidity, and exposure to sunlight, which is being currently investigated. The performance of the studied salt must be compared to increasing the amount of slaked lime in paints, or paints made with graphene-infused and waste concrete powder. Both oxidative and thermal stability of the proposed paint needs to be established along with the longevity of sequestering carbon dioxide, especially in humid environments. Since L-lysine is an amino acid, its impact on the environment will be minimal. However, it can sustain fungal and microbial growth, which requires further investigation. Technically, the CO2-sorbent-water chemistry within the paint’s substrate and its reaction mechanism must be established. The current study is limited to water-based paints. If an oil-based solvent can be used reliably, the sodium lysinate can be extended to non-aqueous coatings like varnishes and acrylic products for passively capturing CO2 from the air.
6. Conclusions
The passive DAC capacity and the change in CO2 mass fraction with time in sodium lysinate solutions were studied for different exposure times to atmospheric carbon dioxide and amino acid salt concentrations. The experimental results show that sodium lysinate is a good option for passively capturing carbon dioxide from the air, with solutions capturing the highest value of 54 g of CO2 per kg of solution. Moreover, the said salt was mixed with three different commercial water-based emulsion paints in varying quantities. It showed that the addition of the salt enhances the DAC capacity of the paints by an average of 70% and also fixes and sequesters CO2 stably for the studied period of 45 days. The results also point out the possibility of capturing 40 g of CO2/L of paint. The results are promising with a potential to passively capture 28,000 tons of CO2 every year in the UK and indicate that carbon capture paints can play a vital role in meeting net-zero targets. Further research is in progress investigating the effect of environmental factors on carbon dioxide capture and determining the longevity of carbon dioxide storage in paint samples.
Author Contributions
Conceptualization, H.S.; Methodology, D.Q.; Formal analysis, G.N. and D.Q.; Investigation, G.N. and Z.S.; Writing—original draft, H.S.; Writing—review & editing, F.A., Q.N. and M.N.; Supervision, H.S. and F.A.; Project administration, H.S.; Funding acquisition, H.S. All authors have read and agreed to the published version of the manuscript.
Funding
H.S. is thankful for the funding support to the Royal Society Research Grants, Grant ID: RGS\R1\221293 for the amino acids-based study and results presented in this manuscript.
Data Availability Statement
Data are contained within the article.
Acknowledgments
The authors in the UK appreciate the funding and administrative support from the Net Zero Industry Innovation Centre, Teesside University, for providing the paint samples for this study.
Conflicts of Interest
The authors declare no conflict of interest.
References
- IPCC. Summary for Policymakers; IPCC: Geneva, Switzerland, 2023. [Google Scholar]
- Earth System Research Laboratories. Trends in Atmospheric Carbon Dioxide. Available online: https://gml.noaa.gov/ccgg/trends/ (accessed on 23 July 2023).
- Arias, P.A.; Bellouin, N.; Coppola, E.; Jones, R.G.; Krinner, G.; Marotzke, J.; Naik, V.; Palmer, M.D.; Plattner, G.-K.; Rogelj, J. Technical Summary. In Climate Change 2021—The Physical Science Basis: Working Group I Contribution to the Sixth Assessment Report of the Intergovernmental Panel on Climate Change; Intergovernmental Panel on Climate Change, Ed.; Cambridge University Press: Cambridge, UK, 2021; pp. 35–144. [Google Scholar] [CrossRef]
- Ozkan, M.; Nayak, S.P.; Ruiz, A.D.; Jiang, W. Current status and pillars of direct air capture technologies. iScience 2022, 25, 103990. [Google Scholar] [CrossRef] [PubMed]
- Asibor, J.O.; Clough, P.T.; Nabavi, S.A.; Manovic, V. Assessment of optimal conditions for the performance of greenhouse gas removal methods. J. Environ. Manag. 2021, 294, 113039. [Google Scholar] [CrossRef] [PubMed]
- Babin, A.; Vaneeckhaute, C.; Iliuta, M.C. Potential and challenges of bioenergy with carbon capture and storage as a carbon-negative energy source: A review. Biomass Bioenergy 2021, 146, 105968. [Google Scholar] [CrossRef]
- Snæbjörnsdóttir, S.Ó.; Sigfússon, B.; Marieni, C.; Goldberg, D.; Gislason, S.R.; Oelkers, E.H. Carbon dioxide storage through mineral carbonation. Nat. Rev. Earth Environ. 2020, 1, 90–102. [Google Scholar] [CrossRef]
- Suleman, H.; Fosbøl, P.L.; Nasir, R.; Ameen, M. Sustainable Carbon Capture: Technologies and Applications, 1st ed.; CRC Press: Boca Raton, FL, USA, 2022. [Google Scholar]
- IEA. Direct Air Capture. Available online: https://www.iea.org/energy-system/carbon-capture-utilisation-and-storage/direct-air-capture (accessed on 23 July 2023).
- Lebling, K.; McQueen, N.; Pisciotta, M.; Wilcox, J. Direct Air Capture: Resource Considerations and Costs for Carbon Removal; World Resources Institute: Washington, DC, USA, 2021; Volume 6. [Google Scholar]
- Chatterjee, S.; Huang, K.-W. Unrealistic energy and materials requirement for direct air capture in deep mitigation pathways. Nat. Commun. 2020, 11, 3287. [Google Scholar] [CrossRef]
- Ozkan, M.; Akhavi, A.-A.; Coley, W.C.; Shang, R.; Ma, Y. Progress in carbon dioxide capture materials for deep decarbonization. Chem 2022, 8, 141–173. [Google Scholar] [CrossRef]
- Niffenegger, J.; Aziz, M. A nature-inspired passive airflow system for carbon capture and sequestration. In Proceedings of the Nature-Inspired Engineering, Cetraro, Italy, 8–13 September 2019. [Google Scholar]
- Abanades, J.C.; Criado, Y.A.; Fernández, J.R. An air CO2 capture system based on the passive carbonation of large Ca(OH)2 structures. Sustain. Energy Fuels 2020, 4, 3409–3417. [Google Scholar] [CrossRef]
- Barzagli, F.; Peruzzini, M.; Zhang, R. Direct CO2 capture from air with aqueous and nonaqueous diamine solutions: A comparative investigation based on 13C NMR analysis. Carbon Capture Sci. Technol. 2022, 3, 100049. [Google Scholar] [CrossRef]
- Kikkawa, S.; Amamoto, K.; Fujiki, Y.; Hirayama, J.; Kato, G.; Miura, H.; Shishido, T.; Yamazoe, S. Direct Air Capture of CO2 Using a Liquid Amine–Solid Carbamic Acid Phase-Separation System Using Diamines Bearing an Aminocyclohexyl Group. ACS Environ. Au 2022, 2, 354–362. [Google Scholar] [CrossRef]
- Stamberga, D.; Thiele, N.A.; Custelcean, R. Synergistic direct air capture of CO2 with aqueous guanidine/amino acid solvents. MRS Adv. 2022, 7, 399–403. [Google Scholar] [CrossRef]
- Custelcean, R.; Williams, N.J.; Garrabrant, K.A.; Agullo, P.; Brethomé, F.M.; Martin, H.J.; Kidder, M.K. Direct Air Capture of CO2 with Aqueous Amino Acids and Solid Bis-iminoguanidines (BIGs). Ind. Eng. Chem. Res. 2019, 58, 23338–23346. [Google Scholar] [CrossRef]
- Hu, G.; Smith, K.H.; Wu, Y.; Mumford, K.A.; Kentish, S.E.; Stevens, G.W. Carbon dioxide capture by solvent absorption using amino acids: A review. Chin. J. Chem. Eng. 2018, 26, 2229–2237. [Google Scholar] [CrossRef]
- Aronu, U.E.; Ciftja, A.F.; Kim, I.; Hartono, A. Understanding Precipitation in Amino Acid Salt systems at Process Conditions. Energy Procedia 2013, 37, 233–240. [Google Scholar] [CrossRef]
- Ozols, J. Amino acid analysis. In Methods in Enzymology; Deutscher, M.P., Ed.; Academic Press: Cambridge, MA, USA, 1990; Volume 182, pp. 587–601. [Google Scholar]
- Suleman, H.; Maulud, A.S.; Syalsabila, A. Thermodynamic modelling of carbon dioxide solubility in aqueous amino acid salt solutions and their blends with alkanolamines. J. CO2 Util. 2018, 26, 336–349. [Google Scholar] [CrossRef]
- Hasegawa, K.; Tanabe, T.; Minami, K. Aqueous Stable Lysine Solution. U.S. Patent 632,954,8B1, 18 June 2001. [Google Scholar]
- Shen, S.; Yang, Y.-N.; Bian, Y.; Zhao, Y. Kinetics of CO2 Absorption into Aqueous Basic Amino Acid Salt: Potassium Salt of Lysine Solution. Environ. Sci. Technol. 2016, 50, 2054–2063. [Google Scholar] [CrossRef] [PubMed]
- Suleman, H.; Maulud, A.S.; Syalsabila, A.; Shahid, M.Z.; Fosbøl, P.L. High-pressure experimental and theoretical study of CO2 solubility in aqueous blends of lysine salts with piperazine as new absorbents. Fluid Phase Equilibria 2020, 507, 112429. [Google Scholar] [CrossRef]
- Chen, H.; Tsai, T.-C.; Tan, C.-S. CO2 capture using amino acid sodium salt mixed with alkanolamines. Int. J. Greenh. Gas Control 2018, 79, 127–133. [Google Scholar] [CrossRef]
- Valeh-e-Sheyda, P.; Sarlak, S.; Karimi, F. Promoted alkanolamine solutions with amino acid L-arginine for post-combustion CO2 capture in a micro-reactor. Process Saf. Environ. Prot. 2022, 165, 241–254. [Google Scholar] [CrossRef]
- Gao, Y.; Zhang, F.; Huang, K.; Ma, J.-W.; Wu, Y.-T.; Zhang, Z.-B. Absorption of CO2 in amino acid ionic liquid (AAIL) activated MDEA solutions. Int. J. Greenh. Gas Control 2013, 19, 379–386. [Google Scholar] [CrossRef]
- Syalsabila, A.; Maulud, A.S.; Nordin, N.A.H.M.; Suleman, H. VLE of carbon dioxide loaded aqueous potassium lysinate with separate blends of piperazine and 2-amino-2-methyl-1-propanol. AIP Conf. Proc. 2018, 2026, 020021. [Google Scholar] [CrossRef]
- Yeh, J.T.; Resnik, K.P.; Rygle, K.; Pennline, H.W. Semi-batch absorption and regeneration studies for CO2 capture by aqueous ammonia. Fuel Process. Technol. 2005, 86, 1533–1546. [Google Scholar] [CrossRef]
- Dulux Paints, Drying and Hardening of Water Based Paints. Available online: https://www.dulux.com.au/applicator/technical-advice/application/drying-and-hardening-of-water-based-paints/ (accessed on 24 December 2023).
- Navarro, C.; Ilić, T.; Ruiz-Agudo, E.; Elert, K. Carbonation mechanisms and kinetics of lime-based binders: An overview. Cem. Concr. Res. 2023, 173, 107301. [Google Scholar] [CrossRef]
- Gosselin, C. Carbon Capture Coatings. Available online: https://www.paint.org/coatingstech-magazine/articles/carbon-capture-coatings/ (accessed on 22 June 2023).
- The UK Coatings Industry—Industry Statistics. Available online: https://coatings.org.uk/page/IndustryStatistics (accessed on 23 July 2023).
Disclaimer/Publisher’s Note: The statements, opinions and data contained in all publications are solely those of the individual author(s) and contributor(s) and not of MDPI and/or the editor(s). MDPI and/or the editor(s) disclaim responsibility for any injury to people or property resulting from any ideas, methods, instructions or products referred to in the content. |
© 2024 by the authors. Licensee MDPI, Basel, Switzerland. This article is an open access article distributed under the terms and conditions of the Creative Commons Attribution (CC BY) license (https://creativecommons.org/licenses/by/4.0/).