Article

Experimental and Numerical Study of the Laminar Burning Velocity of Biogas–Ammonia–Air Premixed Flames

by
Pierre Brequigny
1,*,
Adnane Soulé
1,
Christine Mounaïm-Rousselle
1,
Guillaume Dayma
2 and
Fabien Halter
2
1
PRISME, University Orléans, INSA-CVL, F-45072 Orléans, France
2
CNRS-ICARE, University Orléans, F-45072 Orléans, France
*
Author to whom correspondence should be addressed.
Energies 2024, 17(2), 319; https://doi.org/10.3390/en17020319
Submission received: 27 October 2023 / Revised: 14 December 2023 / Accepted: 27 December 2023 / Published: 9 January 2024
(This article belongs to the Special Issue Advances in Biomass Conversion Technologies)

Abstract

:
Biogas is a gas resulting from the digestion of biomass, which means transforming organic waste into energy. It is composed essentially of methane (CH4) and carbon dioxide (CO2) and can also contain ammonia (NH3) as an impurity. Biogas is generally used to generate electricity or produce heat in a cogeneration system. With the renewed interest in ammonia and the increasing development of biogas caused by the urge for an energetic transition, those two carbon-neutral fuels are being investigated as a mixture in this study through the laminar burning velocity (LBV). In this paper, the LBV of biogas ammonia air mixtures are investigated experimentally for the first time over a wide range of equivalence ratios and ammonia concentrations. The biogas studied was 60% CH4 and 40% CO2 in volume. The NH3 concentration in the fuel varied from 0 to 50% vol. while the equivalence ratio varied from 0.8 to 1.2. The experiments were conducted at constant pressure in a constant volume vessel at 300 K and 1 bar. Adding ammonia to biogas decreases the LBV while the Markstein length is not very sensitive to ammonia addition. The CEU-NH3-Mech-1.1 and Okafor mechanisms show good agreement with the experimental laminar burning velocity. The effect of radiative heat losses on the measurement is also investigated.

1. Introduction

The need for alternative fuels is strongly dependent on pressures applied by society and government policies. Biomass continues to be the main renewable energy source in Europe and is considered to be one of the solutions to achieve the EU energy targets for 2030 [1]. Among biomass energy types, biogas is an alternative fuel easily produced from various feedstocks such as crop residues, organic wastes, sewage sludge or landfills [2,3,4]. Biogas is mainly composed of CH4 (50–70%vol.) and CO2 (30–50%) but can contain traces of N2, O2 and several impurities such as H2S or NH3. Ammonia can appear as an impurity when the feedstock used for anaerobic digestion is nitrogenous-rich such as manure or sewage sludge. Moreover, ammonia has recently gained a renewed interest as a potential zero-carbon fuel in internal combustion engines especially in spark-ignition (SI) ones. Indeed, despite his unfavorable combustion properties [5], stable operation was achieved with neat ammonia in SI engines with different architectures [6,7,8]. It could also be noticed that one of the first uses of ammonia in engines dates back to WWII in Belgium, where the bus fleet operated with the first dual-fuel engine ever reported: coal gas (syngas) composed of 50% H2 directly injected in the combustion chamber filled with ammonia [9]. In order to predict and improve the performance of practical combustion systems, key parameters of the combustion process must be determined beforehand. One important parameter is the laminar flame speed,  S L 0 , of the fuel air mixture, which indicates its usability under certain engine operating conditions or its propensity to flashback in burners. The knowledge of this parameter is even crucial for the CFD simulation of an engine or a gas turbine since the turbulent flame development in such devices is directly related to  S L 0 . Two ways could be used to compute this parameter under real conditions: either with a correlation proposed from the experimental database as a function of blends and conditions or with a kinetic mechanism previously validated against experimental  S L 0  values in order to model a practical combustion system. The Markstein length, Lb, is another measurable parameter that characterizes the flame response to stretch, influenced by thermal and mass diffusivities whose ratio is the Lewis number. This parameter is of importance for understanding the flame dynamics in practical combustion systems such as gas turbines or engines where turbulence affects the flame front development or propagation differently depending on the Lewis number and the Markstein length. Lb and  S L 0  can both be determined experimentally using the spherical expanding flame technique at constant pressure.
Data on the laminar flame speed of biogas are rather limited in the literature. Nonaka et al. [10] investigated the effect of the CO2 content on the laminar flame speed using the heat flux burner. They showed a decrease in the laminar flame speed when increasing the CO2 content from 0 to 50% in volume at 1 bar and 298 K, mainly due to a thermal (i.e., decrease in the adiabatic flame temperature). Similarly for pure CH4, the maximum flame speed is reached for an equivalence ratio about 1 to 1.1 no matter the composition of the biogas. Hinton and Stone [11] used the constant volume hypothesis to measure the laminar flame speed of biogas with up to 40% CO2 for a wide range of temperature and pressure conditions and proposed a correlation as a function of equivalence ratio, pressure, temperature, and CO2 content. More recently, Wei et al. investigated the possibility to increase the laminar flame speed of biogas by adding hydrogen to the blend [12].
Regarding ammonia, recent experimental studies have investigated  S L 0  and  L b  characteristics, notably Hayakawa et al. [13] from atmospheric to 5 bar of initial pressure and Kanoshima et al. [14], who extended the work to include the influence of initial temperature. The influence of temperature as well as hydrogen addition were also investigated by Lhuillier et al. [5]. Results from these works highlight that  S L 0  peaks at an equivalence ratio  ϕ  of ≈ 1.1, with an increase in pressure and temperature resulting in a decrease and increase in  S L 0 , respectively. Concerning  L b , NH3/air flames show an increasing  L b  trend with increasing  ϕ , similar to CH4/air and H2/air flames. It is worth noting that at normal temperature and pressure conditions (T = 298 K, P = 0.1 MPa), lean NH3 flames exhibit negative  L b , while positive values are observed at rich conditions. Those results were updated and analyzed in depth recently by Zitouni et al. [15] showing the importance of fundamental parameters such as the Lewis number, the expansion ratio, and the activation energy, i.e., the Zel’dovich number in the stretch response.
To the best of the author’s knowledge, there is currently no study investigating the fundamental combustion properties of blends of biogas and ammonia. Mong et al. [16] recently investigated the use of such a blend but in a swirled burner, showing that the use of biogas instead of neat methane in the methane/ammonia blend is expected to increase the turbulent intensity compared to the laminar flame speed. This phenomenon will intensify as ammonia content is increased in the blend especially for NH3 > 40%vol in the ammonia/biogas blend. Concerning laminar flame speeds, ammonia methane blends (but without CO2) were recently deeply investigated in the literature [15,17,18,19,20,21]. Those studies showed very similar results despite the use of different measurement techniques such as heat flux burner, constant volume, or constant pressure spherical expanding flames. Due to the very low reactivity of ammonia and its very low flame speed (about 6–8 cm/s at ambient conditions), blending it with methane results in a decrease in the flame speed of CH4. For instance, the flame speed of methane at ambient conditions peaks at 36–38 cm/s whereas it does not exceed 19–20 cm/s for 50/50 NH3/CH4 blends.
The objective of the present work is therefore to provide laminar flame speed and Markstein length of biogas/ammonia blends using the constant pressure spherical expanding flame methodology. For this purpose, a 60% CH4/40% CO2 blend, called biogas 60/40 was used to represent biogas and mixed with ammonia up to 50%vol. in the fuel blend. The equivalence ratio varied from 0.8 to 1.2. Results were compared with different kinetic mechanisms, and radiative effects were discussed.

2. Materials and Methods

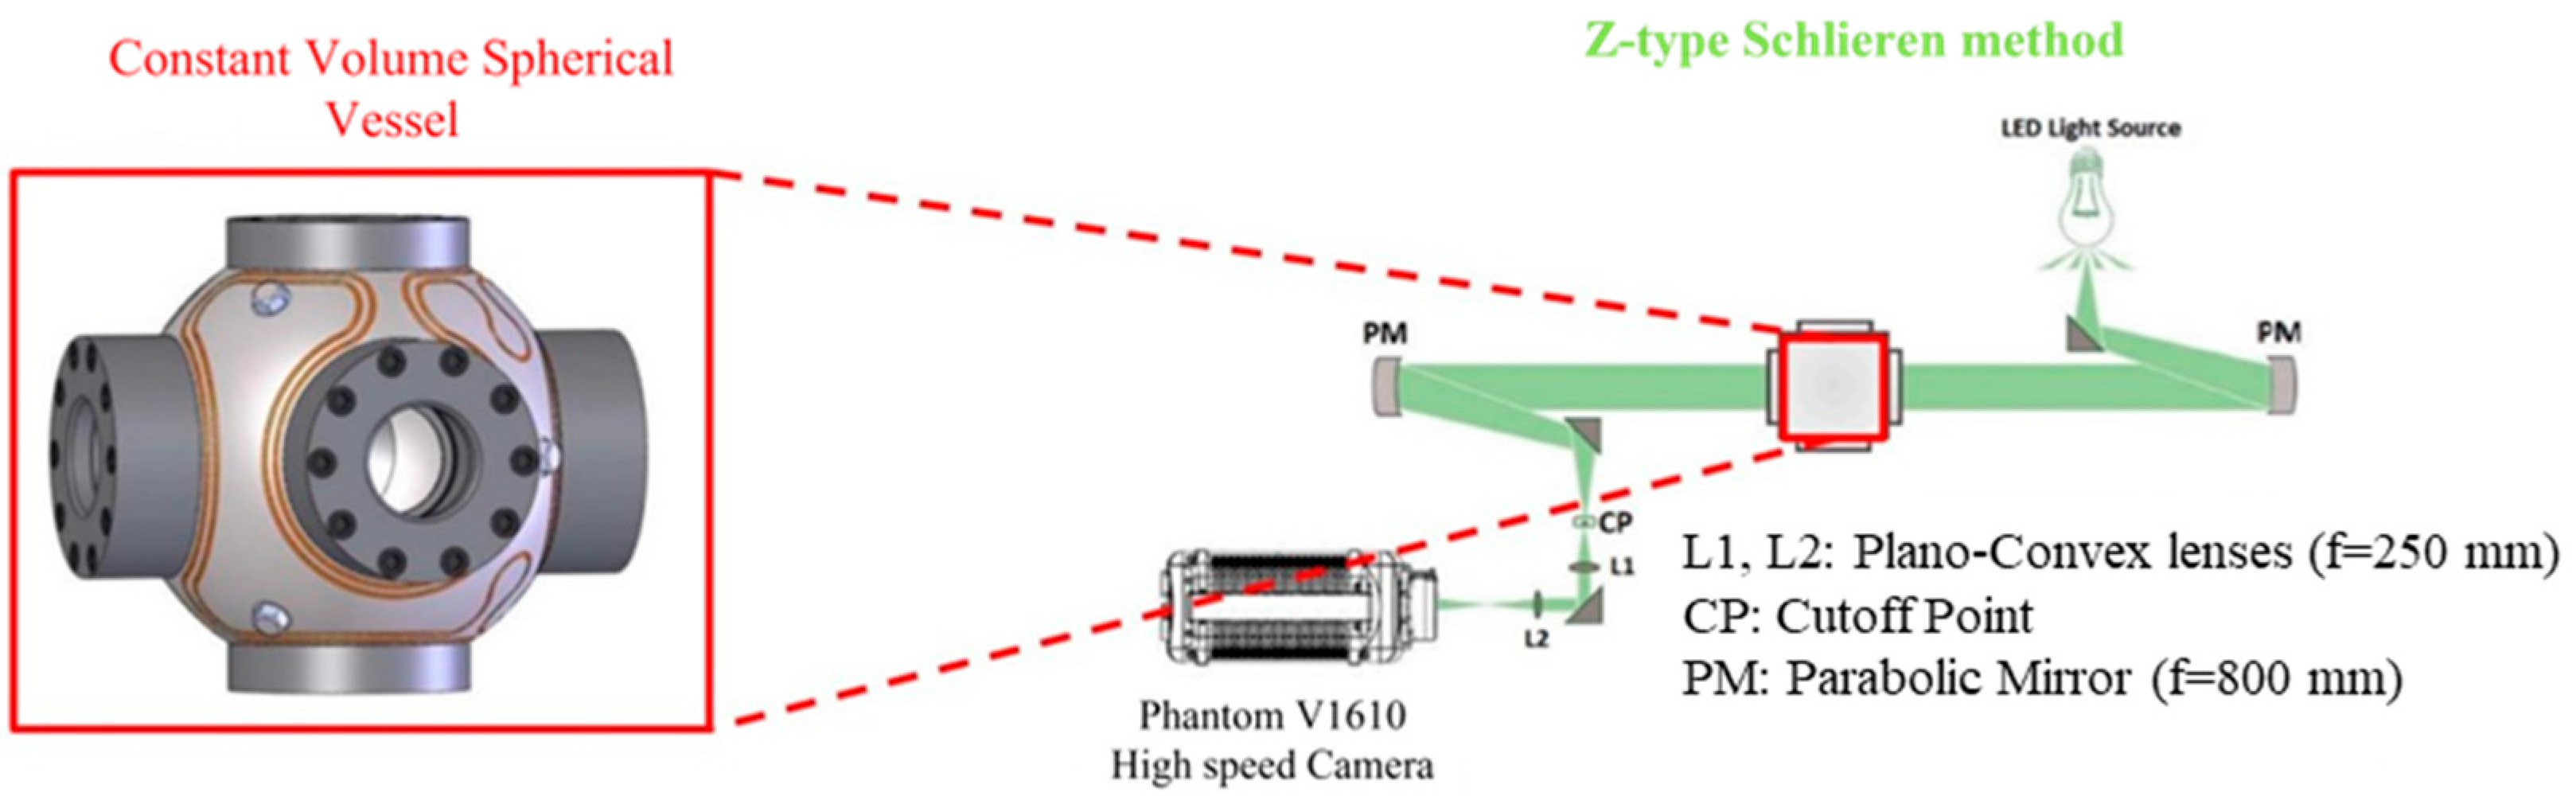
2.1. Laminar Flame Speed Measurment

The laminar flame speed setup used here consists of an optically accessible 4.2 L constant volume spherical vessel in which a series of flowmeters is used to simulate different mixture compositions. A high-speed Schlieren setup is used to obtain images of the propagating flame and determine the laminar burning velocity using the constant pressure methodology. This setup is described in depth in the following work [5]. A schematic view of the setup is displayed in Figure 1.
The vessel has four 70 mm diameter quartz windows. A vacuum pump is connected to the vessel to ensure that the pressure at the beginning of the filling process is below 10 mbar. Three gaseous flowmeters deliver the air/biogas/ammonia. The 60/40 biogas blend was prepared in the premixed bottle using a Coriolis mass flowmeter using the partial pressure method. The partial pressure was checked at the end of the introduction of each component to be equal to the desired quantity with less than a 3% deviation. To ensure homogeneity in the biogas bottle, a fan is switched on before the introduction into the spherical vessel and keeps running during the injection of the gas in the spherical vessel. Moreover, another fan rotates in the spherical vessel during the filling process guaranteeing homogeneity of the mixture and is stopped 20 s before the spark to avoid any turbulent motion during combustion. Several heating elements are placed along the intake line and on the vessel itself (as shown by the incrusted orange wires in Figure 1) and the temperature inside the vessel is controlled by k-type thermocouples. The ignition system consists of an automotive coil-on-plug device connected to two 0.5 mm thick electrodes with a 1.5 mm gap between them. Coil charge duration was set to have the minimum discharge energy allowing ignition and propagation. A high-speed Phantom V1610 camera from Vision Research/AMETEK is used for image acquisition, set at 7000 frames per second with a spatial resolution of 0.11 mm/pixel. The post-processing is performed in the MATLAB R2022b environment and consists of obtaining the flame contour and equivalent radius as a function of time. First, the background is subtracted, then images are binarized, and spatially filtered using a low-pass filter to reduce noise on the contour of the flame front. The radius corresponding to this contour is given by Equation (1).
R f = A π ,
where  A , is the flame area. The flame speed,  S b , and stretch,  K , profiles are then calculated as follows:
S b = d R f d t ;   K = 2 R f S b
The non-linear extrapolation method is used to provide the unstretched flame speed value,  S b 0 , and the Markstein length using Equation (1)
( S b S b 0   ) 2 ln ( S b S b 0   ) 2 = 2 L b K S b 0
Finally, the unstretched laminar burning velocity,  S L 0 , is given by  S L 0 = ρ b ρ u S b 0  with  ρ b  and  ρ u  respectively the burned and unburned densities calculated using the equilibrium routine of ANSYS CHEMKIN Pro.
The uncertainties presented are calculated based on the work of Moffat [22] and were detailed in previous works [5]. Overall uncertainty values are the combination of statistical, hardware-related (3.5% due to pressure and temperature) and imaging (2.5%) errors. Statistical errors are defined as  Δ S L 0 / S L 0 = t 95 %   · σ s t d / N  where  σ s t d  is the standard deviation and t95% is the value of the Student’s law for N = 3 tests in a 95% confidence interval. The uncertainties in the mixture composition are due to the accuracy of the mass flow meters (1% of the full scale), resulting in a maximum uncertainty of 3% in the target equivalence ratio. Measurements were made at 1 bar absolute initial pressure and the initial temperature was 300  ±   3   K. For the present study, a biogas with 40%vol. CO2 and 60%vol. CH4 was selected. The volume fraction of NH3 in the biogas/NH3 blend was varied as follows: 5, 10, 15, 25, and 50%vol.

2.2. Kinetics Simulation Setup

Numerical simulations were carried out using the premixed laminar flame-speed calculation module of ANSYS CHEMKIN-PRO 2020 R1 to estimate the laminar flame speed and assess the validity of several chemical kinetic mechanisms. The maximum number of grid points was set to 1000 with 50 adaptative grid points. GRAD and CURV parameters were set to 0.1 and 0.05 respectively. The length of the domain was set to 10 cm. Since ammonia presents very different diffusive properties compared to conventional fuels [15] the Soret effect was considered in order to account for those phenomena as in many studies dealing with ammonia [23], hydrogen [24], or multi-component fuel [25] similarly to the present work, and a mixture averaged transport model was used. Four mechanisms, displayed in Table 1, containing the required species, were first tested on pure biogas and CH4/NH3 blends to select the most suitable before validation on biogas/ammonia blends.

3. Results

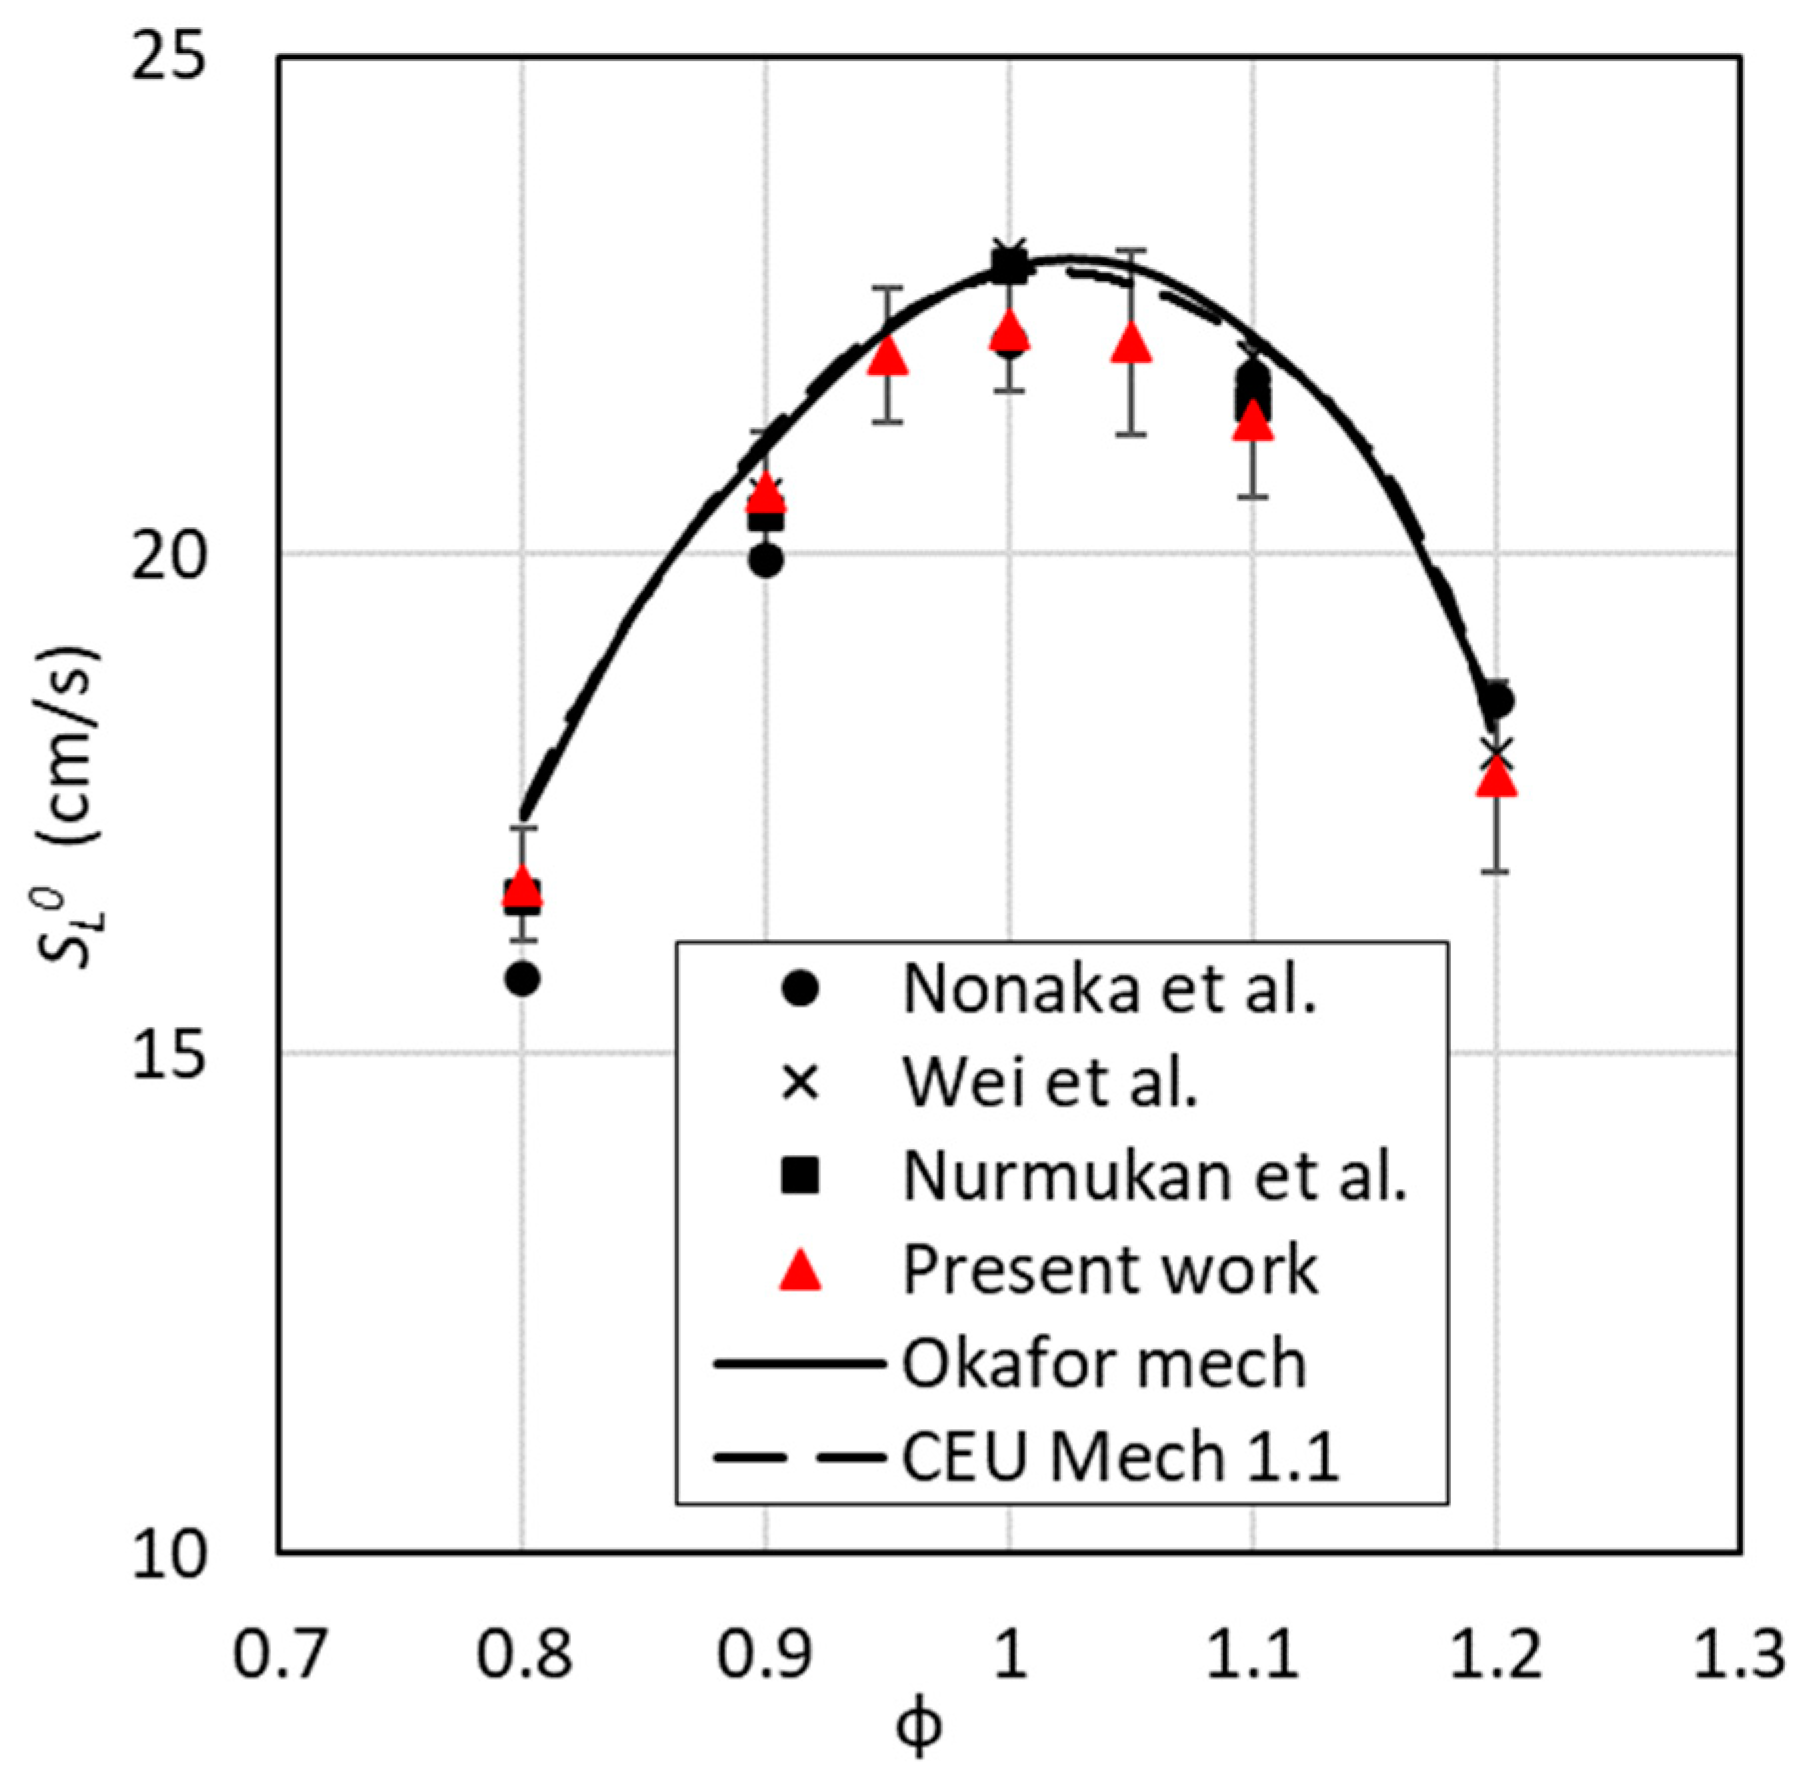
3.1. Mechanisms Validation

Simulation results were compared to the experimental data of Nonaka and Pereira [10], Wei et al. [12] and Nurmukan et al. [28] at ambient conditions in Figure 2. The bar graph shows overall good agreement between simulations and experiments with better performances for Okafor and CEU-NH3-Mech-1.1. The San Diego mechanism also performs well around stoichiometry but shows higher discrepancies with experiments on the lean and rich sides. The mechanisms were also compared to the dataset of Hinton and Stone [11] at higher pressures, namely 2 and 4 bar, with three different temperatures 298, 380 and 450 K leading to the same conclusions as with ambient conditions. At this stage, the Shrestha mechanism is no longer considered due to its higher discrepancies.
To assess the prediction of the mechanism with ammonia, simulations were compared with experimental data of various CH4/NH3 blends from Wang et al. [21] and Han et al. [20] at 1 atm and 298 K. This comparison is presented in Figure 3. The mechanisms show overall good agreement with the experiments in the literature. Yet the San Diego mechanism shows higher differences on the lean side with a low ammonia content. Results were akso compared at higher pressure with the experiments of Okafor et al. [19], Wang et al. [21], and Shu et al. [17]. An extensive comparison between the available literature data for ammonia/methane blends and the Okafor, San Diego and CEU-NH3-Mech-1.1 mechanisms is presented in Table 2, Table 3, and Table 4, respectively. As a result, only Okafor and CEU-NH3-Mech-1.1 were retained for the remainder of the study since they showed the best agreement with the experimental data in the literature.

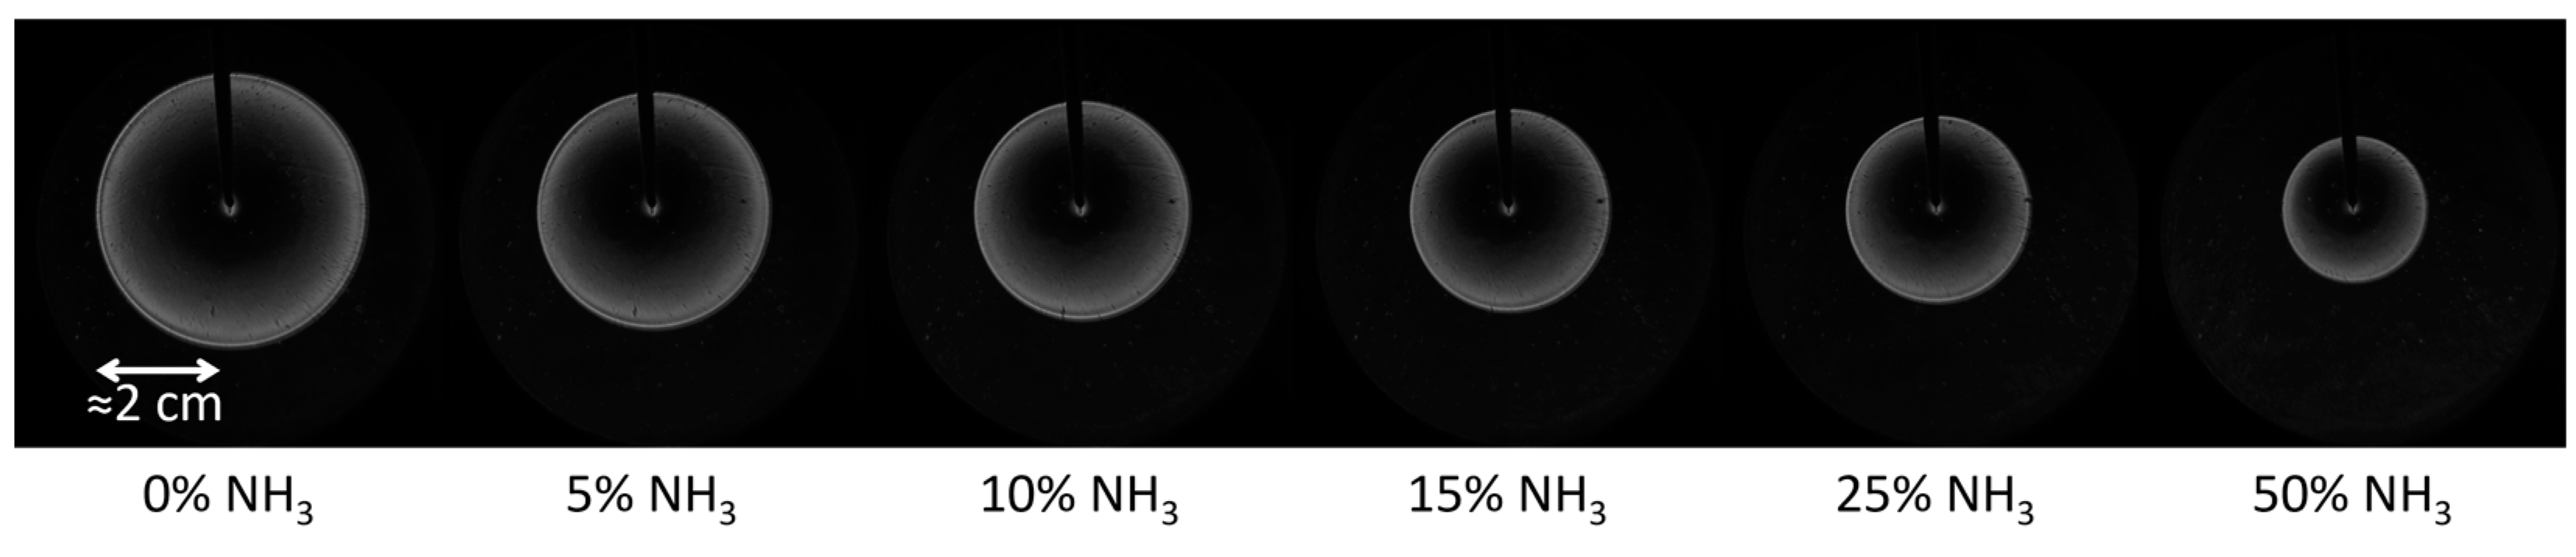
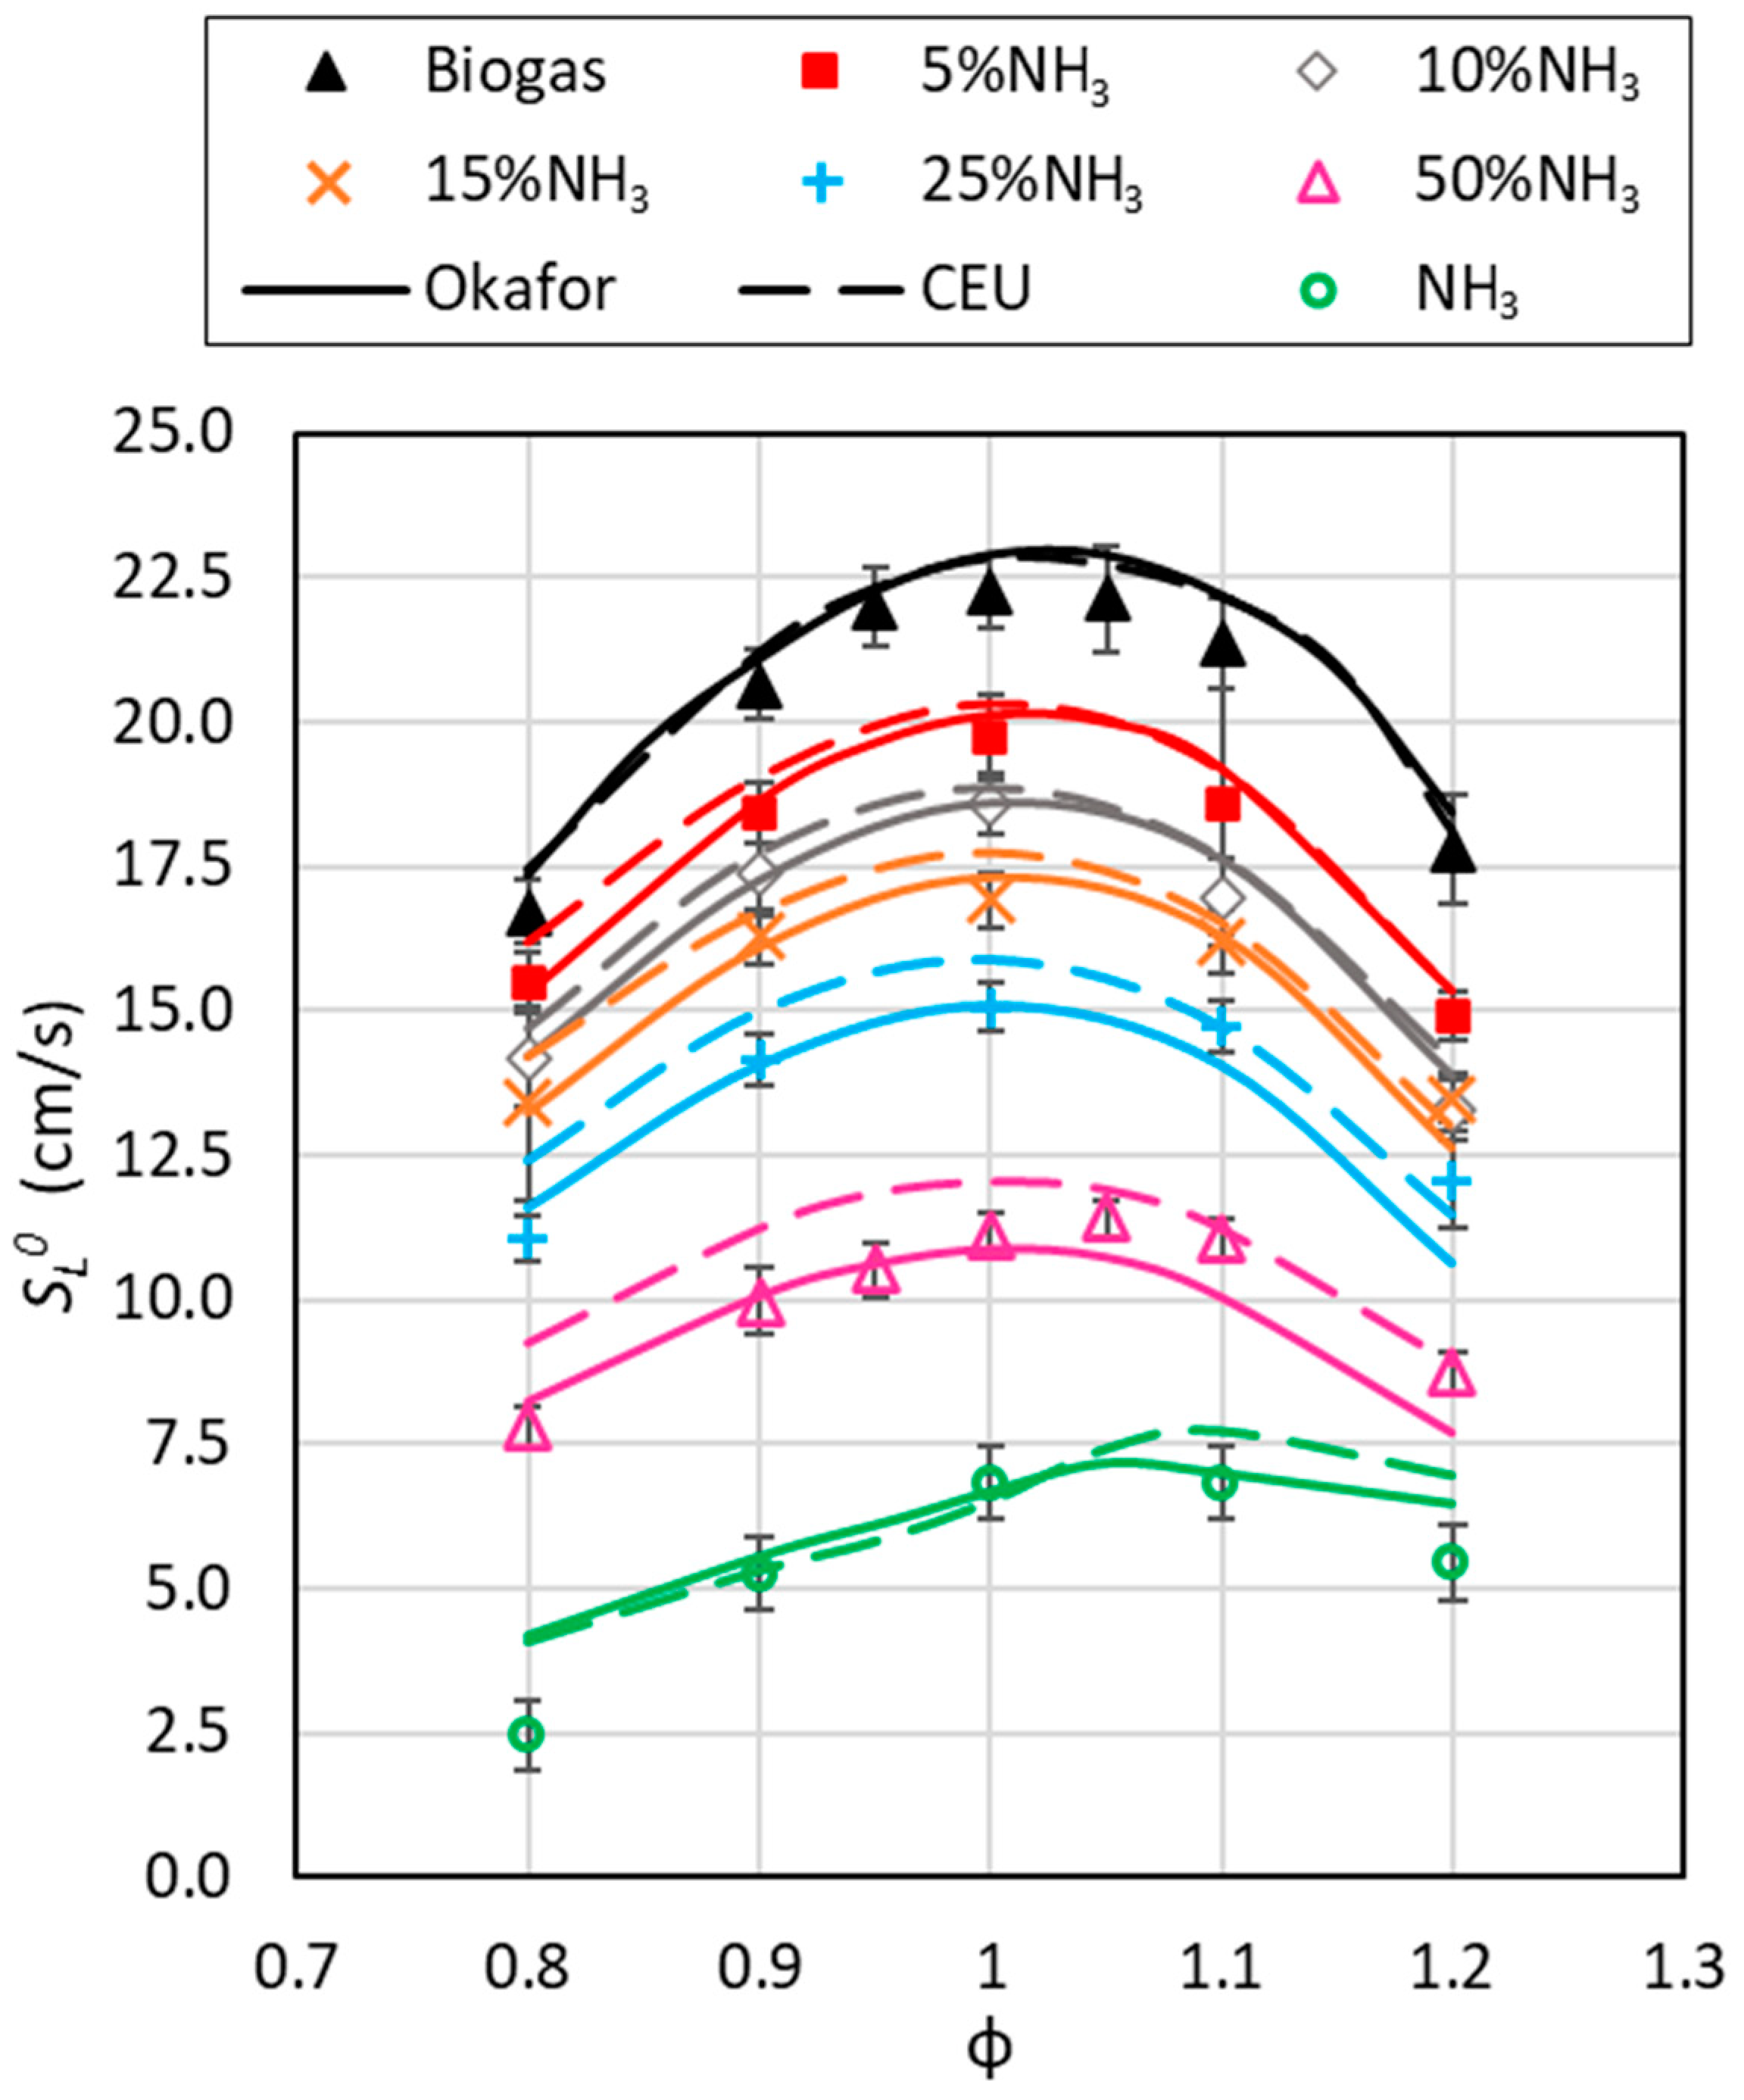
3.2. Experimental Laminar Burning Velocities

As per validation, Figure 4 shows the comparison of the laminar flame speeds  S L 0  of the present work with previous experiments of Nonaka and Pereira [10], Wei et al. [12] and Nurmukan et al. [28], as well as with the two selected mechanisms for biogas only. All the reported data, experimental or numerical, fall within the uncertainty of the present work.
Figure 5 shows examples of flame images at  ϕ  = 1.0 for various ammonia content 16 ms after ignition. It can be seen that for all NH3 contents the flame remains spherical and does not seem to be affected by any instability, such as buoyancy, which has been observed for a neat ammonia flame [14,15]. The decrease in the flame speed with the addition of NH3 is also visible since the flame diameter decreases at the same time when adding NH3 to the blend. Experiments were also conducted at 75% of NH3, but due to less contrast, local extinction, and the appearance of buoyancy instabilities, it was not possible to process the images, especially for rich flames as illustrated in Figure 6.
In Figure 7 S L 0  is plotted over the equivalence ratio for various biogas/ammonia blends with ammonia content ranging from 0 to 50%vol. in the fuel mixture. The pure ammonia results are taken from [15]. As expected, adding ammonia to the fuel mixture decreases the laminar flame speed towards the value of pure ammonia. The flame speed shows a non-linear decrease with the first important step only with a 5% ammonia addition. Results present higher uncertainties on the rich side, at  ϕ = 1.2 ,  with the 10% NH3 blend showing a lower value than the 15% one which is due to the experimental uncertainty. This higher uncertainty is mainly due to a higher standard deviation on the flame speed value. This can be caused by two reasons: a higher stretch sensitivity that makes the laminar flame speed extrapolation more difficult to fit, and/or some instabilities that can occur, as shown in Figure 6, thus shortening the radius range for the flame speed extrapolation and increasing the standard deviation on the unstretched flame speed. On top of that, the 5% blend condition  ϕ = 1.2  seems low, whereas for the 25% blend, it seems, at the same equivalence ratio, slightly too high. Globally, the two selected mechanisms capture the experimental results well, with the Okafor mechanism performing better than CEU-NH3-Mech-1.1 on the lean side and vice versa on the rich side.

3.3. Markstein Lengths

The Markstein lengths, obtained by the non-linear extrapolation model (Equation (3)), are displayed as a function of the equivalence ratio for all the studied blends in Figure 8. The Markstein lengths of pure ammonia extracted from [15] are presented for comparison. Globally, in terms of stretch sensitivity, the biogas/ammonia blends behave similarly to pure biogas. Yet, it can be noted that adding NH3 to the blend leads to a Markstein length increase especially on the rich side. The upper (and lower) error bars for neat ammonia taken from Zitouni et al. [15] represent the difference between the maximum (and minimum, respectively) values determined against the average Markstein length. For biogas and blends with NH3, no error bar is plotted for the sake of clarity, but the standard deviation over three consecutive tests is generally around 5% and never exceeds 15% which is obtained for the leanest case, where the measurement is the most difficult. In conclusion, it can be said that up to 50% of NH3, the flame response to the flame stretch of the biogas/NH3 blend is very similar to that of the biogas flame, at least for near-stoichiometric mixture thus probably not affecting that much the operation of a biogas system with NH3 addition. A relationship between the Markstein length and other fundamental parameters such as Lewis and Zel’dovich based on spherically expanding flames was derived by Chen [29] from analytical development as follows:
L b = [ 1 L e ( Z e 2 ) ( 1 L e 1 ) ] . ρ b ρ u δ k  
where  L e  is the Lewis number, defined as the thermal diffusivity to the mass diffusivity, Ze, the Zel’dovich number, and  δ k  the kinetic flame thickness defined as  δ k = λ / ( ρ u . c p . S L 0 )  where  λ  represents the thermal conductivity and  c p  the specific heat at constant pressure. This relationship was further used by Bouvet et al. [30], Lapalme et al. [25] and Zitouni et al. [31]. Adding ammonia to biogas will affect each of these parameters: it will increase the flame thickness (along with a decrease in the flame speed), and the Zel’dovich number will also increase, as the activation energy is much higher for neat ammonia [15]. Last, the diffusion properties of biogas/air could be modified by the addition of ammonia. Vieira et al. [32] showed that first CO2 dilution does not affect the methane/air Lewis number on the lean side and decreases it moderately on the rich side. In addition, Zitouni et al. [15] showed that adding ammonia to methane does not affect the Lewis number of the blend: it slightly decreases for lean and stoichiometric mixtures, and does not change it for rich mixtures. Consequently, the moderate change in the Markstein length observed when mixing ammonia and biogas (up to 50%vol. NH3), seems to be related to flame thickness and Zel’dovich changes rather than to a modification of the diffusive properties of the blend through the Lewis number.

3.4. Radiative Heat Losses

Regarding the radiative heat losses, it is well known that CO2 and NH3 can be important contributors. In order to assess this impact, the optically thin model (OTM) implemented in ANSYS CHEMKIN-PRO was used. In ANSYS CHEMKIN-PRO, the radiative heat loss from a mixture of gases is given by the optically thin model through:
Q r a d ˙ = 4 σ [ ( T 4 T a m b 4 ) i P ( X i a i ) ]
where  σ  is the Stefan-Boltzmann constant, T is the gas temperature,  T a m b  is the ambient temperature, P is the gas pressure,  X i  the mole fraction of species  i , and  a i  is the Planck mean absorption coefficient. The Planck absorption coefficients are directly taken from the thermodynamic data file of the CEU-NH3-Mech-1.1 provided by Wang et al. [21]. It should be noted that this type of radiation model does not account for the reabsorption of heat loss in the burnt gases by the fresh gases thus usually overestimating radiative effects [33]. In the present case, where CO2 is both present in the burned and fresh gases, this could be of importance. Therefore, the results obtained from the OTM are compared with the correlation of Yu et al. [34], which is based on the statistical narrow band model (SNB), calculated as follows:
S L 0 r a d i a t i v e S L 0 a d i a b a t i c = 1 0.82 ( S L 0 a d i a b a t i c S 0 ) 1.14 ,
where  S 0 = 1   cm / s . This correlation should therefore consider reabsorption, but it was only validated on H2/CO blends, CH4, C3H8 and C8H18 and does not work for diluted mixtures with a high content of CO2 (important reabsorption) thus probably leading to an overestimation of the radiative effect as highlighted by Yu et al. [34]. Indeed, Yu et al. showed that for a 6% dilution with CO2 of a stoichiometric CH4/air (which corresponds to the 60/40 biogas composition), the radiation-induced error on the flame speed stays below 2% at ambient conditions. Since the radiation effect is the most critical at low speeds, results are presented for the leanest/richest case in Figure 9a and b respectively. Based on previous comparisons, Okafor/CEU-NH3-Mech-1.1 mechanisms were used for the lean/rich cases respectively. Globally, results show that considering radiation either with the OTM or with the Yu et al. correlation leads to a decrease in the flame speed compared to the adiabatic case. Globally, the simulated flame speeds accounting for radiation agree better with the experimental results, but it should be highlighted that both simulations (adiabatic and radiative) and the correlation fall within the uncertainty bars of the experimental data. Higher discrepancies are visible on the rich side, as already seen in Figure 7, mainly because of higher uncertainties on the quantity of ammonia. Moreover, as explained by Chen et al. [33], the OTM usually overestimates the heat losses caused by radiation since it does not consider reabsorption. The correlation of Yu et al. behaves similarly for CO2 diluted mixtures: it overestimates the decrease of the flame speed according to its authors [34]. As a result, it is possible that experimentally, the reabsorption by the fresh gases compensates for the heat losses in burnt gases resulting in evolutions almost similar to an adiabatic case. Plotting both the adiabatic and the OTM cases already shows the boundaries of possible flame speed values and the maximum difference between them. As a result, the present flame speed measurements for the biogas/NH3/air mixture seem to be not that much affected by radiation, at least for blends with less than 25% vol. of NH3. For 50%vol. of NH3, the relative difference between adiabatic and radiation-affected case is about 5 and 8% for the rich and lean cases respectively.

4. Conclusions

In this study, first data for laminar flame speeds and Markstein lengths of biogas/ammonia blends are presented (to the best of the authors knowledge). For biogas only, results are in good agreement with the literature and kinetic mechanisms. Adding ammonia to the blend decreases the laminar flame speed due to the low reactivity of NH3. In terms of Markstein lengths, the blends present a similar stretch sensitivity as pure biogas. Yet an increase in the Markstein length is noticeable on the rich side with the ammonia addition. The measurements were limited to blends below 50%vol. of NH3 due to the occurrence of local quasi-extinction and buoyancy instabilities. Okafor et al. and CEU-NH3-Mech-1.1 kinetics mechanism show good agreement with the experimental data with, respectively, about 5 and 7% differences on average with all experimental data. A first attempt to assess the uncertainty related to radiative heat losses was conducted, showing a very limited impact on the results, at least for biogas/NH3 with less than 50% vol. of NH3.

Supplementary Materials

The following supporting information can be downloaded at: https://www.mdpi.com/article/10.3390/en17020319/s1, Table S1: experimental database for laminar burning velocities and Markstein lengths.

Author Contributions

Conceptualization, P.B. and A.S.; methodology, P.B.; validation, P.B., C.M.-R., F.H. and G.D.; formal analysis, P.B. and A.S.; investigation, P.B. and A.S.; data curation, P.B. and A.S.; writing—original draft preparation, P.B.; writing—review and editing, P.B., C.M.-R., F.H. and G.D.; supervision, P.B., C.M.-R., F.H. and G.D.; funding acquisition, P.B. All authors have read and agreed to the published version of the manuscript.

Funding

The research leading to these results has received funding from the CNRS through PEPS Energie 2022 program: project MASYNBIOZ. The authors also thank CNRS/FITe (FR2039): Fédération pour l’Innovation et la Transition énergétique for its financial support.

Data Availability Statement

The original contributions presented in the study are included in the article/Supplementary Material, further inquiries can be directed to the corresponding author.

Acknowledgments

The authors are grateful to their students Gauthier Brienne and Alexandre Guillemot, for their technical support during the experimental campaign.

Conflicts of Interest

The authors declare no conflict of interest. The funders had no role in the design of the study; in the collection, analyses, or interpretation of data; in the writing of the manuscript; or in the decision to publish the results.

References

  1. Scarlat, N.; Dallemand, J.; Taylor, N.; Banja, M. Brief on Biomass for Energy in the European Union; Publications Office of the European Union: Luxembourg, 2019; pp. 1–8. [Google Scholar]
  2. Calbry-Muzyka, A.; Madi, H.; Rüsch-Pfund, F.; Gandiglio, M.; Biollaz, S. Biogas Composition from Agricultural Sources and Organic Fraction of Municipal Solid Waste. Renew. Energy 2022, 181, 1000–1007. [Google Scholar] [CrossRef]
  3. Wagner, A.O.; Hohlbrugger, P.; Lins, P.; Illmer, P. Effects of Different Nitrogen Sources on the Biogas Production—A Lab-Scale Investigation. Microbiol. Res. 2012, 167, 630–636. [Google Scholar] [CrossRef] [PubMed]
  4. Feiz, R.; Johansson, M.; Lindkvist, E.; Moestedt, J.; Påledal, S.N.; Svensson, N. Key Performance Indicators for Biogas Production—Methodological Insights on the Life-Cycle Analysis of Biogas Production from Source-Separated Food Waste. Energy 2020, 200, 117462. [Google Scholar] [CrossRef]
  5. Lhuillier, C.; Brequigny, P.; Lamoureux, N.; Contino, F.; Mounaïm-Rousselle, C. Experimental Investigation on Laminar Burning Velocities of Ammonia/Hydrogen/Air Mixtures at Elevated Temperatures. Fuel 2020, 263, 116653. [Google Scholar] [CrossRef]
  6. Grannell, S.M.; Assanis, D.N.; Bohac, S.V.; Gillespie, D.E. The Fuel Mix Limits and Efficiency of a Stoichiometric, Ammonia, and Gasoline Dual Fueled Spark Ignition Engine. J. Eng. Gas Turbines Power 2008, 130, 042802. [Google Scholar] [CrossRef]
  7. Mørch, C.S.; Bjerre, A.; Gøttrup, M.P.; Sorenson, S.C.; Schramm, J. Ammonia/Hydrogen Mixtures in an SI-Engine: Engine Performance and Analysis of a Proposed Fuel System. Fuel 2011, 90, 854–864. [Google Scholar] [CrossRef]
  8. Westlye, F.R.; Ivarsson, A.; Schramm, J. Experimental Investigation of Nitrogen Based Emissions from an Ammonia Fueled SI-Engine. Fuel 2013, 111, 239–247. [Google Scholar] [CrossRef]
  9. Koch, E. Ammonia as a Fuel for Motor Buses. J. Inst. Pet. 1949, 31, 21–32. [Google Scholar]
  10. Nonaka, H.O.B.; Pereira, F.M. Experimental and Numerical Study of CO2 Content Effects on the Laminar Burning Velocity of Biogas. Fuel 2016, 182, 382–390. [Google Scholar] [CrossRef]
  11. Hinton, N.; Stone, R. Laminar Burning Velocity Measurements of Methane and Carbon Dioxide Mixtures (Biogas) over Wide Ranging Temperatures and Pressures. Fuel 2014, 116, 743–750. [Google Scholar] [CrossRef]
  12. Wei, Z.; Zhen, H.; Fu, J.; Leung, C.; Cheung, C.; Huang, Z. Experimental and Numerical Study on the Laminar Burning Velocity of Hydrogen Enriched Biogas Mixture. Int. J. Hydrogen Energy 2019, 44, 22240–22249. [Google Scholar] [CrossRef]
  13. Hayakawa, A.; Goto, T.; Mimoto, R.; Arakawa, Y.; Kudo, T.; Kobayashi, H. Laminar Burning Velocity and Markstein Length of Ammonia/Air Premixed Flames at Various Pressures. Fuel 2015, 159, 98–106. [Google Scholar] [CrossRef]
  14. Kanoshima, R.; Hayakawa, A.; Kudo, T.; Okafor, E.C.; Colson, S.; Ichikawa, A.; Kudo, T.; Kobayashi, H. Effects of Initial Mixture Temperature and Pressure on Laminar Burning Velocity and Markstein Length of Ammonia/Air Premixed Laminar Flames. Fuel 2022, 310, 122149. [Google Scholar] [CrossRef]
  15. Zitouni, S.-E.; Brequigny, P.; Mounaїm-Rousselle, C. Influence of Hydrogen and Methane Addition in Laminar Ammonia Premixed Flame on Burning Velocity, Lewis Number and Markstein Length. Combust. Flame 2023, 253, 112786. [Google Scholar] [CrossRef]
  16. Mong, G.R.; Chiong, M.-C.; Chong, C.T.; Ng, J.-H.; Mashruk, S.; Tran, M.-V.; Lee, K.M.; Samiran, N.A.; Wong, K.Y.; Valera-Medina, A. Fuel-Lean Ammonia/Biogas Combustion Characteristics under the Reacting Swirl Flow Conditions. Fuel 2023, 331, 125983. [Google Scholar] [CrossRef]
  17. Shu, T.; Xue, Y.; Zhou, Z.; Ren, Z. An Experimental Study of Laminar Ammonia/Methane/Air Premixed Flames Using Expanding Spherical Flames. Fuel 2021, 290, 120003. [Google Scholar] [CrossRef]
  18. Okafor, E.C.; Naito, Y.; Colson, S.; Ichikawa, A.; Kudo, T.; Hayakawa, A.; Kobayashi, H. Experimental and Numerical Study of the Laminar Burning Velocity of CH4–NH3–Air Premixed Flames. Combust. Flame 2018, 187, 185–198. [Google Scholar] [CrossRef]
  19. Okafor, E.C.; Naito, Y.; Colson, S.; Ichikawa, A.; Kudo, T.; Hayakawa, A.; Kobayashi, H. Measurement and Modelling of the Laminar Burning Velocity of Methane-Ammonia-Air Flames at High Pressures Using a Reduced Reaction Mechanism. Combust. Flame 2019, 204, 162–175. [Google Scholar] [CrossRef]
  20. Han, X.; Wang, Z.; Costa, M.; Sun, Z.; He, Y.; Cen, K. Experimental and Kinetic Modeling Study of Laminar Burning Velocities of NH3/Air, NH3/H2/Air, NH3/CO/Air and NH3/CH4/Air Premixed Flames. Combust. Flame 2019, 206, 214–226. [Google Scholar] [CrossRef]
  21. Wang, S.; Wang, Z.; Chen, C.; Elbaz, A.M.; Sun, Z.; Roberts, W.L. Applying Heat Flux Method to Laminar Burning Velocity Measurements of NH3/CH4/Air at Elevated Pressures and Kinetic Modeling Study. Combust. Flame 2022, 236, 111788. [Google Scholar] [CrossRef]
  22. Moffat, R.J. Describing the Uncertainties in Experimental Results. Exp. Therm. Fluid Sci. 1988, 1, 3–17. [Google Scholar] [CrossRef]
  23. Chi, C.; Han, W.; Thévenin, D. Effects of Molecular Diffusion Modeling on Turbulent Premixed NH3/H2/Air Flames. Proc. Combust. Inst. 2022, 17, 1–10. [Google Scholar] [CrossRef]
  24. Ben Zenou, J.; Vicquelin, R. Acceleration of Premixed H2-Air-Steam Flames When Accounting for Thermal Radiation. Combust. Flame 2023, 258, 113068. [Google Scholar] [CrossRef]
  25. Lapalme, D.; Halter, F.; Mounaïm-Rousselle, C.; Seers, P. Characterization of Thermodiffusive and Hydrodynamic Mechanisms on the Cellular Instability of Syngas Fuel Blended with CH4 or CO2. Combust. Flame 2018, 193, 481–490. [Google Scholar] [CrossRef]
  26. Shrestha, K.P.; Seidel, L.; Zeuch, T.; Mauss, F. Detailed Kinetic Mechanism for the Oxidation of Ammonia Including the Formation and Reduction of Nitrogen Oxides. Energy Fuels 2018, 32, 10202–10217. [Google Scholar] [CrossRef]
  27. University of California at San Diego Chemical-Kinetic Mechanisms for Combustion Applications”, San Diego Mechanism Web Page. Available online: http://web.eng.ucsd.edu/mae/groups/combustion/mechanism.html (accessed on 27 November 2023).
  28. Nurmukan, D.; Chen, T.J.M.; Hung, Y.M.; Ismadi, M.Z.; Chong, C.T.; Tran, M.V. Enhancement of Biogas/Air Combustion by Hydrogen Addition at Elevated Temperatures. Int. J. Energy Res. 2020, 44, 1519–1534. [Google Scholar] [CrossRef]
  29. Chen, Z. On the Extraction of Laminar Flame Speed and Markstein Length from Outwardly Propagating Spherical Flames. Combust. Flame 2011, 158, 291–300. [Google Scholar] [CrossRef]
  30. Bouvet, N.; Halter, F.; Chauveau, C.; Yoon, Y. On the Effective Lewis Number Formulations for Lean Hydrogen/Hydrocarbon/Air Mixtures. Int. J. Hydrogen Energy 2013, 38, 5949–5960. [Google Scholar] [CrossRef]
  31. Zitouni, S.; Pugh, D.; Crayford, A.; Bowen, P.J.; Runyon, J. Lewis Number Effects on Lean Premixed Combustion Characteristics of Multi-Component Fuel Blends. Combust. Flame 2022, 238, 111932. [Google Scholar] [CrossRef]
  32. Vieira, M.C.d.J.; Figueira da Silva, L.F. Flame Flashback Critical Damköhler Number for CO2 Diluted CH4 and C3H8 Mixtures with Air. Flow, Turbul. Combust. 2023, 110, 377–393. [Google Scholar] [CrossRef]
  33. Chen, Z.; Qin, X.; Xu, B.; Ju, Y.; Liu, F. Studies of Radiation Absorption on Flame Speed and Flammability Limit of CO2 Diluted Methane Flames at Elevated Pressures. Proc. Combust. Inst. 2007, 31, 2693–2700. [Google Scholar] [CrossRef]
  34. Yu, H.; Han, W.; Santner, J.; Gou, X.; Sohn, C.H.; Ju, Y.; Chen, Z. Radiation-Induced Uncertainty in Laminar Flame Speed Measured from Propagating Spherical Flames. Combust. Flame 2014, 161, 2815–2824. [Google Scholar] [CrossRef]
Figure 1. Schematic view of the setup.
Energies 17 00319 g001
Figure 2. The relative difference between simulations and averaged experimental laminar burning velocities for biogas 60/40 at 1 bar and 300  ±  3 K [10,12,28].
Energies 17 00319 g002
Figure 3. Laminar burning velocities of CH4/NH3 blends. Comparison of mechanisms with data from Han et al. [20] and Wang et al. [21] at 1 bar and 300 ± 3 K. Black, grey and white symbols respectively represent the 80%CH4/20%NH3, 60%CH4/40%NH3 and the 40%CH4/60%NH3 blends.
Energies 17 00319 g003
Figure 4. Comparison of biogas/air laminar flame speeds results at 1 bar and 300 ± 3 K with previous experimental data of Nonaka and Pereira [10], Wei et al. [12] and Nurmukan et al. [28] and the selected mechanisms.
Energies 17 00319 g004
Figure 5. Examples of biogas/NH3/air flame images at  ϕ  = 1, P = 1 bar, and T = 300 ± 3 K, 16 ms after the spark.
Energies 17 00319 g005
Figure 6. Example of biogas/NH3/air flame images for 75% of NH3, at  ϕ  = 1.1, P = 1 bar, and T = 300 ± 3 K, 16 ms (left) and 44 ms (right) after the spark, showing first an extinction and then strong buoyancy effect. The exposure time was increased compared to Figure 5 for better visualization.
Energies 17 00319 g006
Figure 7. Experimental and numerical laminar flame speed vs. equivalence ratio for various biogas/NH3 blends. P = 1 bar; T = 300 ± 3 K. Pure ammonia data were taken from [15]. All data are available in the Table S1 of the Supplementary Material.
Energies 17 00319 g007
Figure 8. Experimental Markstein lengths vs. equivalence ratio for various biogas/NH3 blends. P = 1 bar; T = 300 ± 3 K. Pure ammonia data taken from [15]. All data are available in the Table S1 of the Supplementary Material.
Energies 17 00319 g008
Figure 9. Laminar flame speed vs. NH3 amount calculated with and without radiation using OTM and Yu et al. correlation [34] compared with experimental data at 1 bar; 300 K (a ϕ  = 0.8; (b ϕ  = 1.2.
Energies 17 00319 g009
Table 1. Selected chemical kinetic mechanisms.
MechanismTypeNumber of SpeciesNumber of Reactions
Okafor [18] (2018)Reduced42130
Shrestha [26] (2018)Detailed1251090
CEU-NH3-Mech-1.1 [21] (2022)Detailed91444
San Diego [27]Reduced69311
Table 2. Relative differences between experimental laminar burning velocities available in the literature and the Okafor mechanism for the CH4/NH3 blend. The values are colored with a gradient from green (low differences) to red (high differences).
φ1 atm 298 K [21]1 atm 298 K [22]3 atm 298 K [22]5 atm 298 K [22]1 atm 298 K [18]5 atm 298 K [18]3 bar 298 K [20]5 bar 298 K [20]MinMaxAvg.
%NH3%NH3%NH3%NH3%NH3%NH3%NH3%NH3
204060204060204060204060105090105090223952223952
0.70.0%1.0%0.9%7.1% 10.3%15.3% 15.3%24.4% 19.1%21.5% 0.0%24.4%11.5%
0.81.6%2.5%4.2%5.2%7.0%12.5%6.9%11.4%10.9%8.2%13.6%14.1%4.8%9.3% 9.8%23.0%11.2%6.0%7.8%7.6%1.9%4.3%7.3%1.6%23.0%8.3%
0.91.9%3.6%5.4%4.4%5.3%9.7%5.6%8.4%8.1%7.0%7.5%5.4%5.3%6.4% 17.0%1.3%0.5%2.3%3.9%1.4%5.4%0.5%17.0%5.5%
11.4%3.5%5.4%3.6%3.5%5.7%5.2%8.2%9.8%5.8%7.3%4.9%3.0%0.1%13.4%3.0%0.9%13.7%0.1%0.8%0.6%3.9%2.0%1.9%0.1%13.7%4.5%
1.10.5%3.1%3.6%2.3%1.1%1.1%3.3%8.0%9.6%0.4%3.5%1.4%1.1%3.3%0.8% 7.8%0.6%2.5%1.6%2.8%2.2%2.3%0.4%9.6%2.9%
1.20.3%3.0%3.2%1.0%0.5%2.2%9.3%15.0%9.0%3.9%4.0%7.7%3.0%5.8%14.1%5.7%3.0%0.8%6.6%7.7%3.4%8.6%4.9%2.0%0.3%15.0%5.2%
1.35.6%0.1%4.4%0.7%0.4%6.7%11.8%6.7%5.1%0.6%10.0%35.8%9.7%5.3%38.6% 2.9%8.1%0.6%1.9%2.1%6.3%10.8%0.1%38.6%7.9%
Table 3. Relative differences between experimental laminar burning velocities available in the literature and the San Diego mechanism for the CH4/NH3 blend. The values are colored with a gradient from green (low differences) to red (high differences).
φ1 atm 298 K [21]1 atm 298 K [22]3 atm 298 K [22]5 atm 298 K [22]1 atm 298 K [18]5 atm 298 K [18]3 bar 298 K [20]5 bar 298 K [20]MinMaxAvg.
%NH3%NH3%NH3%NH3%NH3%NH3%NH3%NH3
204060204060204060204060105090105090223952223952
0.715.9%13.4% 7.7% 3.6%4.3% 0.6%13.9% 35.6%34.1% 0.6%35.6%14.3%
0.812.2%10.5% 8.1%5.5% 3.3%2.4%7.5%1.0%5.5%10.0%17.1%19.9%2.9%18.3%32.1%3.0%17.8%19.0%15.0%12.4%14.3%14.7%1.0%32.1%11.5%
0.97.0%6.1%1.5%4.3%4.3%5.9%0.8%2.9%5.9%3.7%2.9%3.0%12.5%15.1%3.4% 10.0%6.8%6.7%6.7%0.6%3.1%9.3%0.6%15.1%5.6%
14.9%2.0%4.0%2.5%2.0%4.3%5.9%7.7%9.0%10.3%8.3%4.1%5.9%4.1%1.1%10.6%0.8%13.3%1.1%0.2%1.3%8.0%3.2%2.7%0.2%13.3%4.9%
1.11.8%0.3%1.8%0.0%2.5%0.8%10.5%9.5%4.7%11.0%4.4%10.9%2.2%0.2%4.7% 7.3%4.5%0.6%12.2%3.6%1.5%0.0%12.2%4.5%
1.23.5%1.5%5.0%4.7%1.1%10.8%17.4%11.9%4.8%12.3%1.4%26.2%8.7%2.0%28.6%20.8%15.2%20.9%13.1%5.1%7.2%15.3%0.4%10.7%0.4%28.6%10.3%
1.30.1%5.7%20.6%5.8%5.2%23.3%12.7%2.2%26.5%0.3%21.2%64.0%19.5%4.8%62.7% 7.5%9.1%18.5%1.1%16.4%30.1%0.1%64.0%17.0%
Table 4. Relative differences between experimental laminar burning velocities available in the literature and the CEU-NH3-Mech-1.1 mechanism for the CH4/NH3 blend. The values are colored with a gradient from green (low differences) to red (high differences).
φ1 atm 298 K [21]1 atm 298 K [22]3 atm 298 K [22]5 atm 298 K [22]1 atm 298 K [18]5 atm 298 K [18]3 bar 298 K [20]5 bar 298 K [20]Min MaxAvg.
%NH3%NH3%NH3%NH3%NH3%NH3%NH3%NH3
204060204060204060204060105090105090223952223952
0.74.3%6.9%9.2%3.1% 1.9%5.5% 2.8%14.8% 22.1%33.0% 1.9%33.0%10.3%
0.82.5%5.7%7.6%1.3%0.9%1.6%0.4%2.1%1.5%1.3%4.1%7.3%8.0%19.1% 19.7%35.3%4.0%14.5%18.9%19.5%13.0%15.8%17.7%0.4%35.3%9.7%
0.91.5%3.0%5.2%1.1%1.2%0.4%0.5%0.2%1.0%0.7%0.6%1.4%8.1%16.2% 10.3%8.1%10.0%12.6%2.9%7.1%14.3%0.2%16.2%5.1%
11.0%2.1%4.4%1.3%2.1%4.1%2.3%1.8%1.4%1.9%1.3%1.7%4.8%7.6%18.4%1.5%8.1%10.0%3.5%5.9%9.5%0.4%4.3%10.0%0.4%18.4%4.6%
1.11.3%1.9%7.3%0.5%4.1%10.1%0.4%0.1%2.9%2.0%4.7%12.7%0.2%4.5%11.1% 18.4%2.9%4.6%10.3%0.2%4.9%7.6%0.1%18.4%5.1%
1.23.6%5.9%13.8%2.3%8.7%20.1%2.8%2.7%6.3%1.9%7.0%21.4%0.7%7.8%28.6%3.3%15.9%7.1%0.6%5.4%11.7%2.4%6.0%10.4%0.6%28.6%8.2%
1.315.7%15.4%18.1%8.9%14.9%20.8%3.9%2.4%14.4%4.5%15.3%44.0%3.9%8.2%50.4% 8.3%1.0%8.4%11.1%1.9%11.5%17.1%1.0%50.4%13.6%
Disclaimer/Publisher’s Note: The statements, opinions and data contained in all publications are solely those of the individual author(s) and contributor(s) and not of MDPI and/or the editor(s). MDPI and/or the editor(s) disclaim responsibility for any injury to people or property resulting from any ideas, methods, instructions or products referred to in the content.

