Article

Economic and Ecological Impacts on the Integration of Biomass-Based SNG and FT Diesel in the Austrian Energy System

Institute of Chemical, Environmental and Bioscience Engineering, TU Wien, Getreidemarkt 9/166, 1060 Vienna, Austria
*
Author to whom correspondence should be addressed.
Energies 2023, 16(16), 6097; https://doi.org/10.3390/en16166097
Submission received: 4 July 2023 / Revised: 7 August 2023 / Accepted: 14 August 2023 / Published: 21 August 2023
(This article belongs to the Special Issue Advances in Biomass Conversion Technologies)

Abstract

:
The production of sustainable, biomass-based synthetic natural gas (SNG) and Fischer–Tropsch (FT) diesel can contribute significantly to climate neutrality. This work aims to determine the commercial-scale production costs and CO2 footprint of biomass-based SNG and FT diesel to find suitable integration scenarios for both products in the Austrian energy system. Based on the simulation results, either 65 MW SNG and 14.2 MW district heat, or 36.6 MW FT diesel, 17.6 MW FT naphtha, and 22.8 MW district heat can be produced from 100 MW biomass. The production costs with taxes for wood-based SNG are 70–91 EUR /MWh and for FT diesel they are 1.31–1.89 EUR /L, depending on whether pre-crisis or crisis times are considered, which are in the range of fossil market prices. The CO2 footprint of both products is 90% lower than that of their fossil counterparts. Finally, suitable integration scenarios for SNG and FT diesel in the Austrian energy system were determined. For SNG, use within the energy sector for covering electricity peak loads or use in the industry sector for providing high-temperature heat were identified as the most promising scenarios. In the case of FT diesel, its use in the heavy-duty traffic sector seems most suitable.

1. Introduction

The increasingly visible climate change around the world requires sustainable solutions. The European Green Deal [1] aims to set the path to Europe’s climate neutrality by 2050. Currently, only approximately 20% of Europe’s gross final energy consumption is covered by renewable energy sources (RES). In Austria, even more ambitious targets are being set for climate neutrality by 2040. Considering the RES share of 36.5% based on Austria’s gross final energy consumption, sustainable solutions in the whole energy system must be found quickly. The most considerable proportion of greenhouse gas emissions are caused by generating electricity, heat, cold, and fuels using fossil feedstocks like natural gas, coal, and mineral oil [2].
In addition to already proven renewable technologies, such as solar PV, wind power, hydropower, and heat pumps using environmental heat, bioenergy can contribute significantly to achieving climate neutrality. The most significant advantage of bioenergy is that there is great potential, especially in Austria, to produce the required energy sources, such as electricity, heat, and fuels, with domestic raw materials. The use of lignocellulosic biomass in the heat and power sector has already been proven for decades. Furthermore, oil crops have been used to produce biodiesel for many years. Sugar and starch crops are used within fermentation plants to produce bioethanol. Additionally, sugar and starch crops can be fed together with biodegradable municipal solid waste to anaerobic digestion plants to generate heat, power, and biomethane. Gasification technologies play a crucial role in expanding the range of bioenergy products [3]. At TU Wien, dual fluidized bed (DFB) gasification technology has been investigated for decades. It has been proven that this technology is suitable for use with a wide range of raw materials. Almost all lignocellulosic biomass and significant parts of biogenic residues can be converted to high-quality product gas, mainly consisting of hydrogen, carbon monoxide, carbon dioxide, and methane. After purification of the produced gas, it can be converted into high-value products such as hydrogen, synthetic fuels, synthetic natural gas, or platform chemicals in addition to electricity and heat production in a gas engine or gas turbine [4].
In 2002, the first demo plant based on DFB gasification technology for the production of heat and power based on woody biomass went into operation in Güssing (AT), with a thermal fuel power of 8 MWth. In the following 15 years, more than 100,000 h of operation were achieved. This successful demonstration resulted in the construction of further commercial plants on a scale of 3.8 to 15.5 MWth in Oberwart (AT), Villach (AT), Senden (DE), Nongbua (TH), and Wajima (JP) in the last two decades. Many plants have been forced to shut down recently due to high production costs for heat and electricity using high-quality wood chips. As a result, research work in recent years has been focusing on using lower-grade feedstocks [5] and producing higher-grade synthesis products such as synthetic natural gas (SNG) [6] or Fischer–Tropsch (FT) diesel. In 2009, the world’s first fluidized bed methanation pilot plant, with a SNG power of 1 MWSNG, was integrated into the existing DFB plant in Güssing. The largest DFB plant to date, with a scale of 33 MWth, was commissioned in Gothenburg (SE) in the frame of the GoBiGas project in 2013 [7]. In the GoBiGas project, the product gas was used to produce 20 MW SNG in a fixed-bed methanation synthesis process. In 2022, a DFB plant using lower-grade feedstocks with a scale of 1 MWth was commissioned in Vienna (AT) at a waste processing location. Additionally, the product gas in Vienna can be converted in a FT slurry reactor to FT products [8,9,10]. Due to the large number of DFB facilities, nearly 200,000 industrial operating hours could be collected, demonstrating the DFB gasification process. Therefore, the DFB gasification process itself has already reached the commercial scale. The DFB demo plant in Vienna helps to test and investigate the use of lower-grade feedstocks in an industrial operational environment, thereby increasing the technological readiness level. From a scientific and technical point of view, fixed-bed methanation has been successfully demonstrated in Gothenburg. However, the Gothenburg plant was forced to shut down for economic reasons. Alternatively, fluidized bed methanation can be used for SNG production with the advantage that, instead of a multi-stage fixed bed methanation, only a single-stage fluidized bed methanation unit is required for the production of the desired raw-SNG. To commercialize fluidized bed SNG and FT diesel production based on product gas from DFB gasification, a further demo plant in an operational environment, covering the process from biomass supply until product use, is required to check the findings of the pilot plants in long-term test runs [11].
Based on a study from TU Wien [11], the Austrian Government decided to fund the establishment of a 5 MWth demonstration plant for the biomass-based production of SNG and FT diesel. With the help of this demo plant, the remaining knowledge gaps in terms of long-term behavior should be closed. The findings should be used to promote the commercialization of DFB technology in connection with SNG and FT diesel production in Austria. Numerous researchers have investigated the technical feasibility of the primary process units of the assessed process routes. The technical feasibility of the DFB gasification process with different feedstocks, bed materials, and gasification temperatures has been investigated intensively at the pilot scale [4,5,12]. Additionally, it was demonstrated at the pilot scale that DFB gasification, coupled with oxyfuel combustion, can capture an almost pure CO2 stream in the flue gas in addition to a high-quality product gas [13,14,15]. Furthermore, intensive development work has already been carried out concerning the layout and design of DFB plants [16]. Moreover, the large-scale demonstration of DFB plants [7] and studies on their implementation in existing industries [17] have been executed. Furthermore, the necessary gas cleaning steps following the gasification process have been successfully demonstrated [18,19]. The experimental validation and demonstration of the methanation unit [6,20,21,22] and FT synthesis [23,24,25,26,27] have also been conducted.
Summing up, the technical feasibility of the production of biomass-based SNG and FT diesel has been proven. After the first operation phase with the 5 MWth demo plant, the remaining knowledge gaps can be clarified, and commercialization can start. Assessments for similar process routes regarding the production costs [28,29] and the CO2 footprint [29,30] have been conducted and presented in the literature. However, neither a techno-economic nor an environmental analysis have been performed yet based on, from the current view, optimized commercial-scale concepts with the goal of reaching the status of drop-in fuels according to the Austrian gas grid feed-in guidelines [31] and synthetic fuel standards [32]. This analysis is urgently needed to determine a suitable integration strategy for the two products in the Austrian energy system. Furthermore, the investigation of energy system integration scenarios allows us to study socio-economic impacts such as sectoral competitiveness.
For this reason, this paper investigates commercial-scale concepts for producing wood-based SNG and FT diesel at a thermal fuel power of 100 MW for integration in the Austrian energy system. In detail, the paper discusses the following sections:
  • Potential analysis of biogenic feedstock suitable for DFB gasification in Austria;
  • Modelling of commercial scale concepts for the production of biomass-based SNG and FT diesel;
  • Techno-economic and ecological assessment of both routes;
  • Development of integration scenarios for biomass-based SNG and FT diesel in the Austrian energy system.
Based on the developed commercial scale concepts, the mass and energy balances of both process routes are calculated. The simulation results are the basis for determining the production costs and CO2 footprints. To consider the economic impact of the crises arising from the Ukrainian war and COVID-19 on the Austrian energy market, the techno-economic analyses are based on the reference years 2019 (pre-crisis level) and 2022 (crisis level). With the help of the production costs, the CO2 footprint, and the Austrian biomass potential, the substitution possibilities, the influence on the sectoral greenhouse gas emissions, and the sectoral gross value added can be calculated. Finally, suitable integration scenarios can be proposed for using biomass-based SNG and FT diesel in the Austrian energy system. Concluding, based on existing literature, the paper provides a novel comprehensive techno-economic and ecological assessment of the commercial-scale production of biomass-based SNG and FT diesel with the aim of reaching the status of drop-in fuels according to the Austrian gas grid feed-in guidelines and synthetic fuel standards. Thus, the techno-economic and ecological impact on various Austrian energy sectors can be calculated by substituting fossil natural gas and diesel with biomass-based SNG and FT diesel.

2. Materials and Methods

In the following section, all applied methods are discussed. The biomass potential analysis builds the basis for defossilization capacities in the Austrian energy system. Furthermore, commercial scale concepts are presented to provide information approximately assumptions within the process simulation. Additionally, the methodologies for the techno-economic and ecological assessment are explained. Finally, scenarios for integrating biomass-based SNG and FT diesel into the Austrian energy system are discussed.

2.1. Potential Analysis of Biogenic Feedstock

For the discussion of the integration possibilities of DFB plants into the Austrian energy system, it is necessary to determine the biomass potential for such plants in Austria. The evaluation of the biomass potential until 2050 is based on studies from the Austrian biomass association [33], the feasibility study “Reallabor” [11], and studies from Dißauer et al. [34] and Hammerschmid et al. [35]. A fluidized bed gasifier is able to process various raw and residual materials since fluidized beds have proven to be robust and fuel-flexible for the thermo-chemical conversion of various feedstocks [4,5,11]. The following defined biomass potentials refer to the year 2050 and can be understood as reduced technical potentials [35,36]. The reduced technical potential in 2050 can be seen as the additional amount of biomass made available by political and social changes and efforts without endangering sustainable agriculture and forestry. Table 1 lists the technical biomass potential from different literature studies. The value for woody biomass ranges between 50–126 PJ/a, including forest biomass, bark, and sawmill by-products. Thus, a reduced technical potential of 75 PJ/a is assumed in this study. A range of 100–200 PJ/a can be determined for the technical biomass potential of agricultural raw materials and residues, which comprise short-rotation wood, straw, beet leaves, corncobs, grapevine pruning, and miscanthus within this study. The available values of the mentioned studies are partly based on very ambitious expansion targets for short-rotation wood and miscanthus. Furthermore, ambitious targets for the energetic utilization of straw were adopted. To ensure sustainable agriculture, a lower reduced technical potential of 80 PJ/a is assumed for the present study. Furthermore, the technical biomass potential of other biogenic residues and waste are investigated, including waste wood, sewage sludge, manure, and biogenic rejects from several industries. The mentioned studies list an additional technical biomass potential of 10–67 PJ/a, which corresponds to a reduced technical biomass potential of 30 PJ/a.
In total, an additional reduced technical biomass potential of 185 PJ/a is defined within this potential analysis based on literature values. Additionally, the potential analysis in [11] showed that a plant size of 100 MWth builds up a good compromise between low specific investment costs due to economy of scale and sustainable biomass procurement. At this point, it must be mentioned again that, in any case, attention must be paid to sustainable agricultural and forestry management.

2.2. Commercial Scale SNG and FT Production Concepts

The underlying commercial-scale process concepts of the FT diesel and SNG routes are presented as a basis for the techno-economic and ecological assessment and scenarios for technology roll-out. The conceptual design of the biomass-based FT diesel and SNG route described in this chapter is based on experience through the operation of laboratory, pilot, and demonstration plants. Furthermore, commercial DFB plants were scientifically monitored. The scalability of all the investigated individual process units has already been demonstrated in other applications, at least on a demonstration scale.
Figure 1 depicts the proposed process routes for producing SNG and FT products from woody biomass on a 100 MWth scale. The process flowsheet is divided into four main sections: resource supply, gasification, gas cooling, cleaning, and synthesis, and gas upgrading. Both process routes only differ in the synthesis and gas upgrading steps, depending on the desired product. Otherwise, the same process layout can be utilized, which reduces the engineering efforts for both routes. Note that the process routes are meant as standalone SNG or FT production routes and are only displayed together to save space and showcase their similarity. Furthermore, only the main process units are shown in the simplified process flow diagram (PFD). Heat displacement and regeneration steps are omitted for better legibility. Process simulation of this flow sheet was performed with the process simulation software IPSEpro 8.0. The process simulation is based on wood chips as the fuel. The assumed biomass composition can be found in the Supplementary Materials. Furthermore, no variations were considered with regard to fuel. However, experiments have shown that the main components of the resulting product gas hardly change, but the impurities vary strongly due to the fuel variation [5]. Consequently, more impurities in the product gas would require a more extensive product gas cleaning section. Moreover, research is still needed for the large-scale use of low-grade fuels such as sewage sludge in DFB gasification. Therefore, the developed plant concept only applies to woody biomass. A detailed list of the assumptions and process parameters used for the simulation is shown in the Supplementary Materials.
The resource supply section consists of the on-site fuel handling and storage, as well as a dryer to reduce the moisture content of the fuel to an optimal and constant level for gasification, which is approximately 20%. In this study, the considered fuel is woody biomass (cf. Section 2.1).
The heat required for drying is supplied internally through heat displacement. The gasification section at approximately 820 °C is based on the advanced DFB steam gasification technology, utilizing a mixture of olivine and limestone as a bed material (80/20 wt.%) in contrast to the classical, industrially proven DFB steam gasification. The product gas, which mainly consists of H2, CO, CO2, CH4, and H2O, leaves the gasification reactor and is cooled to 180 °C in heat exchangers (PG cooler). In the coarse gas cleaning section, dust is removed in a baghouse filter (PG filter) and tars are separated in a biodiesel scrubber at 40 °C based on the solvent rapeseed methyl ester (RME). Additionally, water vapor condenses in the biodiesel scrubber and enables the separation of water-soluble substances from the product gas, like ammonia (NH3). The tar-rich RME and the condensed water are directed into a phase separator (solvent regen). Here, the liquid separates into a clear RME phase, an emulsion phase, and a water phase. The clear RME phase is recirculated to the scrubber, while the water phase is evaporated, superheated, and reused as a gasification agent in the gasification reactor. In this way, the freshwater consumption of the DFB system is reduced. The emulsion phase consists of a mixture of RME, absorbed tars, and water, and is utilized as additional fuel in the combustion reactor. Downstream of the biodiesel scrubber, part of the product gas is recirculated to the combustion reactor to provide the necessary heat for gasification. This way, there is no need for an external fuel supply to the combustion reactor during the process. In the fine gas cleaning section, all remaining impurities that harm the catalysts during the synthesis processes and are unwanted in the final product are removed. Activated carbon filters (AC filters) remove light aromatic compounds such as benzene, toluene, or naphthalene, as well as sulfur compounds such as hydrogen sulfide (H2S). The activated carbon filters are operated through temperature swing adsorption (TSA), and the regeneration is carried out with steam at 250 °C [38]. The contaminated steam is disposed of in the post-combustion chamber. At this point, the requirements of the FT and SNG processes, and, therefore, the process chains, start to differ.
For the SNG route, the product gas is compressed to 10 bar in a two-stage intercooled compressor and preheated to 250 °C. ZnO acts as a protection layer against sulfur breakthrough. The conversion of syngas to raw-SNG takes place in a cooled fluidized bed methanation reactor at 320 °C in the presence of a nickel catalyst. A thermodynamic equilibrium model is used for this stage. After heat recovery, a condenser separates water from the raw SNG, and the gas enters an amine scrubber for CO2 removal. The condensed water is fully reused within the process, e.g., for steam regeneration of the activated carbon or for steam addition upstream of the methanation reactor. In the last step, the gas is dried in a glycol scrubber and transferred to the natural gas grid following the specifications of the Austrian gas grid (ÖVGW G B210 [31]).
The product gas is compressed in three stages to 21 bar for the FT route. After the second compression step, CO2 is removed in an amine scrubber at 10 bar, and recycled tail gas from the steam reformer is added to the product gas stream. Similar to the SNG route, the syngas is preheated, passes a ZnO guard bed and enters a FT slurry reactor at 230 °C. For the simulation of the FT reactor, the extended Anderson–Schulz–Flory distribution from Förtsch et al. [39], with modeling parameters according to Pratschner et al. [40], and a single-pass CO conversion of 50% are assumed. Liquid FT products are withdrawn from the slurry reactor and pumped into a hydrocracker. The hydrocracker converts long-chain FT products with hydrogen on a platinum catalyst to shorter molecules and thus increases the output of the desired diesel fraction. A consecutive distillation separates the product from the hydrocracker into different molecular weight fractions. Gaseous molecules (C1–C3) are directed to the steam reformer, and C4–C9 molecules are sold as a naphtha fraction to a refinery. Long-chain waxes (C20+) are recycled to the hydrocracker and converted to low-boiling hydrocarbons (C1–C19). The properties of the desired diesel fraction (C10–C19) are further adjusted in a hydrotreater, allowing the production of drop-in diesel fuel with similar properties to its fossil counterpart, according to DIN EN 15940 [32]. The gaseous phase leaving the FT slurry reactor consists of molecules with different chain-lengths and unconverted syngas. Thus, a quench column condenses C10+ hydrocarbons pumped to the fractional distillation. A further condensation step separates a naphtha fraction from the remaining gas. C1–C3 molecules and unconverted syngas are brought to a steam reformer to reclaim CO and H2. The necessary heat for the steam reformer is provided through the combustion of a partial flow (15%) of the gas itself. The reformed tail gas is then reintroduced to the process upstream of the FT slurry reactor for further conversion.
Furthermore, CO2 and district heat are generated as side products from these processes. Additionally, for the FT route, a naphtha fraction can be sold to the refinery. CO2 is a main component in the product gas and is separated in amine scrubbers with an assumed purity of 95%. After upgrading, the CO2 is sold and creates additional revenues. District heat is a result of the thermal nature of the involved processes. Heat sources and sinks are matched in this study so that no external heat supply is required. Nevertheless, heat at temperature levels above 100 °C remains, which can be utilized as district heat and create additional revenues. The processes also generate water at various steps along the process chains (e.g., RME scrubber, condensation steps, etc.), which is assumed to be internally reused for steam production (e.g., gasification agent, regeneration of activated carbon, etc.). Because of the water and hydrogen content of the biomass, typically more water is produced than consumed. Therefore, wastewater disposal costs are included for the effluent streams. However, a potentially necessary water upgrading for the internally recycled water is neglected. For the DFB gasification process itself, the internal use of steam as a gasification agent from the condensed water phase from the RME scrubber, with pre-evaporation to remove unwanted impurities via the post-combustion chamber, is industrially proven.

2.3. Techno-Economic and Ecological Assessment

The techno-economic and ecological assessment is performed based on the process simulation of the biomass-based SNG and FT diesel route. The techno-economic investigation follows the net present value method, which analyzes a pending investment by discounting future payments and revenues to the present. The levelized costs of products (LCOP) in terms of synthetic natural gas and FT diesel are calculated according to Equation (1). Thus, the LCOP are influenced by the total capital investment costs of the plant (I0), the annual expenditures (E), the annual revenues of secondary products (Rsec. prod.), and the annual quantity of the produced main product (Mt,main prod.). The discounting of the revenues, expenditures, and the annual quantity of the produced main product is considered using the cumulative discount factor (CDF) according to Equation (2), which is a function of the interest rate (i) and the plant lifetime (n) [41,42,43,44]. The total capital investment costs of the biomass-based SNG and FT diesel route with a 100 MWth thermal fuel power scale are based on the visualized methodology in Figure 2. For the techno-economic assessment, the process route is divided into two sections. The first plant section, from the biomass feeding system until the primary product gas cleaning, has been built already several times worldwide at a commercial scale with a plant size from 8–32 MWth [11]. According to the order of magnitude method [11,45], the inflation-adjusted total capital investment costs of the plants in Güssing, Oberwart, and Senden are used to determine the total capital investment costs of an average DFB plant with a thermal fuel power of 15 MWth. The final total capital investment costs for a 100 MWth scale for the first plant section are calculated using the cost-scaling method [11] according to Equation (3). The total capital investment costs of the second plant section are calculated via the cost-scaling of inflation-adjusted literature values according to Equation (3). The purchased equipment costs are multiplied by a Lang factor of 4.87 for solid-fluid-processing plants, according to Peters et al. [46], to consider all additional costs like instrumentation and control, piping, or electrical equipment. The expenditures and revenues are calculated based on simulation results and cost rates for all operating utilities. Two base years for calculating the LCOP for SNG and synthetic FT diesel are selected, namely 2019 and 2022. The year 2019 provides an investigation concerning the pre-crisis level. The increased energy prices after COVID-19 and the Ukraine war are reflected by the base year 2022. For the SNG process route, the expenditures are compensated by the revenues from the sale of district heat and captured CO2. In the FT process route, naphtha is produced as a by-product in addition to CO2 and district heat. Additionally, the resulting LCOP values are based on a plant lifetime of 20 years. Further details on calculating the total capital investment costs and the considered cost rates and assumptions for the techno-economic assessment are summarized in the Supplementary Materials.
The resulting LCOPs for both routes are compared with the market prices of their fossil equivalents and LCOPs of alternative renewable routes. Finally, a sensitivity analysis is conducted to analyze the influences of assumed cost rates on the resulting LCOP values. For further details on the determination of the LCOP, a reference is made to [46]
L C O P = I 0 + ( E R s e c . p r o d . ) · C D F M t , m a i n   p r o d . · C D F
C D F = 1 + i n 1 i · 1 + i n
C e q , d e s i g n = C e q , b a s e S d e s i g n S b a s e r Z C E P C I b a s e   y e a r C E P C I 2019 2022
Additionally, an ecological assessment of both process routes is conducted to analyze the CO2 footprint of the produced synthetic products. The process balance boundaries are defined by a Well-to-Tank approach [47,48]. The calculation of greenhouse gas emissions is based on the unit CO2 equivalents (CO2e) in order to achieve a standardization of the climate impact of different greenhouse gases. Therefore, the CO2 footprint of both process routes is determined by calculating the direct and indirect greenhouse gas emissions of the main utilities, including the built-in steel and concrete, via ecological factors. The ecological factors are mainly based on databases from the Federal Environmental Agency of Austria [49], Germany [50], and the database of the software tool GEMIS 5.0 [51]. For the ecological factor of the consumed electricity, it is assumed that green electricity is used [49]. In accordance with the IEA [49], the energy allocation method was applied to allocate the resulting absolute CO2e emissions to the primary and secondary products. The functional unit for the techno-economic and ecological assessment is MWhSNG for the SNG route and lDiesel for the FT route. At this point, it must be mentioned that for a holistic life cycle assessment of the two biomass-based products, many other ecological factors such as acidification potential, eutrophication, and land use have to be considered in addition to the CO2 footprint. Further details on calculating the ecological footprint are summarized in the Supplementary Materials.

2.4. Scenarios for Integrating Biomass-Based SNG and FT Diesel in the Austrian Energy System

The techno-economic and ecological assessment of the 100 MW biomass-based SNG and FT route form the basis for discussing the scenarios for integrating biomass-based SNG and FT diesel into the Austrian energy system. The techno-economic assessment explained in Section 2.3 is based on woody biomass. Other feedstocks like energy crops, straw, or sewage sludge are mostly cheaper than woody biomass. However, the more complex gas cleaning process in the case of non-woody biomass also induces higher investment and operating costs. Furthermore, the ecological assessment is also based on woody biomass. The use of different feedstocks influences the resulting CO2 footprint. Nevertheless, for the following scenarios, the whole biomass potential from the potential analysis is considered, assuming that the production costs and CO2 footprint of SNG and FT diesel remain constant independent of the feedstock. In total, six scenarios for integrating drop-in FT diesel or SNG into the Austrian energy system are discussed. The underlying demand for natural gas and diesel is based on 2021 [2,52]. Below, the scenarios considered are explained, showing the broad integration possibilities of the two products.
(a)
SNG use in the energy sector
The first scenario is based on the use of SNG in the energy sector for defossilization of existing heat, combined heat and power, and power plants. Due to the increasing share of fluctuating renewable energy sources in the Austrian power grid, further flexibility options have to be installed to ensure the security of supply. On the one hand, this can be achieved through the increased interconnection to the European power grid with corresponding national grid reinforcement and grid expansion projects, as well as the installation of additional storage facilities [53]. On the other hand, existing gas-fired power plants could be retained for peak load coverage and still be defossilized with SNG. Additionally, gas-fired heat plants based on biomass-based SNG can decrease the CO2 footprint of existing district heating systems directly. Within this scenario, the natural gas consumption from the energy sector is completely substituted with biomass-based SNG based on industry prices. The defossilization potential assumes that the natural gas consumption in the energy sector remains constant until 2050.
(b)
SNG use in the private and public sector (without mobility)
In the second scenario, the use of SNG in the private and public sector is considered, which means that existing gas boilers in private households, public and private services, and aggregates in the agriculture and forestry sector are retained and driven by biomass-based SNG. Of course, renewable heat supply in the private sector can also be achieved via other technologies, such as heat pumps or solar thermal, but the necessary high inlet temperatures in old apartments, as they are found in Vienna, can only be achieved satisfactorily by district heat or wood-fired boilers [54]. Therefore, the defossilization of existing gas infrastructure in the public and private sector using biomass-based SNG can also contribute to a sustainable energy system. The following techno-economic assessment in this scenario is based on household prices. The defossilization potential assumes that the natural gas consumption in this sector remains constant until 2050.
(c)
SNG use in the industry
The third scenario for integrating biomass-based SNG in the Austrian energy system is integration in the manufacturing sector. Natural gas in burners is used in different sectors like the chemical, pulp and paper, cement, or steel industries to provide high-temperature heat for several production processes. Integrating biomass-based SNG in the industry would be an easy way to provide the necessary high-temperature heat without any changes in the current utilized process chains [55]. Furthermore, the material use of natural gas in the industry sector could be easily substituted with biomass-based SNG. The techno-economic assessment in this scenario is based on industry prices. The defossilization potential assumes that the natural gas consumption in the industry sector remains constant until 2050.
(d)
FT diesel in private and public transport
Therein, the use of biomass-based FT diesel as drop-in fuel in conventional diesel cars and buses is considered. For evaluating the defossilization potential, it is assumed, according to [35], that the number of diesel cars and the associated diesel demand will be reduced by half until 2050. The number of diesel buses will remain constant until 2050. The techno-economic assessment in this scenario is based on petrol station market prices for private consumers.
(e)
FT diesel in heavy-duty traffic
The fifth scenario is based on integrating biomass-based FT diesel in the heavy-duty traffic sector. In this sector, freight transport with light and heavy commercial vehicles (LCV and HCV) and the diesel demand in agriculture and forestry is considered. Furthermore, the diesel demand for inland navigation and railway is discussed. For calculating the defossilization potential in this scenario, it is assumed that the number of LCVs will be reduced, simultaneously with the number of cars, by half until 2050 [35]. The number of diesel-driven HCVs, tractors, ships, and trains will remain constant until 2050 [35]. For the techno-economic assessment, the mean value of the petrol station market price for private consumers and the stock market diesel price is considered.
(f)
FT diesel in heat and power
Finally, the sixth scenario includes the integration of FT diesel in the heat and power sector. Therein, the diesel demand in the manufacturing and the public and private sectors is considered. Similar to the use of SNG in industry, FT diesel can provide high-temperature heat. The diesel demand in the public and private service sectors can be mainly attributed to, e.g., emergency diesel aggregates in hospitals and other critical infrastructure. The diesel demand in the manufacturing sector is assumed to remain constant until 2050, whereas a reduction by half is assumed for the public and private sector due to a substitution with other renewable technologies [35]. The techno-economic assessment is based on the stock market diesel price.
These six scenarios are further investigated and compared to discuss the techno-economic and ecological impact of each integration possibility. Therefore, the natural gas and diesel demand in 2050 is estimated in all sectors and compared with the SNG and FT diesel potential. Furthermore, the CO2 reduction potential (CO2ered,sector i) through the substitution of natural gas with SNG or fossil diesel with FT diesel is investigated in each scenario (see Equation (4)). For this, the annual amount of sectoral used gas or diesel (Egas/diesel,sector i) is multiplied by the difference in CO2 footprints between the renewable biomass-based product and its fossil counterpart (FP) and divided by the absolute annual CO2 emissions in the respective sector (CO2etot,sector i). Finally, the techno-economic comparison between the SNG and FT diesel production costs with the market prices (MP) of the fossil counterpart shows the economic competitiveness (EC) of both products (see Equation (5)). The comparison of the total additional costs or savings per year with the gross value added (GVA) shows the economic impact in the respective sector. The GVA is calculated from the gross production values achieved, reduced by all advance outlays. Simplified, GVA could be described as a company’s revenue minus expenses for all kinds of utilities. The resulting GVA is ultimately shared among all the stakeholders involved, namely the employees, the company owners, and the state. Consequently, the EC determines the percentage by which the sectoral GVA or, in approximation, the profit changes as a result of switching to biomass-based SNG or FT diesel.
C O 2 e r e d , s e c t o r   i = E g a s / d i e s e l , s e c t o r i F P f o s . g a s / d i e s e l F P S N G / F T d i e s e l C O 2 e t o t , s e c t o r i
E C s e c t o r   i = E g a s / d i e s e l , s e c t o r i M P f o s . g a s / d i e s e l L C O P S N G / F T d i e s e l G V A t o t a l , s e c t o r   i
Finally, alternative options for using SNG and FT diesel are discussed, which can contribute to a sustainable energy system in the individual sectors. Consequently, in addition to a quantitative comparison of the individual scenarios based on techno-economic and ecological footprints, a qualitative comparison of possible alternatives can be used to find the most suitable application for SNG and FT diesel.

3. Results and Discussion

In this chapter, all results are visualized and discussed. First of all, the input and output streams of both commercial scale routes for producing wood-based SNG and FT diesel with a thermal fuel power input of 100 MWth are determined. Then, the techno-economic and ecological competitiveness of each route, regarding levelized production costs and CO2 footprints, is assessed. Finally, the integration of biomass-based SNG and FT diesel in several sectors of the Austrian energy system is discussed.

3.1. Input- and Output Streams of Commercial SNG and FT Production Plants

In Section 2.2, the commercial scale concepts for both investigated routes were presented. Based on these concepts, the process simulation results in terms of input and output streams for both routes are presented in this chapter. In Table 2, the input and output streams for the production of wood-based SNG based on 100 MWth scale are summarized. Thus, it can be concluded that approximately 65 MW of SNG can be generated from 100 MWth woody biomass. In addition, approximately 14.2 MW of district heat and 6150 Nm3/h of CO2 for storage or utilization can be recovered.
Table 3 shows the input and output streams for the production of wood-based FT diesel based on a 100 MWth scale. Therein, it can be seen that through the gasification of woody biomass with subsequent gas cleaning, FT synthesis, and FT upgrading, approximately 36.6 MW of drop-in FT diesel can be produced. Additionally, 22.8 MW district heat, 17.6 MW FT naphtha, and 3790 Nm3/h of CO2 can be recovered.
In comparison, the SNG process yields a higher energetic efficiency than the FT process. About 79% of the chemical energy from the woody biomass can be transferred to SNG and district heat, whereas 77% is found in FT diesel, naphtha, and district heat. Furthermore, more CO2 needs to be captured in the SNG process due to a higher CO2 capture rate and less carbon in the product per molecule of CH4 compared to FT products. Thus, more amine is also needed for the scrubber. In the FT process route, more electricity is required to reach higher synthesis pressure levels. Additionally, hydrogen is needed to upgrade FT products in the hydrocracker and hydrotreater. The presented simulation results are the basis for the calculation of the techno-economic and ecological results.

3.2. Techno-Economic Results of Commercial SNG and FT Production Plants

Based on the simulation results, a techno-economic assessment determines the levelized production costs for both commercial-scale routes. The underlying methodology for determining the production costs for wood-based SNG and FT diesel is explained in Section 2.3.
Figure 3 visualizes the production costs of wood-based SNG for the 100 MWth scale. They are compared with the household and industry market prices of fossil natural gas based on the pre-crisis year 2019 and crisis year 2022. The production costs for SNG consist of approximately one-third each, namely, of fuel, operation and maintenance, and investment costs. For the base year 2019, the production costs of SNG, including taxes, are around 70 EUR /MWh. For 2022, the production costs rose to approximately 91 EUR /MWh. The increase in production costs is attributable to all three previously mentioned cost drivers. While the investment costs increased by 37% and the fuel costs by 27%, the most significant price increase, with 57%, was seen for operation and maintenance (O&M) costs. This is due to the doubling of the industrial electricity price from 2019 to 2022. However, the price increases were partially compensated by the rising purchase prices for district heat and CO2. Meanwhile, market prices for fossil natural gas doubled in the household sector and tripled in the industrial sector during the period under consideration. Consequently, production costs of wood-based SNG are at household market price levels in 2019 and at industrial market price levels in 2022 compared to fossil natural gas.
In Figure 4 (left), the determined production costs excluding taxes for wood-based SNG for 2019 are compared with those for alternatives based on renewable energy sources (RES), according to Terlouw et al. [56] and Götz et al. [57]. These alternatives comprise e-fuels based on renewable electricity and CO2 from biogenic sources and biomethane based on manure and corn silage. The comparison shows that the production costs for biomethane are 20–55% higher than the SNG production costs based on woody biomass in the 100 MW scale. The e-fuels’ production costs are 175%higher than the production costs for wood-based SNG. In this comparison, the plant scale for biomethane is considerably lower, which is unfavorable regarding the economy of scale, and biomethane plants are not being built much larger. In the case of e-fuels, the high production costs can be attributed primarily to the high dependency on the underlying electricity price, which is the main price driver.
In Figure 4 (right), the sensitivity analysis of the SNG production costs based on the year 2022 is visualized. The most significant influence on SNG production costs is caused by the annual operating hours, the plant lifetime, the fuel costs, and the investment costs. Consequently, high plant availability and lifetime, and minimization of investment and fuel costs must be realized to keep production costs low. Furthermore, a moderate influence on SNG production costs is induced by interest rate, electricity price, maintenance, insurance and administration costs, and earnings through captured CO2 and district heat. Other operating utility costs have little to no impact on SNG production costs.
In Figure 5, the FT diesel production costs are compared to the stock market and petrol station prices for fossil diesel based on the pre-crisis year 2019 and the crisis year 2022. The FT diesel production costs are in the range of the petrol station prices but above stock market prices for fossil diesel in both reference years. Furthermore, the FT diesel production costs comprise 20–23% fuel costs, 36–39% operation and maintenance costs, and 40–41% investment costs, dependent on the base year. The FT diesel production costs with taxes are approximately 1.31 EUR /L for 2019 and 1.89 EUR /L for 2022. The production costs increase from 2019 compared to 2022 is in the same range as mentioned for the SNG process route.
Additionally, the yearly operation and maintenance costs of the FT diesel route are 67–74% higher compared to the SNG route. This is because of the higher consumption of catalysts and electricity and higher maintenance needs. The investment costs of the FT diesel production route are approximately 70% higher than the investment costs of the SNG process route, while the fuel costs remain constant.
In Figure 6 (left), the FT diesel production costs excluding taxes, based on 2019, are compared with renewable alternative routes published by Maniatis et al. [58] and Pratschner et al. [59]. The biodiesel production routes fatty acid methyl ester (FAME) and hydroprocessed ester and fatty acid (HEFA) based on used cooking oil show production costs of 0.86–0.87 EUR /L and are approximately 26% cheaper than the wood-based FT diesel at 100 MW scale. The jatropha oil-based biodiesel from the HEFA route is more expensive than the FT diesel due to the higher fuel costs. E-fuels based on RES electricity and industrial CO2 are approximately two to three times more expensive than wood-based FT diesel due to the high dependency on the electricity price.
The sensitivity analysis regarding the wood-based FT diesel production costs for 2022 is visualized in Figure 6 (right). Similar to the SNG route, the main influences are the annual operating hours, the plant lifetime, and the investment costs. However, the sensitivity to varying fuel costs is lower in comparison to the SNG route due to their lower share within the overall production costs.
If the techno-economics of the biomass-based SNG and FT diesel routes are compared in an energy-related manner, it is noticeable that the production costs of SNG at 70–91 EUR /MWh are much lower than FT diesel with 137–198 EUR /MWh. This results from the much higher investment costs for the production of FT diesel due to the significantly more complex product upgrading steps. Furthermore, the O&M are higher because more electricity is required for compression to a higher pressure level in synthesis and hydrogen is needed in upgrading.

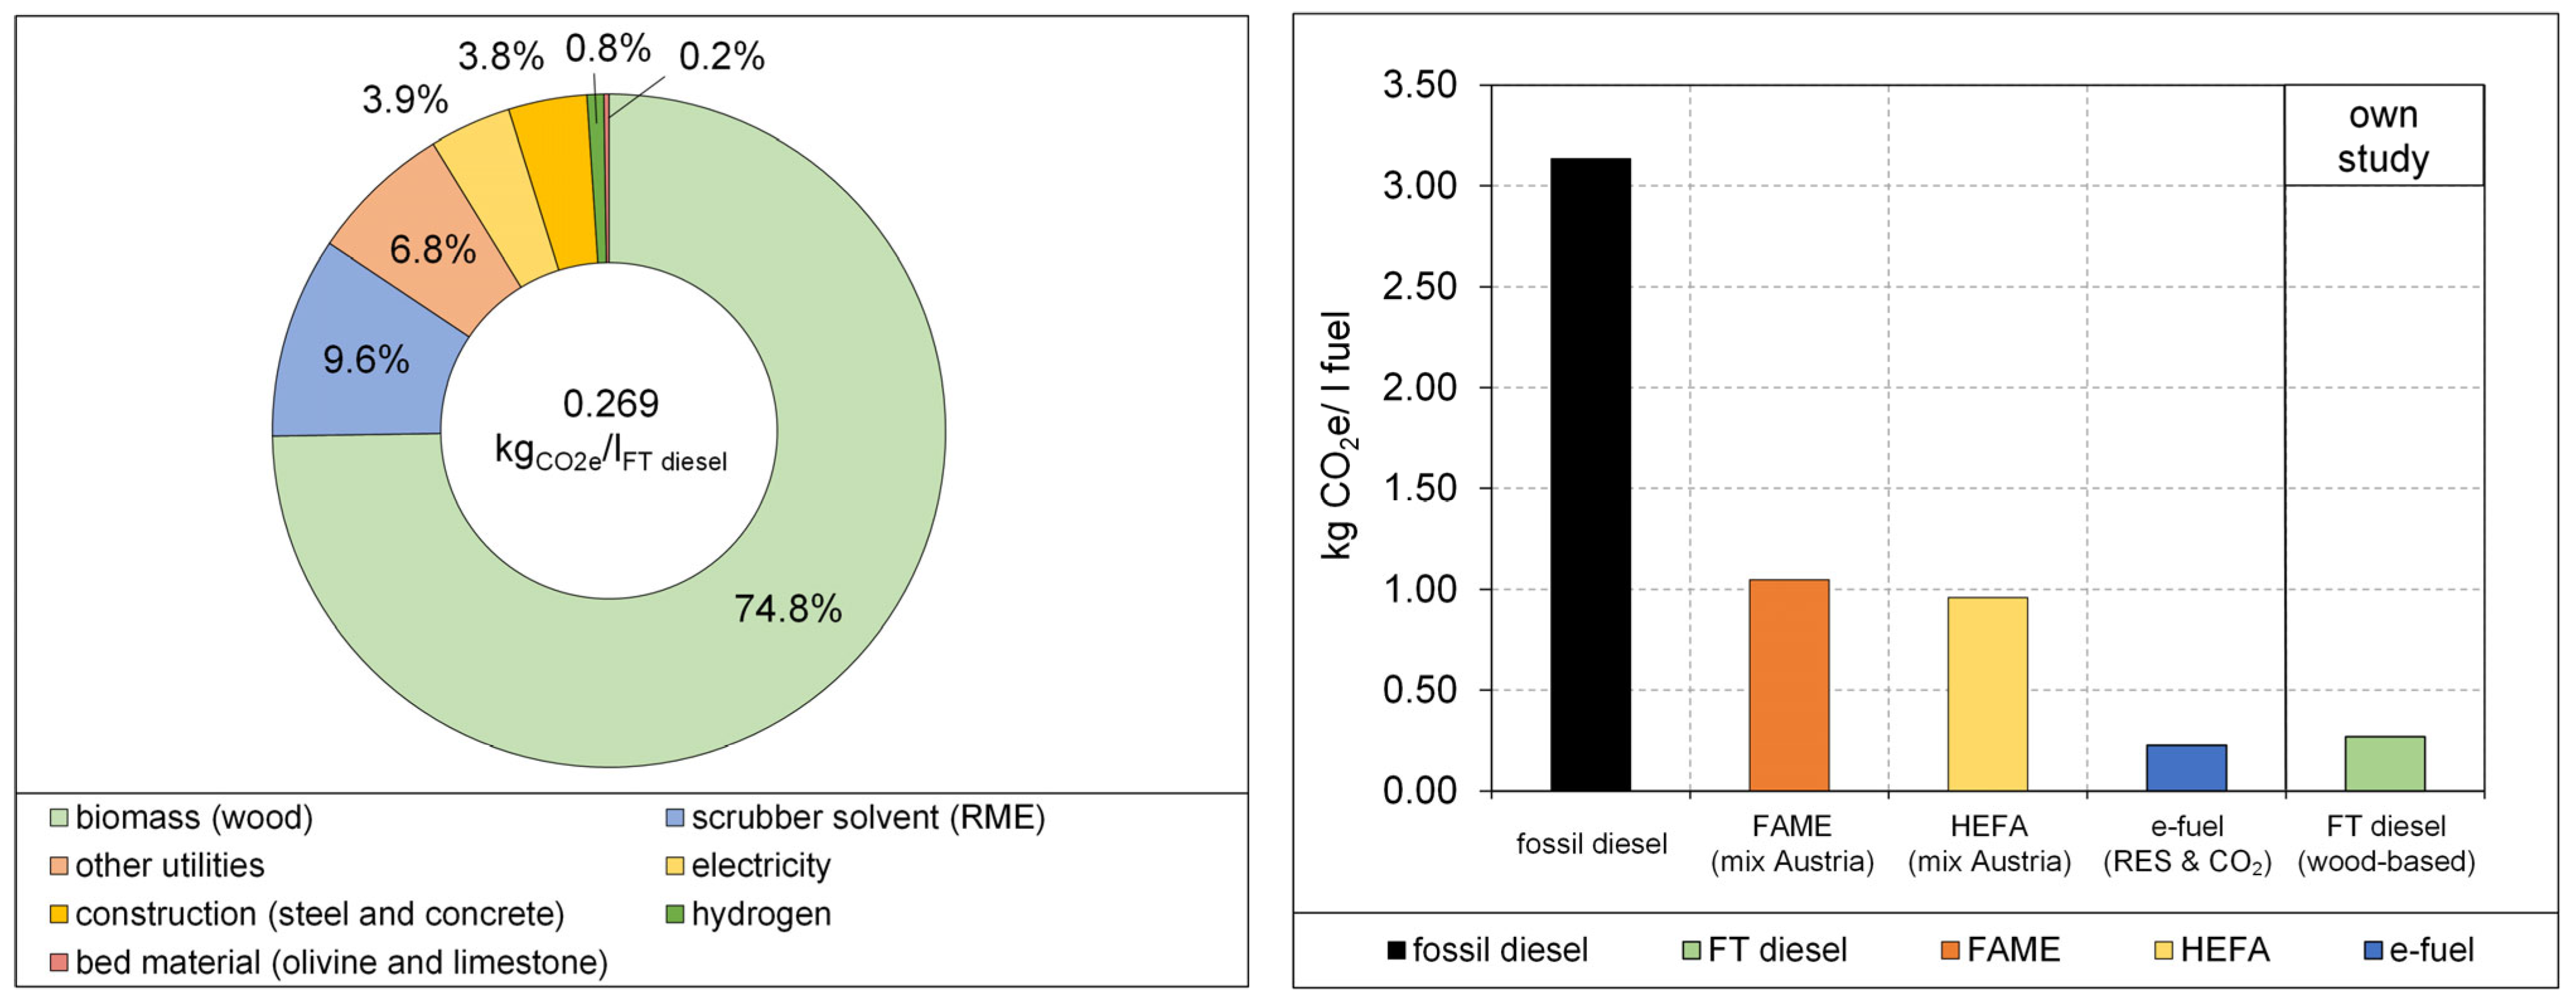
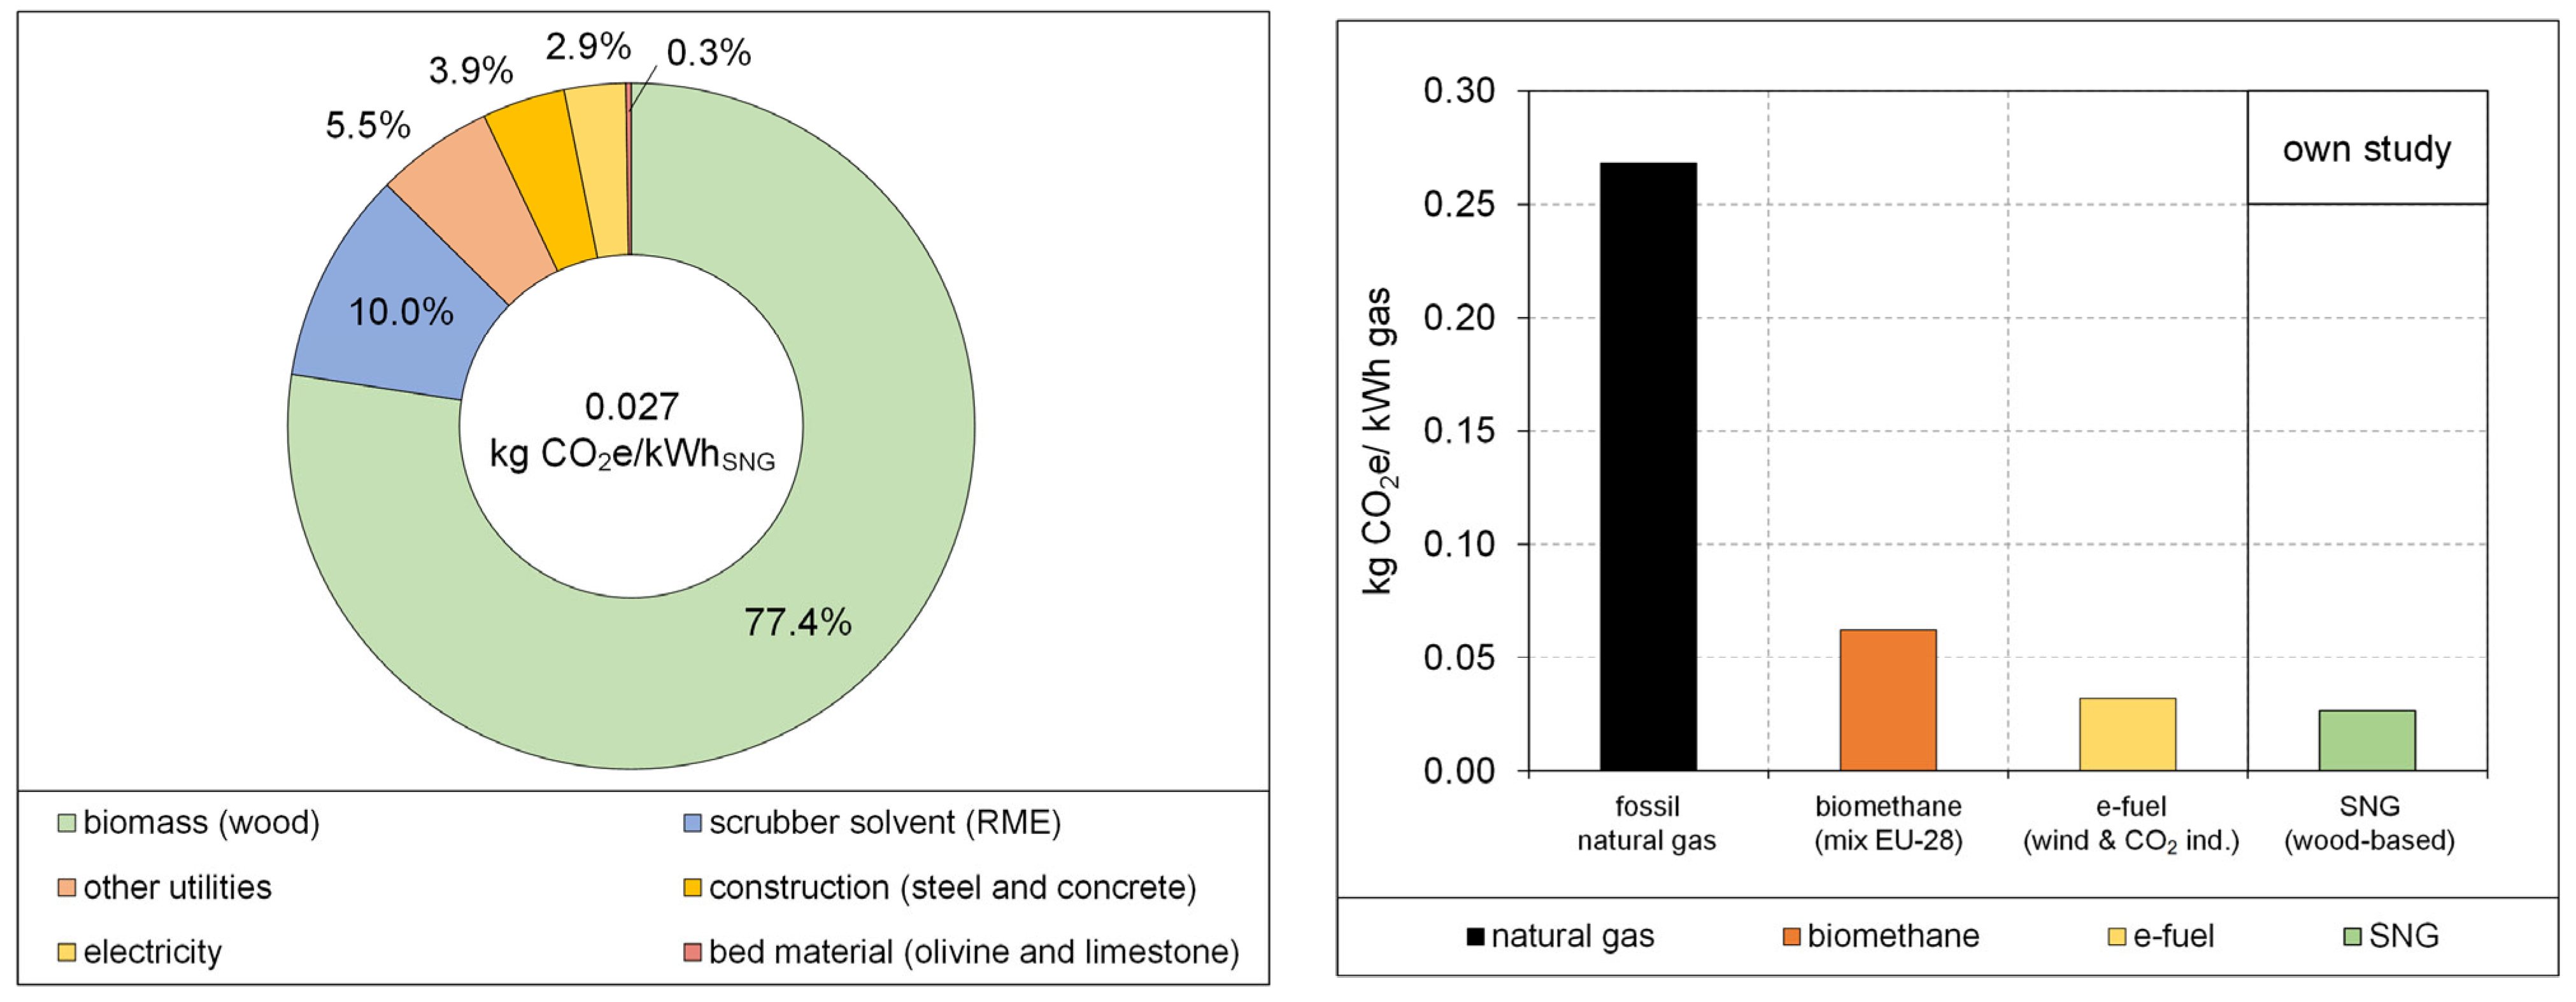
3.3. Ecological Results of Commercial SNG and FT Production Plants

In analogy to the techno-economic, the egologic assessment expressed by the CO2 footprint of both process routes is conducted. The underlying methodology for determining the CO2 footprint for wood-based SNG and FT diesel is explained in Section 2.3.
Figure 7 (left) shows a breakdown of the CO2 footprint of the wood-based SNG production route. The CO2 footprint per produced unit of SNG is 0.027 kgCO2e/kWhSNG. The direct and indirect emissions of wood are responsible for approximately 77% of the total CO2 footprint. About 10% are related to using rapeseed methyl ester as a scrubber solvent. All the other utilities, like steel, concrete, bed material, activated carbon, zinc oxide, nickel catalyst, amine, glycol, and green electricity, cause the remaining 13% of the overall CO2 footprint. Regarding the CO2 footprint for electricity, it must be mentioned that the calculation is based on the utilization of green electricity. If the CO2 footprint of the Austrian electricity mix were chosen, the total CO2 footprint of the produced SNG would increase by 37% to 0.037 kgCO2e/kWhSNG.
In Figure 7 (right), a comparison of the CO2 footprint from wood-based SNG with that from fossil natural gas, according to Federal Environmental Agency Austria [49], and from RES alternatives, according to a study from Jungmeier et al. [30,60], is shown. Therein, it can be seen that using wood-based SNG at 100 MW scale instead of fossil natural gas can save 90% of CO2 emissions. Furthermore, the CO2 footprint of wood-based SNG is also lower compared to the renewable alternatives biomethane and e-fuel. The CO2 footprint per kWh of biomethane, based on the average substrate mix within the European Union, is more than double as high as the value of synthetic natural gas, mostly caused by the emissions due to the use of corn silage or energy plants. The CO2 footprint of e-fuels using renewable electricity and biogenic CO2 is also in the range of wood-based SNG and quite low. However, the CO2 footprint of e-fuels using fossil electricity is much higher than that of fossil natural gas. Finally, it has to be mentioned that for the CO2 footprint of the biomass-based SNG, the 6150 Nm3/h of captured CO2 during gas upgrading are not considered. If this is considered a CO2 sink, a negative CO2 footprint of 0.127 kgCO2e/kWhSNG could be achieved, and thereby, a below zero emission technology is possible.
In Figure 8 (left), the breakdown of the CO2 footprint for the wood-based FT diesel is shown. The CO2 footprint of the wood-based FT diesel is 0.269 kgCO2e/lFT diesel. The distribution of CO2 emissions is very similar to the SNG process route. Due to the larger consumption of different catalysts in the synthesis and upgrading step, the category “other utilities” has a slightly larger impact on the CO2 footprint compared to the SNG route. The electricity consumption is also slightly higher due to the higher pressure level in the synthesis step. Additionally, hydrogen is required in the upgrading steps of the FT diesel, which also accounts for a small share of the CO2 footprint. The CO2 footprint of the electricity is based on green electricity. If the CO2 footprint of the Austrian electricity mix were chosen for calculating the CO2 footprint of electricity and hydrogen, the total CO2 footprint of the produced FT diesel would increase by 64% to 0.440 kgCO2e/lFT diesel.
In Figure 8 (right), the CO2 footprint of the wood-based FT diesel is compared with that of fossil diesel, according to Federal Environmental Agency Austria [49], and of RES alternatives, according to studies from Aichmayer et al. [61] and Pratschner et al. [62]. The CO2 footprints of the wood-based FT diesel and the e-fuels, both based on green electricity, are the lowest and more than 90% lower compared to the CO2 footprint of fossil diesel. If using fossil-based electricity as an energy source for e-fuels, the CO2 footprint is much higher than the CO2 footprint of fossil diesel. The CO2 footprint of the FAME and HEFA process routes based on an Austrian fuel mix is 65–70% lower compared to the fossil diesel. If cooking oil is used as a feedstock for the FAME and HEFA processes, CO2 footprints in the same range as those of e-fuels and wood-based FT diesel can be achieved. Similar to the SNG process route, the capturing of CO2 is not considered. By taking the capture of approximately 3790 Nm3/h of CO2 in the upgrading step into account as a CO2 sink, a footprint of 0.657 kgCO2e/lFT diesel could be achieved.
If the CO2 footprints of the two biomass-based products are compared, hardly any difference can be detected. The energy-related CO2 footprint of FT diesel is 0.028 kgCO2e/kWhFT diesel, nearly the same as the SNG footprint of 0.027 kgCO2e/kWhSNG. The reason is that the same amount of biomass is used for the production of an energy-related product unit, with approximately the same energetic process efficiencies. In contrast to the techno-economy, the higher electricity demand and the use of hydrogen have not as strong of a impact, since green electricity with a very low CO2 footprint was assumed.

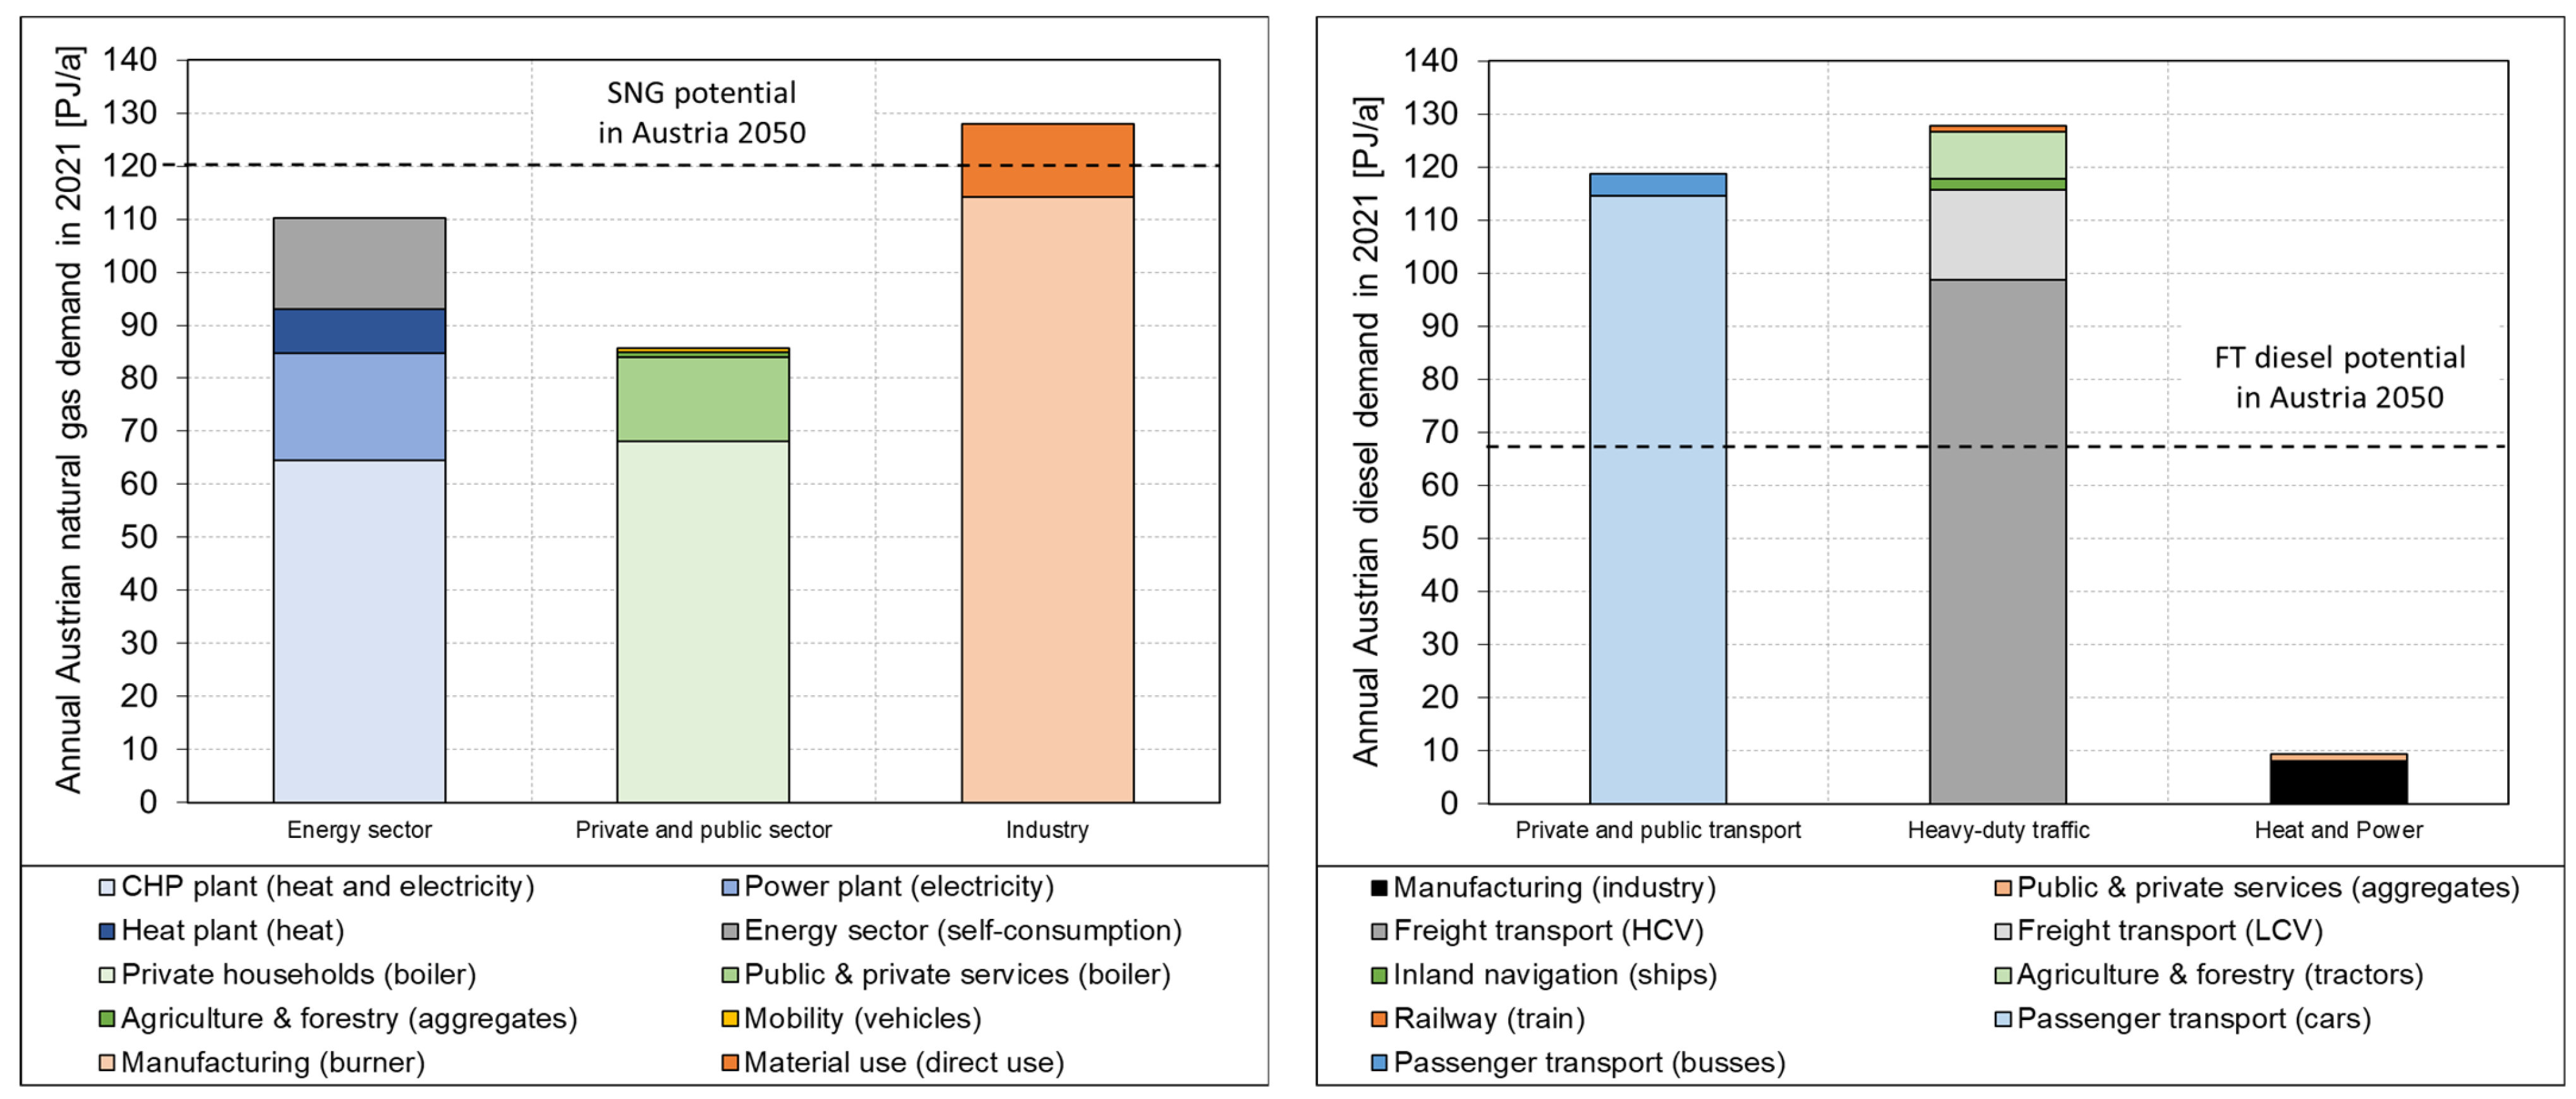
3.4. Integration of Biomass-Based SNG and FT Diesel in the Austrian Energy System

The biomass potential analysis (from Section 2.1) and the techno-economic (from Section 3.2) and ecological (from Section 3.3) results form the basis for discussing integration possibilities of biomass-based SNG and FT diesel in the Austrian energy system. Based on the biomass potential analysis, an additional biomass potential of 185 PJ/a can be determined in Austria in the year 2050. It should be mentioned that this potential does not consider competitive use by other biomass-based technologies. Considering the energetic efficiencies for the SNG and FT diesel process route, 120 PJ/a of SNG or 67.5 PJ/a of FT diesel can be produced out of the raised biomass potential. Additionally, the by-products of FT diesel, naphtha, district heat, and captured CO2, are produced. In Figure 9, the annual Austrian energy demand for fossil natural gas and fossil diesel, distributed to six sectors related to the scenarios explained in Section 2.4, is compared to the biomass-based SNG and FT diesel potential in 2050. It can be seen that there is enough potential to substitute the whole natural gas demand in the energy sector or private and public sector, or nearly the whole industry sector. Instead of producing SNG, biomass-based FT diesel can substitute approximately half of the fossil diesel demand in private and public transport sectors or the heavy-duty traffic sector, or the whole demand in the heat and power sector.
In Table 4, the six scenarios for the use of SNG and FT diesel as drop-in fuels in several sectors are summarized and compared. Therein, the substituted fossil natural gas and fossil diesel demands are compared with the change in the sectoral gross value added (GVA) for the pre-crisis year 2019 and crisis year 2022 and the CO2 reduction potential of the sector.
It can be seen that the highest sectoral CO2 reduction, 89%, can be reached in the energy sector through a nearly complete defossilization of the electricity and district heat mix with SNG. Regarding the economic impact, it can be seen in Figure 3 that the SNG production costs in the pre-crisis year 2019 were more than double and in the crisis year 2022, nearly on the same level compared to the related industrial natural gas market prices. This comparison shows that by integrating SNG into the energy sector, the electricity and heat price can be decoupled from the natural gas price. However, because cheaper alternative electricity and heat production technologies like wind power or solar PV exist, the SNG use in the energy sector should be focused on gas-fired power plants for the coverage of peak-loads.
SNG use in the private and public sector also helps to reduce the sectoral CO2 footprint by more than 70%, while raising the sectoral GVA. This would mean that using SNG in private households in times of crisis would help relieve household budgets. In comparison with alternative decentralized heat production technologies, it has to be mentioned that heat pumps and district heat should be used preferentially, because biomass-based SNG is not infinitely available. However, using SNG in private households, where no district heat or other renewable options are available, could be favorable.
Furthermore, the industry can use SNG to defossilize the gas demand for burners and direct material use without major changes in the process chains. In this way, nearly a third of the industrial CO2 emissions can be reduced. The economic impact in this scenario is limited, with a sectoral GVA change of up to 2%. Consequently, the use of SNG could be a viable option in the defossilization process of the industry where the use of heat-pumps or waste heat cannot be realized.
In addition to the three integration scenarios for biomass-based SNG, three scenarios for integrating FT diesel in the Austrian energy system are discussed. According to the biomass potential, approximately half of the private and public transport diesel demand can be substituted with FT diesel. Consequently, according to future vehicle fleet predictions [35], it was assumed that only half of the diesel demand for cars could be replaced by synthetic fuels, thus leading to a sectoral CO2 reduction of approximately 40%, while the sectoral GVA remains nearly constant. However, besides FT diesel, there are several alternative options for the public and private transport sector, first and foremost e-mobility.
The use of FT diesel in the heavy-duty traffic sector would be another option for using biomass-based products in the Austrian energy system. If the entire biomass potential is used to produce FT diesel for the heavy-duty traffic sector, the sectoral CO2 footprint can be reduced by over 58%, while the sectoral GVA would be reduced by up to 2%. Furthermore, alternative options in this sector are, to date, limited; thus, the integration of FT diesel into the heavy-duty traffic sector is a promising solution. Moreover, it must be mentioned that the use of FT diesel in mobility can only take place if this fuel is approved for use in the most common diesel engines, regardless of the standard to be met.
The last scenario is based on the use of FT diesel in the heat and power sector, which comprises public and private heat production and the diesel demand in the manufacturing sector. The substitution of the diesel demand in this sector can only lead to a sectoral CO2 reduction of 2–3%, much less than in the other scenarios. Consequently, it can be concluded that using high-quality FT diesel in the heat and power sector is not a viable option.
The scenarios examined aim to ensure that the released biomass can be used in either one sector or another. This means that several scenarios can only be implemented if the total amount of biomass used does not exceed the calculated biomass potential of 185 PJ/a.

4. Conclusions and Outlook

Based on a study from TU Wien [11], the Austrian Government could be convinced to fund the establishment of a 5 MW demonstration plant for the biomass-based production of SNG and FT diesel. The remaining knowledge gaps regarding the long-term behavior of different process units and utilities can be clarified within this demonstration phase. This includes exemplifying the technical investigation of the influence of fluctuating fuel qualities on product quality, the lifetime of catalysts and other utilities, and the required maintenance intervals with regard to plant availability. Furthermore, non-technical aspects, such as the examination of the all-season regional provision of biomass and the creation of social acceptance of the novel technology, should be investigated. In addition to the knowledge gaps described above, the competitive use of biomass must also be mentioned here as a possible limitation for the roll-out process.
After this demonstration phase, the lessons learned should be used to roll out the investigated technology commercially in Austria. This publication investigated the commercial scale concepts for producing wood-based SNG and FT diesel based on a 100 MWth scale.
The simulation of both process routes showed that the energetic efficiency of the SNG process route is 79%, slightly higher compared to the 77% of the FT diesel process route. At the same time, it must be mentioned that within the SNG process, 65% of the chemical energy of the biomass can be converted to the main product, SNG. In comparison, within the FT process, only 36.6% of the biomass input is converted to the main product, FT diesel.
The techno-economic assessment showed that biomass-based SNG and FT diesel production costs can compete with the market prices of their fossil counterparts. The production costs of wood-based SNG related to the pre-crisis year 2019 are approximately 70 EUR /MWh. The market price range for fossil natural gas in the same year was 30–70 EUR /MWh, depending on the quantity purchased in industrial and household sectors. Based on the crisis year 2022, the SNG production costs were 91 EUR /MWh, slightly higher due to inflation. However, the market price for fossil natural gas increased to 89–150 EUR /MWh. Thus, it can be seen that the SNG production costs based on 2019 are in the range of the household prices, and when based on 2022, in the range of industrial market prices. Consequently, wood-based SNG production can help to decouple the domestic natural gas price level from the global market price level. The production costs for wood-based FT diesel are 1.31–1.89 EUR /L in the reference years 2019 and 2022. In comparison, the petrol station price level for fossil diesel was between 1.24–1.94 EUR /L. This comparison shows that the FT diesel production costs approximately match the petrol station price level, independent of the reference year. The economical comparison also showed that biomass-based SNG and FT diesel can compete with other renewable alternatives. The energy-related comparison of production costs for both biomass-based products shows that FT diesel, with 137–198 EUR /MWh, costs approximately twice as much as SNG, with 70–91 EUR /MWh. The reason for this is the much higher investment costs for the FT diesel route due to the more complex product upgrading and the additional costs for the higher electricity and hydrogen demand.
Furthermore, the CO2 footprints of the wood-based SNG and FT diesel were determined. The CO2 footprint for wood-based SNG is 0.027 kgCO2e/kWhSNG, and it is 0.269 kgCO2e/lFT diesel for wood-based FT diesel, which are more than 90% lower than their fossil counterparts. Compared to renewable alternatives, wood-based SNG and FT diesel are among the products with the lowest CO2 footprint. The energy-related comparison of the two biomass-based products shows hardly any differences, since the higher consumption of electricity and hydrogen due to the use of green electricity is not significant. Moreover, it has to be mentioned that if the additional CO2 capturing in both process routes were considered, the production of wood-based SNG and FT diesel would create a CO2 sink.
Moreover, six integration scenarios for producing biomass-based SNG and FT diesel were investigated to find possible applications in the Austrian energy system. The biomass potential analysis, based on several literature studies, showed that, in 2050, an additional biomass potential of 185 PJ/a would be available. Hence, a potential for biomass-based SNG of 120 PJ/a or biomass-based FT diesel of 67.5 PJ/a can be assumed. The scenarios demonstrated the various application possibilities for biomass-based SNG and FT diesel. Therein, the sectoral change of gross value added and the CO2 reduction potential were calculated to investigate the economic and ecological impacts. The most promising applications for biomass-based FT diesel and SNG are summarized below:
  • SNG use for covering electricity peak loads in the energy sector 🡺 helps to prevent blackouts and to decouple the domestic electricity market from the gas market;
  • SNG use in the industry sector for the provision of high-temperature heat 🡺 economically feasible and a good option, when no waste heat or heat pumps can be used;
  • FT diesel in heavy-duty traffic 🡺 economically feasible and an excellent option to facilitate the defossilization of inland navigation, railway, freight transport, agriculture, and forestry.
Further, the use of biomass-based FT diesel in private and public transport, as well as the use of biomass-based SNG in the private and public heat provision sector, could be an additional economically favorable option to accelerate the transition phase towards defossilization of these sectors. However, the sectoral view neglects the fact that individual enterprises and households certainly experience different economic and ecological impacts from transitioning to sustainable FT diesel and SNG, since the used energy sources and energy quantities can vary significantly.
To accelerate the rollout of the two biomass-based technologies, regulatory measures must be applied. The associated EU directive on the expansion of renewable energy sources in the EU (RED II) [63] already set mandatory quotas for the share of advanced biofuels, such as FT diesel, until 2030. Furthermore, the Austrian Renewable Energy Expansion Act [64] specifies that a fixed annual amount of biomethane, such as SNG, must be fed into the grid by 2030. A further increase in quotas with associated financial support measures would help to accelerate the roll-out process.
Besides determining the energetic efficiency, production costs, and CO2 footprint, further sustainability indicators like the acidification potential, ground air quality, eutrophication, land use, payback time, or changes in gross domestic products should be investigated. Future research should focus on validating the calculated sustainability indicators after the scale-up to the demonstration plant. The process simulation focused mostly on each unit’s mass and energy balances to define the main streams of the whole process unit. More detailed simulation models based on experimental test rigs can help to refine the whole process chain. In addition, future research should focus on biomass price changes caused by greater demand. The biomass price depends very much on the market situation and is dominated by supply and demand. Therefore, an increase in biomass use must be expected to lead to an increase in biomass price, unless regulatory measures follow. The continuous improvement of the sustainability criteria for the use of biomass must contribute to sustainable agriculture and forestry in Austria.
Summing up, the extensive investigation of biomass-based SNG and FT diesel production showed significant potential and enables the implementation of different defossilization strategies in the Austrian energy system. Nevertheless, the technical feasibility must first be tested within the framework of long-term trials in the planned demonstration plant.

Supplementary Materials

Supplementary data to this article can be found online at https://www.mdpi.com/article/10.3390/en16166097/s1. References [65,66,67,68,69,70,71,72,73,74,75,76,77,78,79,80,81,82,83,84,85,86,87,88,89,90,91,92,93,94,95,96,97,98,99,100,101,102,103,104,105,106,107,108,109,110,111,112,113,114,115,116,117,118,119,120,121,122,123,124,125,126,127,128,129,130] are cited in the Supplementary Materials.

Author Contributions

Conceptualization, M.H., A.B., F.B., M.V., S.P. and H.H.; methodology, M.H., A.B., F.B. and S.P.; validation, M.H., A.B. and S.P.; investigation, M.H., A.B., F.B. and S.P.; resources, M.H., A.B., S.P. and F.B.; writing—original draft, M.H. and A.B.; writing—review and editing, F.B., M.V., S.P., S.M. and H.H.; visualization, M.H. and A.B.; supervision, S.M. and H.H.; project administration, F.B. and H.H.; funding acquisition, F.B. and H.H. All authors have read and agreed to the published version of the manuscript.

Funding

Open Access Funding by TU Wien. The present work contains results of the project “Reallabor zur Herstellung von FT-Treibstoffen und SNG aus Biomasse und biogenen Reststoffen für die Land- und Forstwirtschaft” (101471), which is being conducted within the “DaFNE” research program funded and processed by the Federal Ministry for Sustainability and Tourism.

Data Availability Statement

Selected data that support the findings of this study are available from the corresponding author, M. Hammerschmid, upon reasonable request.

Acknowledgments

The authors acknowledge TU Wien Bibliothek for financial support through its Open Access Funding Programme.

Conflicts of Interest

The authors declare no conflict of interest.

Abbreviations

ACactivated carbon
ATAustria
C1–C3gaseous short-chain hydrocarbons recycled in Fischer–Tropsch tailgas
C4–C9naphtha fraction (raw product for producing gasoline)
C10–C19middle distillate fraction (after upgrading equivalent to diesel)
C10+middle distillate fraction and long-chain waxes
C20+long-chain waxes
CH4methane
COcarbon monoxide
CO2carbon dioxide
CO2ecarbon dioxide equivalent
DEGermany
DFBdual fluidized bed
ECeconomic competitiveness
FAMEfatty acid methyl ester
FTFischer–Tropsch
GEMISsoftware tool with database for life cycle analysis
GVAgross value added
H2hydrogen
H2Owater
H2Shydrogen sulfide
HCVheavy commercial vehicles
HEFAhydroprocessed ester and fatty acid
IEAInternational Energy Agency
IPSEpro 8.0software tool for process simulation from company SimTech GmbH
JPJapan
LCOPlevelized costs of products
LCVlight commercial vehicles
MPmarket prices
NH3ammonia
O&Moperation and maintenance
PFDprocess flow diagram
PGproduct gas
PVphotovoltaic
raw-SNGsynthetic natural gas after methanation unit and before upgrading
RESrenewable energy sources
RMErapeseed methyl ester
SESweden
SNGsynthetic natural gas
THThailand
TSAtemperature swing adsorption
ZnOzinc oxide
Symbols:
%percent
C D F cumulative discount factor
C E P C I 2019 2022 Chemical Engineering Plant Cost Index based on 2019 or 2022
C E P C I b a s e   y e a r Chemical Engineering Plant Cost Index based on base year of literature
C e q , b a s e equipment costs based on base year and base scale of literature
C e q , d e s i g n overall costs for installed equipment based on 2019 or 2022
C O 2 e r e d , s e c t o r   i carbon dioxide reduction potential in sector i
C O 2 e t o t , s e c t o r   i total carbon dioxide equivalent in sector i
E annual expenditures
E C s e c t o r   i economic competitiveness in sector i based on 2019 or 2022
E g a s / d i e s e l , s e c t o r   i substituted annual fossil gas or diesel demand in sector i
F P f o s . g a s / d i e s e l carbon dioxide equivalent footprint of fossil natural gas or diesel
F P S N G / F T d i e s e l carbon dioxide equivalent footprint of biomass-based SNG or FT diesel
G V A t o t a l , s e c t o r   i total gross value added in sector i based on 2019 or 2022
i interest rate
I 0 total capital investment costs of plant
l liter
L C O P levelized costs of products
L C O P S N G / F T d i e s e l levelized costs of products for SNG or FT diesel based on 2019 or 2022
l D i e s e l liters of diesel
M P f o s . g a s / d i e s e l market prices of fossil natural gas or diesel in 2019 or 2022
M t , m a i n   p r o d . annual quantity of the produced main product
M W megawatt
M W h megawatt hours
M W h t h megawatt hours of thermal fuel power
M W h S N G megawatt hours of synthetic natural gas
n plant lifetime
P J / a petajoule per year
r scaling factor
R s e c . p r o d . annual revenues of secondary products
S b a s e base scale
S d e s i g n desired scale
Z overall installation factor

References

  1. European Union. The European Green Deal. 2019. Available online: https://commission.europa.eu/system/files/2019-12/european-green-deal-communication_de.pdf (accessed on 2 July 2023).
  2. Anderl, M.; Bartel, A.; Frei, E.; Gugele, B.; Gössl, M.; Mayer, S.; Heinfellner, H.; Heller, C.; Heuber, A.; Köther, T.; et al. Klimaschutzbericht 2022; Federal Environmental Agency: Vienna, Austria, 2022. Available online: https://www.umweltbundesamt.at/fileadmin/site/publikationen/rep0816.pdf (accessed on 2 July 2023).
  3. Kaltschmitt, M.; Hartmann, H.; Hofbauer, H. Energie aus Biomasse: Grundlagen, Techniken und Verfahren, 3rd ed.; Springer Vieweg: Berlin/Heidelberg, Germany, 2016. [Google Scholar] [CrossRef]
  4. Schmid, J.C.; Benedikt, F.; Fuchs, J.; Mauerhofer, A.M.; Müller, S.; Hofbauer, H. Syngas for biorefineries from thermochemical gasification of lignocellulosic fuels and residues—5 years’ experience with an advanced dual fluidized bed gasifier design. Biomass Convers. Biorefinery 2021, 11, 2405–2442. [Google Scholar] [CrossRef]
  5. Benedikt, F.; Schmid, J.C.; Fuchs, J.; Mauerhofer, A.M.; Müller, S.; Hofbauer, H. Fuel flexible gasification with an advanced 100 kW dual fluidized bed steam gasification pilot plant. Energy 2018, 164, 329–343. [Google Scholar] [CrossRef]
  6. Bartik, A.; Benedikt, F.; Fuchs, J.; Hofbauer, H.; Müller, S. Experimental investigation of hydrogen-intensified synthetic natural gas production via biomass gasification: A technical comparison of different production pathways. Biomass Convers. Biorefinery 2023. [Google Scholar] [CrossRef]
  7. Thunman, H.; Seemann, M.; Berdugo Vilches, T.; Maric, J.; Pallares, D.; Ström, H.; Berndes, G.; Knutsson, P.; Larsson, A.; Breitholtz, C.; et al. Advanced biofuel production via gasification—Lessons learned from 200 man-years of research activity with Chalmers’ research gasifier and the GoBiGas demonstration plant. Energy Sci. Eng. 2018, 6, 6–34. [Google Scholar] [CrossRef]
  8. Cleantech Cluster. Erstes Produkt der Fischer-Tropsch-Pilotanlage in Wien-Simmering kommt in Flottentest zum Einsatz. 2023. Available online: https://www.cleantech-cluster.at/partnerunternehmen-im-ctc/ctc-partnernews-umwelt/detail/news/erstes-produkt-der-fischer-tropsch-pilotanlage-in-wien-simmering-kommt-in-flottentest-zum-einsatz (accessed on 28 May 2023).
  9. Kadlez, D.; Benedikt, F.; Bartik, A.; Müller, S.; Hofbauer, H.; Karel, T.; Binder, M.; Huber, M.; Egger, A.; Hochstöger, D.; et al. First results of mass and energy balances of a 1 MW advanced dual fluidized bed steam gasification demonstration plant. In Proceedings of the Central European Biomass Conference, Graz, Austria, 18–20 January 2023. [Google Scholar]
  10. Kuba, M.; Karel, T.; Fürsatz, K.; Binder, M.; Hannl, T.; Huber, M.; Hochstöger, D.; Egger, A.; Weber, G.; Haslinger, W.; et al. Second generation biomass gasification: The Syngas Platform Vienna—Current status and outlook. In Proceedings of the Central European Biomass Conference, Graz, Austria, 18–20 January 2023. [Google Scholar]
  11. Hofbauer, H.; Mauerhofer, A.M.; Benedikt, F.; Hammerschmid, M.; Bartik, A.; Veress, M.; Haas, R.; Siebenhofer, M.; Resch, G. Reallabor zur Herstellung von Holzdiesel und Holzgas aus Biomasse und Biogenen Reststoffen für die Land- und Forstwirtschaft; TU Wien: Vienna, Austria, 2020; Available online: https://dafne.at/projekte/ftsng-reallabor (accessed on 2 July 2023).
  12. Fuchs, J.; Schmid, J.C.; Müller, S.; Hofbauer, H. Dual fluidized bed gasification of biomass with selective carbon dioxide removal and limestone as bed material: A review. Renew. Sustain. Energy Rev. 2019, 107, 212–231. [Google Scholar] [CrossRef]
  13. Schmid, M.; Beirow, M.; Schweitzer, D.; Waizmann, G.; Spörl, R.; Scheffknecht, G. Product gas composition for steam-oxygen fluidized bed gasification of dried sewage sludge, straw pellets and wood pellets and the influence of limestone as bed material. Biomass Bioenergy 2018, 117, 71–77. [Google Scholar] [CrossRef]
  14. Schmid, M.; Hafner, S.; Scheffknecht, G. Experimental Parameter Study on Synthesis Gas Production by Steam-Oxygen Fluidized Bed Gasification of Sewage Sludge. Appl. Sci. 2021, 11, 579. [Google Scholar] [CrossRef]
  15. Schweitzer, D.; Beirow, M.; Gredinger, A.; Armbrust, N.; Waizmann, G.; Dieter, H.; Scheffknecht, G. Pilot-Scale Demonstration of Oxy-SER steam Gasification: Production of Syngas with Pre-Combustion CO2 Capture. Energy Procedia 2016, 86, 56–68. [Google Scholar] [CrossRef]
  16. Karl, J.; Pröll, T. Steam gasification of biomass in dual fluidized bed gasifiers: A review. Renew. Sustain. Energy Rev. 2018, 98, 64–78. [Google Scholar] [CrossRef]
  17. Kuba, M.; Benedikt, F.; Fürsatz, K.; Fuchs, J.; Demuth, M.; Aichernig, C.; Arpa, L.; Hofbauer, H. Integration of dual fluidized bed steam gasification into the pulp and paper industry. Biomass Convers. Biorefinery 2021. [Google Scholar] [CrossRef]
  18. Loipersböck, J.; Weber, G.; Rauch, R.; Hofbauer, H. Developing an adsorption-based gas cleaning system for a dual fluidized bed gasification process. In Proceedings of the International Conference on Polygeneration Strategies, Vienna, Austria, 18–20 November 2019; Hofbauer, H., Müller, S., Eds.; TU Wien: Vienna, Austria, 2019. [Google Scholar] [CrossRef]
  19. Bardolf, R. Optimierung eines Produktgaswäschers bei der Biomassedampfvergasung im Zweibettwirbelschichtverfahren. Ph.D. Thesis, TU Wien, Vienna, Austria, 2017. [Google Scholar]
  20. Rehling, B. Development of the 1MW Bio-SNG Plant, Evaluation on Technological and Economical Aspects and Upscaling Considerations. Ph.D. Thesis, TU Wien, Vienna, Austria, 2012. [Google Scholar]
  21. Schildhauer, T.J.; Biollaz, S.M.A. Reactors for Catalytic Methanation in the Conversion of Biomass to Synthetic Natural Gas (SNG). Chimia 2015, 69, 603–607. [Google Scholar] [CrossRef] [PubMed]
  22. Seemann, M.C.; Schildhauer, T.J.; Biollaz, S.M.A. Fluidized Bed Methanation of Wood-Derived Producer Gas for the Production of Synthetic Natural Gas. Ind. Eng. Chem. Res. 2010, 49, 7034–7038. [Google Scholar] [CrossRef]
  23. Gruber, H. Synthesis and Refining of Biomass- Derived Fischer-Tropsch Paraffin Waxes. Ph.D. Thesis, TU Wien, Vienna, Austria, 2020. [Google Scholar]
  24. Sauciuc, A.; Abosteif, Z.; Weber, G.; Potetz, A.; Rauch, R.; Hofbauer, H.; Schaub, G.; Dumitrescu, L. Influence of operating conditions on the performance of biomass-based Fischer–Tropsch synthesis. Biomass Convers. Biorefinery 2012, 2, 253–263. [Google Scholar] [CrossRef]
  25. Guilera, J.; Díaz-López, J.A.; Berenguer, A.; Biset-Peiró, M.; Andreu, T. Fischer-Tropsch synthesis: Towards a highly-selective catalyst by lanthanide promotion under relevant CO2 syngas mixtures. Appl. Catal. A Gen. 2022, 629, 118423. [Google Scholar] [CrossRef]
  26. Müller, S.; Groß, P.; Rauch, R.; Zweiler, R.; Aichernig, C.; Fuchs, M.; Hofbauer, H. Production of diesel from biomass and wind power—Energy storage by the use of the Fischer-Tropsch process. Biomass Convers. Biorefinery 2018, 8, 275–282. [Google Scholar] [CrossRef]
  27. Rauch, R.; Hrbek, J.; Hofbauer, H. Biomass gasification for synthesis gas production and applications of the syngas. WIREs Energy Environ. 2014, 3, 343–362. [Google Scholar] [CrossRef]
  28. Thunman, H.; Gustavsson, C.; Larsson, A.; Gunnarsson, I.; Tengberg, F. Economic assessment of advanced biofuel production via gasification using cost data from the GoBiGas plant. Energy Sci. Eng. 2019, 7, 217–229. [Google Scholar] [CrossRef]
  29. Neuling, U.; Kaltschmitt, M. Techno-economic and environmental analysis of aviation biofuels. Fuel Process. Technol. 2018, 171, 54–69. [Google Scholar] [CrossRef]
  30. Jungmeier, G.; Canella, L.; Pucker-Singer, J.; Beermann, M. Geschätzte Treibhausgasemissionen und Primärenergieverbrauch in der Lebenszyklusanalyse von Pkw-basierten Verkehrssystemen; Joanneum Research Forschungsgesellschaft: Graz, Austria, 2019. [Google Scholar]
  31. Österreichische Vereinigung für das Gas- und Wasserfach. Richtlinie G B210—Gasbeschaffenheit: Gas Quality; Österreichische Vereinigung für das Gas- und Wasserfach: Vienna, Austria, 2021; Available online: https://shop.austrian-standards.at/action/de/public/details/697809/OEVGW_G_B210_2021_06 (accessed on 2 July 2023).
  32. DIN EN 15940; Kraftstoffe—Paraffinischer Dieselkraftstoff aus Synthese oder Hydrierungsverfahren—Anforderungen und Prüfverfahren. Beuth Verlag: Berlin, Germany, 2019. Available online: https://www.beuth.de/de/norm/din-en-15940/309170058 (accessed on 2 July 2023).
  33. Österreichischer Biomasseverband. Basidaten 2019 Bioenergie; Österreichischer Biomasseverband: Vienna, Austria, 2019; Available online: https://www.biomasseverband.at/wp-content/uploads/Basisdaten_Bioenergie_2019.pdf (accessed on 2 July 2023).
  34. Dißauer, C.; Rehling, B.; Strasser, C. Machbarkeitsuntersuchung Methan aus Biomasse; Bioenergy 2020+: Wieselburg, Austria, 2019; Available online: https://www.gruenes-gas.at/assets/Uploads/BioEenergy2020+_Machbarkeitsuntersuchung_Methan_aus_Biomasse.pdf (accessed on 2 July 2023).
  35. Hammerschmid, M.; Konrad, J.; Werner, A.; Popov, T.; Müller, S. ENECO2Calc—A Modeling Tool for the Investigation of Energy Transition Paths toward Climate Neutrality within Municipalities. Energies 2022, 15, 7162. [Google Scholar] [CrossRef]
  36. Kranzl, L. Bioenergy—A Key Option within all Energy Sectors. VO Economic Perspectives of Renewable Energy Systems; Energy Economics Group (EEG), TU Wien: Vienna, Austria, 2020. [Google Scholar]
  37. Kranzl, L.; Haas, R.; Kalt, G.; Diesenreiter, F.; Eltrop, L.; König, A.; Makkonen, P. Strategien zur Optimalen Erschließung der Biomassepotenziale in Österreich bis zum Jahr 2050 mit dem Ziel einer Maximalen Reduktion an Treibhausgasemissionen; Energy Economics Group (EEG), TU Wien: Vienna, Austria, 2008. [Google Scholar]
  38. Alamia, A.; Gardarsdòttir, Ò.S.; Larsson, A.; Normann, F.; Thunman, H. Efficiency Comparison of Large-Scale Standalone, Centralized, and Distributed Thermochemical Biorefineries. Energy Technol. 2017, 5, 1435–1448. [Google Scholar] [CrossRef]
  39. Förtsch, D.; Pabst, K.; Groß-Hardt, E. The product distribution in Fischer–Tropsch synthesis: An extension of the ASF model to describe common deviations. Chem. Eng. Sci. 2015, 138, 333–346. [Google Scholar] [CrossRef]
  40. Pratschner, S.; Hammerschmid, M.; Müller, F.J.; Müller, S.; Winter, F. Simulation of a Pilot Scale Power-to-Liquid Plant Producing Synthetic Fuel and Wax by Combining Fischer–Tropsch Synthesis and SOEC. Energies 2022, 15, 4134. [Google Scholar] [CrossRef]
  41. Hammerschmid, M.; Rosenfeld, D.C.; Bartik, A.; Benedikt, F.; Fuchs, J.; Müller, S. Methodology for the Development of Virtual Representations within the Process Development Framework of Energy Plants: From Digital Model to Digital Predictive Twin—A Review. Energies 2023, 16, 2641. [Google Scholar] [CrossRef]
  42. Konstantin, P. Praxisbuch Energiewirtschaft: Energieumwandlung, -Transport und -Beschaffung, Übertragungsnetzausbau und Kernenergieausstieg, 4th ed.; VDI-Buch; Springer Vieweg: Berlin/Heidelberg, Germany, 2017; ISBN 978-3-662-49823-1. [Google Scholar]
  43. Resch, G.; Kranzl, L.; Faninger, G.; Geipel, J. Block 1: Introduction: Energy & climate challenge and basics of economic assessment. In VO Economic Perspectives of Renewable Energy Systems; Energy Economics Group (EEG), TU Wien: Vienna, Austria, 2020. [Google Scholar]
  44. Kost, C.; Shammugam, S.; Jülch, V.; Nguyen, H.-T.; Schlegl, T. Stromgestehungskosten Erneuerbare Energien; Fraunhofer-Institut für solare Energiesysteme (ISE): Freiburg, Germany, 2018. [Google Scholar]
  45. Veress, M. Optimization of a Process Concept for the Industrial Production of Bio-SNG from Low-Grade Fuels. Master’s Thesis, TU Wien, Vienna, Austria, 2020. [Google Scholar]
  46. Peters, M.S.; Timmerhaus, K.D. Plant Design and Economics for Chemical Engineers, 4th ed.; McGraw-Hill Chemical Engineering Series; McGraw-Hill: New York, NY, USA, 1991; ISBN 0-07-049613-7. [Google Scholar]
  47. Wulf, C.; Kaltschmitt, M. Hydrogen Supply Chains for Mobility—Environmental and Economic Assessment. Sustainability 2018, 10, 1699. [Google Scholar] [CrossRef]
  48. Lichtblau, G.; Pölz, W.; Stix, S.; Winter, R. Ökobilanzen Ausgewählter Biotreibstoffe: Projekt proVISION; Umweltbundesamt Österreich: Vienna, Austria, 2012; Available online: https://www.umweltbundesamt.at/fileadmin/site/publikationen/rep0360.pdf (accessed on 2 July 2023).
  49. Federal Environmental Agency Austria. Berechnung von Treibhausgas (THG)-Emissionen verschiedener Energieträger; FEA: Vienna, Austria, 2022. Available online: https://secure.umweltbundesamt.at/co2mon/co2mon.html (accessed on 20 March 2023).
  50. Federal Environmental Agency Germany. ProBas—Prozessorientierte Basisdaten für Umweltmanagementsysteme; FEA Germany: Dessau-Roßlau, Germany, 2015. Available online: https://www.probas.umweltbundesamt.de/php/index.php (accessed on 2 July 2023).
  51. INAS GmbH, Version 4.94. Globales Emissions-Modell Integrierter Systeme (GEMIS). Internationales Institut für Nachhaltigkeitsanalysen und -Strategien: Freiburg, Germany, 2018.
  52. Gollner, M. Gesamtenergiebilanz Österreich 1970 bis 2021; Statistik Austria: Vienna, Austria, 2022; Available online: https://www.statistik.at/web_de/statistiken/energie_umwelt_innovation_mobilitaet/energie_und_umwelt/energie/energiebilanzen/index.html (accessed on 2 July 2023).
  53. Resch, G.; Burgholzer, B.; Totschnig, G.; Lettner, G.; Auer, H.; Geipel, J.; Haas, R. Stromzukunft Österreich 2030: Analyse der Erfordernisse und Konsequenzen eines Ambitionierten Ausbaus von Erneuerbaren Energien; Energy Economics Group (EEG), TU Wien: Vienna, Austria, 2017; Available online: https://www.igwindkraft.at/mmedia/download/2017.07.10/1499698755049626.pdf (accessed on 2 July 2023).
  54. Kranzl, L.; Müller, A.; Büchele, R. Wärmezukunft 2050: Anforderungen an die Gebäudesanierung: Endbericht; Energy Economics Group (EEG), TU Wien: Vienna, Austria, 2018; Available online: https://www.igwindkraft.at/mmedia/download/2018.02.05/1517825327514183.pdf (accessed on 2 July 2023).
  55. Baumann, M.; Fazeni-Fraisl, K.; Kienberger, T.; Nagovnak, P.; Pauritsch, G.; Rosenfeld, D.; Sejkora, C.; Tichler, R. Erneuerbares Gas in Österreich 2040: Quantitative Abschätzung von Nachfrage und Angebot; Bundesministerium für Klimaschutz, Umwelt, Energie, Mobilität, Innovation und Technologie: Vienna, Austria, 2021. Available online: https://www.bmk.gv.at/themen/energie/publikationen/erneuerbares-gas-2040.html (accessed on 2 July 2023).
  56. Terlouw, W.; Peters, D.; van Tilburg, J.; Schimmel, M.; Berg, T.; Cihlar, J.; Ur Rehman Mir, G.; Spöttle, M.; Staats, M.; Lejaretta, A.V.; et al. Gas for Climate: The Optimal Role for Gas in a Net-Zero Emissions Energy System; Navigant: Utrecht, The Netherlands, 2019; Available online: https://gasforclimate2050.eu/wp-content/uploads/2020/03/Navigant-Gas-for-Climate-The-optimal-role-for-gas-in-a-net-zero-emissions-energy-system-March-2019.pdf (accessed on 2 July 2023).
  57. Götz, M.; Lefebvre, J.; Mörs, F.; Koch, A.M.; Graf, F.; Bajohr, S.; Reimert, R.; Kolb, T. Renewable Power-to-Gas: A technological and economic review. Renew. Energy 2016, 85, 1371–1390. [Google Scholar] [CrossRef]
  58. Maniatis, K.; Landälv, I.; Waldheim, L.; van den Heuvel, E.; Kalligeros, S. Final Report—Building up the Future: Sub Group on Advanced Biofeuls—Sustainable Transport Forum; European Comission: Luxembourg, 2017; ISBN 978-92-79-69010-5. [Google Scholar]
  59. Pratschner, S.; Hammerschmid, M.; Müller, S.; Winter, F. Converting CO2 and H2O into Fischer-Tropsch Products—A Techno-economic assessment. In Proceedings of the 27th International Symposium for Chemical Reaction Engineering—ISCRE 27, Quebec City, QC, Canada, 11–14 June 2023. [Google Scholar]
  60. Jungmeier, G. Umweltbilanz von E-Fuels—Vergleich mit anderen Treibstoffen im Lebenszyklus. In Proceedings of the ÖGEW/DGMK Onlinekonferenz „Innovative Energieversorgung“, Graz, Austria, 13 November 2020; Available online: https://www.wko.at/site/oegew/veranstaltungen/umweltbilanz-von-e-fuels.pdf (accessed on 2 July 2023).
  61. Aichmayer, S.; Mitterhuemer, R.; Winter, R. Biokraftstoffe im Verkehrssektor 2021; Bundesministerium für Klimaschutz, Umwelt, Energie, Mobilität, Innovation und Technologie: Vienna, Austria, 2021; Available online: https://www.biokraft-austria.at/media/18119/biokraftstoffbericht_2021.pdf (accessed on 2 July 2023).
  62. Pratschner, S.; Hammerschmid, M.; Müller, S.; Winter, F. CO2 Footprint of Fischer-Tropsch Products produced by a Power-to-Liquid Plant. In Proceedings of the 15th Mediterranean Congress of Chemical Engineering—MECCE 2023, Barcelona, Spain, 30 May–2 June 2023. [Google Scholar]
  63. European Union. Directive (EU) 2018/2001 of the European Parliament and of the Council of 11 December 2018 on the Promotion of the Use of Energy from Renewable Sources, RED II. Off. J. Eur. Union 2018, L 328/82. Available online: https://eur-lex.europa.eu/legal-content/DE/TXT/?qid=1575559881403&uri=CELEX:32018L2001 (accessed on 12 May 2021).
  64. Bundesrepublik Österreich. Erneuerbaren-Ausbau-Gesetz, EAG. 2021. Available online: https://www.parlament.gv.at/PAKT/VHG/XXVII/I/I_00733/index.shtml (accessed on 12 August 2021).
  65. Ringhofer, T. Evaluierung des Biomassetrockners der Kraft-Wärme-Kopplungsanlage Oberwart. Bachelor’s Thesis, TU Wien, Vienna, Austria, 2011. [Google Scholar]
  66. Müller, S. Hydrogen from Biomass for Industry—Industrial Application of Hydrogen Production Based on Dual Fluid Gasification. Ph.D. Thesis, TU Wien, Vienna, Austria, 2013. [Google Scholar]
  67. Benedikt, F.; Fuchs, J.; Schmid, J.C.; Müller, S.; Hofbauer, H. Advanced dual fluidized bed steam gasification of wood and lignite with calcite as bed material. Korean J. Chem. Eng. 2017, 34, 2548–2558. [Google Scholar] [CrossRef]
  68. Benedikt, F.; Müller, S.; Hofbauer, H. 1 MW scale-up of the advanced fuel flexible dual fluidized bed steam gasification process by process simulation. In Proceedings of the ICPS19—International Conference on Polygeneration Strategies, Vienna, Austria, 18–20 November 2019; ISBN 978-3-9503671-1-9. [Google Scholar]
  69. Wolfesberger, U. Profiling Tar Behavior in Dual Fluidized Bed Biomass Steam Gasification. Ph.D. Thesis, TU Wien, Vienna, Austria, 2013. [Google Scholar]
  70. Hofbauer, H.; Rauch, R.; Bosch, K.; Koch, R.; Aichernig, C. Biomass CHP plant Güssing—A success story. In Proceedings of the Pyrolysis and Gasification of Biomass and Waste—Expert Meeting, Strasbourg, France, 30 September–1 October 2002. [Google Scholar]
  71. Pröll, T.; Siefert, I.G.; Friedl, A.; Hofbauer, H. Removal of NH3 from Biomass Gasification Producer Gas by Water Condensing in an Organic Solvent Scrubber. Ind. Eng. Chem. Res. 2005, 44, 1576–1584. [Google Scholar] [CrossRef]
  72. Stidl, M. Prozesssimulation von spezifischen Anwendungsfällen der Zweibett-Wirbelschicht-Dampfvergasungs-Technologie für die Papier- und Zellstoffindustrie. Ph.D. Thesis, TU Wien, Vienna, Austria, 2012. [Google Scholar]
  73. Sadegh, A.M.; Worek, W.M. Marks’ Standard Handbook for Mechanical Engineers, 12th ed.; McGraw-Hill Education: New York, NY, USA, 2018; ISBN 9781259588518. [Google Scholar]
  74. Broer, K.M.; Woolcock, P.J.; Johnston, P.A.; Brown, R.C. Steam/oxygen gasification system for the production of clean syngas from switchgrass. Fuel 2015, 140, 282–292. [Google Scholar] [CrossRef]
  75. Bartik, A.; Fuchs, J.; Pacholik, G.; Föttinger, K.; Hofbauer, H.; Müller, S.; Benedikt, F. Experimental investiga-tion on the methanation of hydrogen-rich syngas in a bubbling fluidized bed reactor utilizing an optimized catalyst. Fuel Process. Technol. 2022, 237, 107402. [Google Scholar] [CrossRef]
  76. Li, K.; Leigh, W.; Feron, P.; Yu, H.; Tade, M. Systematic study of aqueous monoethanolamine (MEA)-based CO2 capture process: Techno-economic assessment of the MEA process and its improvements. Appl. Energy 2016, 165, 648–659. [Google Scholar] [CrossRef]
  77. Günther, L. Biomethanreinigung mit der Drucklosen Wäsche zur Herstellung von Biomethan und Kohlendioxid. Fachtagung “Innogas”; DGE GmbH Presentation: Wittenberg, Germany, 2007; Available online: https://www.dge-wittenberg.de/vortraege/DGE%20Fachtagung%20WB%202006.pdf (accessed on 2 July 2023).
  78. Neagu, M.; Cursaru, D.L. Technical and economic evaluations of the triethylene glycol regeneration processes in natural gas dehydration plants. J. Nat. Gas Sci. Eng. 2017, 37, 327–340. [Google Scholar] [CrossRef]
  79. Kidnay, A.J.; Parrish, W.R.; McCartney, D.G. Fundamentals of Natural Gas Processing; CRC Press: Boca Raton, FL, USA, 2019; ISBN 9780429464942. [Google Scholar]
  80. Gruber, H.; Groß, P.; Rauch, R.; Reichhold, A.; Zweiler, R.; Aichernig, C.; Müller, S.; Ataimisch, N.; Hofbauer, H. Fischer-Tropsch products from biomass-derived syngas and renewable hydrogen. Biomass Convers. Biorefinery 2019, 48, 22. [Google Scholar] [CrossRef]
  81. De Klerk, A. Fischer-Tropsch Refining; Wiley-VCH Verlag GmbH & Co. KGaA: Weinheim, Germany, 2011; ISBN 9783527635603. [Google Scholar]
  82. Schädel, B.T.; Duisberg, M.; Deutschmann, O. Steam reforming of methane, ethane, propane, butane, and natural gas over a rhodium-based catalyst. Catal. Today 2009, 142, 42–51. [Google Scholar] [CrossRef]
  83. Ali, S.; Sørensen, K.; Nielsen, M.P. Modeling a novel combined solid oxide electrolysis cell (SOEC)—Biomass gasification renewable methanol production system. Renew. Energy 2020, 154, 1025–1034. [Google Scholar] [CrossRef]
  84. Clariant International Ltd. Catalysts and Adsorbents for Syngas; Clariant International Ltd.: Muttenz, Switzerland, 2017; Available online: https://de.scribd.com/document/477562978/Clariant-Brochure-Catalysts-And-Adsorbents-For-Syngas-2017-EN-1 (accessed on 2 July 2023).
  85. Petersen, A.M.; Chireshe, F.; Okoro, O.; Gorgens, J.; van Dyk, J. Evaluating refinery configurations for deriving sustainable aviation fuel from ethanol or syncrude. Fuel Process. Technol. 2021, 219, 106879. [Google Scholar] [CrossRef]
  86. Fahim, M.A. Fundamentals of Petroleum Refining; Elsevier Science & Technology: Oxford, UK, 2010; ISBN 978-0-444-52785-1. [Google Scholar]
  87. De Klerk, A. Can Fischer–Tropsch Syncrude Be Refined to On-Specification Diesel Fuel? Energy Fuels 2009, 23, 4593–4604. [Google Scholar] [CrossRef]
  88. Kang, J.; Ma, W.; Keogh, R.A.; Shafer, W.D.; Jacobs, G.; Davis, B.H. Hydrocracking and Hydroisomerization of n-Hexadecane, n-Octacosane and Fischer–Tropsch Wax Over a Pt/SiO2–Al2O3 Catalyst. Catal. Lett. 2012, 142, 1295–1305. [Google Scholar] [CrossRef]
  89. Murali, C.; Voolapalli, R.K.; Ravichander, N.; Gokak, D.T.; Choudary, N.V. Trickle bed reactor model to simulate the performance of commercial diesel hydrotreating unit. Fuel 2007, 86, 1176–1184. [Google Scholar] [CrossRef]
  90. Busca, G. Heterogeneous Catalytic Materials; Elsevier: Amsterdam, The Netherlands, 2014; ISBN 978-0-444-59524-9. [Google Scholar]
  91. Mauerhofer, A.M.; Schmid, J.C.; Benedikt, F.; Fuchs, J.; Müller, S.; Hofbauer, H. Dual fluidized bed steam gasification: Change of product gas quality along the reactor height. Energy 2019, 173, 1256–1272. [Google Scholar] [CrossRef]
  92. Schmid, J.C. Technoökonomische Fallstudien als Entscheidungsunterstützung für das Strategische Management. Master’s Thesis, Fachhochschule Burgenland, Eisenstadt, Austria, 2016. [Google Scholar]
  93. E-Control. Gaspreisentwicklung; E-Control: Vienna, Austria, 2022; Available online: https://www.e-control.at/statistik/gas/marktstatistik/preisentwicklung (accessed on 10 August 2022).
  94. E-Control. Strom- und Gaspreise in Österreich; E-Control: Vienna, Austria, 2022; Available online: https://www.e-control.at/preismonitor (accessed on 10 August 2022).
  95. Bundesministerium für Klimaschutz, Umwelt, Energie, Mobilität, Innovation und Technologie. Treibstoffpreise aktuell. Bundesministerium für Klimaschutz, Umwelt, Energie, Mobilität, Innovation und Technologie: Vienna, Austria, 2022. Available online: https://www.bmk.gv.at/themen/energie/preise/aktuelle_preise.html (accessed on 15 October 2022).
  96. Deutsche Börse; Diesel: Frankfurt, Germany, 2022; Available online: https://www.boerse.de/charts/Dieselpreis/XC0009677813 (accessed on 15 October 2022).
  97. Statistik Austria. Erzeugerpreisindex Produzierender Bereich—Österreich. Vienna, Austria; 2022. Available online: https://www.statistik.at/statistiken/volkswirtschaft-und-oeffentliche-finanzen/preise-und-preisindizes/erzeugerpreisindex-produzierender-bereich (accessed on 10 August 2022).
  98. Meehan, J. Europe Monoethanolamine Prices Move Down on Import Pressure. 2013. Available online: https://www.icis.com/explore/resources/news/2013/06/19/9680122/europe-monoethanolamine-prices-move-down-on-import-pressure/ (accessed on 13 December 2019).
  99. Billig, E. DBFZ Report Nr. 26. Ph.D. Thesis, Universität Leipzig, Helmholtz-Zentrum für Umweltforschung, Leipzig, Germany, 2016. [Google Scholar]
  100. Thrän, D.; Pfeiffer, D. Methodenhandbuch: Stoffstromorientierte Bilanzierung der Klimagaseffekte. Energetische Biomassenutzung 2013, 2013, 4. [Google Scholar]
  101. European Energy Exchange AG (EEX). EEX EUA Spot Market—CO2 Emission Allowances; EEX: Leipzig, Germany, 2022; Available online: https://www.eex.com/de/marktdaten/umweltprodukte/spot (accessed on 15 October 2022).
  102. E-Control. Strompreisentwicklung; E-Control: Vienna, Austria, 2022; Available online: https://www.e-control.at/statistik/strom/marktstatistik/preisentwicklung (accessed on 10 August 2022).
  103. Godula-Jopek, A.; Stolten, D. Hydrogen Production: By Electrolysis, 1st ed.; Wiley-VCH: Weinheim, Germany, 2015; ISBN 9783527676507. [Google Scholar]
  104. Goritschnig, M.; Kreuter, K.; Novakovits, P.; Pomper, M.; Zweiler, R. Winddiesel_klienIF: Untersuchung des Lastwechselverhaltens eines Slurryreaktors zur Einkopplung von H2 und Produktion von FT-Diesel. Güssing Energy Technologies. 2017. Available online: https://www.winddiesel.at/images/Downloads/13003-BB008a_Winddiesel_kurzfassung.pdf (accessed on 15 October 2022).
  105. Perry, R.H.; Green, D.W.; Maloney, J.O. Perry’s Chemical Engineers’ Handbook, 7th ed.; McGraw-Hill: New York, NY, USA, 1997; ISBN 0070498415. [Google Scholar]
  106. Batidzirai, B.; Shotman, G.S.; van der Spek, M.W.; Junginger, M.; Faaij, A.P.C. Techno-economic performance of sustainable international bio-SNG production and supply chains on short and longer term. Biofuels Bioprod. Biorefining 2019, 13, 325–357. [Google Scholar] [CrossRef]
  107. Brasington, R.D.; Haslbeck, J.L.; Kuehn, N.J.; Lewis, E.G.; Pinkerton, L.L.; Turner, M.; Varghese, E.; Woods, M. Cost and Performance Baseline for Fossil Energy Plants: Volume 2, Coal to Synthetic Natural Gas and Ammonia; DOE/NETL-2010/1402; Report for the U.S. Department of Energy; National Energy Technology Laboratory by the Research and Development Solutions, LLC (RDS): Morgantown, WV, USA, 2011.
  108. Heyne, S.; Harvey, S. Impact of choice of CO2 separation technology on thermo-economic performance of Bio-SNG production processes. Int. J. Energy Res. 2014, 38, 299–318. [Google Scholar] [CrossRef]
  109. Arvidsson, M.; Morandin, M.; Harvey, S. Biomass gasification-based syngas production for a conventional oxo synthesis plant—Greenhouse gas emission balances and economic evaluation. J. Clean. Prod. 2015, 99, 192–205. [Google Scholar] [CrossRef]
  110. Holmgren, K.M. Investment Cost Estimates for Gasification- Based Biofuel Production Systems; IVL Swedish Environmental Research Institute: Stockholm, Sweden, 2015; Available online: https://www.ivl.se/download/18.694ca0617a1de98f472a45/1628413810159/FULLTEXT01.pdf (accessed on 2 July 2023).
  111. Federal Environmental Agency Germany. ProBas—Xtra-AbbauQuarzsand-DE-2030; Federal Environmental Agency Germany: Dessau-Roßlau, Germany, 2008. Available online: https://www.probas.umweltbundesamt.de/php/prozessdetails.php?id=%7b843DA94D-BDA7-442E-A9A3-B80D8B40E66F%7d (accessed on 20 March 2023).
  112. Federal Environmental Agency Germany. ProBas—LKW oder Lastzug; Federal Environmental Agency Germany: Dessau-Roßlau, Germany, 2010. Available online: https://www.probas.umweltbundesamt.de/php/prozessdetails.php?id=%7b539F70D8-E544-FE35-BBCA-700578003269%7d (accessed on 20 March 2023).
  113. Federal Environmental Agency Germany. ProBas—BioRaff-IIRME-DE-2020/brutto; Federal Environmental Agency Germany: Dessau-Roßlau, Germany, 2011. Available online: https://www.probas.umweltbundesamt.de/php/prozessdetails.php?id={35FD7B45-BBDF-4D1B-BEE6-7EEAA29BFDAE} (accessed on 20 March 2023).
  114. Jekel, M.; Baur, N.; Böckelmann, U.; Dünnbier, U.; Eckhardt, A.; Gnirß, R.; Grummt, T.; Hummelt, D.; Lucke, T.; Meinel, F.; et al. Anthropogene Spurenstoffe und Krankheitserreger im Urbanen Wasserkreislauf; Universitätsverlag der TU Berlin: Berlin, Germany, 2016; ISBN 978-3-7983-2815-0. [Google Scholar]
  115. Federal Environmental Agency Germany. ProBas—Zink; Federal Environmental Agency Germany: Dessau-Roßlau, Germany, 2008. Available online: https://www.probas.umweltbundesamt.de/php/prozessdetails.php?id=%7b50476E3A-C90A-4AE4-A1FB-3BC08579E219%7d (accessed on 20 March 2023).
  116. Federal Environmental Agency Germany. ProBas—MetallNickel-DE-2020; Federal Environmental Agency Germany: Dessau-Roßlau, Germany, 2008. Available online: https://www.probas.umweltbundesamt.de/php/prozessdetails.php?id=%7b65C51F09-9F88-4D3C-8858-CFBCACF98D53%7d (accessed on 20 March 2023).
  117. Federal Environmental Agency Germany. ProBas—AufbereitungTonerde-DE-2020; Federal Environmental Agency Germany: Dessau-Roßlau, Germany, 2010. Available online: https://www.probas.umweltbundesamt.de/php/prozessdetails.php?id={9DFA17E4-264F-459F-90D0-8EDF677F1BC0} (accessed on 20 March 2023).
  118. Federal Environmental Agency Germany. ProBas—Kobalt; Federal Environmental Agency Germany: Dessau-Roßlau, Germany, 2008. Available online: https://www.probas.umweltbundesamt.de/php/prozessdetails.php?id={81A717DC-DA5B-4EDC-A754-03331A829E4F} (accessed on 20 March 2023).
  119. Federal Environmental Agency Germany. ProBas—EdelmetallPt-primär-mix-Welt; Federal Environmental Agency Germany: Dessau-Roßlau, Germany, 2008. Available online: https://www.probas.umweltbundesamt.de/php/prozessdetails.php?id={0E0B2A95-9043-11D3-B2C8-0080C8941B49} (accessed on 20 March 2023).
  120. Federal Environmental Agency Germany. ProBas—Quarz, Quarzite; Federal Environmental Agency Germany: Dessau-Roßlau, Germany, 2008. Available online: https://www.probas.umweltbundesamt.de/php/prozessdetails.php?id={9E9C7D4E-6240-4BF8-823A-D80C0F0C257B} (accessed on 20 March 2023).
  121. Federal Environmental Agency Germany. ProBas—Trimethylamin; Federal Environmental Agency Germany: Dessau-Roßlau, Germany, 2008. Available online: https://www.probas.umweltbundesamt.de/php/prozessdetails.php?id=%7bCC66D615-2F74-4C6C-8EDA-74119209C218%7d (accessed on 20 March 2023).
  122. Federal Environmental Agency Germany. ProBas—Chem-OrgPEG+DPM (Hochrein); Federal Environmental Agency Germany: Dessau-Roßlau, Germany, 2011. Available online: https://www.probas.umweltbundesamt.de/php/prozessdetails.php?id=%7b150EFBAB-DBA6-4752-BF86-FB34F95A1B3C%7d (accessed on 20 March 2023).
  123. NREL. H2A: Hydrogen Analysis Production Models: Case Studies 2018; National Renewable Energy Laboratory: Denver, CO, USA, 2018. Available online: https://www.nrel.gov/hydrogen/h2a-production-models.html (accessed on 28 June 2021).
  124. Federal Environmental Agency Germany. ProBas—MetallStahl-Profile-85%Recycling-Welt-2005; Federal Environmental Agency Germany: Dessau-Roßlau, Germany, 2012. Available online: https://www.probas.umweltbundesamt.de/php/prozessdetails.php?id={E0B82461-4166-4CFB-9F80-3EDFBF6B858C} (accessed on 20 March 2023).
  125. Federal Environmental Agency Germany. ProBas—Stahl; Federal Environmental Agency Germany: Dessau-Roßlau, Germany, 2008. Available online: https://www.probas.umweltbundesamt.de/php/prozessdetails.php?id={19E7D6CB-2337-4ED1-A096-3DF3961DDA87} (accessed on 20 March 2023).
  126. Federal Environmental Agency Germany. ProBas—Beton; Federal Environmental Agency Germany: Dessau-Roßlau, Germany, 2012. Available online: https://www.probas.umweltbundesamt.de/php/prozessdetails.php?id={707E23CA-304F-485C-83A6-90C0A0F1BAA6} (accessed on 20 March 2023).
  127. Wirtschaftskammer Österreich. Statistisches Jahrbuch 2023; Wirtschaftskammer Österreich: Vienna, Austria, 2023; Available online: https://www.wko.at/service/zahlen-daten-fakten/statistisches-jahrbuch.html (accessed on 2 July 2023).
  128. Gollner, M. Nutzenergieanalyse 1993–2021; Statistik Austria: Vienna, Austria, 2022; Available online: https://www.statistik.at/statistiken/energie-und-umwelt/energie/nutzenergieanalyse (accessed on 2 July 2023).
  129. Turner, J.; Winkler, G.; Swoboda, G. Statistiken Sonderheft: Einkommen, Konsum und Vermögen der Haushalte—Sektorale Volkswirtschaftliche Gesamtrechnungen in den Letzten 20 Jahren; Oesterreichische Nationalbank: Vienna, Austria, 2022. Available online: https://www.oenb.at/Publikationen/Statistik/Statistiken-Sonderhefte/2022/sektorale-vgr.html (accessed on 2 July 2023).
  130. Fichtinger, M.; Grohall, G.; Helmenstein, C.; Schitnig, H.; Sengschmid, E.; Zalesak, M. Die volkswirtschaftliche Bedeutung des österreichischen Logistiksektors: Studie im Auftrag der Wirtschaftskammer Österreich—Sparte Transport und Verkehr, der Vereinigung der Österreichischen Industrie und des Zentralverbandes Spedition & Logistik; Economica GmbH: Vienna, Austria, 2022; Available online: https://news.wko.at/news/oesterreich/221115-Logistik-Studienbericht-EconomicaG.pdf (accessed on 2 July 2023).
Figure 1. Simplified process flow diagram of the 100 MWth FT and SNG routes (note: FT and SNG production are standalone routes but are displayed together in this picture).
Energies 16 06097 g001
Figure 2. Methodology for the calculation of total capital investment costs [11,45].
Energies 16 06097 g002
Figure 3. Comparison of production costs of wood-based SNG with the market price of fossil counterparts based on the years 2019 and 2022.
Energies 16 06097 g003
Figure 4. Comparison of production costs of wood-based SNG with RES alternatives (left, base year 2019) [56,57] and sensitivity analysis of production costs of wood-based SNG (right, base year 2022).
Energies 16 06097 g004
Figure 5. Comparison of wood-based FT diesel production costs with market price of fossil counterpart based on the years 2019 and 2022.
Energies 16 06097 g005
Figure 6. Comparison of wood-based FT diesel production costs with RES alternatives (left, base year 2019) [58,59] and sensitivity analysis of production costs FT diesel (right, base year 2022).
Energies 16 06097 g006
Figure 7. Breakdown of the CO2 footprint of wood-based SNG (left) and comparison with fossil and RES alternatives (right) [30,49,60].
Energies 16 06097 g007
Figure 8. Breakdown of the CO2 footprint of wood-based FT diesel (left) and comparison with fossil and RES alternatives (right) [49,61,62].
Energies 16 06097 g008
Figure 9. Annual Austrian energy demand for natural gas (left) and diesel (right) in 2021 compared to the SNG and FT diesel potential in 2050.
Energies 16 06097 g009
Table 1. Analysis of reduced technical biomass potential in 2050.
Property Classes
and Components
Additional Technical Biomass Potential 2050
(Study Dißauer et al. [34])
Additional Technical
Biomass Potential 2050
(Study Biomass Association [33])
Additional Technical Biomass Potential 2050
Scenario “High” and “Biomasse Max”
(Study Kranzl et al. [37])
Additional Reduced Technical Biomass Potential 2050
(Present Study)
Woody biomass126 PJ/a50 PJ/a110 PJ/a75 PJ/a
Agricultural raw materials and residues126 PJ/a200 PJ/a100 PJ/a80 PJ/a
Other biogenic residues and waste67 PJ/a50 PJ/a10 PJ/a30 PJ/a
Table 2. Input and output streams for producing wood-based SNG related to a thermal fuel power of 100 MW.
Plant InputPlant Output
Input StreamUnitValueOutput StreamUnitValue
Biomass (wood)kg/h33,250Synthetic natural gasNm3/h6840
kWbefore drying94,360kW64,960
kWafter drying100,000District heatkW14,170
Fresh bed material (80% olivine and
20% limestone)
kg/h150Captured CO2 for storage or utilizationNm3/h6150
Fresh scrubber solvent (rapeseed methyl ester)kg/h110Ash and dustkg/h350
Fresh amine (monoethanolamine)kg/h18.4Waste waterkg/h320
Fresh glycolkg/h0.1
ElectricitykW4340
Table 3. Input and output streams for producing wood-based FT diesel related to thermal fuel power of 100 MW.
Plant InputPlant Output
Input StreamUnitValueOutput StreamUnitValue
Biomass (wood)kg/h33,250FT dieselL/h3850
kWbefore drying94,360kW36,563
kWafter drying100,000FT naphthaL/h2000
Fresh bed material (80% olivine and
20% limestone)
kg/h150kW17,561
Fresh scrubber solvent (rapeseed methyl ester)kg/h110District heatkW22,823
Fresh amine (monoethanolamine)kg/h11.5Captured CO2 for storage or utilizationNm3/h3790
Hydrogen (for hydrocracking and hydrotreating)kg/h26.3Ash and dustkg/h350
ElectricitykW6120Waste waterkg/h2635
Table 4. Comparison of possible implementation scenarios of biomass-based SNG and FT diesel in the Austrian energy system.
Implementation ScenariosNatural Gas or Diesel Demand in 2050Substituted Natural Gas or Diesel Demand in 2050Additionally Produced
by-Products
Sectoral CO2 Reduction PotentialEconomic Competitiveness (Change of
Sectoral GVA)
Possible
Renewable Alternatives
20192022
SNG use in
energy sector
110 PJ/a 1110 PJ/a24 PJ/a district heat89.1%−12.4%−0.5%Peak-load power coverage
  • increased interconnection to the European power grid
  • additional storage facilities
  • sector coupling
Provision of district heat
  • heat pumps
  • biomass heating plants
  • solar thermal systems
  • waste heat utilization
  • hydrogen
SNG use in private and public sector (without mobility)85 PJ/a 185 PJ/a18.5 PJ/a district heat70.6%0%8.6%Provision of decentral heat
  • heat pumps
  • solar thermal systems
  • wood-fired boilers
  • district heat
SNG use in
industry
128 PJ/a 1120 PJ/a26.2 PJ/a district heat30.3%−2.0%−0.1%
  • Provision of high-temperature heat
  • waste heat recovery
  • hydrogen
  • high-temperature heat pumps
FT diesel in private and public transport61.5 PJ/a 261.5 PJ/a38.4 PJ/a district heatand 29.6 PJ/a
FT naphtha
40.2%−0.2%0.2%Alternative mobility options
  • battery electric vehicles
  • fuel cell electric vehicles
  • hydrogenated vegetable oil
  • e-fuels
FT diesel in
heavy-duty traffic
119 PJ/a 267.5 PJ/a42.2 PJ/a district heatand 32.5 PJ/a
FT naphtha
58.5%−1.8%−0.8%Alternative mobility options
  • battery electric vehicles (limited)
  • fuel cell electric vehicles
  • hydrogenated vegetable oil
  • e-fuels
  • compressed natural gas vehicles
FT diesel in
heat and power
9 PJ/a 39 PJ/a5.5 PJ/a district heat and4.2 PJ/a
FT naphtha
2.6%−0.1%−0.1%Provision of high-temperature heat
  • wood-fired boilers
  • waste heat recovery
  • hydrogen
  • high-temperature heat pumps (limited usability)
1 gas demand remains constant until 2050. 2 diesel demand for cars and LCV was reduced by half compared to 2021, because of vehicle fleet predictions [35]/diesel demand for busses and other heavy-duty traffic vehicles remain constant until 2050. 3 diesel demand for aggregates in public and private sector was reduced by half compared to 2021/diesel demand in manufacturing remains constant until 2050.
Disclaimer/Publisher’s Note: The statements, opinions and data contained in all publications are solely those of the individual author(s) and contributor(s) and not of MDPI and/or the editor(s). MDPI and/or the editor(s) disclaim responsibility for any injury to people or property resulting from any ideas, methods, instructions or products referred to in the content.

