Article

The Impact of Hydrogen on Flame Characteristics and Pollutant Emissions in Natural Gas Industrial Combustion Systems

1
School of Engineering, Shanghai Ocean University, Shanghai 201306, China
2
Shanghai Marine Renewable Energy Engineering Technology Research Center, Shanghai 201306, China
3
Pulin Zhike (Shanghai) Technology Co., Ltd., Shanghai 201306, China
*
Author to whom correspondence should be addressed.
Energies 2024, 17(19), 4959; https://doi.org/10.3390/en17194959
Submission received: 9 September 2024 / Revised: 27 September 2024 / Accepted: 1 October 2024 / Published: 3 October 2024
(This article belongs to the Special Issue Advanced Combustion Technologies and Emission Control)

Abstract

:
To improve energy savings and emission reduction in industrial heating furnaces, this study investigated the impact of various molar fractions of hydrogen on natural gas combustion and compared the results of the Non-Premixed Combustion Model with the Eddy Dissipation Combustion Model. Initially, natural gas combustion in an industrial heating furnace was investigated experimentally, and these results were used as boundary conditions for CFD simulations. The diffusion flame and combustion characteristics of natural gas were simulated using both the non-premixed combustion model and the Eddy Dissipation Combustion Model. The results indicated that the Non-Premixed Combustion Model provided simulations more consistent with experimental data, within acceptable error margins, thus validating the accuracy of the numerical simulations. Additionally, to analyze the impact of hydrogen doping on the performance of an industrial gas heater, four gas mixtures with varying hydrogen contents (15% H2, 30% H2, 45% H2, and 60% H2) were studied while maintaining constant fuel inlet temperature and flow rate. The results demonstrate that the Non-Premixed Combustion Model more accurately simulates complex flue gas flow and chemical reactions during combustion. Moreover, hydrogen-doped natural gas significantly reduces CO and CO2 emissions compared to pure natural gas combustion. Specifically, at 60% hydrogen content, CO and CO2 levels decrease by 70% and 37.5%, respectively, while NO emissions increase proportionally; at this hydrogen content, NO concentration in the furnace chamber rises by 155%.

1. Introduction

As primary energy-consuming equipment in the petrochemical and iron and steel industries, improving combustion efficiency and reducing pollutant emissions from heating furnaces have become key research areas. The structure of the burner and the angle of the fuel flow jet have a significant impact on the thermal efficiency of the heating furnace [1]. Burner nozzle angle, atomization performance, and flue gas waste heat recovery technology are critical for significantly improving the thermal efficiency of the heating furnace system [2,3]. Mu Lianbo et al. [4] investigated the effects of flue gas temperature and pressure drop on energy savings and emission reductions across varying combustion air temperatures, humidity levels, and excess air coefficients in refinery heating furnaces. Their findings demonstrated that lowering the flue gas temperature to 40 °C resulted in optimal energy savings while reducing the flue gas pressure drop substantially enhanced waste heat utilization.
Nitric oxide, a major contributor to photochemical smog and acid rain, remains a critical focus in energy conservation and emission reduction efforts for industrial heating furnaces [5]. He Zhao et al. [6] determined that, while increasing methane content had minimal impact on thermal performance, NO emissions were significantly reduced. This conclusion was reached through an investigation of methane and ammonia gas mixtures in a miniature combustion chamber. Nhan et al. [7] explored the impact of flue gas recirculation techniques on NO emissions in medium to large combustion systems using the RANS CFD method, observing a significant reduction in NO emissions. Nada et al. [8] examined the effects of burner fuel nozzle and oxidizer nozzle spacing on combustion performance and NOx formation, finding that increased nozzle spacing resulted in reduced NOx emissions within reasonable limits. Swaminathan [9] developed and validated a numerical model using the GRI 3.0 chemical mechanism, showing its effectiveness in reducing NOx emissions by adjusting the mass flow rate ratio between the primary and secondary air streams. Ortolani et al. [10] employed the Reynolds stress model for turbulence closure analysis to investigate the impact of different burner thermal powers on flue gas and pollutant emissions. Their results revealed that at high powers, significant NOx formation occurs where the oxidizer interacts with the high-temperature fuel stream. Chen Jun et al. [11] utilized a novel preheating device to investigate the effect of the air excess coefficient on NO emissions in a non-premixed ammonia jet flame. Their results demonstrated that NO emissions increased with the air excess coefficient.
The development of renewable energy sources, particularly hydrogen energy, is increasingly recognized as a crucial energy strategy for countries with high energy demands. As natural gas pipeline infrastructure for hydrogen storage and transportation matures, the process of hydrogen doping in natural gas has garnered significant attention [12,13]. Huang et al. [14] found that hydrogen combustion occurs in four distinct stages—the growth stage, the stabilization stage, the spreading stage, and the self-extinguishing stage—and that the combustion rate increases with temperature by studying the hydrogen jet flame. Sekar et al. [15] demonstrated through numerical simulations that hydrogen doping increases turbulence intensity and turbulent kinetic energy in the combustion chamber, thereby improving combustion efficiency. Cellek et al. [16] conducted numerical simulations of an industrial low-swirl burner using the swirl dissipation method, analyzing the effects of natural gas and pure hydrogen on burner performance and pollutant emissions. Yang Huan et al. [17] found that mixing CO2 with hydrogen-rich methane significantly reduces NO emissions. Their study on the mixed combustion of waste gas and hydrogen-rich methane offers a theoretical foundation for recycling technology. Xu Shunta et al. [18] investigated NO emissions during hydrogen-rich natural gas combustion using the graded MILD combustion technique, finding NO reductions of 67.4% in air MILD and 52.4% in fuel MILD graded combustion.
Current research on the combustion characteristics and pollutant emissions of traditional heating furnaces is comprehensive. However, research on the combustion of hydrogen-enriched natural gas mixtures remains underdeveloped. This paper aims to improve the optimization of heating furnace performance by focusing on the combustion simulation of natural gas and hydrogen at various mixing ratios, with the goal of clarifying temperature fields and pollutant distributions.

2. Materials and Methods

2.1. Geometric Model

The experimental component was conducted with natural gas to validate the numerical results. The experimental setup, as illustrated in Figure 1a, includes the heating furnace unit and the flue gas waste heat recovery unit. The numerical model focuses on the boiler and burner structures. Each burner is equipped with nine fuel nozzles and a circular oxidant air inlet (diameter: 225 mm). The central fuel nozzle has a pipeline diameter of 28 mm and includes 8 circular outlets (diameter: 4 mm, radial angle: 45°). The remaining 8 fuel nozzles are evenly distributed around the burner, each with a pipe diameter of 14 mm and a radial angle of 45° (Figure 1b).

2.2. Numerical Methods and Boundary Condition

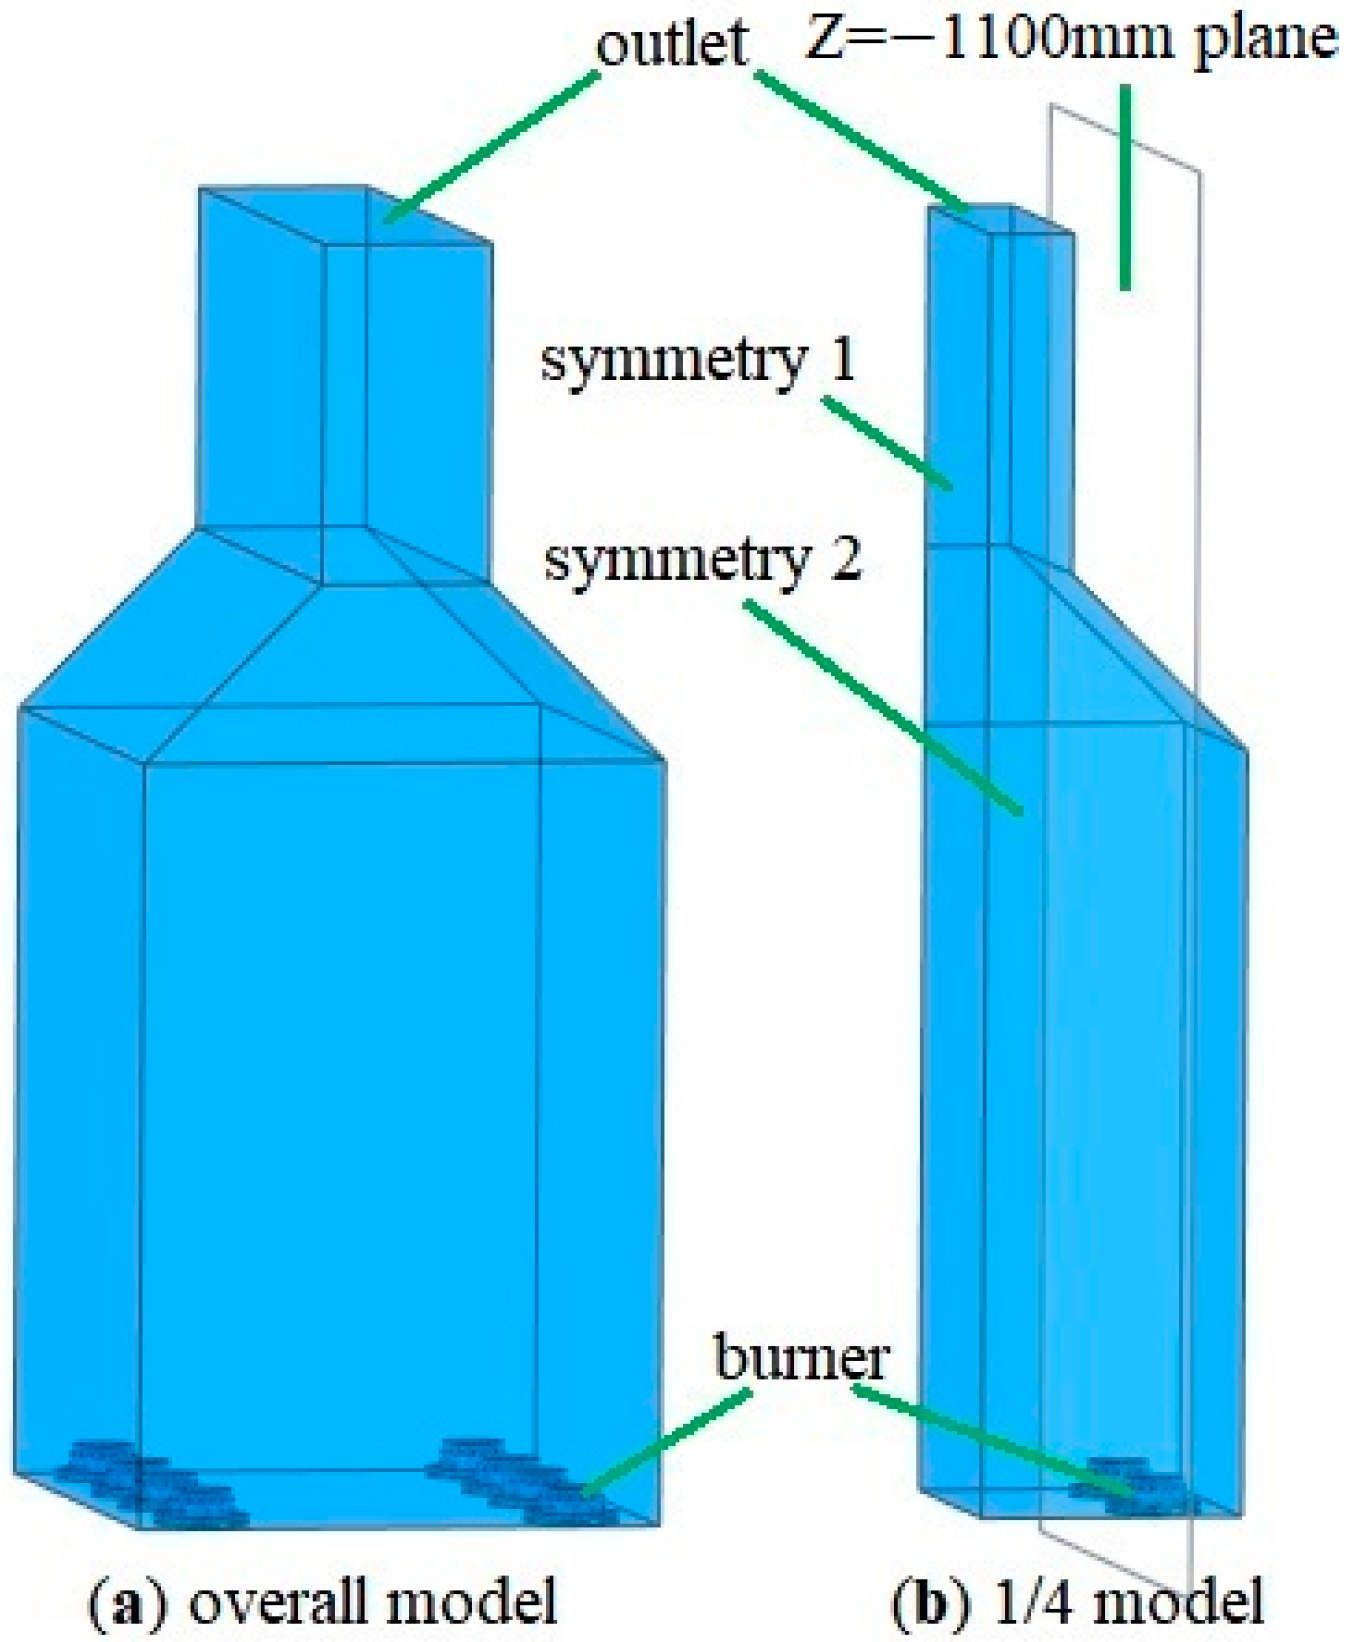
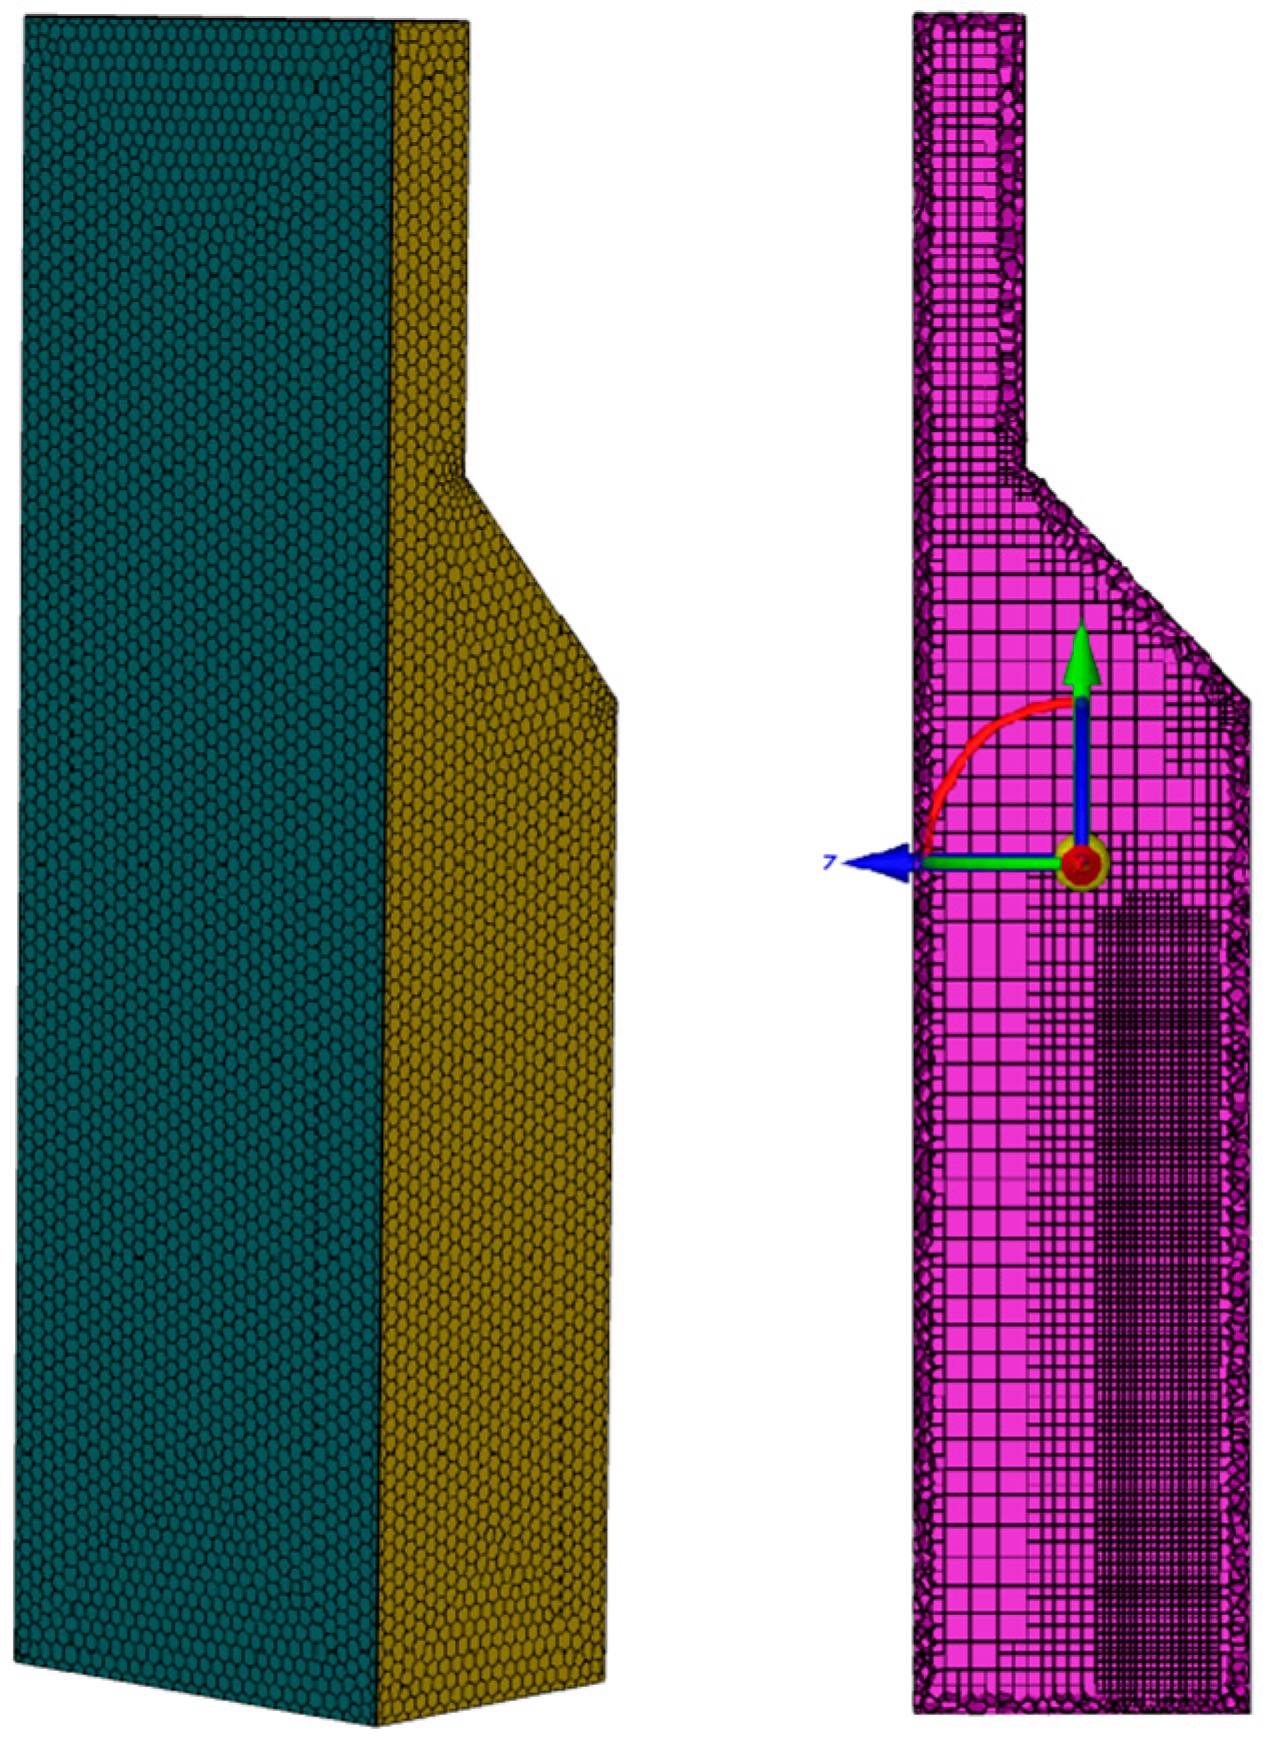
Since the boiler has a regular square box shape, as shown in Figure 2, and the burner distribution is uniform, a 1/4 symmetric geometric model was utilized to reduce the mesh count and computational time. To mitigate the influence of grid count on the calculation results, a grid-independence verification was essential. Table 1 presents the simulation results of natural gas combustion for varying grid counts. The results indicate that NOx levels stabilize when the number of grid cells exceeds 1,884,301. Therefore, a grid model with 1,884,301 cells was employed for the subsequent analysis. Figure 3 shows both the overall and sectional views for this number of grids.
Numerical calculations were conducted using ANSYS Fluent 2022 software, which is widely utilized for computational fluid dynamics and offers significant advantages for the post-processing of NOx combustion products. The burner air inlet pressure was set to 85 Pa, with a flow rate of 0.105 kg/s and a temperature of 380 K. The fuel inlet pressure was 150 kPa, and the total mass flow rate for natural gas was 0.0084 kg/s. The furnace flue gas outlet pressure is 70 Pa, and the heat flux through the furnace wall is 900 W/m2. This study investigates the numerical simulation of fuels doped with hydrogen at mass fractions of 15%, 30%, 45%, and 60%, aiming to elucidate the internal temperature distribution within the heating furnace and the formation of various pollutants. Detailed fuel species parameters are shown in Table 2.
In combustion modeling, both the Eddy Dissipation Model (EDM) and the Non-Premixed Combustion Model are extensively employed to simulate turbulent combustion. The EDM is based on the premise that the chemical reaction rate is predominantly influenced by the turbulent mixing rate, making it suitable for scenarios characterized by rapid and highly turbulent combustion processes. Conversely, the Non-Premixed Combustion Model integrates detailed chemical kinetics, employing a mixture fraction and probability density function (PDF) to accurately represent the mixing of fuel and oxidizer. This approach facilitates more precise modeling of complex chemical reactions, particularly in instances of slow combustion, low-temperature reactions, or localized extinction. Moreover, the Non-Premixed Combustion Model captures phenomena such as stratified combustion, reignition, and mixing inhomogeneities, providing a considerable advantage in applications necessitating accurate descriptions of combustion mechanisms. The fundamental chemical reaction mechanisms employed in the two models are presented in Table 3 and Table 4.

2.3. Turbulence Model

In numerical simulations of industrial natural gas-fired heating furnaces, selecting an appropriate turbulence model is essential for accurately predicting fluid behavior and heat transfer during the combustion process [19]. The airflow within the furnace chamber is typically highly turbulent. This turbulent flow significantly impacts the mixing of fuel and air, combustion efficiency, and temperature distribution within the furnace. Standard k ε turbulence models [20] efficiently simulate these complex flow characteristics with fewer computational resources and provide accurate information about the velocity and pressure fields. The standard k ε turbulence model is a semi-empirical formulation proposed by Launder and Spalding, characterized by the following two-equation formulation.
The transport equation with respect to k is as follows:
ρ k t + ρ k u i x i = x j μ + μ t σ k k x j + G k + G b ρ ε Y M + S k .
The transport equation with respect to ε is as follows:
ρ ε t + ρ ε u i x i = x j μ + μ t σ ε ε x j + C 1 ε ε k G K + C 3 ε G b C 2 ε ρ ε 2 k + S ε ,
where G k denotes the generation term of turbulent kinetic energy k due to the mean velocity gradient, G b denotes the generation term of turbulent kinetic energy k due to buoyancy, Y M represents the contribution of pulsation expansion in pressurizable turbulence, C 1 ε , C 2 ε , and C 3 ε are empirical constants, σ k and σ ε are the Prandtl numbers associated with turbulent kinetic energy k and the dissipation rate ε , respectively, and S k and S ε are user-defined source terms.

2.4. Combustion Model

A Non-Premixed Combustion Model simulates the complex behavior of fuels and oxidants during combustion. This model is particularly suited for combustion processes where the fuel and oxidizer are not mixed until they enter the combustion chamber [21]. In non-premixed combustion, the fuel and oxidizer typically come into contact at different locations or times, resulting in a complex combustion process. In this study, the burner fuel inlet and air inlet are independent, and the fuel and air are not mixed before entering the furnace chamber; therefore, a Non-Premixed Combustion Model is used. The Non-Premixed Combustion Model results from a series of simplifications that reduce the complex transient thermal–chemical states and conserved quantities to physical quantities related to the mixing fraction [22], given by the following mixing mass fraction equation:
f = Z i Z i , o x Z i , f u e l Z i , o x ,
In the formula, Z i denotes the mass fraction of element i , Z i , o x denotes the mass fraction of component i in the oxidizer inlet, and Z i , f u e l denotes the mass fraction of component i in the fuel inlet.
Assuming that the diffusion rate of each component is identical in turbulent flow, the component equation can be simplified to a transport equation for the following mixing fraction:
t ρ f ¯ + x f ρ u j f ¯ = x f Γ e , f f ¯ x f + S m + S u s e r ,
In the equation, Γ e , f denotes the mixing fraction exchange coefficient, S m denotes the mass of liquid fuel spray or particles entering the gas phase, and S u s e r denotes the user-defined source term.
In industrial combustion equipment, the primary method of heat transfer is thermal radiation exchange. The thermal radiation from the flame during combustion is influenced by the temperature, radiation absorption rate, and scattering properties of the reaction medium, which in turn depend on the wavelength of the radiation. The Discrete Ordinates (DO) radiation model can solve radiation problems across all optical depth intervals, calculate radiation through translucent media, and account for medium participation in radiation (e.g., smoke, water vapor) while being computationally efficient.

2.5. NO Formation Model

2.5.1. Thermal NO

During combustion, nitrogen molecules (N2) dissociate at high temperatures, causing the nitrogen atoms to rapidly react with oxygen to form thermal NO. Thermal NO is a primary contributor to NO formation in combustion reactions [23]. The recognized mechanism controlling thermal NO formation was proposed by Zeldovich [24]. Activation of the thermal pathway requires high temperatures, typically above 1800 K [25], due to the significant energy needed to break the N2 triple bond. The lower activation energy required for the oxidation of N atoms, compared to that needed to dissociate N2 molecules, results in a consumption rate of N atoms that is approximately equal to their formation rate. A quasi-steady-state assumption can be made for the concentration of nitrogen atoms [N], allowing the rate of formation of thermal NO to be expressed as follows:
d [ N O ] t h d t = 2 k f , 1 [ O ] [ N 2 ] ( 1 k r , 1 k r , 2 [ N O ] 2 k f , 1 [ N 2 ] k f , 2 [ O 2 ] ) ( 1 + k r , 1 [ N O ] k f , 2 [ O 2 ] + k f , 3 [ O H ] )
The coefficients k f , x and k r , x in this equation denote the forward and reverse rates of the reaction and are defined as Arrhenius rates:
k = A T n e B T ,
The rate constants A , n , and B [26] in this equation were obtained experimentally by Hanson et al. [27].

2.5.2. Prompt NO

Prompt NO is formed in the region of rapid chemical reactions near the leading edge of the flame, where nitrogen and carbon interact in the NO formation reaction chain. This prompt pathway results in significant NO production in the fuel-rich region, even at moderate temperatures [28]. The prompt NO formation rate calculation model proposed by De Soete [29] and modified by Dupont [30] is frequently used in combustion analysis. In this model, the prompt NO formation rate is expressed as follows:
d [ N O ] p r d t = f k p r [ O 2 ] a [ N 2 ] [ f u e l ] e E ´ a R T ,
In the equation, R denotes the gas constant and E a denotes the reaction activation energy. The variable f represents the number of carbon atoms in the fuel molecule as a function of the total system equivalence ratio. The equivalence ratio is a very important parameter in combustion reactions and depends on the ratio of the fuel and air mass flow rates, as well as their ratio in the stoichiometric case.

2.5.3. N2O Intermediate NO

Under certain conditions, NO can be formed through the N2O intermediate mechanism. The significance of the N2O intermediate mechanism increases under fuel-poor and low-temperature conditions [31]; however, its contribution to NO formation is generally less than that of the thermal NO mechanism. The mechanism of NO formation through N2O [32,33,34,35,36,37] intermediates, proposed by Nicol et al. [38], consists of a two-step reaction process:
N 2 + O + M N 2 O + M ,
N 2 O + O 2 N O ,
M is the generic third body in this equation.

3. Results and Discussion

3.1. Comparison of Natural Gas Combustion Experimental and Numerical Simulation Errors

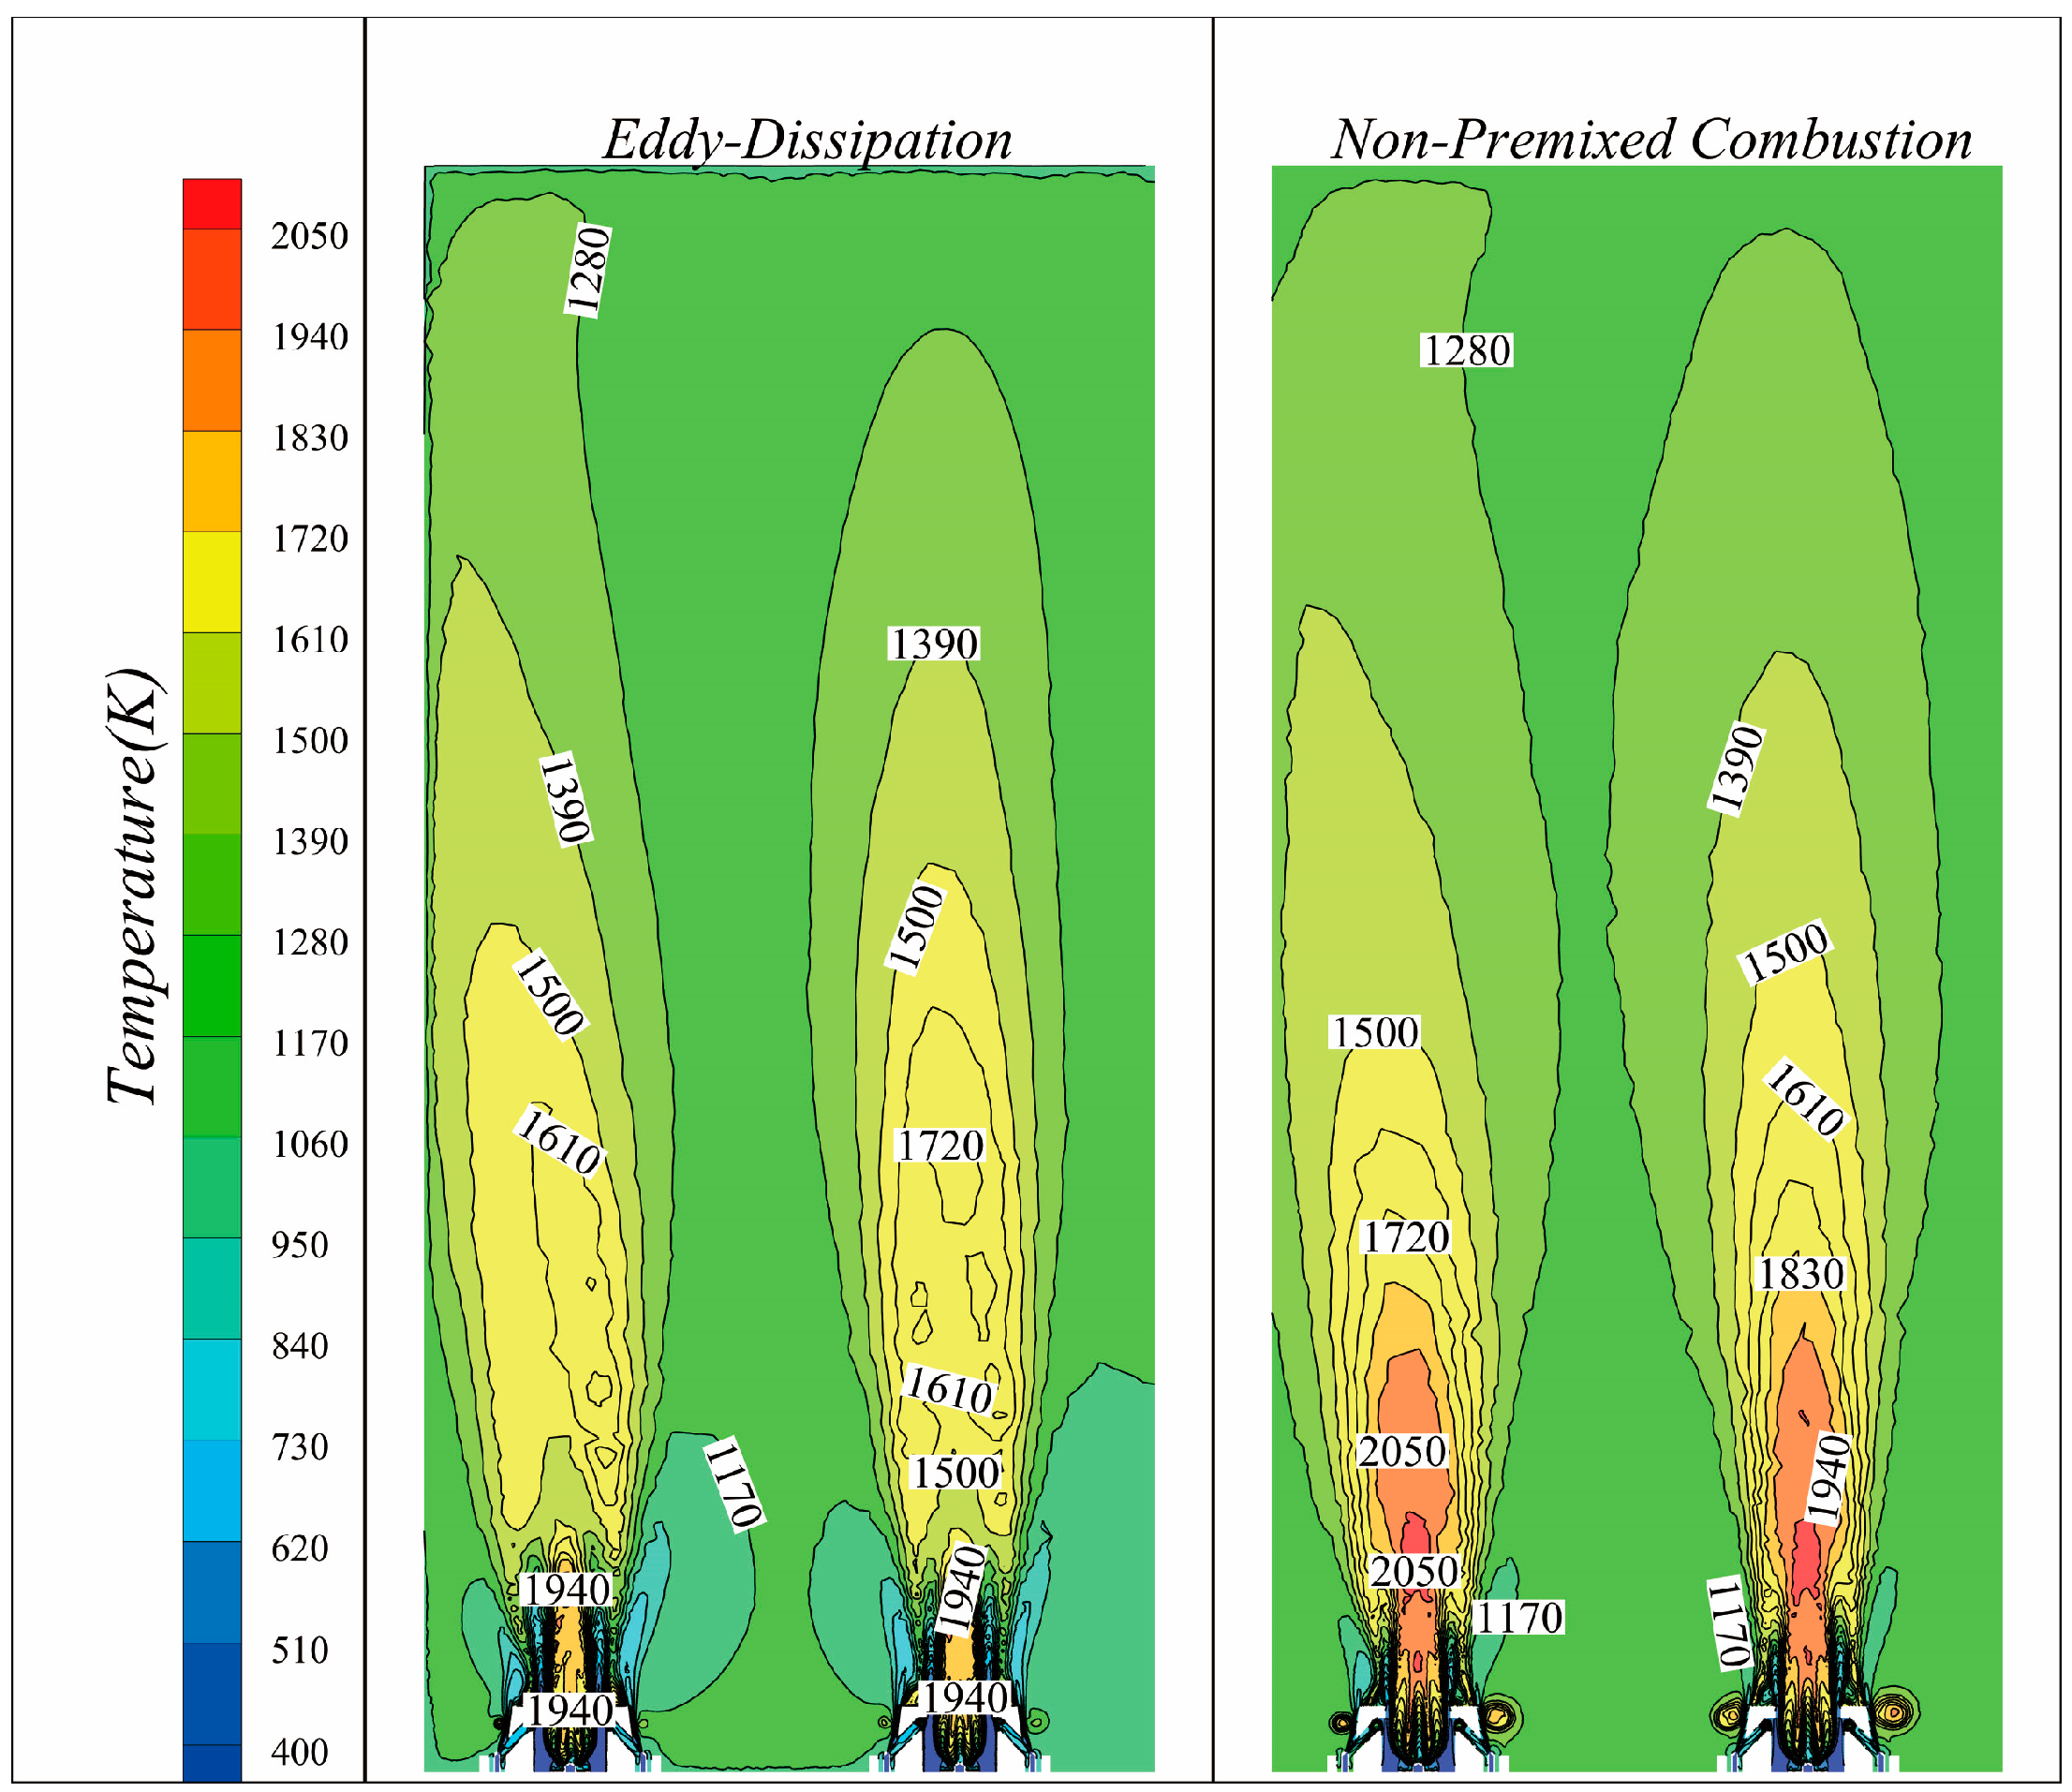
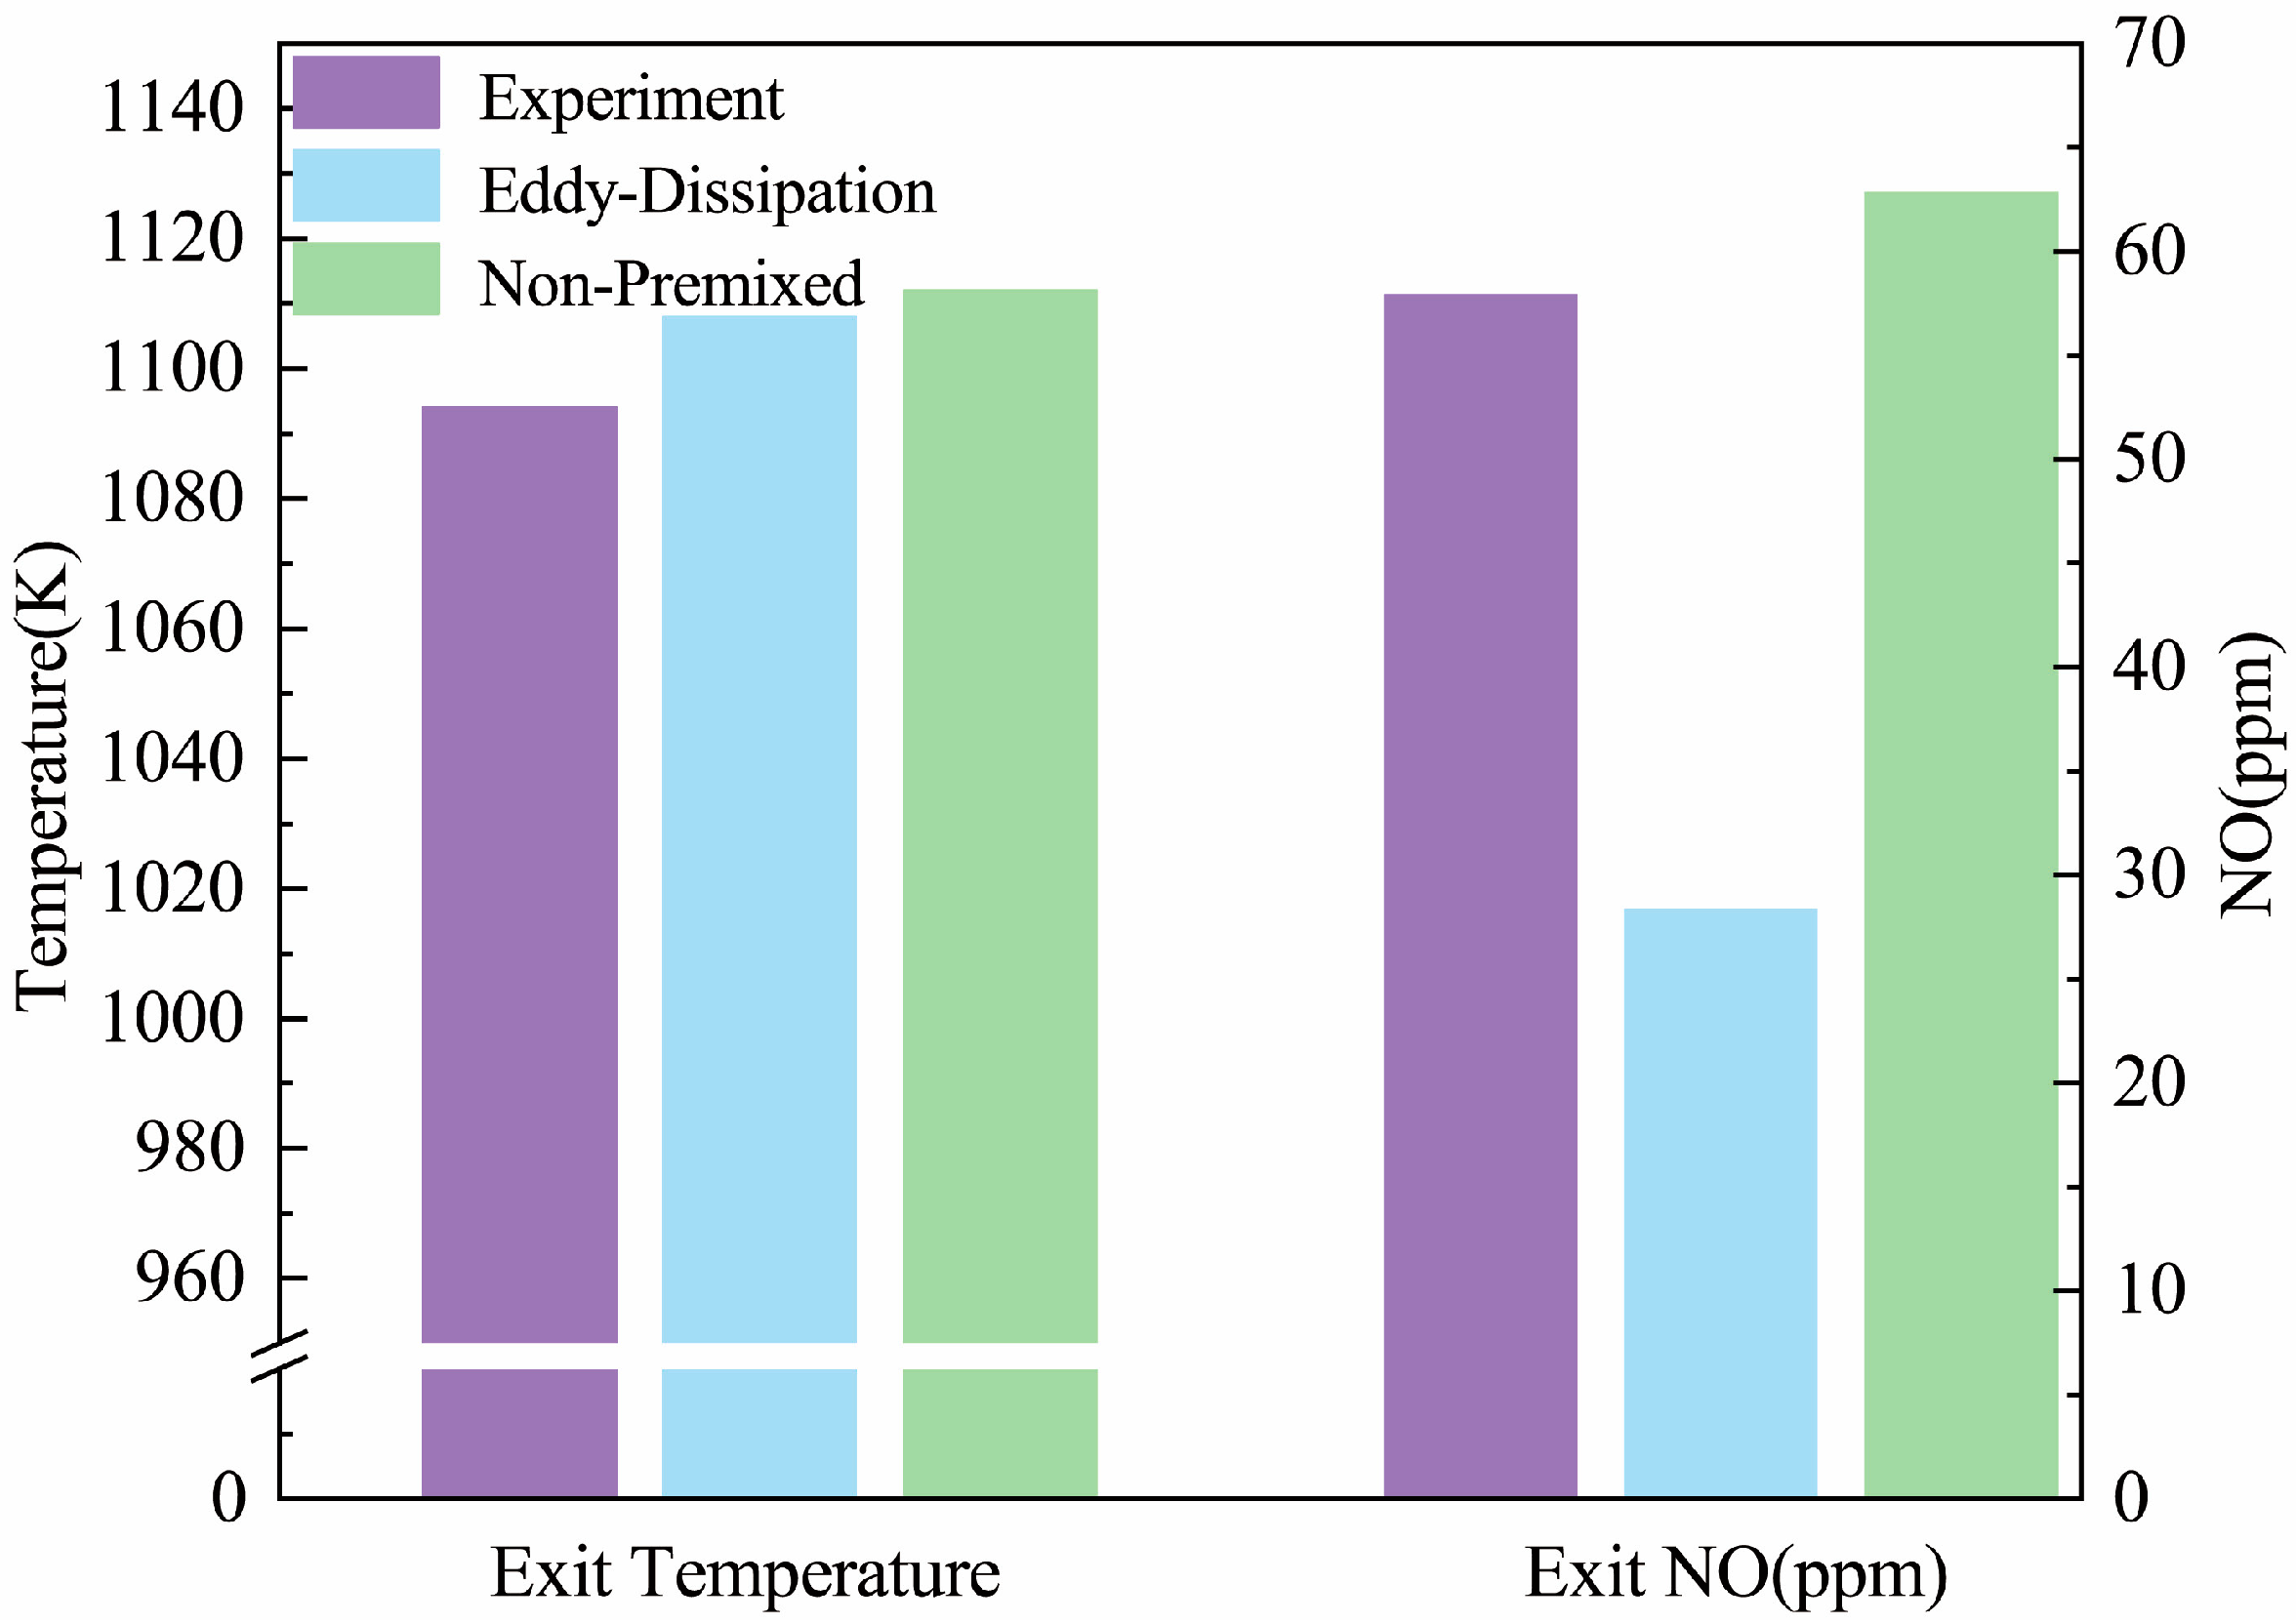
Figure 4 presents the temperature distribution contour plots simulated by the Eddy Dissipation Combustion Model and the Non-Premixed Combustion Model. Both models exhibit similar flame structures, but the Non-Premixed Combustion Model [39] predicts significantly higher flame temperatures, with peak temperatures of 2047 K and 2058 K, respectively. The Non-Premixed Model also predicts a substantially larger high-temperature region compared to the Eddy Dissipation model. This discrepancy results in a 50% lower NO concentration at the outlet when using the Eddy Dissipation Model compared to the experimental results. Figure 5 compares the experimental measurements with the numerical simulations of the Eddy Dissipation Model and the Non-Premixed Model. The outlet temperature was measured experimentally using thermocouples. As illustrated in the figure, although the outlet temperatures from both models are closely aligned, the Non-Premixed Model simulates the pollutant concentration with greater accuracy and a reduced margin of error. Consequently, the Non-Premixed Combustion Model exhibits superior performance in this study and will be employed in subsequent numerical simulations.
Table 5 compares the measured data from actual natural gas combustion experiments with the results of CFD numerical simulations and previous studies. The simulation results indicate an outlet temperature of 1112 K, which is 18 K higher than the experimentally measured value. The Eddy Dissipation Model simulation produced an outlet NO concentration of 28.35 ppm, which is 29.57 ppm lower than the experimentally measured value, thus significantly exceeding the acceptable error range. This discrepancy can be attributed to the fact that thermal NO becomes the predominant pathway for NO formation when the combustion temperature exceeds 1800 K. In the Eddy Dissipation Model simulation, the region where the temperature exceeds 1800 K is significantly smaller than that predicted by the Non-Premixed Combustion Model. Consequently, the NO concentration predicted by the Eddy Dissipation Model was significantly underestimated. The Non-Premixed Combustion Model simulation yielded an outlet NO concentration of 57.92 ppm, which is 4.92 ppm higher than the experimentally measured value. With an error of less than 8%, this indicates that the Non-Premixed Combustion Model more accurately reproduces the temperature and pollutant distribution within the heating furnace. The numerical computational modeling presented in this paper yields even better results compared to previous studies, further demonstrating the applicability of the Non-Premixed Combustion Model to this type of combustion problem.

3.2. Effect of Hydrogen on Combustion Temperature

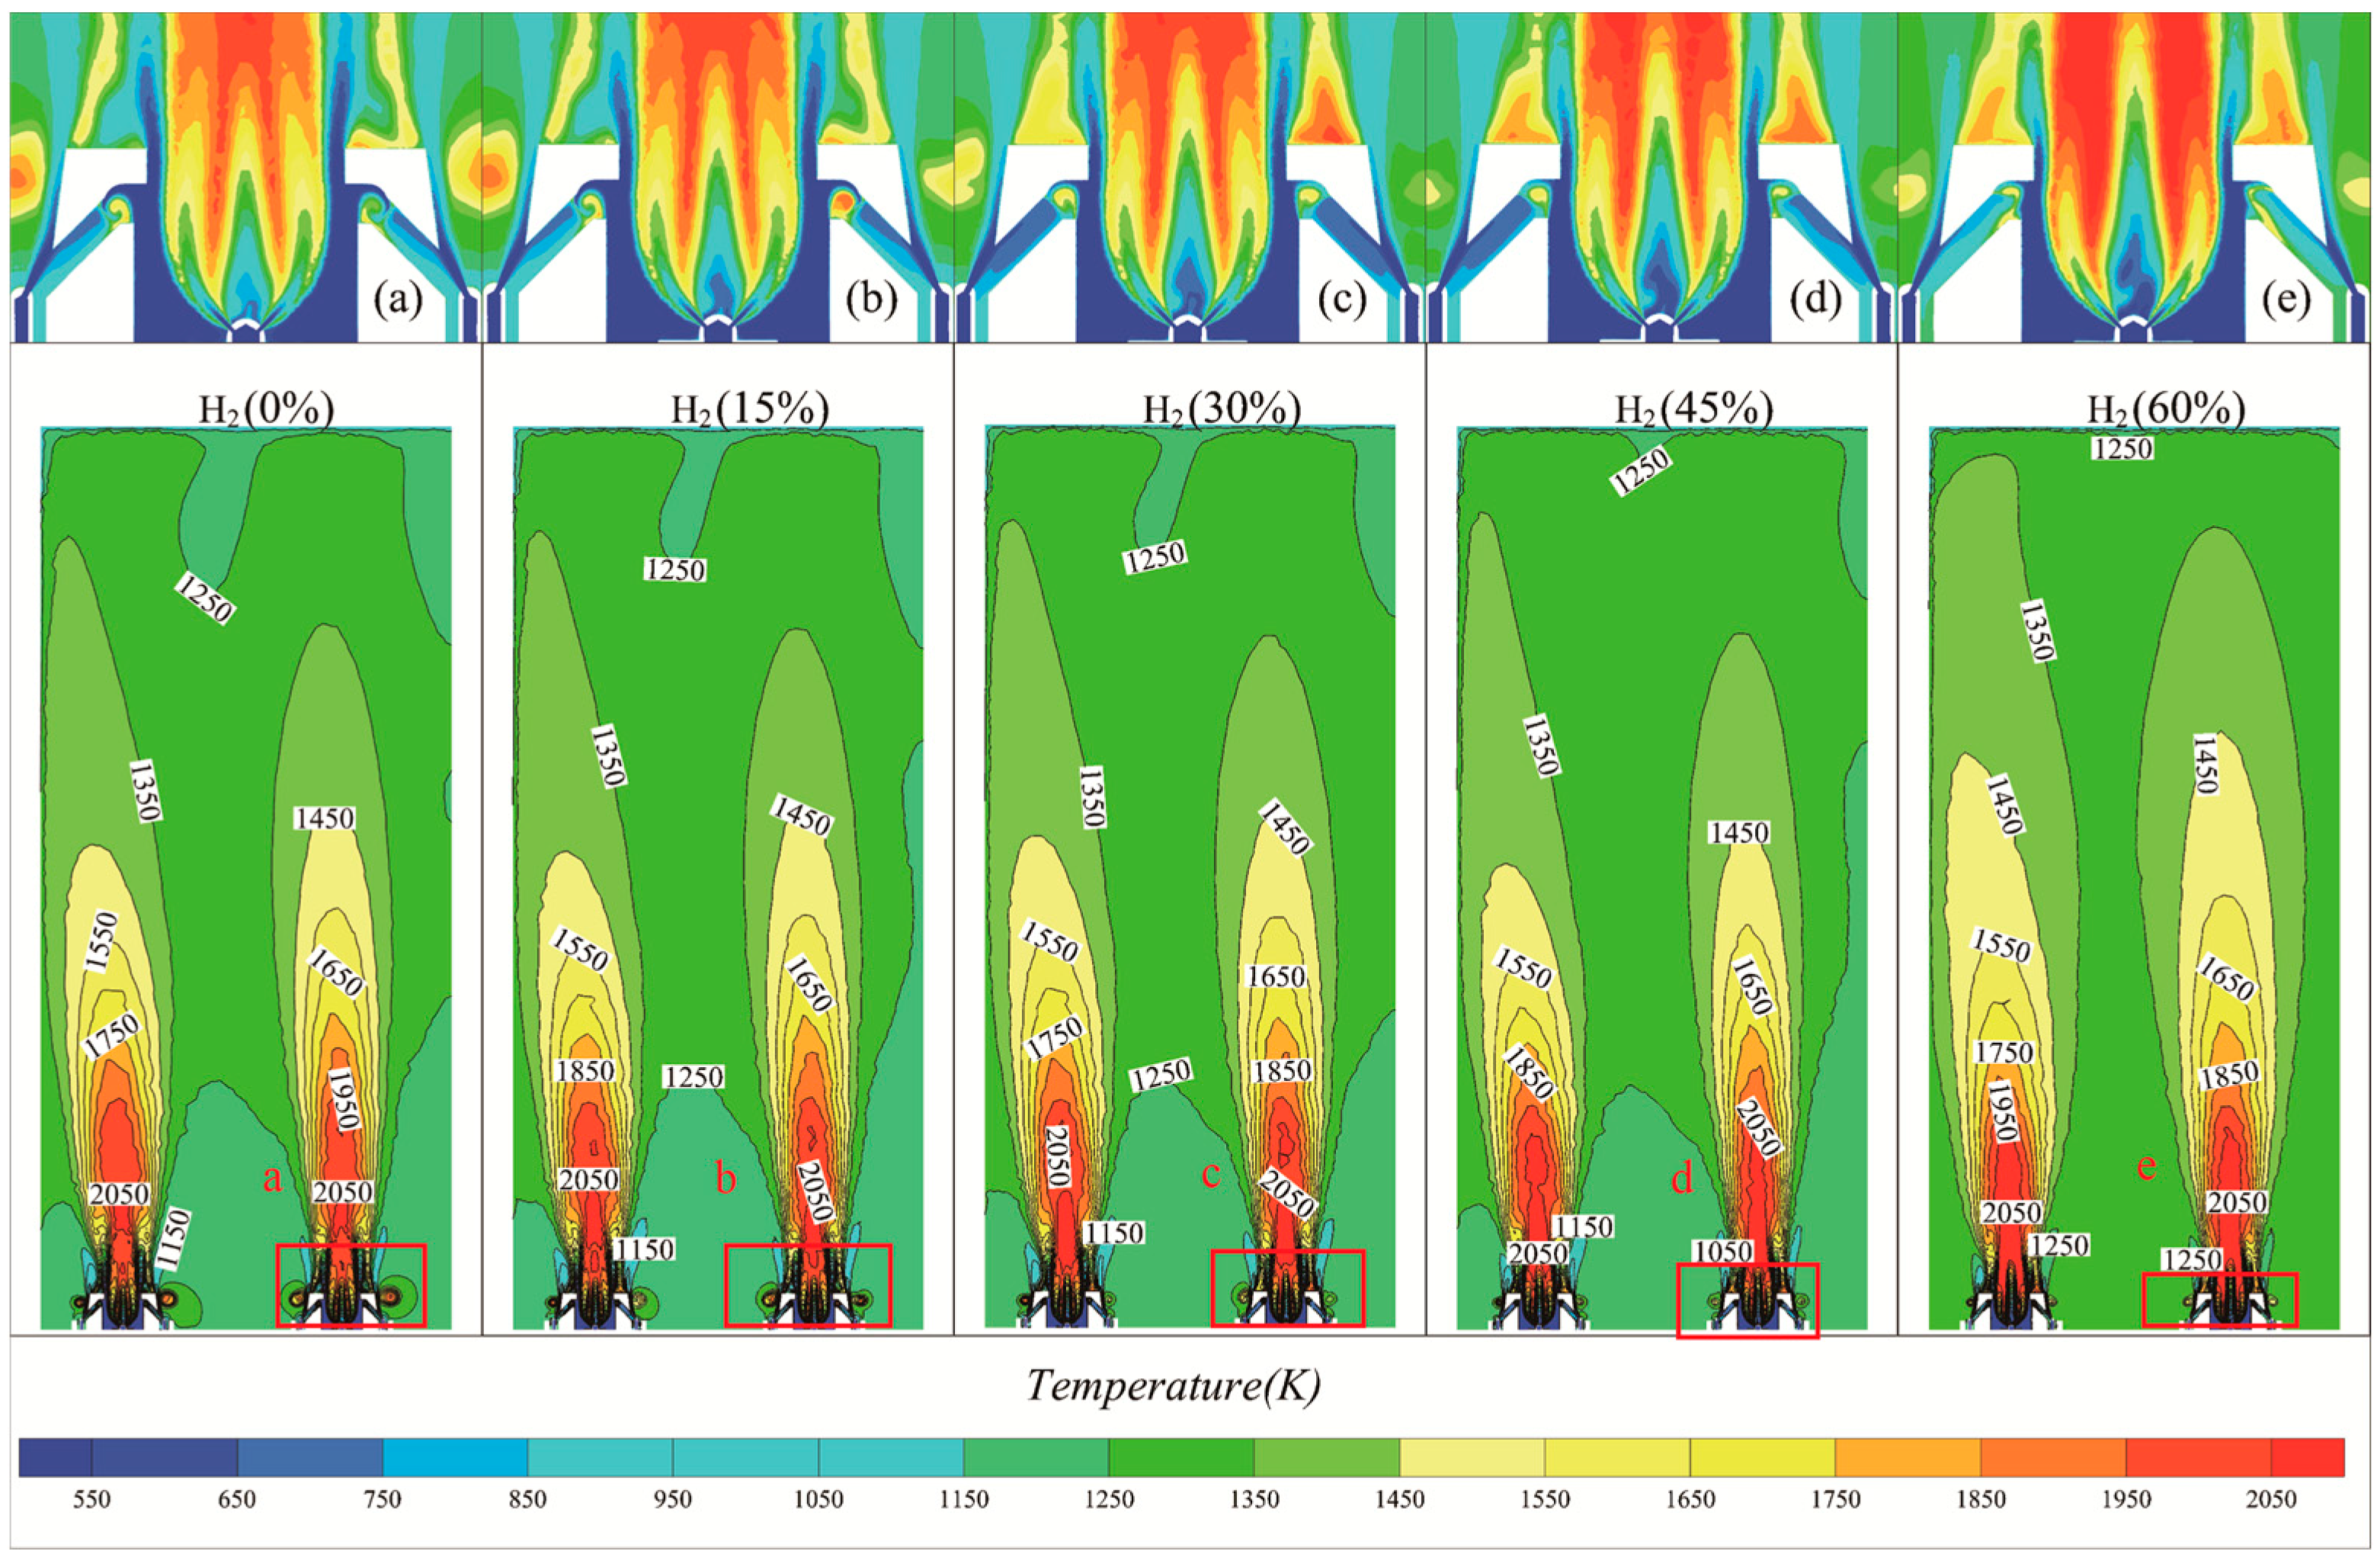
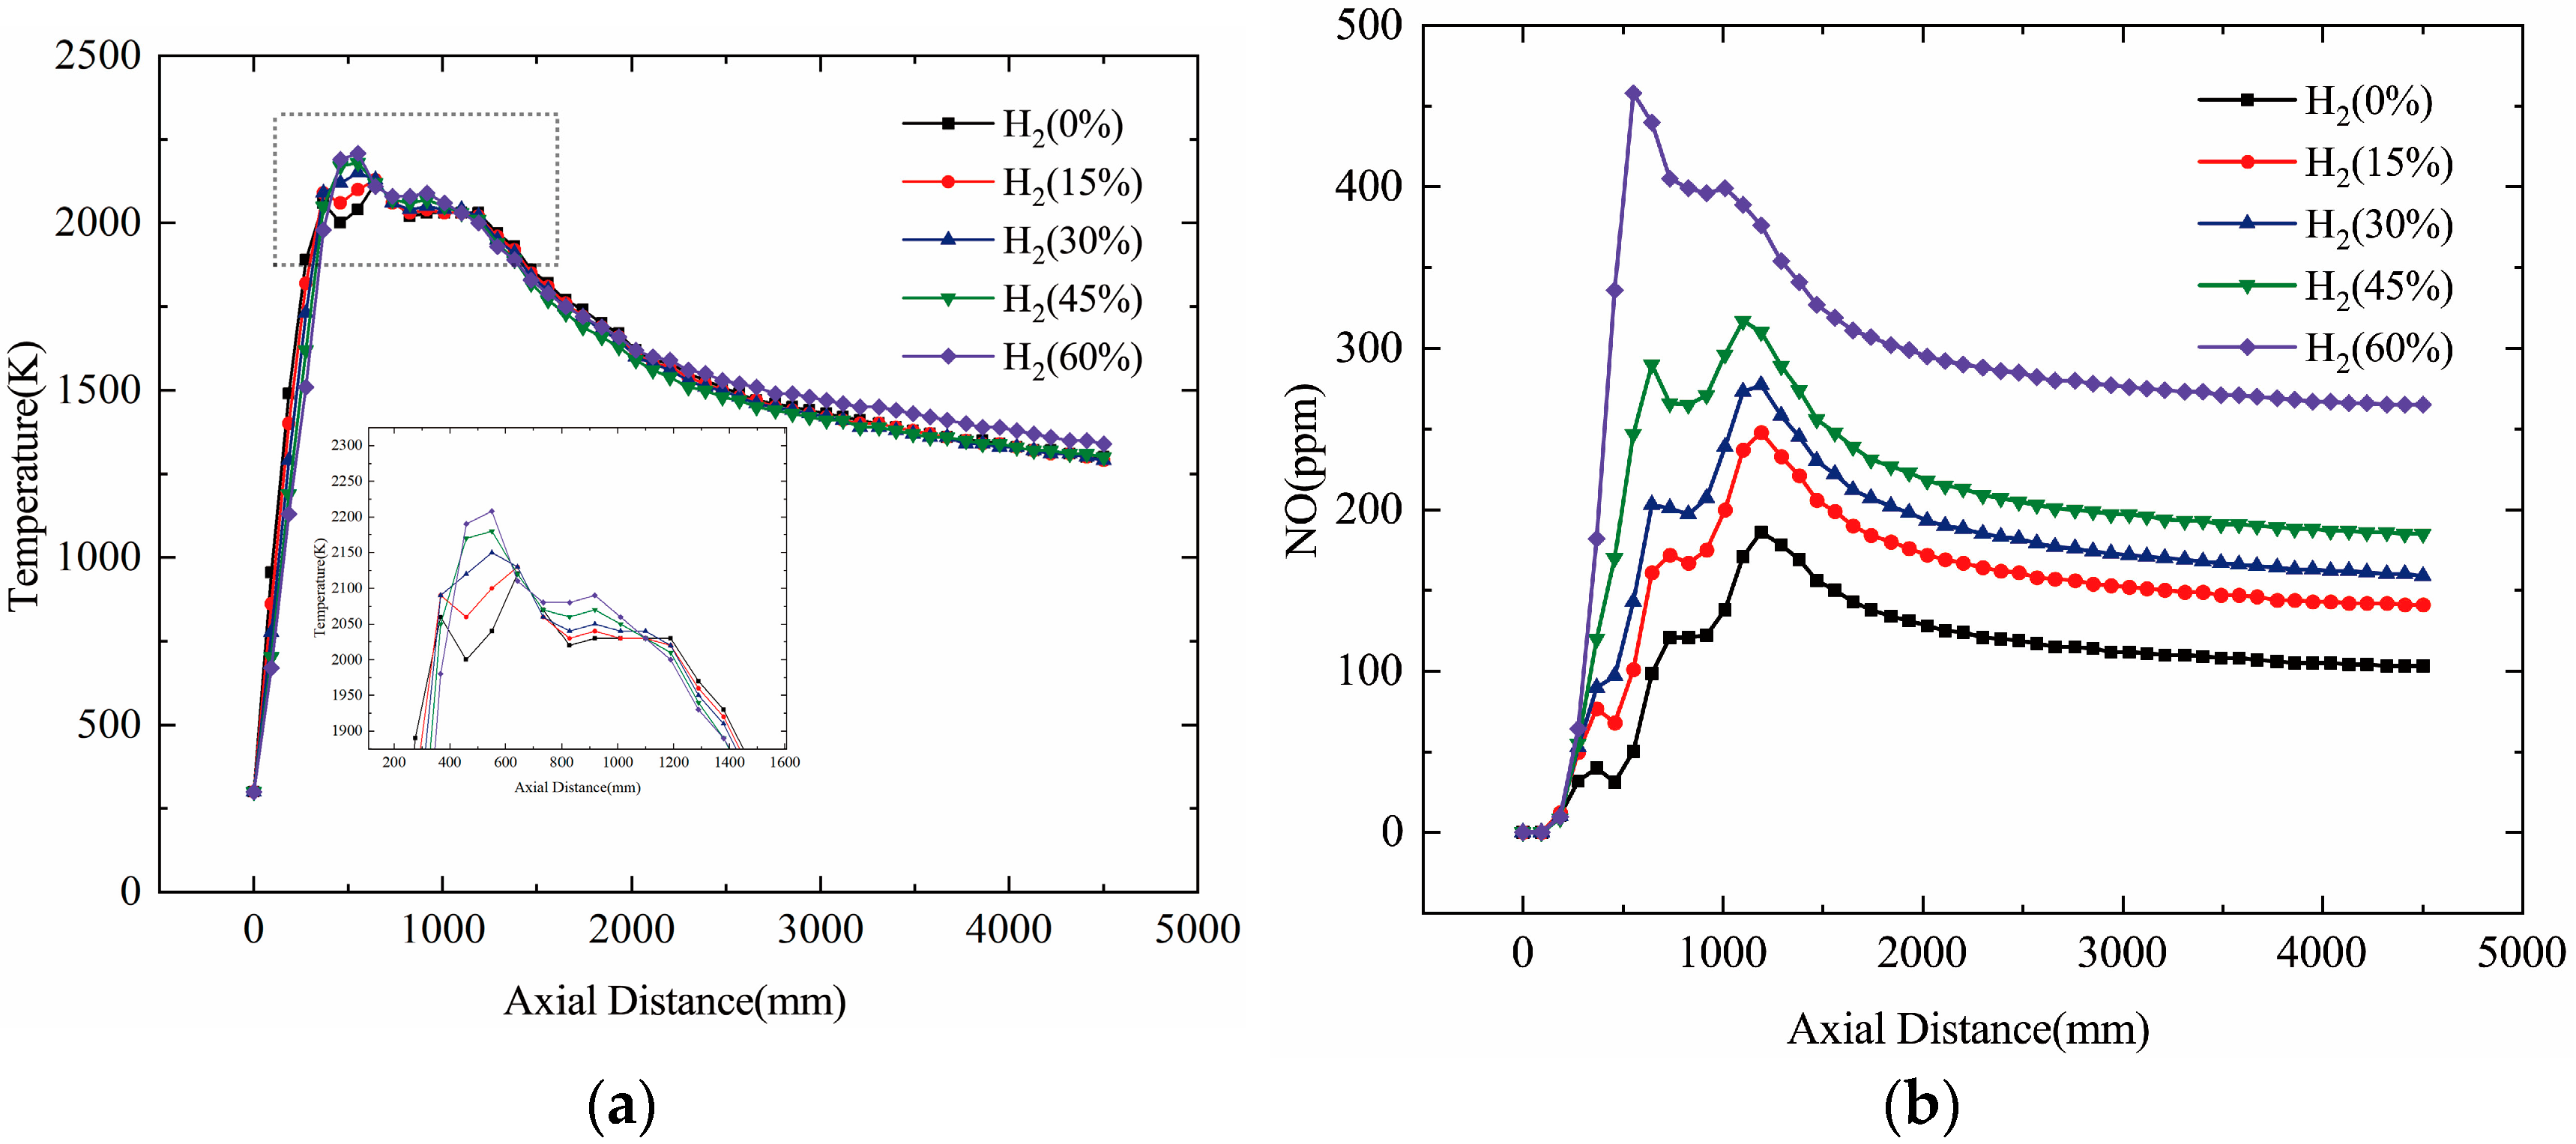
In the following Figures, present the temperature contour plots of the heating furnace at the Z = −1100 mm plane and the temperature distribution along the burner’s center axis, respectively. Figure 6 illustrates the fundamental flame structure: the central fuel nozzle reacts with air to produce the flame, while the outer fuel nozzle interacts with unreacted air. As the hydrogen content in the fuel increases, the flame temperature rises, with the maximum temperature increasing from 2010 K at 0% hydrogen to 2180 K at 60% hydrogen, representing an increase of 8.5%. And, when the hydrogen content was increased to 60%, the thermal efficiency of the heating furnace increased from 91.2% to 94.7%, indicating that hydrogen has a positive effect on the thermal efficiency of the heating furnace. Figure 7 illustrates the gas velocity contour plots within the furnace at varying hydrogen concentrations, with subfigures (a)–(e) representing magnified views of the regions near the nozzle, highlighted by red boxes. These figures clearly indicate that as hydrogen concentration increases, the gas velocity within the furnace correspondingly increases. The magnified views around the nozzle further demonstrate that the gas velocity surrounding the flame exhibits an upward trend. This phenomenon can be attributed to hydrogen’s highly flammable nature, characterized by a significantly faster combustion rate compared to conventional hydrocarbons. Additionally, the high-temperature gasses generated by hydrogen combustion undergo greater expansion than those produced by the combustion of conventional fuels. In the furnace, this thermal expansion directly results in an increase in gas volume, thereby accelerating the outward gas flow. Consequently, the introduction of hydrogen into the fuel accelerates the combustion process, allowing the released energy to be transferred more rapidly to the surrounding medium, thereby enhancing gas flow. This phenomenon is also a key factor contributing to the slight increase in flame height.
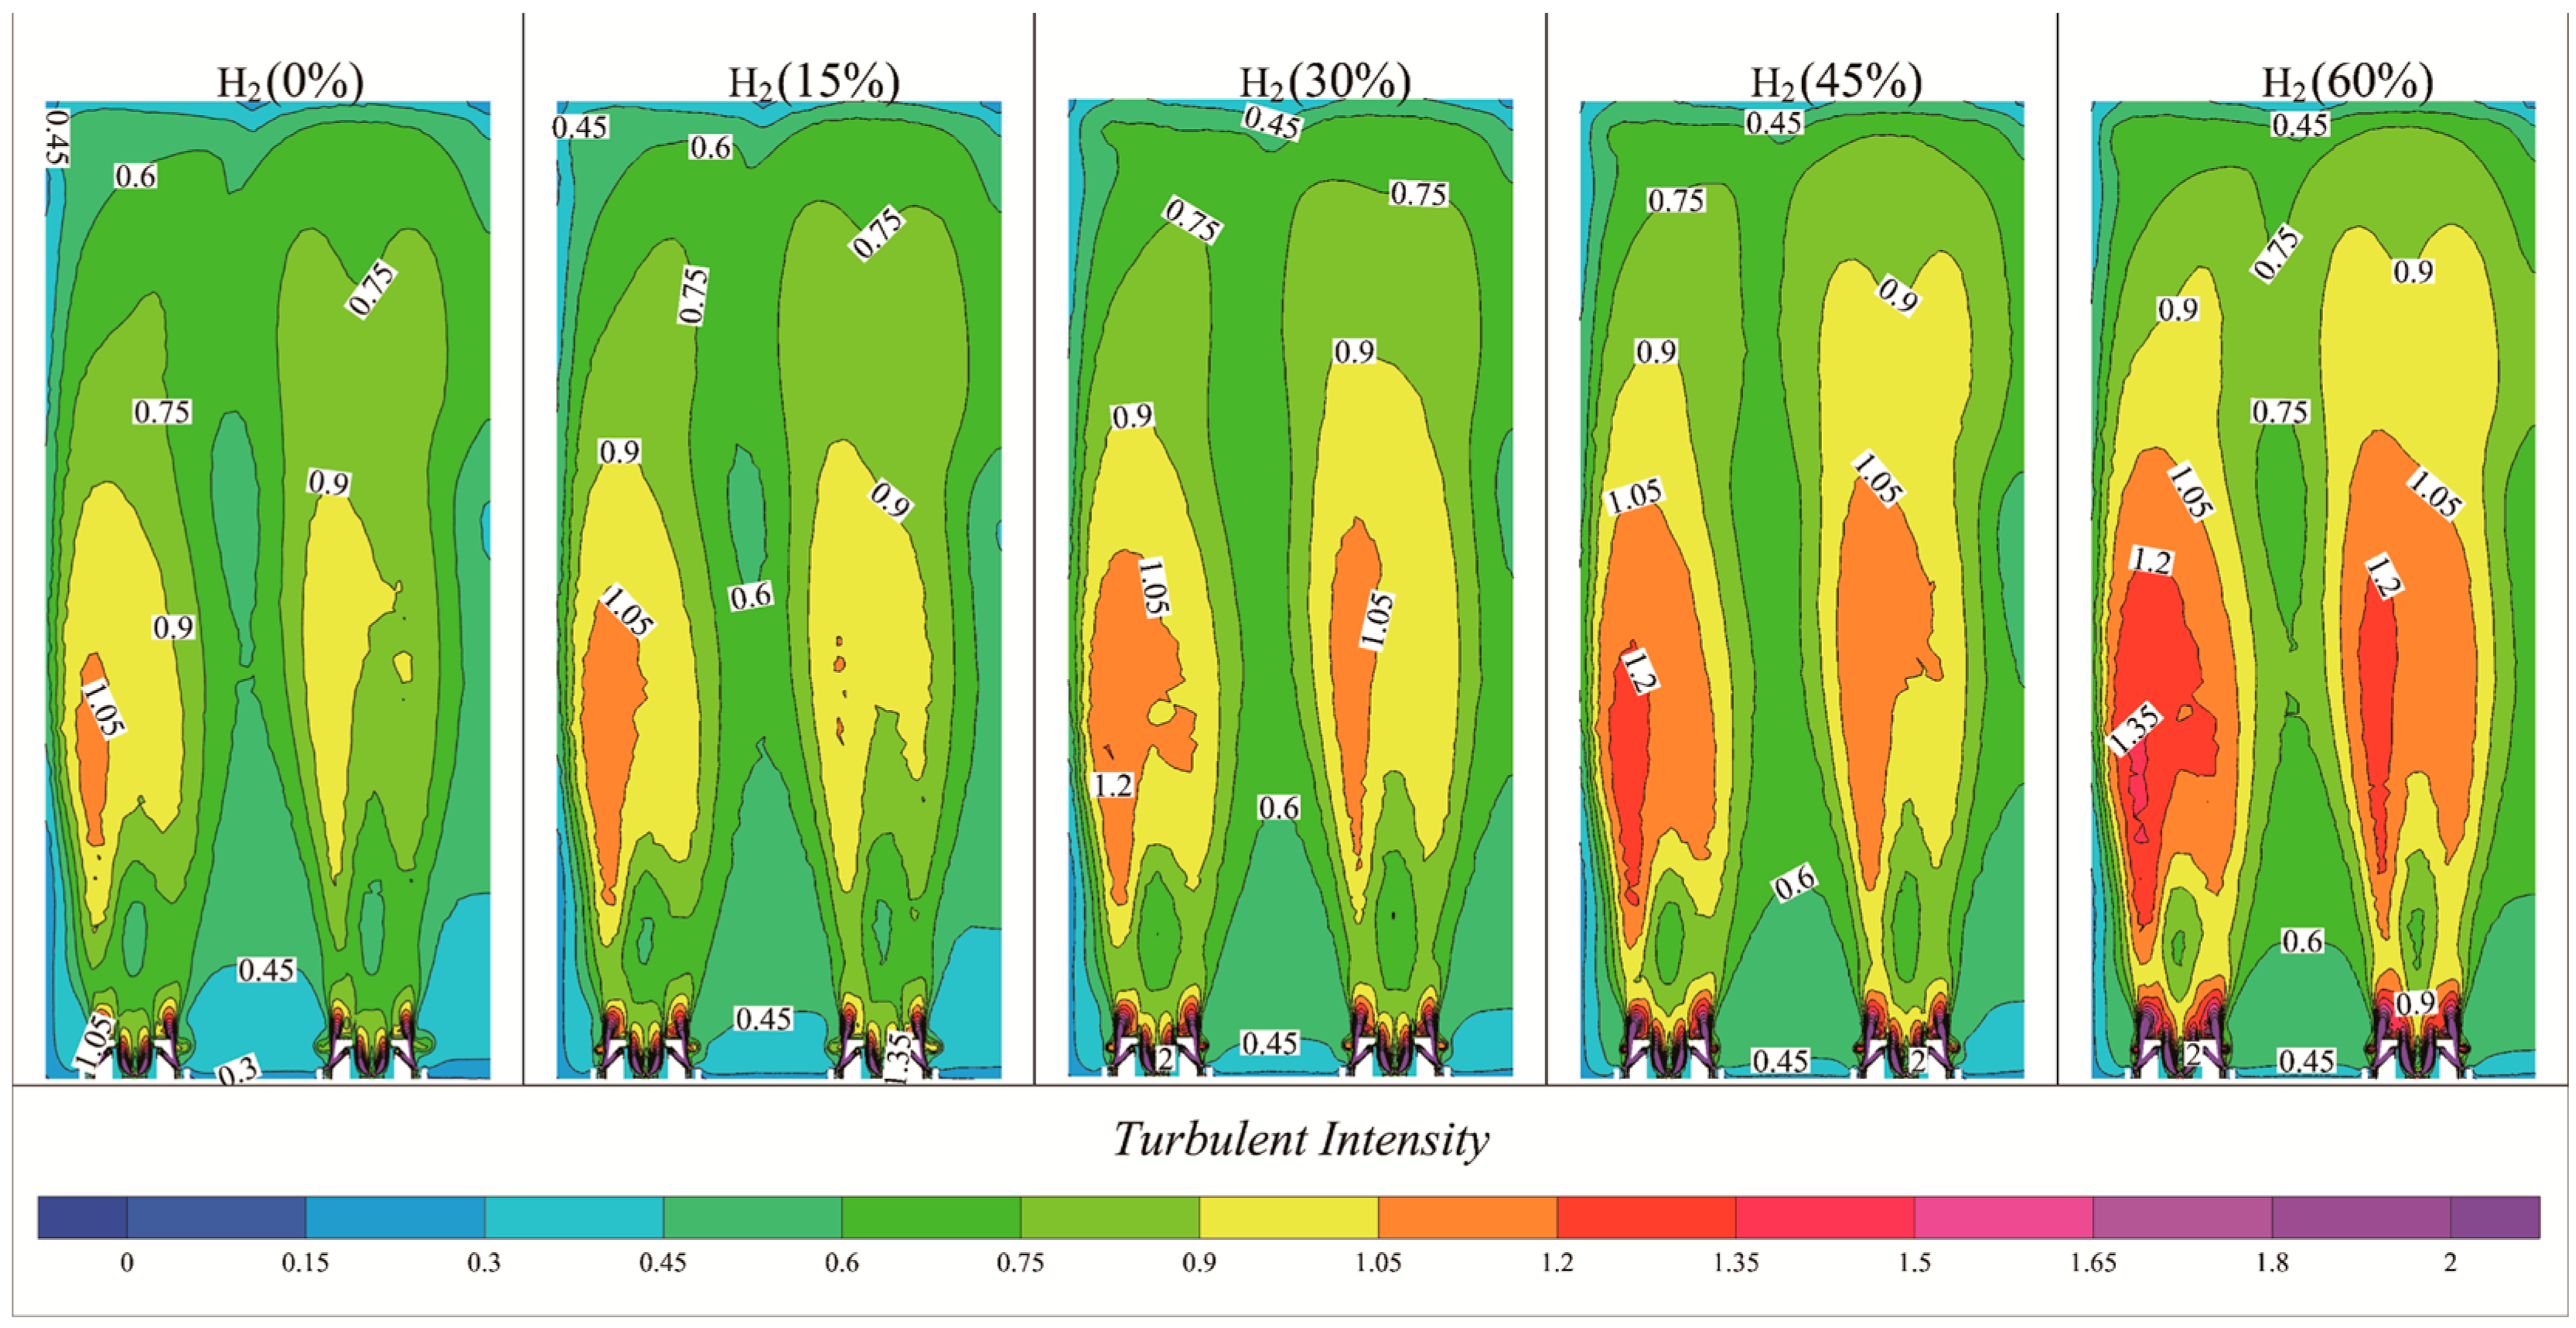
An increase in flame width with the increase in hydrogen content: This phenomenon can be attributed to the increasing turbulent intensity within the furnace due to the addition of hydrogen (as illustrated in Figure 8). Due to its high diffusion rate, hydrogen rapidly disperses to the flame front during combustion, thereby intensifying the turbulent combustion. This rapid diffusion enhances the mixing of fuel and oxygen, resulting in a more intense turbulent flame. The contour plots of turbulent intensity distribution within the furnace (Figure 8) clearly indicate that as hydrogen content increases, turbulent intensity progressively rises, thereby contributing to the widening of the flame.

3.3. Effect of Hydrogen on NO Production

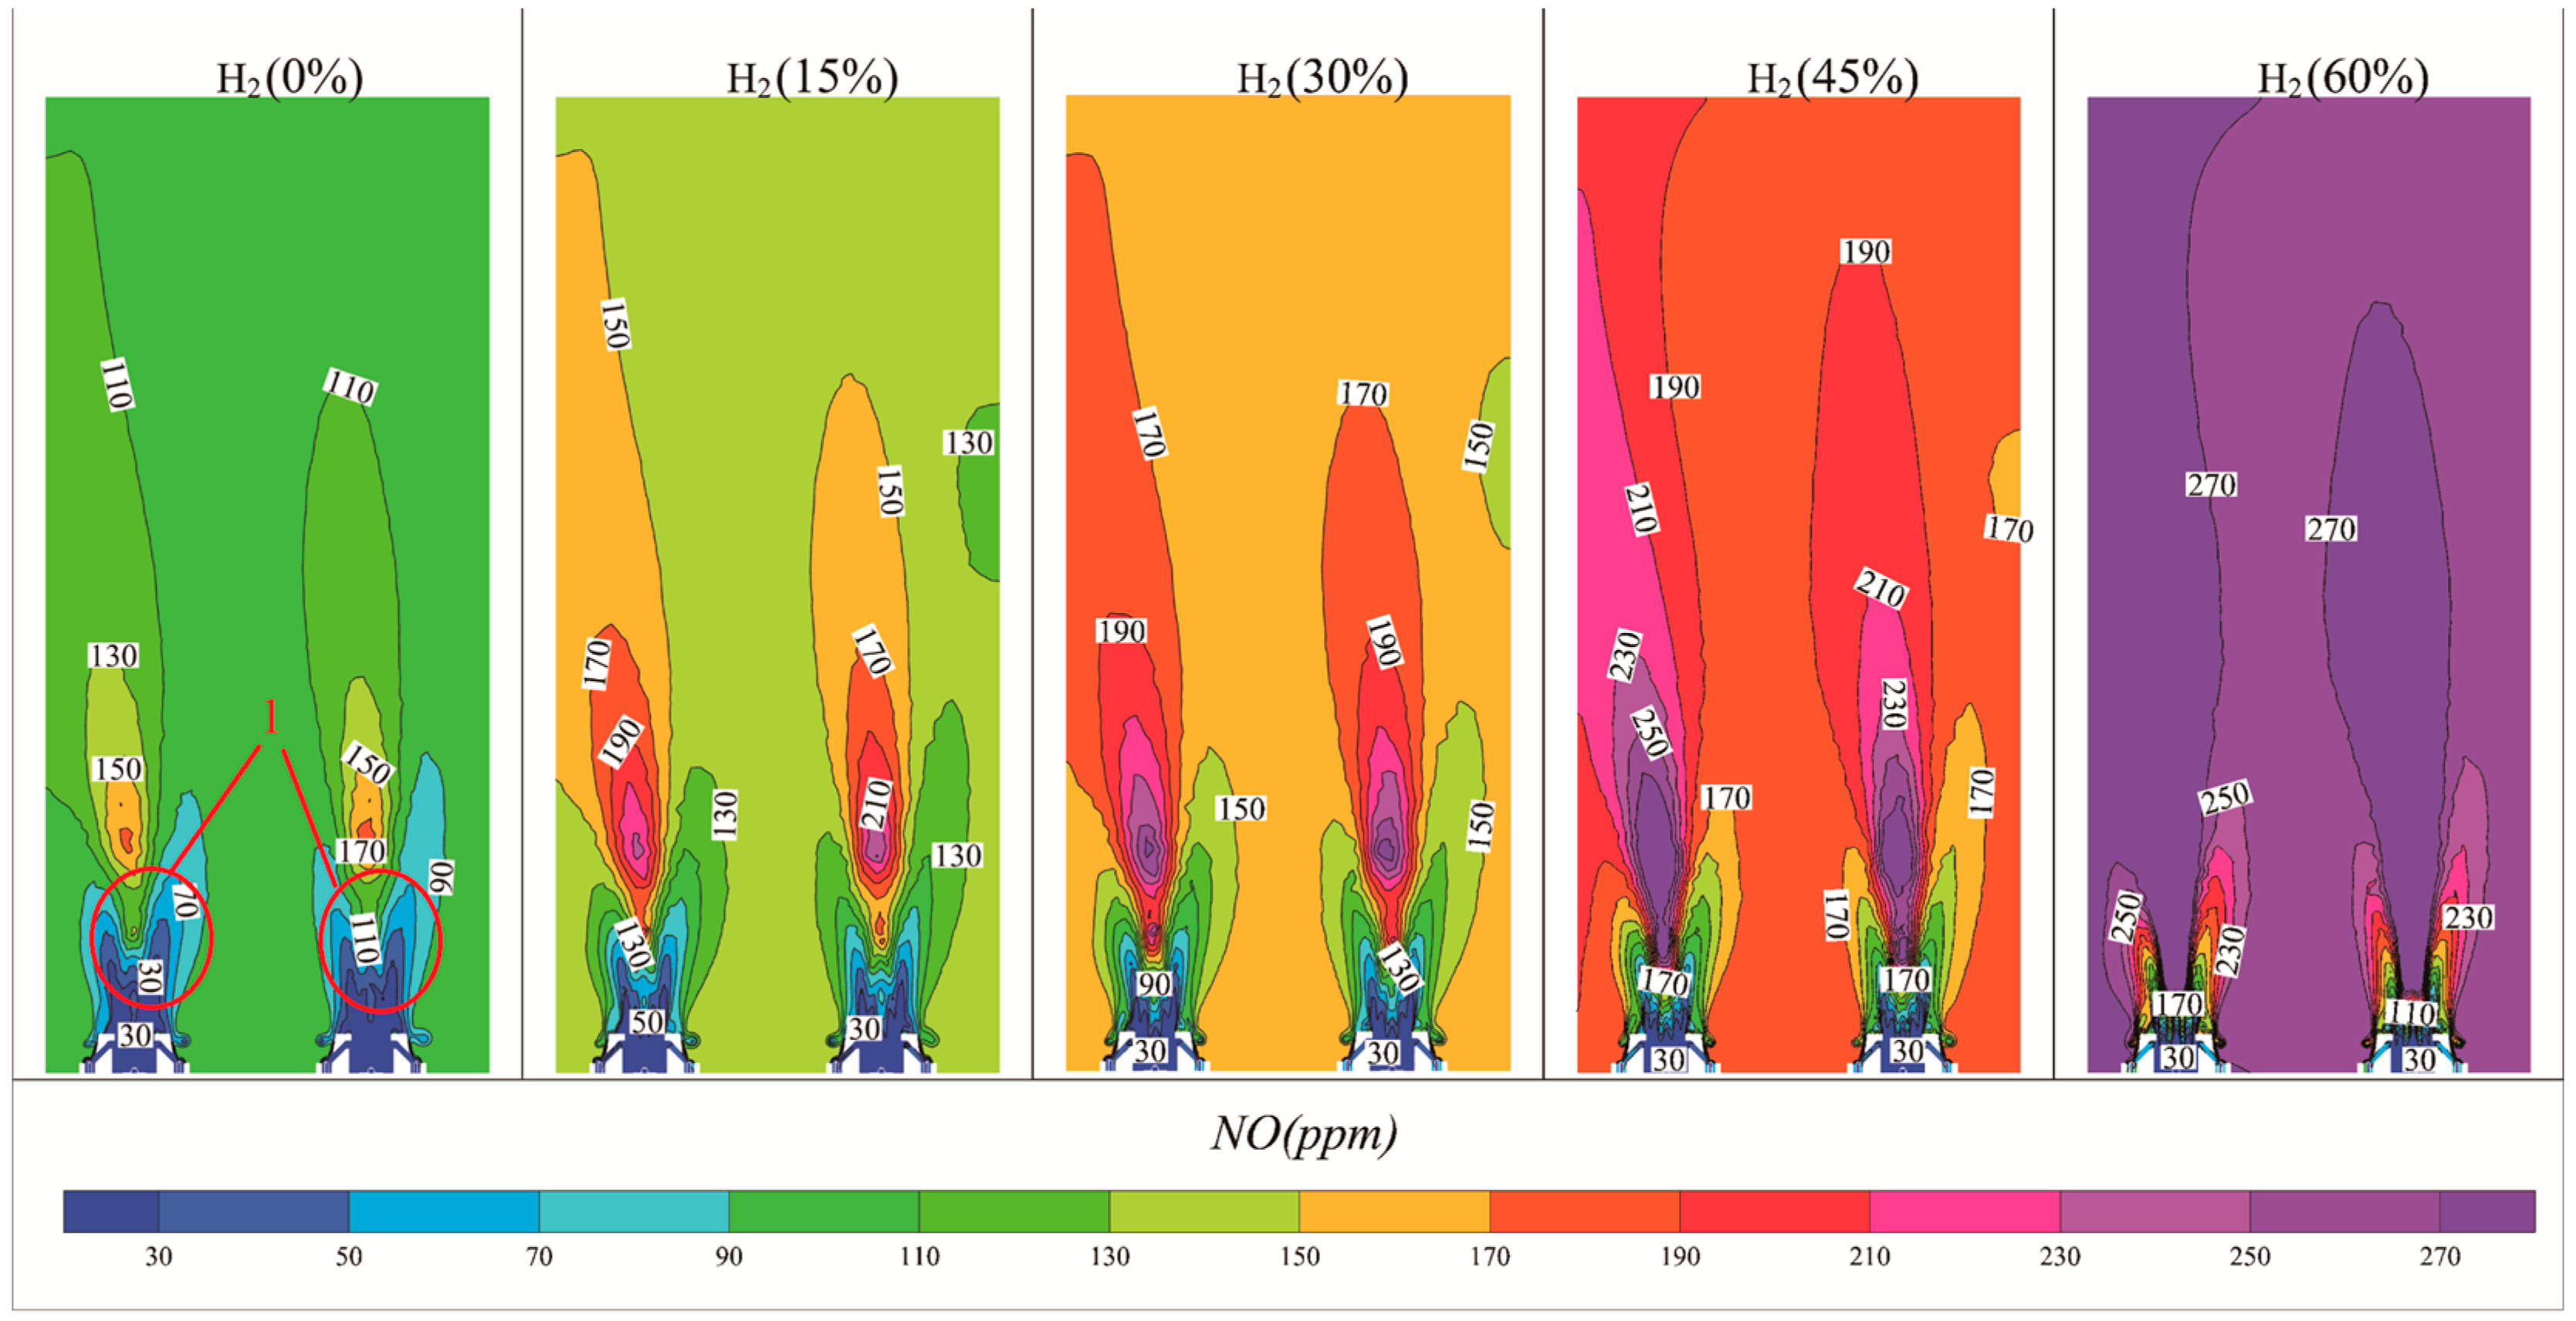
Figure 9 shows the NO concentration distribution, indicating that NO is predominantly formed in the high-temperature central region of the flame and increases with higher hydrogen content. Region 1 in this figure exhibits very low NO concentration due to the rapid mixing of fuel and air, higher gas flow rates, and lower temperatures. The distribution curves of temperature and NO concentration along the combustor’s center axis (Figure 10) reveal a positive correlation between NO concentration and temperature. Without hydrogen, the peak NO concentration in the furnace chamber is 180 ppm, whereas, at 60% hydrogen content, it rises to 460 ppm, representing a relative increase of 155%.
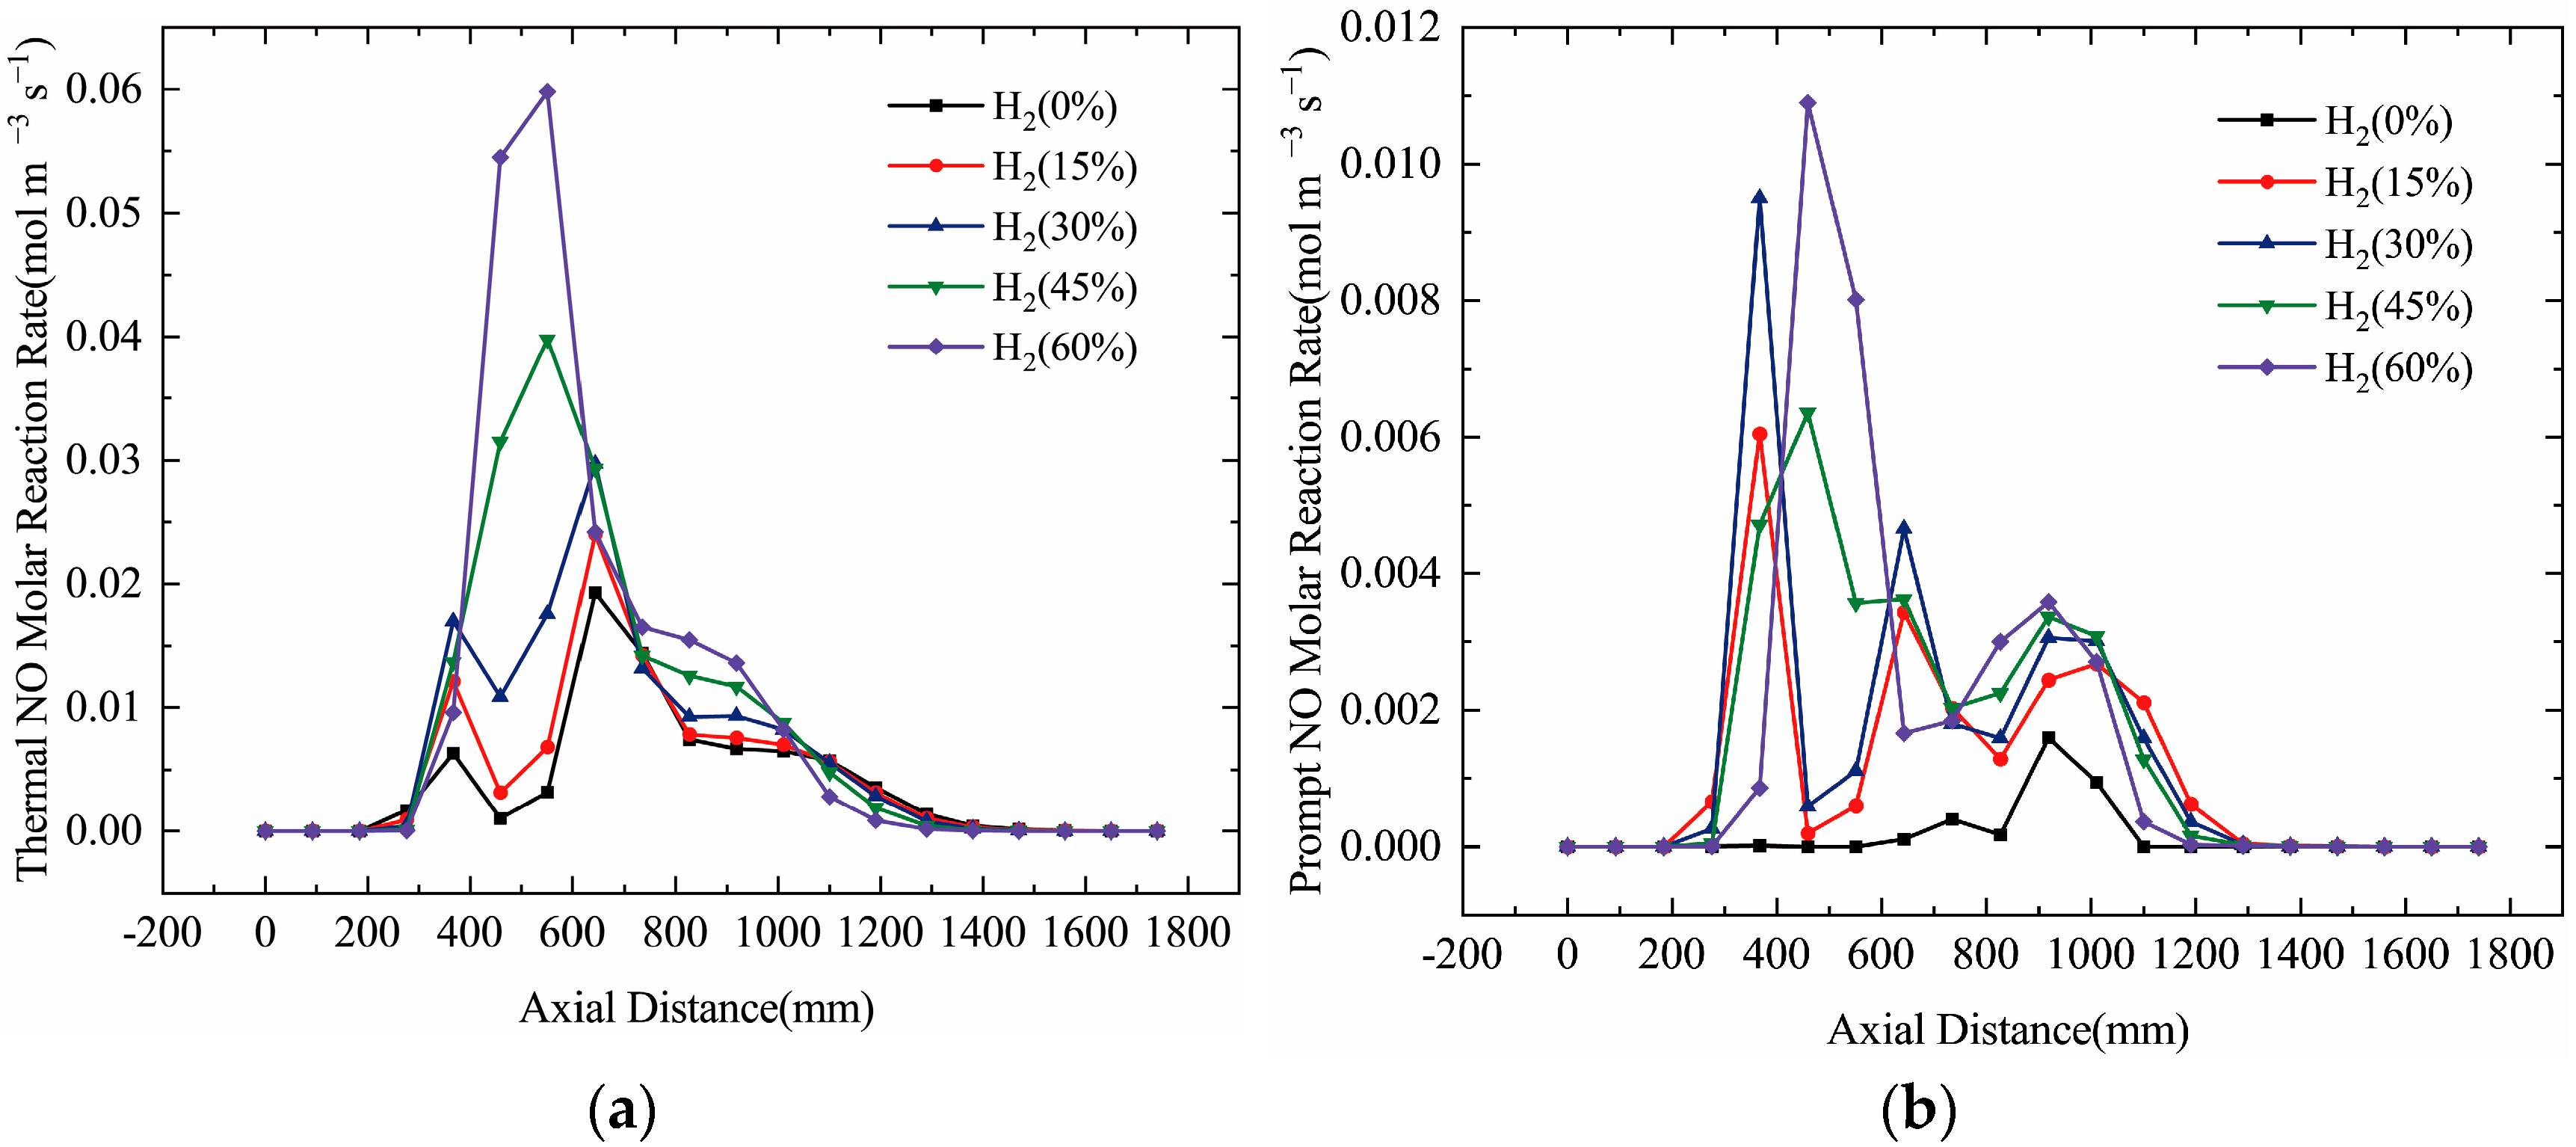
Figure 11 displays the NO production rate along the burner’s center axis, showing that thermal NO production is significantly higher than prompt NO production. The NO content in the furnace chamber primarily consists of thermal NO. As hydrogen content increases, both thermal and prompt NO production rates rise. With pure natural gas combustion, prompt NO production is negligible, resulting in low NO concentrations. At the end of combustion, both NO production rates decline to zero.

3.4. Effect of Hydrogen on CO2, CO Production

Figure 12 presents the distribution of CO2 and CO concentrations along the burner’s center axis. The addition of hydrogen to natural gas effectively reduces CO2 content. Since CO2 emission is related to carbon-based fuel content, the CO2 mass fraction decreases as hydrogen content increases and methane content decreases. The CO distribution follows a similar trend, as shown in Figure 12b, with CO content decreasing with increasing hydrogen content. At 60% hydrogen, the CO mass fraction drops sharply to less than 0.03, representing a 70% reduction compared to pure natural gas fuel. CO production is primarily due to insufficient oxygen during combustion, leading to incomplete oxidation of carbon monoxide. As the hydrogen content increases from 45% to 60%, the axial CO concentration at the burner’s center decreases sharply to below 0.03. This phenomenon occurs because hydrogen is a highly combustible gas characterized by a rapid combustion rate and complete combustion properties. When 60% hydrogen is introduced, the combustion reaction becomes more complete, significantly reducing the occurrence of incomplete combustion. Furthermore, hydrogen possesses a lower molecular weight compared to methane, the primary component of natural gas. With an increased proportion of hydrogen, the overall density of the fuel mixture decreases, resulting in a higher combustion temperature. At elevated temperatures, CO is more readily oxidized to CO2, thereby decreasing CO concentration. Moreover, when the hydrogen content reaches 60%, the proportion of carbon-based fuel decreases significantly, and because the combustion product of hydrogen is solely water, the CO concentration declines sharply.
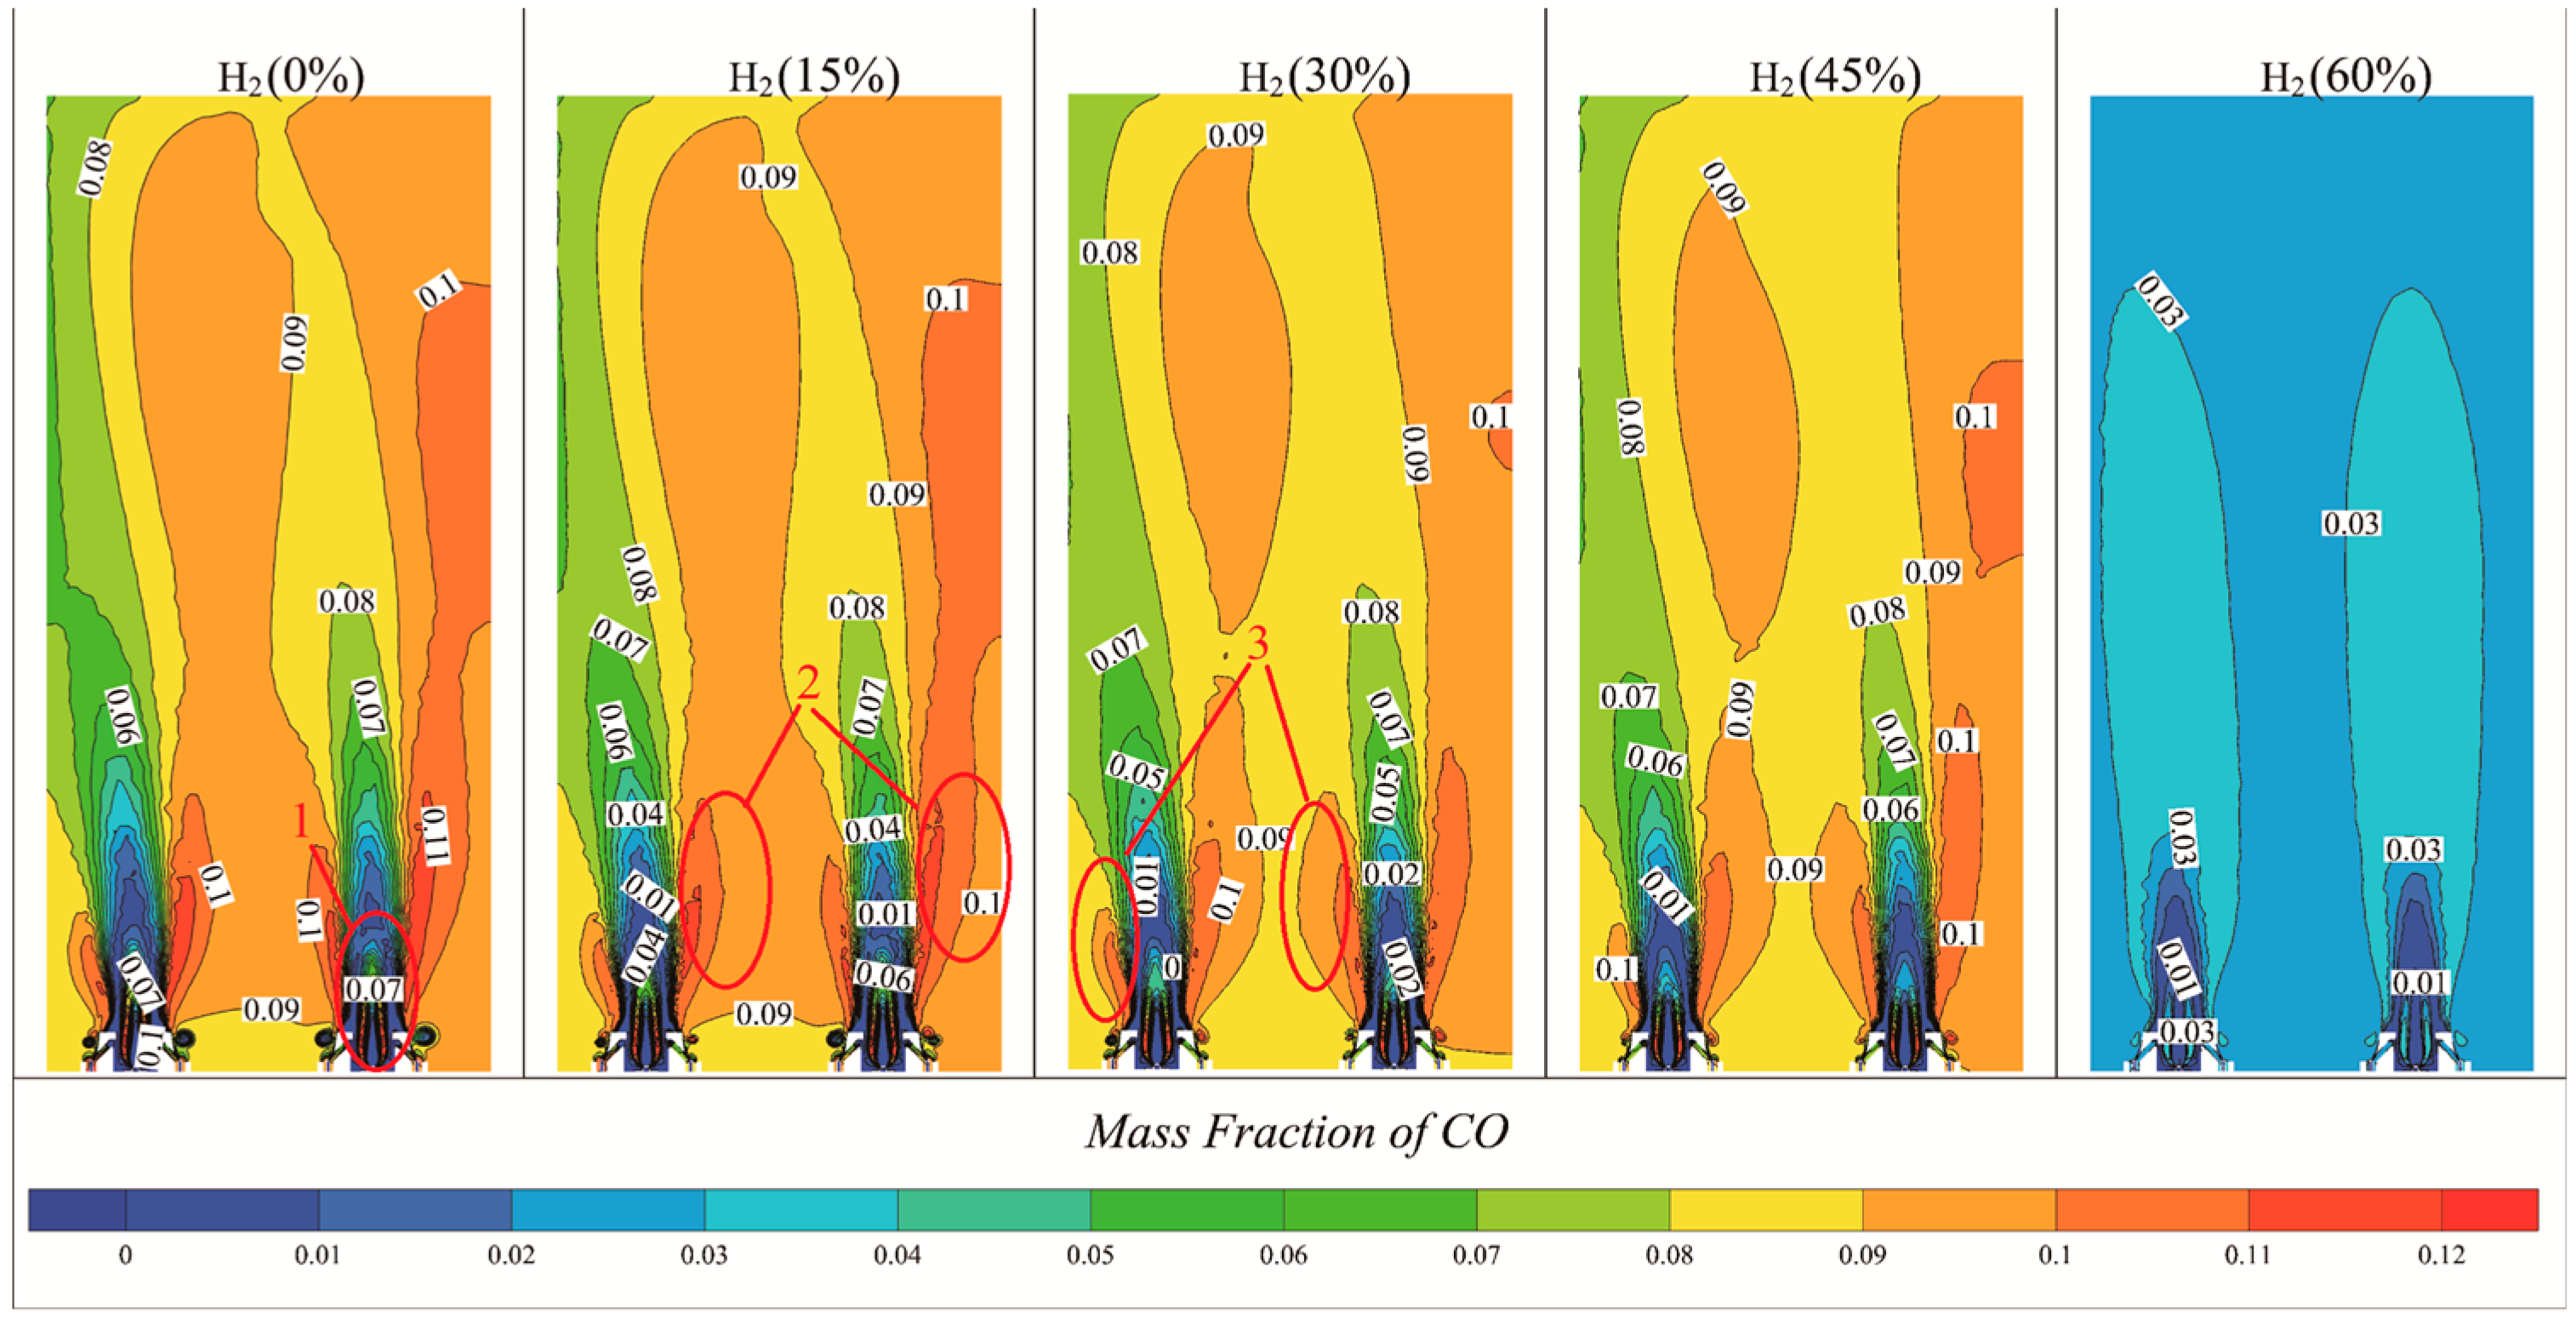
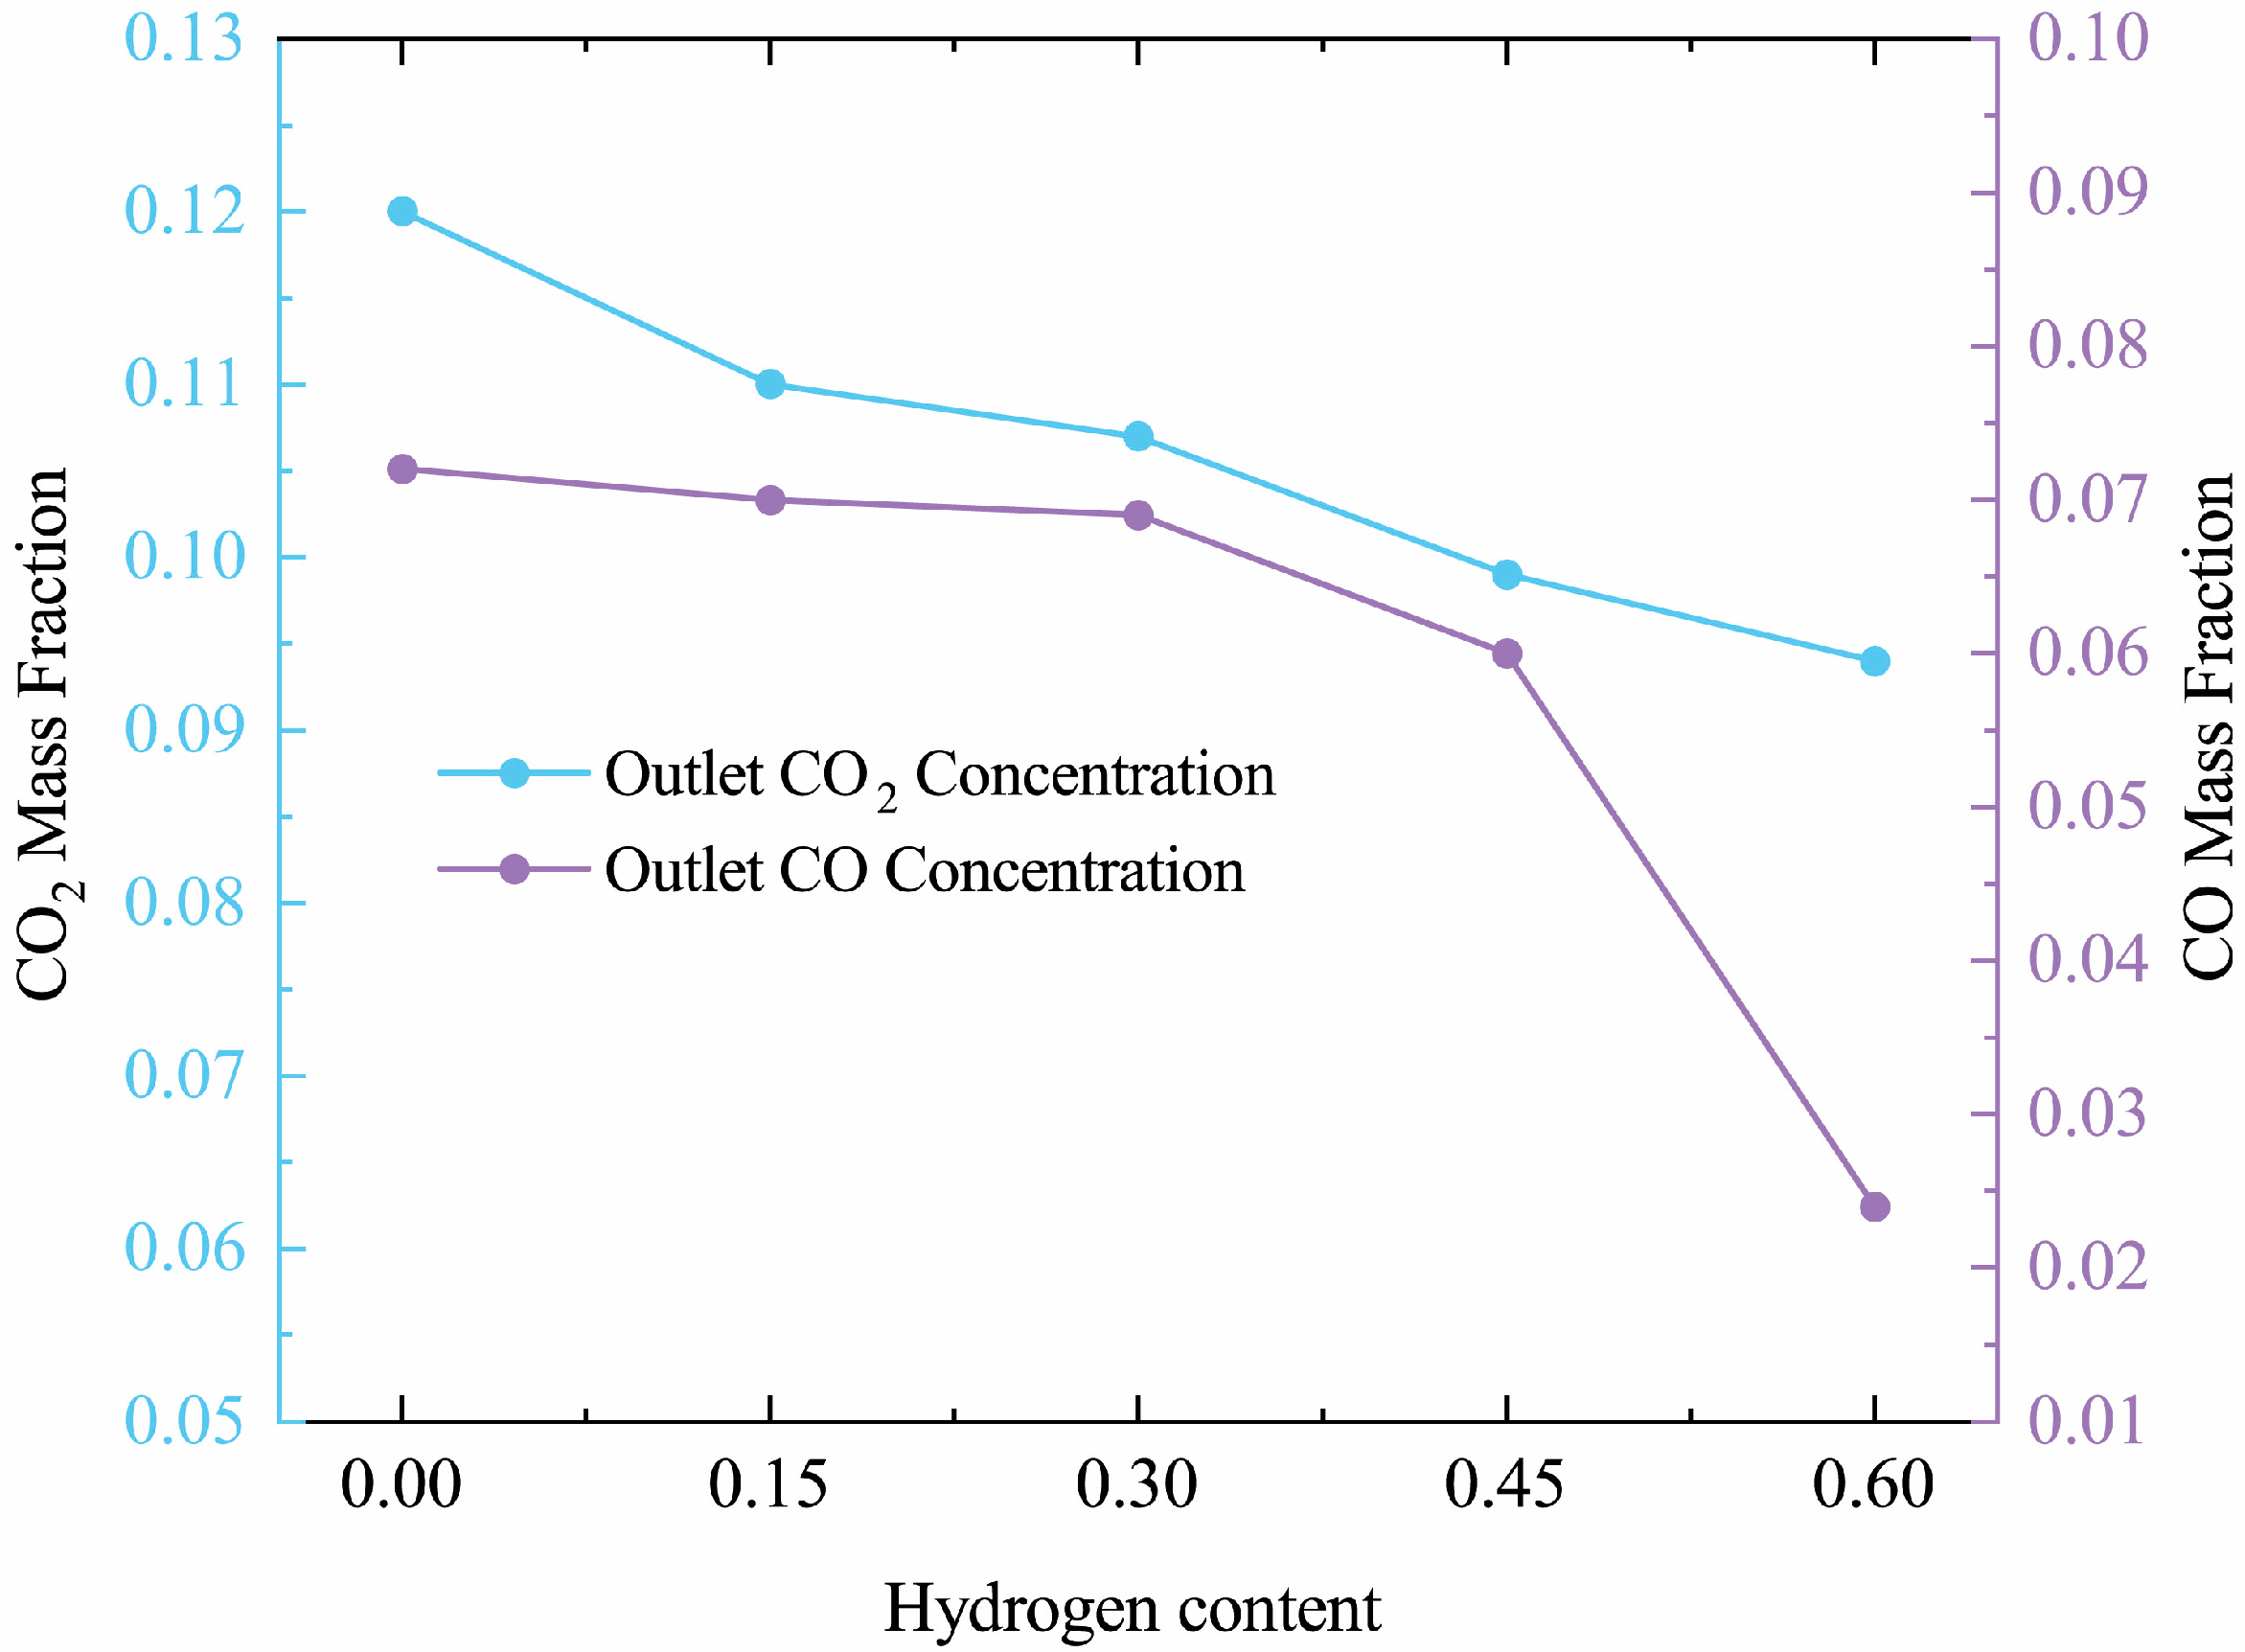
Figure 13 illustrates CO concentration distribution, revealing that insufficient oxygen in Region 1, due to the 45° angle of fuel entry and bottom air supply, results in higher CO content. CO and water vapor are the primary products of high-temperature combustion, and rapid cooling can prevent the complete oxidation of CO to CO2. High CO content in Regions 2 and 3 is attributed to proximity to the flame and rapid cooling by water vapor. Figure 14 illustrates the relationship between the mass fractions of CO2 and CO at the furnace outlet and hydrogen content. This figure clearly indicates that both CO2 and CO mass fractions decrease as hydrogen content increases, with the CO mass fraction exhibiting the most significant reduction at 60% hydrogen. This phenomenon is attributable to the sharp decline in CO concentration within the furnace. The relationship between the mass fractions of CO2 and CO at the outlet and hydrogen content demonstrates that hydrogen has a beneficial effect on reducing pollutant emissions from the furnace.

3.5. The Impact of Hydrogen on the Intermediate Product Hydroxyl (OH)

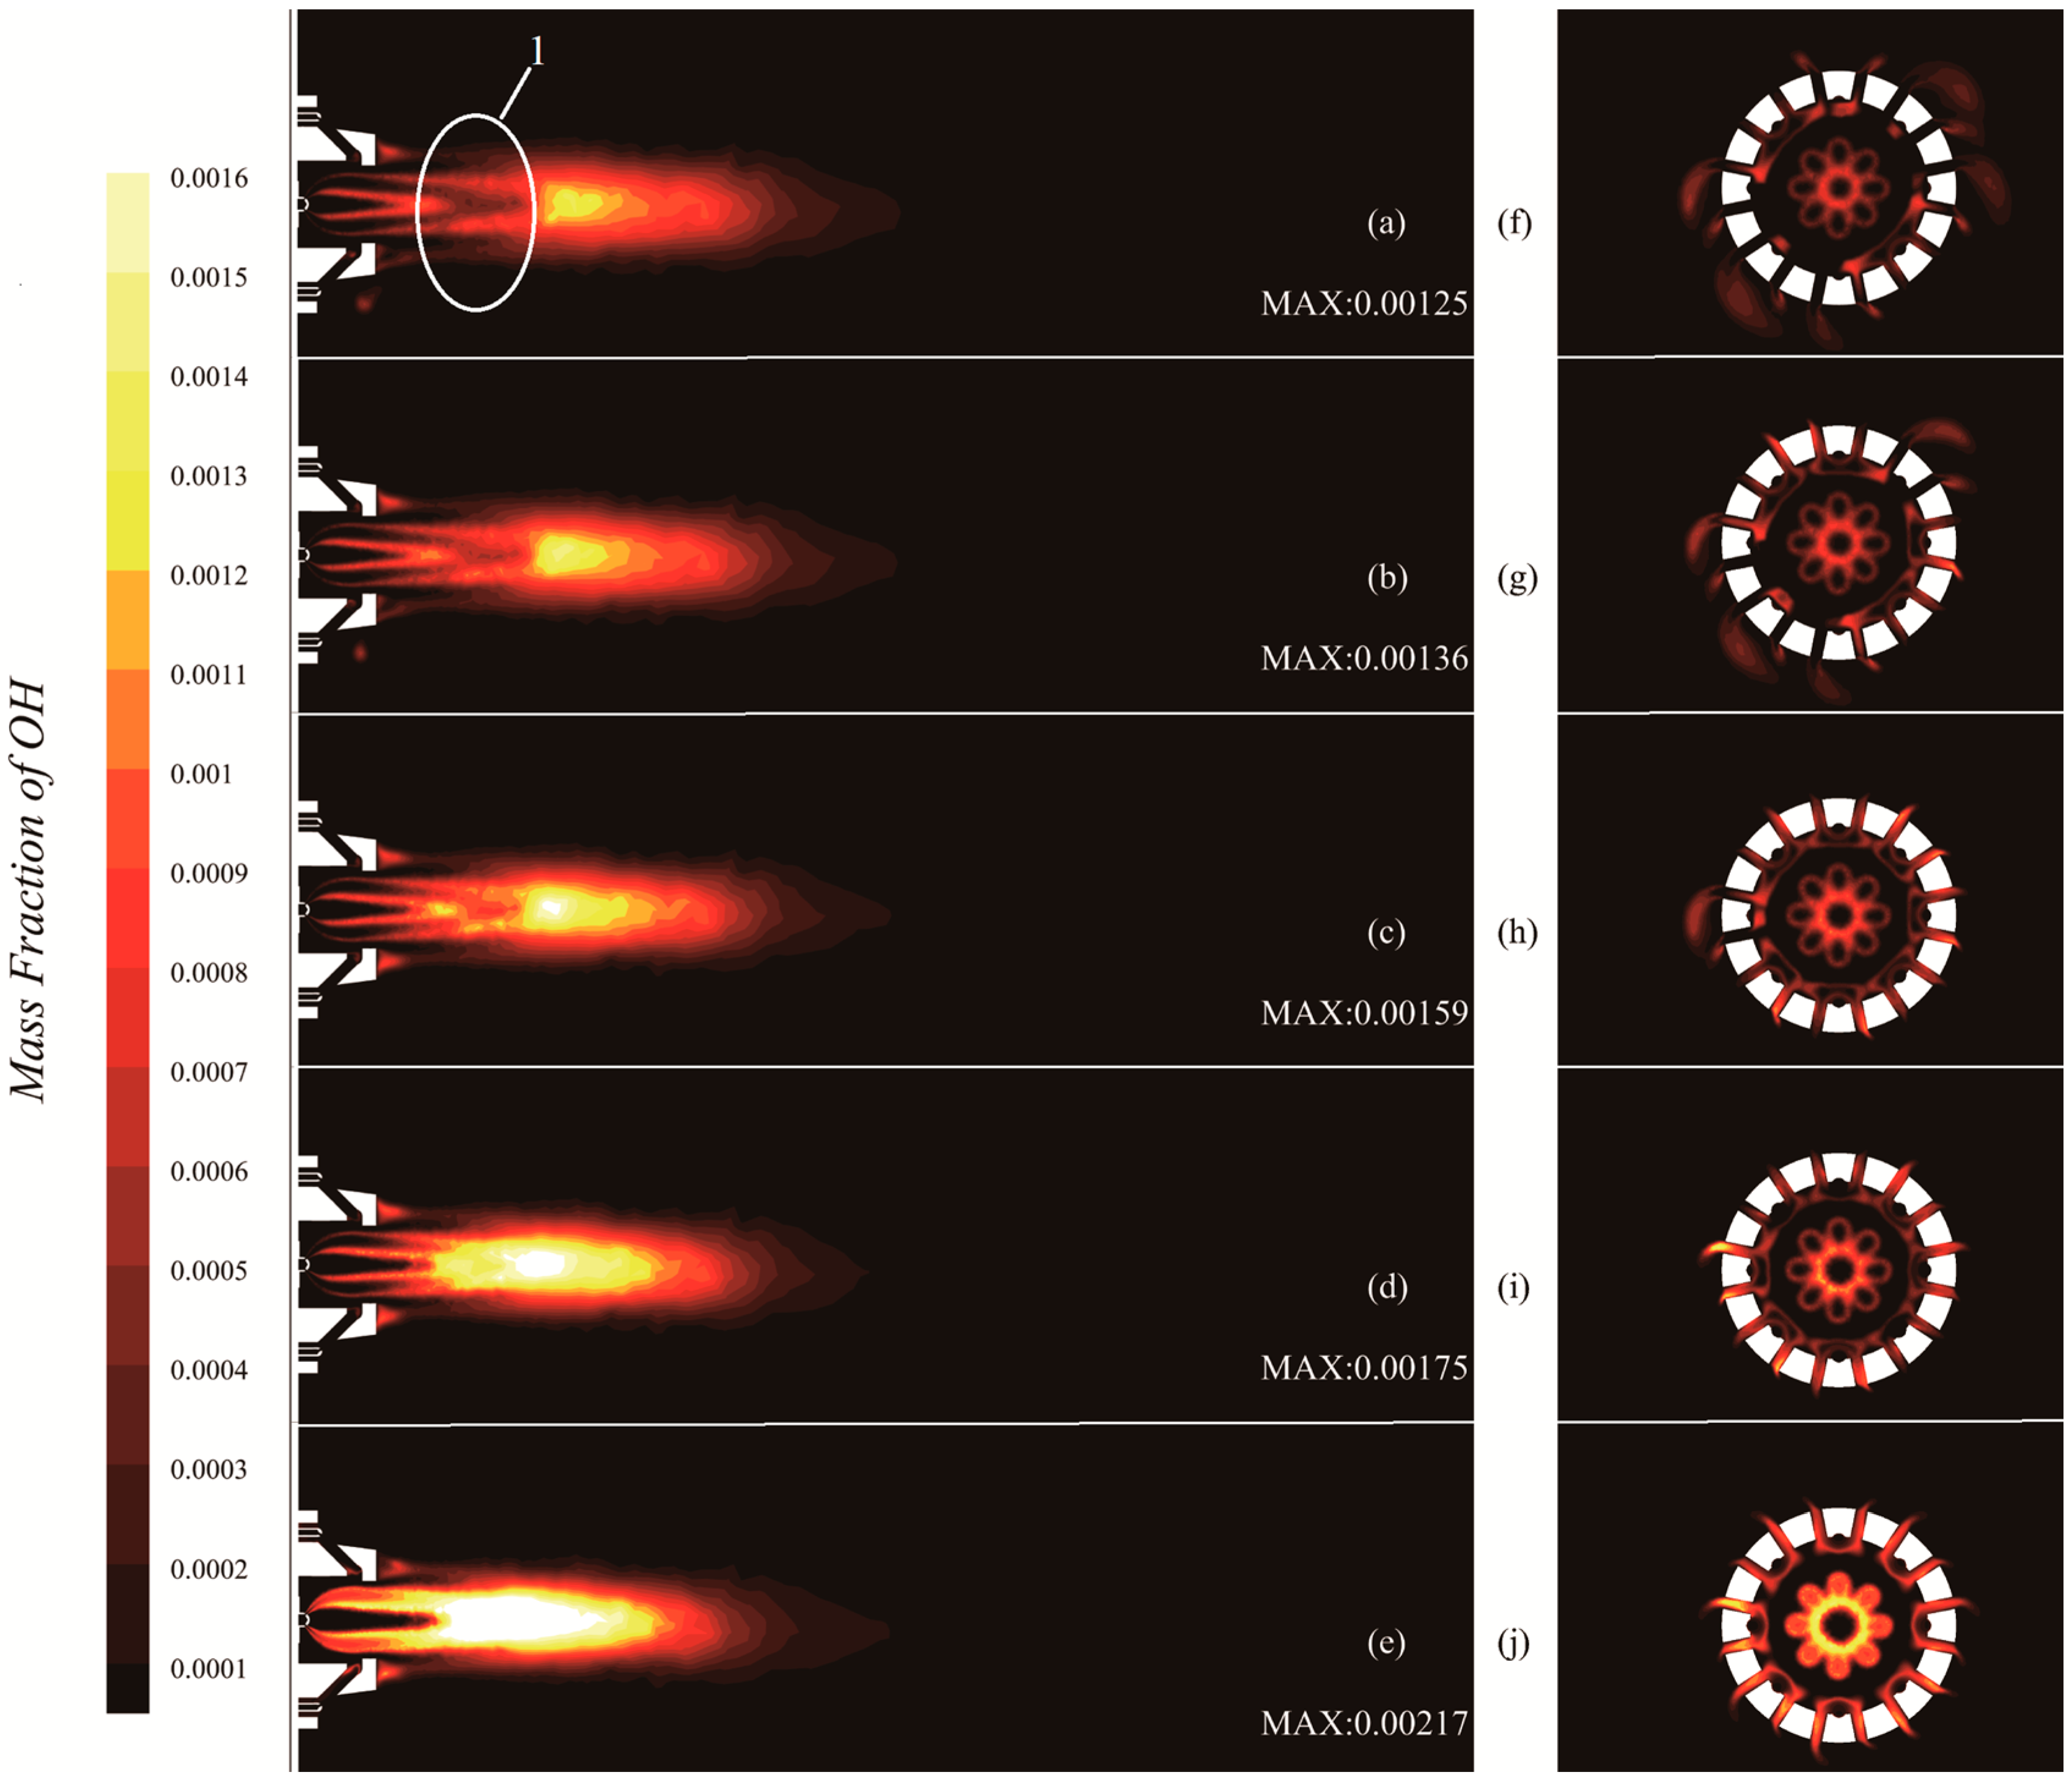
The contour (Figure 15) plots (a) through (j) illustrate the spatial distribution of the OH radical within a furnace under various combustion scenarios involving pure natural gas and natural gas mixed with differing mole fractions of hydrogen (15%, 30%, 45%, and 60%). The OH radical is a crucial intermediate species in combustion processes, and its distribution offers valuable insights into the reaction zones and flame structure.
Figure 15a illustrates the combustion of pure natural gas, with the OH mass fraction predominantly concentrated near the burner, indicating intense combustion at the flame front. The distribution pattern reveals localized reaction zones, with pronounced stratification evident in Region 1, indicating incomplete combustion in that area. Figure 15b–e depict increasing hydrogen additions (15%, 30%, 45%, and 60%). As hydrogen content increases, the OH concentration zone significantly expands within the furnace. In Figure 15b,c, the addition of 15% and 30% hydrogen results in a broader OH distribution compared to pure natural gas, signifying enhanced flame propagation and a more extensive reaction zone, while the stratified region notably diminishes, indicating improved combustion efficiency due to the introduction of hydrogen. In Figure 15d,e, with higher hydrogen ratios (45% and 60%), the OH mass fraction further expands within the furnace, covering a larger volume, with the OH mass fraction increasing from 0.00125 to 0.00217, reflecting a gradual rise in OH concentration due to elevated hydrogen content. The stratification phenomenon observed in Region 1 of Figure 15a is eliminated, indicating that the greater reactivity of hydrogen enhances the reaction rate, thereby promoting flame stability and increasing overall flame velocity. Figure 15f–j concentrate on the distribution of the OH mass fraction surrounding the burner, providing a clearer view of flame anchoring and combustion intensity. As hydrogen is introduced, Figure 15f–j reveal a gradual expansion of regions with high OH concentration near the burner, indicating that hydrogen enhances local flame intensity and facilitates efficient combustion.
The addition of hydrogen to the fuel mixture enhances overall flame reactivity, as evidenced by the broader and more uniformly distributed OH mass fraction within the furnace. This phenomenon is attributable to hydrogen’s higher diffusivity and lower ignition energy, which accelerate combustion reactions and result in a more uniform flame front. With increased hydrogen content, the flame appears more stable and propagates more efficiently throughout the furnace, reducing localized hot spots and resulting in a more uniform temperature distribution. This enhancement can improve furnace performance by increasing thermal efficiency and reducing emissions. The OH radical, a key indicator of the combustion reaction zone, highlights the differences in flame structure between pure natural gas combustion and hydrogen-enriched mixtures. The higher OH concentrations in hydrogen-enriched flames suggest accelerated combustion kinetics and more complete fuel oxidation.

4. Conclusions

This paper mainly investigates the combustion characteristics and pollutant distribution in an industrial heating furnace using a Non-Premixed Combustion Model. Firstly, the results of the numerical simulation of natural gas combustion were compared with experimental measurements to confirm the reliability of the numerical simulation; secondly, the combustion characteristics of natural gas doped with different contents of hydrogen and the effects on pollutants produced were investigated, and the following main conclusions were drawn:
(1)
Numerical Simulation Validation: The CFD numerical simulation results for natural gas combustion were validated against experimental measurements, confirming the reliability of the numerical model. It was observed that the flame temperature increased by 47 K, 52 K, 72 K, and 91 K with the addition of 15%, 30%, 45%, and 60% molar mass hydrogen, respectively. Although the flame temperature showed a noticeable increase, the change in the outlet temperature of the heater was minimal.
(2)
Turbulence Characteristics: The intensity and velocity of turbulence within the furnace chamber increased with higher hydrogen content, demonstrating a more pronounced effect compared to pure natural gas combustion. This increase in turbulence led to observable changes in both the height and width of the flame.
(3)
NO Concentration: As the hydrogen content in natural gas increased, both the flame temperature and NO concentration rose. Specifically, at 60% hydrogen content, the NO concentration in the furnace chamber increased by 155% compared to pure natural gas combustion, and the NO concentration at the furnace outlet rose by 146%. Thus, higher hydrogen content correlates with an increase in NO emissions.
(4)
CO2 and CO Emissions: The introduction of hydrogen into the natural gas mixture led to a reduction in carbon content, resulting in significant decreases in CO2 and CO emissions. At 60% hydrogen content, CO2 and CO levels decreased by 37.5% and 70%, respectively.

Author Contributions

Conceptualization, Y.L. and Z.W.; methodology, Y.L.; software, Z.W.; validation, Y.L., Z.W. and W.Y.; formal analysis, Z.W.; investigation, Z.W.; resources, J.X. and W.Y.; data curation, Y.L.; writing—original draft preparation, Z.W.; writing—review and editing, Z.W.; visualization, Z.W.; supervision, Y.L.; project administration, Y.L. All authors have read and agreed to the published version of the manuscript.

Funding

This research was funded by the Shanghai Soft Science Research Program, “Science and Technology Innovation Action Plan” (23692102600), and by the Shanghai Engineering and Technology Research Center Construction Program (19DZ2254800).

Data Availability Statement

The datasets presented in this article are not readily available due to privacy.

Conflicts of Interest

Author Wulang Yi was employed by the company Pulin Zhike (Shanghai) Technology Co., Ltd. The remaining authors declare that the research was conducted in the absence of any commercial or financial relationships that could be construed as a potential conflict of interest.

References

  1. Wang, K.; Xie, D.; Cao, Q.; Hu, J.; Tang, Y.; Shi, B.; Wang, N. Characteristics of Oxy-Methane Flame in an Axial/Tangential Swirl Jet Burner. Exp. Therm. Fluid Sci. 2022, 139, 110732. [Google Scholar] [CrossRef]
  2. Cheng, J.; Liu, B.; Zhu, T. Characterizing Combustion Instability in Non-Premixed Methane Combustion Using Internal Flue Gas Recirculation. Appl. Energy 2024, 370, 123602. [Google Scholar] [CrossRef]
  3. Wang, C.; Wang, C.; Pan, H.; Yue, Y. Effect of Structure Parameters on Low Nitrogen Performance of Burner Based on Orthogonal Experiment Method. Case Stud. Therm. Eng. 2022, 39, 102404. [Google Scholar] [CrossRef]
  4. Mu, L.; Wang, S.; Lu, J.; Liu, G.; Zhao, L.; Lan, Y. Effect of Flue Gas Condensing Waste Heat Recovery and Its Pressure Drop on Energy Saving and Carbon Reduction for Refinery Heating Furnace. Energy 2023, 279, 128081. [Google Scholar] [CrossRef]
  5. Bowman, C.T. Control of Combustion-Generated Nitrogen Oxide Emissions: Technology Driven by Regulation. Symp. (Int.) Combust. 1992, 24, 859–878. [Google Scholar] [CrossRef]
  6. Zhao, H.; Zhao, D.; Dong, X. Investigation on NO Emissions and Thermal Performance of an Ammonia/Methane-Fuelled Micro-Combustor. Int. J. Hydrogen Energy 2024, 58, 912–923. [Google Scholar] [CrossRef]
  7. Nhan, H.K.; Kwon, M.; Kim, S.; Park, J.H. CFD Investigation of NOx Reduction with a Flue-Gas Internal Recirculation Burner in a Mid-Sized Boiler. J. Mech. Sci. Technol. 2019, 33, 2967–2978. [Google Scholar] [CrossRef]
  8. Nada, Y.; Kidoguchi, Y.; Matsumoto, M.; Sugiyama, K.; Oono, T.; Fujii, Y.; Horikawa, R. Effects of Spacing between Fuel and Oxidizer Nozzles on NOx Emission from Spray Combustion Furnace Operating under Various Oxidizer Temperatures. Fuel 2024, 366, 131398. [Google Scholar] [CrossRef]
  9. Swaminathan, S.; Spijker, C.; Raonic, Z.; Koller, M.; Kofler, I.; Raupenstrauch, H. Numerical Study of an Industrial Burner to Optimise NOx Emissions and to Evaluate the Feasibility of Hydrogen-Enriched Fuel. Int. J. Hydrogen Energy 2024, 49, 1210–1220. [Google Scholar] [CrossRef]
  10. Ortolani, A.; Yeadon, J.; Ruane, B.; Paul, M.C.; Campobasso, M.S. Numerical and Experimental Analysis of the Formation of Nitrogen Oxides in a Non-Premixed Industrial Gas Burner. Results Eng. 2024, 23, 102392. [Google Scholar] [CrossRef]
  11. Chen, J.; Fan, W.; Feng, G.; Guo, H.; Zhang, H. NO Emission Characteristics of Air Coflowed Non-Premixed Ammonia Jet Flame at Elevated Ambient Temperatures and with N2 Dilution. J. Clean. Prod. 2024, 435, 140463. [Google Scholar] [CrossRef]
  12. Shan, X.; Yu, W.; Hu, B.; Wen, K.; Ren, S.; Men, Y.; Li, M.; Gong, J.; Zheng, H.; Hong, B. A Methodology to Determine Target Gas Supply Reliability of Natural Gas Pipeline System Based on Cost-Benefit Analysis. Reliab. Eng. Syst. Saf. 2024, 251, 110364. [Google Scholar] [CrossRef]
  13. Di, T.; Sun, X.; Chen, P.; Huang, Q.; Liu, X. A Novel Static Mixer for Blending Hydrogen into Natural Gas Pipelines. Int. J. Hydrogen Energy 2024, 86, 1118–1128. [Google Scholar] [CrossRef]
  14. Huang, Z.; Jin, H.; Ma, H.; Yu, X.; Li, Y.; Wang, C. Experimental Study on Flame Behaviors and Dynamic Parameters Induced by Hydrogen Jet Flame in an Enclosed Compartment. Therm. Sci. Eng. Prog. 2024, 54, 102851. [Google Scholar] [CrossRef]
  15. Sekar, M.; Alahmadi, T.A.; Nithya, S. Numerical Simulation of Industrial Gas Burners Fueled with Hydrogen-Methane Mixtures for Enhanced Combustion Efficiency and Reduced Greenhouse Gas Emissions. Fuel 2024, 370, 131807. [Google Scholar] [CrossRef]
  16. Cellek, M.S.; Pınarbaşı, A. Investigations on Performance and Emission Characteristics of an Industrial Low Swirl Burner While Burning Natural Gas, Methane, Hydrogen-Enriched Natural Gas and Hydrogen as Fuels. Int. J. Hydrogen Energy 2018, 43, 1194–1207. [Google Scholar] [CrossRef]
  17. Yang, H.; Jin, S.; He, Y.; Liu, Y. Experimental Study on Flame Temperature Distribution and Pollutant Emission Characteristics of CH4 Mixed with CO2/N2/H2 Combustion. Int. J. Hydrogen Energy 2024, 71, 750–762. [Google Scholar] [CrossRef]
  18. Xu, S.; Chen, Y.; Tian, Z.; Liu, H. NO Emission Reduction Characteristics of CH4/H2 Staged MILD Combustion over a Wide Range of Hydrogen-Blending Ratios. Fuel 2024, 372, 132239. [Google Scholar] [CrossRef]
  19. Gan, Z.; Yang, S.; Wang, H. Investigation of the Heating Characteristics of Turbulent Non-Premixed Gas Combustion in the Industrial-Scale Walking Beam Type Reheating Furnace. Appl. Therm. Eng. 2024, 257, 124212. [Google Scholar] [CrossRef]
  20. Yao, Q.; Zhang, Y.; Wang, X.; Tian, Z.; Hu, G.; Du, W. Investigation of NOx Emission under Different Burner Structures with the Optimized Combustion Model. Neurocomputing 2022, 482, 224–235. [Google Scholar] [CrossRef]
  21. Bose, D.; Kumar, I.; Hens, A. Enhancing Fuel-Air Mixing in COG-BOG Non-Premixed Combustion: A CFD Analysis with Different Turbulent Models. J. Indian Chem. Soc. 2024, 101, 101222. [Google Scholar] [CrossRef]
  22. Wu, X.; Guo, Q.; Gong, Y.; Liu, J.; Luo, X.; Wu, T.; Yu, G. Influence of Burner Geometry on Atomization of Coal Water Slurry in an Entrained-Flow Gasifier. Chem. Eng. Sci. 2022, 247, 117088. [Google Scholar] [CrossRef]
  23. Roy, S.; Shuai, R.; Wang, P.; Zhang, Z.; Qian, W.; Ferrante, A.; Dai, K. Combustor Shape Optimization and NO Emission Characteristics for Premixed NH3-CH4 Turbulent Swirling Flame towards Sustainable Combustion. Aerosp. Sci. Technol. 2024, 150, 109216. [Google Scholar] [CrossRef]
  24. Zeldovich, Y.B.; Sadovnikov, P.Y.; Frank-Kamenetskii, D.A. Oxidation of Nitrogen in Combustion; Academy of Sciences: Moscow, Russia, 1947. [Google Scholar]
  25. Masum, B.M.; Masjuki, H.H.; Kalam, M.A.; Rizwanul Fattah, I.M.; Palash, S.M.; Abedin, M.J. Effect of Ethanol–Gasoline Blend on NOx Emission in SI Engine. Renew. Sustain. Energy Rev. 2013, 24, 209–222. [Google Scholar] [CrossRef]
  26. Irace, P.H.; Gopan, A.; Axelbaum, R.L. An Investigation of Thermal Radiation from Laminar Diffusion Flames in a Tri-Coflow Burner with Central Oxygen. Combust. Flame 2022, 242, 112158. [Google Scholar] [CrossRef]
  27. Hanson, R.K.; Salimian, S. Survey of Rate Constants in the N/H/O System. In Combustion Chemistry; Gardiner, W.C., Ed.; Springer: New York, NY, USA, 1984; pp. 361–421. ISBN 978-1-4684-0188-2. [Google Scholar]
  28. Glarborg, P.; Miller, J.A.; Kee, R.J. Kinetic Modeling and Sensitivity Analysis of Nitrogen Oxide Formation in Well-Stirred Reactors. Combust. Flame 1986, 65, 177–202. [Google Scholar] [CrossRef]
  29. De Soete, G.G. Overall Reaction Rates of NO and N2 Formation from Fuel Nitrogen. Symp. (Int.) Combust. 1975, 15, 1093–1102. [Google Scholar] [CrossRef]
  30. Dupont, V.; Pourkashanian, M.; Williams, A.; Woolley, R. The Reduction of NOx Formation in Natural Gas Burner Flames. Fuel 1993, 72, 497–503. [Google Scholar] [CrossRef]
  31. Shang, X.; Xie, J.; Chen, J.; Gu, Y. Numerical Study on Combustion Characteristics of Biogas Cocombustion in a 300 MW Coal-Fired Boiler Furnace. ACS Omega 2024, 9, 20378–20387. [Google Scholar] [CrossRef]
  32. Lu, L.; Jiang, H. Study of NO and CO Formation Pathways in Jet Flames with CH4/H2 Fuel Blends. Energies 2024, 17, 4382. [Google Scholar] [CrossRef]
  33. Wang, D.; Tan, Z.; Xu, J.; Meng, H. Quantitative Studies of NO Emissions from Various Reaction Pathways in Swirling Combustion of Hydrogen-Enriched Methane. Int. J. Hydrogen Energy 2024, 53, 409–421. [Google Scholar] [CrossRef]
  34. Lu, C.; Zhang, L.; Cao, C.; Chen, X.; Xing, C.; Shi, H.; Liu, L.; Qiu, P. The Effects of N2 and Steam Dilution on NO Emission for a H2/Air Micromix Flame. Int. J. Hydrogen Energy 2022, 47, 27266–27278. [Google Scholar] [CrossRef]
  35. Ding, H.; Ouyang, Z.; Wang, W.; Zhang, X.; Zhu, S. Experimental Study on the Influence of O2/CO2 Ratios on NO Conversion and Emission during Combustion and Gasification of High-Temperature Coal Char. Fuel 2022, 310, 122311. [Google Scholar] [CrossRef]
  36. Zheng, S.; He, Y.; Hu, B.; Zhu, J.; Zhou, B.; Lu, Q. Effects of Radiation Reabsorption on the Flame Speed and NO Emission of NH3/H2/Air Flames at Various Hydrogen Ratios. Fuel 2022, 327, 125176. [Google Scholar] [CrossRef]
  37. Rrustemi, D.N.; Ganippa, L.C.; Axon, C.J. Investigation of Boost Pressure and Spark Timing on Combustion and NO Emissions under Lean Mixture Operation in Hydrogen Engines. Fuel 2023, 353, 129192. [Google Scholar] [CrossRef]
  38. Nicol, D.G.; Steele, R.C.; Marinov, N.M.; Malte, P.C. The Importance of the Nitrous Oxide Pathway to NOx in Lean-Premixed Combustion. J. Eng. Gas Turbines Power 1995, 117, 100–111. [Google Scholar] [CrossRef]
  39. Wang, J.; Cong, B.; Zhang, K.; Zheng, B. Investigation of the Temperature Field of Turbulent Non-Premixed Flame for the Variable Angles of Inclination of NexGen Burner. Case Stud. Therm. Eng. 2023, 49, 103353. [Google Scholar] [CrossRef]
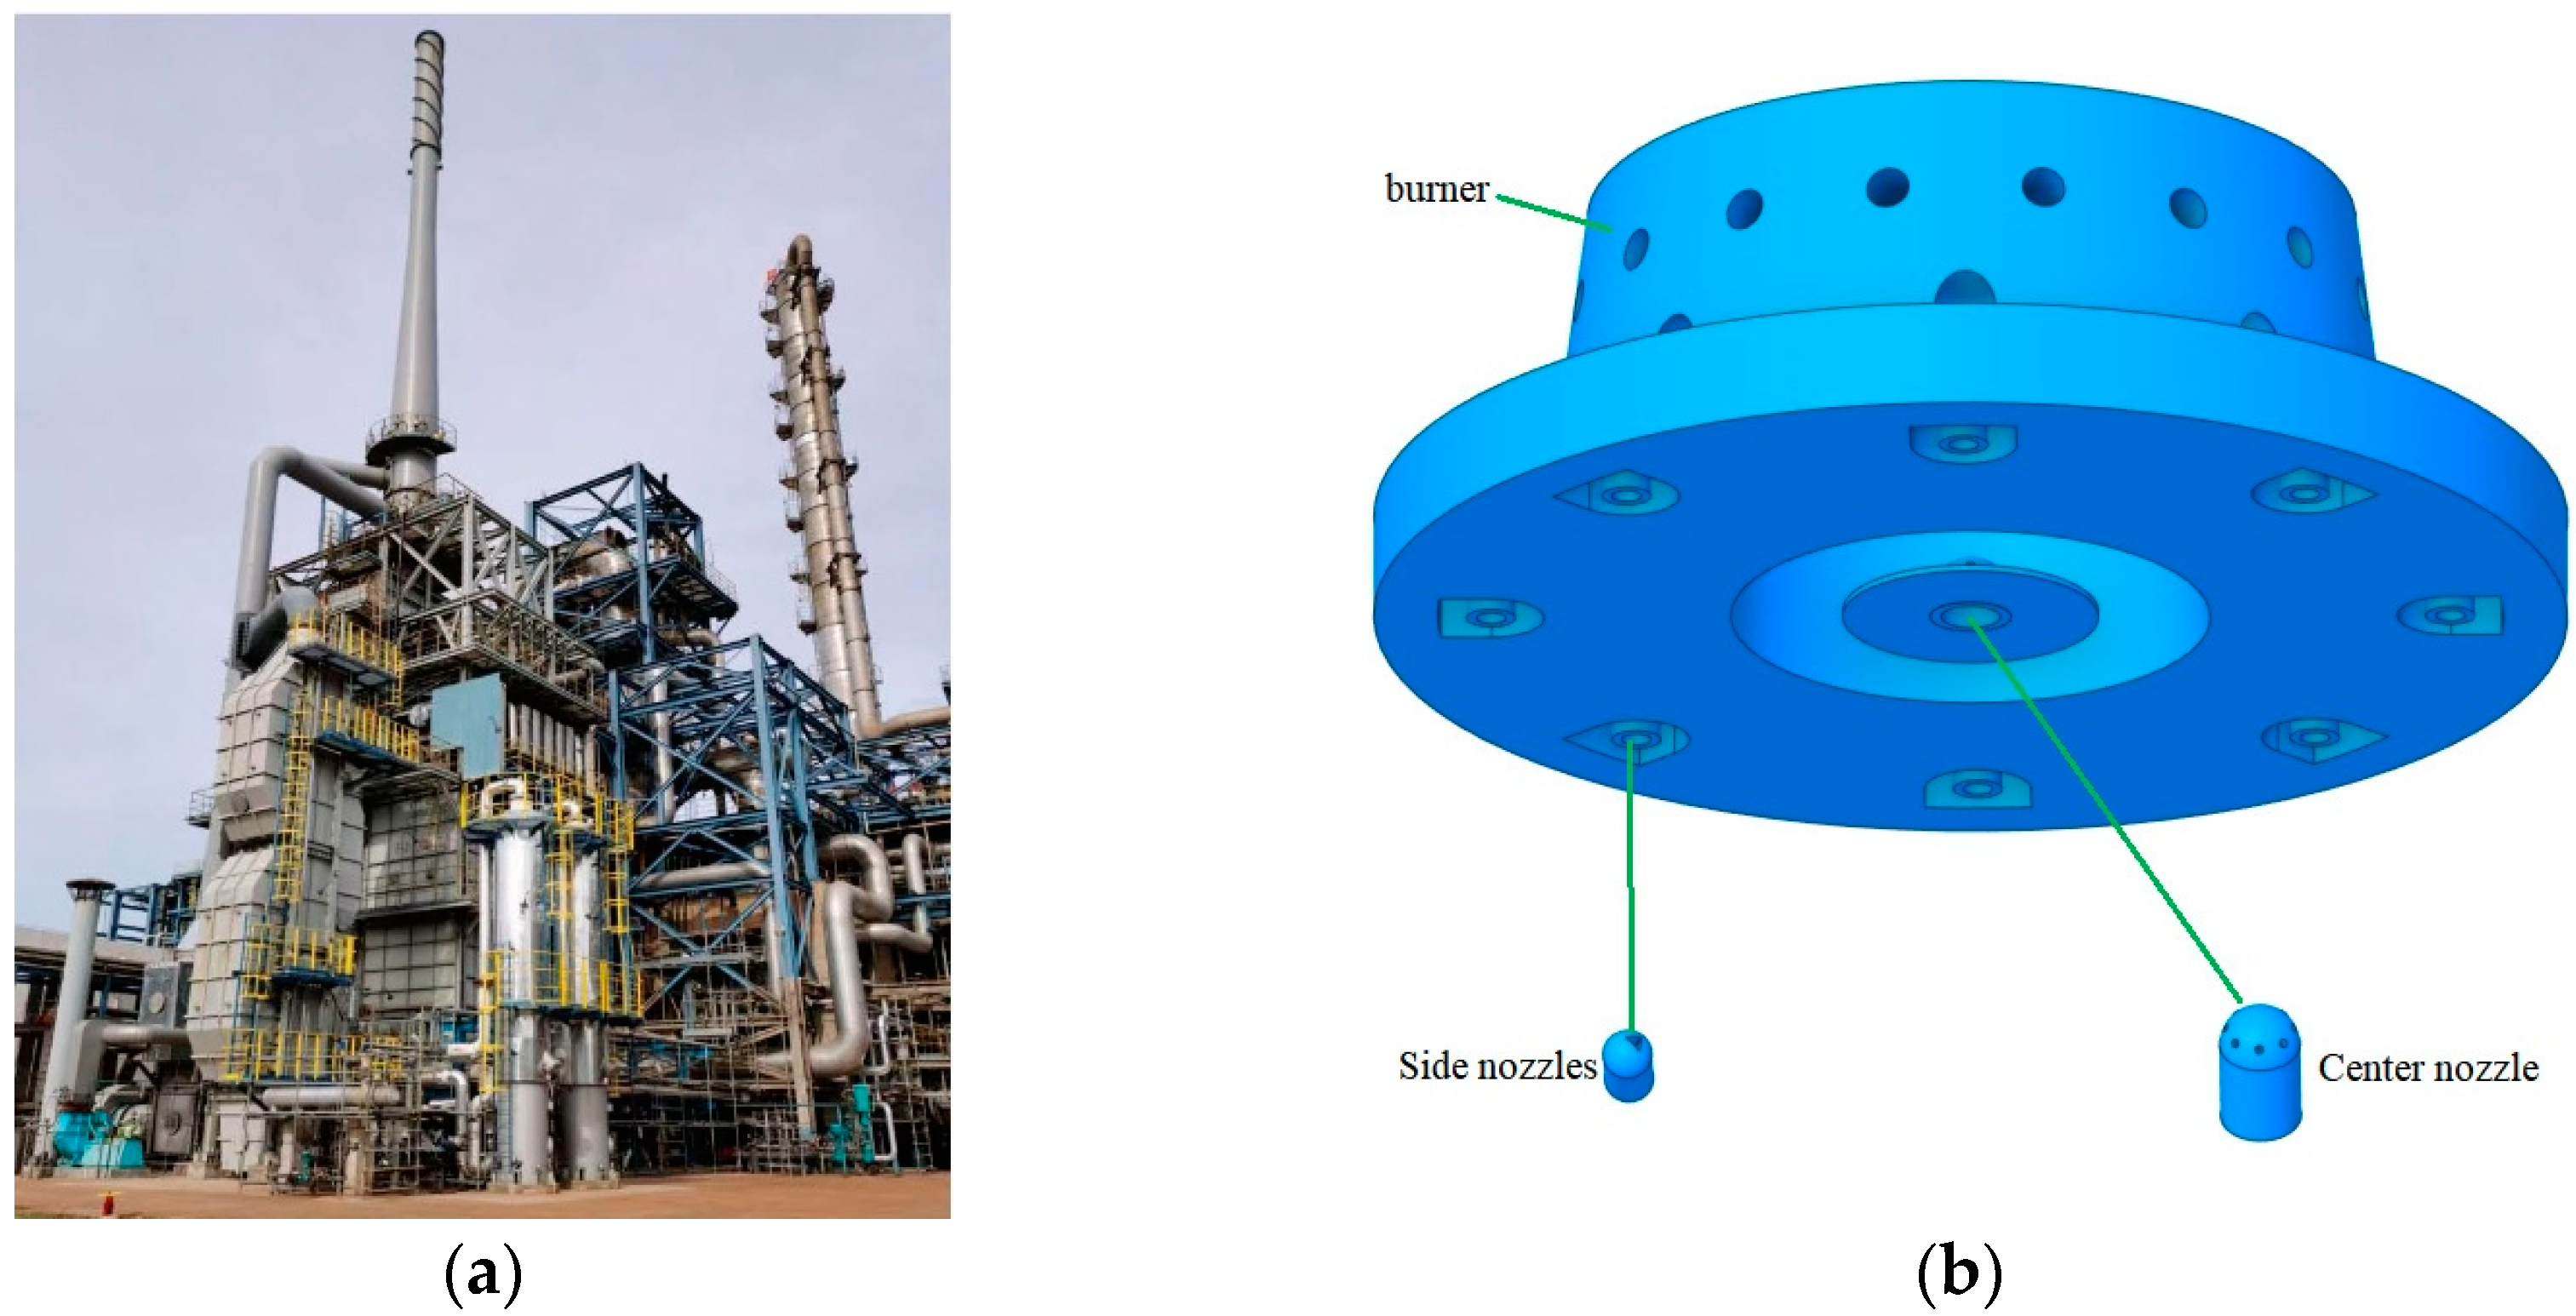
Figure 1. Experimental equipment for natural gas combustion: (a) structure of the burner, center nozzle, and side nozzles (b).
Energies 17 04959 g001
Figure 2. Numerical modeling of heating furnace.
Energies 17 04959 g002
Figure 3. Overall grid and sectional grid models.
Energies 17 04959 g003
Figure 4. Temperature distributions in the Z = −1100 mm plane for the Eddy Dissipation and Non-Premixed Combustion Models.
Energies 17 04959 g004
Figure 5. Comparison between experimental data and results from the Eddy Dissipation Model and the Non-Premixed Combustion Model.
Energies 17 04959 g005
Figure 6. Temperature distributions of the heating furnace during combustion with different hydrogen concentrations at the Z = −1100 mm section, (ae) correspond to the temperature distributions in its nozzle region, respectively.
Energies 17 04959 g006
Figure 7. Velocity distributions of the heating furnace for combustion with different hydrogen concentrations at Z = −1100 mm cross section, (ae) correspond to the velocity distributions in their nozzle regions, respectively.
Energies 17 04959 g007
Figure 8. Turbulence intensity distribution for combustion with different hydrogen concentrations in a heating furnace at a cross section of Z = −1100 mm.
Energies 17 04959 g008
Figure 9. NO ppm distribution of the heating furnace for combustion with different hydrogen concentrations at Z = −1100 mm cross section.
Energies 17 04959 g009
Figure 10. Axial temperature distribution at the center of the burner (a). Axial NO concentration distribution at the center of the burner (b).
Energies 17 04959 g010
Figure 11. Thermal NO production rate in the axial direction at the center of the burner (a). Prompt NO production rate in the axial direction at the center of the burner (b).
Energies 17 04959 g011
Figure 12. Axial CO2 mass fraction distribution in the center of the burner (a). Axial CO mass fraction distribution in the center of the burner (b).
Energies 17 04959 g012
Figure 13. Distribution of CO mass fraction in Z = −1100 mm section.
Energies 17 04959 g013
Figure 14. The variation of outlet concentrations of CO2 and CO with the hydrogen content in the fuel.
Energies 17 04959 g014
Figure 15. (ae) represent the mass fraction distribution of OH within the furnace at 0%, 15%, 30%, 45%, and 60% hydrogen concentrations, respectively. (fj) represent the mass fraction distribution of OH across the burner cross section at 0%, 15%, 30%, 45%, and 60% hydrogen concentrations, respectively.
Energies 17 04959 g015
Table 1. Numerical simulation results of NOx content with different grid cells.
Cell CountTurbulence ModelNOx (ppm)
4,574,814 Standard   k ε 62.73
2,723,223 Standard   k ε 62.77
1,884,301 Standard   k ε 62.84
1,308,430 Standard   k ε 75.83
943,477 Standard   k ε 83.64
Table 2. Species composition of different fuel mixtures (in mole fractions).
SpeciesNatural Gas15% H230% H245% H260% H2Air
CH40.95060.80060.650060.50060.35006-
C2H60.0290.0290.0290.0290.029-
C3H80.00950.00950.00950.00950.0095-
C4H100.00260.00260.00260.00260.0026-
N20.00580.00580.00580.00580.00580.79
CO20.00250.00250.00250.00250.0025-
O2-----0.21
H2-0.150.30.450.6-
Table 3. The primary chemical reaction mechanisms of the Non-Premixed Combustion Model.
No.Reaction NameChemical Reaction Equation
1Hydrogen–oxygen reaction H 2 + 0.5 O 2 H 2 O
2Carbon monoxide oxidation C O + 0.5 O 2 C O 2
3Methane oxidation C H 4 + 2 O 2 C O 2 + 2 H 2 O
4Water–gas shift reaction C O + H 2 O C O 2 + H 2
5Reverse water–gas shift reaction C O 2 + H 2 C O + H 2 O
6Hydroxyl production and consumption H 2 + O H H + H 2 O
7Hydrogen dissociation H 2 2 H
8Oxygen dissociation O 2 2 O
9Hydroxyl oxidation O H + C O H + C O 2
10Intermediate reactions in hydrogen–oxygen combustion H + O 2 O H + O
Table 4. The primary chemical reaction mechanisms of the Eddy Dissipation Combustion Model.
No.Reaction NameChemical Reaction Equation
1Complete methane combustion C H 4 + 2 O 2 C O 2 + 2 H 2 O
2Partial methane oxidation C H 4 + 1.5 O 2 C O + 2 H 2 O
3Carbon monoxide oxidation C O + 0.5 O 2 C O 2
4Water–gas shift reaction C O + H 2 O C O 2 + H 2
5Reverse water–gas shift reaction C O 2 + H 2 C O + H 2 O
6Hydrogen combustion H 2 + 0.5 O 2 H 2 O
7Hydrogen dissociation H 2 2 H
8Oxygen dissociation O 2 2 O
9Hydroxyl production and consumption H 2 + O H H + H 2 O
10Hydroxyl oxidation O H + C O H + C O 2
Table 5. Comparison of errors between experimental data and numerical simulation results.
Outlet Temperature (K)ErrorOutlet NO Concentration (ppm)Error
Experimental measurement data1094-57.92-
Eddy Dissipation11081.28%28.3551.05%
Non-Premixed11121.65%62.848.49%
Past Study11252.37%67.389%
Disclaimer/Publisher’s Note: The statements, opinions and data contained in all publications are solely those of the individual author(s) and contributor(s) and not of MDPI and/or the editor(s). MDPI and/or the editor(s) disclaim responsibility for any injury to people or property resulting from any ideas, methods, instructions or products referred to in the content.