1. Introduction
As the number of megacities continues to grow worldwide, urban air mobility (UAM) and advanced air mobility (AAM) have emerged as solutions to traffic congestion [
1]. Electric-powered UAM and AAM offer environmentally sustainable mobility services in urban areas by expanding the traditional two-dimensional transportation system into a three-dimensional one. Additionally, public service capabilities are expected to improve, including transportation during emergencies and the delivery of packages to areas inaccessible by existing transportation systems. While electric propulsion systems represent innovative technology in aviation, significant research and development are still required to fully realize AAM and UAM. One core technology that needs further development is the thermal management system (TMS) for electrical devices such as motors, inverters, and batteries [
2].
In conventional aviation propulsion systems, such as turbofan or turbojet engines, most of the heat generated by the engine is discharged into the ambient air through the engine’s air stream or absorbed by the fuel. Therefore, aside from the oil cooler, no additional TMS is necessary. However, in electric-powered propulsion systems, there is no air stream as in conventional propulsion systems, so an additional TMS is required to dissipate waste heat from the electrical components. As the power demand of the electric motor increases, waste heat also increases. Additionally, as electric devices become more compact, heat density rises, making an effective TMS increasingly important.
The basic operation of a TMS involves acquiring heat from a source, transporting it, and finally rejecting it toward terminal heat sinks [
3]. The two major types of TMS used in aircraft are direct air cooling [
4] and conventional liquid cooling [
5,
6,
7,
8]. Additionally, advanced TMS architectures, such as submerged liquid TMS [
9,
10,
11], vapor cycle TMS [
12], and TMS using refrigerants [
13,
14], are being explored for potential application in electric propulsion systems.
Air cooling systems utilize ambient air to directly cool electronic devices. Since these systems do not require additional components like heat exchangers or pumps, their structure is simple, and the overall TMS is lightweight. However, due to the low thermal conductivity of air compared to liquids, air cooling is less effective for electronic devices that require heavy-duty thermal management. In contrast, liquid cooling TMS is preferred when active temperature management and substantial heat dissipation are necessary.
Conventional liquid cooling TMSs typically consist of components such as heat exchangers, pumps, ram air-related elements, and coolant passages. Various studies have designed and simulated conventional liquid-based TMSs for electric propulsion systems. Lents et al. [
5] conceptually studied the TMS architecture for a parallel hybrid geared turbofan engine and estimated the weight of the TMS. In their study, since the fuel temperature was not suitable to serve as a heat sink for the battery coolant and motor drive, the coolant loop for the electric devices was cooled using ram air. Chapman et al. [
6,
7] designed and simulated liquid cooling TMS for three electrified aircraft propulsion concepts and a six-passenger quadrotor concept vehicle, utilizing a compact plate-fin type heat exchanger. Zhao et al. [
8] focused on optimizing the liquid cooling system for batteries on eVTOL aircraft. Their study calculated the performance of the thermal management system under various flight conditions and examined the impact of thermal management on battery degradation. Li et al. [
14] designed a liquid cooling TMS for lithium-ion batteries, incorporating a flow distributor and spiral channel to ensure uniform temperature distribution within the battery pouch. These studies suggest that a liquid-based TMS, usually using a water–ethylene glycol mixture or a water–propylene glycol mixture, is feasible for application in electric propulsion systems.
One of the key components of the conventional liquid cooling TMS for electric propulsion systems is the heat exchanger, which dissipates heat from the coolant to the ram air. Therefore, designing and evaluating the performance of the heat exchanger is important for the TMS design. Given the critical importance of volume and weight in such systems, plate-fin heat exchangers are commonly employed in mobility applications. These heat exchangers can feature various types of fin configurations, including louvered fins, offset strip fins, perforated fins, and wavy fins [
15]. Among these, offset strip fins are particularly favored for enhancing air-side heat transfer, and have been widely used in applications such as oil coolers and intercoolers in the mobility sector [
16]. Additionally, offset strip fins have been utilized in aircraft oil coolers [
17] and extensively in aerospace applications [
18], making them a strong candidate for use in TMS for eVTOL systems.
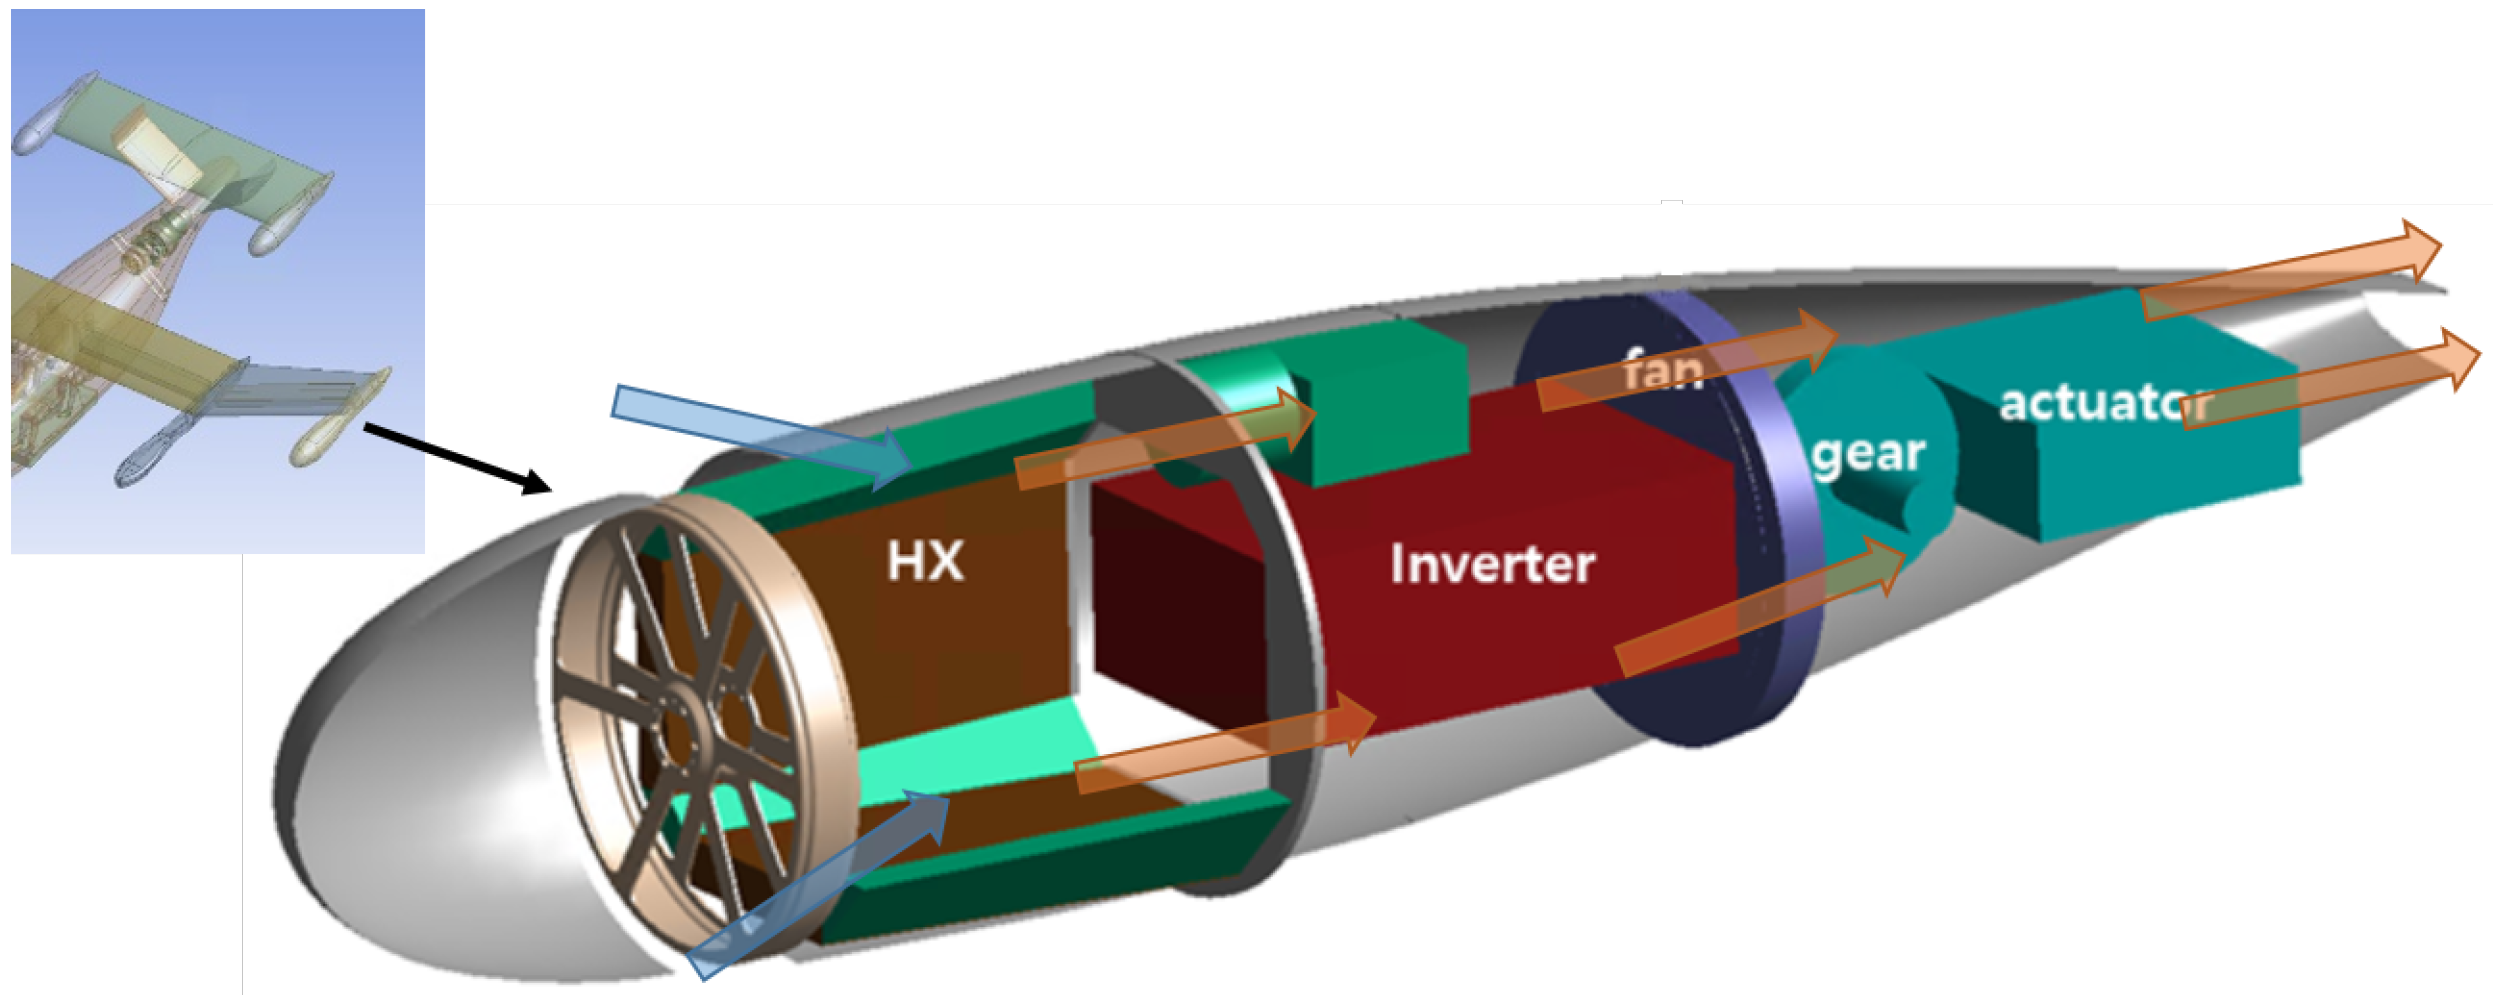
The electric propulsion system and the TMS are usually installed inside the nacelle, as shown in
Figure 1. To minimize drag, the nacelle’s diameter must be kept as small as possible. Due to the limited space inside the nacelle and drag considerations, it is challenging to install the TMS heat exchanger perpendicularly to the ram air flow. Consequently, the heat exchanger is installed at an inclined angle, creating a specific angle between the ram air flow and the heat exchanger, as illustrated in
Figure 1. However, heat exchangers are typically designed and evaluated under conditions where they are installed perpendicularly to the airflow. Therefore, studying the effect of the heat exchanger’s inclination angle on its performance is crucial for designing an effective TMS.
Several researchers have evaluated the impact of inclination angle on heat exchanger performance. Lisa et al. [
19] studied the effect of inclination on louvered fins in automotive applications, examining four inclination angles: 10°, 30°, 60°, and 90°. They found that as the heat exchanger became more inclined, both the pressure drop and heat transfer rate increased. Similarly, Kim et al. [
20,
21] investigated the effect of inclination angle on louvered-fin type heat exchangers, finding that while heat transfer coefficients were minimally affected, the friction factor increased. Tang et al. [
22] examined the effects of inclination angle on oval tube heat exchangers, studying angles of 30°, 45°, 60°, and 90°. They discovered that heat transfer performance was optimal at 45°, while 30° resulted in the worst heat transfer performance with the largest pressure drop. Kennedy et al. [
23] also explored the influence of heat exchanger inclination when the motor forces air into the heat exchanger, noting that thermal performance slightly increased with inclination. Across these studies, the pressure drop and heat transfer performance varied, depending on the type and fin configuration of the heat exchanger.
In this study, the performance of a compact plate-fin heat exchanger, designed for use in the liquid cooling TMS of the electric propulsion system for UAM or AAM vehicles, is investigated. The compact plate-fin heat exchanger, equipped with offset strip fins, is designed to transfer heat between ram air and a coolant. The effect of inclination on the heat exchanger is particularly studied, considering the limited space available for installation within the nacelle.
2. Design of the Heat Exchanger
The target AAM vehicle for which the heat exchanger is being designed is an eVTOL with two lift rotors and four tilt rotors. Since the battery is positioned near the fuselage, where the turbo generator will be installed, it is far from the nacelle. Therefore, an independent TMS is considered, with the liquid cooling TMS designed specifically for the electric motor and inverter. The concept of the liquid cooling TMS for the electric motor and inverter is depicted in
Figure 2. The cooled coolant first passes through the inverter, as the electrical components of the inverter have lower temperature limits than the motor. After passing through the inverter, the coolant flows through the motor, and the heated coolant then dissipates the heat into the ram air through heat exchangers. Four heat exchangers are used to allow radial installation within the nacelle. The coolant flow is assumed to be evenly divided among the four heat exchangers.
The requirements for designing the heat exchanger are determined based on the specifications of the motor and inverter, which are designed for the target AAM vehicle. The construction of the ground test rig for the designed motor and inverter, along with the turbogenerator, is ongoing for the ground demonstration of the hybrid electric propulsion system. The heat load of the heat exchanger is calculated based on the efficiency and power of these designed components. The mechanical power of the designed motor is 112 kW under nominal conditions. The efficiency of the designed motor is approximately 91.1%, and the efficiency of the designed inverter is about 96.5%. Therefore, the total heat that needs to be dissipated from the motor and inverter is estimated to be 15.4 kW. Considering a 50% safety margin, the heat load requirement for the TMS of the electric propulsion system is estimated to be 22.98 kW. In the future, these efficiencies may change as the development of the motor and inverter matures. However, for the current initial development phase of the TMS, these initial design values are being used and may be updated in the future.
The total flow rate of the coolant is set at 8 L/min, as specified by the inverter and motor design specifications. Since the coolant is evenly divided among the four heat exchangers, each heat exchanger must dissipate 5.745 kW of heat with a 2 L/min flow rate. The target coolant temperature entering the inverter is set at 42 °C. Although antifreeze, such as ethylene glycol, should be mixed with the coolant for practical applications, water is used as the coolant throughout this paper for experimental safety.
According to the thermal performance requirements, the heat exchanger is designed as shown in
Figure 3a. The initial core size is 600 mm × 100 mm × 40 mm. However, to facilitate easier maintenance, repair, and overhaul, the headers for the coolant inlet and outlet are located on the same side, as depicted in
Figure 3a. Consequently, the coolant first passes through one side of the heat exchanger and then returns through the other side, as shown in the same figure. Therefore, final core size of the heat exchanger is 300 × 200 × 40 mm. The material of the heat exchanger is aluminum. The estimated performance at the design point is summarized in
Table 1.
4. Results and Discussion
4.1. Evaluation of the Heat Exchanger at Design Point
First, the performance of the designed heat exchanger was evaluated at the design point. The evaluation was conducted with an air inlet temperature of 36 °C, a coolant inlet temperature of 77 °C, and an air flow rate of 0.6 kg/s. The test results at the design point are shown in
Table 4. When compared with
Table 1, the temperatures are similar: the air outlet temperature differs by 3%, while the coolant temperature differs by 1.8%. This indicates that the estimation of thermal performance aligns well with the experimental results.
The pressure shows a significant difference, almost 50% from the estimation. On the hot side, the pressure decreased compared to the estimation, which is preferable. This difference may be due to the header, which was not considered during the design stage. Additionally, the coolant pressure drop on the hot side may have a considerable margin. On the other hand, the pressure difference on the cold side increased. This may be due to a reduction in the area available for airflow through the heat exchanger, caused by the installation interface on the rig. To install the heat exchanger on the rig, several millimeters near the boundary of the heat exchanger had to be blocked. Nevertheless, since the pressure on the cold side is related to the design of the fan or duct that provides sufficient ram air into the heat exchanger, more margins should be considered.
4.2. Heat Transfer Performance along the Plane of the Heat Exchanger
As mentioned in
Section 2, the designed plate-fin heat exchanger has the inlet and outlet ports for the coolant on the same side, resulting in the cold and hot sections of the heat exchanger core being merged together, as shown in
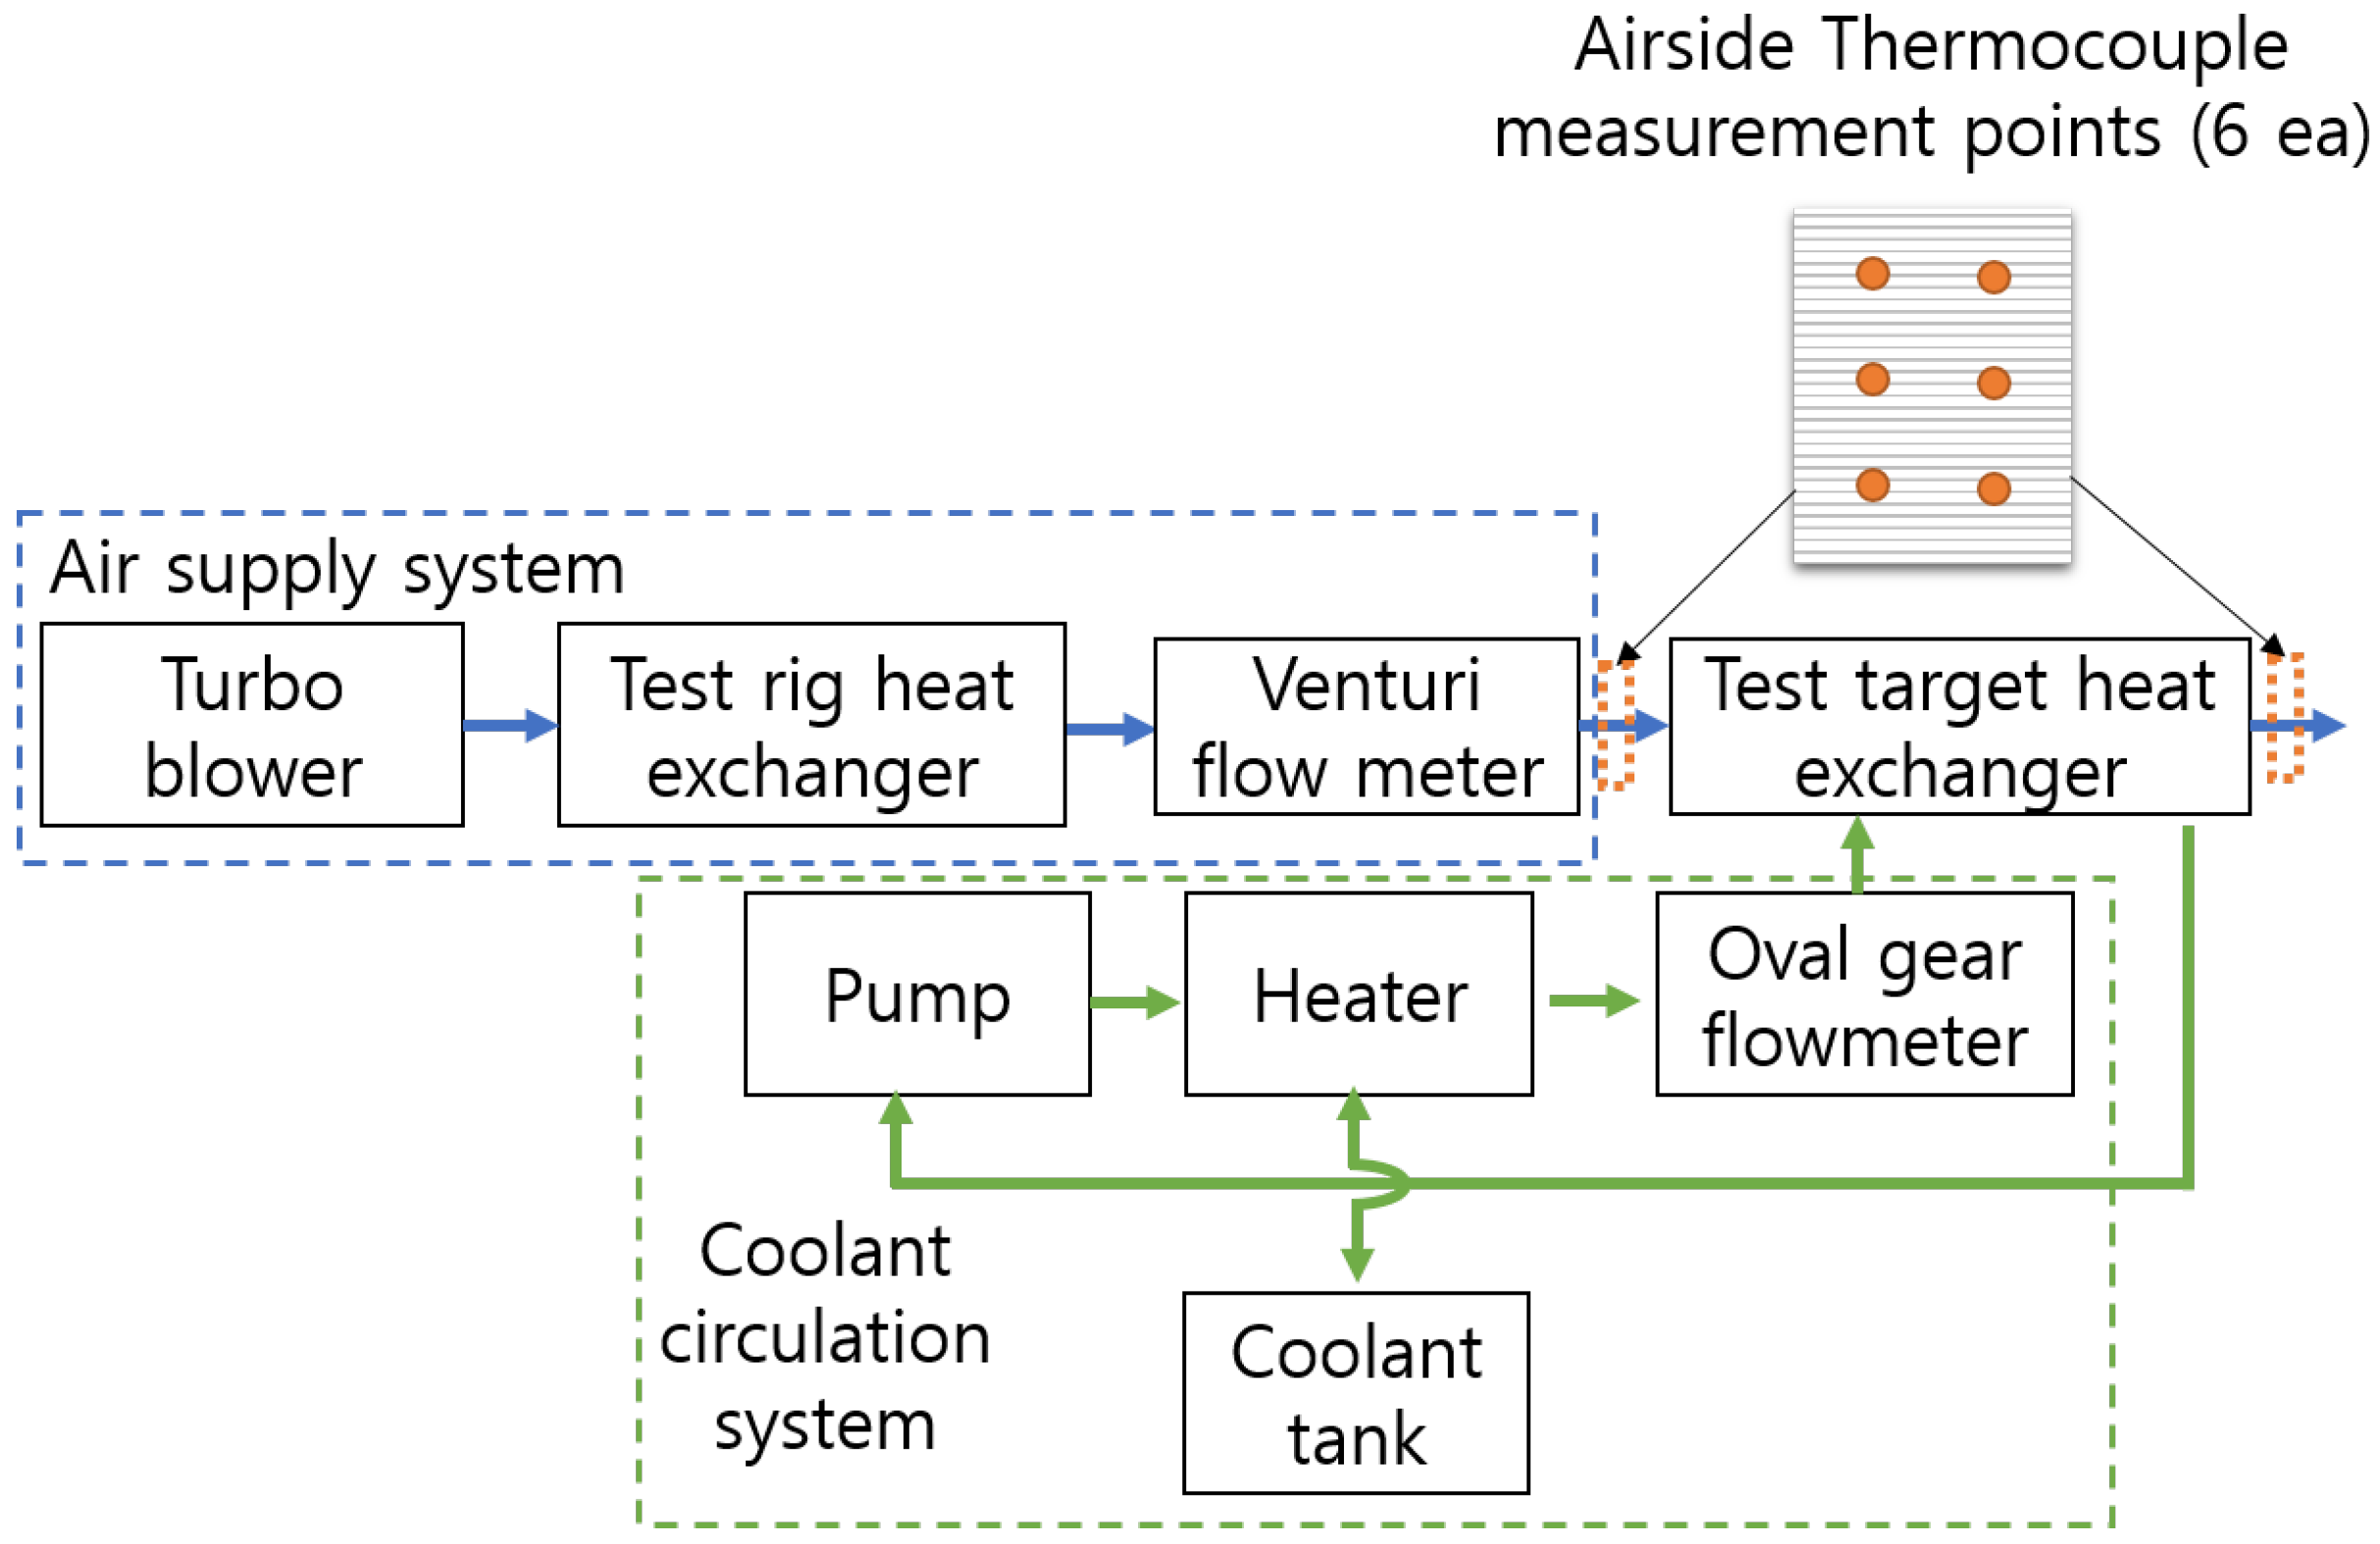
Figure 7a. At the boundary between the hot and cold sections of the heat exchanger, thermal conduction can occur, so the effect of this boundary on the heat exchanger’s performance should be investigated. To analyze the impact of the merged boundary between the cold and hot sections, the temperature of the air is manually scanned along the plane at the air outlet of the heat exchanger after reaching steady state. The results are shown in
Figure 7:
Figure 7a illustrates the contour, and the square dots on the contours show the measurement points,
Figure 7b presents the temperature measurements at the same y-position, and
Figure 7c displays the temperature measurements at the same x-position. The contour in
Figure 7a was generated by creating a new mesh grid with 0.25 mm spacing in both the x and y directions. The three sets of temperature data along the y-axis and one set of temperature data along the x-axis were interpolated and extrapolated using a linear scattered interpolant method [
24]. In this method, the available data points are used to create Delaunay triangles, which partition the data into a mesh of non-overlapping triangles. These triangles are then used to estimate the temperature at various positions through interpolation and extrapolation.
As seen in
Figure 7a, most of the heat transfer occurs near the coolant inlet of the heat exchanger. This is clearly evident in
Figure 7c, where the instantaneous slope of the temperature in the hot section (yellow line) decreases as the coolant flows to the bottom. Furthermore, the average temperature slope of the cold section (blue line) is much smaller than that of the hot section (yellow line). The significant heat transfer near the coolant inlet can be analyzed using the effectiveness of the heat exchanger [
18]. The effectiveness (
) of the heat exchanger is defined as the actual heat transfer rate divided by the maximum possible heat transfer rate. The maximum possible heat transfer rate (
) and the effectiveness of the heat exchanger are given as follows:
where
is the minimum heat capacity rate between the air and coolant. Assuming the heat exchanger is evenly divided into sections along the coolant passage, the overall heat transfer and heat transfer area can be assumed to be the same for each section. Since the heat transfer core is similar for each section, it can be assumed that
is the same for each section. As the coolant cools down along the coolant passage,
decreases, while
remains uniform, as the inlet air flow is the same for each section. Therefore,
decreases along the coolant passage, and with the same
, the heat transfer rate for each section decreases along the coolant passage, as shown in
Figure 7c. In
Figure 7c, the measurement data at the merged boundary (red line) shows significantly varying temperatures at y = 100–150 mm. This variation seems to be due to an x-position error during temperature scanning, where the x-position may slightly shifted between the hot and cold sections during the scanning process.
In
Figure 7a, there is a slight gradient along the x-direction, which is also visible in
Figure 7b. Here, the temperature is varying along the x-direction in the hot section, while it is almost uniform in the cold section. This seems to be due to thermal conduction near the merged boundary of the hot and cold sections. Although thermal conduction occurs at this boundary, it appears to have a minimal effect on the overall thermal performance, as the estimated performance of the heat exchanger closely matches the test results described in
Section 4.1. However, applying insulation material at the boundary between the cold and hot sections may enhance the overall performance of the heat exchanger.
4.3. Effect of Flow Rate on Heat Exchanger Performance
The effect of air mass flow rate and coolant flow rate on the heat exchanger’s performance is analyzed.
Figure 8 illustrates the impact of coolant flow rate and air mass flow rate. In
Figure 8a, the coolant temperature as a function of heat load is shown for flow rates of 2 and 4 L/min. As the coolant flow rate increases, the temperature difference between the coolant inlet and outlet decreases. Since heat transfer is proportional to the flow rate and the temperature difference, this decrease is expected as flow rate increases. Interestingly, the coolant outlet temperature slightly rises when the flow rate decreases. This is mainly due to a decrease in the
of the heat exchanger as the mass flow rate increases. In
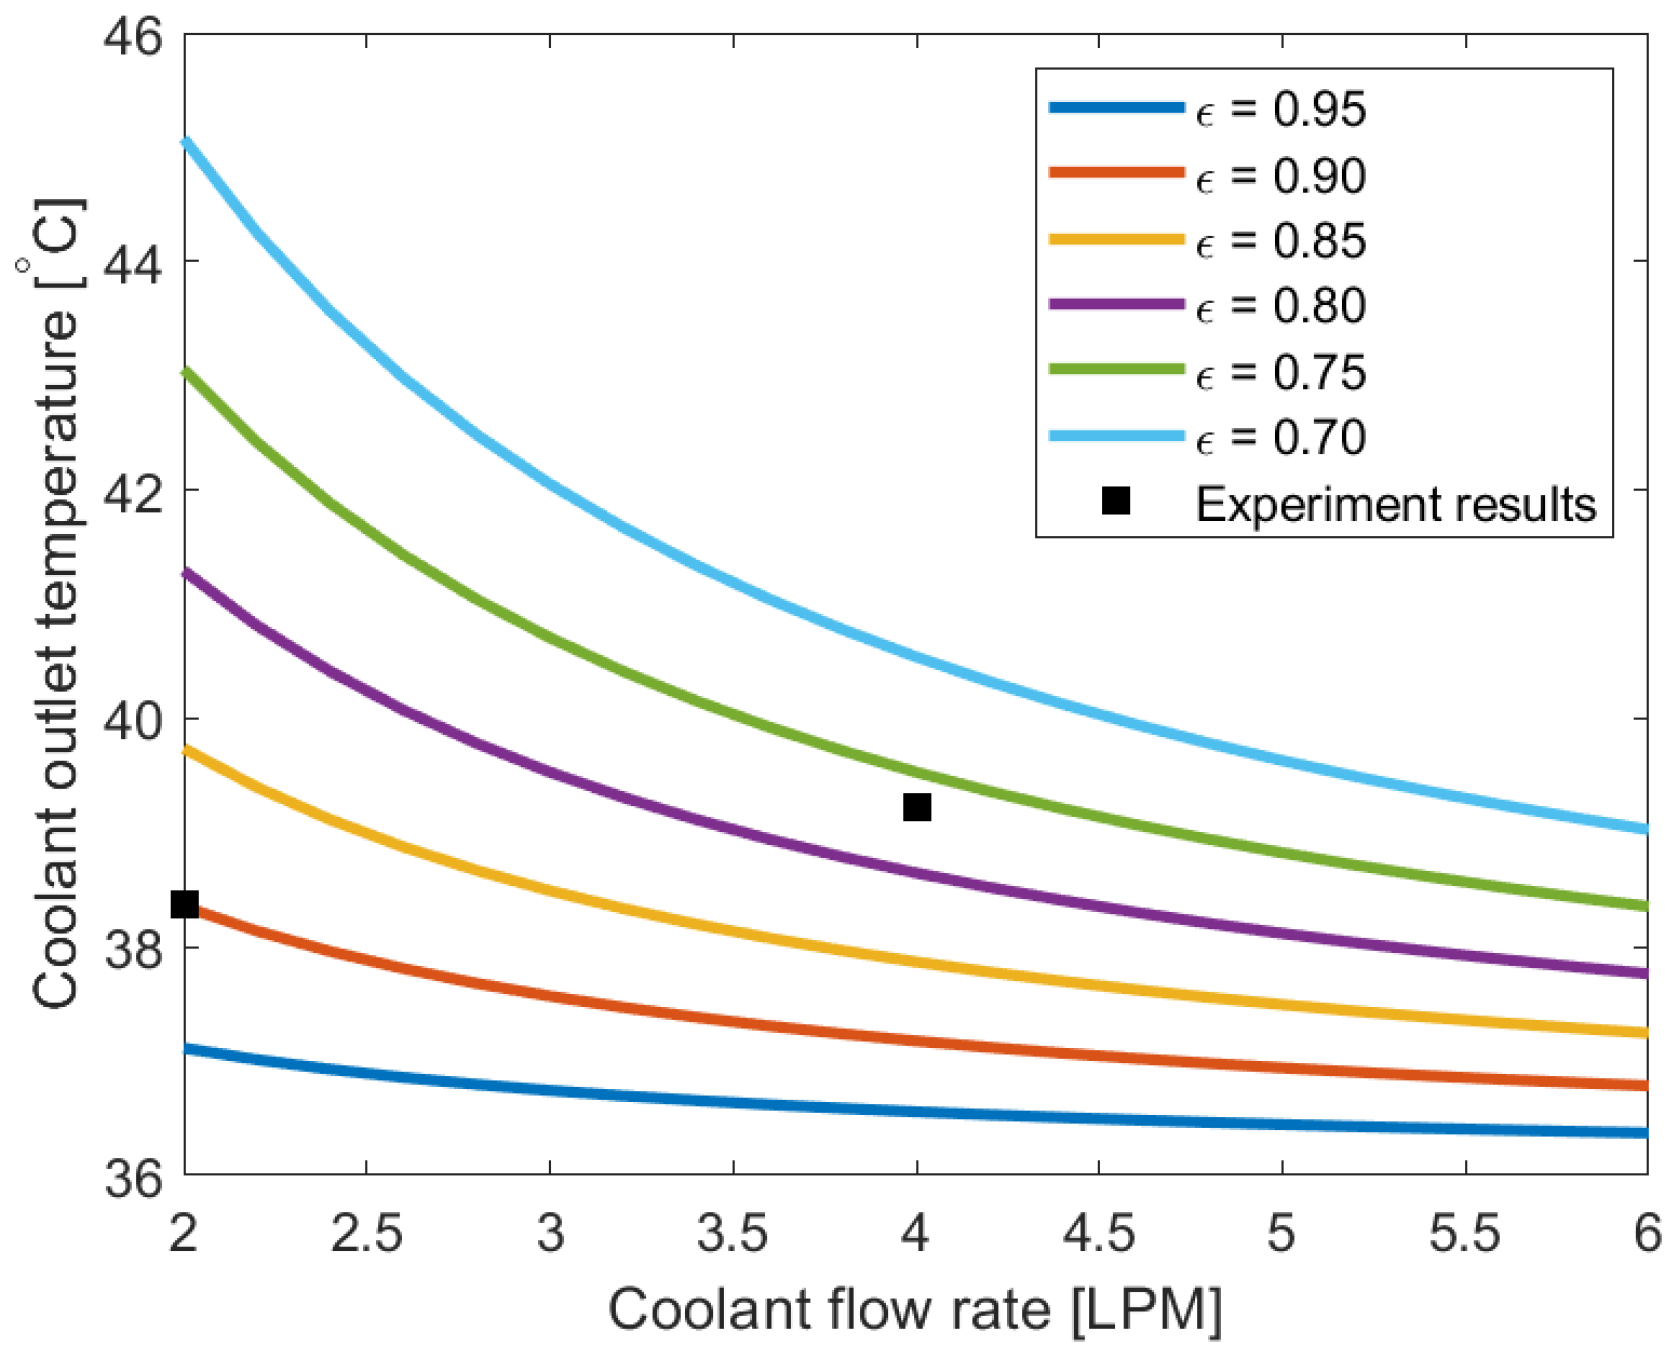
Figure 9, the coolant outlet temperature is calculated when the coolant mass flow rate is increased from the reference point using Equations (
4) and (
7). The reference point corresponds to the experimental result at a coolant mass flow rate of 0.0339 kg/s, where the effectiveness
is 0.9, the coolant inlet temperature is 59.53 °C, the air inlet temperature is 36 °C, and the heat load is 3 kW. The square dots in
Figure 9 represent the experimental results for coolant mass flow rates of 0.034 kg/s and 0.068 kg/s. If
remained constant as the coolant mass flow rate increased, the coolant outlet temperature would decrease. However, the experimental results showed that
decreased to 0.77, and as shown in
Figure 9, the coolant outlet temperature may increase as
decreases. The reason for the decrease in
may be that, at higher flow rates, the residence time of the coolant in the heat exchanger is reduced, preventing sufficient cooling compared to lower flow rates. Therefore, the overall effectiveness of the heat exchanger may decrease. While higher flow rates can reduce the overall temperature of the coolant, they may result in a higher outlet temperature, which is critical for the device being cooled. Therefore, when determining the coolant flow rate, the temperature requirements of the electronics inside the inverter should be carefully considered.
In
Figure 8b, the effect of air mass flow rate is considered for the same heat load. As expected, the coolant temperature decreases as the air mass flow rate increases. The change in coolant temperature relative to the air mass flow rate is linearly proportional, while the temperature difference between the coolant inlet and outlet remains almost the same across all air mass flow rates. From the experimental results, the
also increased as the air mass flow rate increased. As the air mass flow rate increases, more fresh, cooled air is supplied to the heat exchanger, thus improving the effectiveness of the heat exchanger. The temperature difference between the coolant inlet and outlet remains the same because the heat capacity and heat load are constant, so the temperature difference must remain the same, as indicated by Equation (
4). The effect of air mass flow rate on coolant temperature is relatively small; for instance, increasing the air mass flow rate by 1.67 times only decreased the coolant outlet temperature by about 4%. Thus, increasing the air mass flow rate may not be critical for the thermal performance of the heat exchanger. However, unlike the coolant flow rate, the coolant outlet temperature consistently decreases as the air mass flow increases.
4.4. Effect of Inclination Angle on the Heat Exchanger Performance
As mentioned in previous sections, the effect of the heat exchanger’s inclination angle is analyzed to estimate its performance when installed in the nacelle.
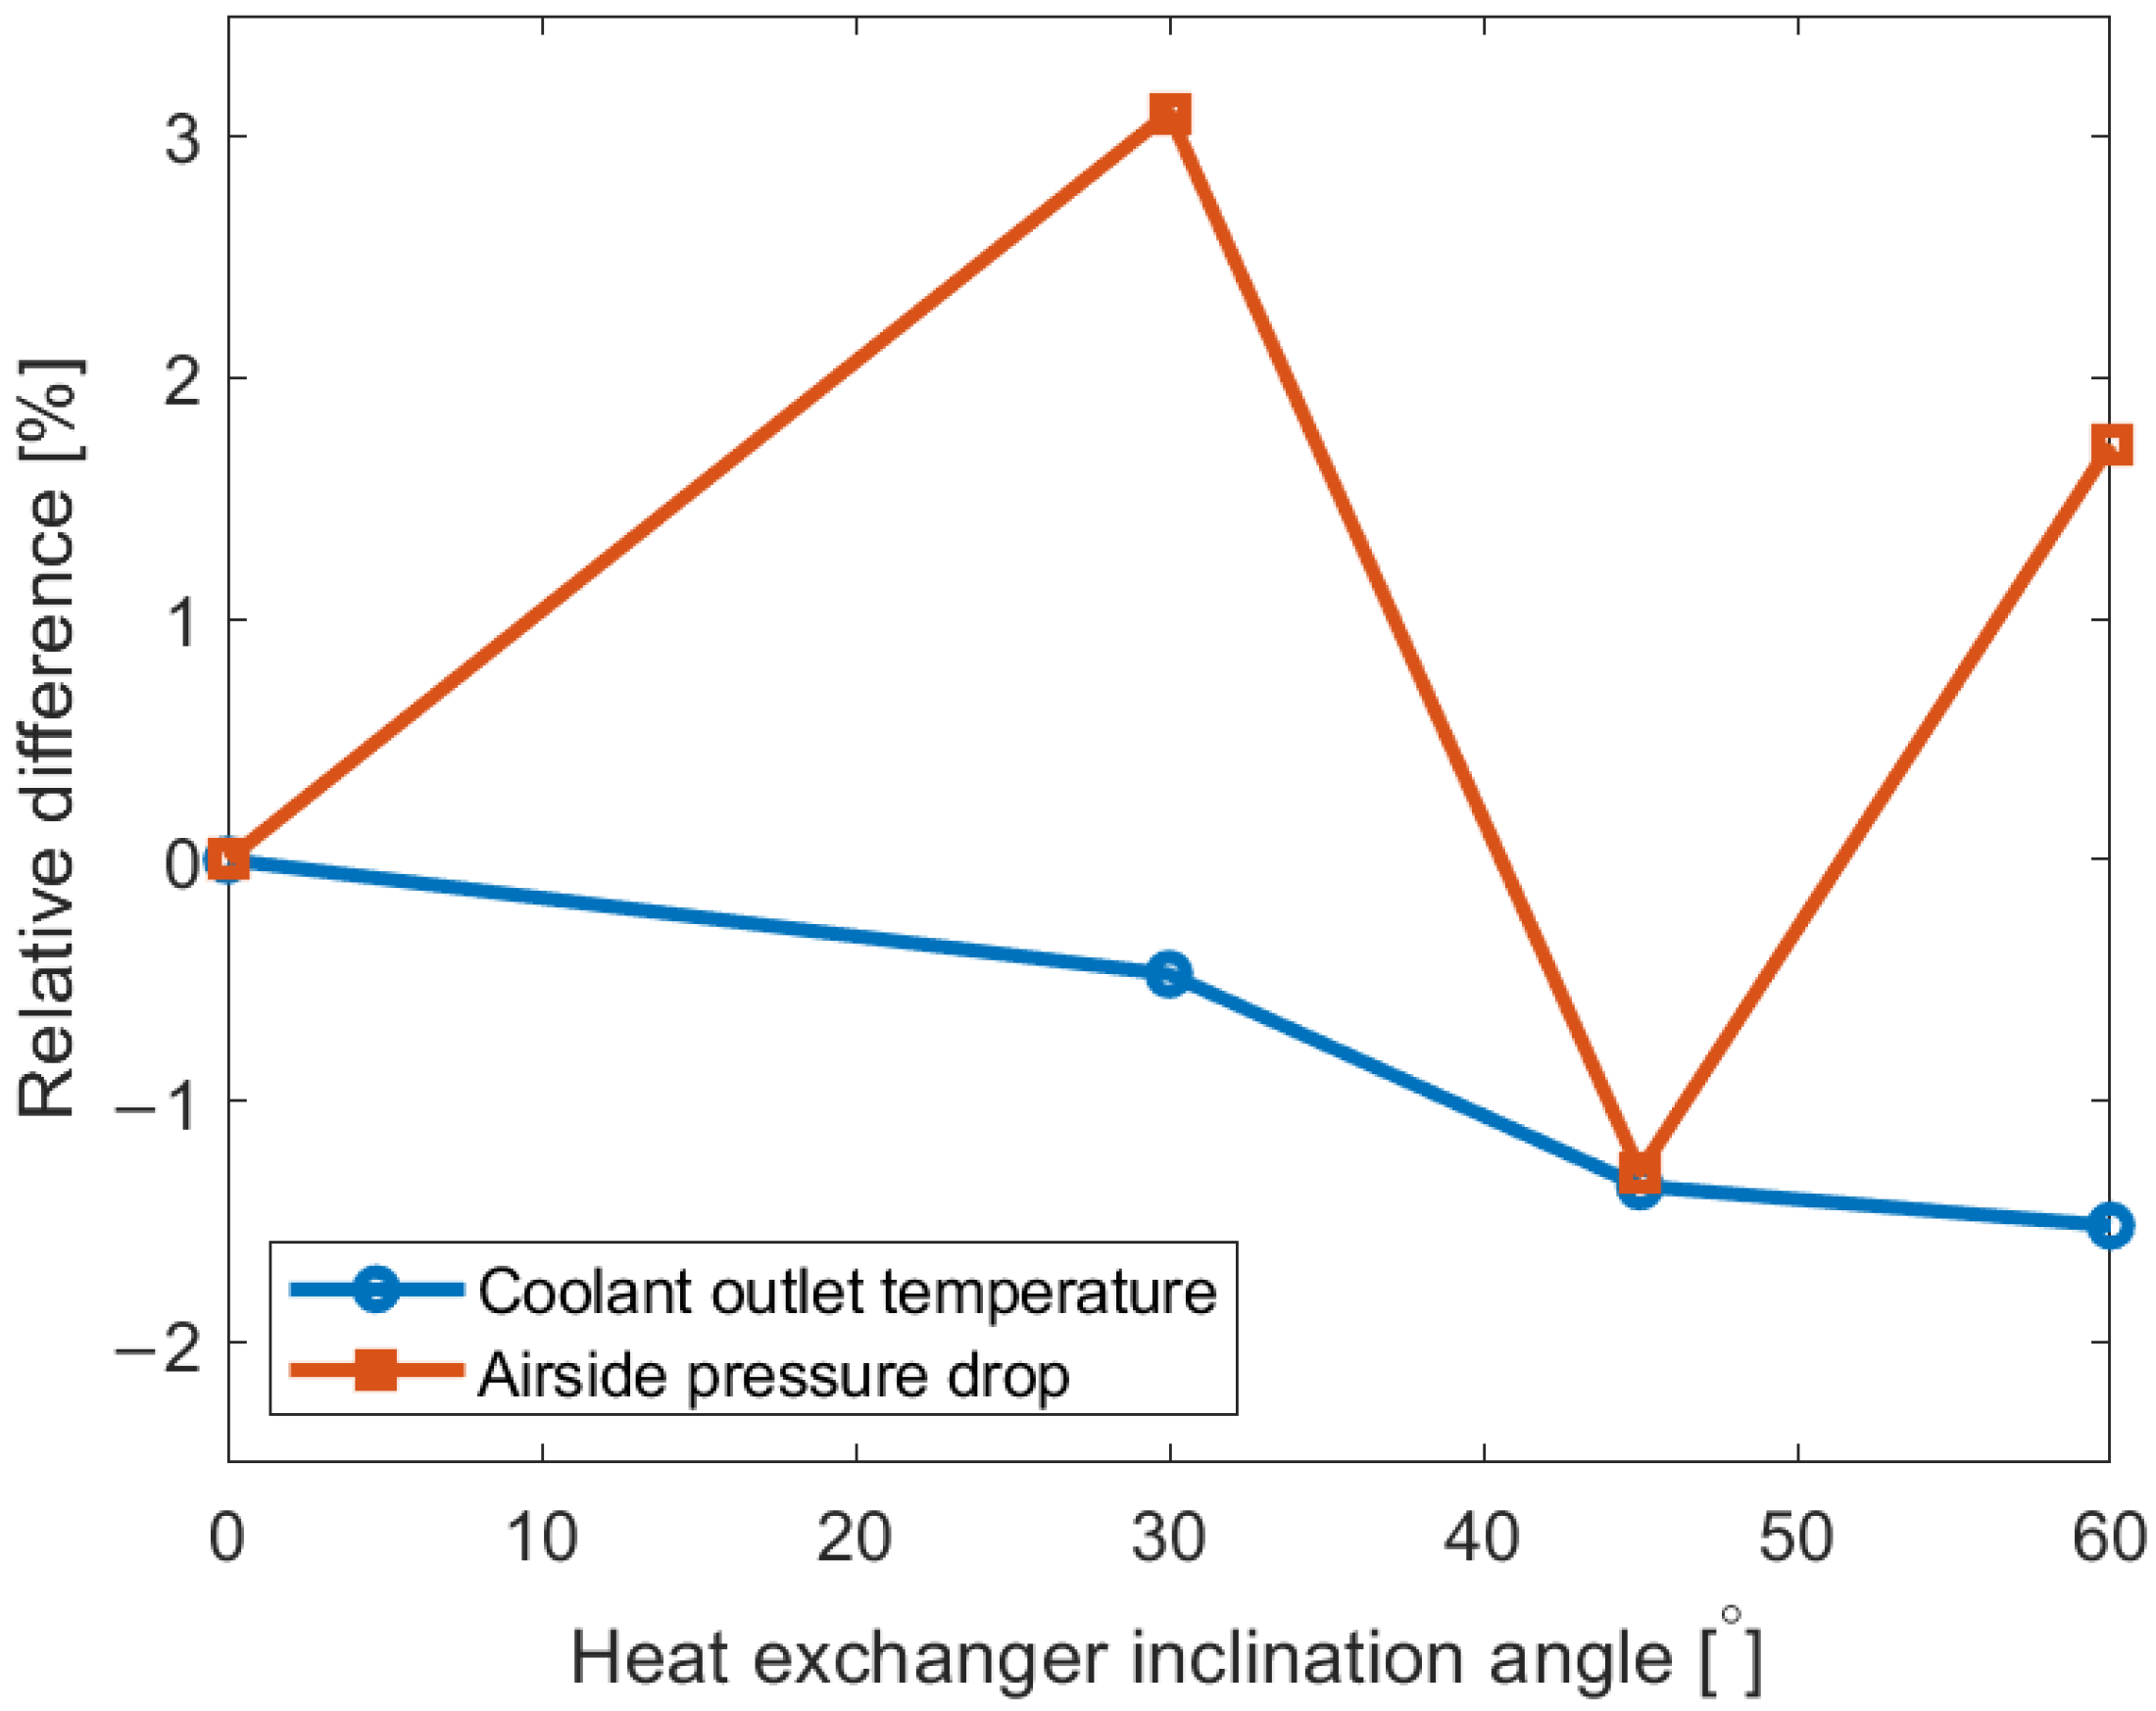
Figure 10 presents the coolant outlet temperature and the air side pressure drop across the heat exchanger depending on the inclination angle. The results are presented in the relative difference from the reference value of 0°. The air-side pressure drop shows a maximum relative difference of 3%, while the relative difference of the coolant outlet temperature is below 1.5%. The pressure difference does not exhibit a clear trend, as it decreases at 45°, which aligns with the findings of Tang et al. [
22], where the optimal performance of the heat exchanger was observed at a 45° inclination angle. The lack of a clear trend in pressure difference may be due to the complex airflow patterns that develop as the heat exchanger is inclined.
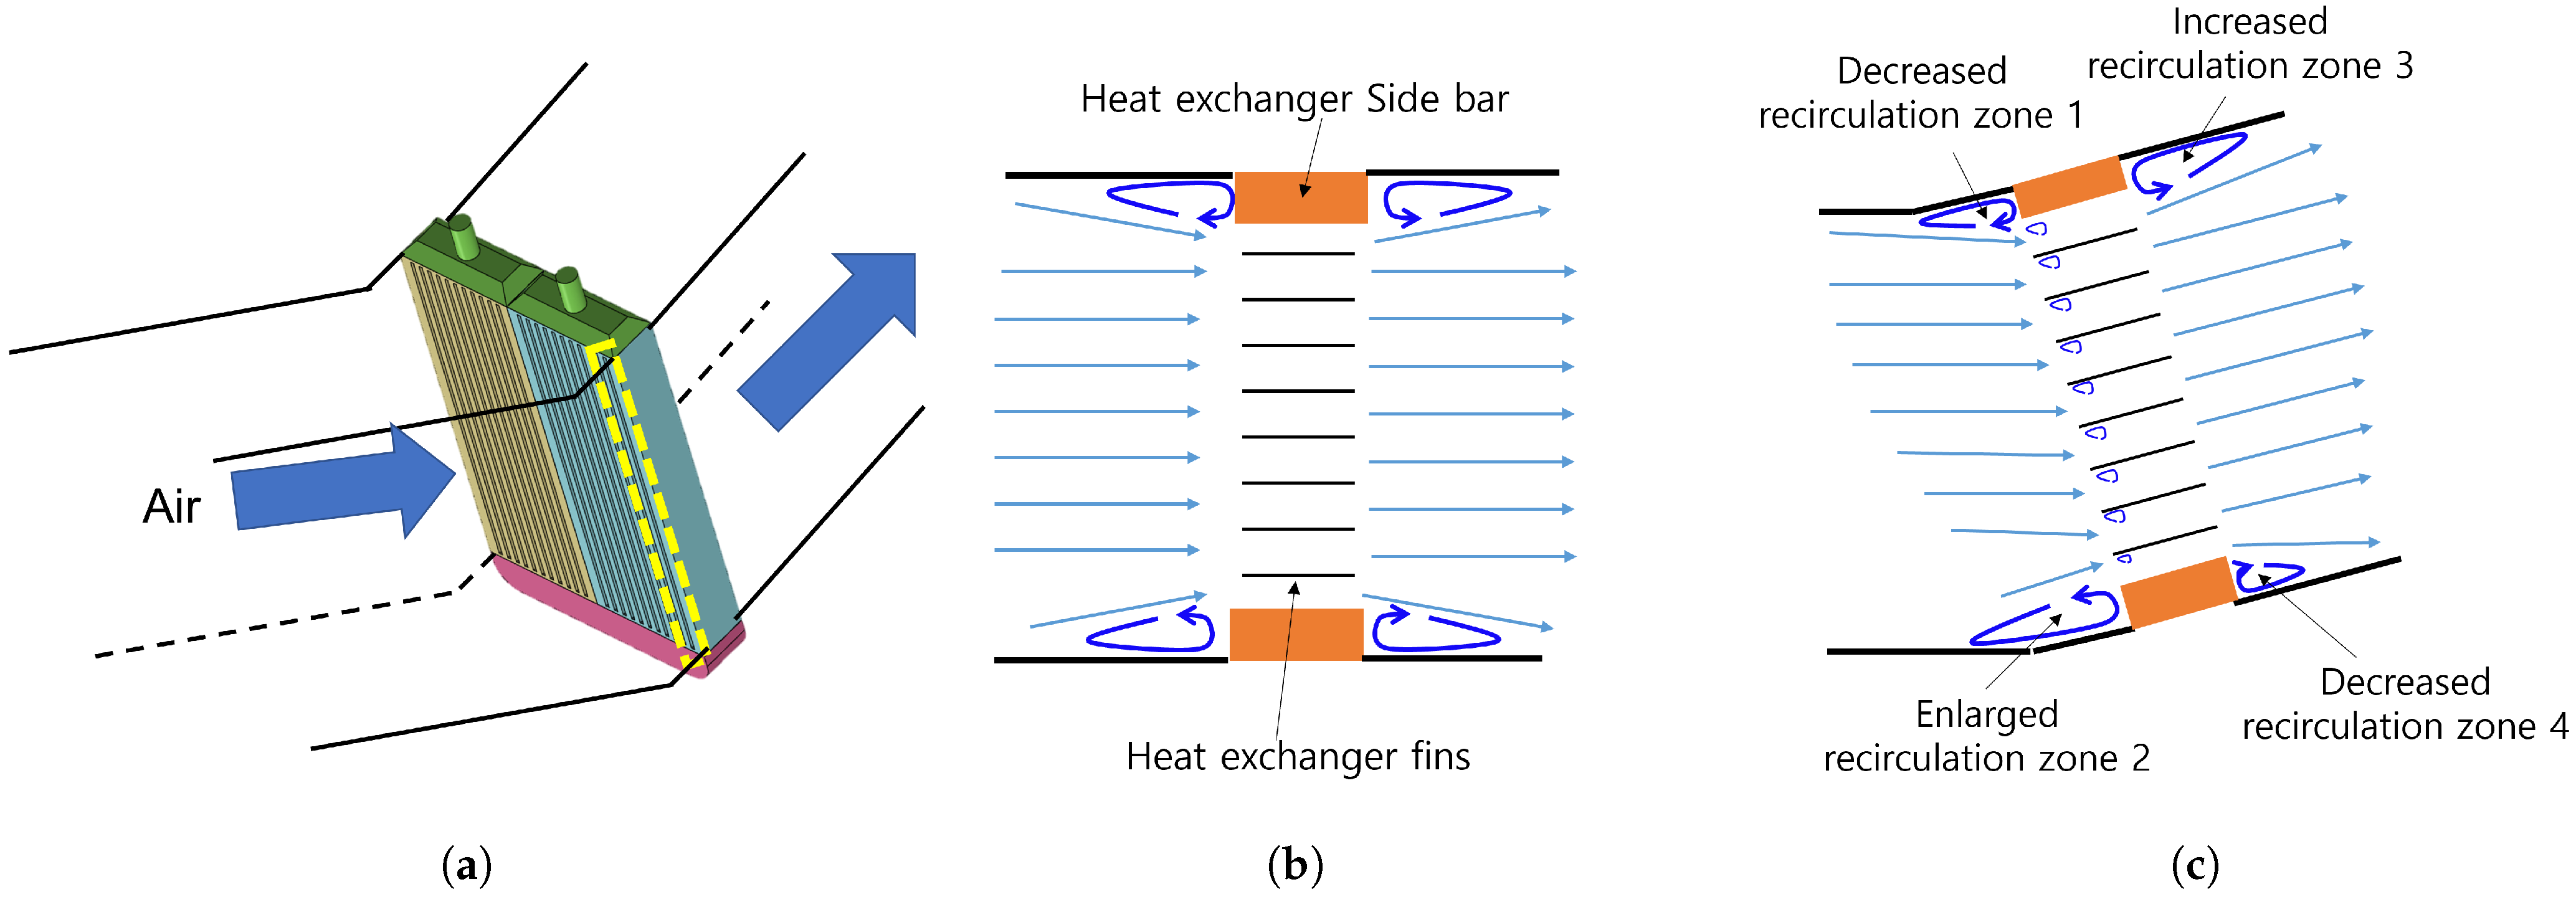
The air-side flow structure of a single channel is presented in
Figure 11.
Figure 11a shows the heat exchanger installed in the duct, with the yellow square depicting the region to be analyzed.
Figure 11b illustrates the flow structure in the non-inclined condition, while
Figure 11c shows the flow structure when the heat exchanger is inclined at a certain angle. Due to the side bar of the heat exchanger, recirculation zones develop at the front and back of the side bar in both the inclined and non-inclined cases. As the heat exchanger is inclined, the size of the recirculation zones changes, as described in
Figure 11c.
At the front, recirculation zone 1 decreases because the relative height of the side bar appears to be reduced when the heat exchanger is inclined. However, for recirculation zone 2, the relative height of the side bar increases, causing it to act as a larger barrier and producing a bigger recirculation zone. Furthermore, as the airflow can easily move near recirculation zone 1, the overall air velocity passing through the channels is higher at the top. As a result, the reduced velocity near recirculation zone 4 likely causes that zone to decrease in size. On the other hand, the high velocity near recirculation zone 3 enlarges this zone. Additionally, as the heat exchanger is inclined, flow separation may occur near the entrance of the fins, contributing to a higher pressure drop.
The changes in the size of the four recirculation zones depending on the inclination angle, along with the pressure drop caused by the separation zone near the fins, may explain the variation in pressure drop across the heat exchanger, resulting in a lower pressure drop at 45°. In the current experimental setup, the detailed size of the recirculation zones cannot be measured or analyzed, making it difficult to analytically calculate the pressure drop due to the inclination angle. A more detailed investigation through flow visualization or computational fluid dynamics (CFD) analysis may be required in future studies to precisely understand the effect on pressure drop.
The inclination angle has a significant effect on the pressure drop across the air-side heat exchanger, but a lesser effect on thermal performance. Interestingly, the relative difference in coolant outlet temperature decreases, indicating an improvement in thermal performance. This may be due to the increase in flow velocity near the coolant inlet, which is the top part of
Figure 11c. As mentioned in
Figure 7, the heat transfer rate of the coolant is higher near the coolant inlet because the coolant temperature is higher in this region compared to other areas. The increased airflow velocity near this region, caused by the inclination of the heat exchanger, leads to a locally increased air mass flow rate, which results in a locally increased effectiveness of the heat exchanger, as described in
Figure 8b. If the inclination direction were different from the current configuration, such as if the inclination were on the opposite side, where the airflow velocity increases near the bottom, the thermal performance might worsen. This is because the mass flow rate would decrease in the high-coolant-temperature region, leading to a decrease in the effectiveness of the heat exchanger.
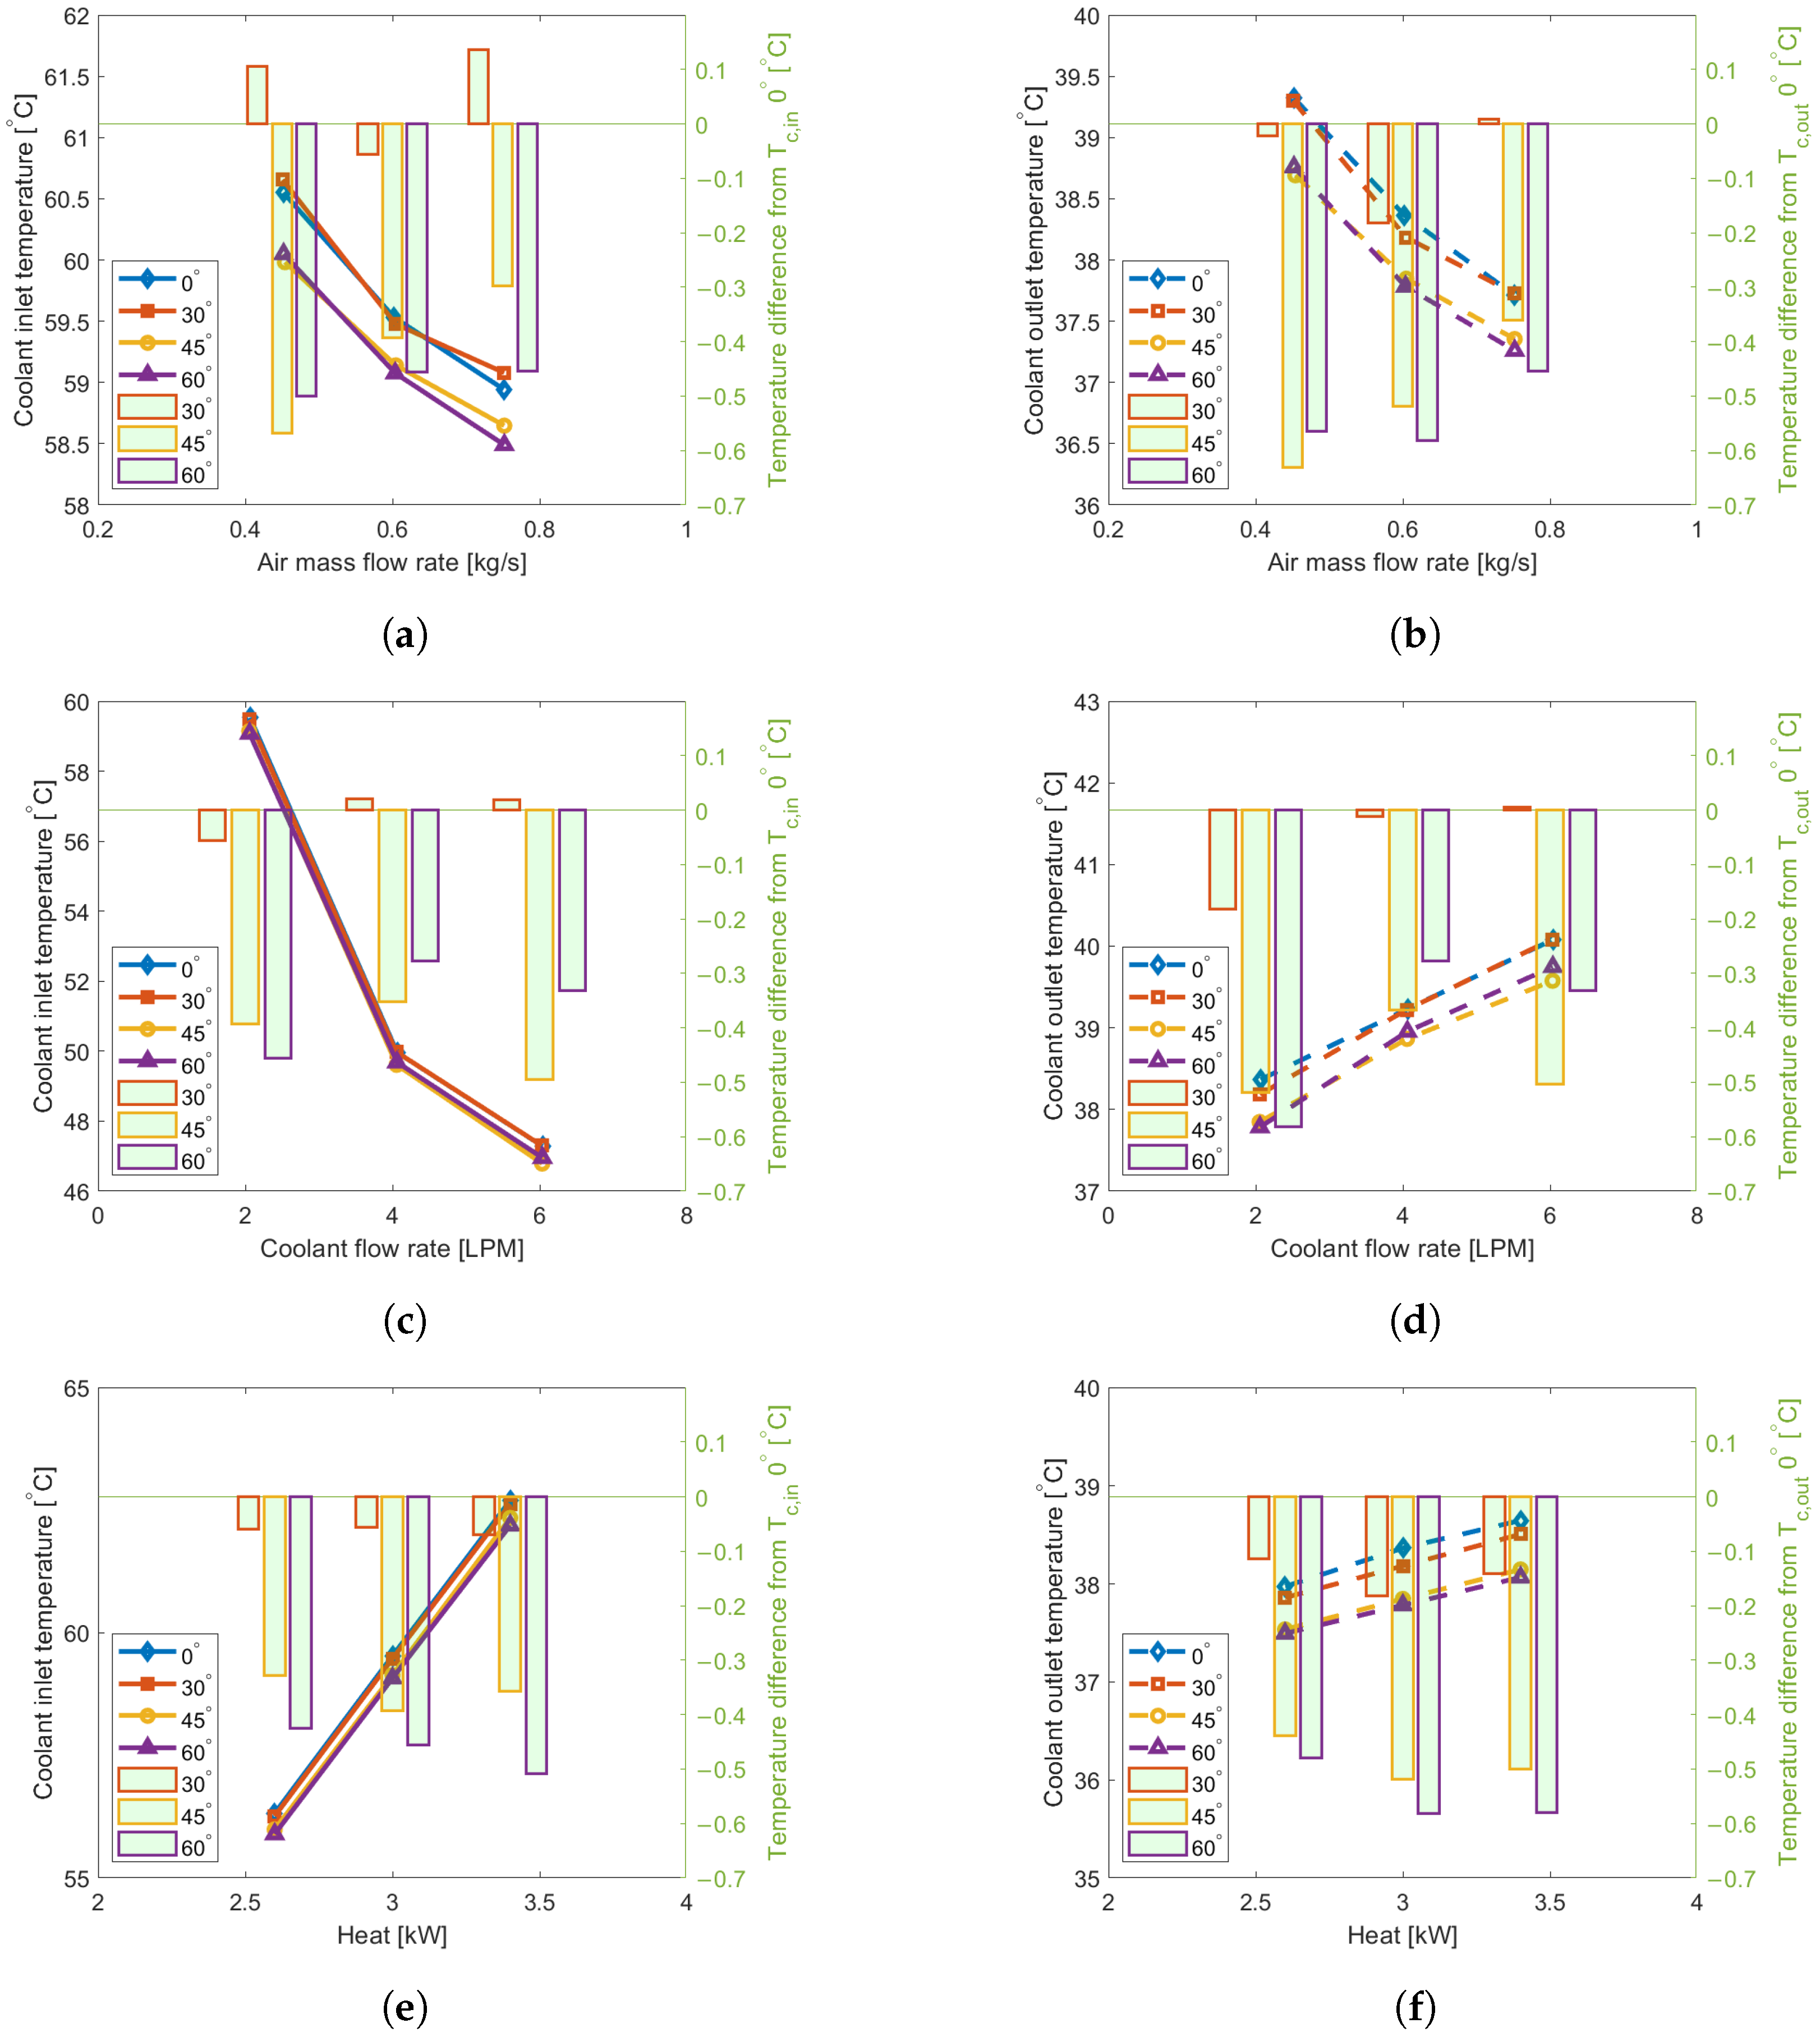
The effect of inclination on the coolant temperature depending on the inclination angle for various parameters is depicted in
Figure 12.
Figure 12a,b shows the effect of air mass flow rate,
Figure 12c,d shows the effect of coolant mass flow rate, and
Figure 12e,f shows the effect of heat load. As there is not much difference in temperatures depending on the inclination angle, the temperature difference referenced to the 0° inclination is depicted as a bar chart in the figures.
The tendency of increasing coolant outlet temperature as the coolant flow rate increases is consistent with
Figure 8a, where
decreased as the coolant flow rate increase and resulted in increased coolant outlet temperature. When the heat load increases, the effect of inclination angle on thermal performance shows a more pronounced tendency compared to other parameters, as in
Figure 12e,f. As the heat load increases, both the coolant inlet and outlet temperatures rise, as
does not change since the air and coolant mass flow rates remain the same. Therefore, as
q increases in Equation (
4),
must also increase, resulting in higher coolant inlet temperatures for the same air inlet temperature. As the temperature difference also increases with the heat load, the inclination effect may become more significant if the heat load exceeds the current design conditions. Therefore, the effect of higher heat loads needs to be studied in the future.
At 30°, a maximum of 0.2 °C is observed, and in some cases, thermal performance degrades, as shown in the air mass flow rate case in
Figure 12a. The 60° inclination generally has the best thermal performance, while in some cases, the 45° inclination shows better performance, as in the air mass flow rate of 0.45 kg/s and coolant flow rates of 4 and 6 L/min (
Figure 8a). This irregularity in the effects of air and coolant mass flow rates, compared to the more consistent trend in heat load, seems to align with the pressure analysis results. The development of recirculation zones varies with the inclination angle and air mass flow rate, which disrupts the clear trend among inclination angles. Furthermore, the non-uniform air mass flow rate along the heat exchanger, depending on the inclination angle, causes irregular behavior based on coolant mass flow rate.
If the installation angle in the nacelle exceeds 60°, the pressure drop could increase further, and thermal performance may degrade due to the development of recirculation zones, which alter the velocity distribution along the fins. Furthermore, as flight conditions change, such as varying air mass flow rates during flight, there may be variations in thermal performance. Therefore, an external fan and optimized duct design may be required to overcome the increased pressure difference and to uniformly distribute airflow along the heat exchanger, preventing degradation in thermal performance when installing it at angles greater than 60° in the nacelle. Additionally, if inclination is necessary, an angle of 45° would be preferable, given the minimum pressure drop and good thermal performance.
4.5. Parameters to Consider for the Heat Exchanger Performance
To investigate which parameter most significantly affects heat exchanger performance from the perspective of managing the TMS, a sensitivity analysis of the parameters is conducted, as shown in
Figure 13. The parameters analyzed include coolant flow rate, air mass flow rate, air inlet temperature, and inclination angle. The ratio of coolant temperature to the reference coolant temperature is calculated for each selected value of these parameters. The reference value for each parameter is determined as the lowest test condition from the conducted tests. For instance, for each parameter, the reference coolant temperature is chosen using the following results: a coolant flow rate of 2 L/min, an air mass flow rate of 0.45 kg/s, an air inlet temperature of 25 °C, and an inclination angle of 30°. The inclination angle of 30° is selected as a reference because the parameter cannot be divided by 0°. Therefore, only 30°, 45°, and 60° are analyzed for the inclination angle. The sensitivity analysis reveals how changes in these parameters impact the ratio of the coolant inlet and outlet temperatures.
In
Figure 13a, the effect of each parameter on the coolant inlet temperature is depicted, while
Figure 13b shows the effect on the coolant outlet temperature. For both inlet and outlet temperatures, the air inlet temperature and heat load exhibit a positive trend, while the air mass flow rate and inclination angle show a negative trend. The trend for coolant flow rate differs between the inlet and outlet temperatures, as discussed in previous sections. The air inlet temperature has the most significant impact on both the coolant inlet and outlet temperatures, followed by heat load. If the air inlet temperature increases, such as when operating the eVTOL in desert conditions, a more powerful TMS must be designed. Additionally, fluctuations in air temperature during actual flight conditions may significantly affect heat exchanger performance. Therefore, a control strategy to prevent sudden increases in coolant temperature should be adopted to mitigate these fluctuations. Furthermore, installing a specialized device to cool the ram air could significantly enhance the thermal performance of the heat exchanger.
As the heat load is the second most influential parameter on coolant inlet temperature, improving motor and inverter efficiency could help reduce this load. However, since efficiency improvements are challenging, controlling the coolant flow rate becomes the next best option. Therefore, if the coolant temperature approaches its limit, such as the boiling point, increasing the coolant flow rate is preferable to increasing the air flow rate. The inclination angle has minimal effect, so adjusting parameters like coolant flow rate may be more beneficial when the heat exchanger is installed at an incline. Since the most temperature-limited device is the inverter electronics, which are cooled by the coolant outlet temperature, if further cooling of the coolant entering the inverter is needed, decreasing the coolant flow rate may be preferable to increasing the air mass flow rate.
Additionally, the effects of humidity and coolant fluid should also be considered in TMS design. In this study, humidity is not accounted for, but for practical applications, it may significantly affect heat exchanger performance. Since eVTOLs typically operate at low altitudes, humidity could have a greater impact than at higher altitudes. Humidity may increase the pressure drop across the heat exchanger and degrade its thermal performance [
25]. In future studies, the effect of humidity on heat exchanger performance should be tested experimentally or through CFD analysis.
Moreover, water cannot be used as the coolant during flight conditions in winter, as it may freeze. Therefore, ethylene glycol- and propylene glycol-based antifreeze coolants should be considered. These glycol-based antifreeze solutions have poorer thermal properties than water, with specific heat capacities approximately 85% that of water. Additionally, while the specific heat capacity of water remains nearly constant, the glycol-based coolant experiences an 8% change in specific heat capacity between 20 and 100 °C. Furthermore, the higher viscosity of glycol-based coolants requires more powerful pumps to circulate the fluid within the TMS. Using the effectiveness–number of transfer units (
-NTU) method, the effect of glycol-based coolants can be indirectly analyzed [
18]. The coolant temperatures depending on the fluid used are depicted in
Table 5. While the coolant inlet temperature varies with different coolants, the coolant outlet temperature remains unchanged. As the coolant inlet temperature shows little change, thermal performance under current operating conditions does not appear to be significantly affected. However, since the models used for the calculations were validated for water, further validation is needed for analysis using the
-NTU method. Future experiments with glycol-based coolants may be necessary.
5. Conclusions
The performance of a compact plate-fin heat exchanger designed for use in the liquid cooling TMS of electric propulsion systems in UAM and AAM vehicles is thoroughly studied. The analysis focuses on several key factors, including the effect of inclination angle, coolant flow rate, air mass flow rate, and heat load on the heat exchanger’s thermal performance and the pressure difference across the system.
The results reveal that the heat exchanger’s thermal performance is relatively stable across various inclination angles, with only slight improvements observed at higher angles, particularly at 45° and 60°. These findings suggest that the heat exchanger’s design is robust enough to maintain effective cooling even when installed at an angle, which is a necessary consideration given the spatial constraints within an aircraft nacelle. However, the inclination angle does significantly impact the pressure difference across the heat exchanger due to the recirculation zone developed near the side bar of the heat exchanger. This may necessitate the use of a larger fan to maintain adequate airflow and cooling performance.
The sensitivity analysis indicates that the air inlet temperature critically influences the heat exchanger’s performance. Air inlet temperature was identified as the most significant factor affecting both coolant inlet and outlet temperatures, followed by heat load. This finding underscores the importance of designing a TMS capable of handling varying ambient conditions, especially in hotter climates or during seasons with high temperatures. The sensitivity analysis further indicates that increasing the coolant flow rate is a more effective strategy for managing coolant temperatures than increasing the air mass flow rate, particularly when the system is operating near its thermal limits.
The analysis also points out that while coolant flow rate and air mass flow rate are important, their effects on thermal performance are more subtle compared to the air inlet temperature. The coolant flow rate directly influences the heat exchanger’s ability to maintain safe operating temperatures for the motor and inverter, while the air mass flow rate has a less pronounced impact but still contributes to overall system efficiency.
In conclusion, while the current heat exchanger design demonstrates solid performance under various conditions, the ongoing development of UAM and AAM technologies will require continuous improvements in thermal management systems. This study lays the groundwork for such advancements, providing a comprehensive understanding of the factors that influence heat exchanger performance and offering a roadmap for future research and development in this critical area of electric aviation.
