Abstract
An accurate assessment of the state of charge (SOC) of electric vehicle batteries is critical for implementing frequency regulation and peak shaving. This study proposes mechanism- and data-driven SOC fusion calculation methods. First, a second-order Thevenin battery model is developed to obtain the physical parameters of the battery. Second, data from the Thevenin battery model and data from four standard cycling conditions in the electric vehicle industry are added to the dataset of the feed-forward neural network data-driven model to construct the test and training sets of the data-driven model. Finally, the error of the mechanism and data-driven fusion modeling method is quantitatively analyzed by comparing the estimation error of the method for the battery SOC at different temperatures with the accuracy of the data-driven SOC estimation method. The simulation results show that the root mean square error, the mean age absolute error, and the maximum error of mechanism and data-driven method for the estimation error of battery SOC are lower than those of the data-driven method by 0.9%, 0.65%, and 1.3%, respectively. The results show that the mechanism and data-driven fusion SOC estimation method has better generalization performance and higher SOC estimation accuracy.
1. Introduction
With the increasing usage of V2G technology, precise battery state-of-charge estimation has become more vital. To ensure that an electric vehicle’s range reaches a specific baseline value, the battery management system (BMS) must measure its state of charge (SOC) using high-precision methods [1,2]. Lithium batteries are influenced internally by SOC, temperature, internal resistance, and lifetime, making it challenging to obtain an accurate SOC estimate. There are a variety of commonly used methods. Examples include Ampere-hour (Ah) integration [3], open-circuit voltage method [4,5,6], electrochemical modeling [7], Kalman filtering [8], particle filtering [9,10], and deep learning [11,12].
The model-based strategy simulates the dynamic processes occurring inside the battery by building a model, and combining the model with an algorithm for the battery state to estimate the battery SOC [13,14]. However, the model-based strategy necessitates a high level of battery model universality. Additionally, as the battery ages and the parameters of the electrochemical model change, the accuracy of SOC prediction decreases [15]. The estimation method combining Kalman filtering and least squares can estimate the state of charge (SOC) under discharge conditions [16]. However, this article only models first-order circuits and is not applicable to complex working conditions. SOC can be estimated based on the open-circuit voltage method [17,18]. However, determining the open-circuit voltage of the battery requires a lot of experiments. Extended Kalman filtering is often applied in real-world scenarios due to the significant nonlinear properties of lithium batteries [19]. Article [20] proposes a trace-free Kalman filter algorithm based on the principle of strong tracking to estimate the SOC. However, the strong tracking method heavily relies on the observed values for state estimation. When the covariance of the observed residuals is not precise enough to approximate the statistical characteristics of the true residuals, this can cause the filtering gain to be lower than optimal, affecting the smoothness of the filtering effect. Article [21] proposes a lithium-ion battery SOC closed-loop estimation method based on SA-SVR (simulated annealing-optimized support vector regression) and MEE-EKF (Minimum Error Entropy Extended Kalman Filter). However, using this method, it is easy to fall into local optimization for complex optimization problems, and it is not guaranteed to find the global optimal solution. In recent years, machine learning-based SOC estimation methods have attracted much attention. Neural networks are based on the process of neural conduction between input and output features and do not involve complex physical mechanisms [22]. The estimation of battery state using data-driven methods is defined as machine learning methods for battery state estimation. These methods have robust nonlinear mapping capabilities and can approximate arbitrary functions with arbitrary accuracy [23]. The SOC estimation method that integrates a BP neural network and EKF algorithm has better robustness and consistency of the trained neural network than the EKF algorithm. However, this method is slow to train and prone to localized extremes.
In this research, we propose a mechanism- and data-driven SOC fusion calculation method that combines the data-driven model and the Thevenin battery model, and improves the generalization ability and accuracy of the model through domain knowledge. Firstly, the second-order Thevenin battery model is established to obtain the physical parameters of the power battery [24,25], and the physical parameters and OCV-SOC curves of the battery are obtained through parameter identification, and the SOC of the second-order battery model is estimated by adaptive asymptotic extended Kalman filtering (AFEKF). Secondly, the data obtained from the second-order Thevenin battery model and the data from the four standard cycling conditions of the EV industry are added to the data-driven model, and the data from the second-order Thevenin battery model is added to the data-driven model. Conditions are added to the dataset of the data-driven model [26]. The test and training sets for the data-driven model are constructed. Finally, the accuracy of the proposed method in this paper is quantitatively analyzed by comparing the errors of the method for SOC estimation at −10 degrees Celsius, 0 degrees Celsius, 10 degrees Celsius, and 25 degrees Celsius. The errors of the SOC estimation results are quantitatively analyzed using the root mean square error (RMSE), mean error (MAE) and maximum error (MAX). Simulations comparing the accuracy of SOC estimation by the data-driven model and the mechanism/data-driven fusion model show that the RMSE, MAE, and MAX of SOC estimation by the mechanism/data-driven fusion method are lower than those of the data-driven method by 0.9%, 0.65%, and 1.3%, respectively. This shows that the latter has better generalization performance and higher accuracy in estimating SOC.
The main contents of this paper are organized as follows: Section 2 introduces the mechanism SOC estimation method. A second-order Thevenin cell model is developed. The physical parameters of this mechanistic model are obtained through parameter identification, and the battery SOC is obtained through Kalman filtering. Section 3 discusses the data-driven SOC estimation method and the feedforward neural network structure. Section 4 presents the fusion of mechanism- and data-driven SOC estimation method. The mechanistic and data-driven fusion method is presented, where data from the mechanistic model and data from four standard cycling conditions in the electric vehicle industry are added to the dataset of the feedforward neural network model. Section 5 presents the validation of the effectiveness of the method proposed in this paper on MATLAB/Simulink and analyzes the simulation results. Section 6 summarizes the results of the research.
2. Mechanism SOC Estimation
2.1. Battery Equivalent Circuit Model
The Thevenin model can help keep the state-of-charge (SOC) estimation error within a reasonable range and simulate various characteristics of Li-ion batteries more accurately [27]. The second-order Thevenin model uses two RC (resistance and capacitance) parallel loops to mimic the battery’s charging and discharging functions, while also representing the internal resistance of the battery through the resistor [28]. Figure 1 shows the second-order Thevenin model.
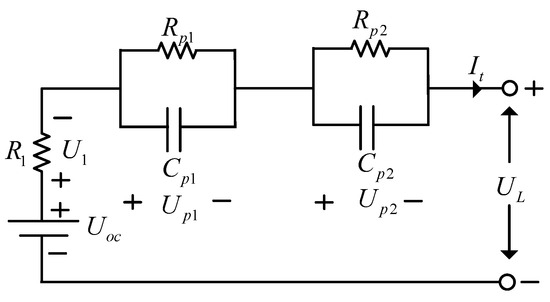
Figure 1.
Second-order Thevenin model.
In Figure 1, is the open-circuit voltage (OCV), is the measured terminal voltage, is the ohmic internal resistance, is the voltage across the ohmic internal resistance, is the measured terminal current, is the electrochemical polarization voltage, is the concentration polarization voltage, is the electrochemical polarization resistance, is the concentration polarization capacitance, is the concentration polarization resistance, and is the concentration polarization capacitance.
Equation (1) is obtained from Kirchhoff’s voltage law:
2.2. Parameter Identification
In the second-order Thevenin model, , , , , and are the parameters to be recognized. The least squares method based on a single forgetting factor (FFRLS) has a good online parameter identification capability as it assigns a higher weight to the new data by introducing a constant value λ (0.9 ≤ λ ≤ 1.0), which reduces the influence of the old data on the identification results. The Laplace transform of Equation (1) can be obtained:
where is the complex frequency domain Laplace operator and the corresponding difference equation in the discrete domain can be expressed as
where ~ is the differential equation to be estimated coefficient. Let the matrix of data variables and the matrix of differential equation to be estimated coefficients be, respectively,
Then, Equation (3) equation can be rewritten as
and the recursive expression for the FFRLS algorithm is
where is the gain coefficient matrix; is the covariance matrix; and is the unit matrix. Based on the identified coefficient matrix, the following can be further derived:
where to are the values of intermediate parameters related to the coefficients to be estimated. The dual polarization process time constants are obtained from Equation (8), respectively:
where is the time constant of electrochemical polarization process and is the time constant of concentration polarization process. Finally, combining Equations (8) and (9), the cell model parameters are calculated as follows:
The charge and discharge test of lithium batteries was performed, and the curve fitting of the parameters obtained is shown in Figure 2.
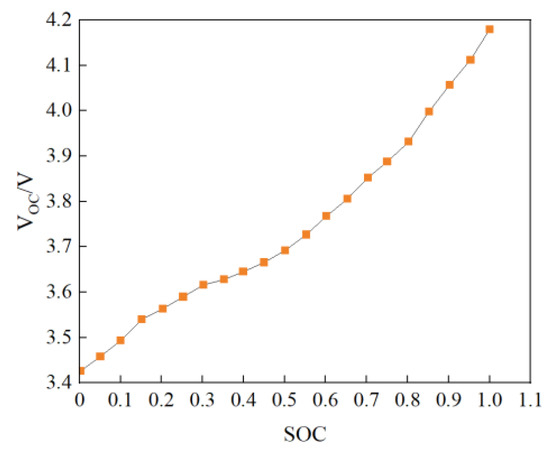
Figure 2.
OCV-SOC fitting curve.
2.3. AFEKF Algorithm
The AFEKF algorithm locally linearizes the nonlinear state-space equations and is suitable for joint parameter identification algorithms to estimate the state of nonlinear systems of lithium batteries. The battery SOC estimation error mainly comes from the estimation of the time constant t and the error transfer during the OCV-SOC mapping relationship. It can be used to compensate the error between the actual state quantities and the observed quantities, and to correct the SOC estimation error due to the inaccurate identification of the open-circuit voltage. The AFEKF state space expression is given by
where is the state vector; is the input vector; is the state transfer function; is the observation function; and and are the state noise values and measurement noise values in the system, respectively. The AFEKF algorithm localizes the model by linearizing the and Taylor expansion at , ignoring higher-order terms yields.
In the meantime, the nonlinear system’s parameters are as follows:
The process of estimating the state of charge (SOC) using the AFEKF method is depicted in Figure 3. The provided discharge current is fed into the battery model, and feedback is generated for the battery’s SOC estimation. The Kalman gain matrix is then adjusted to minimize the error in the end voltage between experimental measurements and model simulations. The updated gain is used to correct the state estimation error. The AFEKF technique is robust and effectively converges after 20 iterations. Moreover, the lithium battery SOC estimation method can be adjusted to adapt to changes in the surrounding environment in real-world scenarios. Figure 3 illustrates the flow of the AFEKF algorithm for SOC estimation.
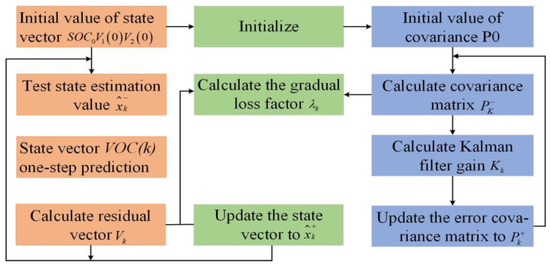
Figure 3.
Flow of AFEKF algorithm for estimating SOC.
3. Data-Driven SOC Estimation
The input layer, hidden layer, and output layer are the three layers that constitute a deep feedforward neural network (DFNN). DFNN is composed of several artificial neurons arranged in a specific manner. The structure of DFNN consists of the input layer, hidden layer, and output layer [29]. To minimize loss during the model’s training and keep the training output close to the true value, the initial learning rate is set to 0.01, and the weight matrix and bias parameters are continually adjusted during the training process of the DFNN. Figure 4 illustrates the construction of the DFNN.
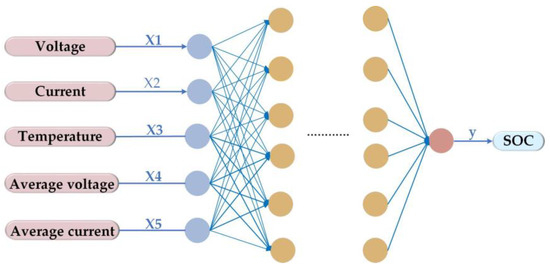
Figure 4.
DFNN structure.
The five parameters current, voltage, temperature, average voltage, and average current correspond to the input properties of the input node, which are represented by the notation X = [x1, x2, x3, x4, x5]. The DFNN algorithm is utilized to estimate the SOC. The numerous neurons that constitute the hidden layer, positioned between the input and output layers, are responsible for extracting features from and transforming the input data. Initially, Layer 1 segregates the original data into dimensionless feature indications. Subsequently, Layer 1 and Layer 2 process the data using an algorithmic approach to extract additional features. Finally, the output layer receives the outcomes. The final prediction results are then output through the output layer. DFNN can derive the final model by continuously iterating Equations (10) and (11).
where is the static input of the neuron; denotes the number of layers of the DFNN; is the weight matrix; is the activation function; is the bias parameter; and is the output of the neuron. In DFNN, the weight matrix is a parameter for stretching the transformation of feature vectors, and its value is a random number in the interval of 0~1. The feed forward neural network’s back propagation updates each network layer during the model training phase, increasing computational accuracy:
where is the updated weight matrix; is the learning rate; is the loss function; and and are the output vectors, respectively. The activation function is used to control the output of neurons to improve the learning ability of DFNN for nonlinear problems. The commonly used activation functions in DFNN are functions such as Sigmoid, Tanh (hyperbolic tangent function) and ReLU (Rectified linear unit) functions. Compared to Sigmoid and Tanh functions, ReLU function improves the neural network training speed and helps the network to adjust the parameters more stably. Therefore, the ReLU function is used as activation function Equation (13).
where f(x) is the output value of the neuron, and x is the input value of the neuron. The degree of variations between the genuine values and the model output values is calculated using the RMSE function, which is provided as (15) to assess the model’s degree of convergence. It is widely acknowledged that the closer the model display values are to the genuine values, the smaller the error value will be.
where denotes the number of samples in each training batch; and and are the true and predicted values of SOC in each training batch, respectively.
4. Mechanism- and Data-Driven Fusion SOC Estimation
4.1. Dataset Acquisition
The dataset has a significant impact on how well the neural network trains. It is constructed from two components: the mechanism model and the normal cycling circumstances of the automotive industry, tailored to match the actual operating conditions of electric vehicles. Ohmic internal resistance and OCV are selected for the mechanism model. Four standard cycling conditions—US06, LA92, UDDS (Urban Dynamometer Driving Schedule), and HWFET (Highway Fuel Economy Test) were chosen for the electric car sector to create the dataset. To collect more data reflecting real-world scenarios, four standard cycles were conducted on the LG_HG2 battery. The time-shifted segments of these cycles were then merged to create six hybrid cycles. To obtain a dataset covering voltage, current, temperature, and SOC, the LG_HG2 battery underwent testing through six hybrid cycles and four standard cycles under consistent charging and discharging conditions. The specific data are illustrated in Figure 5, where (a) represents the US06 battery condition, (b) the LA92 condition, (c) the UDDS condition, (d) the HWFET working condition, and (e) the mixed cycle condition. Each row in the figure displays the voltage, current, temperature, and corresponding SOC for different conditions. The output variables of the mechanism model are incorporated as new eigenvalues into the existing condition dataset. This entails adding additional features generated by the mechanistic model to the original data, resulting in a multi-case fusion dataset utilized as input data for the fusion model.
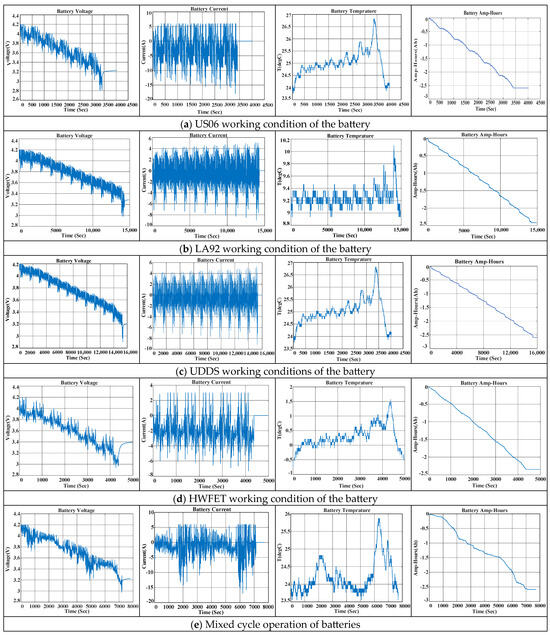
Figure 5.
Working conditions of various types of batteries.
4.2. Fusion Model SOC Estimation Methods
When the DFNN technique is used to estimate the state of charge (SOC) of the power battery, three parameters—current, voltage, and temperature—are entered into the model’s dataset as characteristic parameters. Subsequently, a mapping link is established between these parameters and the state of charge (SOC) of the battery at the critical moment. The relationship between input and output can be visually represented, as shown in Figure 6.
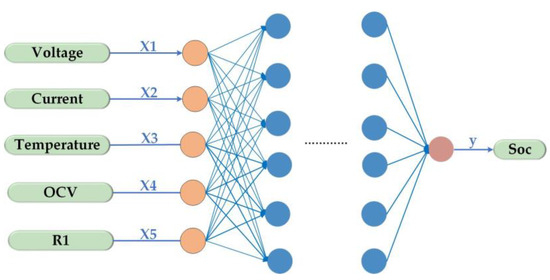
Figure 6.
Fusion model structure.
When the DFNN technique is used to estimate the SOC of the power battery, three parameters—current, voltage, and temperature—are inputted into the model’s dataset as characteristic parameters. Subsequently, a mapping link is established between these factors and the battery’s state of charge at that specific moment. The relationship between input and output can be represented as follows:
where denotes voltage, I denotes current, and T denotes temperature, which together represent the mapping relationship of the DFNN model.
The open-circuit voltage (OCV) profile is a crucial component in SOC estimation. OCV varies relatively slowly and steadily, unaffected by short-term noise, making it a reliable input for high-precision SOC prediction. These voltage components within the cell depict the cell’s response to SOC variations and current excitations on various time scales. The ohmic polarization overpotential and the concentration polarization potential are two significant factors influencing the cell terminal voltage. To expedite the mapping relationship between input variables and battery SOC using the fusion model, internal battery voltage and internal resistance can serve as input variables in the fusion dataset. Dividing each polarization voltage by the current allows for the determination of the polarization resistance.
where Tn represents the second-order Thevenin model, X denotes the new input variable calculated by Tn, i represents the number of new input variables (here, only the two parameters OCV and ohmic internal resistance are used as new variable inputs), and denotes the algorithm used to calculate the battery internal variables. is the fusion model to estimate the battery SOC results. The mechanism- and data-driven fusion model is shown in Figure 7.
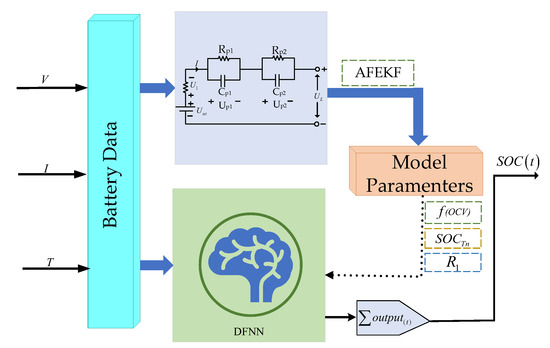
Figure 7.
Mechanism- and data-driven fusion modeling.
Three elements constitute the framework of the SOC prediction approach outlined in this paper: error analysis, SOC estimation using a deep feed-forward neural network, and prognosis assisted by a second-order Thevenin circuit model. During forward propagation, the initial output is computed by inputting the training dataset into the DFNN model. This output is then compared to the reference SOC to determine the error. The partial derivatives of each parameter (weights and biases) in the DFNN are used to update the values before repeating the process for a new iteration. This iterative process continues until the specified criteria are met. The mechanism- and data-driven fusion SOC estimation approach operate as follows:
(1) Training data acquisition, open-circuit voltage (OCV), and ohmic internal resistance data from four automotive industry-standard cyclic condition datasets and mechanism models (US06, LA92, UDDS, and HWFET) are converted into tensor form to create a multivariate time series dataset.
(2) The SOC estimation model was trained with 55 neurons per layer in the DFNN model for 50 iterations of each process. A time series containing 3 + i variables is used as input, where i represents the number of additional state variables, including the mechanism model OCV, ohmic internal resistance, and the training output SOC.
An error analysis is conducted on the state-of-charge (SOC) estimation results to evaluate the effectiveness of the strategy. By quantitatively studying the errors in the SOC estimates using metrics such as root mean square error (RMSE), mean absolute error (MAE), and maximum error (MAX), the accuracy and precision of the SOC estimation process can be thoroughly evaluated.
where denotes the number of samples in the SOC estimation dataset, is the true value of the sample, and is the predicted value of the sample.
5. Simulation Analysis
5.1. SOC Estimation at Different Temperatures
To calculate the maximum error, mean absolute error, and root mean square error at various temperatures, the state of charge (SOC) was determined from four different temperature cases: −10 °C, 0 °C, 10 °C, and 25 °C. The training of the deep feedforward neural network (DFNN) involved 55 neurons per layer, 50 training sessions, and 50 iterations per process.
Figure 8 displays the root mean square error of the state-of-charge (SOC) estimation by the mechanism- and data-driven fusion method at various temperatures (−10 °C, 0 °C, 10 °C, and 25 °C). Figure 9 and Figure 10 show the mean and maximum errors of the SOC estimation by the mechanism- and data-driven fusion method at different temperatures. The simulation results indicate that low-temperature conditions have a significant impact on the SOC of Li-ion batteries. This is evident as the root mean square error, mean error, and maximum error of the SOC of the battery at −10 °C are higher compared to those at 0 °C, 10 °C, and 25 °C.
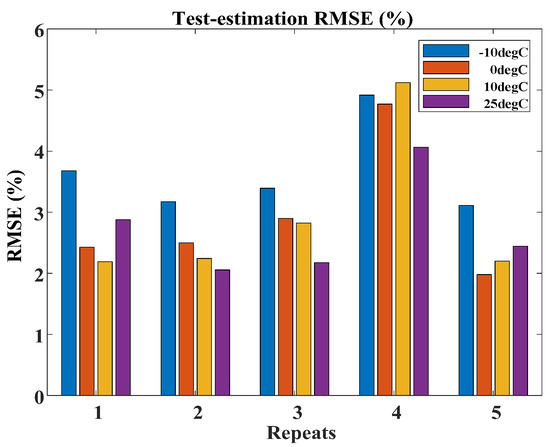
Figure 8.
Root mean square error of estimated SOC at various temperatures.
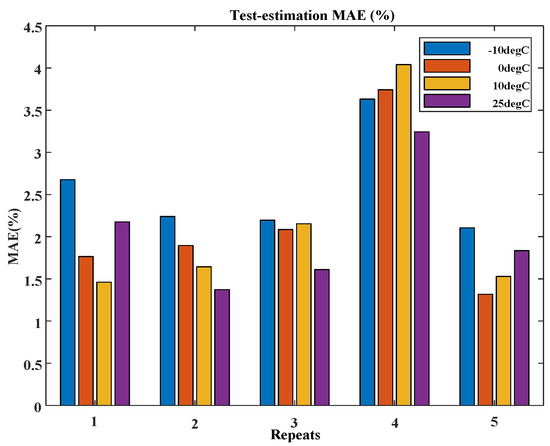
Figure 9.
Average absolute SOC estimation error at various temperatures.
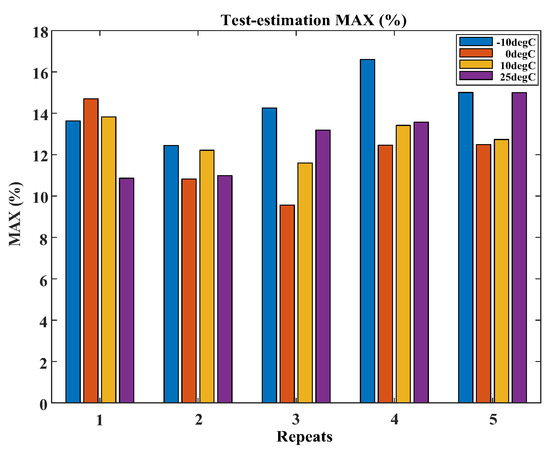
Figure 10.
Maximum SOC estimation error at various temperature.
The data-driven fusion state-of-charge (SOC) estimation and mechanism simulation results at −10 °C are displayed in Figure 11. The discrepancies between the actual and projected values at −10 °C are shown in Figure 12. The figures illustrate that the discrepancy between the tested and observed values is smaller when the SOC value is higher, with an 11% difference between the two when the SOC value is low.
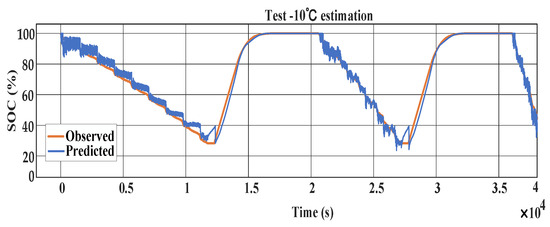
Figure 11.
Chart showing −10 °C SOC estimation.
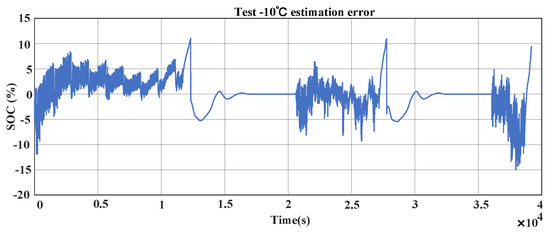
Figure 12.
Chart showing −10 SOC estimation errors at °C.
The mechanism- and data-driven fusion SOC estimation simulation results at 0 °C are displayed in Figure 13, and the errors between the observed and predicted values at 0 °C are shown in Figure 14. It is evident from the charts that the errors between the tested and observed values are lower than those at −10 °C.
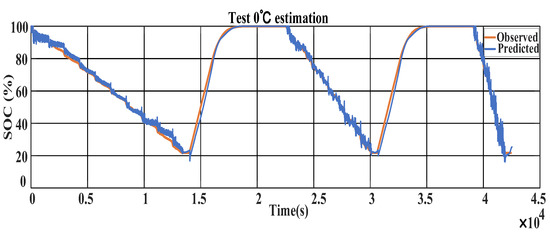
Figure 13.
Chart showing 0 °C SOC estimation.
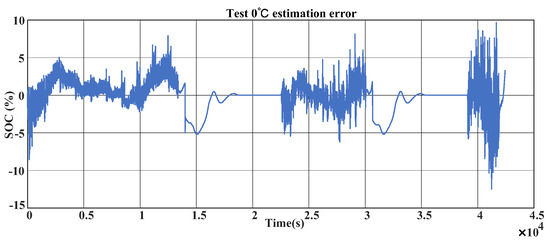
Figure 14.
Chart showing 0 °C SOC estimation error.
The simulation results of the 10 °C mechanism- and data-driven fusion SOC estimation are displayed in Figure 15, and the errors between the actual and predicted values at 10 °C are shown in Figure 16. The figures indicate that as the state-of-charge (SOC) value increases, the errors between the tested and observed values decrease, while both exhibit larger errors when the SOC value is lower.
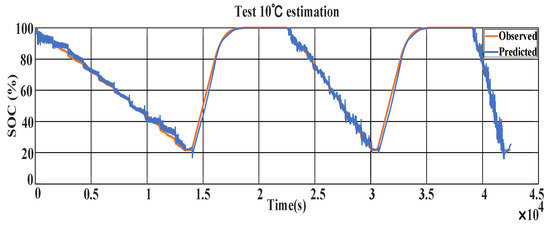
Figure 15.
Chart showing 10 °C SOC estimation.
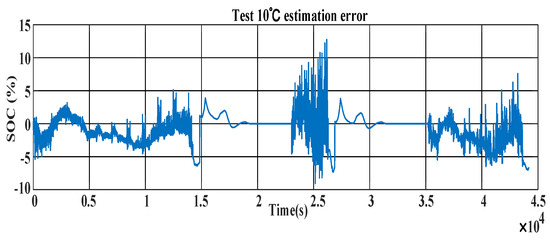
Figure 16.
Chart showing 10 °C SOC estimation error.
The mechanism- and data-driven fusion SOC estimation simulation results at 25 °C are displayed in Figure 17, and the deviations between observed and predicted values at the same temperature are shown in Figure 18. It is evident from the figures, the errors of both test and observed values decrease when the training time is increased to 4.5 × 10⁵ s. The root mean square error (RMSE), mean absolute error (MAE), and maximum error (MAX) are 2.55%, 1.81%, and 12.6%, respectively, following the DFNN algorithm iteration. As the number of training cycles increases, these three evaluation indexes will decrease, and the SOC prediction accuracy will improve. Lithium-ion batteries have several negative effects at low temperatures, including a shorter lifespan, decreased power capability, which can affect EV range, and the need for more complex models to estimate their state of charge (SOC). Consequently, the inaccuracy of low temperature cycling increases.
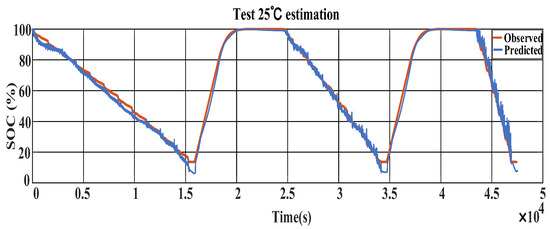
Figure 17.
Chart showing 25 °C SOC estimation.
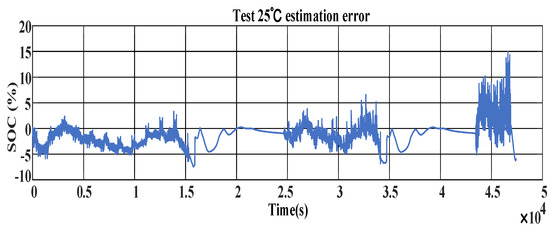
Figure 18.
Chart showing 25 °C SOC estimation error.
5.2. Comparison of SOC Estimation Results of Different Prediction Methods
Comparing data-driven models and mechanics with data-driven fusion models for estimating the state of charge (SOC) at 25 °C requires the integration of mechanical inputs into the dataset construction process. Using the dataset from the mechanistic model as a training and test set helps to implement the fusion in the structural design of the DFNN model, which effectively improves the accuracy and convergence of the fusion of mechanistic and data-driven SOC estimation. Using the data and labels generated from the mechanistic model, a complete closed loop is established through continuous iteration, optimization, and enhancement, thus improving the accuracy and adaptability of the model.
The data-driven method’s state-of-charge (SOC) estimation at 25 °C is depicted in Figure 19. It is apparent from the graph that the test value curve varies significantly during charging. The observed and expected value errors at 25 °C are illustrated in Figure 20, with the observed and predicted value errors increasing as the SOC decreases.
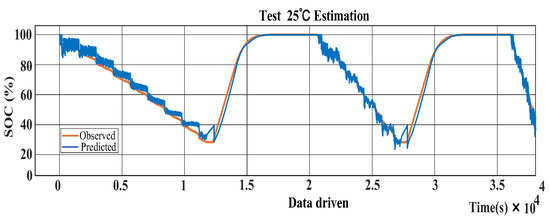
Figure 19.
Chart showing 25 °C data-driven SOC estimate.
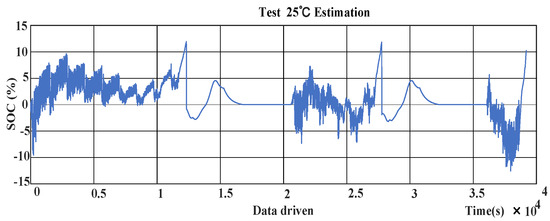
Figure 20.
Chart showing 25 °C data-driven SOC estimation error.
Figure 21 illustrates the state-of-charge (SOC) estimation results at 25 °C achieved by integrating both mechanism-based and data-driven approaches. Meanwhile, Figure 22 displays the discrepancies between the observed and predicted values at the same temperature. These figures highlight that the SOC estimation errors resulting from the fusion of mechanism-based and data-driven approaches are notably lower than those from a purely data-driven SOC estimation.
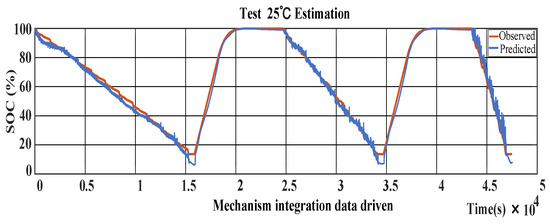
Figure 21.
Chart showing 25 °C mechanism- and data-driven fusion SOC estimation.
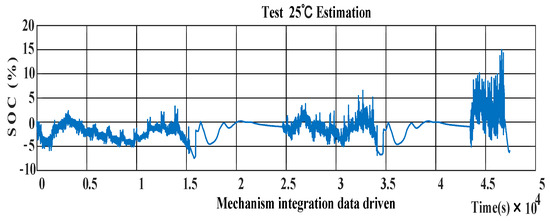
Figure 22.
Chart showing 25 °C mechanism- and data-driven fusion SOC estimation error.
As shown in Table 1, the RMSE and MAE are 1.65% and 1.16%, respectively, after the iteration of the mechanism- and data-driven fusion SOC algorithms. Compared with the data-driven model SOC estimates, the RMSE and MAE are reduced by 0.9% and 0.65%, respectively, and the SOC prediction accuracy is significantly improved. Table 1 shows the SOC limit parameters. Table 1 shows the errors of the two SOC estimation methods.

Table 1.
Comparison table of SOC estimation errors of different methods.
6. Conclusions
This research proposes a mechanism- and data-driven SOC fusion computation method that combines a data-driven model with the Thevenin battery model to improve the generalization ability and accuracy of the model through domain knowledge. Data obtained from the second-order Thevenin battery model and from four standard cycling conditions in the electric vehicle industry were added to the dataset of the data-driven model. Test and training sets for the data-driven model were constructed. Finally, the errors in the SOC estimation results were quantitatively analyzed. The results show that the root mean square error (RMSE), mean error (MAE) and maximum error (MAX) are 2.55%, 1.81% and 12.6%, respectively. By comparing the SOC estimation accuracies of the data-driven models and mechanisms with those of the data-driven fusion models, it is evident that the latter has better generalization performance and higher SOC estimation accuracy.
Author Contributions
Conceptualization, A.T. and W.X.; methodology, W.X. and A.T.; software, C.Z. and A.T.; validation, A.T., C.Z. and Y.Z.; formal analysis, W.X. and A.T.; investigation, C.Z. and Y.Z.; resources, A.T. and H.D.; data curation, C.Z. and A.T.; writing—original draft preparation, W.X., A.T. and Y.Z.; writing—review and editing, A.T., W.X. and H.D.; visualization, Y.Z.; supervision, A.T. and H.D.; project administration, A.T. and H.D.; funding acquisition, A.T. and H.D. All authors have read and agreed to the published version of the manuscript.
Funding
This work was funded by Industrial Support Program for Gansu Province Higher Education Institutions, grant number (No. 2023CYZC-33).
Data Availability Statement
Data are contained within the article.
Conflicts of Interest
This manuscript has not been published or presented elsewhere in part or in its entirety and is not under consideration by any other journal. We have read and understood the journal’s policies, and we believe that neither the manuscript nor the study violates any of these. The authors declare no conflicts of interest.
References
- Ali, M.U.; Zafar, A.; Nengroo, S.H.; Hussain, S.; Alvi, M.J.; Kim, H.J. Towards a smarter battery management system for electric vehicle applications: A critical review of lithium-ion battery state of charge estimation. Energies 2019, 12, 446. [Google Scholar] [CrossRef]
- Wu, L.X.; Lyu, Z.; Huang, Z.B.; Zhang, C.; Wei, C.Y. Physics-based battery SOC estimation methods: Recent advances and future perspectives. Energy Chem. 2024, 89, 27–40. [Google Scholar] [CrossRef]
- Zhang, X.; Hou, J.W.; Wang, Z.K.; Jiang, Y.Q. Study of SOC Estimation by the Ampere-Hour Integral Method with Capacity Correction Based on LSTM. Batteries 2022, 8, 170. [Google Scholar] [CrossRef]
- Sundaresan, S.; Devabattini, B.; Kumar, P.; Balasingam, B.; Pattipati, K. Tabular open-circuit Voltage modeling of Li-ion Batteries for Robust SOC Estimation. Appl. Energy 2022, 15, 9142. [Google Scholar]
- Wang, L.; Sun, J.; Cai, Y.; Lian, Y.; Jin, M.; Zhao, X.; Wang, R.; Chen, L.; Chen, J. A novel OCV curve reconstruction and update method of lithium-ion batteries at different temperatures based on cloud data. Energy 2023, 268, 126773. [Google Scholar] [CrossRef]
- Yu, Q.Q.; Huang, Y.K.; Tang, A.H.; Wang, C.; Shen, W.X. OCV-SOC-Temperature Relationship Construction and State of Charge Estimation for a Series-Parallel Lithium-Ion Battery Pack. IEEE Trans. Intell. Transp. Syst. 2023, 24, 6362–6371. [Google Scholar] [CrossRef]
- Demirci, O.; Taskin, S.; Schaltz, E.; Demirci, B.A. Review of battery state estimation methods for electric vehicles—Part I: SOC estimation. J. Energy Storage 2024, 87, 111435. [Google Scholar] [CrossRef]
- Qi, W.; Qin, W.H.; Yun, Z.H. Closed-loop state of charge estimation of Li-ion batteries based on deep learning and robust adaptive Kalman filter. Energy 2024, 307, 132805. [Google Scholar] [CrossRef]
- Yun, X.; Zhang, X.; Wang, C.; Fan, X.M. Online parameters identification and state of charge estimation for lithium-ion bat-teries based on improved central difference particle filter. J. Energy Storage 2023, 70, 107987. [Google Scholar] [CrossRef]
- Pang, H.; Chen, K.; Geng, Y.; Wu, L.; Wang, F.; Liu, J. Accurate capacity and remaining useful life prediction of lithium-ion batteries based on improved particle swarm optimization and particle filter. Energy 2024, 293, 130555. [Google Scholar] [CrossRef]
- Zhang, Q.; Wan, G.W.; Li, C.R.; Li, J.K.; Liu, X.R.; Li, M.H. State of charge estimation for Li-ion battery during dynamic driving process based on dual-channel deep learning methods and conditional judgement. Energy 2024, 294, 130948. [Google Scholar] [CrossRef]
- Tas, G.; Bal, C.; Uysal, A. Performance comparison of lithium polymer battery SOC estimation using GWO-BiLSTM and cutting-edge deep learning methods. Electr. Eng. 2023, 105, 3383–3397. [Google Scholar] [CrossRef]
- Pei, Z.W.; Liu, K.M.; Zhang, S.; Chen, X.F. Optimized EKF algorithm using TSO-BP neural network for lithium battery state of charge estimation. Energy Storage 2023, 73, 108882. [Google Scholar] [CrossRef]
- Li, Y.; Ye, M.; Wang, Q.; Lian, G.; Xia, B. An improved model combining machine learning and Kalman filtering architecture for state of charge estimation of lithium-ion batteries. Green Energy Intell. Transp. 2024, 3, 100163. [Google Scholar] [CrossRef]
- Khan, A.B.; Akram, A.S.; Choi, W. State of Charge Estimation of Flooded Lead Acid Battery Using Adaptive Unscented Kalman Filter. Energies 2024, 17, 1275. [Google Scholar] [CrossRef]
- Wang, H.; Zheng, Y.P.; Yu, Y. Joint Estimation of SOC of Lithium Battery Based on Dual Kalman Filter. Process 2021, 9, 1412. [Google Scholar] [CrossRef]
- Song, D.D.; Gao, Z.; Chai, H.Y.; Jiao, Z.Y. An adaptive fractional-order extended Kalman filtering approach for estimating state of charge of lithium-ion batteries. Energy Storage 2024, 85, 111089. [Google Scholar] [CrossRef]
- Qin, P.L.; Zhao, L.H. A Novel Battery Model Considering the Battery Actual Reaction Mechanism for Model Parameters and SOC Joint Estimation. IEEE Trans. Ind. Electron. 2024, 71, 5496–5507. [Google Scholar] [CrossRef]
- Pillai, P.; Sundaresan, S.; Kumar, P.; Pattipati, K.; Balasingam, B. Open-Circuit Voltage Models for Battery Management Systems: A Review. Energies 2022, 15, 6803. [Google Scholar] [CrossRef]
- Li, C.; Kim, G.W. Improved State-of-Charge Estimation of Lithium-Ion Battery for Electric Vehicles Using Parameter Estimation and Multi-Innovation Adaptive Robust Unscented Kalman Filter. Energies 2024, 17, 272. [Google Scholar] [CrossRef]
- Zhang, X.S.; Liu, X.J.; Li, J.H. A Novel Method for Battery SOC Estimation Based on Slime Mould Algorithm Optimizing Neural Network under the Condition of Low Battery SOC Value. Electronics 2023, 12, 3924. [Google Scholar] [CrossRef]
- How, D.N.T.; Hannan, M.A.; Lipu, M.S.H.; Ker, P.J. State of Charge Estimation for Lithium-Ion Batteries Using Model-Based and Data-Driven Methods: A Review. IEEE Access 2019, 7, 136116–136136. [Google Scholar] [CrossRef]
- Zhang, C.Z.; Zhao, H.Y.; Wang, L.Y.; Liao, C.L.; Wang, L.F. A comparative study on state-of-charge estimation for lithium-rich manganese-based battery based on Bayesian filtering and machine learning methods. Energy 2024, 306, 132349. [Google Scholar] [CrossRef]
- Zhou, W.; Zheng, Y.; Pan, Z.; Lu, Q. Review on the battery model and SOC estimation method. Processes 2021, 9, 1685. [Google Scholar] [CrossRef]
- Murawwat, S.; Gulzar, M.M.; Alzahrani, A.; Hafeez, G.; Khan, F.A.; Abed, A.M. State of charge estimation and error analysis of lithium-ion batteries for electric vehicles using Kalman filter and deep neural network. Energy Storage 2023, 72, 108039. [Google Scholar]
- Yang, D.; Wang, Y.; Pan, R.; Chen, R.; Chen, Z. State-of-health estimation for the lithium-ion battery based on support vector regression. Appl. Energy 2017, 227, 273–283. [Google Scholar] [CrossRef]
- Wu, M.; Qin, L.; Wu, G.; Huang, Y.; Shi, C. State of Charge Estimation of Power Lithium-ion Battery Based on a Variable Forgetting Factor Adaptive Kalman Filter. Energy Storage 2021, 41, 102841. [Google Scholar] [CrossRef]
- Lyu, C.; Li, J.F.; Zhang, L.L.; Wang, L.X.; Wang, D.F.; Pecht, M. State of charge estimation based on a thermal coupling simplified first-principles model for lithium-ion batteries. Energy Storage 2019, 25, 100838. [Google Scholar] [CrossRef]
- Lee, H.; Kim, Y.; Yang, S.Y.; Choi, H. Improved weight initialization for deep and narrow feedforward neural network. Neural Netw. 2024, 176, 106362. [Google Scholar] [CrossRef]
Disclaimer/Publisher’s Note: The statements, opinions and data contained in all publications are solely those of the individual author(s) and contributor(s) and not of MDPI and/or the editor(s). MDPI and/or the editor(s) disclaim responsibility for any injury to people or property resulting from any ideas, methods, instructions or products referred to in the content. |
© 2024 by the authors. Licensee MDPI, Basel, Switzerland. This article is an open access article distributed under the terms and conditions of the Creative Commons Attribution (CC BY) license (https://creativecommons.org/licenses/by/4.0/).