Article

Mathematical Models and Dynamic Global Warming Potential Calculation for Estimating the Role of Organic Amendment in Net-Zero Goal Achievement

1
Department of Civil Engineering, Indian Institute of Technology, Roorkee 247667, India
2
Engineering and Environment, Northumbria University, Newcastle upon Tyne NE1 8ST, UK
*
Author to whom correspondence should be addressed.
Energies 2024, 17(19), 4819; https://doi.org/10.3390/en17194819
Submission received: 7 July 2024 / Revised: 26 August 2024 / Accepted: 9 September 2024 / Published: 26 September 2024
(This article belongs to the Special Issue Emerging Technologies for Waste Biomass to Green Energy and Materials)

Abstract

:
This study aimed to assess the potential of soil organic carbon (SOC) production through organic amendments. SOC sequestration would help to achieve the net-zero emissions targets set by the Intergovernmental Panel on Climate Change (IPCC). Given the urgency to reduce greenhouse gas emissions, traditional methods that estimate SOC over 100 years must be revised. Hence, a novel fate transport numerical model was developed to forecast SOC levels relevant to individual countries’ net-zero targets in various time frames. The simulation results revealed that most countries had sufficient organic amendment to mitigate the CO2 emission of that country for a year if the organic amendment was applied on 20% of the arable land. However, if a significant fraction of the total CO2 emissions needs to be mitigated before reaching the net zero target, the requirements of organic amendments need to be increased several folds. All the available agricultural land should also be brought under the organic amendment regime. Later, the dynamic LCA approach was undertaken for estimating Global Warming (GWP) from land-applied organic residue. It was observed that, depending on the dynamic LCA model, the estimated GWP was different. However, the estimated dynamic GWP was very close to the residual SOC calculated through the fate transport model. The mass of organic residues generated from a biorefinery was examined by employing a waste biorefinery model to explore further the routes of acquiring additional organic amendment. Simulated results showed that while a waste biorefinery could not provide additional organic residue compared to the original organic waste input, it was highly efficient for nutrient recovery and its uses. This study demonstrated that organic amendment-based carbon sequestration adequately mitigated residual GHG at the net-zero target.

1. Introduction

To keep the earth’s temperature rise within 1.5–2 °C above pre-industrial levels, all nations must ensure their greenhouse gas (GHG) emissions are at zero by 2050 [1]. Around 120 nations have announced their net-zero target year, which ranged between 2040 and 2070 [2,3]. It is crucial to achieve net-zero emissions by actively avoiding, reducing, and offsetting greenhouse gas emissions across all interconnected sectors, such as energy, agriculture, forestry, and heavy industries (e.g., steel) [4,5]. The energy sector, which includes transportation, is the primary source of greenhouse gas emissions. Successfully reducing emissions from the energy sector is paramount for achieving the net-zero goal. Recent studies have indicated that renewable energy and fossil fuels are predicted to be the key energy sources in various net-zero scenarios developed by the IPCC’s Integrated Assessment Models. Around 14–39% of the primary energy would be derived from fossil fuels, which include coal in various net-zero scenarios. The renewable energy share would be between 28–78%. Hence, the energy sector would not be decarbonized even at net-zero. It is estimated that the CO2 intensity of the energy sector would be reduced from 80 Mt CO2/EJ to 30 Mt CO2/EJ at net-zero [6]. In addition to the energy sector, agriculture is projected to be a net emitter of greenhouse gases (GHGs). As a result, there will be residual emissions of GHGs at net-zero, which will need to be offset by various carbon sinks. Estimates suggest that around 6–12 gigatons of CO2 residual emissions will remain at the net-zero target years [6,7]. There is considerable uncertainty in predicting these residual GHG emissions, and addressing residual emissions removal is expected to be a significant challenge in achieving the net-zero goal [7,8,9,10]. Several promising carbon sinks have been identified for removing the residual emissions. Hydrogen energy, carbon capture from air, and carbon sequestration as soil organic carbon (SOC) are some methods highlighted in the various literature. Implementation of some of these technologies requires an exorbitant amount of money. Currently, CO2 removal is priced at $500–$1000 per ton of CO2 removed [6]. Among these methods, carbon sequestration as SOC is most likely the most cost-effective and prevalent method and has been in place for over a century [11,12]. Several reports highlighted that the price of CO2 sequestration varied between $3 to $130 /ton CO2 sequestered [11,13]. Applying organic amendments to improve soil quality and crop yield is a proven practice in agriculture. Hence, enhancing such practices may improve the SOC stock and help to remove the residual emissions at a reduced cost [14]. Organic amendments take various forms for application on the land [15,16]. However, the heterogeneous distribution of organic amendments has led to overapplication in areas with abundant availability [17]. As a result, organic waste can be repurposed for biofuel production. This not only recycles nutrients from organic waste but also helps reduce dependence on virgin nutrients [18]. A few experimental studies demonstrated successful uses of organic waste for algal biomass production [19,20,21].
Diverting organic amendment from land and its use for biofuel production may reduce the soil organic carbon stock generated from the land application of organic amendment in business-as-usual cases.
Therefore, it is hypothesized that (i) uses of organic amendment for a biorefinery would not affect the soil organic carbon on land if the organic amendment was used for biofuel production, and (ii) sufficient organic amendment is available to mitigate a significant fraction of GHG emissions for net-zero targets. These hypotheses were tested using a fate transport model and a biorefinery model.
As per the IPCC guideline, 10% of the applied carbon was taken as sequestered carbon after 100 years of its application [22]. However, several pieces of evidence showed that carbon sequestration and various greenhouse gas emissions from the applied biomass varied from one study to another [23,24,25,26,27,28,29,30]. Estimating residual biomass present on the applied land requires a biogeochemical model. Several biogeochemical models, such as the DNDC (Denitrification–Decomposition), Roth-C, Daisy, etc. [31,32,33,34,35,36], and the APSIM [37,38] and biological field model [39] can simulate soil organic carbon dynamics at different time frames. Some of these models can also simulate the growth of plants considering the N and P present in the biomass. For example, the DNDC model can simulate SOC dynamics and plant growth and decay. Due to the difficulty in calibrating the DNDC model using experimental data, we found it judicious to develop a fate transport model that could simulate SOC dynamics from land application of biomass and simulated the N and P fate plant growth and decay. The model would help to estimate the SOC remaining from the land application of biomass. Such an estimate helps to set a net-zero target and provides a way to reduce the cost of reaching the net-zero target. Most countries have committed for achieving the net-zero target by 2050–2070. Hence, considering the residual carbon remaining on the land as a part of the sequestered carbon would help to reduce the cost of achieving the net-zero target. The carbon sequestration potential of residual biomass for an intermediate time frame would be significant if a reliable and robust methodology could be developed.
Hence, this study estimated the variability of SOC remaining on land at different time frames and its impact on the net-zero goal achievement (hypothesis (i)). For this purpose, a fate transport model consisting of several coupled differential equations was used. The in-house model can simulate the CO2 release and plant uptake of N and P. Plant residue was a part of residual biomass and provided N, P, and released CO2 during simulations. Later, a biorefinery model was used to estimate the organic residue that can be generated from dairy waste [22]. A comparison was made on whether the diversion of organic waste for biofuel production would change the soil organic carbon stock (hypothesis (ii)).
This study introduces a new approach that combines fate-transport numerical models and biorefinery simulations to address the effect of organic amendments on SOC stock building. Our study’s uniqueness lies in its ability to quantify the variability of SOC under different time frames, thereby offering a new perspective for net-zero emission estimation. The model also simulated the plant growth and decay to understand the role of these processes in N and P fate and SOC accumulation. Moreover, we critically evaluated the trade-offs between using organic amendments for biofuel production and land application, providing an informed pathway for achieving net-zero targets. The thoroughness of our research instills confidence in the findings and their potential impact on the field.

2. Materials and Methods

2.1. Development of the In-House Model

The application of waste biomass or nutrients on the land or water was simulated to estimate the carbon sequestration due to the application of waste biomass (organic amendments). Various equations used to simulate the fate of carbon, nitrogen, and phosphorus present in the residual biomass are given below. A schematic showing the various processes incorporated in this model is also depicted in Figure S1. Equation (1) provides the time-dependent change in soil organic carbon. Changes in soil organic carbon depend on the labile pool of the sludge applied on the ground and plant debris remaining after harvest (first part of the Equation (1)). The rate of degradation of the labile and recalcitrant pool was depicted by kd11 and kd12. Equations (2) and (3) are used to simulate the time-dependent change of organic P and organic N. Equations (2) and (3) have similar components as found in Equation (1). Sludge and plant remnants have two pools, labile and recalcitrant. A particular fraction (values are given later) of these pools is assumed to consist of nitrogen and phosphorus. These fractions of N and P in the labile and recalcitrant pool remain constant throughout the simulation. Equation (5) provides the change in N due to the mineralization of organic N, leaching of N, plant uptake of N, and change of N to nitrogen gas. Equations (7) and (8) used for the constant uptake of N and P due to plant growth.
d s o c d t = f s s s c 1 + 0.2 1000 f p Y c 2 1 k d 11 + s s 1 f s c 1 + 0.2 1000 1 f p Y c 2 1 k d 12
d P o r g d t = f s s s p c 11 c 1 + 0.2 1000 f p Y p c 12 c 2 1 k d 11 + s s 1 f s p c 11 c 1 + 1000 1 f p 0.2 Y p c 12 c 2 1 k d 12 P o r g k g m p
d ( P ) d t = P o r g k g m p P k l p P u
d N o r g d t = f s s s n c 11 c 1 + 0.2 1000 f p Y n c 12 c 2 1 k d 11 + s s 1 f s n c 11 c 1 + 1000 1 f p 0.2 Y n c 12 c 2 1 k d 12 N o r g k g m n
d ( N ) d t = N o r g k g m n γ N k l n N u γ N k d n
d ( Y ) d t = c y t
N u = 0.034 Y 1000
P u = 0.002 Y 1000
where SS is the sewage sludge, algae residue, biochar, etc. application rate of 11.9 kg/ha/day; kd11 is 5.05 × 10⁻³–3.09 × 10⁻⁴ (per day degradation rate, labile pool); kd12 is 5.05 × 10⁻⁴–3.09 × 10⁻⁵ (per day degradation rate, recalcitrant pool) [40]; kgmn is 1.27 × 10⁻² to 9.69 × 10⁻³ (per day gross mineralization rate of Norg) [41]; kgmp is 7.84 × 10⁻³ to 3.80 × 10⁻³ per day (mineralization rate of Porg) [42]; kdn is 0–0.655 (per day (denitrification rate inorganic NO3-N to N2 gas) [43]; klp is 3.04 × 10⁻⁹–1.51 × 10⁻¹¹ per day (leaching rate of P (soluble P)) [44]; kln is 0.0265–0.014 [45] per day (leaching rate of inorganic N); γ is 0.243 (fraction in soluble nitrogen that includes NO3); nc11 is the nitrogen to carbon ratio (0.17) for the sludge fraction; nc12 is the nitrogen to carbon ratio for plant remnants (0.17); pc11 is the phosphorus to carbon ratio (0.01) for sludge or residual biomass (algae); pc12 is the phosphorus to carbon ratio for plant residue (0.01) [46]; fs (0.5) is the fraction of labile pool in sewage sludge or algae residue; and fp (0.580) is the labile fraction in crop residue (assumed). Nu is the plant uptake of nitrogen; Pu is the plant uptake of phosphorus; Y is the yield of crops; and Cy varies between 0 to 0.02 for an average biomass yield of 10 ton/ha/year. To validate the model an uncertainty analysis was conducted by varying various parameters [Table S1].
The above mentioned differential Equations (1)–(8) were solved using the Runga–Kutta 4th order scheme. Matlab 2019b®, a scientific computing software program, was used to implement R–K 4th order scheme. The time step of the simulation was optimally kept at 0.5 day. Decreasing the time step further did not improve the result further.
Other pathways and intermediate steps of nitrification and denitrification of various nitrogenous species were ignored, except for converting nitrate and ammonia to nitrogen. Some of these pathways can produce potent GHG nitrous oxide, and the production of nitrous oxide is redox dependent [47,48]. This model did not simulate the redox state of the soil column. Hence, we ignored the N20 emissions from the soil. It was assumed that various mitigation measures, including best management practices and inhibitors, would be applied on land to reduce or eliminate the N2O emission [49,50,51,52].

2.2. Uses of Organic Waste in a Biorefinery and Uses of Residue Generated from a Biorefinery as a Soil Amendment

Previously, an attributional life cycle assessment (LCA) model was developed by Chowdhury and Freire [22]. In this model, dairy waste was used to produce energy by different process trains, and residues generated from those process trains were ultimately applied on the land as a soil amendment. Two process trains (scenario 1 and scenario 4) described in Chowdhury and Freire [22] were used to simulate residue generated from the biorefinery from the addition of 1 ton of N and 0.216 of P as a waste (dairy waste, estimated, Chowdhury and Freire, [22], Supporting Information, Table S1). The residue produced by the biorefinery was estimated at one-year intervals for four years. In scenario 1, the residue was generated from an anaerobic digester. Digesters were used to recover energy and nutrients from dairy waste and algae residue after lipid extraction. In scenario 4 [22]), all the residue was used for pyrolysis, and biochar was produced as the end product for land application (hereafter, scenario 4 is depicted as scenario 2). The carbon content in the residue generated from scenario 1 was assumed as 0.33 for solids generated from anaerobically digested dairy waste [53] and 0.438 in the solids generated from anaerobic digestion of defatted algal biomass [54]. The organic carbon content in the biochar varied depending on the feedstock, temperature of the reactors, and types of pyrolysis (slow, fast, flash, etc.). Detail on the organic carbon content in biochar was given by Krull et al. [55]. The carbon content for this study was taken at the lower side (0.5) [55]. A reference case was also considered, in which dairy waste was not treated through scenario 1 or 2 and applied as raw.

2.3. Biorefinery for Recycling of Nutrients

The process trains used in scenarios 1 and 2 (given in [22] had several procedures used to recover nutrients from waste or biomass residue. For example, anaerobic digestion was used to recover nutrients from dairy waste and defatted algal biomass, and recovered nutrients were returned to the algal pond for more biomass production. A closed-loop procedure was adopted; hence, a minimal amount of nutrients was wasted in these process trains. Completing all the processes in the process train for a scenario took some time and was depicted as a cycle (45 days taken in this study) [56]. After each cycle, the residue generated was wasted, and some nutrients were also wasted through this residue. Nutrients (N, P) recycled through each cycle were estimated using the model. The simulation was carried out for four years. For estimating nutrient recycle and carbon assimilation, a mass balance approach was adopted.

2.4. Dynamic Counting of CO2 for Better Estimation of Global Warming Potential

Dynamic counting of GHGs provides a better estimation of radiative forcing and associated global warming potential. Radiative forcing of a particular gas depends on its residence time in the atmosphere; hence, proper time-wise counting of GHGs is required for an accurate determination of the GWP.
G W P i = 0 t r i C t d t 0 t r r C t d t
C t = a 0 + i = 1 3,6 a i e t / T i
Values of a and T are different depending on the models used for estimating Ct and are given in Chowdhury et al. [57] and references cited therein. The sequestered CO2 and emitted CO2 profiles were taken from the simulation of the model (Equations (1)–(8)). ri and rp are the radiative efficiency of GHG gas of interest and CO2 respectively.
The dynamic GWP was estimated using Equation (11), where DCF was estimated for a gas, which was released at k − 1 time, and its DCF was estimated for a k to k − 1 time step.
D C F i = k 1 k r p C t d t
r p = C
where rp = 5.35 W/m2 and C is the ambient concentration of CO2 at a particular time. GWPdynamic was estimated for a particular puff emission of GHG using Equation (13). A composite GWP dynamic can be estimated by summing all the DCF of individual puff emissions and divided by 0 k r p C t d t . In the present scenario, k = 47 years (2023–2070).
G W P d y n a m i c = i = 1 n D C F i 0 k r p C t d t

3. Results and Discussion

Results obtained from the fate transport models [Inhouse model, Equations (1)–(8)] were used to simulate the carbon sequestration from biomass obtained from a biorefinery after added value product recovery or as raw. Residual biomass was applied on the land, and carbon sequestration was simulated by excluding and including plant growth obtained from N and P present in the biomass. The data obtained from the simulation depicted year-wise carbon remaining on the land. Such simulations can help estimate the carbon storage for a time frame and can be integrated with the net-zero goal for a country or a region.
A mass balance model was utilized to assess carbon sequestration and nitrogen and phosphorus recovery in an algal biorefinery that employed dairy manure nutrients for algae cultivation. The results were obtained from a mass balance model based on Microsoft © Excel. Detailed descriptions of the model can be found in several previous publications [22,56,58]. In this model, dairy waste was used to grow algae. After the recovery of added-value products, the residue was applied to the land, and carbon sequestration was estimated using a 100-year time frame. Then, 10% and 20% of the applied carbon was used as the sequestered carbon obtained from residual biomass and biochar applied on the land [22].

3.1. Carbon Remaining on the Land after Different Time Frames (Simulation Results Obtained from the In-House Model)

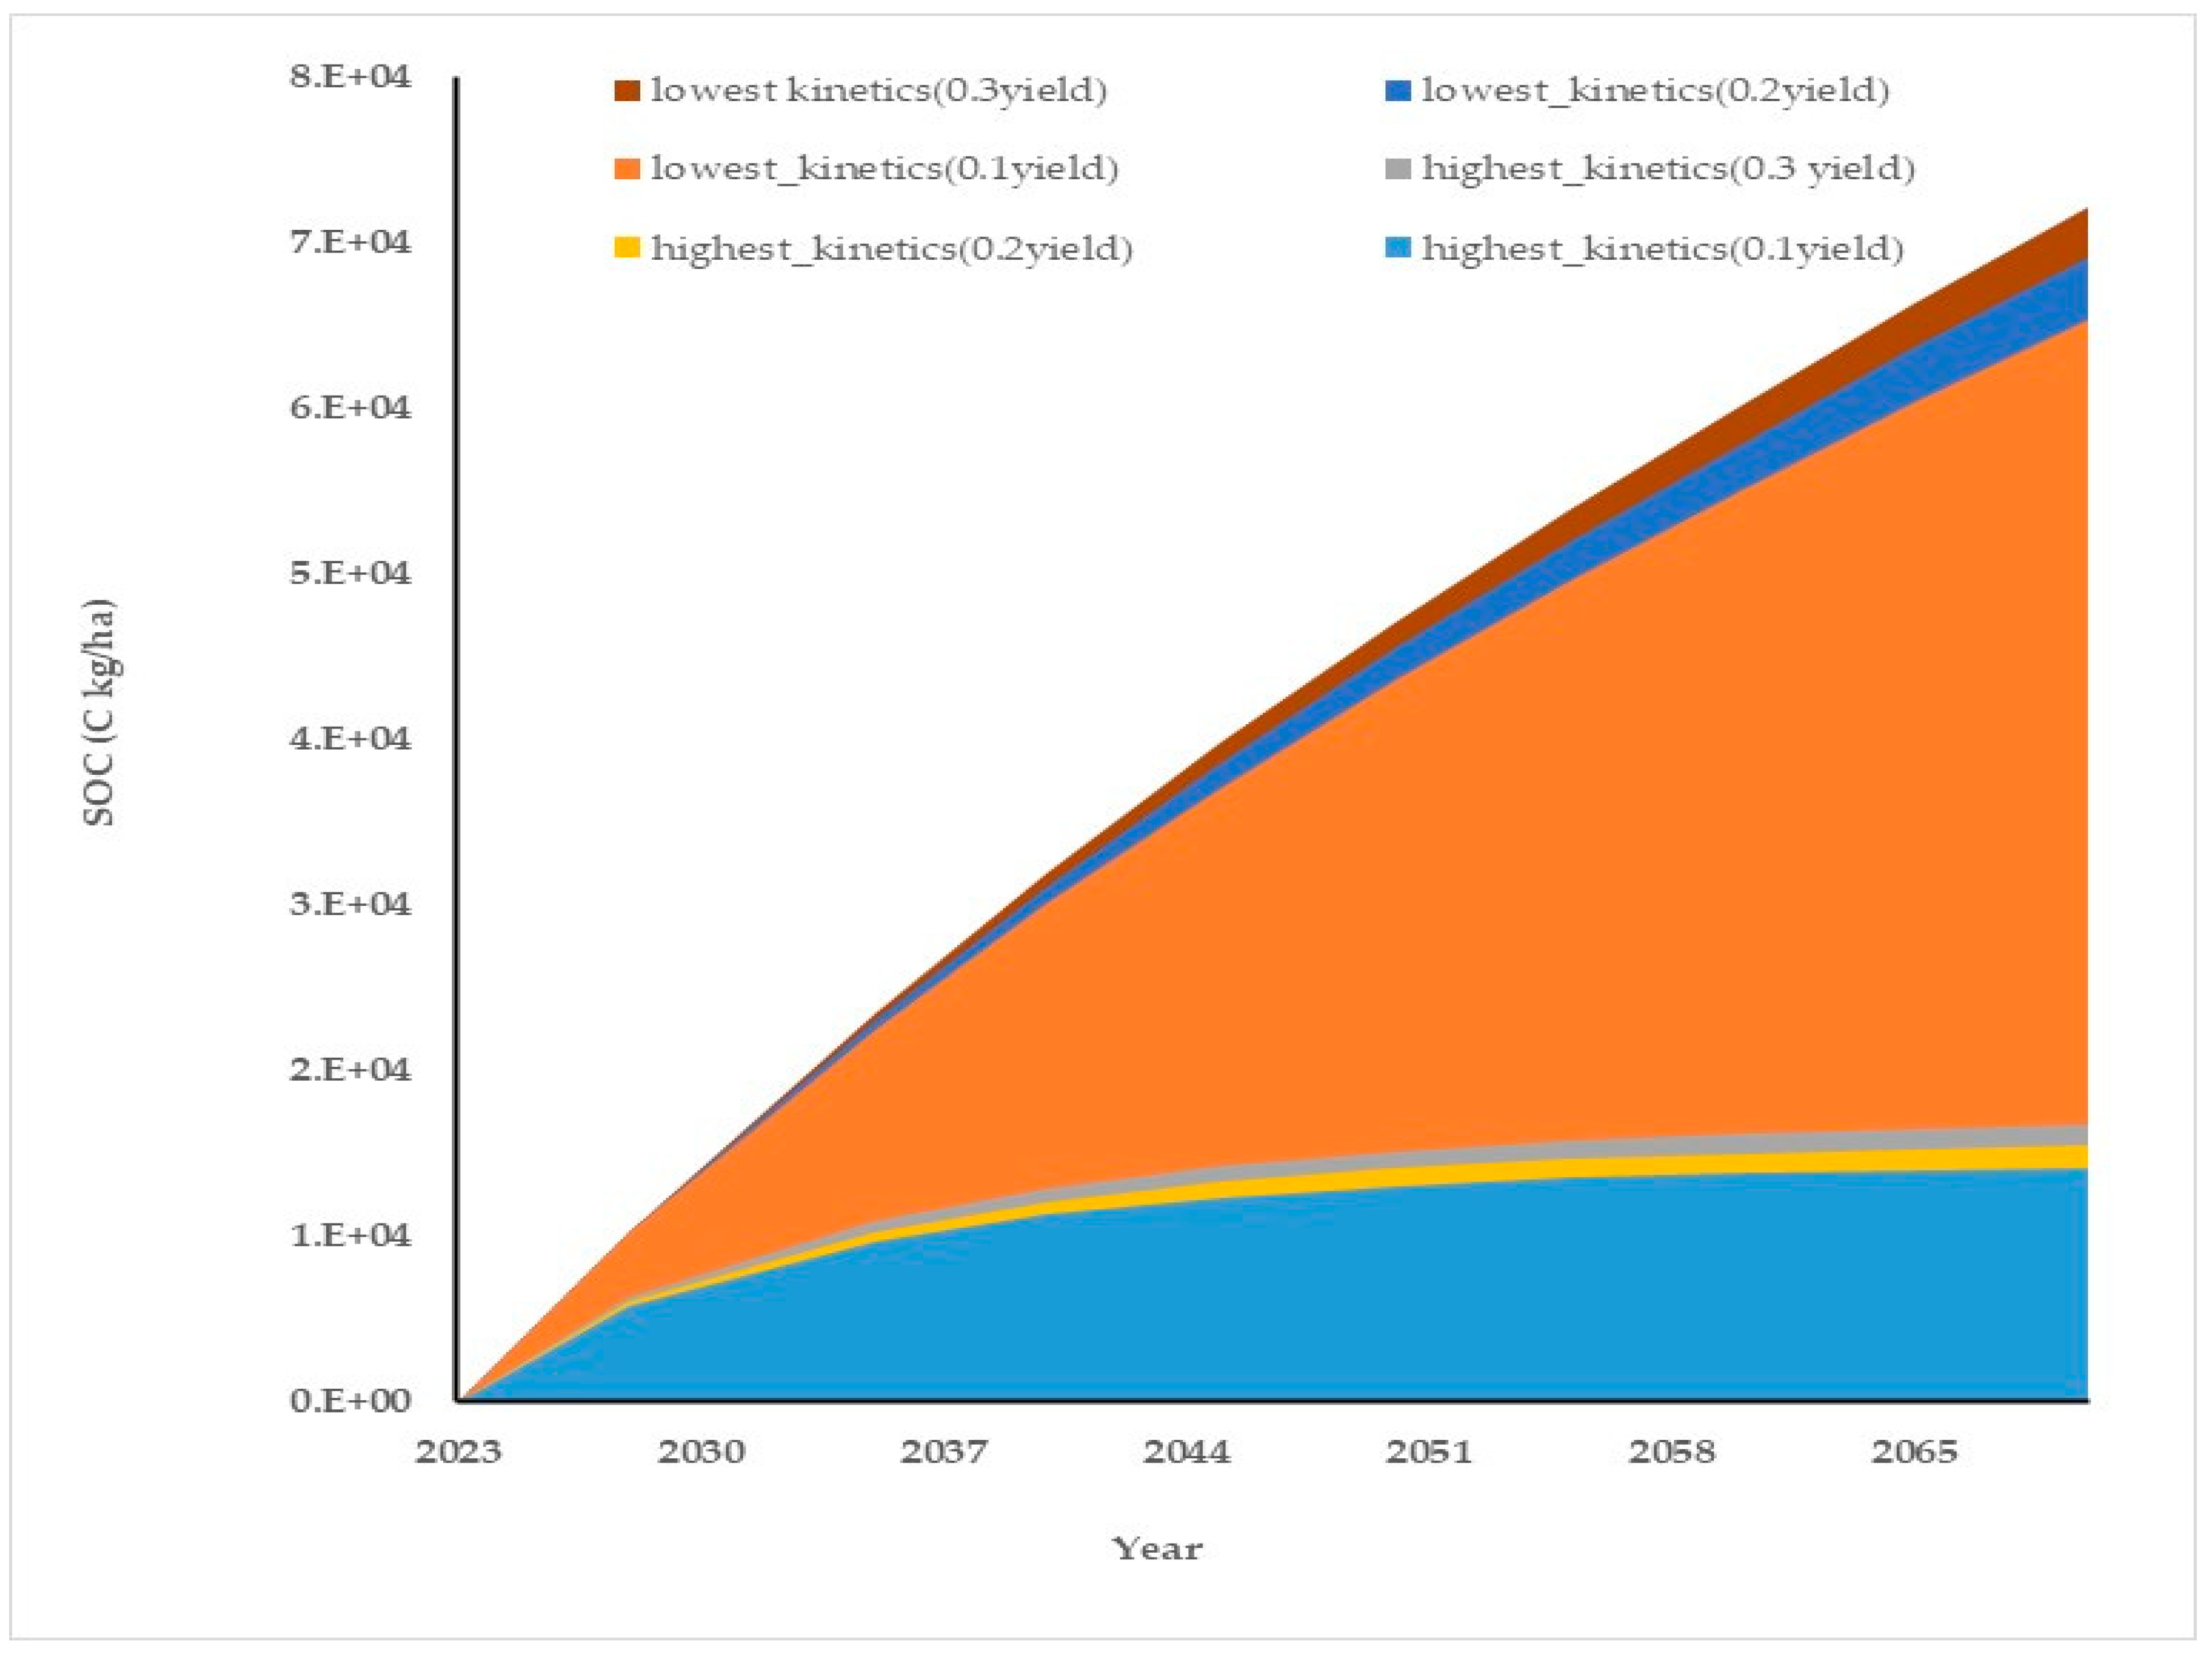
In these simulations, carbon remaining on the land after different time frames was delineated, ignoring the yield of the plants associated with biomass input from plant debris. Two different scenarios were depicted using the lowest and highest kinetics of biomass degradation obtained from the literature (given in the in-house model, Materials and Methods Section 2) [Figure 1].
Application of 11.9 kg/ha/day biomass on land resulted in 1.28 × 10⁴ kg of carbon built up by 2070, if we considered the highest degradation rate, whereas at the lowest degradation rate, the carbon build-up increased to 6.27 × 10⁴ kg/ha. According to the IPCC guideline, it was mentioned that after 100 years, 10–20% of applied carbon would remain on the land [22]. If one estimated the degradation rate taking the IPCC guideline into account, the estimated rate constants were 4.41 × 10⁻⁵–6.31 × 10⁻⁵ day−1. The estimated rate constant provided a lower degradation rate compared to the degradation rate taken in this study (3.09 × 10⁻⁴–3.09 × 10⁻⁵). Hence, our results were more conservative than those given by the IPCC guidelines.
Incorporating plant yield and the addition of plant debris on land increased the accumulation of carbon by no more than 10–20% (Figure 2). We have also checked the adequacy of our model by comparing simulated SOC data and experimental data obtained from literature (Figure S2 and Table S2).
At the highest degradation rate, depending on the fraction of plant-derived biomass that ended up on the land, 1.41 × 10⁴–1.68 × 10⁴ kg/ha carbon was built up on the applied land. Decreasing the degradation rate increased the carbon accumulation to 7.21 × 10⁴ kg C/ha. The contribution of carbon built up from plant debris was further delineated in Figure 3. A total of 2.6 × 10³–9.4 × 10³ kg C was added from plant debris for 47 years, if one considered that 10–30% of the yield ended up on the land as plant debris.

3.2. Implication of Carbon Buildup on Land and Its Role in Net-Zero Target Achievement

The net-zero target or achieving net-zero GHG emission to the atmosphere, is a well-known target set by the IPCC and well-accepted by numerous countries, and some of these countries have announced the year by which the net-zero targets will be reached [59]. Around 59 Gt of GHG (CO2 equivalent) is emitted into the air through various activities [60]. Various nationally determined contribution caps of GHGs fall short of achieving the emission target set by the Paris Agreement [61]. The IPCC advocated keeping the global CO2 level within 430–480 ppm by 2100 to keep the average temperature rise within 2°C. Fossil energy is the prime contributor to GHG emissions. Almost 70% of the GHG emissions originate from burning fossil fuels. The IPCC advocated biofuel use, which would reduce the GHG emissions from the transportation sector. In 2019, around 33 Gt of GHG (CO2 equivalent) was produced from fossil-based energy [62]. Creutzig et al. [63] reported that 35 EJ/year of bioenergy was used in 2015, and the usage would increase from 100 EJ/year to 245 EJ/year by 2050. GHG emissions from biofuels were highly variable, and depending on the incorporation of various parameters, the variations in emissions also increased [64]. GHG emissions from biofuel derived from forest residue, dedicated energy crops, and algae were much lower than those from fossil fuels. Various reports depicted that biofuel produced from the biomass mentioned above varied from 26–93 kg CO2 eq/GJ of biofuel produced [22,65,66]. Some of these studies took the carbon credit derived from residual biomass applied on land. These studies took 10–20% of the applied carbon as the sequestered carbon and deducted the CO2 sequestered from the emitted GHGs (CO2 equivalent).
The net-zero target aims to reduce the net greenhouse gas (GHG) emissions to the atmosphere to zero. This means that there is no requirement to estimate residual carbon remaining on the land after 100 years. Instead, it is necessary to determine the amount of residual carbon on the land after a specific period. Therefore, the simulation conducted in this study will be useful for estimating the carbon sequestration potential at different times. Carbon sequestration costs through this method are low, and forest, marginal, and agricultural land can be utilized for residual biomass application. For instance, the UK has developed various pathways to achieve net-zero targets, with some of these pathways promoting carbon sequestration through afforestation [67].
Several reports and researchers advocated for renewable energy in the form of hydrogen, photovoltaic, and bioenergy with after-combustion carbon capture [68,69,70,71,72]. Most of these proposed technologies have a low TRL (technology readiness level) and an exorbitant implementation cost. For example, decarbonizing the energy sectors in the UK costs 200–509 pounds/ton of CO2 emissions [73]. Hence, residual biomass generated from agricultural and bioenergy production facilities provides an inexpensive way to store carbon to achieve a net-zero target. Residual biomass applied on the land increases the soil organic carbon (SOC) stock of the receiving land. The IPCC and various researchers also observed that increasing SOC in soil provided a major share of the GHG emission abatement for reaching the net-zero target. It was reported that around 23.8 Gt CO2/year could be stored as SOC through various landforms, including agricultural, wetland, peatland, grassland, forest, etc. [12]. Cropland has a sequestration potential of 12.8 Gt CO2/year [74]. Bossio et al. [12] reported that agricultural and grassland areas have no more than 2.3 Gt CO2/year of SOC production potential. Several such variations are observed when estimating the potential of SOC at the global and national levels. This study, therefore, also tried to estimate a realistic contribution of SOC that can be achieved from organic residue application on land.
Table 1 shows the GHG emissions of various major GHG-emitting countries. Except for China, most of the major GHG emitters, such as the US, EU-27, India, and Russia, have the potential to mitigate a major fraction of GHG emissions from the application of biomass on arable land (if 20% of the total arable land is available and GHG emission is mitigated for a particular year of GHG emission). Most of these countries also have sufficient biomass available for application on the land (Table 1). To mitigate a substantial amount of GHG emissions reduction until the net-zero target year through biomass application, one must use all the available agricultural area. For example, China will emit around 260 Gt of CO2 until 2060 if one considers a linear decrease of GHG emissions from 2023 to 2060. In that case, the present approach could mitigate 9% of the emission through SOC if all the agricultural land were used for SOC storage with an organic amendment of 11.9 kg/ha/day. Increasing the biomass application rate increased the residual carbon linearly on land (i.e., doubling the biomass application input doubled the residual carbon on land). Hemmat et al. [75] also reported that increasing the rate of organic matter application increased the soil organic carbon linearly up to a particular application rate of 50 Mg/ha/year). Smith et al. [76] also observed that increasing the organic amendment linearly increased SOC (5 ton/ha/year SOC: 0.53; 10 ton/ha/year SOC: 1.26; 15 ton/ha/year, SOC: 1.50). The Chinese government has taken numerous steps to increase the SOC stock in agricultural soils. These steps include conservation tillage, application of organic amendments, monitoring the SOC stock in the agricultural soils, etc. It was estimated that around 0.61 Gt of C was built up in the topsoil in some of the cropland in China in the last 21 years [77]. Chinese cropland accumulates 0.044–0.12 Gt CO2/year under mineral nutrient and organic amendment regime (straw return). Hence, at that pace, by 2060, Chinese cropland could accumulate 1.6–4.6 Gt of CO2 as SOC [78]. The estimated SOC was very close to the one estimated in our study (Table 1).
India is another country that has considerable CO2 sequestration potential through the build-up of SOCs. Fuhrman et al. [79] reported that by 2050, India could mitigate millions of tons of CO2 per year using biochar. India’s cropland contains around 20–23 Gt of CO2 as SOC stock, and 80% of this SOC stock is present in India’s mono and double-cropped land. Experimental studies showed that applying fertilizer and organic amendments increased the SOC stock by 10–20% compared to its initial value. The C sequestration rate, however, varied from one study to another and ranged from 0.023–0.089 Gt of C year−1 [77].
Studies conducted in France showed that the SOC sequestration potential was 1.81 Gt in arable land. However, as per the 4/1000 initiative, which aims to increase the amount of carbon stored in soils by 0.4% per year, the SOC sequestration should be 5.8 Mt of CO2/year. Reaching the potential of SOC sequestration under this initiative requires 61 years [80]. Several researchers analyzed IPCC–IAM scenarios and found that around 6–12 Gt of CO2 needed to be mitigated through carbon sinks. Our study showed that organic amendment at its current availability could mitigate at least 8 Gt of CO2 (Table 1). The mitigation potential can be increased by increasing the application rate of organic amendment and the land that is being used for organic amendment. However, mitigating a major fraction of GHG gases for net-zero targets through organic amendment will require to increase biomass availability by several fold. These aspects are discussed in detail later in the manuscript.
Table 1. Arable land available for large GHG-emitting countries, their net-zero target year, and carbon sequestration potentials of 20% of the arable land. In the fifth column, numbers in the parentheses and brackets show CO2 sequestration with and without plant growth, respectively. These numbers denote maximum and minimum values that can be obtained from simulations.
CountryGHG Emissions (Gton CO2), 2020 [81]Net-Zero Target Year [82]Arable Land Available (km2) [83]GHG Emission Mitigation from Biomass Residue Applications (Gton CO2 eq.)Biomass Required per Year (Gton)Residual Biomass AvailableResidual Emission at Net Zero (Buck et al., [7] Mt CO2 eqReference
China13.742060 [82]1,086,420(4.8–1.1) [4.23–1]0.094 0.39 Cuiping et al., [84]
USA6.32050 [82]1,705,000(5.9–1.6) [5.28–1.5]0.150.4–3.3831605Gronowska et al., [85]
EU273.92050 [82]1,570,000 [86](5.4–1.8) [4.9–1.4]0.140.365 Esteban and Carrasco, [87]
India3.612070 [82]1,581,450(8.4–1.6) [7.3–1.5]0.140.5 Kumar et al., [88]
Russia2.32060 [89]1,216,490(5.4–1.23) [4.74–1.12]0.110.213 Namsaraev et al., [90]
Japan1.272050 [82]43,080(0.15–0.04) [0.13–0.04]0.04
Brazil1.262050 [91]610,000(2.1–0.6) [1.9–0.5]0.050.782 Ferreira et al., [92]
Indonesia1.0742060 [93]220,000(0.97–0.22) [0.85–0.21]0.02
Mexico0.8012050 [91]248,000(0.85–0.24) [0.77–0.22]0.020.05 Lozano-Garcia et al., 2020 [94]
Canada0.7622050 [82]451,000(1.6–0.43) [1.4–0.4]0.040.05–1.02149Gronowska et al., 2004 [85]
South Korea0.7582050 [82]15,530(0.05–0.015) [0.05–0.013]0.001
Saudi Arabia0.752060 [95]34,460(0.15–0.035) [0.13–0.03]0.003
South Africa0.5742050 [82]145,000(0.5–0.14) [0.45–0.13]0.012
UK0.4642050 [82]60,050(0.2–0.06) [0.19–0.05]0.005 76
France and Monaco0.452050 [82]182,603(0.63–0.17) [0.57–0.16]0.016 80
Poland0.4252050 [96]125,710(0.43 –0.12) [0.39–0.11]0.011
Vietnam0.419205063,000(0.22–0.06) [0.2 –0.06]0.005
Italy0.4182050 [82]71,320(0.24–0.07) [0.22–0.06]0.006
Argentina0.3972050 [97]320,000(0.11–0.3) [0.99–0.28]0.028
Spain0.352050 [82]125,000(0.43–0.12)–[0.39–0.11]0.011 29
Malaysia0.3242050 [98]18,000(0.062–0.017) [0.056–0.016]0.0016
Taiwan0.322050 [97]7.87 [98](2.71 × 10−5–0.75 × 10−5) [2.44 × 10⁻⁵–0.69 × 10⁻⁵]6.8 × 10⁻⁷
Ukraine0.2782060 [82]324,740(1.43–0.33) [1.27–0.3]0.028

3.3. Dynamic Counting of CO2 and Associated GHG Mitigation Potential

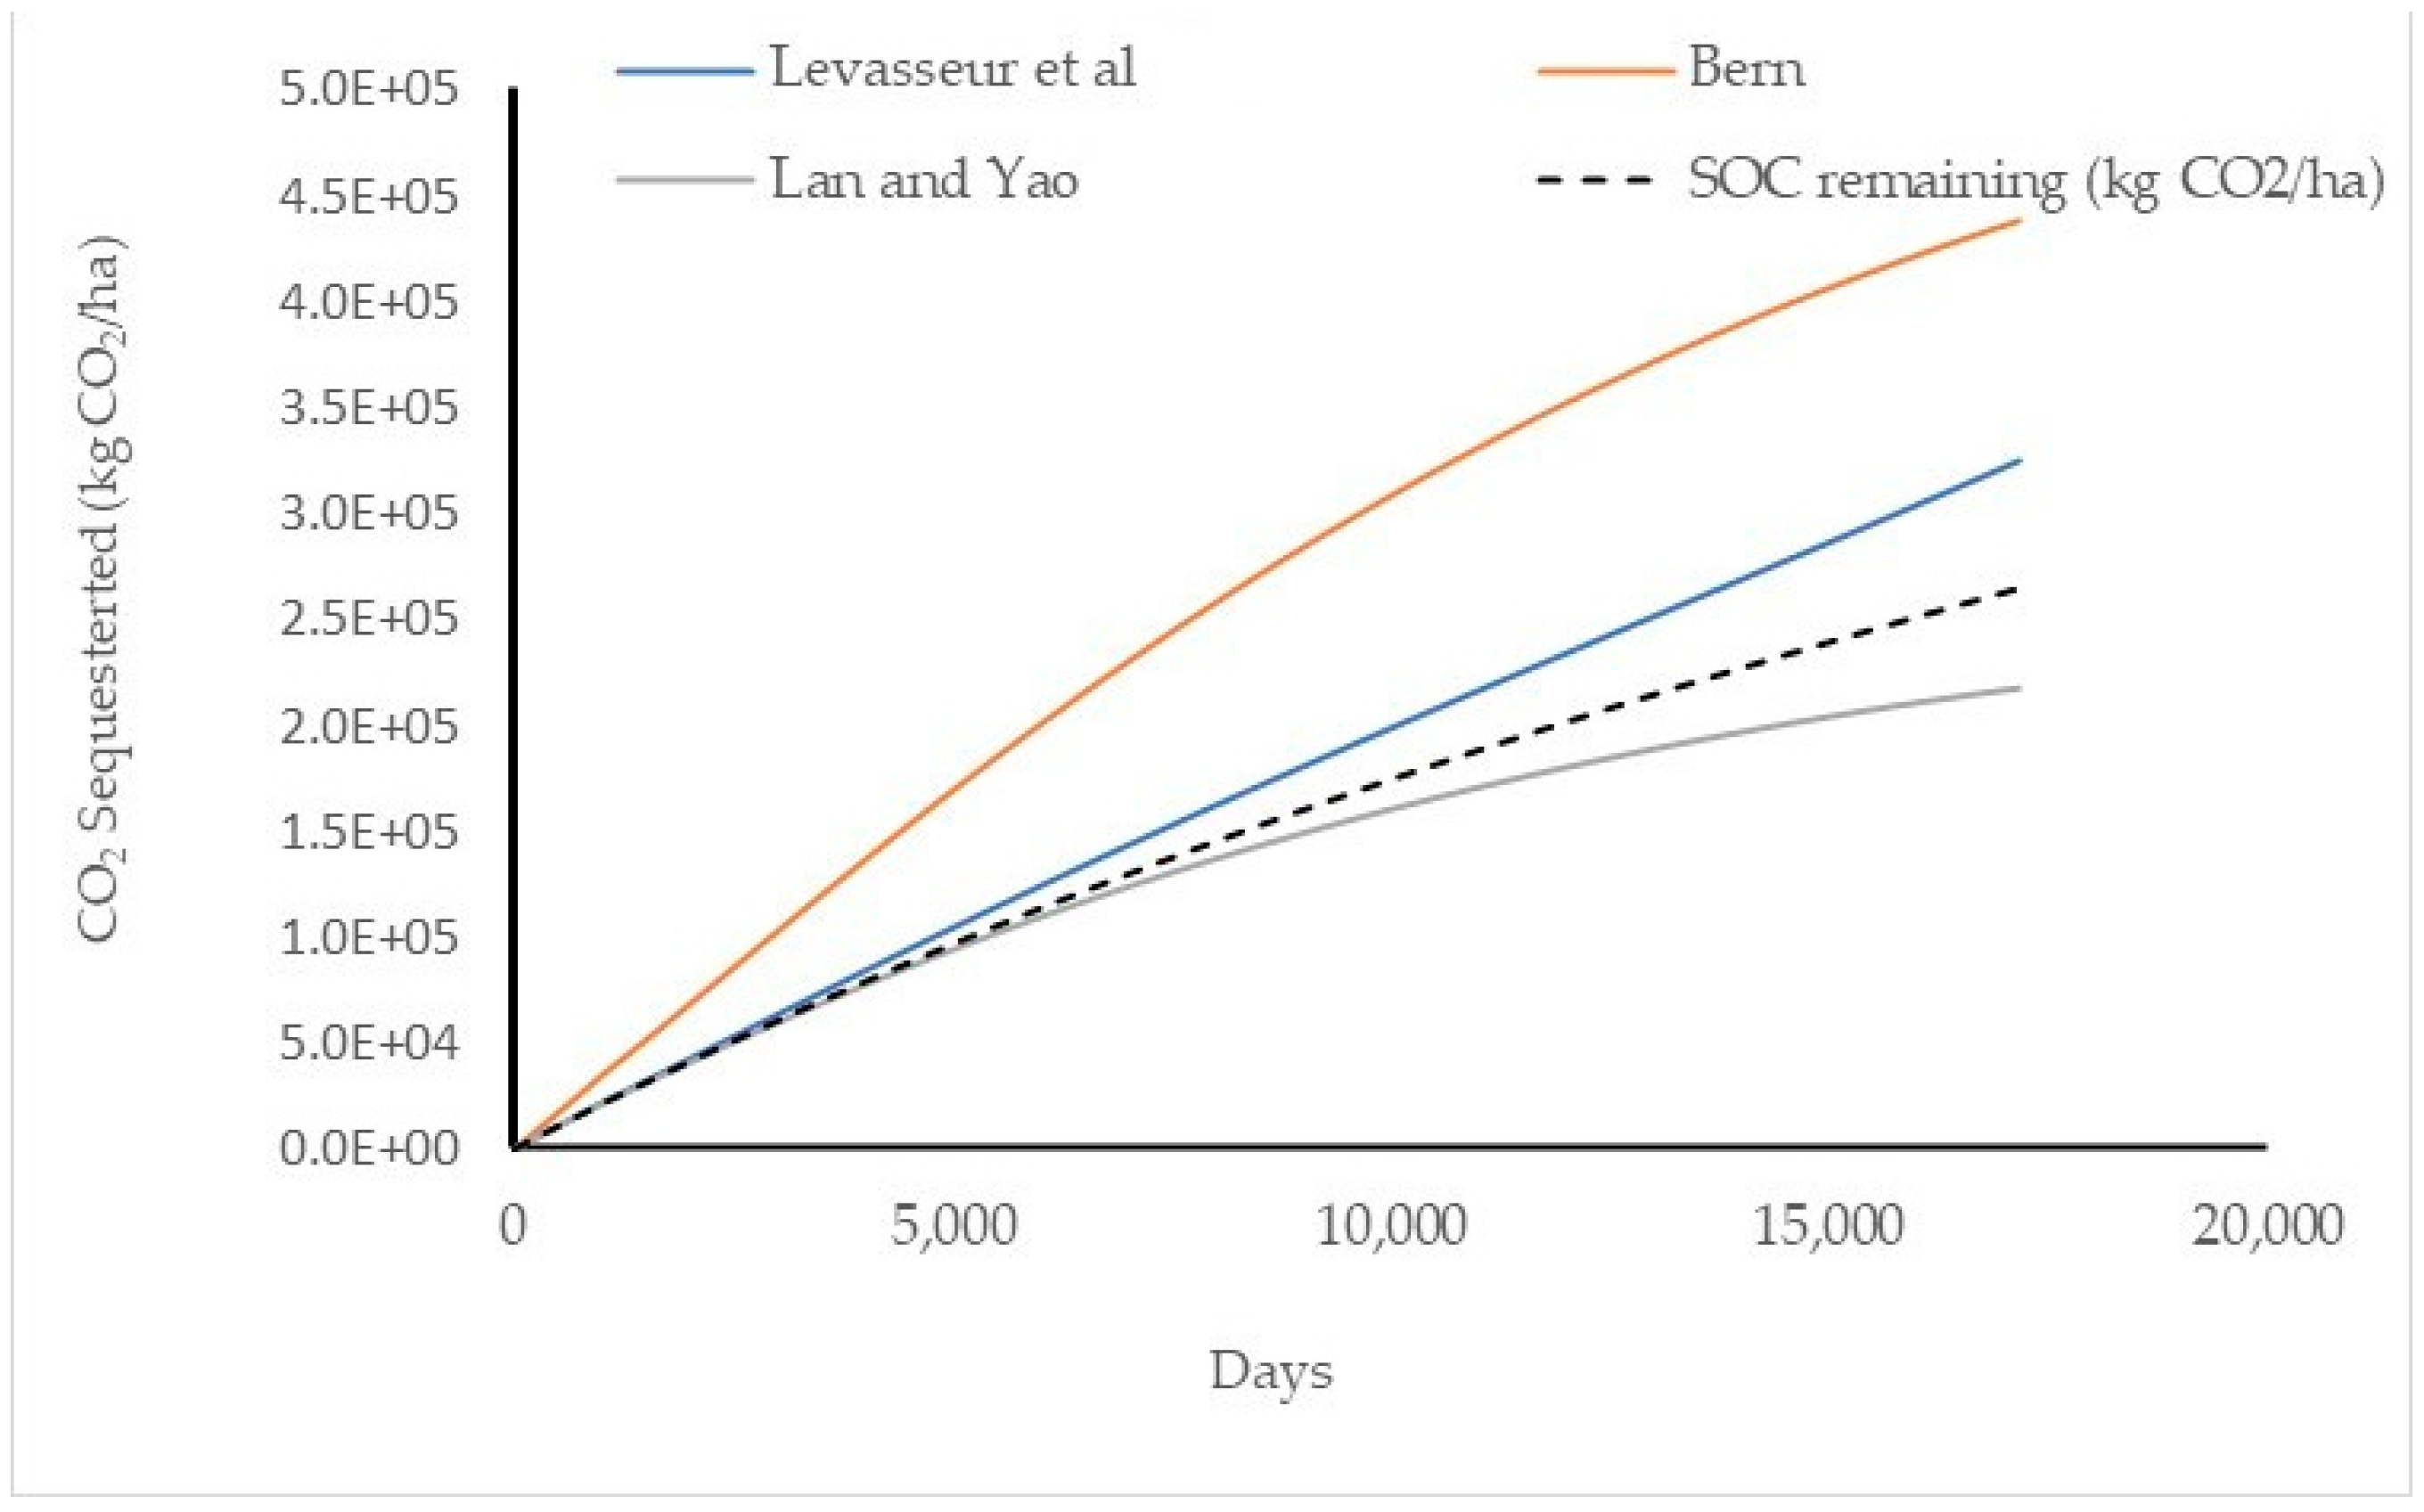
This study estimated the dynamic GWP using Equations (9)–(13). Three models used for estimating the dynamic GWP showed different GWPs at different times. The highest GWP was estimated through the BERN model [57]. In contrast, the model developed by Levasseur et al. [99] and Lan and Yao [100] provided comparable results (Figure 4). After 47 years, the dynamic GWP was very close to the value estimated as the remaining SOC on the land. For example, the BERN model estimated a CO2 sequestration of 4.35 × 10⁵ kg CO2/ha compared to 2.53 × 10⁵ kg CO2/ha using the mathematical simulation. Unlike the BERN model, Levasseur et al. [99] and Lan and Yao [100] predicted a GWP sequestration of 3.23 × 10⁵ and 2.17 × 10⁵ kg CO2/ha, respectively. Lower values of CO2 sequestration were estimated using models developed by Levasseur et al. [99] and Lan and Yao [100] due to the incorporation of CO2 emissions from the field due to microbial degradation of organic amendment on the field. The predicted SOC value (as kg CO2/ha) estimated through mathematical models (Equations (1)–(8)) did not consider the GWP generated through emitted CO2. The difference in GWP estimated through various models was due to the difference in radiative forcing calculations in those three models.

3.4. Role of Biorefinery in Residual Biomass Generation and Nutrient Management

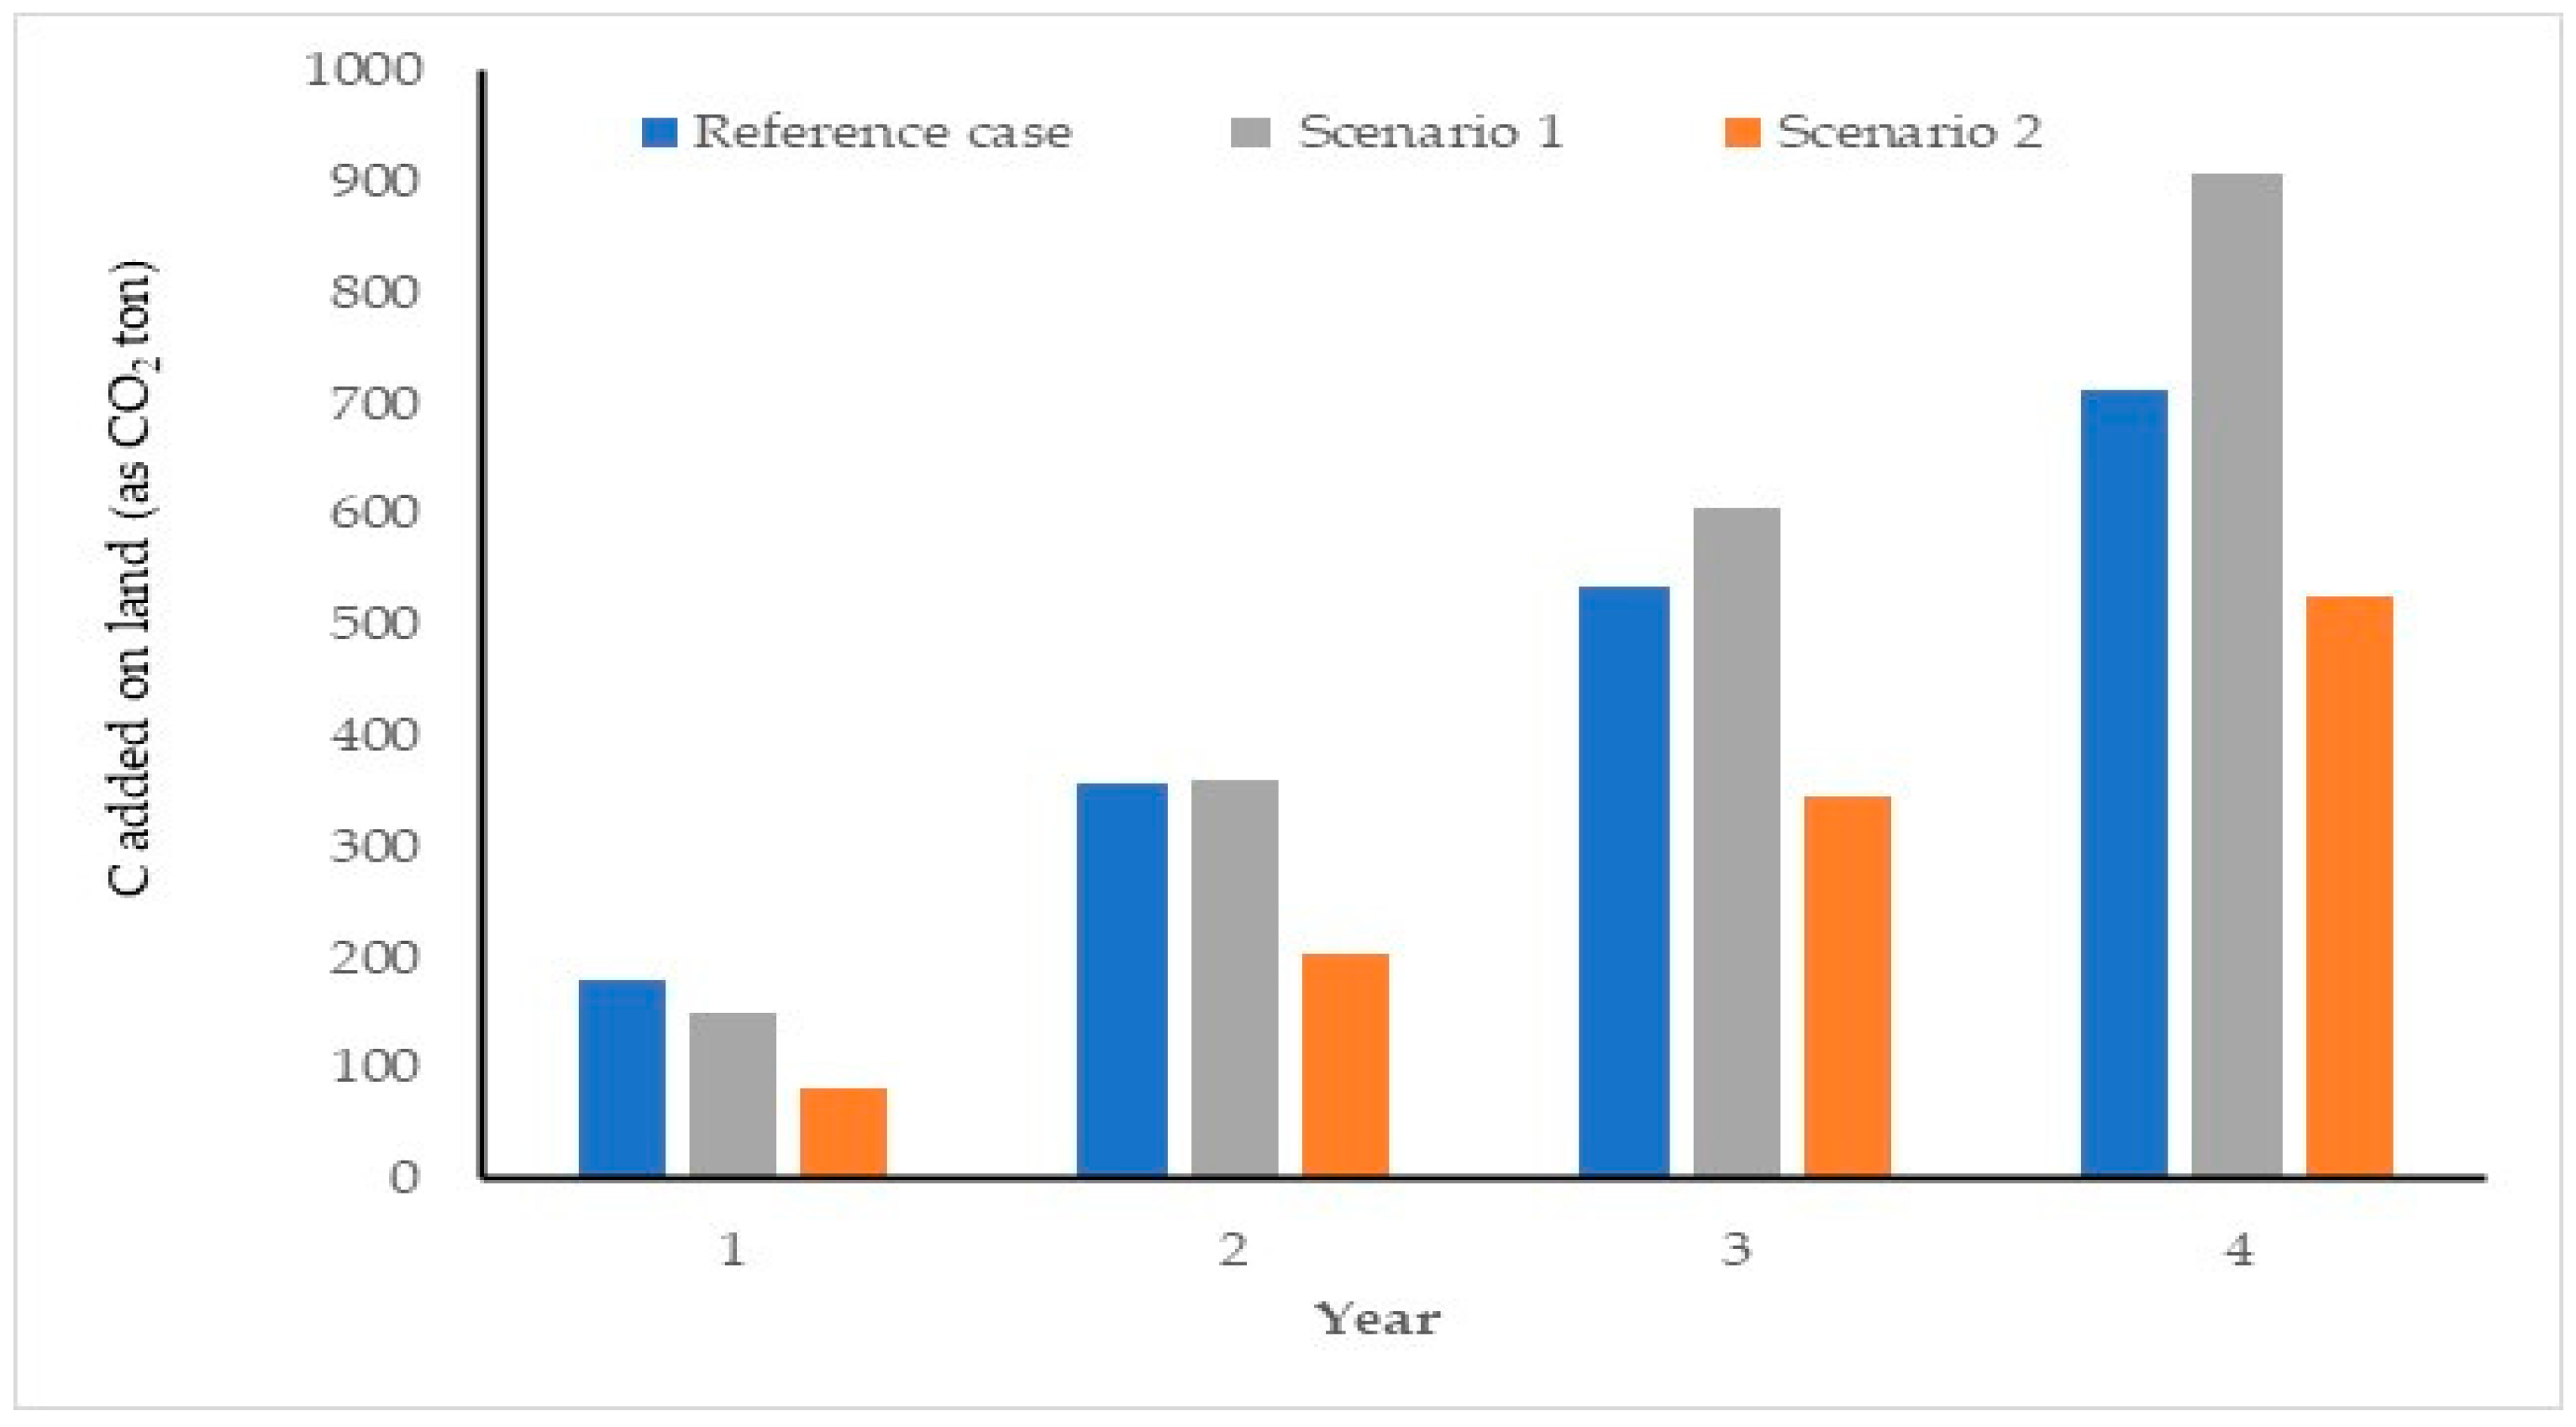
In the previous section (Table 1), we showed that land application of organic amendment provided substantial mitigation of CO2 emission for at least one year of emissions of most countries that have declared a net-zero target. The available organic amendment was sufficient to achieve the one-year emission reduction target (Table 1). Most agricultural land must be used for organic amendment application to reduce a substantial fraction of GHG emissions before ultimately reaching the net-zero goal. In such a situation, there is a need to increase the production of organic amendments, which can be used for land application. Biorefineries can provide an inexpensive and continuous supply of organic residue for land application. Biomass is the main feedstock for a biorefinery; hence, biomass production can be increased by various routes, including dedicated energy crops and algal biomass for use in a biorefinery. Waste nutrients produced from various anthropogenic activities, such as municipal waste and wastewater generated from animal operations, can provide an inexpensive resource of nutrients for algal biomass production. Chowdhury and his coworkers provided several publications on the uses of animal wastewater for biofuel production using the algal route [22,56,58]. Using animal waste for biofuel production reduces the nutrient requirements, and residual biomass can be used for soil amendment instead of raw animal waste. The biorefinery approach also helps to improve nutrient management as the nutrients present in the algal biomass can be recovered through several nutrient recovery techniques, including anaerobic digestion [22,58]. The model used in those studies was used here to simulate CO2 sequestration potential when a biorefinery approach was undertaken for biofuel production [22]. It was estimated that residual carbon generated using a biorefinery approach in scenario 1 was similar in the first and second years compared to the original organic residue applied on land, and higher in the third and fourth years than the original residue (reference case). Hence, the biorefinery approach provided more organic residue for land application and an added biofuel production advantage. In the second scenario, the residue generated was less than the reference case (Figure 5). However, in the second scenario, biochar was produced, which could generate more soil organic carbon after a particular time. Biochar has a lower nutrient value; hence, additional nutrient amendment is required for growing crops on biochar-amended soil. The biorefinery approach provided the added benefit of nutrient recycling that ultimately helped to provide more biofuel.
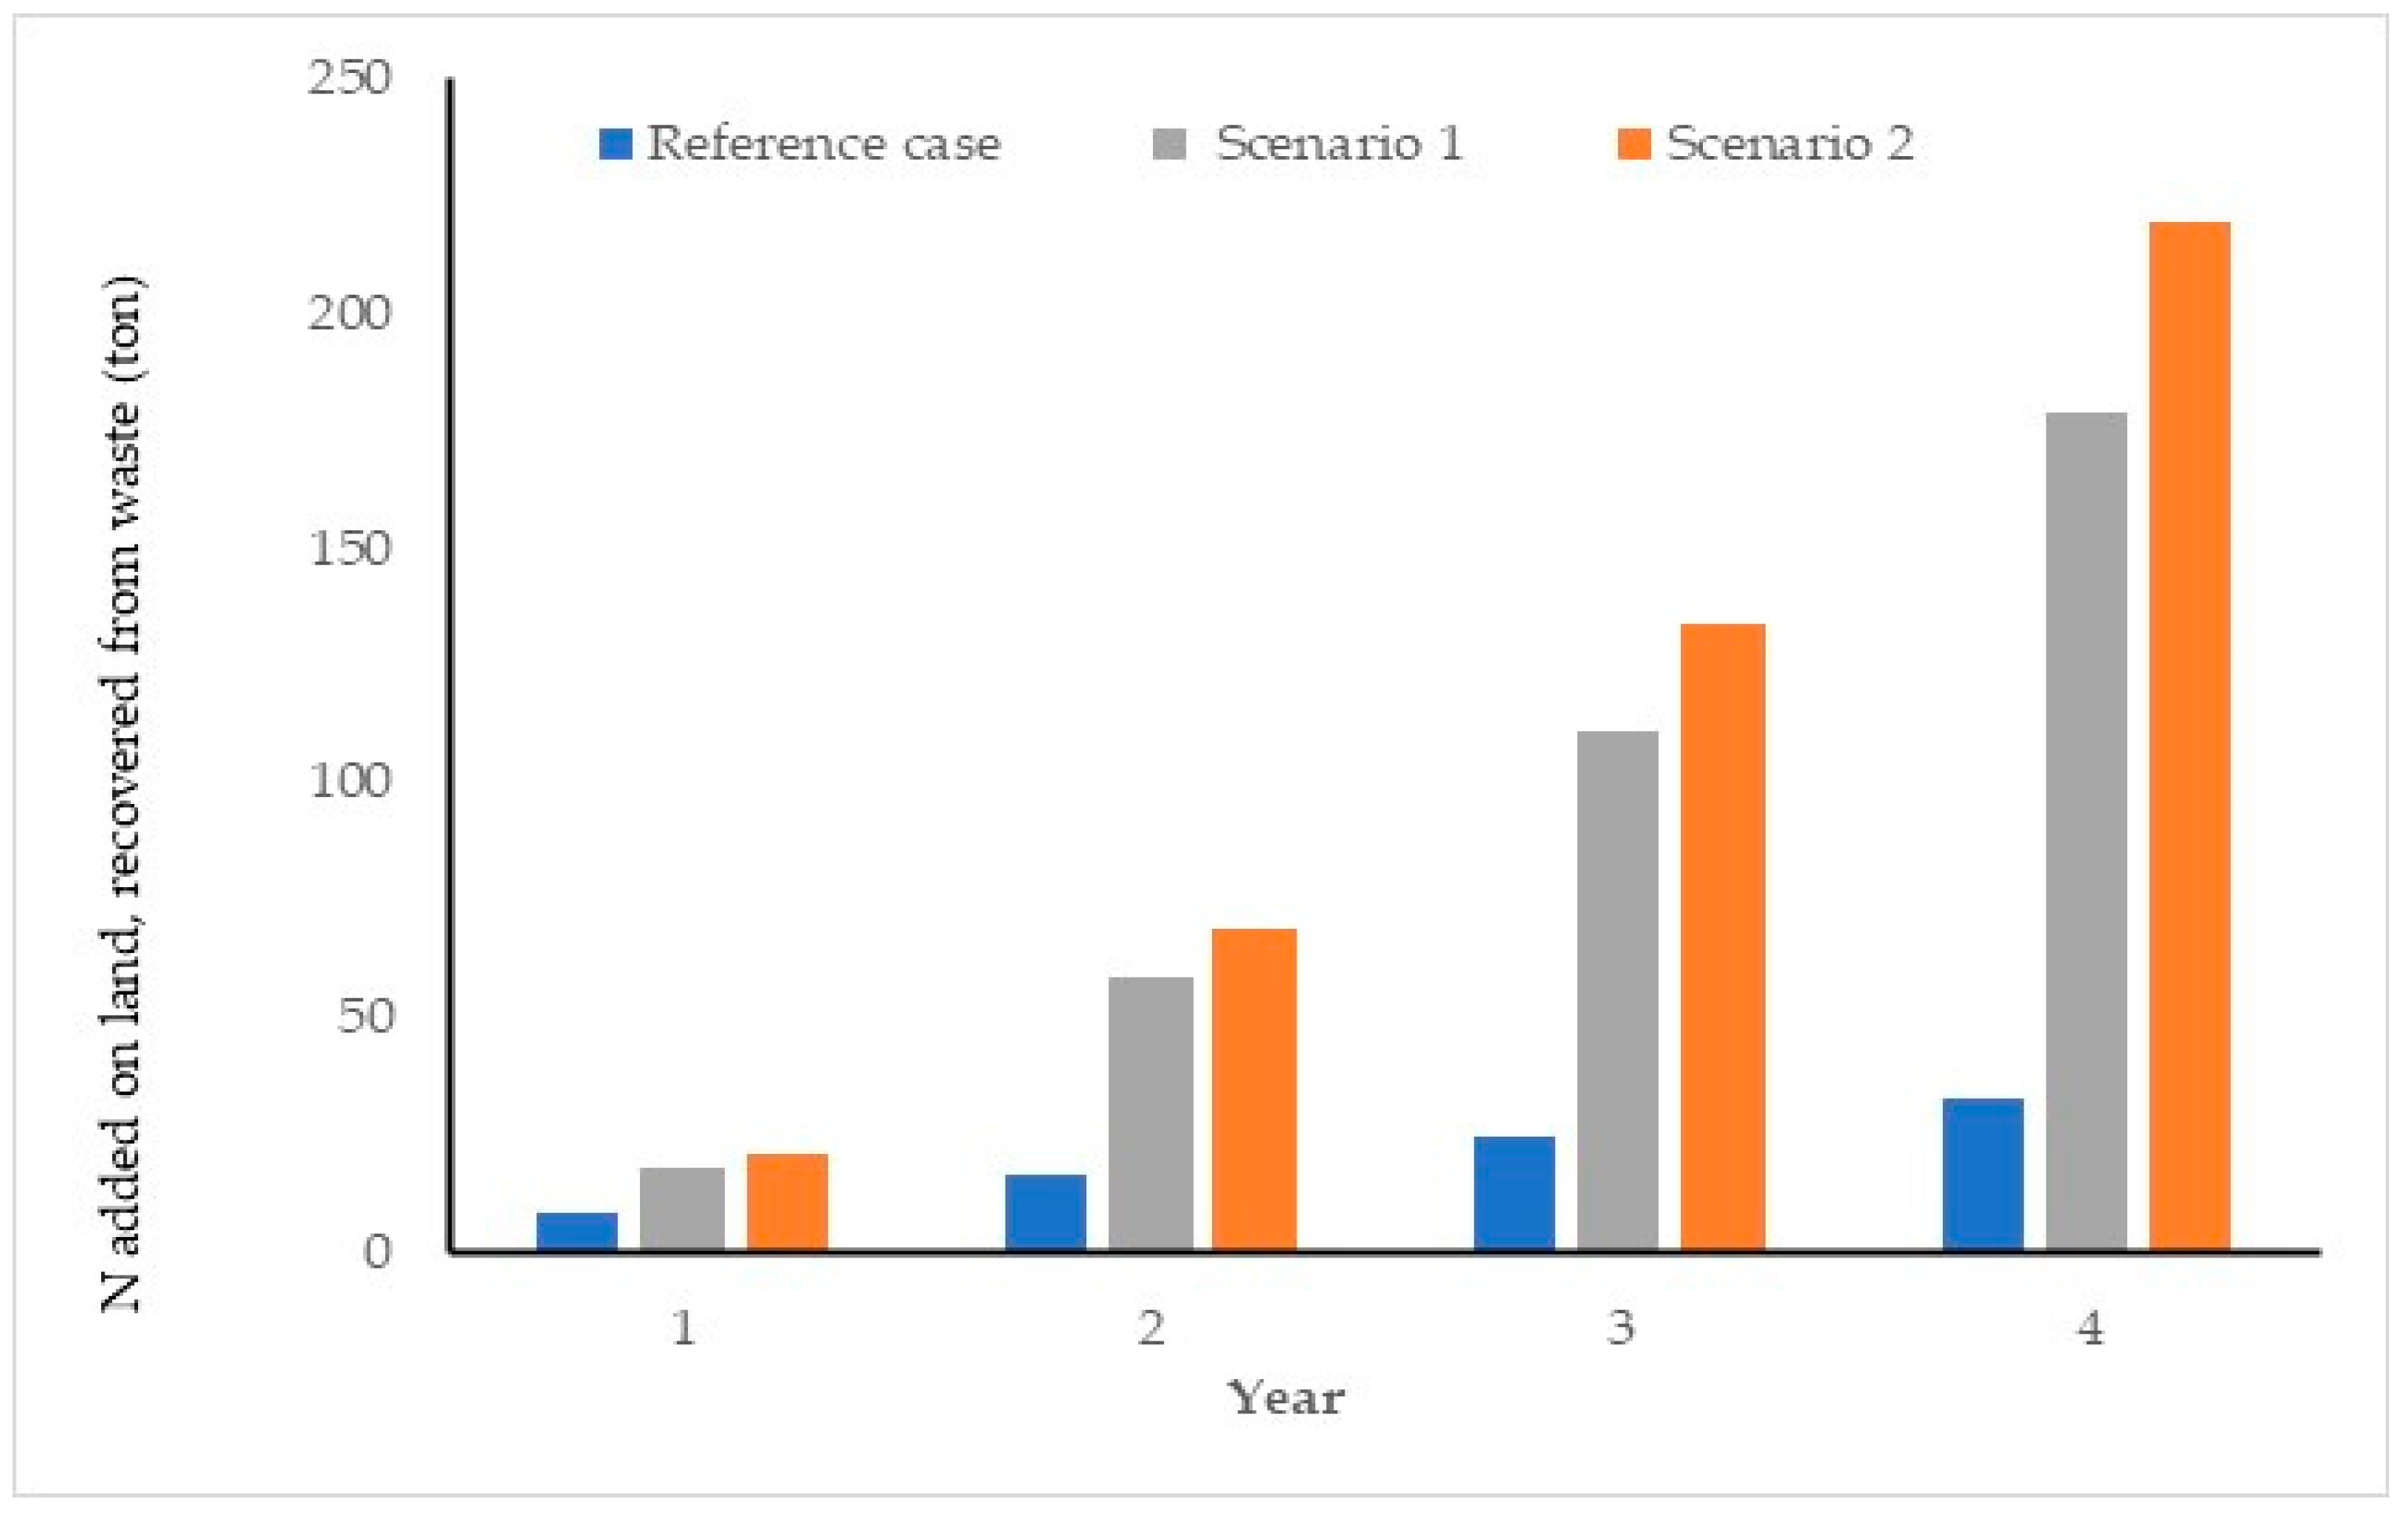
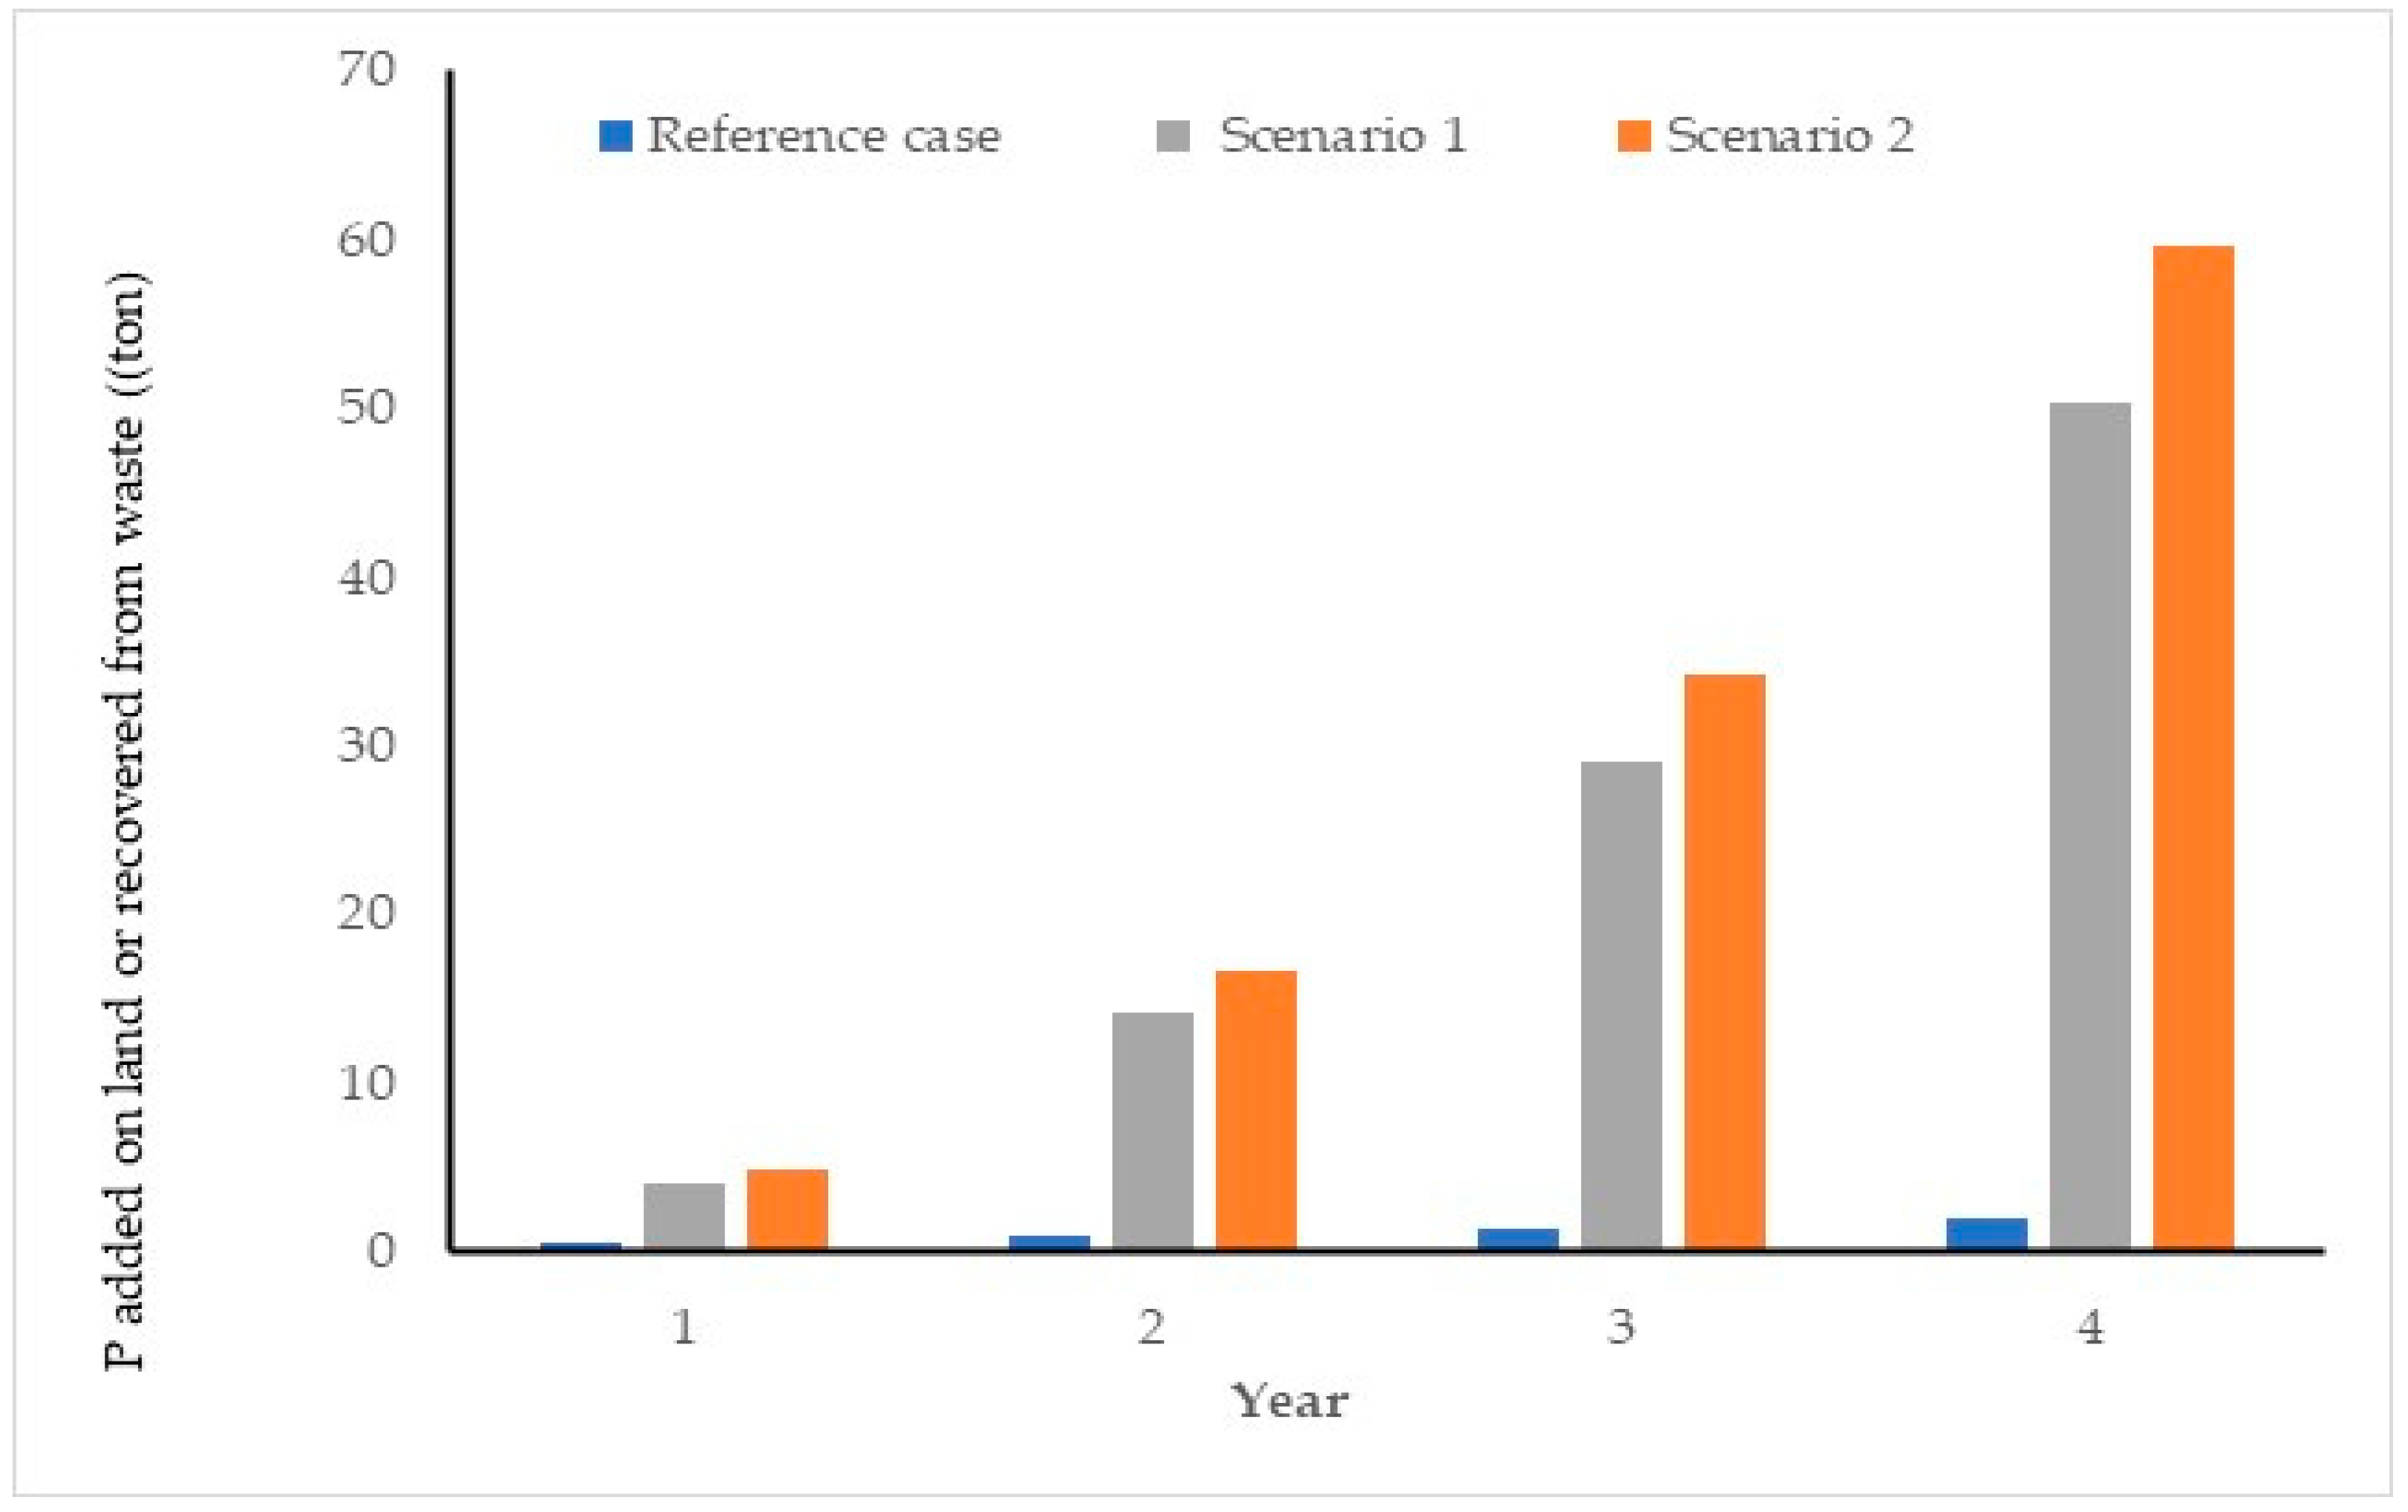
The benefit of nutrient recycling through the first and second scenarios was evident in Figure 6 in which 8 ton to 33 ton of N was added during the first year to fourth year through the reference scenario. Due to nutrient recycling in scenario 1, 18 tons to 172 tons of N was generated, and accordingly, biomass production (algae) also increased. Recycling produced more N in the second scenario than in the first scenario. A similar trend was also found for P (Figure 7). Hence, the biorefinery approach, especially in the first scenario, provided more organic residue for land application, and hence more SOC can be generated by the net-zero target year. The second scenario may also provide a similar SOC by the net-zero target year as biochar provided a higher SOC after a particular time compared to other organic residues. The main benefit of a biorefinery in the case of a net-zero target can be realized through biofuel production, which has lower GHG emissions than fossil fuel. It was estimated that dairy waste produced in the USA could produce 3.14 EJ of energy per year and mitigate a substantial portion of GHG emissions from the US transportation sector [57,58].
Several other studies undertaken on the uses of soil organic carbon stock in climate mitigation also reported that SOC could be a primary player behind climate mitigation [9,101]. Organic amendment also works as a temporary carbon storage; depending on the nature of the organic amendment, the temporary storage would stay in the soil for a shorter or longer time and provide temporary climate benefit [101] or would help in reaching net zero, as we have advocated in this study. On the other hand, Sharma et al. [102] observed that extreme events such as floods and drought reduced the SOC content of the soil drastically. Hence, there is a mixed opinion of the potency of SOC as a significant player in climate mitigation. After carefully examining the literature discussed, we have concluded that SOC would provide a substantial climate benefit if sufficient organic amendment was available. As per the current availability of organic amendments, SOC could mitigate at least the residual GHG emission remaining at net zero. However, floods, drought, forest fire, and landslides would undoubtedly affect SOC build-up. Hence, SOC built up through organic amendment should be considered a cushion or good practice against climate change, and various government agencies should take immediate steps to build up SOC in soil. Such good practices give us carbon stock that could mitigate SOC and biogenic carbon depletion from various natural disasters mentioned before and would also help us to reach net zero.

4. Conclusions

Organic amendment provides an avenue for increasing soil organic carbon to help reach net-zero goals. Here, we developed a fate transport model, which simulated the SOC remaining on land after a particular time. This study’s simulated results showed that most countries had sufficient organic amendment to mitigate at least one year of their GHG emissions (hypothesis 1). The available organic amendment also mitigated residual GHG emissions at the net-zero targets described in several studies. However, to mitigate a substantial amount of GHG emissions before reaching net-zero, a nation needs to increase the organic amendment production by several fold. Using organic residue for biofuel production in a biorefinery approach provides added value in biofuel and nutrient management without compromising the availability of organic amendments (hypothesis II). Dynamic LCA approaches provided comparable results concerning GWP, as estimated through the fate and transport model.

Supplementary Materials

The following supporting information can be downloaded at: https://www.mdpi.com/article/10.3390/en17194819/s1, Figure S1: A Conceptual diagram of the main theme of this research. Figure S2: SOC (kg/ha) reported from long term study. These studies were conducted all over the world. In those studies, the application of organic amendment varies. Max and Minimum values were obtained from varying various parameters given before. Table S1: Values of various parameters used for simulating maximum and minimum SOC depicted in the Figure S2. Table S2: SOC obtained from long term experiments used in this study for model validation.

Author Contributions

R.C.: conceptualization, problem formulations, writing—original draft, and acquiring funding V.A.: programming, visualization, and editing. All authors have read and agreed to the published version of the manuscript.

Funding

This research was partially funded by Science and Engineering Board (SERB), DST(CRG/2021/004486), and the Dept. of Biotechnology, Govt of India (BT/IN/IC-IMPACTS/33/PK/2015-2016).

Data Availability Statement

The original contributions presented in the study are included in the article, further inquiries can be directed to the corresponding authors.

Acknowledgments

Fausto Freire (University of Coimbra, Portugal), Abhishek (IITR), Auroop Ganguly (Northeastern University, USA), Reviewers of this manuscript Kapil Mamtani and Deepak Suyal (former master students, Civil Engineering, IITR) contributed directly or indirectly to enrich the research described in this manuscript.

Conflicts of Interest

The authors declare no conflict of interest.

Abbreviations

Symbol Description Unit
fs Labile fraction in organic amendment fraction
SS Organic amendmentfraction
fp Labile fraction in plant residuefraction
Y yieldton-day−1
SOC Soil organic carbonkg
c1 Carbon content in organic amendmentfraction
c2 Carbon content in plant residuefraction
nc11 Nitrogen to carbon ratio in organic amendmentfraction
nc12 Nitrogen to carbon ratio in plant residuefraction
kd11 Decay rate of labile fraction of organic amendment and plant residue to CO2day−1
kd12 Decay rate of nonlabile fraction of organic amendment and plant residue to CO2Day−1
pc11 Phosphorus to carbon ratio in organic amendmentfraction
pc12 Phosphorus to carbon ratio in plant residuefraction
Porg Organic Phosphoruskg
Norg Organic nitrogenkg
P Inorganic phosphoruskg
N Inorganic nitrogenkg
kgmp conversion rate of organic P to inorganic PDay−1
kgmn conversion rate of organic N to inorganic NDay−1
kdn Denitrification rate of inorganic NDay−1
kln Leaching rate of inorganic NDay−1
klp Leaching rate of inorganic PDay−1
γ Fraction of inorganic N that is nitratefraction
Nu Plant uptake of inorganic nitrogenkg-day−1
Pu Plant uptake of inorganic phosphoruskg-day−1
cy Constant
t Timeday
GWP Global warming potentialKg CO2 eq.
DCF Dynamic global warmingW/m2
Ct Atmospheric decay function of CO2Mass/volume
r Radiative efficiency of greenhouse gasesW/m2

References

  1. IPCC. Summary for Policymakers. In Global Warming of 1.5 °C. An IPCC Special Report on the Impacts of Global Warming of 1.5 °C above Pre-Industrial Levels and Related Global Greenhouse Gas Emission Pathways, in the Context of Strengthening the Global Response to the Threat of Climate Change, Sustainable Development, and Efforts to Eradicate Poverty; IPCC: Geneva, Switzerland, 2018. [Google Scholar]
  2. Van Soest, H.L.; den Elzen, M.G.; van Vuuren, D.P. Net-zero emission targets for major emitting countries consistent with the Paris Agreement. Nat. Commun. 2021, 12, 2140. [Google Scholar] [CrossRef] [PubMed]
  3. Fankhauser, S.; Smith, S.M.; Allen, M.; Axelsson, K.; Hale, T.; Hepburn, C.; Kendall, J.M.; Khosla, R.; Lezaun, J.; Mitchell-Larson, E.; et al. The meaning of net zero and how to get it right. Nat. Clim. Chang. 2022, 12, 15–21. [Google Scholar] [CrossRef]
  4. Anderson, C.M.; DeFries, R.S.; Litterman, R.; Matson, P.A.; Nepstad, D.C.; Pacala, S.; Schlesinger, W.H.; Shaw, M.R.; Smith, P.; Weber, C.; et al. Natural climate solutions are not enough. Science 2019, 363, 933–934. [Google Scholar] [CrossRef] [PubMed]
  5. Beillouin, D.; Corbeels, M.; Demenois, J.; Berre, D.; Boyer, A.; Fallot, A.; Feder, F.; Cardinael, R. A global meta-analysis of soil organic carbon in the Anthropocene. Nat. Commun. 2023, 14, 3700. [Google Scholar] [CrossRef] [PubMed]
  6. DeAngelo, J.; Azevedo, I.; Bistline, J.; Clarke, L.; Luderer, G.; Byers, E.; Davis, S.J. Energy systems in scenarios at net-zero CO2 emissions. Nat. Commun. 2021, 12, 6096. [Google Scholar] [CrossRef]
  7. Buck, H.J.; Carton, W.; Lund, J.F.; Markusson, N. Why residual emissions matter right now. Nat. Clim. Chang. 2023, 13, 351–358. [Google Scholar] [CrossRef]
  8. Matthews, H.D.; Tokarska, K.B.; Nicholls, Z.R.; Rogelj, J.; Canadell, J.G.; Friedlingstein, P.; Frölicher, T.L.; Forster, P.M.; Gillett, N.P.; Ilyina, T.; et al. Opportunities and challenges in using remaining carbon budgets to guide climate policy. Nat. Geosci. 2020, 13, 769–779. [Google Scholar] [CrossRef]
  9. Matthews, H.D.; Zickfeld, K.; Dickau, M.; MacIsaac, A.J.; Mathesius, S.; Nzotungicimpaye, C.M.; Luers, A. Temporary nature-based carbon removal can lower peak warming in a well-below 2 °C scenario. Commun. Earth Environ. 2022, 3, 65. [Google Scholar] [CrossRef]
  10. Jenkins, S.; Cain, M.; Friedlingstein, P.; Gillett, N.; Walsh, T.; Allen, M.R. Quantifying non-CO2 contributions to remaining carbon budgets. NPJ Clim. Atmos. Sci. 2021, 4, 47. [Google Scholar] [CrossRef]
  11. Gentzis, T. Subsurface sequestration of carbon dioxide—An overview from an Alberta (Canada) perspective. Int. J. Coal Geol. 2000, 43, 287–305. [Google Scholar] [CrossRef]
  12. Bossio, D.A.; Cook-Patton, S.C.; Ellis, P.W.; Fargione, J.; Sanderman, J.; Smith, P.; Wood, S.; Zomer, R.J.; von Unger, M.; Emmer, I.M.; et al. The role of soil carbon in natural climate solutions. Nat. Sustain. 2020, 3, 391–398. [Google Scholar] [CrossRef]
  13. Amelung, W.; Bossio, D.; de Vries, W.; Kögel-Knabner, I.; Lehmann, J.; Amundson, R.; Bol, R.; Collins, C.; Lal, R.; Leifeld, J.; et al. Towards a global-scale soil climate mitigation strategy. Nat. Commun. 2020, 11, 5427. [Google Scholar] [CrossRef] [PubMed]
  14. Luo, L.; Wang, J.; Lv, J.; Liu, Z.; Sun, T.; Yang, Y.; Zhu, Y.G. Carbon Sequestration Strategies in Soil Using Biochar: Advances, Challenges, and Opportunities. Environ. Sci. Technol. 2023, 57, 11357–11372. [Google Scholar] [CrossRef] [PubMed]
  15. Goulding, K.; Jarvis, S.; Whitmore, A. Optimizing nutrient management for farm systems. Philos. Trans. R. Soc. B Biol. Sci. 2008, 363, 667–680. [Google Scholar] [CrossRef]
  16. Kowalska, A.; Grobelak, A.; Almås, Å.R.; Singh, B.R. Effect of biowastes on soil remediation, plant productivity and soil organic carbon sequestration: A review. Energies 2020, 13, 5813. [Google Scholar] [CrossRef]
  17. Lho, A.; Parker, D.; Zilberman, D. Optimal Regional Regulation of Animal Waste. In Modeling, Dynamics, Optimization and Bioeconomics III: DGS IV, Madrid, Spain, June 2016, and Bioeconomy VIII, Berkeley, USA, April 2015–Selected Contributions IV; Springer International Publishing: Berlin/Heidelberg, Germany, 2018; pp. 1–23. [Google Scholar]
  18. Dahiya, S.; Chowdhury, R.; Kumar, P.; Ghosh, S.; Srinivasan, A. Recovery of Sugar and Nutrients from Algae and Colocasia esculenta (Taro) Leaves Using Chemical Hydrolysis. Sustainability 2022, 14, 16383. [Google Scholar] [CrossRef]
  19. Wang, L.; Min, M.; Li, Y.; Chen, P.; Chen, Y.; Liu, Y.; Wang, Y.; Ruan, R. Cultivation of green algae Chlorella sp. in different wastewaters from municipal wastewater treatment plant. Appl. Biochem. Biotechnol. 2010, 162, 1174–1186. [Google Scholar] [CrossRef]
  20. Abreu, A.P.; Fernandes, B.; Vicente, A.A.; Teixeira, J.; Dragone, G. Mixotrophic cultivation of Chlorella vulgaris using industrial dairy waste as organic carbon source. Bioresour. Technol. 2012, 118, 61–66. [Google Scholar] [CrossRef]
  21. Rani, S.; Chowdhury, R.; Tao, W.; Nedbalová, L. Microalga-Mediated Tertiary Treatment of Municipal Wastewater: Removal of Nutrients and Pathogens. Sustainability 2021, 13, 9554. [Google Scholar] [CrossRef]
  22. Chowdhury, R.; Freire, F. Bioenergy production from algae using dairy manure as a nutrient source: Life cycle energy and greenhouse gas emission analysis. Appl. Energy 2015, 154, 1112–1121. [Google Scholar] [CrossRef]
  23. Masto, R.E.; Chhonkar, P.K.; Singh, D.; Patra, A.K. Changes in soil biological and biochemical characteristics in a long-term field trial on a sub-tropical inceptisol. Soil Biol. Biochem. 2006, 38, 1577–1582. [Google Scholar] [CrossRef]
  24. He, Y.T.; Zhang, W.J.; Xu, M.G.; Tong, X.G.; Sun, F.X.; Wang, J.Z.; Huang, S.M.; Zhu, P.; He, X.H. Long-term combined chemical and manure fertilizations increase soil organic carbon and total nitrogen in aggregate fractions at three typical cropland soils in China. Sci. Total Environ. 2015, 532, 635–644. [Google Scholar] [CrossRef] [PubMed]
  25. Zhang, F.; Zhang, W.; Li, M.; Zhang, Y.; Li, F.; Li, C. Is crop biomass and soil carbon storage sustainable with long-term application of full plastic film mulching under future climate change? Agric. Syst. 2017, 150, 67–77. [Google Scholar] [CrossRef]
  26. Wang, G.; Luo, Z. Organic Amendments Alter Long-Term Turnover and Stability of Soil Carbon: Perspectives from a Data-Model Integration. Agronomy 2021, 11, 2134. [Google Scholar] [CrossRef]
  27. Tripathi, R.; Nayak, A.K.; Bhattacharyya, P.; Shukla, A.K.; Shahid, M.; Raja, R.; Panda, B.B.; Mohanty, S.; Kumar, A.; Thilagam, V.K. Soil aggregation and distribution of carbon and nitrogen in different fractions after 41 years long-term fertilizer experiment in tropical rice–rice system. Geoderma 2014, 213, 280–286. [Google Scholar] [CrossRef]
  28. Mandal, B.; Majumder, B.; Bandyopadhyay, P.K.; Hazra, G.C.; Gangopadhyay, A.; Samantaray, R.N.; Mishra, A.K.; Chaudhury, J.; Saha, M.N.; Kundu, S. The potential of cropping systems and soil amendments for carbon sequestration in soils under long-term experiments in subtropical India. Glob. Chang. Biol. 2007, 13, 357–369. [Google Scholar] [CrossRef]
  29. Yang, J.; Gao, W.; Ren, S. Long-term effects of combined application of chemical nitrogen with organic materials on crop yields, soil organic carbon and total nitrogen in fluvo-aquic soil. Soil Tillage Res. 2015, 151, 67–74. [Google Scholar] [CrossRef]
  30. Mandal, A.; Majumder, A.; Dhaliwal, S.S.; Toor, A.S.; Mani, P.K.; Naresh, R.K.; Gupta, R.K.; Mitran, T. Impact of agricultural management practices on soil carbon sequestration and its monitoring through simulation models and remote sensing techniques: A review. Crit. Rev. Environ. Sci. Technol. 2022, 52, 1–49. [Google Scholar] [CrossRef]
  31. Jiang, Z.; Yin, S.; Zhang, X.; Li, C.; Shen, G.; Zhou, P.; Liu, C. Research and Development of a DNDC Online Model for Farmland Carbon Sequestration and GHG Emissions Mitigation in China. Int. J. Environ. Res. Public Health 2017, 14, 1493. [Google Scholar] [CrossRef]
  32. Jensen, L.; Mueller, T.; Nielsen, N.; Hansen, S.; Crocker, G.; Grace, P.; Klír, J.; Körschens, M.; Poulton, P. Simulating trends in soil organic carbon in long-term experiments using the soil-plant-atmosphere model DAISY. Geoderma 1997, 81, 5–28. [Google Scholar] [CrossRef]
  33. Coleman, K.; Jenkinson, D.; Crocker, G.; Grace, P.; Klír, J.; Körschens, M.; Poulton, P.; Richter, D. Simulating trends in soil organic carbon in long-term experiments using RothC-26.3. Geoderma 1997, 81, 29–44. [Google Scholar] [CrossRef]
  34. Bhattacharyya, T.; Pal, D.K.; Ray, S.K.; Chandran, P.; Mandal, C.; Telpande, B.; Deshmukh, A.S.; Tiwary, P. Simulating change in soil organic carbon in two long term fertilizer experiments in India: With the RothC model. Clim. Chang. Environ. Sustain. 2013, 1, 104–117. [Google Scholar] [CrossRef]
  35. Farina, R.; Testani, E.; Campanelli, G.; Leteo, F.; Napoli, R.; Canali, S.; Tittarelli, F. Potential carbon sequestration in a Mediterranean organic vegetable cropping system. A model approach for evaluating the effects of compost and Agro-ecological Service Crops (ASCs). Agric. Syst. 2018, 162, 239–248. [Google Scholar] [CrossRef]
  36. Mishra, G.; Jangir, A.; Francaviglia, R. Modeling soil organic carbon dynamics under shifting cultivation and forests using Rothc model. Ecol. Model. 2019, 396, 33–41. [Google Scholar] [CrossRef]
  37. Mohanty, M.; Sinha, N.K.; Somasundaram, J.; McDermid, S.S.; Patra, A.K.; Singh, M.; Dwivedi, A.K.; Reddy, K.S.; Rao, C.S.; Prabhakar, M.; et al. Soil carbon sequestration potential in a Vertisol in central India-results from a 43-year long-term experiment and APSIM modeling. Agric. Syst. 2020, 184, 102906. [Google Scholar] [CrossRef]
  38. Luo, Z.; Wang, E.; Sun, O.J.; Smith, C.J.; Probert, M.E. Modeling long-term soil carbon dynamics and sequestration potential in semi-arid agro-ecosystems. Agric. For. Meteorol. 2011, 151, 1529–1544. [Google Scholar] [CrossRef]
  39. Yin, J.; Zhao, L.; Xu, X.; Li, D.; Qiu, H.; Cao, X. Evaluation of long-term carbon sequestration of biochar in soil with biogeochemical field model. Sci. Total Environ. 2022, 822, 153576. [Google Scholar] [CrossRef]
  40. Yoshida, H.; Nielsen, M.P.; Scheutz, C.; Jensen, L.S.; Christensen, T.H.; Nielsen, S.; Bruun, S. Effects of sewage sludge stabilization on fertilizer value and greenhouse gas emissions after soil application. Acta Agric. Scand. Sect. B Soil Plant Sci. 2015, 65, 506–516. [Google Scholar] [CrossRef]
  41. Li, L.L.; Li, S.T. Nitrogen mineralization from animal manures and its relation to organic N fractions. J. Integr. Agric. 2014, 13, 2040–2048. [Google Scholar] [CrossRef]
  42. Oehl, F.; Frossard, E.; Fliessbach, A.; Dubois, D.; Oberson, A. Basal organic phosphorus mineralization in soils under different farming systems. Soil Biol. Biochem. 2004, 36, 667–675. [Google Scholar] [CrossRef]
  43. Barton, L.; McLay, C.D.A.; Schipper, L.A.; Smith, C.T. Annual denitrification rates in agricultural and forest soils: A review. Soil Res. 1999, 37, 1073–1094. [Google Scholar] [CrossRef]
  44. Cooke, C.M.; Gove, L.; Nicholson, F.A.; Cook, H.F.; Beck, A.J. Effect of drying and composting biosolids on the movement of nitrate and phosphate through repacked soil columns under steady-state hydrological conditions. Chemosphere 2001, 44, 797–804. [Google Scholar] [CrossRef] [PubMed]
  45. Mendoza, C.; Assadian, N.W.; Lindemann, W. The fate of nitrogen in a moderately alkaline and calcareous soil amended with biosolids and urea. Chemosphere 2006, 63, 1933–1941. [Google Scholar] [CrossRef]
  46. Kidd, P.S.; Domínguez-Rodríguez, M.J.; Díez, J.; Monterroso, C. Bioavailability and plant accumulation of heavy metals and phosphorus in agricultural soils amended by long-term application of sewage sludge. Chemosphere 2007, 66, 1458–1467. [Google Scholar] [CrossRef] [PubMed]
  47. Masscheleyn, P.H.; DeLaune, R.D.; Patrick, W.H., Jr. Methane and nitrous oxide emissions from laboratory measurements of rice soil suspension: Effect of soil oxidation-reduction status. Chemosphere 1993, 26, 251–260. [Google Scholar] [CrossRef]
  48. Kralova, M.; Masscheleyn, P.H.; Lindau, C.W.; Patrick, W.H. Production of dinitrogen and nitrous oxide in soil suspensions as affected by redox potential. Water Air Soil Pollut. 1992, 61, 37–45. [Google Scholar] [CrossRef]
  49. Lee, J.-M.; Park, D.-G.; Kang, S.-S.; Choi, E.-J.; Gwon, H.-S.; Lee, H.-S.; Lee, S.-I. Short-Term Effect of Biochar on Soil Organic Carbon Improvement and Nitrous Oxide Emission Reduction According to Different Soil Characteristics in Agricultural Land: A Laboratory Experiment. Agronomy 2022, 12, 1879. [Google Scholar] [CrossRef]
  50. Yuan, Y.; Dai, X.; Wang, H.; Xu, M.; Fu, X.; Yang, F. Effects of land-use conversion from double rice cropping to vegetables on methane and nitrous oxide fluxes in southern China. PLoS ONE 2016, 11, e0155926. [Google Scholar] [CrossRef]
  51. Akiyama, H.; Yan, X.; Yagi, K. Evaluation of effectiveness of enhanced-efficiency fertilizers as mitigation options for N2O and NO emissions from agricultural soils: Meta-analysis. Glob. Chang. Biol. 2010, 16, 1837–1846. [Google Scholar] [CrossRef]
  52. Henault, C.; Devis, X.; Page, S.; Justes, E.; Reau, R.; Germon, J.C. Nitrous oxide emissions under different soil and land management conditions. Biol. Fertil. Soils 1998, 26, 199–207. [Google Scholar] [CrossRef]
  53. Jørgensen, K.; Jensen, L.S. Chemical and biochemical variation in animal manure solids separated using different commercial separation technologies. Bioresour. Technol. 2009, 100, 3088–3096. [Google Scholar] [CrossRef] [PubMed]
  54. Lage, S.; Gentili, F.G. Chemical composition and species identification of microalgal biomass grown at pilot-scale with municipal wastewater and CO2 from flue gases. Chemosphere 2023, 313, 137344. [Google Scholar] [CrossRef] [PubMed]
  55. Krull, E.S.; Baldock, J.A.; Skjemstad, J.O.; Smernik, R.J. Characteristics of biochar: Organo-chemical properties. In Biochar for Environmental Management; Routledge: Oxfordshire, UK, 2009; pp. 53–63. [Google Scholar]
  56. Chowdhury, R.; Sadhukhan, J.; Traverso, M.; Keen, P.L. Effects of residence time on life cycle assessment of bioenergy production from dairy manure. Bioresour. Technol. Rep. 2018, 4, 57–65. [Google Scholar] [CrossRef]
  57. Chowdhury, R.; Caetano, N.; Franchetti, M.J.; Hariprasad, K. Life Cycle Based GHG Emissions from Algae Based Bioenergy with a Special Emphasis on Climate Change Indicators and Their Uses in Dynamic LCA: A Review. Sustainability 2023, 15, 1767. [Google Scholar] [CrossRef]
  58. Chowdhury, R.; Franchetti, M. Life cycle energy demand from algal biofuel generated from nutrients present in the dairy waste. Sustain. Prod. Consum. 2017, 9, 22–27. [Google Scholar] [CrossRef]
  59. Jeudy-Hugo, S.; Re, L.L.; Falduto, C. Understanding countries’ net-zero emissions targets. In OECD/IEA Climate Change Expert Group Papers; OECD: Paris, France, 2021. [Google Scholar]
  60. Shukla, P.R.; Skea, J.; Reisinger, A. (Eds.) Climate Change 2022: Mitigation of Climate Change: Working Group III Contribution to the Sixth Assessment Report of the Intergovernmental Panel on Climate Change; WMO, IPCC Secretariat: Geneva, Switzerland, 2022. [Google Scholar]
  61. Den Elzen, M.G.; Dafnomilis, I.; Forsell, N.; Fragkos, P.; Fragkiadakis, K.; Höhne, N.; Kuramochi, T.; Nascimento, L.; Roelfsema, M.; van Soest, H.; et al. Updated nationally determined contributions collectively raise ambition levels but need strengthening further to keep Paris goals within reach. Mitig. Adapt. Strateg. Glob. Chang. 2022, 27, 33. [Google Scholar] [CrossRef]
  62. Choe, C.; Cheon, S.; Kim, H.; Lim, H. Mitigating climate change for negative CO2 emission via syngas methanation: Techno-economic and life-cycle assessments of renewable methane production. Renew. Sustain. Energy Rev. 2023, 185, 113628. [Google Scholar] [CrossRef]
  63. Creutzig, F.; Ravindranath, N.H.; Berndes, G.; Bolwig, S.; Bright, R.; Cherubini, F.; Chum, H.; Corbera, E.; Delucchi, M.; Faaij, A.; et al. Bioenergy and climate change mitigation: An assessment. GCB Bioenergy 2015, 7, 916–944. [Google Scholar] [CrossRef]
  64. Zuiderveen, E.A.R.; Kuipers, K.J.J.; Caldeira, C.; Hanssen, S.V.; van der Hulst, M.K.; de Jonge, M.M.J.; Vlysidis, A.; van Zelm, R.; Sala, S.; Huijbregts, M.A.J. The potential of emerging bio-based products to reduce environmental impacts. Nat. Commun. 2023, 14, 8521. [Google Scholar] [CrossRef]
  65. Nie, Y.; Bi, X. Life-cycle assessment of transportation biofuels from hydrothermal liquefaction of forest residues in British Columbia. Biotechnol. Biofuels 2018, 11, 23. [Google Scholar] [CrossRef]
  66. Tu, Q.; McDonnell, B.E. Monte Carlo analysis of life cycle energy consumption and greenhouse gas (GHG) emission for biodiesel production from trap grease. J. Clean. Prod. 2016, 112, 2674–2683. [Google Scholar] [CrossRef]
  67. Dixon, J.; Bell, K.; Brush, S. Which way to net zero? A comparative analysis of seven UK 2050 decarbonisation pathways. Renew. Sustain. Energy Transit. 2022, 2, 100016. [Google Scholar] [CrossRef]
  68. Anika, O.C.; Nnabuife, S.G.; Bello, A.; Okoroafor, R.E.; Kuang, B.; Villa, R. Prospects of low and zero-carbon renewable fuels in 1.5-degree net zero emission actualisation by 2050: A critical review. Carbon Capture Sci. Technol. 2022, 5, 100072. [Google Scholar] [CrossRef]
  69. Azevedo, I.; Bataille, C.; Bistline, J.; Clarke, L.; Davis, S. Net-zero emissions energy systems: What we know and do not know. Energy Clim. Chang. 2021, 2, 100049. [Google Scholar] [CrossRef]
  70. Sproul, E.; Barlow, J.; Quinn, J.C. Time-resolved cost analysis of natural gas power plant conversion to bioenergy with carbon capture and storage to support net-zero emissions. Environ. Sci. Technol. 2020, 54, 15338–15346. [Google Scholar] [CrossRef]
  71. Solomon, A.A.; Bogdanov, D.; Breyer, C. Solar driven net zero emission electricity supply with negligible carbon cost: Israel as a case study for Sun Belt countries. Energy 2018, 155, 87–104. [Google Scholar] [CrossRef]
  72. Rogelj, J.; Den Elzen, M.; Höhne, N.; Fransen, T.; Fekete, H.; Winkler, H.; Schaeffer, R.; Sha, F.; Riahi, K.; Meinshausen, M. Paris Agreement climate proposals need a boost to keep warming well below 2 C. Nature 2016, 534, 631–639. [Google Scholar] [CrossRef]
  73. Hafner, S.; Jones, A.; Anger-Kraavi, A. Economic impacts of achieving a net-zero emissions target in the power sector. J. Clean. Prod. 2021, 312, 127610. [Google Scholar] [CrossRef]
  74. Zomer, R.J.; Bossio, D.A.; Sommer, R.; Verchot, L.V. Global sequestration potential of increased organic carbon in cropland soils. Sci. Rep. 2017, 7, 15554. [Google Scholar] [CrossRef]
  75. Hemmat, A.; Aghilinategh, N.; Rezainejad, Y.; Sadeghi, M. Long-term impacts of municipal solid waste compost, sewage sludge and farmyard manure application on organic carbon, bulk density and consistency limits of a calcareous soil in central Iran. Soil Tillage Res. 2010, 108, 43–50. [Google Scholar] [CrossRef]
  76. Smith, P.; Powlson, D.; Glendining, M.; Smith, J.O. Potential for carbon sequestration in European soils: Preliminary estimates for five scenarios using results from long-term experiments. Glob. Chang. Biol. 1997, 3, 67–79. [Google Scholar] [CrossRef]
  77. Minasny, B.; Malone, B.P.; McBratney, A.B.; Angers, D.A.; Arrouays, D.; Chambers, A.; Chaplot, V.; Chen, Z.-S.; Cheng, K.; Das, B.S.; et al. Soil carbon 4 per mille. Geoderma 2017, 292, 59–86. [Google Scholar] [CrossRef]
  78. Lu, F.E.I.; Wang, X.; Han, B.; Ouyang, Z.; Duan, X.; Zheng, H.U.A.; Miao, H. Soil carbon sequestrations by nitrogen fertilizer application, straw return and no-tillage in China’s cropland. Glob. Chang. Biol. 2009, 15, 281–305. [Google Scholar] [CrossRef]
  79. Fuhrman, J.; Bergero, C.; Weber, M.; Monteith, S.; Wang, F.M.; Clarens, A.F.; Doney, S.C.; Shobe, W.; McJeon, H. Diverse carbon dioxide removal approaches could reduce impacts on the energy–water–land system. Nat. Clim. Chang. 2023, 13, 341–350. [Google Scholar] [CrossRef]
  80. Chen, S.; Arrouays, D.; Angers, D.A.; Chenu, C.; Barré, P.; Martin, M.P.; Saby, N.P.; Walter, C. National estimation of soil organic carbon storage potential for arable soils: A data-driven approach coupled with carbon-landscape zones. Sci. Total Environ. 2019, 666, 355–367. [Google Scholar] [CrossRef]
  81. GHG Emissions of All World Countries. Available online: https://edgar.jrc.ec.europa.eu/report_2021#emissions_table (accessed on 24 August 2023).
  82. Which Countries Have a Net Zero Carbon Goal? Available online: https://www.climatechangenews.com/2019/06/14/countries-net-zero-climate-goal/ (accessed on 24 August 2023).
  83. Available online: https://unstats.un.org/unsd/environment/agriculturalland.htm (accessed on 24 August 2023).
  84. Cuiping, L.; Chuangzhi, W.; Haitao, H. Study on the distribution and quantity of biomass residues resource in China. Biomass Bioenergy 2004, 27, 111–117. [Google Scholar] [CrossRef]
  85. Gronowska, M.; Joshi, S.; MacLeana, H.L. A review of US and Canadian biomass supply studies. BioResources 2009, 4, 341–369. [Google Scholar] [CrossRef]
  86. Farms and Farmland in the European Union—Statistics. Available online: https://ec.europa.eu/eurostat/statistics-explained/index.php?title=Farms_and_farmland_in_the_European_Union_-_statistics (accessed on 28 August 2023).
  87. Esteban, L.S.; Carrasco, J.E. Biomass resources and costs: Assessment in different EU countries. Biomass Bioenergy 2011, 35, S21–S30. [Google Scholar] [CrossRef]
  88. Kumar, A.; Kumar, N.; Baredar, P.; Shukla, A. A review on biomass energy resources, potential, conversion and policy in India. Renew. Sustain. Energy Rev. 2015, 45, 530–539. [Google Scholar] [CrossRef]
  89. Available online: https://climateactiontracker.org/countries/russian-federation/ (accessed on 24 August 2023).
  90. Namsaraev, Z.B.; Gotovtsev, P.M.; Komova, A.V.; Vasilov, R.G. Current status and potential of bioenergy in the Russian Federation. Renew. Sustain. Energy Rev. 2018, 81, 625–634. [Google Scholar] [CrossRef]
  91. Race to Net Zero: Carbon Neutral Goals by Country. Available online: https://www.visualcapitalist.com/sp/race-to-net-zero-carbon-neutral-goals-by-country/ (accessed on 27 August 2023).
  92. Ferreira, L.R.A.; Otto, R.B.; Silva, F.P.; De Souza, S.N.M.; De Souza, S.S.; Junior, O.A. Review of the energy potential of the residual biomass for the distributed generation in Brazil. Renew. Sustain. Energy Rev. 2018, 94, 440–455. [Google Scholar] [CrossRef]
  93. An Energy Sector Roadmap to Net Zero Emissions in Indonesia. Available online: https://www.iea.org/reports/an-energy-sector-roadmap-to-net-zero-emissions-in-indonesia (accessed on 27 August 2023).
  94. Lozano-García, D.F.; Santibañez-Aguilar, J.E.; Lozano, F.J.; Flores-Tlacuahuac, A. GIS-based modeling of residual biomass availability for energy production in Mexico. Renew. Sustain. Energy Rev. 2020, 120, 109610. [Google Scholar] [CrossRef]
  95. Available online: https://climateactiontracker.org/countries/saudi-arabia/ (accessed on 27 August 2023).
  96. Available online: https://www.oecd.org/regional/RO2021%20Poland.pdf (accessed on 27 August 2023).
  97. Available online: https://climateactiontracker.org/countries/argentina/net-zero-targets/ (accessed on 27 August 2023).
  98. Available online: https://www.wwf.org.my/our_work/climate_change/towards_net_zero_emissions_by_2050/ (accessed on 11 September 2023).
  99. Levasseur, A.; Lesage, P.; Margni, M.; Deschênes, L.; Samson, R. Considering time in LCA: dynamic LCA and its application to global warming impact assessments. Environ. Sci. Technol. 2010, 44, 3169–3174. [Google Scholar] [CrossRef] [PubMed]
  100. Lan, K.; Yao, Y. Dynamic life cycle assessment of energy technologies under different greenhouse gas concentration pathways. Environ. Sci. Technol. 2021, 56, 1395–1404. [Google Scholar] [CrossRef]
  101. Matthews, H.D.; Zickfeld, K.; Koch, A.; Luers, A. Accounting for the climate benefit of temporary carbon storage in nature. Nat. Commun. 2023, 14, 5485. [Google Scholar] [CrossRef]
  102. Sharma, B.; Kumar, J.; Ganguly, A.R.; Hoffman, F.M. Carbon cycle extremes accelerate weakening of the land carbon sink in the late 21st century. Biogeosciences 2023, 20, 1829–1841. [Google Scholar] [CrossRef]
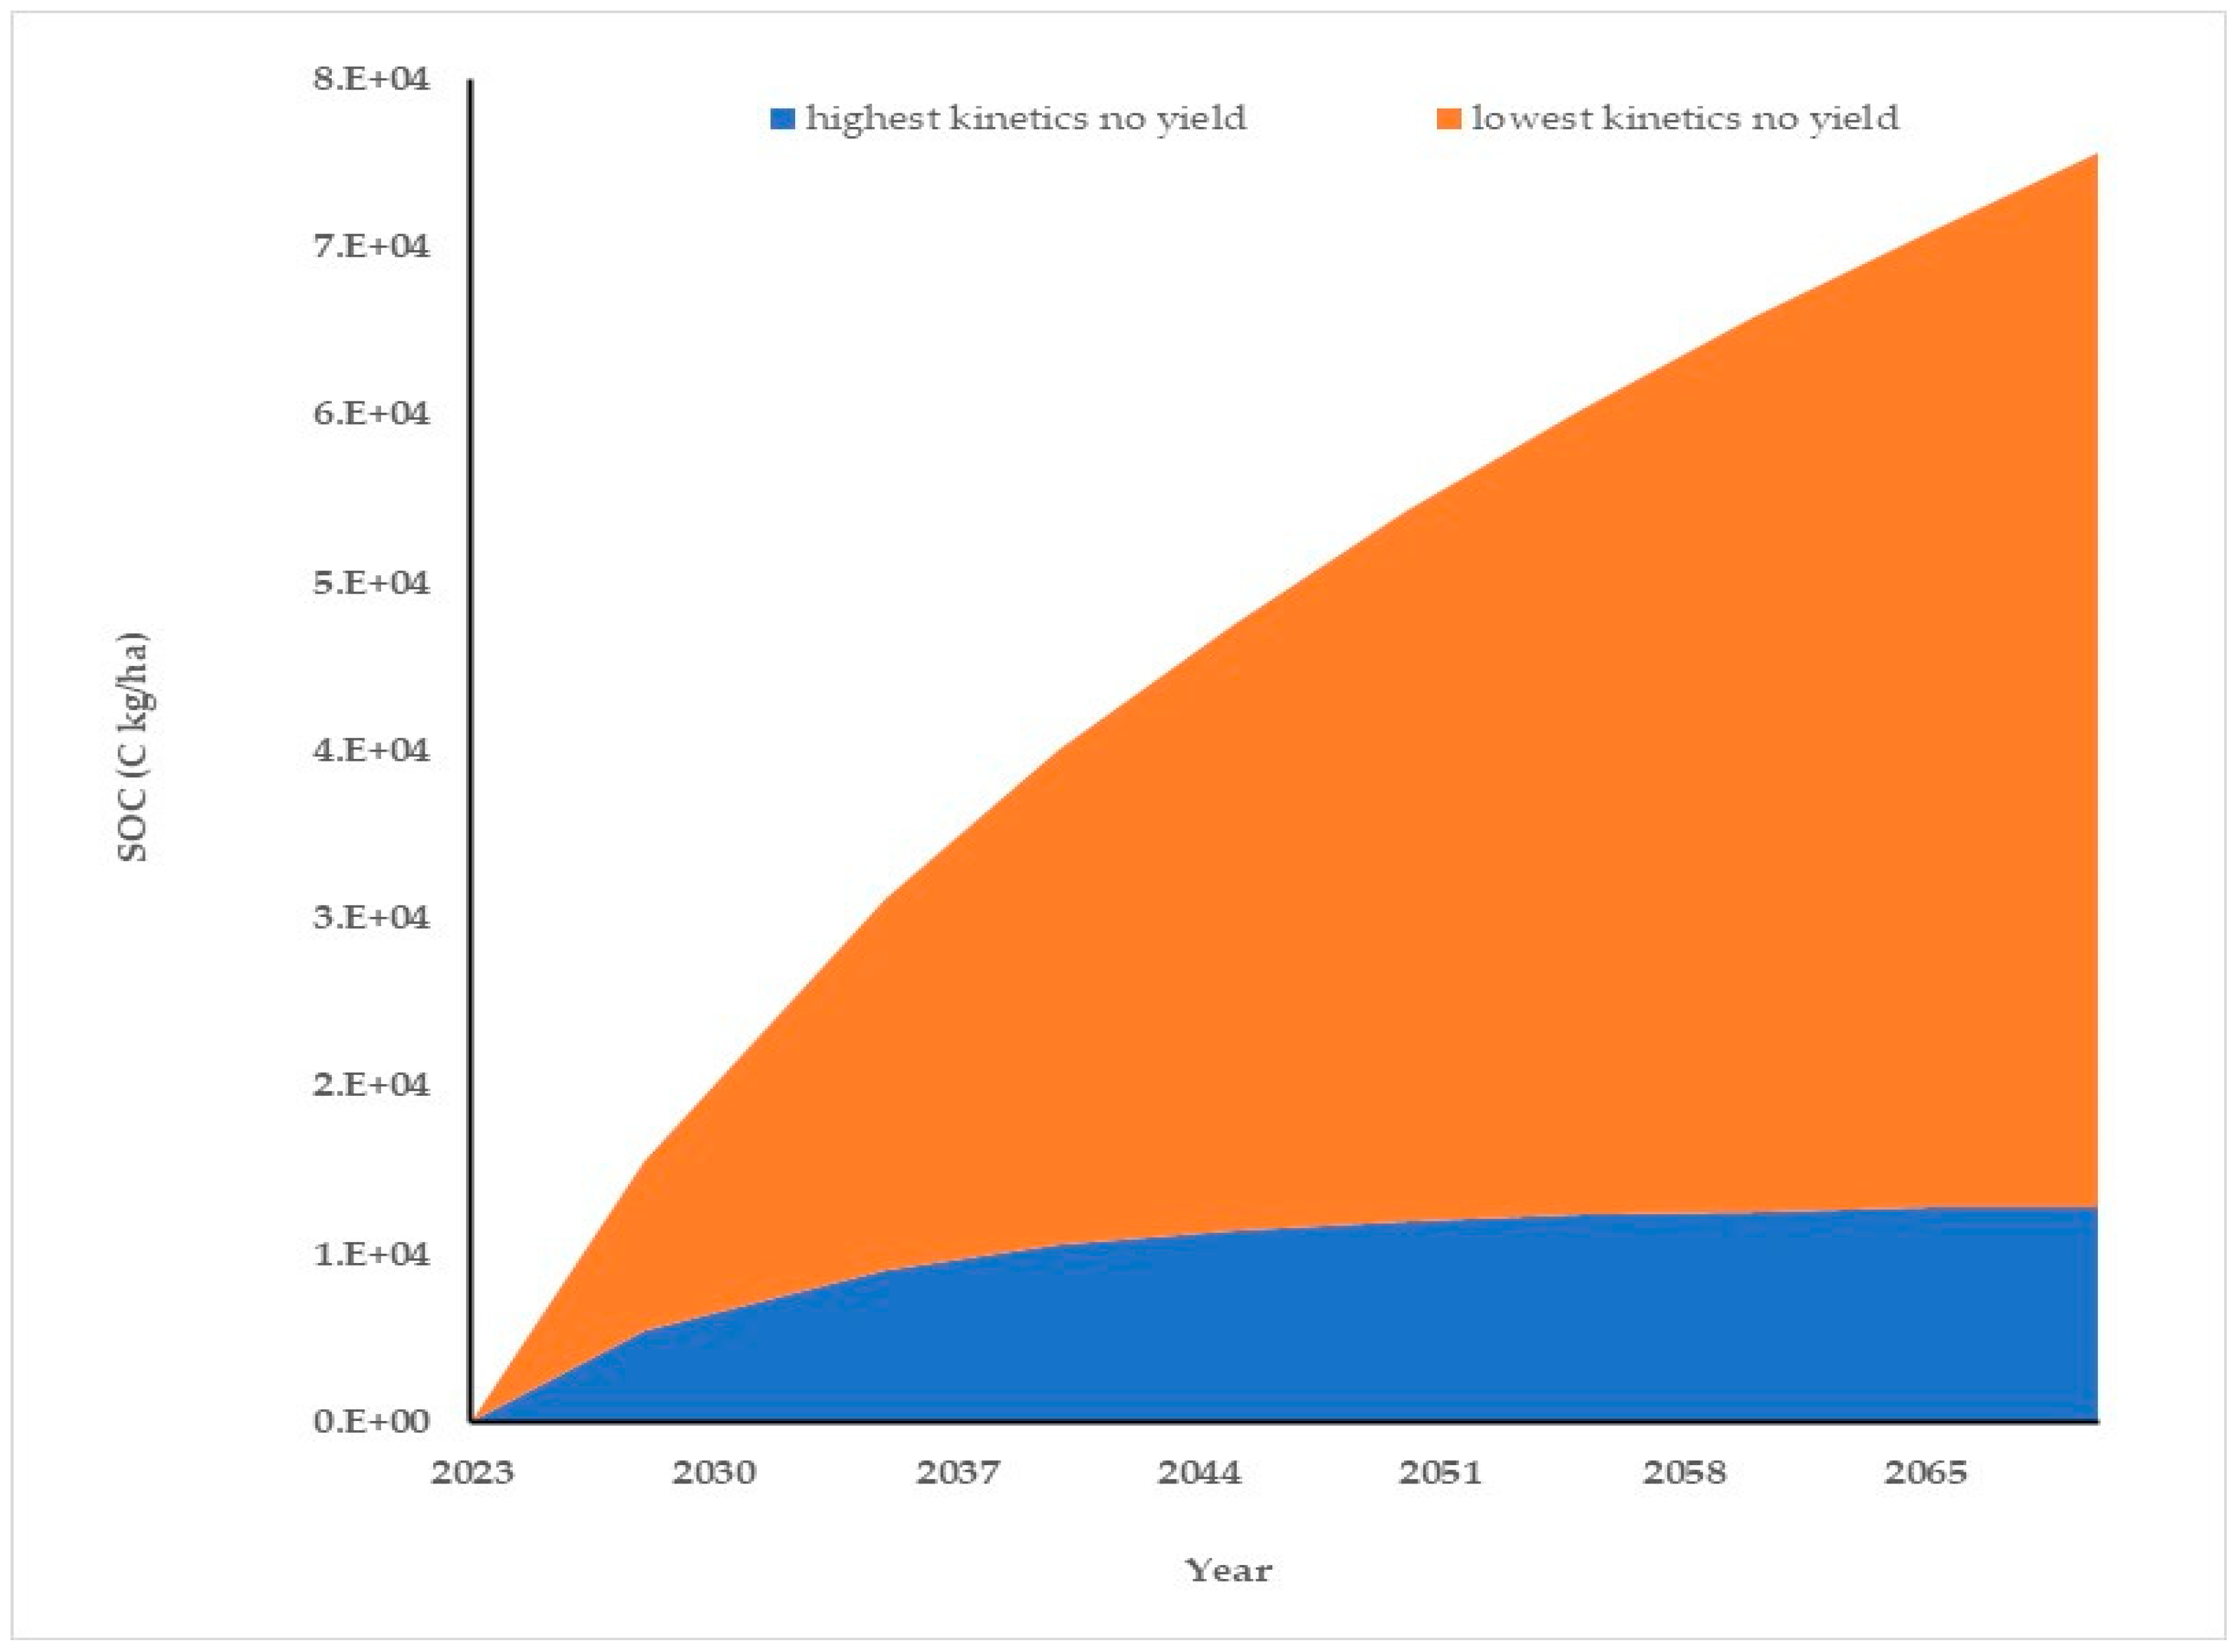
Figure 1. Carbon remaining on land at different years due to the application of biomass residue (11.9 kg/ha/day). Simulation time 2023–2070.
Energies 17 04819 g001
Figure 2. Carbon remaining on land due to biomass residue application and plant debris remaining on the land. Simulation time (2023–2070).
Energies 17 04819 g002
Figure 3. Carbon build-up on land from plant debris; 0.1–0.3 of the yield was assumed to end up on the land.
Energies 17 04819 g003
Figure 4. Dynamic GWP estimated through various models and SOC estimated through the mathematical model (Equations (1)–(8)) [99,100].
Energies 17 04819 g004
Figure 5. Carbon added in the reference scenario and from the biorefinery.
Energies 17 04819 g005
Figure 6. Nitrogen added on land or utilized in the reference and biorefinery scenario.
Energies 17 04819 g006
Figure 7. Phosphorus added on land or utilized in the reference and biorefinery scenario.
Energies 17 04819 g007
Disclaimer/Publisher’s Note: The statements, opinions and data contained in all publications are solely those of the individual author(s) and contributor(s) and not of MDPI and/or the editor(s). MDPI and/or the editor(s) disclaim responsibility for any injury to people or property resulting from any ideas, methods, instructions or products referred to in the content.