Article

Considering Differentiated Pricing Mechanisms for Multiple Power Levels

1
Sichuan Energy Internet Research Institute, Tsinghua Universitiy, Chengdu 610213, China
2
State Grid Tianjin Electric Power Company, Electric Power Research Institute, Tianjin 300454, China
*
Author to whom correspondence should be addressed.
Energies 2024, 17(19), 4771; https://doi.org/10.3390/en17194771
Submission received: 23 July 2024 / Revised: 9 September 2024 / Accepted: 12 September 2024 / Published: 24 September 2024
(This article belongs to the Section E: Electric Vehicles)

Abstract

:
With the development of supercharging technology, charging stations will face supercharging piles and fast-charging piles coexisting for a long time. The traditional unified service fee pricing model will face the problem of slow-charging vehicles occupying supercharging piles, and the advantages of supercharging facilities cannot be fully utilized. Considering factors such as station revenue, station utilization rate, and user willingness, this paper constructs a differentiated pricing model for multi-power-level charging facilities based on capacity and electricity service fees. It reveals the impact of this pricing model on the economy and user satisfaction of charging stations. In addition, a multi-objective optimization model is constructed and solved by a multi-objective particle swarm method to determine the pricing strategy of different power levels that adapt to the actual situation. The results show that the differentiated pricing mechanism can increase the station revenue by about 10.74% and the station stack power utilization rate by about 7.14%, and user satisfaction is higher, which is better than the conventional pricing mechanism. Therefore, the proposed charging pricing strategy can provide a decision-making reference for charging station operation and planning.

1. Introduction

With the vigorous development of China’s new energy vehicle industry, the construction of charging infrastructure has become the focus of attention. Among them, the “supercharging” mode, represented by DC fast-charging technology, provides users with a convenient charging experience due to its efficient and fast charging speed, and has become one of the important development directions of the global new energy vehicle industry. From a policy perspective, in January 2024, the Shenzhen Municipal Market Supervision Administration issued local standards such as the “Evaluation Specifications for the Grading of Electric Vehicle Supercharging Equipment” and formulated the rated power of a charger at the supercharging terminal of supercharging equipment to be no less than 480 kW, and the rated power of a single charger at the fast-charging terminal to be no less than 120 kW. From the perspective of urban construction, in September 2022, the “Three-Year Action Plan for Accelerating the Construction of Electric Vehicle Charging Infrastructure in Guangzhou (2022–2024)” proposed that by 2024, a charging and swapping service system of “one fast and one slow, orderly charging” and a “supercharging hub” will be built; and on 30 November 2023, Shenzhen announced its accelerated efforts to build a world-class “Supercharging City,” aiming to provide residents with high-quality, efficient, and convenient charging services. . . From an industry development perspective, Huawei is expected to deliver over 100,000 fully liquid-cooled supercharging devices to the market by the end of 2024 and construct more than 4500 high-speed supercharging stations, with a full configuration of 2 supercharging piles and 10 fast-charging piles per station. On 1 February 2024, more than 330 Ideal Supercharging Stations were put into operation. An Ideal 5C Supercharging Station is equipped with one to two 5C supercharging piles, and some are equipped with 2C supercharging piles for all new energy vehicles. Therefore, in the future, charging stations will face a situation where supercharging piles and fast-charging piles coexist for a long time to meet the changing needs of different types of EVs.
In 2014, the National Development and Reform Commission issued the “Notice on Issues Concerning Electricity Price Policy for Electric Vehicles” (Development and Reform Price [2014] No. 1668), which pointed out that operators shall implement a pricing mechanism for electricity charges and service fees for users, in which the electricity charges shall be implemented by the national electricity price policy, and the charging and swapping service fees can be priced by the market. Therefore, operators can only decide how to collect the service fee.
Domestic and foreign scholars have conducted a lot of research on the pricing of charging service fees. From the perspective of time, references [1,2,3,4] adopted a fixed electricity price strategy, that is, the charging price is the same at all times of the day, and different pricing targets are set according to stakeholders such as the government, users, and charging operators. The final pricing is obtained by solving the problem through methods such as Stackleberg game theory. This strategy has the advantages of stability and simplicity, but it does not distinguish between electricity prices in different electricity consumption periods, and it is difficult to guide users and adapt to market changes. References [5,6,7,8,9,10,11,12,13] adopt a time-of-use pricing strategy. References [5,6,7,8,9,10] divide peak and valley periods based on the grid price, aiming to guide electric vehicle users to charge in an orderly manner and reduce grid load fluctuations. However, this method is quite different from the actual electricity demand of electric vehicles. Actual users are affected by work and life and cannot fully respond. Therefore, the role of dividing peak and valley periods based on grid price is limited. References [11,12,13] divide the load curve of electric vehicle charging power into peak and valley periods. However, if a large number of electric vehicles respond to time-of-use electricity prices, it may cause the load to peak in the flat or valley period. The research results from reference [14] show that the current time-of-use electricity price division may not match the actual load level, resulting in a contradiction between the simultaneous realization of multiple objective functions. References [15,16,17,18] use real-time electricity price strategies to determine electricity prices in a relatively short period, dynamically adjust electricity prices according to grid load conditions, and reflect the relationship between supply and demand. The predicted electricity prices can effectively guide users’ electricity demand and electricity consumption behavior, help the grid to adjust and balance loads, achieve peak load reduction and valley filling, optimize power supply, improve power system efficiency [19], and minimize electricity costs. In addition, some scholars have considered the impact of the spatial dimension based on the time dimension. Charging stations will arrange certain electricity price policies to attract electric vehicles to charge. The electricity price policies will vary from region to region, but the electricity price considered only from the time dimension cannot meet this requirement. References [20,21,22] consider pricing in both time and space dimensions to guide charging more intelligently. The charging price can be optimized based on the user’s location and the load of the power system, reducing the peak power consumption of the power system. At the same time, users are encouraged to choose the most economical charging period based on their location and time to reduce their charging costs. In addition, the comprehensive consideration of regional differences and power demand at different times can more effectively balance the load of the power system and improve the stability of the power system.
Currently, charging stations with various power levels typically employ a uniform service fee pricing strategy. However, there is a paucity of research addressing the differentiated pricing of charging piles with distinct power levels within the same charging station. This lack of differentiation can lead to scenarios where slow-charging vehicles occupy fast-charging piles, thereby diminishing the utilization efficiency of fast-charging stations. Furthermore, when a fast-charging vehicle arrives at a charging station, it may be required to wait or even seek alternative stations to charge, which could, over time, decrease user satisfaction, result in user attrition, and adversely impact the revenue of the charging station. Consequently, it is imperative to develop and implement a reasonable and flexible service fee pricing strategy for charging piles of varying power levels within the same station. Such a strategy would align with the new power system’s grid regulation requirements and enhance the revenue for both users and charging stations. This research is of considerable significance.

2. The Simulation Model for Differentiated Pricing of Multi-Power-Level Charging Facilities

2.1. Differentiated Pricing Model Framework

Considering the impact of different charging power levels, charging service prices, and charging times on users’ charging decision-making behavior, the differentiated pricing model framework proposed in this article is shown in Figure 1. The model primarily comprises a differentiated pricing mechanism, a user decision model, and a multi-objective optimization model. The differentiated pricing mechanism categorizes the power levels of charging piles and designs the composition of different power levels. Based on this, a user decision model is established to segment users, calculate user satisfaction, and obtain user decision results. This model determines station revenue, station battery power utilization rate, and average user satisfaction. Ultimately, the objective is to maximize these three metrics by optimizing the pricing of charging service fees, thereby guiding users’ charging behavior and improving station utilization.

2.2. Differentiated Pricing Mechanism

In 2014, the National Development and Reform Commission issued the “Notice on Issues Concerning Electric Vehicle Electricity Price Policy” (Development and Reform Price (2014) No. 1668), which pointed out that charging and swapping facility operators can charge electric vehicle users two fees: electricity fees and charging and swapping service fees. Among them, electricity fees are subject to the national electricity price policy, while charging service fees can be priced by the market, so charging facility operators can only decide the charging service fee. The differentiated pricing mechanism referred to in this article mainly divides the service fee into two parts: capacity service fee and electricity service fee. The price composition of the traditional pricing mechanism and the differentiated pricing mechanism is shown in Table 1.
In this table, M represents the electricity price stipulated by the state, N is the service fee set by the operator, R is the capacity service fee, and D is the electricity service fee.

2.2.1. Capacity Service Fee

The capacity service fee can be applied to charging piles of different power levels and is set based on the maximum power of the charging facilities within the station. This fee ensures the efficient use of resources and compensates for the costs associated with high-capacity facilities. Among them, the supercharging pile is R c c and the fast-charging pile is R p t .
R c c = α T c 60 P 2 C b , t
R p t = 0
where α denotes the weight ( α ∈[0,1]), P 2 denotes the charging power of the supercharger, C b , t denotes the electricity service unit value parameter, and T c denotes the time (in minutes) taken by the user to complete the entire charging process.

2.2.2. Electricity Service Fee

The electricity service fee is typically calculated based on the actual amount of electricity consumed during the charging process, with the value parameter of the electricity service unit for supercharging piles being D c c , and that of the electricity service unit for ordinary piles being D p t .
D c c = 1 α T c 60 P C b , t
D p t = T c 60 P C b , t
where P is the charging power supported by the user when charging at the current charging pile.

2.3. User Decision Model

2.3.1. User Classification Based on Charging Preference

The weighting of factors considered by different users in their charging decisions varies. Some users may pay more attention to charging prices, while others may pay more attention to time costs and other aspects. In order to deeply analyze the impact of different users’ charging preferences on the final guidance effect, it is necessary to classify them based on their charging selection habits and charging concerns. This paper selects charging price and charging time cost as two factors of user charging preferences for classification. Given that users have different sensitivities to charging prices and time costs, this article preliminarily divides users into three categories. The user classification is shown in Figure 2.
  • Price-sensitive
Price-sensitive users mainly consider saving charging costs. They are more sensitive to charging prices, but less sensitive to time costs. When faced with multiple factors, this type of user pays more attention to maximizing economic benefits.
  • Time-sensitive
Time-sensitive users mostly focus on maximizing time savings in their charging decisions. They are more sensitive to time costs and less sensitive to economic costs. In the comprehensive consideration of multiple factors, this type of user pays more attention to maximizing time benefits.
  • Balanced
Balanced users show a relatively balanced and non-obvious preference in charging decisions, and are relatively sensitive to economic and time costs. Such users may pay more attention to achieving a balance between economic and time costs in charging behavior and tend to seek a relative compromise between economy and time.

2.3.2. Modeling of Comprehensive User Satisfaction

User satisfaction consists of charging price satisfaction and charging time satisfaction, which are normalized to obtain a comprehensive satisfaction model due to their different scales.
  • Satisfaction with expected charging prices
The base tariff is the charging cost incurred by the user in choosing the most suitable charging post for him/her, C0. Meanwhile, the overall cost of charging is   C T . Then, we have the following settings:
  • First, the charging price satisfaction is “1”, when C0 = C T ;
  • Second, the charging price satisfaction varies with the price difference C T -C0, and the greater the price difference, the greater the change in charging price satisfaction, when C0   C T   < nC0;
  • Third, the charging price satisfaction is “0”, when C T   nC0.
Based on the above settings and the “principle of diminishing sensitivity”, this paper adopts the cosine function to construct the relationship between the electricity price and the charging price satisfaction as follows, which can ensure that the user’s charging decision-making behavior is in line with the actual situation.
e i , j = 1                                                                         C T C 0 cos ( C T C 0 C 0 × π 2 n )                       C 0 C T n C 0   0                                                                         C T n C 0
C T = S O C 2 S O C 1 C b · R T + D T
where e i , j is the charging price satisfaction of the jth user of class I, S O C 1 is the initial charge for electric vehicles arriving at the charging station, S O C 2 is the target charge of electric vehicle, C b is the battery capacity, R T is the capacity service charge for charging posts, and D T is the electricity service charge for charging posts. Furthermore, we set n = 2 in this paper.
2.
Satisfaction with expected charging time
The time costs include the user queuing time to get to the charging station and the user charging time. We measure charging time satisfaction in terms of the difference ΔT between the user’s arrival moment at the charging station and the expected end-of-charging moment based on the user’s target charging time T c .
T = T 1 + T 2
where ΔT1 is the expected queuing time and ΔT2 is the expected charging time. The minimum queuing time is ΔT1 min and the maximum queuing time is ΔT1 max. ΔT1min is set to “0” to indicate that the user does not queue, and ΔT1max is set to “m” to indicate the maximum length of time that the user can accept queuing. The formula for calculating user charging time is as follows.
T c = C b S O C 2 S O C 1 β P η
where β is the charging efficiency (the ratio of the electrical energy actually stored in the battery during the battery charging process to the total electrical energy delivered to the battery from the charging station), P is the maximum permissible charging power, and η is the average power conversion factor.
In addition, we have the following settings:
  • First, when the user chooses the most compatible charging post without queuing, ΔT1 = 0, ΔT2 = Tc, and the highest charging time satisfaction is “1”;
  • Second, when the user has to queue or does not have the most compatible charging post, or both, ΔT increases and charging time satisfaction decreases, and the larger ΔT is, the lower the charging time satisfaction is;
  • Third, the charging time satisfaction is “0”, when ΔT = ΔTmax= T c + m .
We also express the relationship between user time cost satisfaction and time difference based on the cosine function as follows:
c i , j = 1                                                                                                 T < T c cos π 2 m × T T c               T c T T c + m 0                                                                                       T > T c + m
3.
Modeling of comprehensive user satisfaction
A comprehensive user satisfaction model was constructed to reflect user autonomy and selectivity and to facilitate subsequent research on the relationship between user satisfaction and user response behavior. Let the price satisfaction preference coefficient and the time satisfaction preference coefficient of user type i be α1,i and α2,i1,i∈[0,1], α2,i∈[0,1], α1,I + α2,I = 1), respectively. Then, the composite satisfaction model ui,j for the jth user of class i can be represented by the charging price satisfaction ei,j and charging time satisfaction ci,j, as follows:
u i , j = α 1 , i e i , j + α 2 , i c i , j

2.3.3. User Decision Process

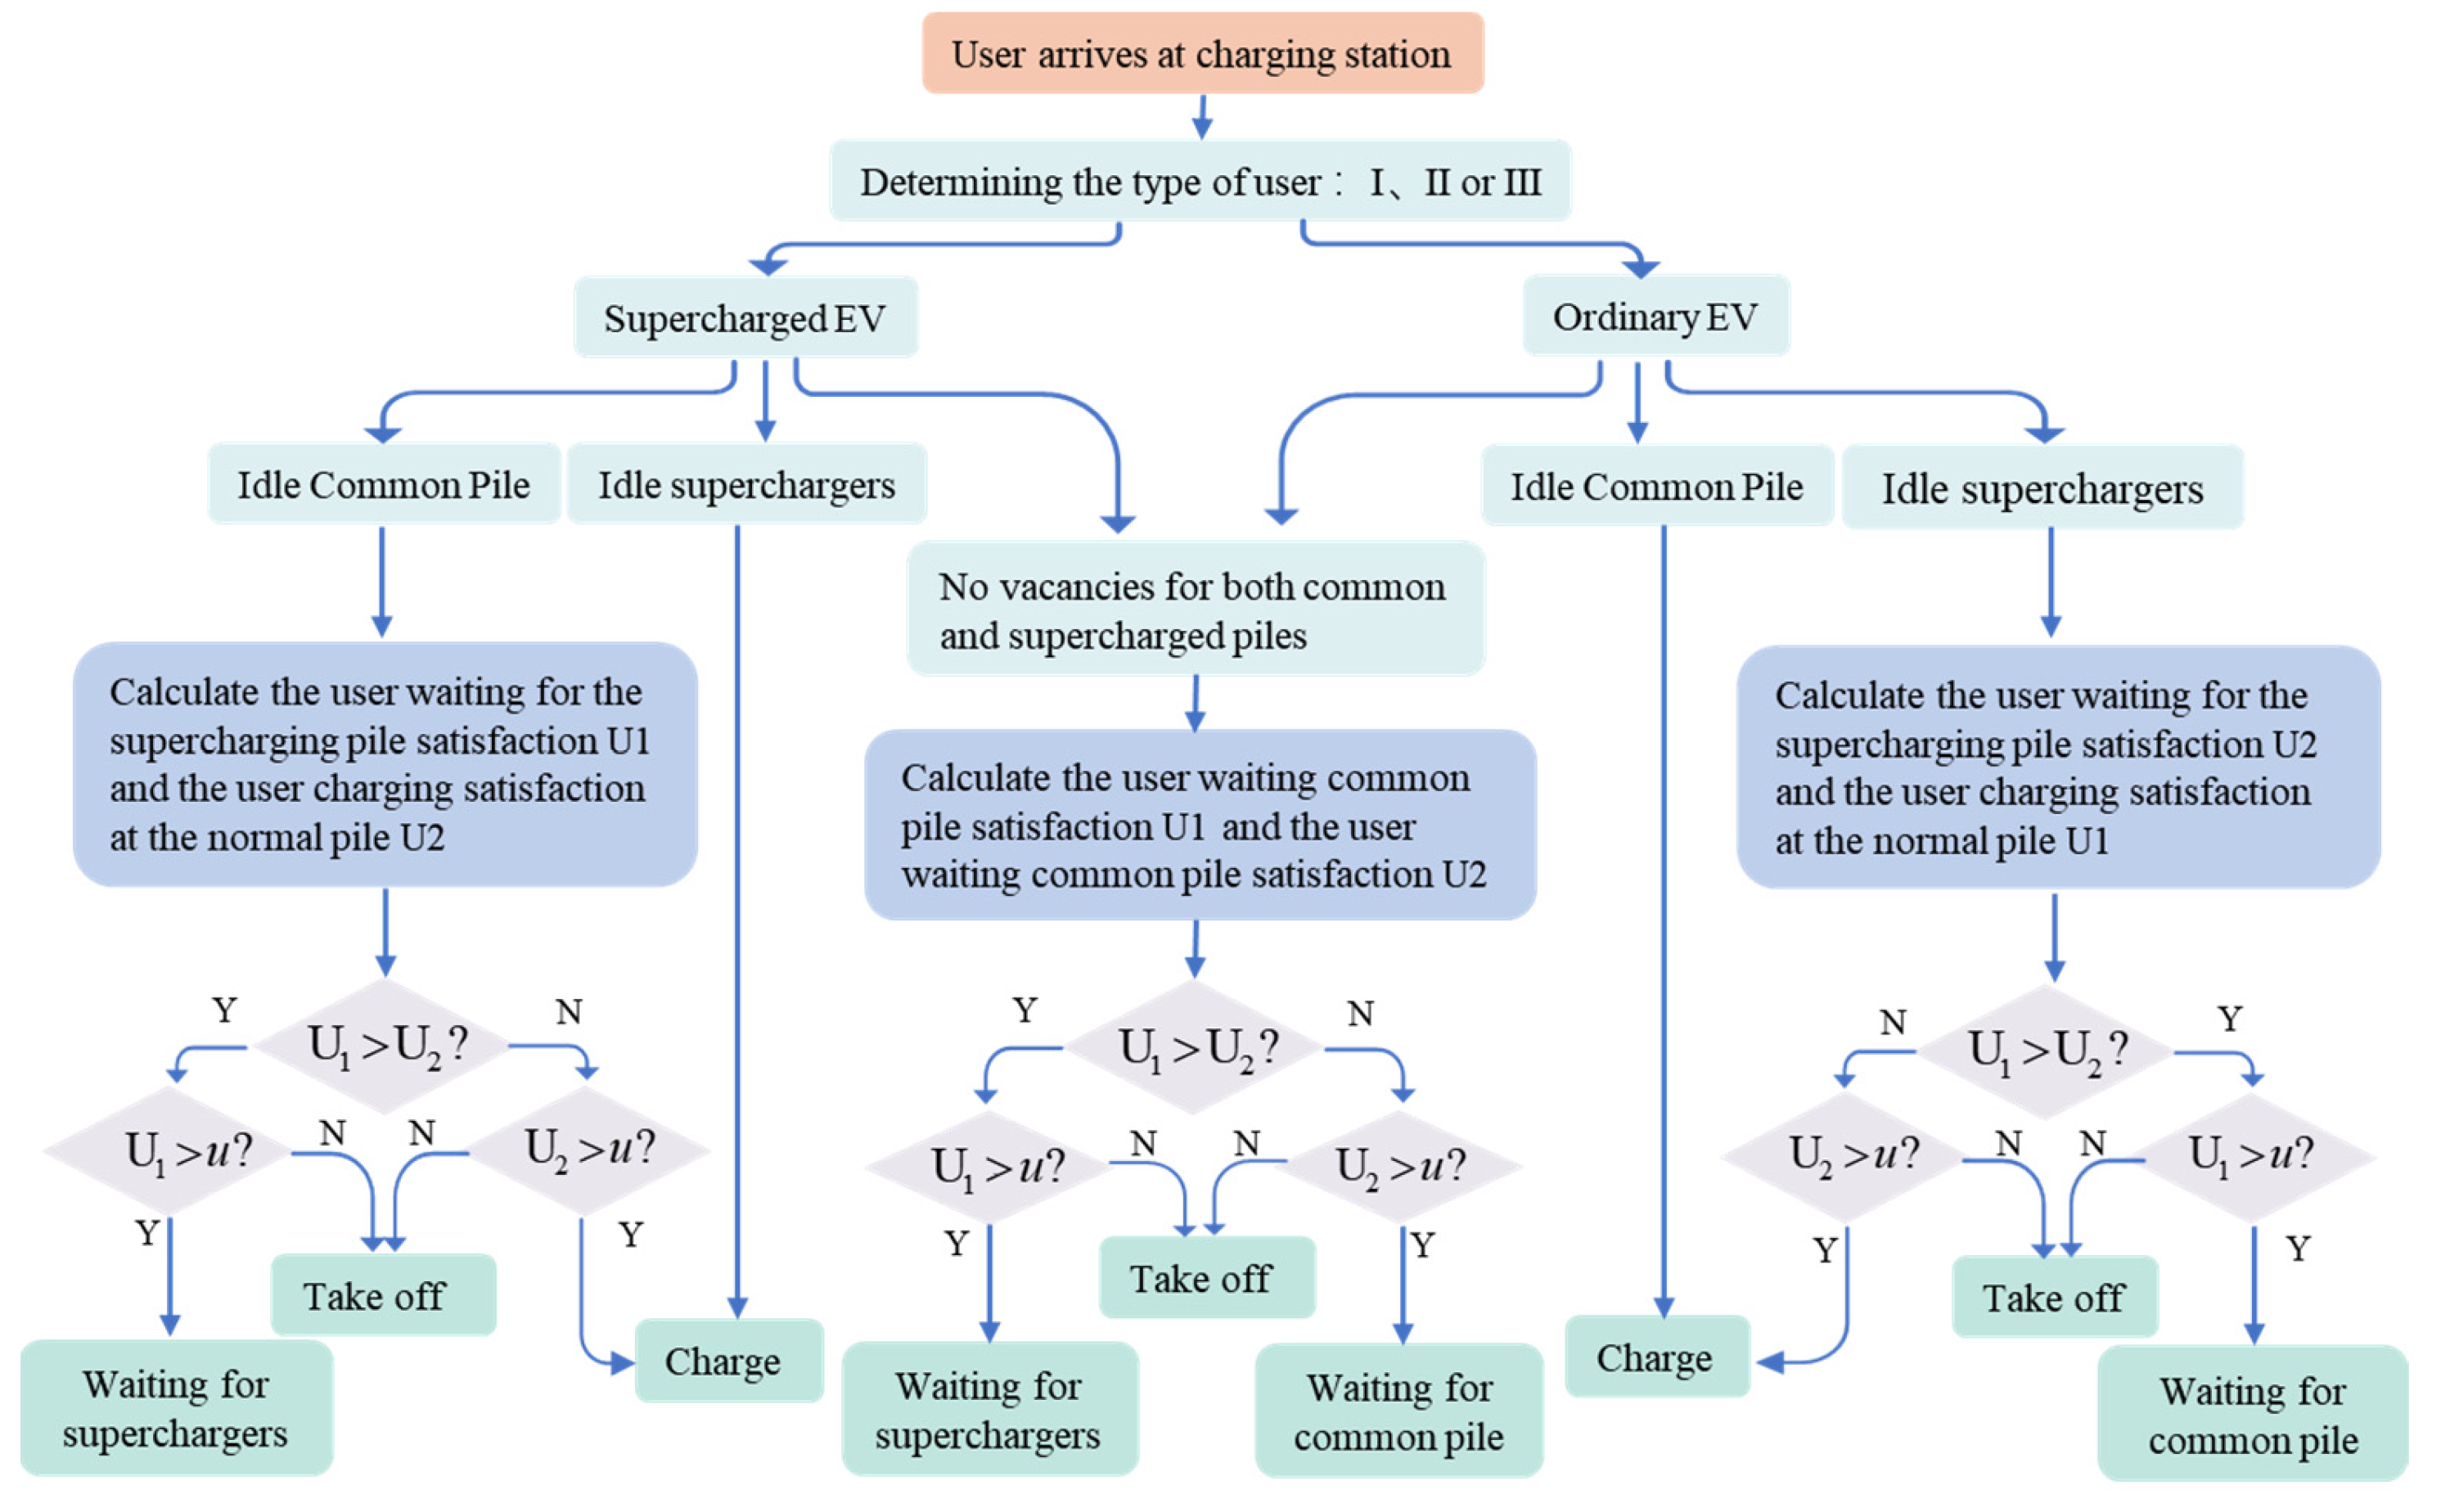
The user charging decision process is shown in Figure 3. When the user arrives at the charging station, if there exists an idle charging pile that matches the charging power of the user’s vehicle, the user directly selects charging, and if all matching charging piles are occupied, the shortest waiting time for the charging piles of different powers will be calculated. Then, we calculate the user’s comprehensive user satisfaction under different power levels of charging posts based on the expected minimum waiting time, the expected charging time, and the charging cost. The user will select the charging pile with the highest comprehensive user satisfaction as the best option. If this comprehensive user satisfaction is greater than or equal to the set value, the user will wait for charging. Otherwise, the user will decide to leave the station.

2.4. Simulation Steps

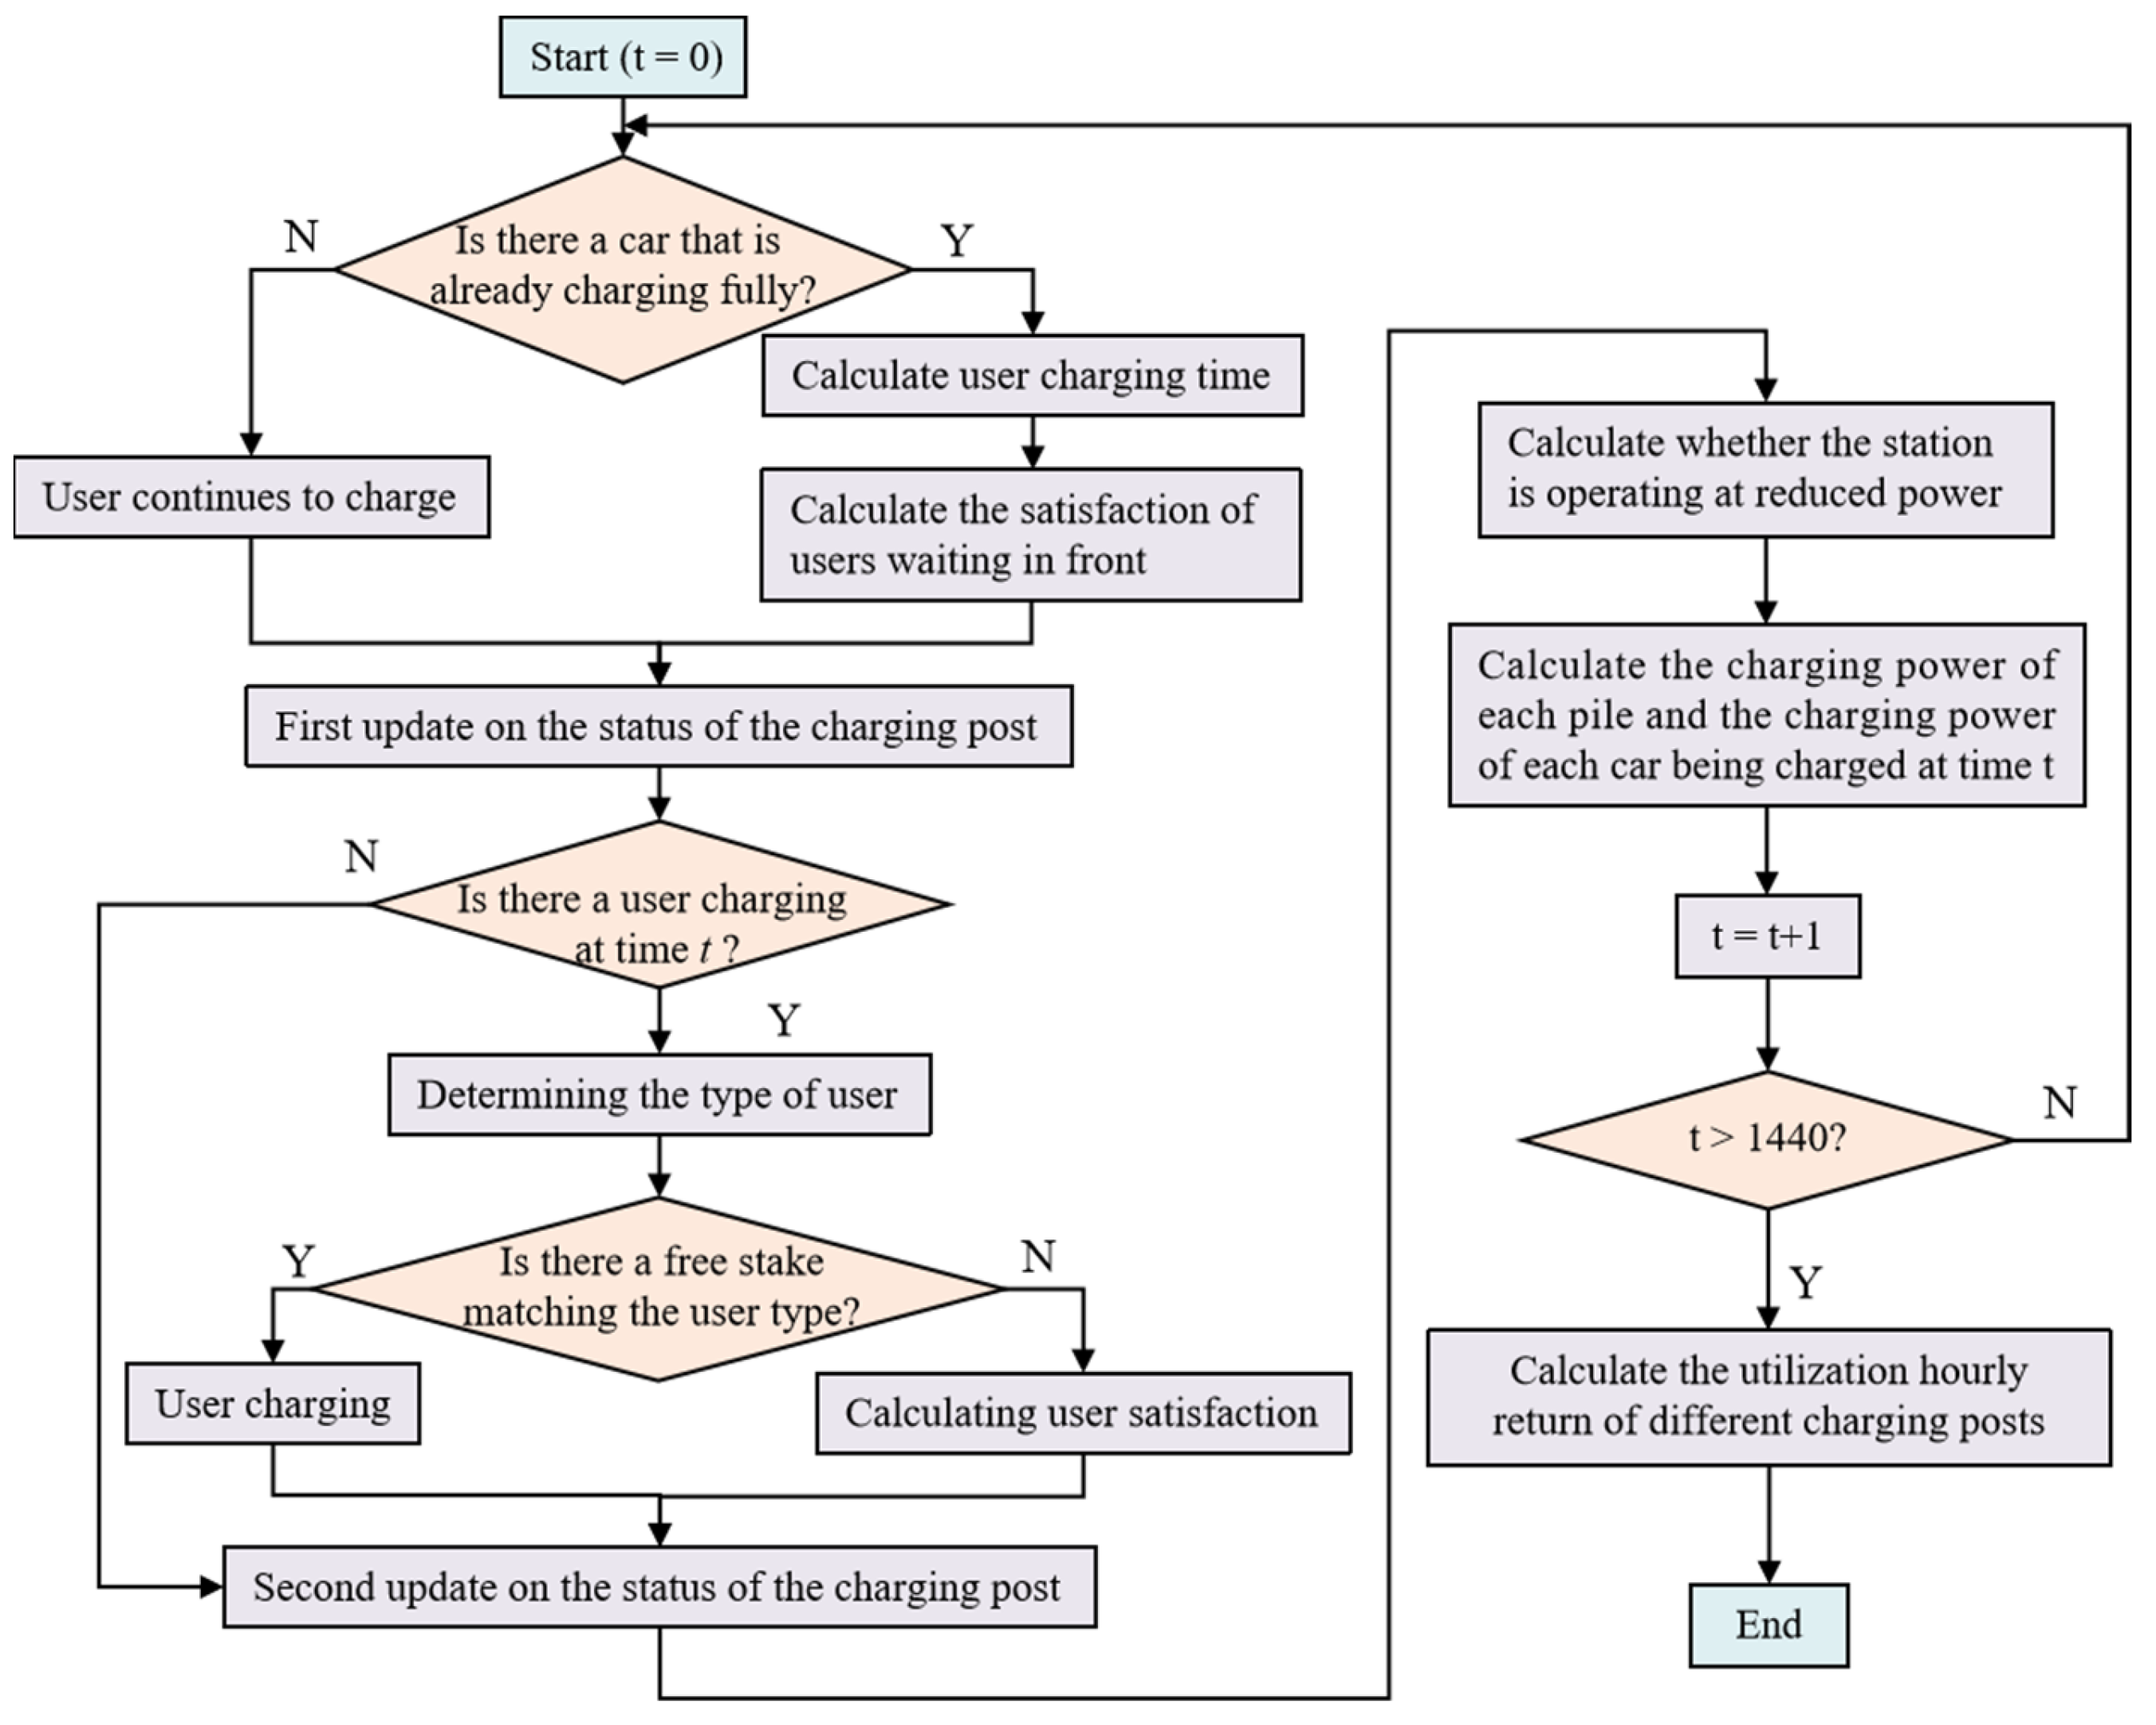
The overall simulation steps are shown in Figure 4.

2.5. Modeling of Multi-Objective Optimization

2.5.1. The Objective Functions and Boundary Conditions

  • The objective functions
  • The objective functions f 1 is established with the goal of maximizing the average satisfaction of the users as follows:
m a x f 1 = i = 1 3 j = 1 N i u i , j N u
where N i is the number of users of class i and Nu is the total number of users.
  • The objective function f 2 is established with the objective of maximizing the revenue of the charging station as follows:
m a x f 2 = i = 1 N u ( α 1 T c , i 60 P 2 C b , t + α 2 T c , i 60 P C b , t ) I
where T c , i is the charging time of the ith user, I is an indicative function about the charging moment, and it takes the value of 1 when the i-th user is charging and 0 when the i-th user is not charging. Furthermore, when the user is charging at an ordinary pile, α 1 = 0, α 2 = 1, and P =   P 1 .
  • The objective function f 3 is established with the goal of maximizing the power utilization of the charging station’s electric stack as follows.
m a x f 3 = t = 1 1440 M t 1440 N p
where M t is the load of the charging station at minute t and N p is the capacity of the electrical stack.
2.
The boundary conditions
  • The optimized charging station revenues should not be lower than pre-adjustment revenues, represented as follows:
i = 1 N u ( α 1 T c , i 60 P 2 C b , t + α 2 T c , i 60 P C b , t ) I i = 1 N u T c , i 60 P C 0 , t I
where C 0 , t is the pre-adjustment tariff.
  • The optimized charging station power utilization should not be lower than the pre-adjustment utilization, represented as follows:
t = 1 1440 M t 1440 N p t = 1 1440 M t , p 1440 N p
where M t , p is the load of the pre-adjustment charging station at minute t.
  • The optimized average user satisfaction should not be lower than the pre-adjustment satisfaction, represented as follows.
i = 1 3 j = 1 N i u i , j N u u 0
where u0 is the pre-adjustment average user satisfaction.

2.5.2. Multi-Objective Optimization Algorithms

Unlike single-objective optimization problems, two or more conflicting objectives are often involved in solving a multi-objective optimization problem. Thus, it is not possible to optimize all the objectives at the same time but rather to try to find a compromise set of non-dominated solutions, known as the Pareto solution set. The multi-objective particle swarm optimization (MOPSO) is a commonly used algorithm for the intelligent solution of multi-objective problems, the core idea of which is to converge the population to the Pareto set by updating and preserving the particle non-dominated solutions.
The main advantages of MOPSO lie in its simple structure, high computational efficiency, excellent global and local search capabilities, strong solution set diversity maintenance, and adaptability. Compared to genetic algorithms (NSGA-II), simulated annealing, and multi-objective differential evolution algorithms, MOPSO is easier to implement, has strong parallelization potential, and is better suited for multi-objective optimization problems in dynamic and complex environments.

3. Case Study

The MOPSO algorithm is used to solve the established multi-objective function model and to analyze the economics of users and charging stations under the differentiated pricing scheme. The results show that the multi-power differentiated pricing mechanism proposed in this paper has a good guiding effect on electric vehicle users, which can effectively improve user satisfaction, increase the revenue and utilization rate of charging stations, and realize the mutual benefit and win-win situation between charging stations and users.

3.1. Case Setting

3.1.1. Case Base Data Setting

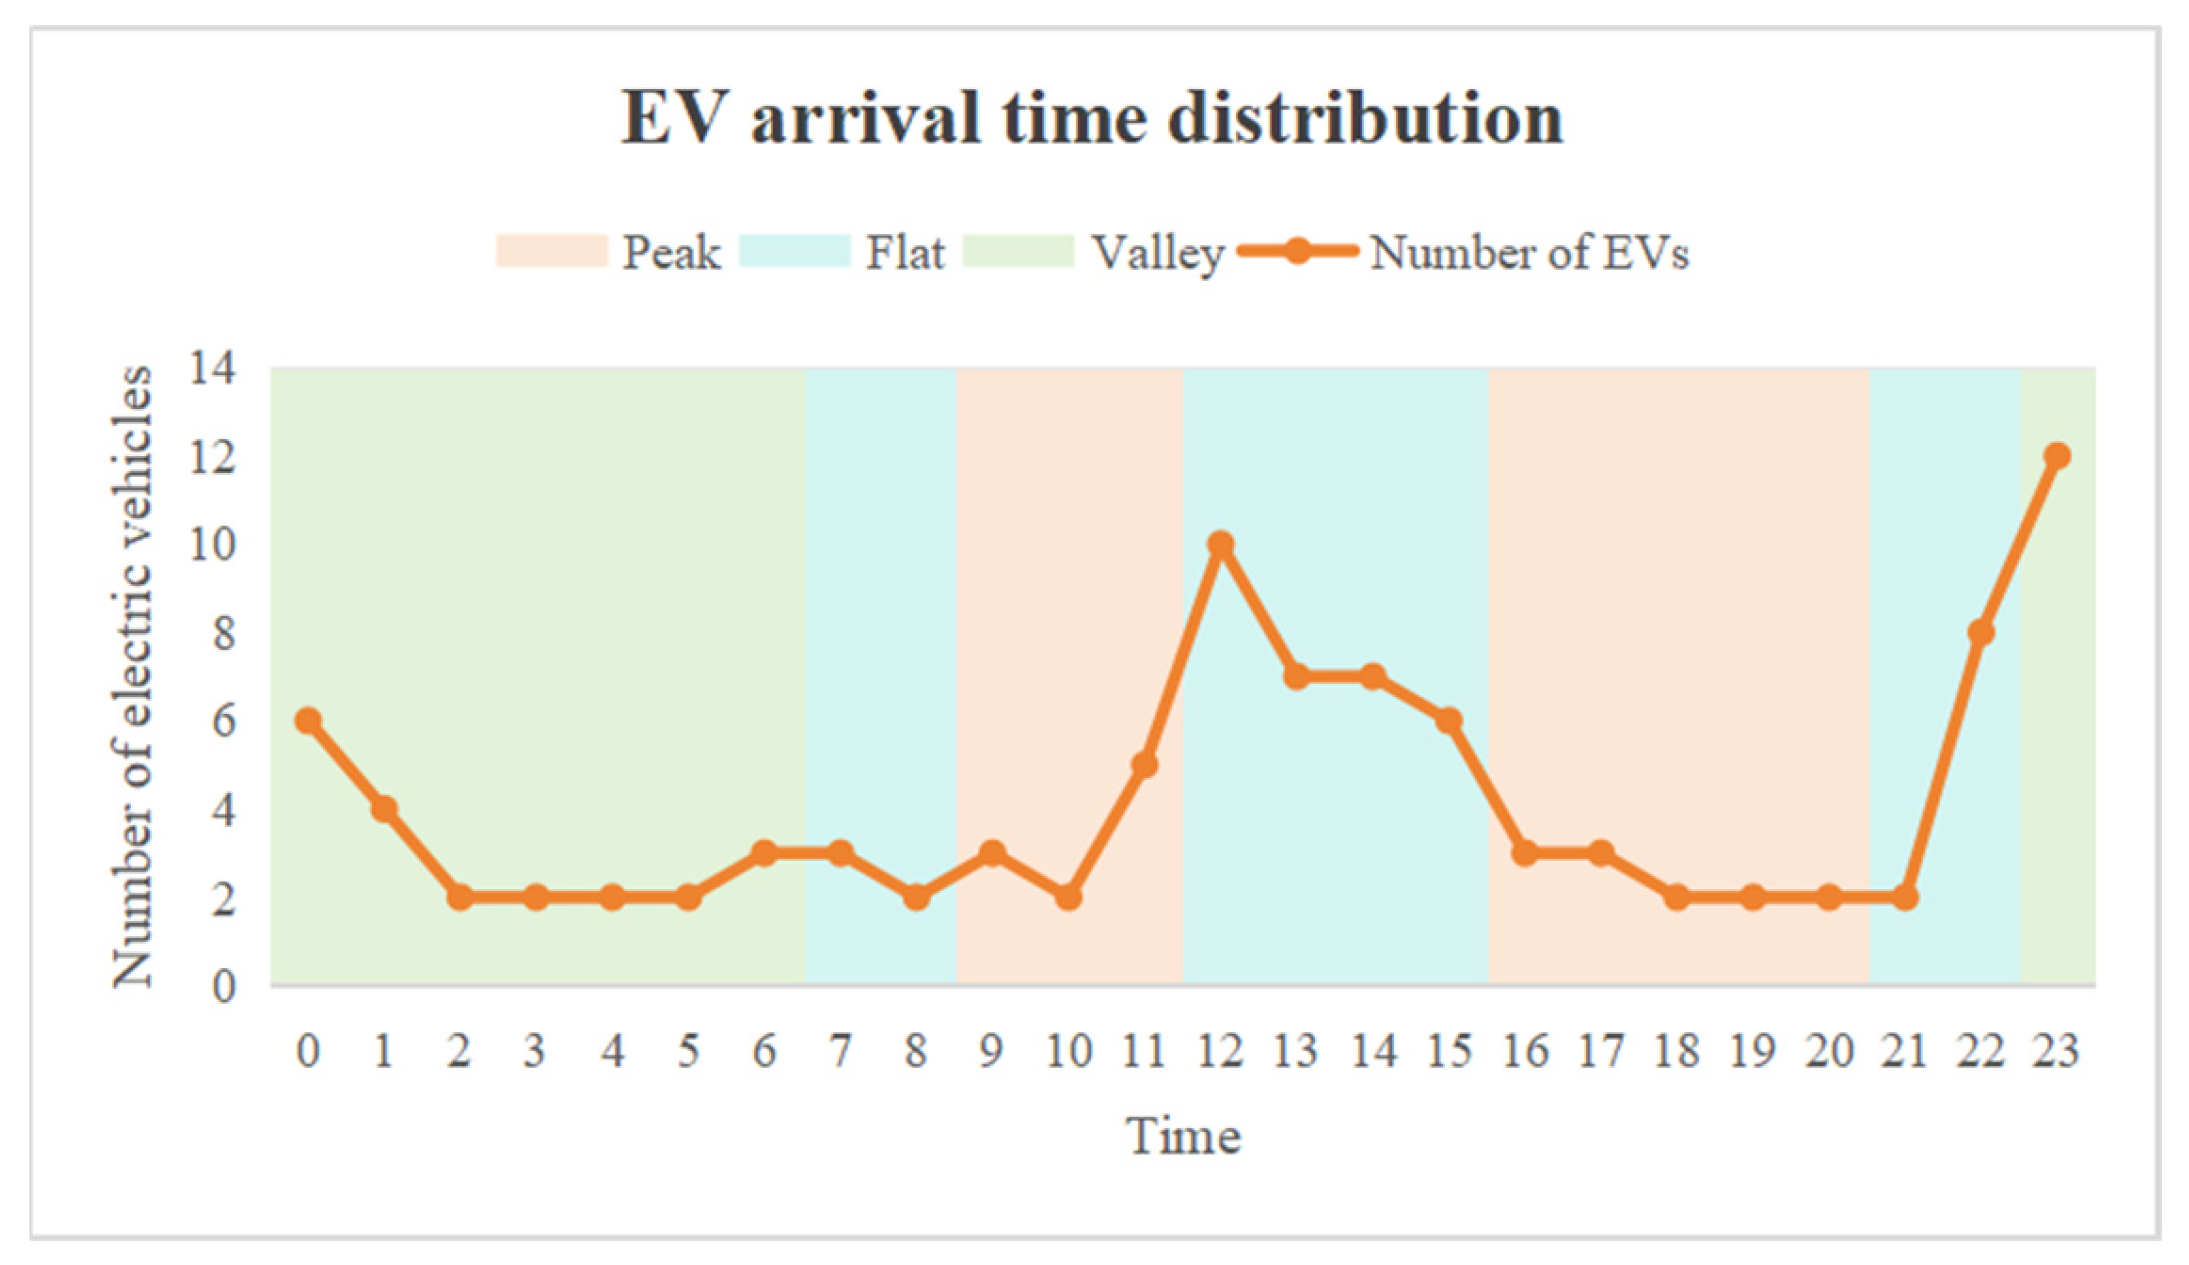
In this paper, we study the optimization problem for a single charging station, assuming that the charging station has an electric stack capacity of 720 kW and six charging piles, including four normal charging piles with a rated power of 120 kW and two supercharging piles with a rated power of 480 kW. The number of users of each type is set in a ratio of I: II: III = 1:1:2. The total number of vehicles arriving at the charging station on a day is 100, and the proportion of 800 V supercharged vehicles is 30%. The battery capacities of 400 V ordinary vehicles are 40 kWh, 50 kWh, 60 kWh, and 70 kWh, respectively, accounting for 25% each; the battery capacities of 800 V supercharged vehicles are 60 kWh, 80 kWh, 100 kWh, and 120 kWh, with percentages assumed to be 50%, 35%, 10%, and 5%, respectively. The battery charging efficiency is 0.95, and the average power conversion factor is 0.7. The charging service cost is 0.45 rmb/kWh. The distribution of EV charging time is shown in Figure 5.

3.1.2. User Decision Boundary Condition Setting

According to the different types of users with different sensitivity to charging preferences, the price satisfaction preference coefficients and time cost satisfaction preference coefficients for different types of users set in this paper are shown in Table 2.
In general, 0.6 is used to calculate overall satisfaction to determine whether users will leave. However, there are still some limitations; for example, for price-sensitive users, the charging cost may be completely in line with the user’s expectations, but the queuing time plus charging time is completely beyond the range of the user’s acceptance. At this time, the comprehensive user satisfaction is more than 0.6, i.e., the user will not choose to leave, which does not correspond to the actual situation. There is also a similar problem for time-sensitive users. Therefore, in order to make the user decision-making model more reasonable, the following conditions are attached:
  • For price-sensitive users, if the total time exceeds Tc,p + 30 min, the users directly choose to leave;
  • For time-sensitive users, if the total cost exceeds 2C0, the users directly choose to leave;
  • For balanced users, no conditions are attached.

3.2. Optimization Results and Comparison

This paper verifies the effectiveness of the classification pricing model proposed in this paper by comparing the following two models:
Model 1: Conventional pricing model: the charging service costs for charging piles of different power levels are the same.
Model 2: Differentiated pricing model: different pricing models are adopted for charging piles of different power levels.

3.2.1. Comparison of the Occupancy of Supercharger Piles by Ordinary Vehicles

Under the conventional pricing model, the number of charges for the superchargers is 61, while the regular cars occupy 38, or about 62% of the total number of charges, as shown in Figure 6. For a supercharger, the average charge time is 15.5 min and the maximum charge time is 31 min, exceeding expectations by 50%.
Under the differentiated pricing model, the number of charges for the superchargers is 32, while the slow-charging vehicles occupy 2, as shown in Figure 7. For a supercharged vehicle, the average charging time is 8.4 min and the maximum charging time is 19 min, reaching a level of charging rate that is satisfactory to users.

3.2.2. Comparison of the Results of the Two Models

According to MOPSO (Multi-Objective Particle Swarm Optimization), this multi-objective function and multi-constraint electric vehicle charging load model are solved, and the optimized capacity service fee weight is obtained. The results under the two schemes are compared as shown in Table 3. When other conditions remain constant, modifying only the capacity service charge weights increases charging station revenue, charging station power utilization, and user satisfaction. Taking 100 vehicles/day as an example, the charging station revenue increases from 3181.2 yuan to 3522.8 yuan, the charging station power utilization rate increases from 0.1934 to 0.2072, and the user satisfaction increases from 0.8361 to 0.8426. All three metrics improve under the differentiated pricing model, which demonstrates the superiority of this proposed model.

4. Conclusions

This study proposes a differentiated pricing strategy for charging service fees. The strategy is designed to enhance overall user satisfaction by allowing users to flexibly plan their charging schedules through a multi-power-level pricing mechanism.
Based on this, a minute-level operational simulation model of charging stations was constructed, fully considering the differences between various user types, providing theoretical support for understanding user decision-making, and offering reliable data support for calculating user satisfaction and station revenue. The research primarily focuses on the interests of both “users” and “charging stations”. Through the development of a multi-objective optimization model, this study aims to determine the most applicable pricing strategy for different power levels under real-world conditions. This comprehensive approach seeks to establish a pricing mechanism that balances the interests of all parties involved.
This study provides a new theoretical framework for pricing methods in the field of electric vehicle charging services by considering the needs of multiple subjects with multiple objectives.

Author Contributions

Writing—original draft preparation, Q.Y.; supervision, L.L.; project administration, X.L. and G.Z. All authors have read and agreed to the published version of the manuscript.

Funding

This research was funded by Research on Key Technologies for Planning and Designing Multiple Types of Charging Facilities Considering Super Fast Charging of State Grid Tianjin Electric Power Company, grant number 5400-202312220A-1-1-ZN.

Data Availability Statement

The data presented in this study are available on request from the corresponding author due to project requirements.

Conflicts of Interest

The authors declare no conflicts of interest. The State Grid Tianjin Electric Power Company Electric Power Research Institute had no role in the design of the study.

References

  1. Teng, Y.; Hu, T.; Wei, Z. Electric Vehicle Charging Tariff Pricing Analysis. J. Transp. Syst. Eng. Inf. Technol. 2008, 3, 126–130. [Google Scholar]
  2. Shi, L.; Wu, W.; Zeng, L. PPP Pricing Model and Application for Electric Vehicle Charging Services. Price Theory Pract. 2015, 8, 94–96. [Google Scholar]
  3. Zhang, J. Study on Electric Vehicle Charging Price Pricing Mechanism. Price Theory Pract. 2018, 09, 135–138. [Google Scholar]
  4. Liu, J.; Jia, Z.; Xiang, Y. Pricing model for electric vehicle charging service charge under ubiquitous power IoT. Adv. Eng. Sci. 2020, 4, 33–41. [Google Scholar]
  5. Chen, Z.; Liu, Y.; Zhou, T. Optimal time-sharing charging pricing strategy for electric vehicles considering mobility characteristics. Electr. Power Autom. Equip. 2020, 4, 96–102. [Google Scholar]
  6. Yang, J.; Gou, F.; Huang, Y. A time-sharing tariff formulation strategy for electric vehicle charging in residential neighborhoods based on uncertainty measurement. Power Syst. Technol. 2018, 42, 96–102. [Google Scholar]
  7. Luo, M.; Zhao, W.; Lin, G. Study on Electric Vehicle Orderly Charging Tariff Based on Grid Peak-Valley Time-of-Use Tariff Linkage. Electr. Energy Manag. Technol. 2015, 24, 78–82. [Google Scholar]
  8. Cui, J.; Cui, W.; Zhou, N. Research on Pricing Model and Strategy of Electric Vehicle Orderly Charging and Discharging Based on Multiple Perspectives. Proc. CSEE 2018, 15, 4438–4450. [Google Scholar]
  9. Yang, J. Study on the Optimization of Electric Vehicle Public Charging Station Site Selection and Service Charge Pricing Strategy. Master’s Thesis, Xidian University, Xi’an, China, 2021. [Google Scholar]
  10. Xin, M.; Li, Y.; Zhang, Y. Electric Vehicle Charging Service Charge Pricing Strategy Taking into Account Grid Peak and Valley Operation. Shanghai Energy Conserv. 2018, 8, 612–618. [Google Scholar]
  11. Gao, Y.; Wang, C.; Lv, M. Optimal Peak-to-Valley Tariff Modelling for Electric Vehicles Accounting for Owner Satisfaction. Electr. Power Autom. Equip. 2014, 34, 8–13. [Google Scholar]
  12. He, J.; Chen, J.; Huang, J. Study on Orderly Charging of Electric Vehicles Based on Regional Peak-Valley Time-of-Use Tariffs. Electr. Meas. Instrum. 2018, 55, 23–29. [Google Scholar]
  13. Luo, J. Research on Charging Pricing Strategy for Public Fast Charging Stations. Master’s Thesis, Southeast University, Nanjing, China, 2022. [Google Scholar]
  14. Sun, X. Research on Electric Vehicle Charging Tariff Period Classification Method and Orderly Charging Strategy. Master’s Thesis, Beijing Jiaotong University, Beijing, China, 2014. [Google Scholar]
  15. Yuan, W.; Huang, J.; Zhang, Y. Competitive charging station pricing for plug-in electric vehicles. IEEE Trans. Smart Grid. 2015, 8, 627–639. [Google Scholar]
  16. Su, S.; Li, P.; Yan, H. Pricing method for charging service fee duopoly alliance based on Hotelling model. Power Syst. Prot. Control. 2019, 47, 133–142. [Google Scholar]
  17. Wei, Q. Research and Simulation of Real-Time Tariff Strategies for Charging Stations in V2G Scenarios. Master’s Thesis, Beijing University of Posts and Telecommunications, Beijing, China, 2016. [Google Scholar]
  18. Deng, X.; Jie, Y.; Zhang, Y. Research on dynamic pricing strategy of electric vehicle charging considering bilateral interests. Mod. Electron. Technol. 2023, 46, 124–128. [Google Scholar]
  19. Zhang, J. Study on Electric Vehicle Orderly Charging Strategy and Charging Facilities Planning. Master’s Thesis, Taiyuan University of Technology, Taiyuan, China, 2018. [Google Scholar]
  20. Yang, Y.; Qin, S.; Zheng, F. A study of charging pricing strategies for electric vehicle charging stations. Zhejiang Electr. Power 2018, 37, 58–62. [Google Scholar]
  21. Yu, S.; Du, Z.; Chen, L. Optimal Regulation Strategy of Electric Vehicle Charging and Discharging Based on Dynamic Regional Dispatching Price. Front. Energy Res. 2022, 10, 873262. [Google Scholar]
  22. Yang, J.; Chen, J.; Chen, L. A Regional Time-of-Use Electricity Price Based Optimal Charging Strategy for Electrical Vehicles. Energies 2016, 9, 670. [Google Scholar]
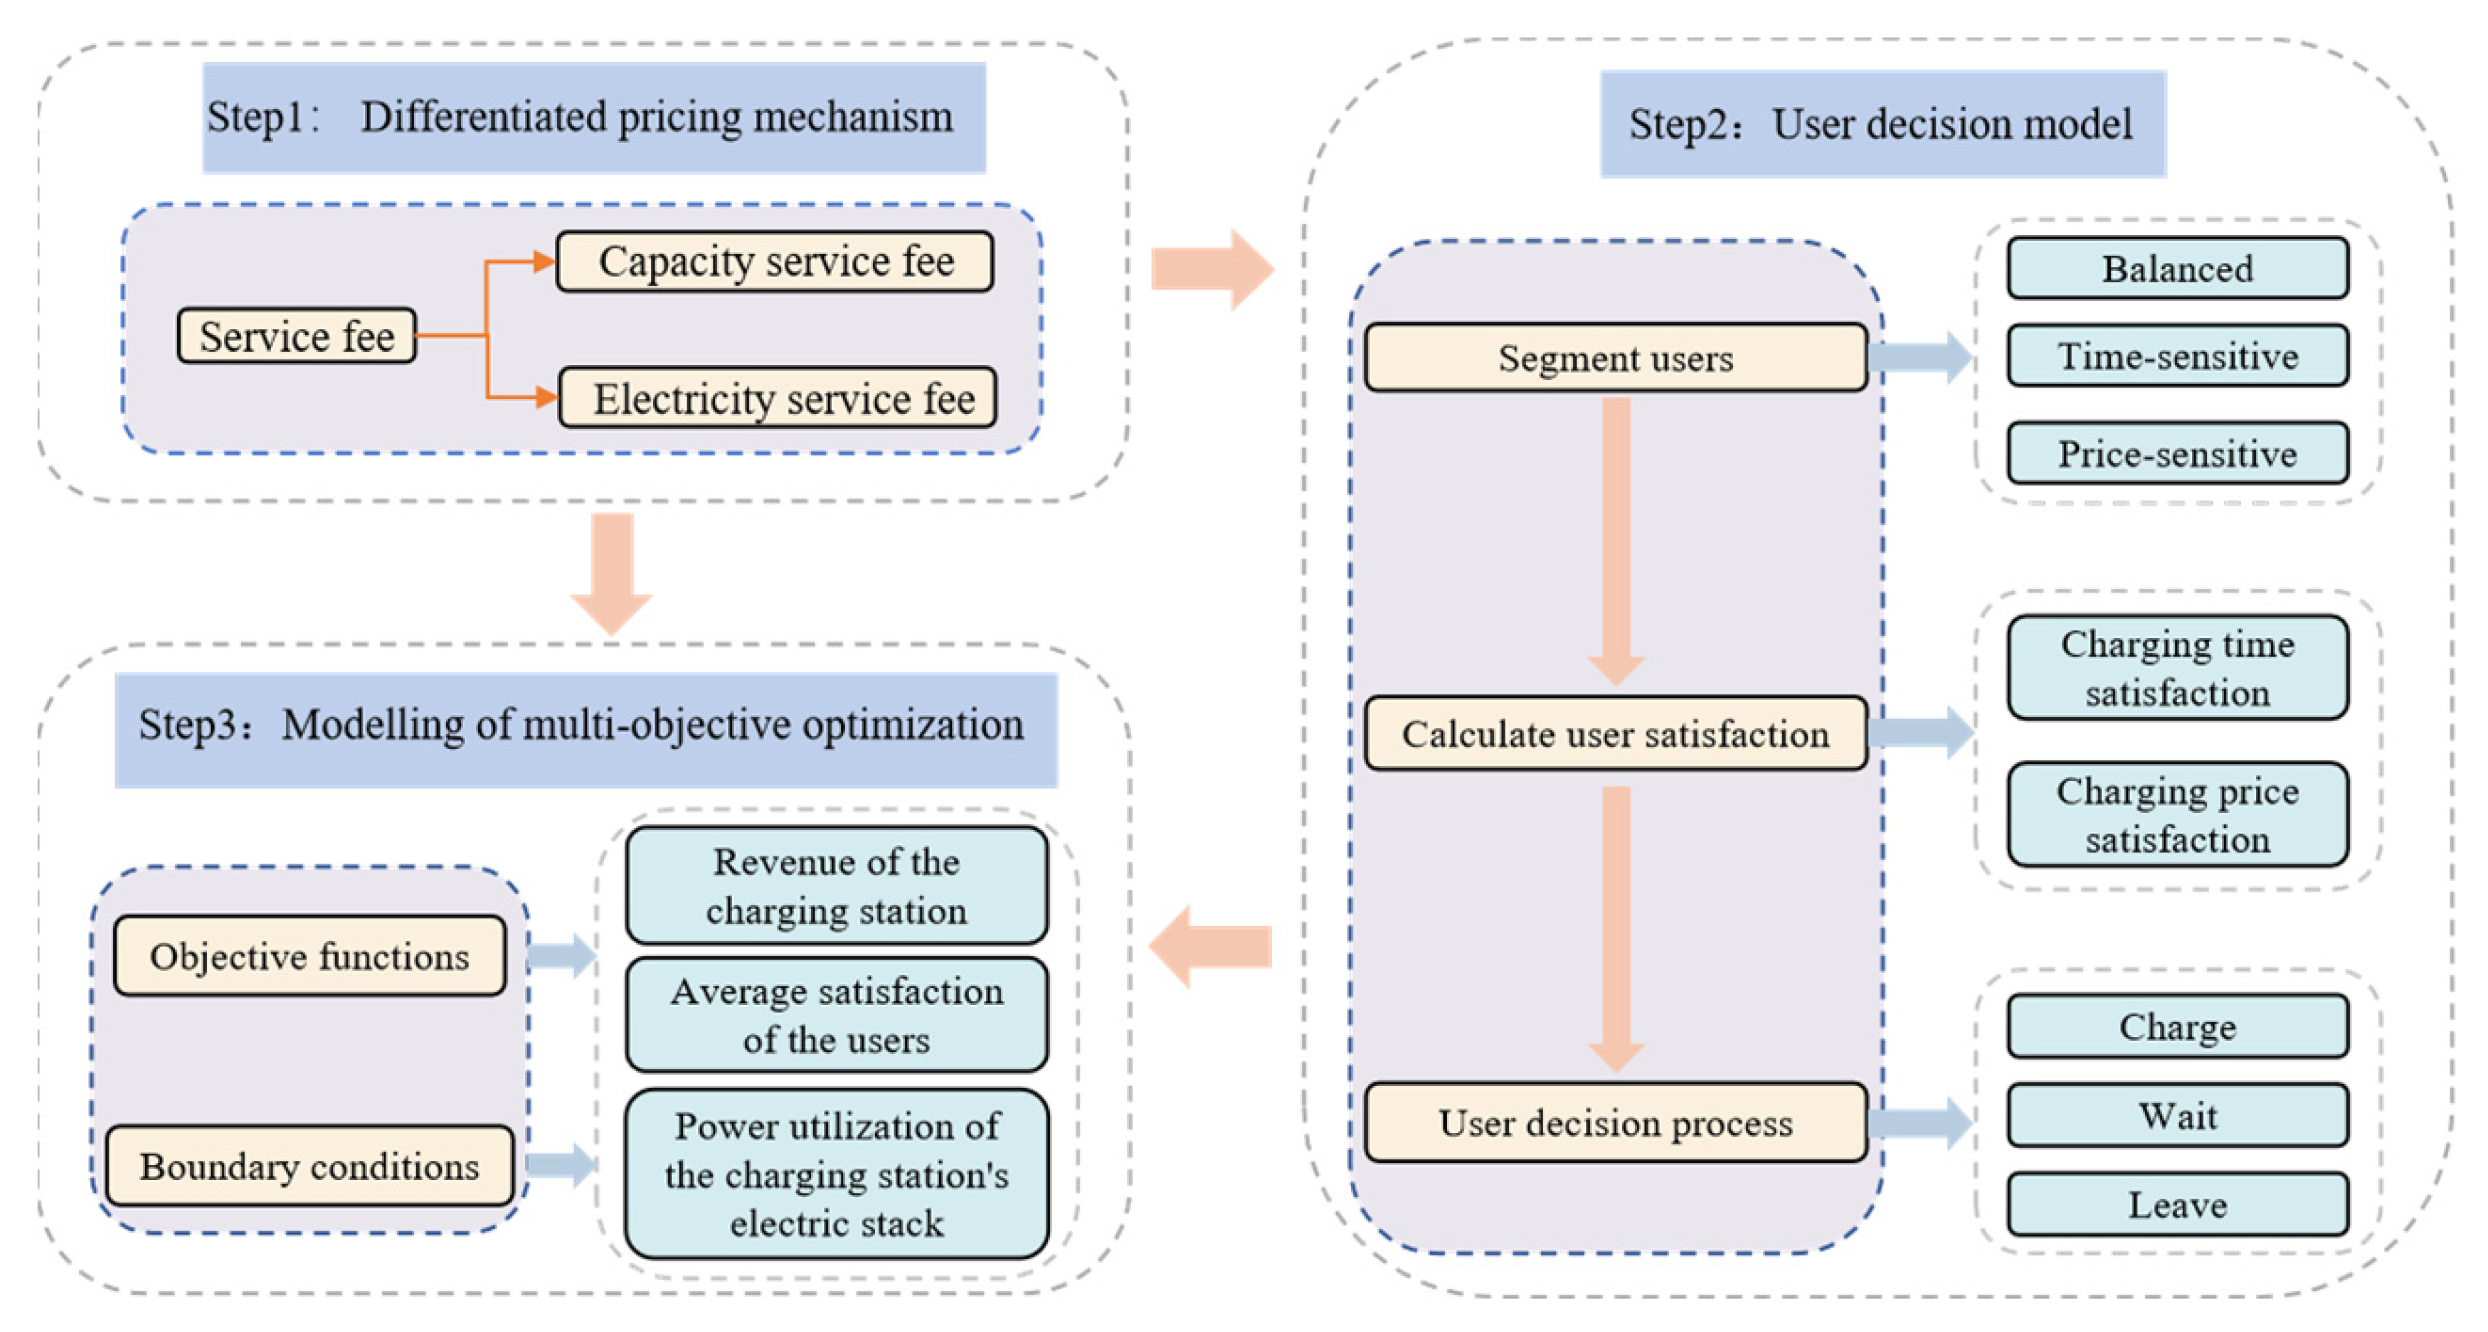
Figure 1. Differentiated pricing model framework.
Energies 17 04771 g001
Figure 2. Different types of users.
Energies 17 04771 g002
Figure 3. The process of the user charging decision.
Energies 17 04771 g003
Figure 4. Simulation steps.
Energies 17 04771 g004
Figure 5. Distribution of EV charging time.
Energies 17 04771 g005
Figure 6. Occupancy of supercharging piles under the conventional pricing model.
Energies 17 04771 g006
Figure 7. Occupancy of supercharging piles under the differentiated pricing model.
Energies 17 04771 g007
Table 1. Price composition of different pricing mechanisms.
Pricing MechanismsElectricity FeeCharging Service Fee
Traditional pricing mechanismMN
Differentiated pricing mechanismMCapacity service feeR
Electricity service feeD
Table 2. Preference coefficients for different types of users.
User TypesPrice Satisfaction Preference CoefficientsTime Cost Satisfaction Preference Coefficients
0.80.2
0.20.8
0.50.5
Table 3. Comparison of results of two schemes.
Conventional Pricing ModelDifferentiated Pricing Model
Capacity service charge weights α 0.0000.280
Charging station revenue (yuan/day)3181.2003522.800
Charging station power utilization0.1930.207
User satisfaction0.8360.843
Disclaimer/Publisher’s Note: The statements, opinions and data contained in all publications are solely those of the individual author(s) and contributor(s) and not of MDPI and/or the editor(s). MDPI and/or the editor(s) disclaim responsibility for any injury to people or property resulting from any ideas, methods, instructions or products referred to in the content.