Article

Impact of Overpressure on the Preservation of Liquid Petroleum: Evidence from Fluid Inclusions in the Deep Reservoirs of the Tazhong Area, Tarim Basin, Western China

1
Shandong Key Laboratory of Depositional Mineralization & Sedimentary Mineral, Shandong University of Science and Technology, Qingdao 266590, China
2
PetroChina Hangzhou Research Institute of Geology, Hangzhou 310023, China
3
State Key Laboratory of Deep Oil and Gas, Qingdao 266580, China
*
Authors to whom correspondence should be addressed.
Energies 2024, 17(19), 4765; https://doi.org/10.3390/en17194765
Submission received: 5 August 2024 / Revised: 4 September 2024 / Accepted: 13 September 2024 / Published: 24 September 2024

Abstract

:
The complexity of petroleum phases in deep formations plays an important role in the evaluation of hydrocarbon resources. Pressure is considered to have a positive impact on the preservation of liquid oils, yet direct evidence for this phenomenon is lacking in the case of deep reservoirs due to late destruction. Here, we present fluid-inclusion assemblages from a deep reservoir in the Tazhong area of the Tarim Basin, northwestern China, which formed as a direct consequence of fluid pressure evolution. Based on thermodynamic measurements and simulations of the coexisting aqueous and petroleum inclusions in these assemblages, the history of petroleum activities was reconstructed. Our results show that all analyzed fluid-inclusion assemblages demonstrated variable pressure conditions in different charging stages, ranging from hydrostatic to overpressure (a pressure coefficient of up to 1.49). Sequential petroleum charging and partial oil cracking may have been the main contributors to overpressure. By comparing the phases of petroleum and fluid pressures in the two wells, ZS1 and ZS5, it can be inferred that overpressure inhibits oil cracking. Thus, overpressure exerts an important influence on the preservation of liquid hydrocarbon under high temperatures. Furthermore, our results reveal that the exploration potential for liquid petroleum is considerable in the deep reservoirs of the Tarim Basin.

1. Introduction

The energy crisis urgently needs to be alleviated through the exploration and development of deep oil and gas resources [1,2,3]. In the past decade, the focus of petroleum exploration has gradually changed from medium and shallow reservoirs to deep (>4500 m and >3500 m in the western and eastern basins of China) and ultra-deep (>6000 m) reservoirs [1,2]. Deep or ultra-deep petroleum reservoirs have attracted increasing attention from petroleum geologists, especially concerning the complexity of deep fluid phases, due to their important impact on the evaluation of deep petroleum exploration potential in petroliferous basins [4,5,6]. The deep petroleum phase is mainly controlled by the local temperature and pressure, and the pressure is considered to have a positive impact on the preservation of liquid oil based on rational inference [7]. However, direct evidence for this effect in deep reservoirs is limited due to the scarcity of deep drilling data and the prevalence of late modifications caused by temperature increases, tectonic activities, and so on. In recent years, several deep and ultra-deep wells have been drilled in the Tarim Basin in western China, providing appropriate samples and data to look for direct evidence [8].
In 2013 and 2014, wells ZS1 and ZS5 were successively drilled down to the Lower Cambrian (nearly 7000 m) and successfully produced petroleum [8,9,10,11,12]. More than 10 deep or ultra-deep wells such as LN1 and MS3 have subsequently been drilled since 2020 [13]. However, obvious phase differences between these wells exist. For instance, the formation test results showed that the inter-salt reservoir of wells ZS1 and ZS1C (sidetracking of ZS1) at about 6400 m (Upper Cambrian) mainly contained oil, while the pre-salt reservoir at about 6800 m (Lower Cambrian) mainly contained natural gas. The pre-salt reservoirs under 6600 m (Middle and Lower Cambrian) in well ZS5 and under 8200 m in well LN1 (Lower Cambrian) are both dominated by oil. Such differences may be controlled by factors such as the source, tectonic activities, and temperature [14,15,16,17,18,19]. In addition, the maturity and formation pressure may also play an important role in the different accumulations [8,20,21]. In order to confirm the main controlling factors of hydrocarbon phase differences in the deep reservoirs of the Tarim Basin, paleo-fluid analysis was carried out. Fluid inclusions, which directly record the fluid activities, are usually used in the fluid analysis of petroliferous basins [22,23,24]. Therefore, by using thermodynamic simulations of fluid-inclusion assemblages (FIAs), the physico-chemical properties of hydrocarbon charged in pre-salt reservoirs in the Tazhong area were analyzed in this work. The influence of pressure on hydrocarbon preservation was then discussed, inferring the deep and ultra-deep petroleum exploration potential in the Tarim Basin.

2. Geological Setting

The Tarim Basin is located in southern Xinjiang Province, China. It is a typical superimposed basin composed of a Paleozoic craton basin and a Meso-Cenozoic foreland basin, so the Paleozoic marine carbonate rocks have undergone multiple tectonic cycles [20]. The tectonic movement led to the formation of the present structural framework of “three uplifts and four depressions” in the Tarim Basin (Figure 1a,b).
The deep petroliferous strata in the Tarim Basin are dominated by Cambrian and Ordovician marine carbonate rocks [25]. Although petroleum was mainly produced in the Ordovician, Cambrian dolomite reservoirs have been a research hotspot in recent years [26]. Petroleum exploration previously conducted in the Cambrian has mainly focused on the Tazhong and Bachu Uplifts in the Central Uplift Belt, which were long-term successive large paleouplifts with complete Cambrian and Ordovician stratigraphic formations (Figure 1c) [8,27]. The Tazhong Uplift was formed during the Middle Ordovician, accompanied by some folds and faults. The Paleozoic strata are considered important petroleum-producing layers in the Tarim Basin [28].
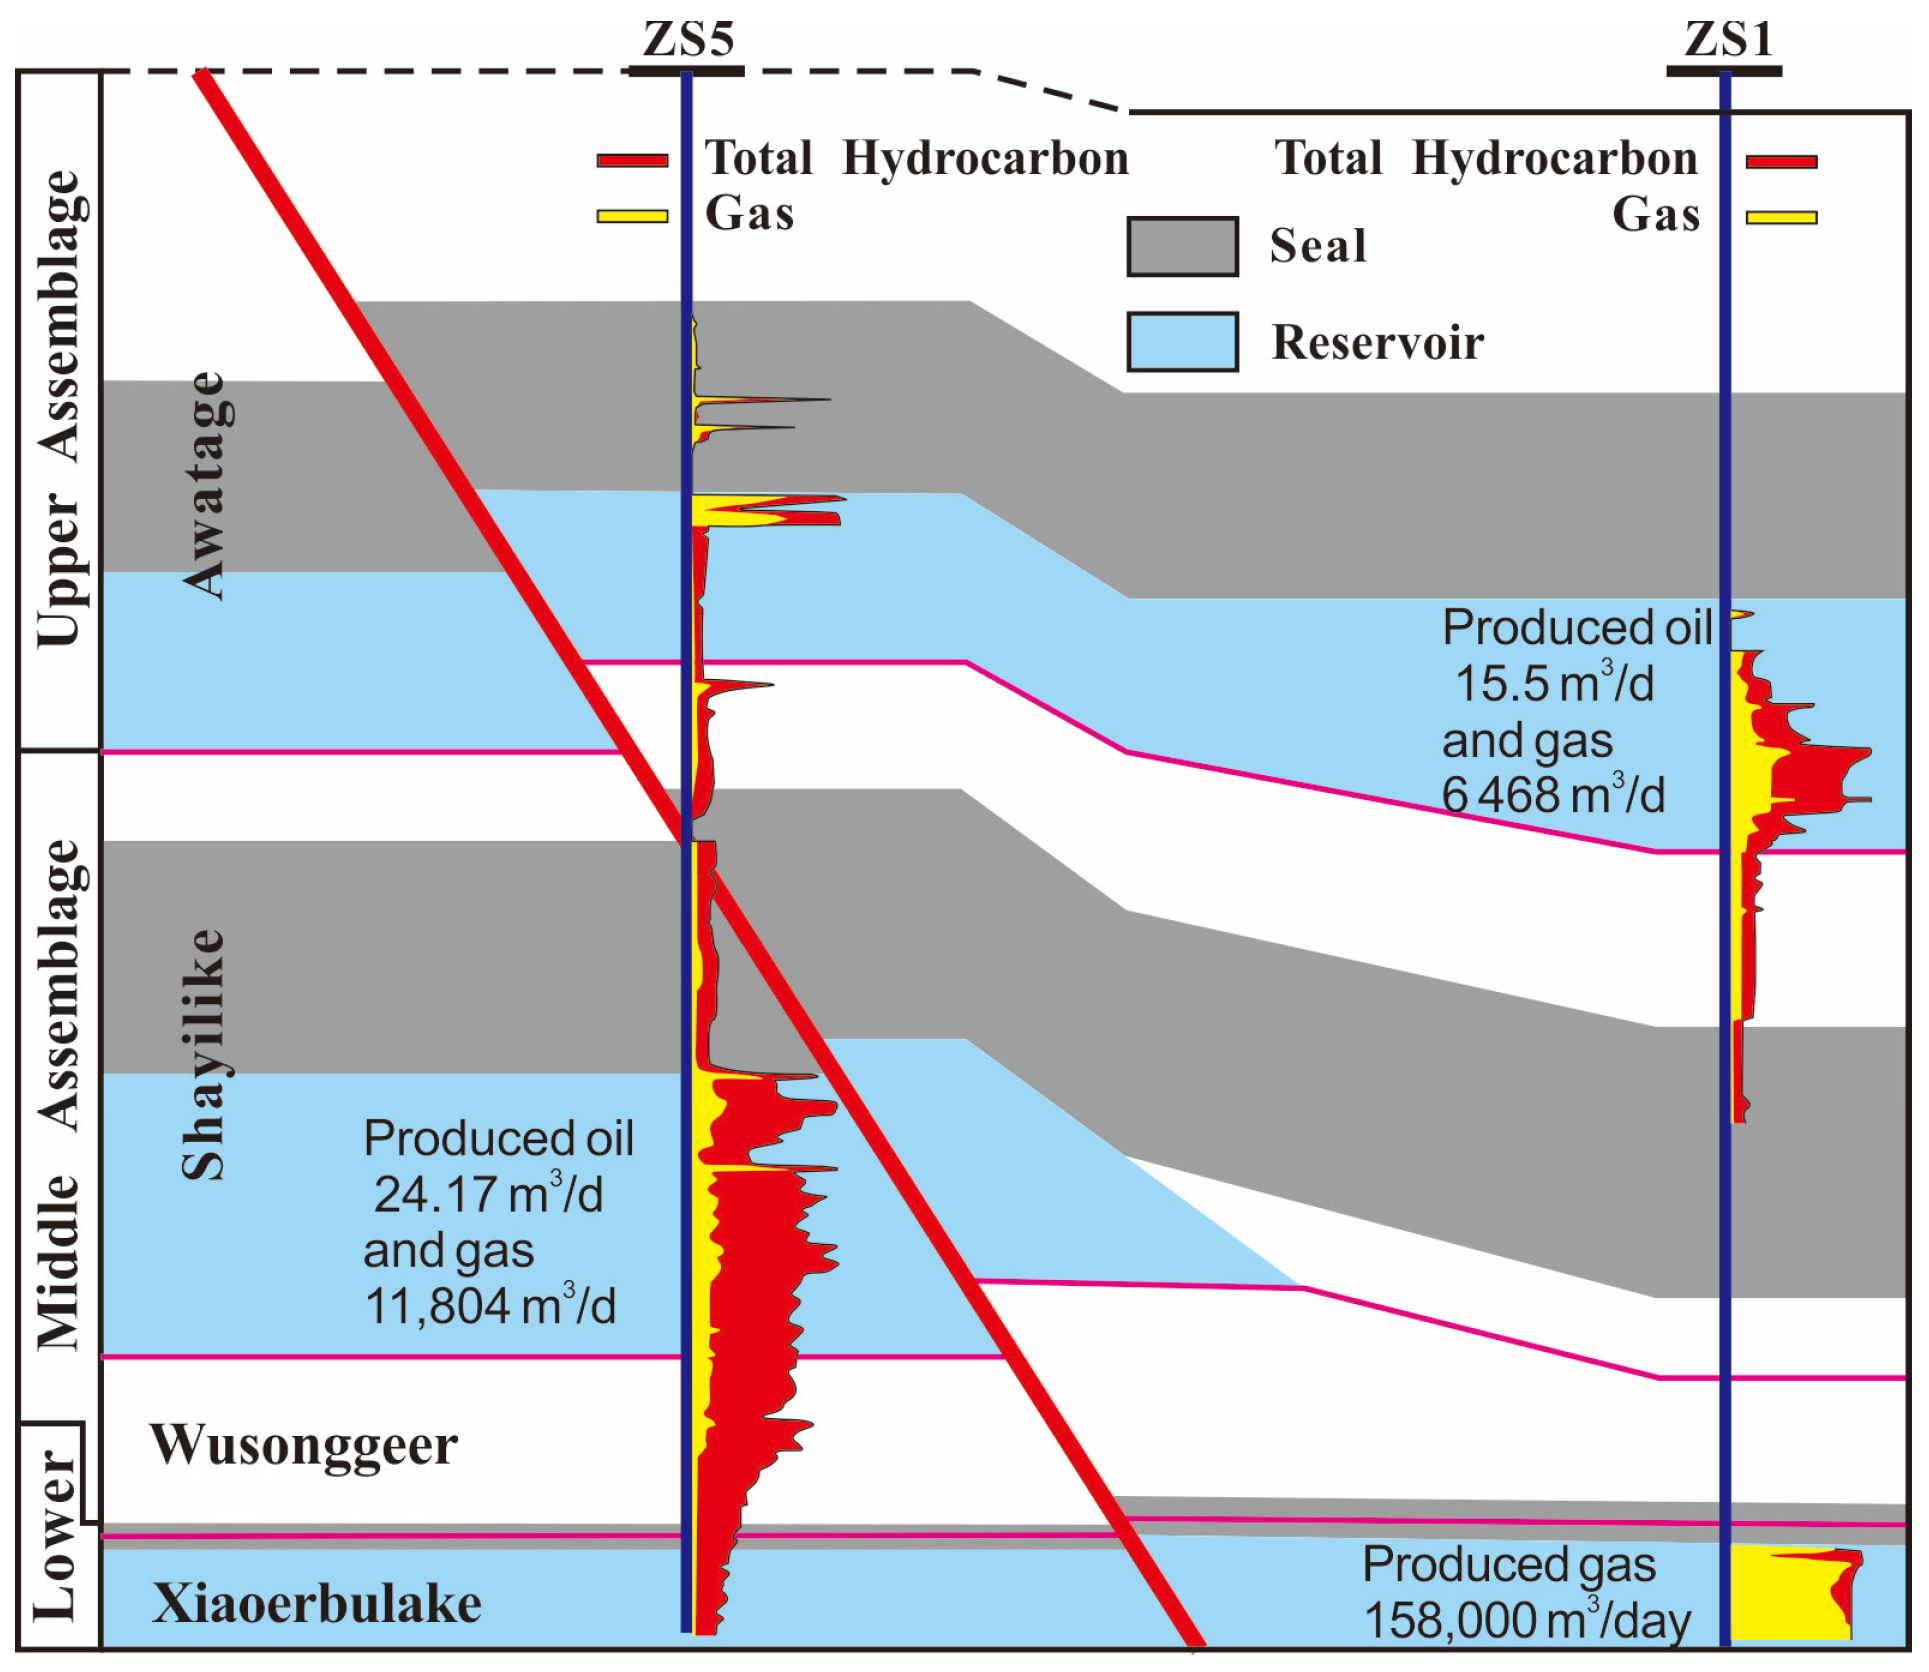
The Middle and Lower Cambrian in the Tazhong area have well source–reservoir–seal assemblages. The Yuertusi Formation at the bottom contains high-quality source rocks, while the Shayilike and Awatage Formations are characterized by widely developed gypsum-bearing rocks acting as a high-quality seal at the top. Meanwhile, the Wusonggeer and Xiaoerbulake Formations are dolomite reservoirs in the middle part. Furthermore, according to the distribution of the pre-salt reservoirs, these strata can be divided into three reservoir–seal assemblages (Figure 2) [8]. In the lower assemblage, the reef beach of the Xiaoerbulake Formation is the reservoir, while some gypsum-bearing rocks above it and the muddy dolomite in the Wusonggeer Formation form a seal. The main gas-producing interval of well ZS1 (gas 158,000 m3/d) is located in this assemblage, but liquid petroleum is contained in this assemblage in well ZS5 (Figure 2). In the middle assemblage, the dolomite or gypsodolomite in the lower part of the Shayilike Formation is the reservoir, and the gypsum-bearing rocks in the upper part act as a seal. This assemblage is the main oil-producing layer of well ZS5 (oil 24.7 m3/d and gas 11,904 m3/d) while little petroleum was found in well ZS1. In the upper assemblage, the dissolved pores in gypsodolomite in the Awatage Formation provide the reservoir space, while dense muddy dolomite forms the seal. The upper oil reservoir of well ZS1 is located in this assemblage producing 15.5 m3/d oil and 6468 m3/d gas.

3. Samples and Methods

Fluid inclusions directly record paleo-fluids, so analyses based on fluid inclusions have become the main method to study fluid activities. In this paper, fluid-inclusion assemblages were used to analyze the hydrocarbon charging of reservoirs underlying salt-bearing layers. Five samples were collected from well ZS5 in the Tazhong area of the Tarim Basin. They came from the reservoirs under the middle gypsum-bearing rock in the Sayilike Formation. The deepest sample was from the Xiaoerbulake Formation at a depth of about 6800 m. All samples were prepared as doubly polished thin sections to observe fluid inclusions more clearly.
In order to understand the characteristics of the hydrocarbon charging of deep reservoirs, a series of experiments were conducted on fluid inclusions on the basis of petrographic observations. In addition, microthermometric measurements, cathodoluminescence, and Raman spectroscopy were also used in this work. Petrographic observations were carried out on a polarizing/fluorescence microscope (DM 2700p, Leica, Wetzlar, Germany). A heating/freezing stage (THMSG600, Linkam, Salfords, UK) was used for microthermometric measurements. The stage was calibrated using synthetic fluid inclusions before measurements. The estimated uncertainty of these measurements was approximately ±0.1 °C at subzero temperatures and ±1 °C at high temperatures [29]. Cathodoluminescence observations were conducted using a CL8200 MK5 microscope (Leica, Wetzlar, Germany). Raman spectra were collected by a laser Raman spectrometer (LabRam-010 Horiba, Kyoto, Japan), which was calibrated with a silicon wafer before collection. The laser used for excitation was 532 nm. Due to the fluorescence influence of the hydrocarbon, the laser intensity was turned down to 1/100 while collecting the hydrocarbon inclusion data.
Fluid-inclusion assemblages, including coexisting aqueous and hydrocarbon inclusions, were selected for thermodynamic analyses. Microthermometric data of aqueous inclusions were interpreted using the equations given by Bodnar and Vityk [30] as implemented in the program “HokieFlincs” [31]. Meanwhile, according to the parameters of oil in the reservoir such as density (0.793 g/cm3) [32] and GOR (gas/oil ratio, 488 m3/m3), we recombined the compositions of gas and oil obtained via gas chromatography to form a new fluid in the PVTsim 20 software as the initial composition of hydrocarbon fluid inclusions (Table 1). In order to generate the composition of hydrocarbon fluid inclusions, some gas was titrated into or out of the initial fluid [24]. The composition of the titrated gas was acquired with a flash of the initial fluid. The corresponding parameters of flash were 1 atmosphere of pressure and a temperature 50 °C higher than the homogenization temperature [33]. Combined with hydrocarbon and aqueous inclusions in an FIA, the trapping temperature and pressure could be calculated through the intersection of the two isochores.

4. Results

4.1. Petrography

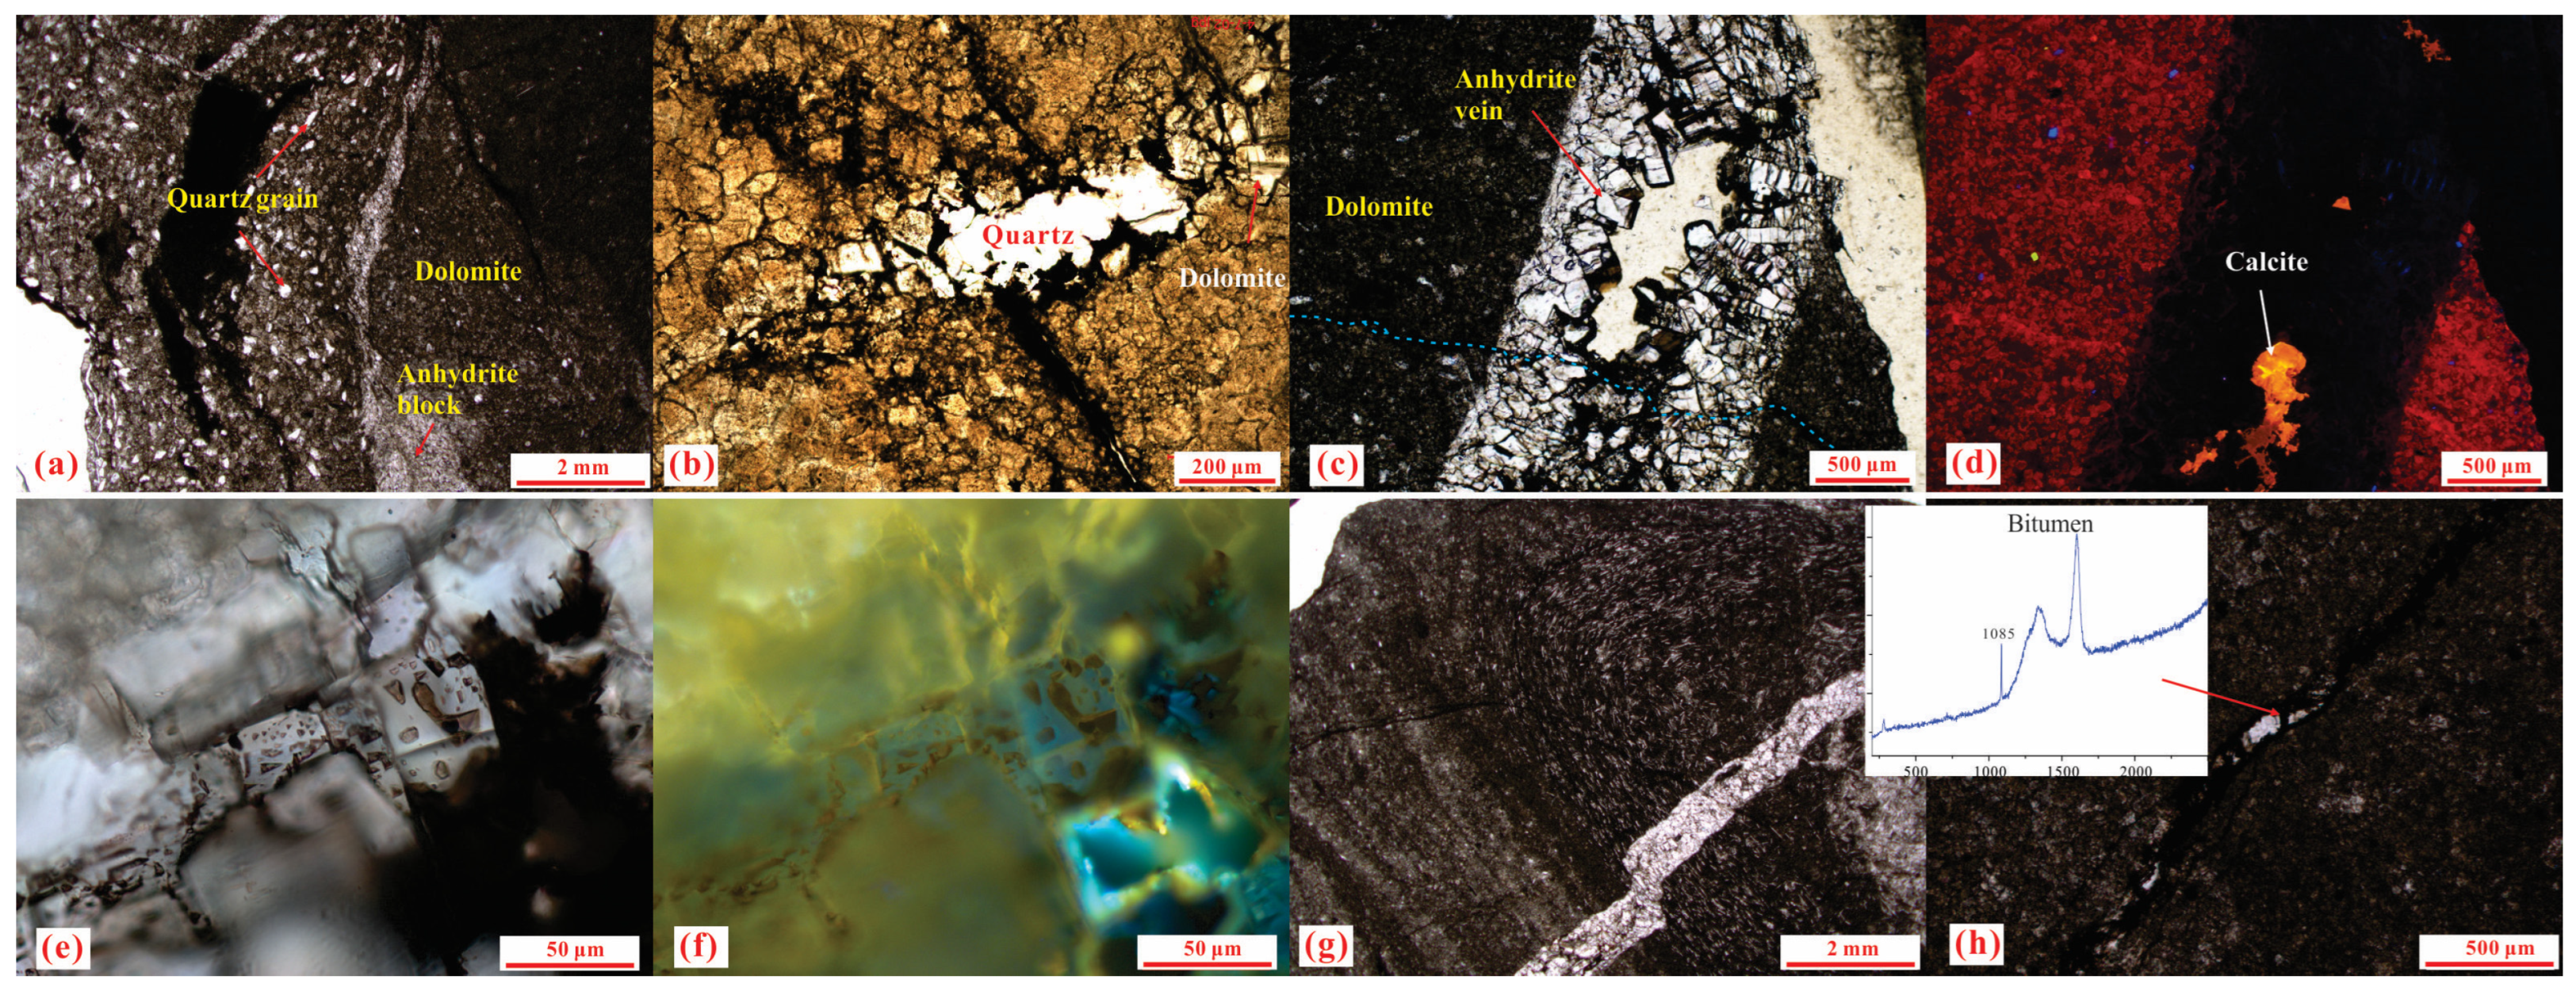
The pre-salt reservoir in the Tazhong area of the Tarim Basin is dominated by dolomite with some sandy dolomite and gypsodolomite (Figure 3a). There are some dissolved pores or caves distributed in the dolomite, partially filled with secondary minerals such as crystal dolomite, quartz, and so on (Figure 3b). Anhydrite veins occur in some samples, formed by the filling of early fractures with anhydrite (Figure 3c,d). Some residual hydrocarbons are also observed in intergranular pores in the anhydrite veins, fluorescing blue-green under UV light (Figure 3e,f). Furthermore, many later structural fractures can be observed in the samples, which cut the anhydrite veins, resulting in dislocation and the re-cracking of the veins (Figure 3c,g). The later fractures are all filled with bitumen, and partially filled with some calcites (Figure 3g,h). The residual bitumen in the fractures indicates that the fractures were once pathways for petroleum migration. Meanwhile, the calcites are usually distributed in the center of the fractures and surrounded by bitumen, indicating that the calcite precipitated during or after hydrocarbon charging.
Fluid inclusions are the most direct records of paleo-fluid activities. Previous studies have found quartz and fluorite in the pores or fractures of the Lower Cambrian reservoirs in the Bachu Uplift, which are rich in gas inclusions containing methane [8], indicating natural gas charging. However, just a few gas inclusions have been observed in our samples while abundant liquid–gas inclusions exist in the secondary minerals, mainly including hydrocarbon and aqueous inclusions. Four types of fluid-inclusion assemblages have been identified. The first is contained in the quartz in dissolved pores or caves with some bitumen (Figure 4a), including a few hydrocarbon inclusions and some aqueous inclusions (Figure 4b). The hydrocarbon inclusions show a dark-brown color, representing heavy oil and early charging. The second type is mainly contained in anhydrite veins. It refers to the coeval aqueous inclusions and the most common gas–liquid two-phase hydrocarbon inclusions with a light-brown color and very small bubbles (Figure 4c), which emit blue-green fluorescence under UV light (Figure 4d). The same hydrocarbon inclusions also occur widely in the cementation of the primary dolomites (Figure 4e,f), demonstrating the majority of hydrocarbon charging. Meanwhile, some three-phase (gas–oil–bitumen) inclusions were found in the anhydrite vein (Figure 4g). They showed the same fluorescence as the two-phase inclusions, while the gas phase and bitumen have no fluorescence (Figure 4h). The big bubble and the existence of bitumen might indicate oil cracking. Thus, it can be inferred that some of the captured hydrocarbon inclusions experienced late adjustment and cracked partially. The fourth type is contained in the calcites in the center of some anhydrite veins. It mainly includes single-phase liquid inclusions at room temperature (20 °C) with blue fluorescence (Figure 4i,j). Just one coeval aqueous inclusion is found in another crystal calcite (Figure 4k). The fourth type includes a few gas inclusions and some coexisting aqueous inclusions (Figure 4l). They are also contained in the quartz in dissolved pores but without bitumen. This FIA might be trapped during late gas charging.

4.2. Microthermometry

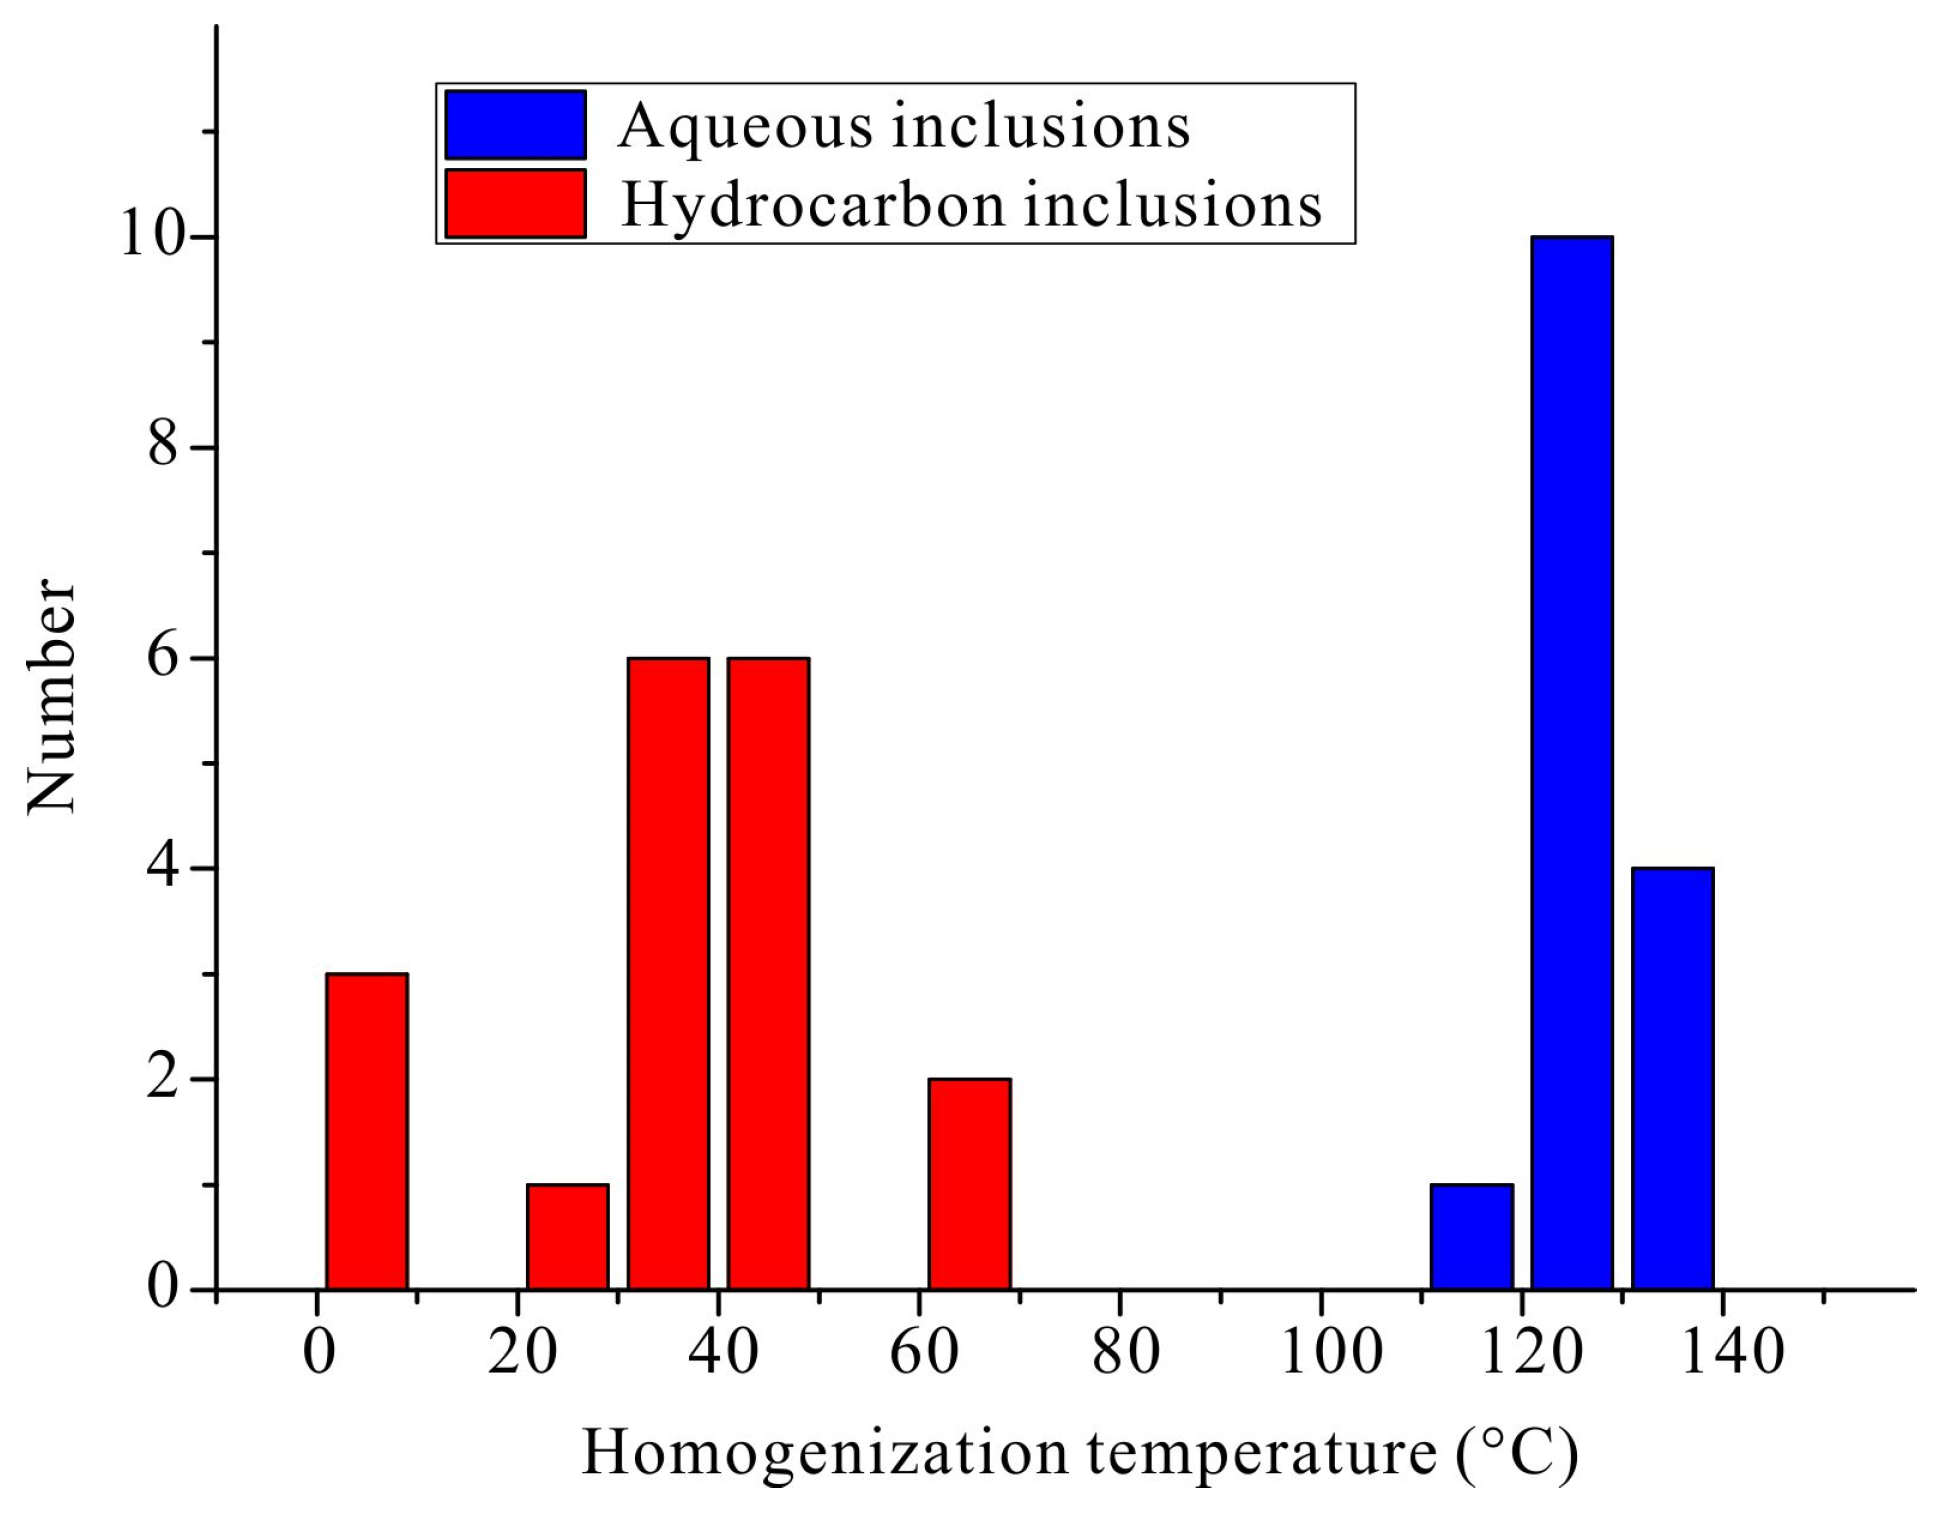
The microthermometric results of all fluid-inclusion assemblages are summarized in Table 2. The first assemblage represents early hydrocarbon charging, though just a few hydrocarbon inclusions are measurable. The second assemblage represents the predominant hydrocarbon charging. These fluid inclusions are mainly hosted in anhydrite, which is a fragile mineral of the gypsum–anhydrite series. However, crystal anhydrite has a similar hardness to fluorite and is more stable than gypsum under normal temperatures in the sedimentary basin. Thus, the microthermometric data of fluid inclusions which are not very big are still reliable. Then, fluid inclusions with a size less than 10 μm were selected for microthermometry. Meanwhile, the homogenization temperatures of the coeval hydrocarbon inclusions in the dolomite were similar to the ones in anhydrite, further verifying the reliability of the microthermometric data of the second FIA. The single-phase oil inclusions in the third FIA had bubbles that separated out during freezing and homogenized at 8–9 °C during heating. The distribution of the homogenization temperatures of the first three FIAs is shown in Figure 5. The homogenization temperatures and salinities of the fourth FIA show obvious distinction from the first three FIAs, representing the gas-bearing fluid activities.

4.3. PVT Simulation

To reconstruct the physico-chemical conditions of petroleum charging, pressure–volume–temperature (PVT) simulations of FIAs were conducted. In this study, considering the influence of the TSR on petroleum [34], the oil and gas in the reservoirs were recombined according to the fluid properties (such as density and gas/oil ratio) to form the initial fluid. Then, the compositions of hydrocarbon inclusions were simulated using the method described by Chen et al. to minimize error [24]. The isochores of HIs could subsequently be drawn. Combined with the thermodynamic properties of aqueous inclusions [30,31], the trapping temperatures and pressures of the FIAs were calculated. The simulation results are shown in Figure 6 and Table 3. Because the salinities of the aqueous inclusions in the first three FIAs are nearly equal, their L-V curves overlap each other. Furthermore, there are only aqueous inclusions in the fourth FIA, so the PVT simulation method described above is no longer available. Here, we just calculate the trapping temperature of this FIA based on Ge’s and Chen’s works for temperature correction [22,35]. The results are also listed in Table 3.

5. Discussion

5.1. Petroleum Charging Process and Overpressure Formation

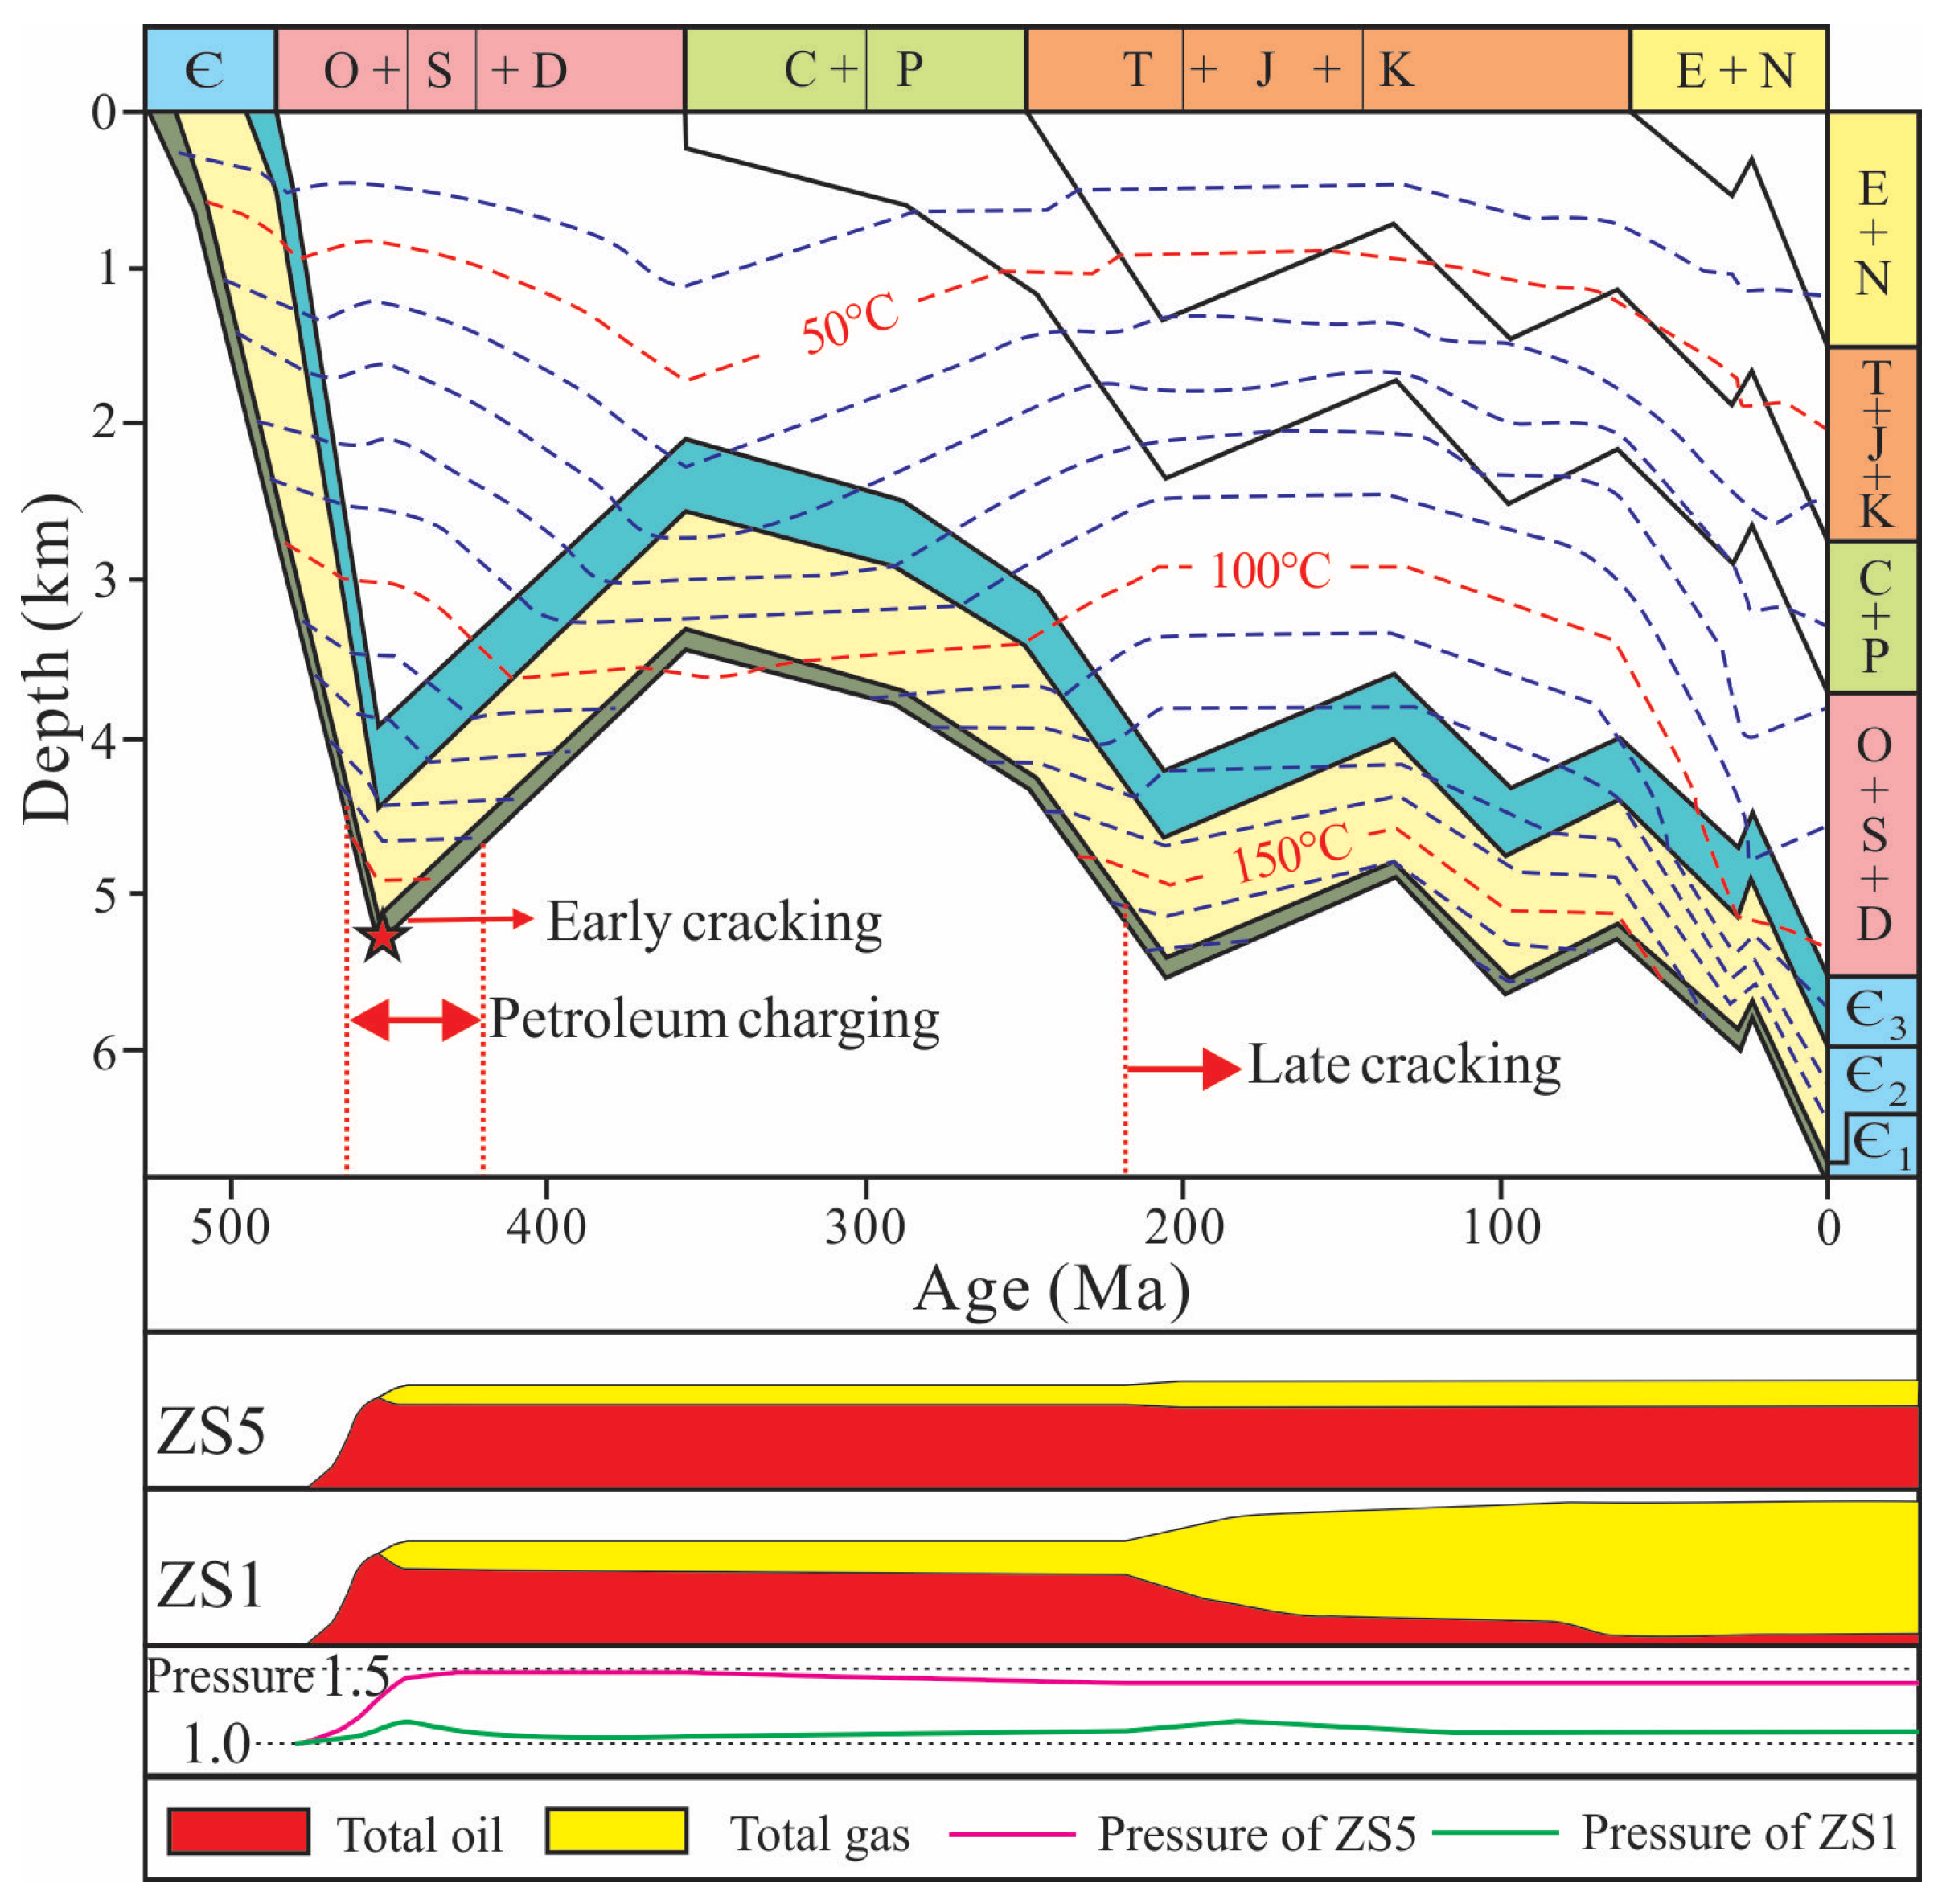
Previous studies reported two hydrocarbon charging periods in the Lower Paleozoic in the Tazhong area, early petroleum charging and late pyrolysis gas charging [1,8,36]. The early petroleum charging occurred from the Early Ordovician to the Late Silurian with slight oil cracking, while significant oil cracking began in the Early Jurassic period [1,8,36]. The recent U-Pb dating of calcite [37,38,39,40] and the Re-Os dating of heavy oil [41] showed similar results to these studies. In this study, we also obtained a similar result. As shown in Figure 5, the homogenization temperatures of hydrocarbon inclusions showed three obvious peaks, illustrating three hydrocarbon-bearing fluid activities in the early hydrocarbon accumulation. Combined with the burial and thermal history [8], the data from the PVT simulation can be used to analyze the period and characteristics of the fluid activities (Figure 7). According to the acquired PVT simulation results, the first three FIAs were formed between 146.2 and 158.3 °C, a very narrow temperature range, indicating short and rapid charging. Meanwhile, the fourth FIA formed at about 167 °C. Based on the projection of these data on the thermal history, the hydrocarbon charging periods may be from the Middle Ordovician to the Late Silurian and from the Late Triassic to the Late Jurassic. Moreover, the period from Ordovician to Silurian is considered a tectonically active period when the faults in the Tazhong area were formed [19,42]. Therefore, by considering the previous isotopic chronology and geological factors, such as tectonics [19,42] and maturity [8,20,21], it can be inferred that the first three FIAs were trapped in the petroleum charging period (from Middle to Late Ordovician) and the fourth FIA was trapped in the late cracking period (Late Triassic to Late Jurassic).
The trapping temperatures of the first three FIAs only showed a small difference, but their trapping pressure environments were evidently different. The first FIA was captured at about 146 °C and 470 bar, which was a hydrostatic pressure condition (the pressure coefficient was 1.02). The second FIA was captured at about 158 °C and 638 bar at paleo-burial depths of 5350 m, and the pressure coefficient was 1.19. The third FIA was captured at about 153 °C and 790 bar at a paleo-burial depth of 5300 m, with a pressure coefficient of 1.49. This is a relatively high pressure coefficient for the Tarim Basin. The increased pressure might be mainly derived from the injection of abundant petroleum from deeper source rocks and partially from slight oil cracking. The Yuertusi Formation was considered to be the main source rock for the reservoirs in the Middle and Lower Cambrian [15,21,27]. However, this formation did not exist under the reservoirs in the Tazhong Uplift. The petroleum was derived from the nearby depression, in which the source rock was at least 1000 m deeper than the reservoirs in the uplift [8,43]. Therefore, the fluids expelled from deeper source rocks had overpressure for shallower reservoirs.
Combined with the petrography and PVT simulation data of fluid inclusions, the process of fluid activity was also analyzed. Three continuous stages were distinguished in the early petroleum charging period. The first was the beginning charging stage, when the petroleum generated from the deeper source rocks began to migrate to the reservoir. The existing pores or caves in the reservoirs were primarily filled under normal pressure. The second was a rapid charging stage. During this period, fault activity was very strong and induced some fractures in the reservoirs. Because the fractures were open in the beginning, the petroleum could migrate smoothly and rapidly. Some hydrocarbon inclusions were trapped in anhydrite, which precipitated in the fractures. With the continuous charging of hydrocarbons in the reservoirs, the fluid pressure gradually increased to create an overpressure environment and equilibrium was reached. This stage lasted the longest and the most hydrocarbon inclusions were captured in anhydrite veins and some dolomite cementations. The third was the blocked charging stage. Just a few calcite crystals containing single-phase liquid hydrocarbon inclusions precipitated in the center of the vein, with some bitumen being left surrounding some crystals, indicating that the veins were about to be sealed in this stage. When the formation temperature increased to nearly 160 °C, the oil in the reservoirs began to crack [8], intensifying the overpressure environment. The overpressure and nearly sealed fractures blocked petroleum migration, leading to the formation of some single-phase hydrocarbon inclusions in the calcite. Subsequently, the hydrocarbon-bearing fluid activities weakened or even stagnated with the uplift of the formation. Since the Late Triassic, the formation temperature has exceeded 160 °C due to formation subsidence since the Carboniferous period. Part of the petroleum in the reservoirs cracked and left some residual bitumen in the reservoirs or inclusions.

5.2. The Role of Overpressure in the Preservation of Liquid Petroleum

Deep reservoirs have been important targets for petroleum exploration in the Tarim Basin in recent years [5,6,44]. In general, it is considered that the lower limit of oil preservation is about 6000 m (corresponding to 160 °C). Reservoirs deeper than this threshold usually contain condensate or gas. For this reason, deep exploration generally focuses on natural gas. However, abundant petroleum has been successively obtained from Ordovician reservoirs with buried depths of >8000 m in several wells, such as ManShen-1 and ManShen-3 in the North Depression of the Tarim Basin. These reservoirs are all dominated by oil without cracking or with slight cracking, indicating that liquid petroleum can still exist in deep reservoirs. Based on experiments, Zhu et al. found that the lower depth limit of liquid petroleum preservation could reach 9000 m in a basin with a low geothermal gradient and rapid subsidence [4]. The geothermal gradient in the Tarim Basin is generally very low, at about 2.2 °C/100 m [27,45]. On top of that, the basin subsided rapidly from the Cambrian to the Early Ordovician period, and the thickness of overlying strata increased by more than 5000 m. This is very favorable for the preservation of deep petroleum [27,45].
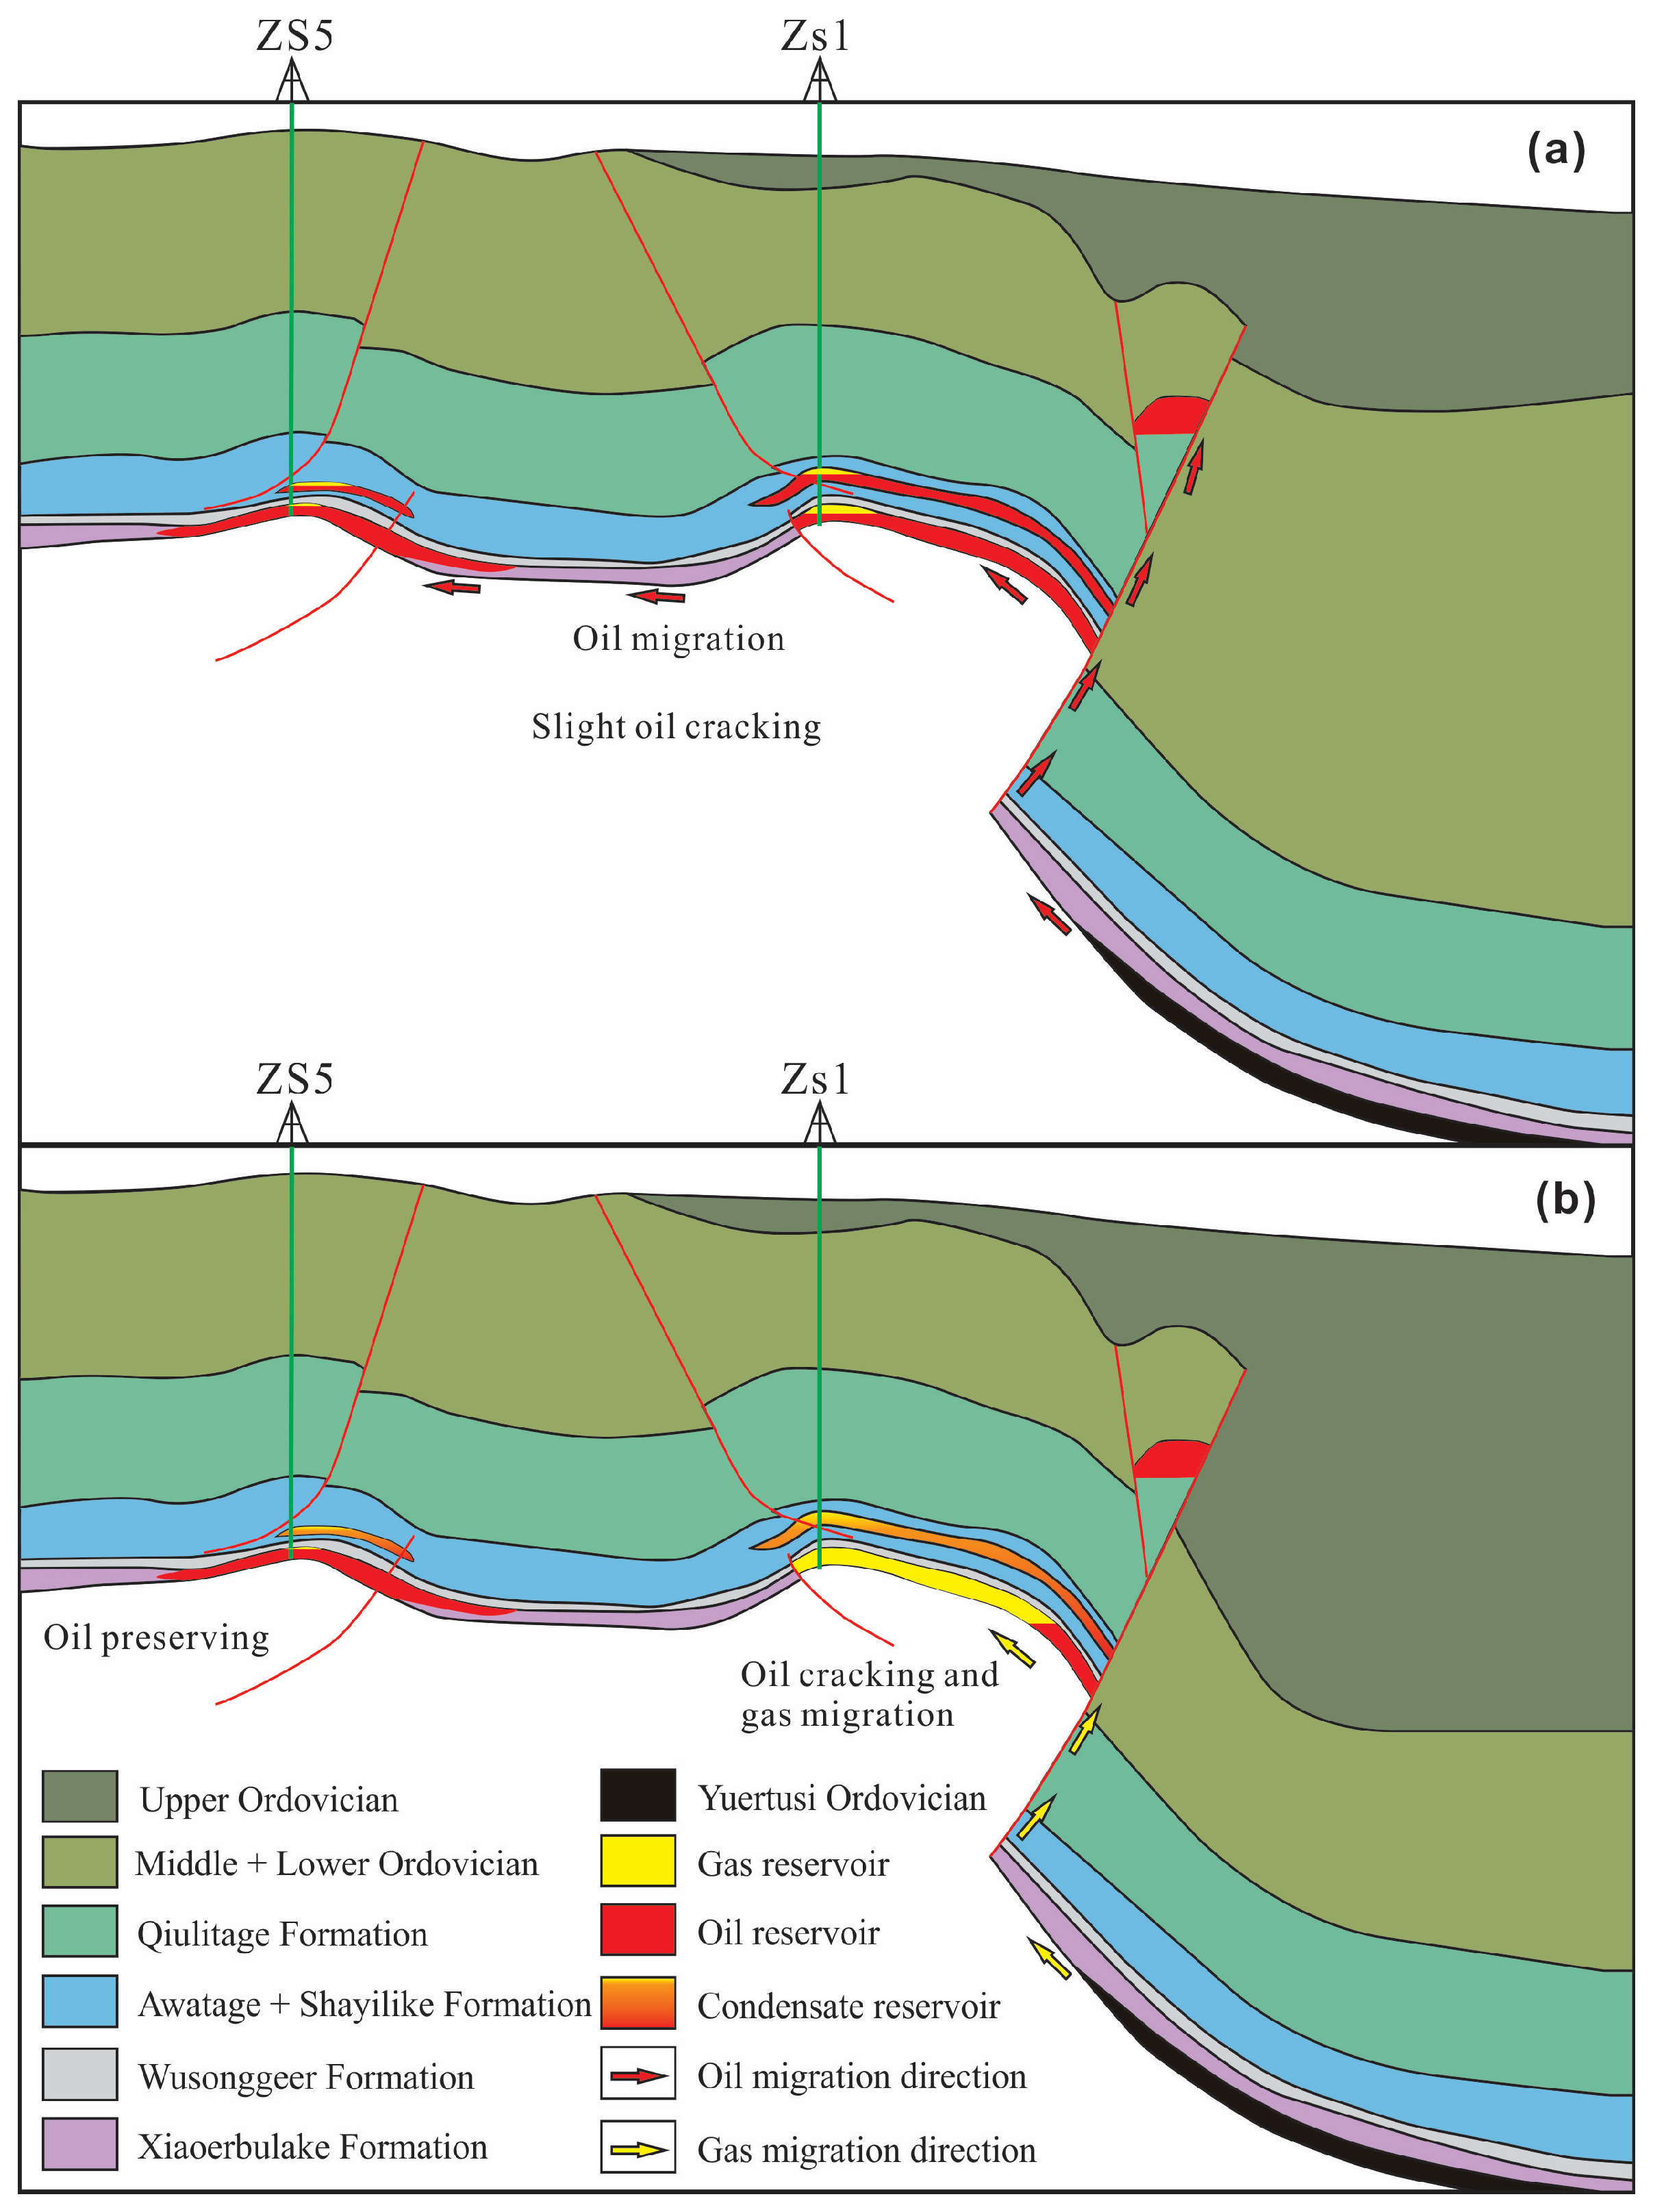
In this study, just a few hydrocarbon inclusions in the samples were cracked with some residual bitumen. This result indicates that large-scale liquid petroleum cracking has not occurred in the deep pre-salt reservoirs in well ZS5. On the one hand, the preservation of liquid petroleum benefits from the low geothermal gradient while, on the other hand, overpressure also plays a key role. The PVT simulation results of FIAs in well ZS5 indicate that overpressure formed during petroleum charging. Most inclusions still maintained their original characteristics at high formation temperatures in the later stage, indicating that overpressure might have inhibited oil cracking. In contrast, the formation pressure of the Lower Cambrian in well ZS1 is about 750 bar with a pressure coefficient of 1.10, which is normal pressure or slight overpressure. The reservoir mainly contains natural gas with some liquid oil in the deep. Such differences between the two wells illustrate the manifestation of different hydrocarbon-bearing fluid activities. Wells ZS1 and ZS5 are both located in the ZS block, Tazhong Uplift, with similar geological settings. The petroleum was mainly derived from the Yuertusi Formation in the deeper depression [14,15,16,20,21,27]. Obviously, overpressure in well ZS5 protected the early liquid oil from cracking and, meanwhile, blocked the charging of pyrolysis gas from the source rocks. However, the pyrolysis gas migrated into the reservoirs of well ZS1 rather than well ZS5. This might be due to the decompression through the fault cutting the reservoir in well ZS1 (Figure 8). Therefore, overpressure was considered to be the main factor for the preservation of liquid petroleum in well ZS5.
In conclusion, the deep evaporites in the Tarim Basin exerted key influences on sealing the lower reservoirs and faults, which was conducive to preserving overpressure in the lower formations. In addition, the basin gradually cooled in the Cenozoic period, which further helped to preserve the deep ancient oil reservoirs. Consequently, there is still oil exploration potential in these deep reservoirs, especially in paleouplift areas that may have formed ancient oil accumulations early. These reservoirs have been important targets for petroleum exploration. For instance, after wells ZS1 and ZS5 successively produced oil in the Lower Cambrian, abundant light oil was obtained from well LT1 in Lower Cambrian dolomite reservoirs in the Tabei Uplift in 2020 [13], which significantly encouraged deep exploration in the uplift area of the Tarim Basin. Meanwhile, this study also provides a good case for petroleum exploration in other similar reservoirs.

6. Conclusions

According to the thermodynamic simulation of fluid-inclusion assemblages in the pre-salt reservoirs in the Tazhong area of the Tarim Basin, the hydrocarbon-bearing fluid activities of pre-salt reservoirs include an early petroleum charging period and a late adjustment period. The early petroleum charging process can be divided into three stages dominated by overpressure, namely beginning charging, rapid charging, and blocked charging. Overpressure is mainly derived from petroleum injection and partially from oil cracking. Petroleum charging mainly occurred from the Late Ordovician to the Late Silurian periods. Since the Early Triassic, the reservoirs have entered an adjustment period.
Overpressure plays a key role in the preservation of liquid hydrocarbons. More specifically, it prevents the oil from cracking and inhibits the charging of pyrolysis gas from source rocks. Consequently, the hydrocarbons in wells ZS5 and ZS1 showed different phases. Therefore, there is still substantial potential for oil exploration in the deep reservoirs of the Tarim Basin.

Author Contributions

Conceptualization, Z.Z. and J.Z.; methodology, Z.Z.; software, P.S.; formal analysis, Z.Z. and X.C.; investigation, J.Z. and Z.Z.; resources, Z.Z.; data curation, P.S. and X.C.; writing—original draft preparation, Z.Z. and P.S.; writing—review and editing, Z.Z. and C.Z.; visualization, Z.Z.; supervision, Z.Z.; project administration, Z.Z. and J.Z.; funding acquisition, Z.Z. and X.C. All authors have read and agreed to the published version of the manuscript.

Funding

This research was jointly funded by the Open Research Fund of State Key Laboratory of Deep Oil and Gas (SKLDOG2024-KFYN-03), the Open Fund Project of Key Laboratory of Carbonate Reservoirs, CNPC (RIPED-2022-JS-2381), the National Natural Science Foundation of China (42272172), and the Shandong Provincial Natural Science Foundation (ZR2023QD065).

Data Availability Statement

The data range is contained in the article, and the detailed dataset is available upon request from the corresponding author due to research requirements of the oil field.

Acknowledgments

The authors would like to thank Tong Lin in CNPC for providing some samples.

Conflicts of Interest

Author Jianyong Zhang was employed by the company PetroChina Hangzhou Research Institute of Geology. The remaining authors declare that the research was conducted in the absence of any commercial or financial relationships that could be construed as a potential conflict of interest.

References

  1. Lu, X.S.; Liu, K.Y.; Zhao, M.J.; Zhang, B.S.; Chen, Y.; Fan, J.J.; Li, X.L. Accumulation mechanism analysis of the typical deep reservoirs in Tarim Basin. J. Northeast Pet. Univ. 2016, 40, 62–73. [Google Scholar]
  2. Luo, X.R.; Yang, H.J.; Wang, Z.L.; Zhang, L.Q.; Zhang, L.K.; Lei, Y.H.; Zhou, L.; Zhang, B.S.; Yan, Y.M.; Cao, B.F.; et al. Heterogeneity characteristics of clastic reservoirs and hydrocarbon accumulation mode in deep-ultradeep basins. Acta Geol. Sin. 2023, 97, 2802–2819. [Google Scholar] [CrossRef]
  3. Li, Q.C.; Li, Y.D.; Cheng, Y.F.; Li, Q.; Wang, F.L.; Wei, J. Numerical simulation of fracture reorientation during hydraulic fracturing in perforated horizontal well in shale reservoirs. Energy Sources Part A 2018, 40, 1807–1813. [Google Scholar] [CrossRef]
  4. Zhu, G.Y.; Yang, H.J.; Su, J.; He, K.; Han, J.F.; Gu, L.J.; Zhu, Y.F.; Zhang, B.T. True exploration potential of marine oils in the Tarim Basin. Acta Petrol. Sin. 2012, 28, 1333–1347. [Google Scholar]
  5. Sun, L.D.; Zou, C.N.; Zhu, R.K.; Zhang, Y.H.; Zhang, S.C.; Zhang, B.M.; Zhu, G.Y.; Gao, Z.Y. Formation, distribution and potential of deep hydrocarbon resources in China. Pet. Explor. Dev. 2013, 40, 687–695. [Google Scholar] [CrossRef]
  6. Ren, Z.L.; Cui, J.P.; Qi, K.; Yang, G.L.; Chen, Z.J.; Yang, P.; Wang, K. Control effects of temperature and thermal evolution history of deep and ultra-deep layers on hydrocarbon phase state and hydrocarbon generation history. Nat. Gas Ind. 2021, 7, 453–461. [Google Scholar] [CrossRef]
  7. Gu, Y.; Wan, Y.L.; Huang, J.W.; Zhuang, X.B.; Wang, B.; Li, M. Prospects for ultra-deep oil and gas in the “deep burial and high pressure” Tarim Basin. Pet. Geol. Exp. 2019, 41, 157–164. [Google Scholar]
  8. Lin, T.; Wang, T.S.; Li, Z.S.; Yuan, W.F.; Ma, W.; Xu, Z.H.; Li, Q.F. Hydrocarbon filling evolution and exploration direction of the middle-lower Cambrian interval in Tazhong area, Tarim Basin. J. China Univ. Pet. Ed. Nat. Sci. 2021, 45, 42–54. [Google Scholar]
  9. Yi, S.W.; Li, M.M.; Guo, X.J.; Yang, F.; Miao, W.D.; Lin, S.G.; Gao, Y. Breakthrough direction of Cambrian pre-salt exploration fields in Tarim Basin. Acta Pet. Sin. 2019, 40, 1281–1295. [Google Scholar]
  10. Wang, Z.M.; Xie, H.W.; Chen, Y.Q.; Qi, Y.M.; Zhang, K. Discovery and Exploration of Cambrian Subsalt Dolomite Original Hydrocarbon Reservoir at Zhongshen-1 Well in Tarim Basin. China Pet. Explor. 2014, 19, 1–13. [Google Scholar]
  11. Ma, A.L.; Jin, Z.J.; Liu, J.Z. Hydrocarbon phase in the deep Cambrian of the Tarim Basin. Pet. Geol. Exp. 2015, 37, 681–688. [Google Scholar]
  12. Guan, S.W.; Zhang, C.Y.; Ren, R.; Zhang, S.C.; Wu, L.; Wang, L.; Ma, P.L.; Han, C.W. Early Cambrian syndepositional structure of the northern Tarim Basin and a discussion of Cambrian subsalt and deep exploration. Pet. Explor. Dev. 2019, 46, 1075–1086. [Google Scholar] [CrossRef]
  13. Yang, H.J.; Chen, Y.Q.; Tian, J.; Du, J.H.; Zhu, Y.F.; Li, H.H.; Pan, W.Q.; Yang, P.F.; Li, Y.; An, H.T. An important discovery in Well Luntan-1 of the Tarim Basin, China, and its significance for ultra-deep oil and gas exploration. China Pet. Explor. 2020, 5, 62–72. [Google Scholar]
  14. Zhang, J.Z.; Wang, Z.M.; Yang, H.J.; Xu, Z.M.; Xiao, Z.Y.; Li, Z.X. Origin and differential accumulation of hydrocarbons in Cambrian sub-salt dolomite reservoirs in Zhongshen Area, Tarim Basin, NW China. Pet. Explor. Dev. 2017, 44, 40–47. [Google Scholar] [CrossRef]
  15. Song, D.F.; Wang, T.G.; Li, M.J. Geochemistry and possible origin of the hydrocarbons from Wells Zhongshen1 and Zhongshen1C, Tazhong Uplift. Sci. China Earth Sci. 2016, 46, 107–117. [Google Scholar] [CrossRef]
  16. Shi, J.L.; Li, J.; Li, Z.S.; Hao, A.S. Geochemical characteristics and origin of the deep Cambrian oil and gas in the Tazhong Uplift, Tarim Basin. Oil Gas Geol. 2017, 38, 302–310. [Google Scholar]
  17. Jiang, T.W.; Han, J.F.; Wu, G.H.; Yu, H.F.; Su, Z.; Xiong, C.; Chen, J.; Zhang, H.F. Differences and controlling factors of composite hydrocarbon accumulations in the Tazhong uplift, Tarim Basin, NW China. Pet. Explor. Dev. 2020, 47, 229–241. [Google Scholar] [CrossRef]
  18. Yang, P.; Wu, G.H.; Ren, Z.L.; Zhou, R.J.; Zhao, J.X.; Zhang, L.P. Tectono-thermal evolution of Cambrian-Ordovician source rocks and implications for hydrocarbon generation in the eastern Tarim Basin, NW China. J. Asian Earth Sci. 2020, 194, 104267. [Google Scholar] [CrossRef]
  19. Yang, P.; Wu, G.H.; Nuriel, P.; Nguyen, A.D.; Chen, Y.Q.; Yang, S.; Feng, Y.X.; Ren, Z.L.; Zhao, J.X. In situ LA-ICPMS U-Pb dating and geochemical characterization of fault-zone calcite in the central Tarim Basin, northwest China: Implications for fluid circulation and fault reactivation. Chem. Geol. 2021, 568, 120125. [Google Scholar] [CrossRef]
  20. Chen, F.R.; Zhang, Y.J.; Zhu, G.Y.; Zhang, B.S.; Lu, Y.H.; Zhang, Z.Y. Geochemistry and accumulation process of deep natural gas in the platform-basin region, Tarim Basin. Nat. Gas Geosci. 2018, 29, 880–891. [Google Scholar]
  21. Han, J.F.; Wu, G.H.; Yang, H.J.; Dai, L.; Su, Z.; Tang, H.; Xiong, C. Type and genesis of condensate gas reservoir in the Tazhong uplift of the Tarim Basin. Nat. Gas Ind. 2021, 41, 24–32. [Google Scholar]
  22. Chen, Y.; Steele-Macinnis, M.; Ge, Y.J.; Zhou, Z.Z.; Zhou, Y.Q. Synthetic saline-aqueous and hydrocarbon fluid inclusions trapped in calcite at temperatures and pressures relevant to hydrocarbon basins: A reconnaissance study. Mar. Pet. Geol. 2016, 76, 88–97. [Google Scholar] [CrossRef]
  23. Tian, T.; Yang, P.; Ren, Z.L.; Fu, D.L.; Zhou, S.X.; Yang, F.; Li, J. Hydrocarbon migration and accumulation in the Lower Cambrian to Neoproterozoic reservoirs in the Micangshan tectonic zone, China: New evidence of fluid inclusions. Energy Rep. 2020, 6, 721–733. [Google Scholar] [CrossRef]
  24. Chen, X.L.; Zhou, Z.Z.; Xia, H.Y.; Chen, Y.; Wang, J. A new view of trapping pressure estimation using PVT simulation of hydrocarbon inclusions in petroliferous basins. J. Pet. Sci. Eng. 2021, 204, 108715. [Google Scholar] [CrossRef]
  25. He, D.F.; Jia, C.Z.; Li, D.S. Formation and evolution of polycyclic superimposed Tarim Basin. Oil Gas Geol. 2005, 26, 64–77. [Google Scholar]
  26. Li, S.; Amrani, A.; Pang, X.; Yang, H.; Said-Ahmad, W.; Zhang, B.; Pang, Q. Origin and quantitative source assessment of deep oils in the Tazhong Uplift, Tarim Basin. Org. Geochem. 2015, 78, 1–22. [Google Scholar] [CrossRef]
  27. Zhu, G.Y.; Li, J.F.; Zhang, Z.Y. Origin of deep oil and gas phase state diversity and evaluation of secondary geochemical intensity—A case study of marine oil and gas in Tarim Basin. Earth Sci. 2021. Available online: https://kns.cnki.net/kcms/detail/42.1874.P.20211108.1622.004.html (accessed on 9 November 2021).
  28. Zheng, M.L.; Wang, Y.; Jin, Z.J.; Li, J.C.; Zhang, Z.P.; Jiang, H.S.; Xie, D.Q.; Guo, X. Superimposition, evolution and petroleum accumulation of Tarim Basin. Oil Gas Geol. 2014, 35, 925–933. [Google Scholar]
  29. Chen, X.L.; Zhou, Z.Z.; Chen, Y.; Barrier, J.; Steele-MacInnis, M. Fluid boiling during high-grade gold deposition in an epithermal gold-telluride deposit, Guilaizhuang, China. J. Geochem. Explor. 2022, 240, 107048. [Google Scholar] [CrossRef]
  30. Bodnar, R.J.; Vityk, M.O. Interpretation of microthermometric data for H2O-NaCl fluid inclusions. In Fluid Inclusions in Minerals, Methods and Applications; De Vivo, B., Frezzotti, M.L., Eds.; Virginia Tech: Blacksburg, VA, USA, 1994; pp. 117–130. [Google Scholar]
  31. Steele-MacInnis, M.; Lecumberri-Sanchez, P.; Bodnar, R.J. HokieFlincs_H2O-NaCl: A Microsoft Excel spreadsheet for interpreting microthermometric data from fluid inclusions based on the PVTX properties of H2O-NaCl. Comput. Geosci. 2012, 49, 334–337. [Google Scholar] [CrossRef]
  32. Wang, D.W.; Wang, T.G.; Li, M.J.; Song, D.F.; Shi, S.B. The distribution of chrysene and methylchrysenes in oils from wells ZS5 and ZS1 in the Tazhong Uplift and its implications in oil-to-source correlation. Geochimica 2016, 45, 451–461. [Google Scholar]
  33. Aplin, A.C.; Macleod, G.; Larter, S.R.; Pedersen, K.S.; Sorensen, H.; Booth, T. Combined use of confocal laser scanning microscopy and PVT simulation for estimating the composition and physical properties of petroleum in fluid inclusions. Mar. Pet. Geol. 1999, 16, 97–110. [Google Scholar] [CrossRef]
  34. Cai, C.F.; Hu, G.Y.; Li, H.X.; Jiang, L.; He, W.X.; Zhang, B.S.; Jia, L.Q.; Wang, T.K. Origins and fates of H2S in the Cambrian and Ordovician in Tazhong area: Evidence from sulfur isotopes, fluid inclusions and production data. Mar. Pet. Geol. 2015, 67, 408–418. [Google Scholar] [CrossRef]
  35. Ge, Y.J. Trapping Mechanism of Hydrocabon Inclusion in Carbonate and Its Response to Hydrocarbon Accumulation. Ph.D. Thesis, China University of Petroleum, Qingdao, China, 2010. [Google Scholar]
  36. Liang, Y.L.; Wu, N.; Feng, Y.; Wang, S.P.; Wang, J. Hydrocarbon Accumulation Period of Cambrian in Zhongshen 5 Well in Tazhong Area. Xinjiang Geol. 2019, 37, 226–230. [Google Scholar]
  37. Chen, J.X.; Wang, B.; Guo, X.W.; Cao, Z.C.; Liu, Y.L.; Geng, F.; Zhang, X.Y.; Xu, H.; Zhao, J.X. Application of laser in-situ U-Pb dating of calcite to determination of the absolute time of hydrocarbon accumulation in polycyclic superimposed basins: A case study on Tahe oilfield, Tarim Basin. Oil Gas Geol. 2021, 42, 1365–1375. [Google Scholar]
  38. Yang, P.; Liu, K.Y.; Zhen, L.; Rankenburg, K.; McInnes, B.I.A.; Liu, J.L.; Evans, N.J. Direct dating Paleo-fluid flow events in sedimentary basins. Chem. Geol. 2022, 588, 120642. [Google Scholar] [CrossRef]
  39. Wei, D.; Gao, Z.Q.; Zhang, L.L.; Fan, T.L.; Wang, J.B.; Zhang, C.; Zhu, D.Y.; Ju, J.H.; Luo, W.J. Application of blocky calcite vein LA-MC-ICP-MS U-Pb dating and geochemical analysis to the study of tectonic-fult-fluid evolutionary history of the Tabei Uplift, Tarim Basin. Sediment. Geol. 2023, 453, 106425. [Google Scholar] [CrossRef]
  40. Zheng, J.F.; Wang, H.; Shen, A.J.; Luo, X.Y.; Cheng, Z.; Dai, K. Genesis of Dolomite Reservoir in Ediacaran Chigbrak Formation of Tarim Basin, NW China: Evidence from U–Pb Dating, Isotope and Element Geochemistry. Minerals 2023, 13, 725. [Google Scholar] [CrossRef]
  41. Wang, J.; Ma, L.B.; Tao, C.; Liu, W.H.; Dong, Q.W. Generation Time and Accumulation of Lower Paleozoic Petroleum in Sichuan and Tarim Basins Determined by Re–Os Isotopic Dating. Processes 2023, 11, 1472. [Google Scholar] [CrossRef]
  42. Wu, G.H.; Ma, B.S.; Han, J.F.; Guan, B.Z.; Chen, X.; Yang, P.; Xie, Z. Origin and growth mechanisms of strike-slip faults in the central Tarim cratonic basin, NW China. Pet. Explor. Dev. 2021, 48, 595–607. [Google Scholar] [CrossRef]
  43. Zhu, G.Y.; Huang, H.P.; Wang, H.T. Geochemical Significance of Discovery in Cambrian Reservoirs at Well ZS1 of the Tarim Basin, Northwest China. Energy Fuels 2015, 29, 1332–1344. [Google Scholar] [CrossRef]
  44. Zhu, G.Y.; Cao, Y.H.; Yan, L.; Yang, H.J.; Sun, C.H.; Zhang, Z.Y.; Chen, Y.Q. Petroleum exploration potential and favorable areas of ultra-deep marine strata deeper than 8000 meters in Tarim Basin. Nat. Gas Geosci. 2018, 29, 755–772. [Google Scholar]
  45. Zhu, G.Y.; Milkov, A.V.; Zhang, Z.Y.; Sun, C.H.; Zhou, X.X.; Chen, F.R.; Han, J.F.; Zhu, Y.F. Formation and preservation of a giant petroleum accumulation in superdeep carbonate reservoirs in the southern Halahatang oil field area, Tarim Basin, China. Am. Assoc. Pet. Geol. Bull. 2019, 103, 1703–1743. [Google Scholar] [CrossRef]
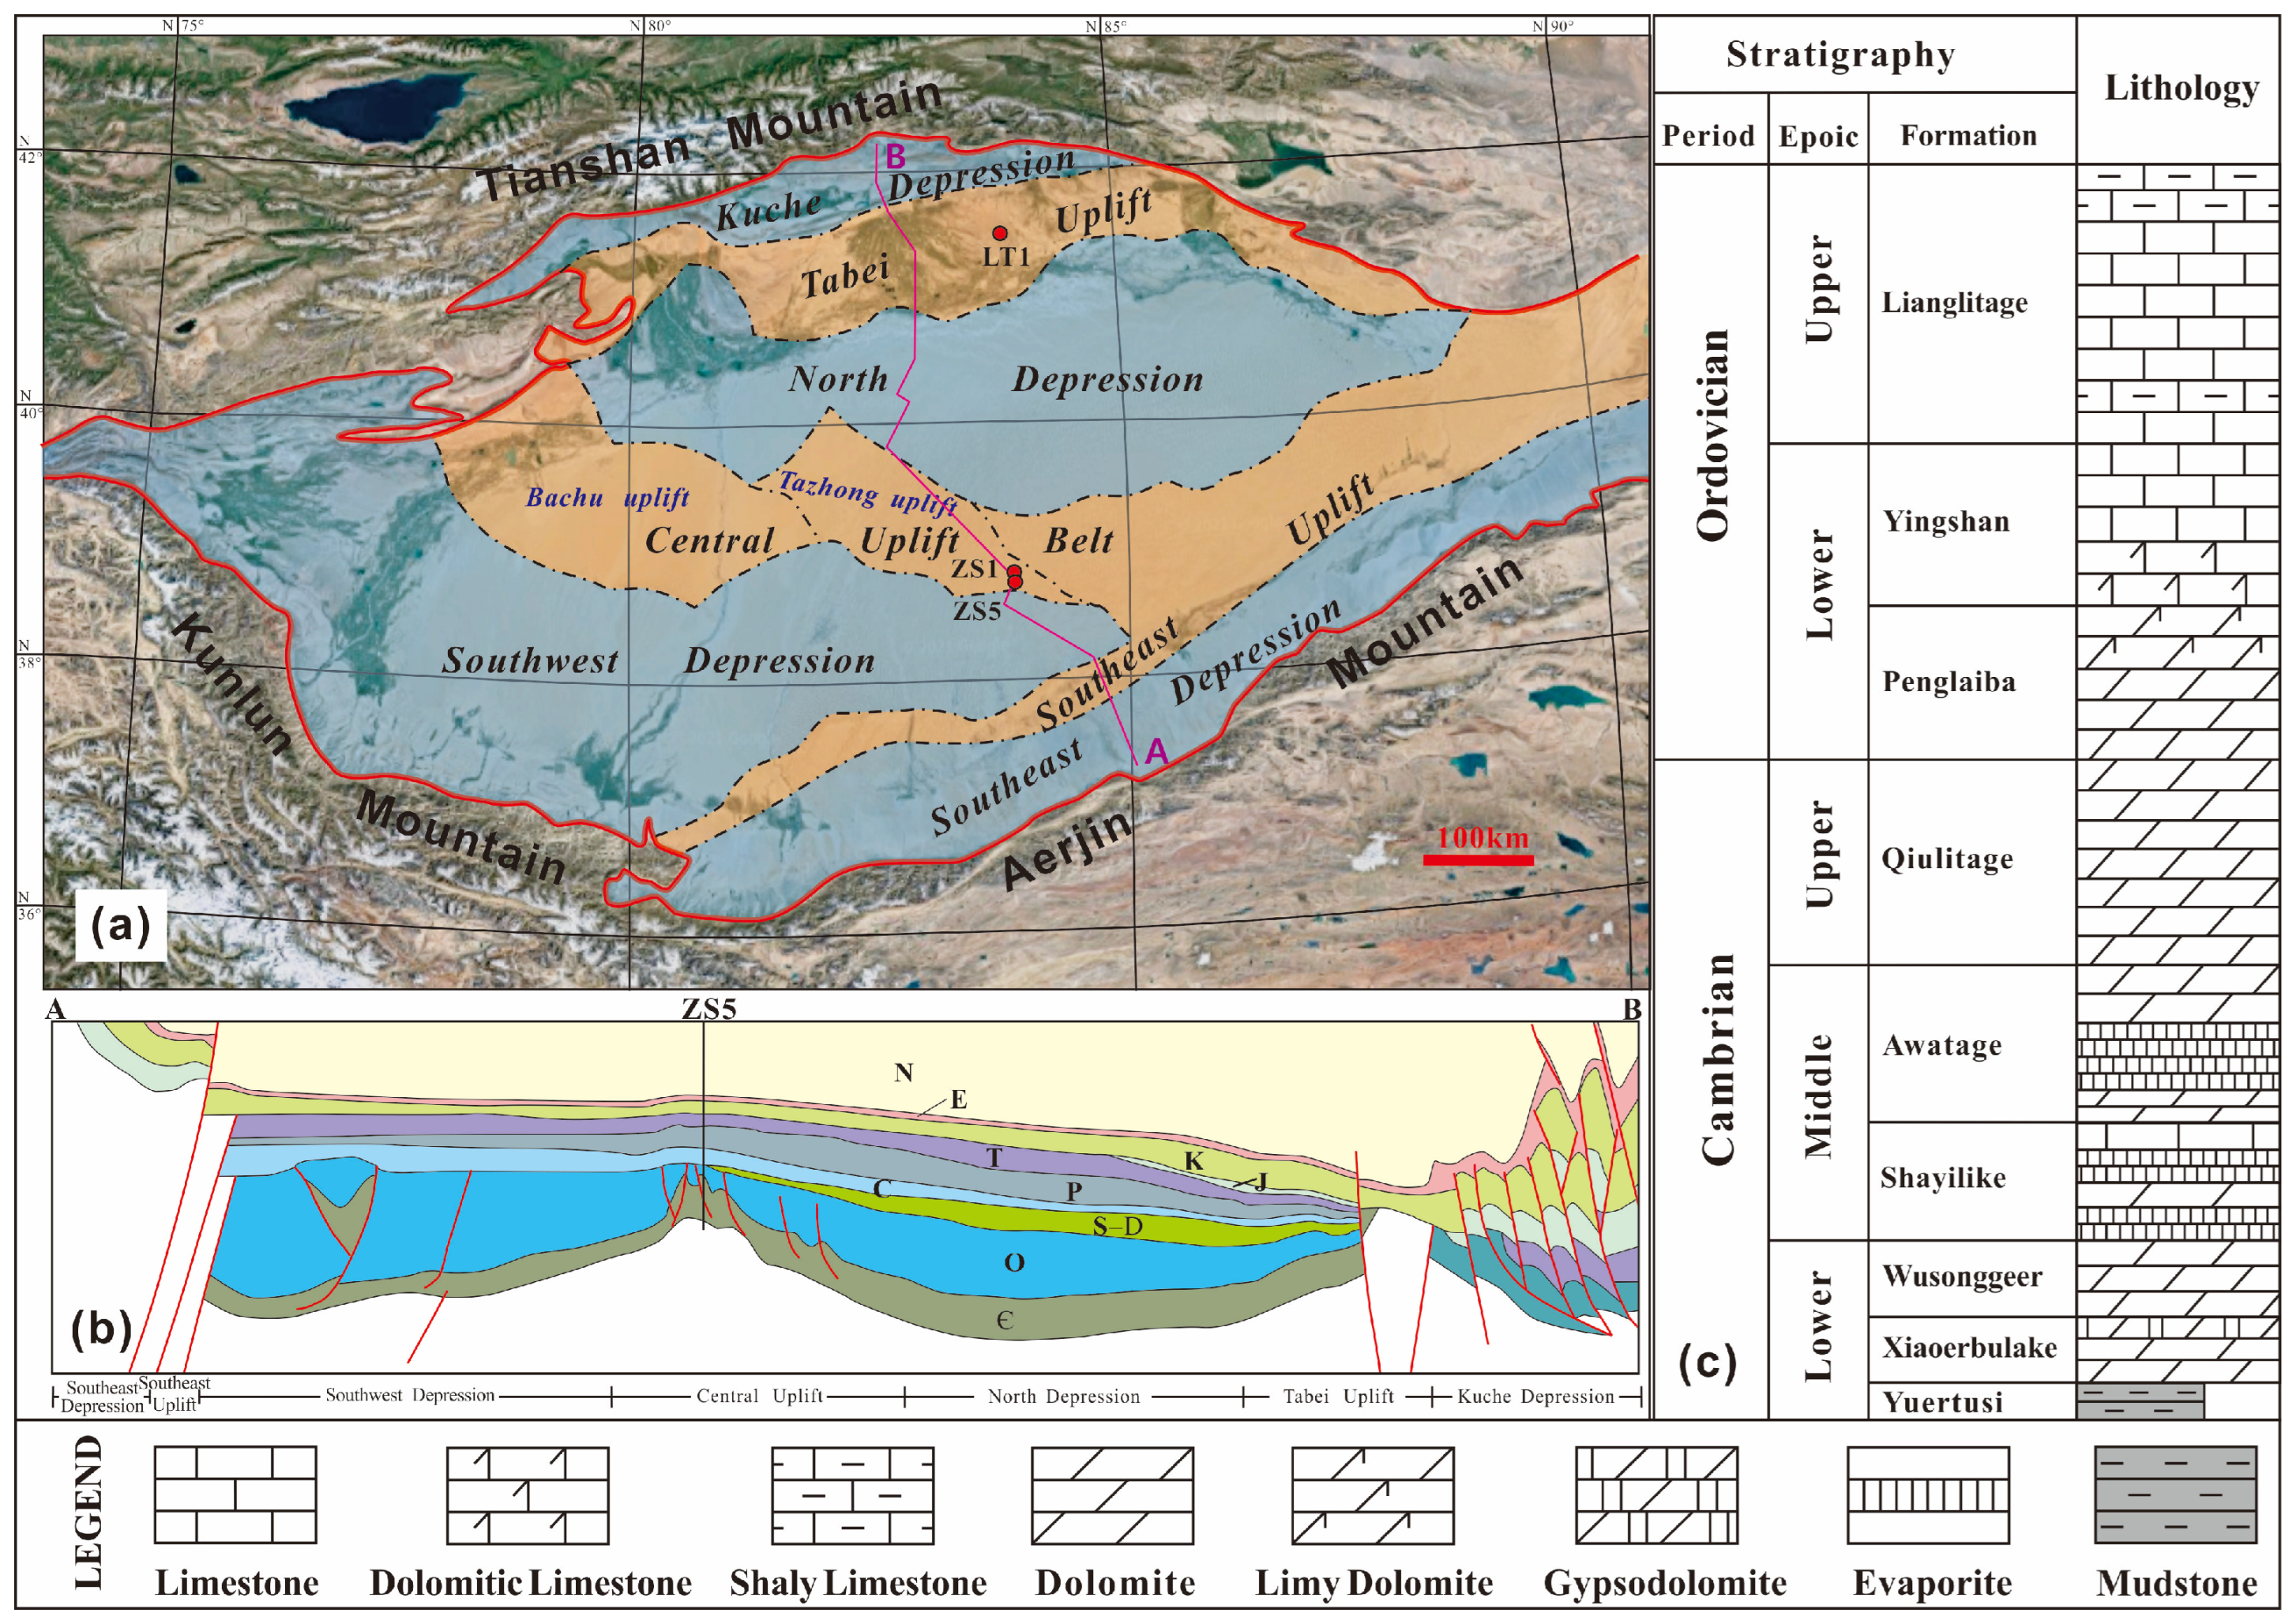
Figure 1. Tectonic units (a), geological profile (b), and Cambrian and Ordovician stratigraphic columns (c) in the Tazhong area, Tarim Basin (modified according to [18,20]). The profile in (b) shows the stratigraphic distribution across the Tarim Basin from A to B in (a). The strata are labeled with capital letters Є (Cambrian), O (Ordovician), S (Silurian), D (Devonian), C (Carboniferous), P (Permian), T (Triassic), J (Jurassic), K (Cretaceous), E (Paleogene), and N (Neogene).
Energies 17 04765 g001
Figure 2. Distribution of reservoirs and division of hydrocarbon accumulation assemblages in the Middle and Lower Cambrian in the Tazhong area, Tarim Basin (Modified according to [8]).
Energies 17 04765 g002
Figure 3. Photographs showing the characteristics of samples from the Middle and Lower Cambrian in the Tazhong area, Tarim Basin. Image (a) shows some clastic quartzes and crystal anhydrites in dolomite. Image (b) shows a dissolved cave filled with crystal dolomite and quartz. The vein includes dominated anhydrite and some calcite observed under bright light (c) and cathodoluminescence (d). Residual oil in intercrystalline pores was observed under bright light (e) and UV light (f). Later fractures filled with bitumen (g,h) and calcite (h) cut the early anhydrite veins. The Raman spectrum (blue line) shows the existence of bitumen in the fracture.
Energies 17 04765 g003
Figure 4. Different types of fluid-inclusion assemblages. Image (a) shows the quartz filled in the dissolved pores in dolomite reservoirs. Image (b) shows the FIA contained in quartz, including heavy oil inclusions and aqueous inclusions. (c,d) Photographs showing the second FIA, including aqueous and two-phase hydrocarbon inclusions under bright light (c) and UV light (d). Images (e,f) show the same hydrocarbon inclusions as the second FIA in dolomite cementation. (g,h) A three-phase hydrocarbon inclusion containing an irregular bubble, oil, and some bitumen under bright light (g) and UV light (h). Images (ik) show the third FIA contained in calcite, including dominated single-phase oil inclusions under bright light (i) and UV light (j), and one aqueous inclusion (k). Image (l) shows the fourth FIA including gas inclusions and aqueous inclusions.
Energies 17 04765 g004
Figure 5. Histogram of the homogenization temperatures of the first three FIAs.
Energies 17 04765 g005
Figure 6. Intersection diagram of isochores of coeval hydrocarbon inclusions (HIs) and aqueous inclusions (AIs) in the FIAs to calculate the trapping temperatures and pressures (shown as the stars).
Energies 17 04765 g006
Figure 7. Burial thermal evolution history and hydrocarbon activity in ZS block.
Energies 17 04765 g007
Figure 8. The model of different hydrocarbon charging in wells ZS1 and ZS5, Tazhong area during (a) petroleum and (b) pyrolysis gas charging periods (modified from [8]).
Energies 17 04765 g008
Table 1. Composition of the initial fluid used for PVT simulation in this paper.
ComponentOilGasRecombined HydrocarbonComponentOilGasRecombined Hydrocarbon
N2 0.30.234C95.391 1.27
CO2 9.77.555C104.713 1.042
H2S 0.190.148C114.463 0.987
C1 59.346.188C124.141 0.916
C2 13.910.827C133.927 0.868
C3 9.667.524C142.963 0.655
iC41.6071.531.547C153.463 0.766
nC41.6073.322.941C163.035 0.671
iC52.2490.781.105C171.856 0.41
nC52.2490.791.113C182.035 0.45
C613.6740.533.148C191.464 0.324
C75.070 1.238C201.178 0.261
C831.596 7.08C20+3.321 0.736
Table 2. Microthermometric data and calculations of the FIAs from the deep reservoirs in the Tazhong area, Tarim Basin.
FIA No.Host MineralTypeNumberTh (Ave.)/°CSalinity (Ave.)/wt%
1QuartzOil–gas260.2–62.0 (61.1)/
Aqueous3120.2–127.8 (124.3)8.68–8.81 (8.72)
2AnhydriteOil–gas1029.6–47.7 (39.9)
Aqueous11121.4–139.8 (129.2)11.22–11.93 (11.69)
DolomiteOil–gas336.6–43.7 (40.5)
3CalciteOil38.2–8.8 (8.5)
Aqueous1118.610.11
4QuartzAqueous4134.1–50.2 (142.5)15.57–17.08 (16.07)
Table 3. Calculated trapping temperatures and pressures shown in Figure 6.
FIA No.Th of HI/°CTh of AI/°CTt/°CPt (bar)Paleo-Depth/mPressure
Coefficient
161.1124.3145.5469.246001.02
239.9129.2158.3648.453501.21
38.5118.6152.8789.753001.49
4/142.5167.0///
Notes: Th = homogenization temperature; AI = aqueous inclusion; HI = hydrocarbon inclusion; Tt = trapping temperature; and Pt = trapping pressure.
Disclaimer/Publisher’s Note: The statements, opinions and data contained in all publications are solely those of the individual author(s) and contributor(s) and not of MDPI and/or the editor(s). MDPI and/or the editor(s) disclaim responsibility for any injury to people or property resulting from any ideas, methods, instructions or products referred to in the content.